instructions for use english release 5 - …...instructions for use english release 5 -...
TRANSCRIPT

Instructions for Use
English
Release 5 -International
Volume 3: Operationat the MR console
Philips MRI


Table of contents
Philips MRI 3
Phili
ps H
ealth
care
4598
006
437
51/7
81 *
03/
2014
*7
Table of contents1 About these Instructions for Use............................................................................................................. 13
2 System startup and switch off................................................................................................................. 15
Computer start up.......................................................................................................................................... 16
Exit system software....................................................................................................................................... 16Computer shutdown.......................................................................................................................... 17
3 Help and User Documentation................................................................................................................ 19
Within the application software..................................................................................................................... 19
From the Windows Start menu....................................................................................................................... 19
4 Operator-Patient Intercom..................................................................................................................... 21
5 Customizing your system........................................................................................................................ 23
Hospital administrator and user accounts...................................................................................................... 23
Hospital/Institution name setting................................................................................................................... 25
Language settings........................................................................................................................................... 26
6 Keyboard and Mouse Interaction............................................................................................................ 29
The Keyboard Function Keys........................................................................................................................... 29
7 Terminology and Definitions................................................................................................................... 33
ExamCard........................................................................................................................................................ 33ExamCard Databases (EC databases)................................................................................................. 33ExamCard Items................................................................................................................................. 34Characteristics................................................................................................................................... 39Password Protection of the EC Hospital folder.................................................................................. 40
SmartLine Processing...................................................................................................................................... 41Smart MPR......................................................................................................................................... 42
ExamCard Exchange........................................................................................................................................ 42Connect to NetForum........................................................................................................................ 42Different User Levels on NetForum................................................................................................... 42Register / login for ExamCard Exchange............................................................................................ 43Download or upload protocols.......................................................................................................... 43
SmartExam...................................................................................................................................................... 44The principle of SmartPlan................................................................................................................ 44Prerequisites for SmartExam............................................................................................................. 44SmartExam Spine............................................................................................................................... 45SmartExam Breast............................................................................................................................. 45
Interactive Scanning....................................................................................................................................... 47About Interactive Scanning............................................................................................................... 47Interactive Modes.............................................................................................................................. 48

Table of contents
4 Philips MRI
Phili
ps H
ealth
care
4598
006
437
51/7
81 *
03/
2014
*7
8 Introduction to the User Interface and General Information................................................................... 49
Viewports and Windows................................................................................................................................. 49Viewport Buttons............................................................................................................................... 49Typical Buttons ................................................................................................................................. 49Switch between views....................................................................................................................... 50
The various controls........................................................................................................................................ 50
Notifications and Alerts.................................................................................................................................. 51
Image Information.......................................................................................................................................... 51
Windowing, Zooming and Panning................................................................................................................. 53
Scrolling through images................................................................................................................................ 54
Generic functions for images.......................................................................................................................... 55In Right Mouse Menus....................................................................................................................... 55On Toolbars....................................................................................................................................... 55
Generate Series and ExamCards..................................................................................................................... 58
ROIs................................................................................................................................................................. 58Draw a ROI......................................................................................................................................... 58Delete and copy a ROI....................................................................................................................... 59Edit a ROI........................................................................................................................................... 59
Scaling of Imaging Series................................................................................................................................. 59
9 Screen Layout, Menus and Windows...................................................................................................... 61
Screen Layout................................................................................................................................................. 61
Main menu bar and corresponding menus..................................................................................................... 62Patients menu.................................................................................................................................... 63Examination menu............................................................................................................................. 63Review menu..................................................................................................................................... 65Analysis menu.................................................................................................................................... 65System menu..................................................................................................................................... 66Help menu......................................................................................................................................... 68
Launch Pad...................................................................................................................................................... 68
List View or Thumbnail View........................................................................................................................... 69ExamCard Properties......................................................................................................................... 71
Graphical PlanScan area ................................................................................................................................. 72Planning toolbar................................................................................................................................ 73PlanScan Overlay............................................................................................................................... 75Exit Planscan...................................................................................................................................... 77
Patient Status area.......................................................................................................................................... 77
ExamCard Manager......................................................................................................................................... 78
Parameter Editor............................................................................................................................................ 79Dashboard......................................................................................................................................... 79Parameter Groups tabs..................................................................................................................... 80

Table of contents
Philips MRI 5
Phili
ps H
ealth
care
4598
006
437
51/7
81 *
03/
2014
*7
Summary tab..................................................................................................................................... 81Extended Parameter Editor............................................................................................................... 82Coil Selection Tab.............................................................................................................................. 88Conflicts page.................................................................................................................................... 91
Scan Assistance............................................................................................................................................... 92Info .................................................................................................................................................... 92Assistance.......................................................................................................................................... 92AutoView........................................................................................................................................... 93
Review toolbar................................................................................................................................................ 93
Reviewing area................................................................................................................................................ 95Select an examination....................................................................................................................... 96
Package Manager............................................................................................................................................ 96
Physiology Properties..................................................................................................................................... 98
Settings window.............................................................................................................................................. 99
Smart Editor.................................................................................................................................................. 101
SmartGeometry Database Editor.................................................................................................................. 102
More about SmartExam & EC....................................................................................................................... 102
10 Review and Analysis Packages.............................................................................................................. 105
ImageView.................................................................................................................................................... 106User Interface.................................................................................................................................. 106
VolumeView.................................................................................................................................................. 113Suitable Scans.................................................................................................................................. 113User Interface.................................................................................................................................. 114
MobiView...................................................................................................................................................... 121About Fusing.................................................................................................................................... 121User Interface.................................................................................................................................. 122
QFlow package.............................................................................................................................................. 127Suitable Scans.................................................................................................................................. 127User Interface.................................................................................................................................. 128Results............................................................................................................................................. 130
PicturePlus.................................................................................................................................................... 133Suitable Scans.................................................................................................................................. 133User Interface.................................................................................................................................. 133
Image Algebra............................................................................................................................................... 136Available Calculations...................................................................................................................... 136User Interface.................................................................................................................................. 137
Diffusion Registration package..................................................................................................................... 141
Diffusion package.......................................................................................................................................... 141User Interface.................................................................................................................................. 142Parametric Maps............................................................................................................................. 144Transfer of DWI iso and ADC images............................................................................................... 147

Table of contents
6 Philips MRI
Phili
ps H
ealth
care
4598
006
437
51/7
81 *
03/
2014
*7
FiberTrak package......................................................................................................................................... 147Requirements for a FT dataset........................................................................................................ 148User Interface.................................................................................................................................. 148ROIs.................................................................................................................................................. 156Algorithms: Fibers and Seeded ROIs................................................................................................ 159Colors: Fibers and ROIs.................................................................................................................... 161Statistics: Fibers, ROIs and current voxel......................................................................................... 161
IViewBOLD ................................................................................................................................................... 162User Interface.................................................................................................................................. 164Statistical Parametric Maps (SPMs)................................................................................................. 168Time-Intensity Diagram (TID)........................................................................................................... 172
Neuro T2* Perfusion package....................................................................................................................... 172User Interface.................................................................................................................................. 173Results of the Neuro T2* Perfusion package................................................................................... 179
Basic T1 Perfusion package........................................................................................................................... 181User Interface ................................................................................................................................. 181Results of the Basic T1 Perfusion package....................................................................................... 186
SpectroView.................................................................................................................................................. 189User Interface.................................................................................................................................. 190
11 Workflows Scanning and Planning........................................................................................................ 197
Entering examination data............................................................................................................................ 197Entering 'New Examination' data.................................................................................................... 197Entering Asian patient names.......................................................................................................... 199Select existing patient data............................................................................................................. 201Select patient data from RIS............................................................................................................ 201Combine Accession Numbers (RIS).................................................................................................. 202
Run an ExamCard.......................................................................................................................................... 203Select an ExamCard and make it the Current ExamCard................................................................. 203Start the ExamCard.......................................................................................................................... 203Plan the items of the ExamCard geometrically................................................................................ 203Resume the ExamCard..................................................................................................................... 204
Manage ExamCards...................................................................................................................................... 205
Create (and/or Edit) an ExamCard................................................................................................................ 205Select scan protocols....................................................................................................................... 205Fine-tune the ExamCard.................................................................................................................. 206Start the ExamCard.......................................................................................................................... 211Plan the items of the ExamCard geometrically................................................................................ 211Access the ExamCard properties..................................................................................................... 212Enable or disable ’Push to workstation’.......................................................................................... 213Resume the ExamCard..................................................................................................................... 213Save the ExamCard.......................................................................................................................... 213Save some items of the current ExamCard as a new ExamCard...................................................... 213
Export/Import of ExamCards........................................................................................................................ 214

Table of contents
Philips MRI 7
Phili
ps H
ealth
care
4598
006
437
51/7
81 *
03/
2014
*7
Export specific ExamCards............................................................................................................... 214Import ExamCards........................................................................................................................... 215Export Hospital ExamCard Database............................................................................................... 215Import Hospital ExamCard Database............................................................................................... 215Select Hospital ExamCard Database................................................................................................ 216
Workflow ’Add Postprocessing to ExamCard’............................................................................................... 216
Workflow ’Perform Automated Processing’................................................................................................. 216
Workflow ’Set up a Smart ExamCard’........................................................................................................... 217Select an ExamCard......................................................................................................................... 217Open the Smart Editor..................................................................................................................... 217Select the Anatomic Region............................................................................................................. 218Add a SmartSurvey to the current ExamCard.................................................................................. 218Convert an ExamCard geometry into a SmartGeometry................................................................. 218Validate a Smart ExamCard............................................................................................................. 220
Workflow ’Execute a Smart ExamCard’........................................................................................................ 221Smart icons indicating the status of Smart items............................................................................ 221Workflow ’Smart items are in validating mode’.............................................................................. 222Workflow ’Smart items are validated’............................................................................................. 222Parameters ’Laterality’ and ’Patient Position’................................................................................. 222Switch to User-Confirmation Mode................................................................................................. 222
Workflow SmartExam Spine......................................................................................................................... 223
Adjust Ventilation in Bore............................................................................................................................. 226
Delayed reconstruction................................................................................................................................. 228
Arterial Spin Labeling (ASL)........................................................................................................................... 230Workflow ASL.................................................................................................................................. 231
BolusTrak Workflow...................................................................................................................................... 234
Workflows MobiTrak and MobiFlex.............................................................................................................. 235Patient safety................................................................................................................................... 235Table movement.............................................................................................................................. 236Workflow MobiTrak......................................................................................................................... 236Workflow MobiFlex......................................................................................................................... 237Postprocessing MobiFlex................................................................................................................. 240Integration of BolusTrak with MobiTrak/MobiFlex......................................................................... 240
Interactive Scanning Workflows................................................................................................................... 241Interactive Scanning parameter...................................................................................................... 241Workflow......................................................................................................................................... 242More about Interactive Scanning.................................................................................................... 242Interactive scanning on ERD............................................................................................................ 245Tips and Hints.................................................................................................................................. 246
Planning the Cardiac Views........................................................................................................................... 246Interactive Scanning Tool................................................................................................................ 2473 Points Planscan (3PPS).................................................................................................................. 248PlanAlign.......................................................................................................................................... 248

Table of contents
8 Philips MRI
Phili
ps H
ealth
care
4598
006
437
51/7
81 *
03/
2014
*7
Basic Views...................................................................................................................................... 249Outflow Tracts................................................................................................................................. 250Cardiac Anatomy............................................................................................................................. 251
Cardiac Function........................................................................................................................................... 251Stress-Test (Physical or Dobutamine).............................................................................................. 251Workflow......................................................................................................................................... 252
Myocardial Perfusion (Temporal Enhancement).......................................................................................... 254About Myocardial Perfusion............................................................................................................ 254Workflow......................................................................................................................................... 255
Late Enhancement (Spatial Enhancement)................................................................................................... 257About Late Enhancement................................................................................................................ 257Workflow......................................................................................................................................... 258Phase Sensitive Inversion Recovery (PSIR)...................................................................................... 259
Coronary Angiography.................................................................................................................................. 261About Coronary Angiography.......................................................................................................... 261Workflow......................................................................................................................................... 262
Workflow MultiNuclei (MN) MR Spectroscopy............................................................................................. 267Pulse sequences and MRS protocols............................................................................................... 267Planning........................................................................................................................................... 268Acquiring Data................................................................................................................................. 268Processing with SpectroView.......................................................................................................... 272Examples of 3.0T with the P-140 Coil.............................................................................................. 274
12 Workflows Review and Analysis packages............................................................................................ 279
Start up a Review or Analysis package.......................................................................................................... 279
ImageView: Workflows................................................................................................................................. 279Start up ImageView......................................................................................................................... 280Typical ImageView workflows......................................................................................................... 280
VolumeView: MaxIP and MinIP.................................................................................................................... 280Start up VolumeView....................................................................................................................... 280Optional: Select the Image Type...................................................................................................... 280Select the Render Mode.................................................................................................................. 280Define the volume to be reconstructed.......................................................................................... 281Calculate the result images as new imaging series......................................................................... 281
VolumeView: MPR........................................................................................................................................ 281Start up VolumeView....................................................................................................................... 281Select the Render Mode.................................................................................................................. 281Calculate the result images as new imaging series......................................................................... 282
VolumeView: Surface Rendering.................................................................................................................. 282Start up VolumeView....................................................................................................................... 282Select the Render Mode.................................................................................................................. 282Define the volume........................................................................................................................... 282
MobiView Workflow..................................................................................................................................... 283Start up MobiView........................................................................................................................... 283

Table of contents
Philips MRI 9
Phili
ps H
ealth
care
4598
006
437
51/7
81 *
03/
2014
*7
Fuse the coronal or sagittal imaging series..................................................................................... 283Merge the transverse imaging series.............................................................................................. 283Save the fused images to database................................................................................................. 284Workflow for Multi-Station imaging series with Multiple Image Types.......................................... 284
QFlow Analysis.............................................................................................................................................. 285Start up the QFlow package............................................................................................................ 285Prepare the environment for drawing a ROI................................................................................... 285Define the vessel contour................................................................................................................ 285Show the results.............................................................................................................................. 286Export and print the results............................................................................................................. 287
PicturePlus Workflow................................................................................................................................... 287Start up PicturePlus......................................................................................................................... 287Enhance Images............................................................................................................................... 287Generate a new imaging series....................................................................................................... 288
Image Algebra Workflow.............................................................................................................................. 288Start up Image Algebra.................................................................................................................... 288Select the type of operation............................................................................................................ 288Select the images for processing (A and B)..................................................................................... 288Apply a weighting factor.................................................................................................................. 288Adjust the threshold values............................................................................................................. 289Generate a new imaging series....................................................................................................... 289
Diffusion Registration Workflow................................................................................................................... 289
Diffusion Workflow....................................................................................................................................... 290Start up the Diffusion package........................................................................................................ 290Navigate through images................................................................................................................. 290Adjust the B0 Threshold.................................................................................................................. 290Select b-values................................................................................................................................. 291Generate a new imaging series....................................................................................................... 291
Fiber Tracking Workflow............................................................................................................................... 291Start up FiberTrak............................................................................................................................ 291Load anatomical data...................................................................................................................... 291Navigate through the data.............................................................................................................. 291Track fibers...................................................................................................................................... 292Generate result series..................................................................................................................... 292View FiberTrak results in movie mode............................................................................................ 293
FiberTrak: Advanced Workflows .................................................................................................................. 293Output Series................................................................................................................................... 293Tips for Fiber Tracking..................................................................................................................... 295
BOLD imaging Workflow............................................................................................................................... 297Patient preparation and positioning................................................................................................ 297Start up IViewBOLD......................................................................................................................... 297View the SPMs................................................................................................................................. 298Calculate a TID................................................................................................................................. 299
BOLD imaging: Paradigm Handling............................................................................................................... 299

Table of contents
10 Philips MRI
Phili
ps H
ealth
care
4598
006
437
51/7
81 *
03/
2014
*7
Select a paradigm............................................................................................................................ 300Delete a paradigm........................................................................................................................... 300Set up a new paradigm.................................................................................................................... 300Edit a paradigm................................................................................................................................ 301Paradigm Editor............................................................................................................................... 301
BOLD imaging: Esys synchronization............................................................................................................ 303Workflow......................................................................................................................................... 303Add IViewBOLD SmartLine processing to ExamCard....................................................................... 304More about the synchronization..................................................................................................... 305Protocol requirements.................................................................................................................... 306
Neuro T2* Perfusion Workflow.................................................................................................................... 306Start up the Neuro T2* Perfusion package...................................................................................... 306Navigate through images................................................................................................................. 306Adjust the threshold........................................................................................................................ 307Calculation of the perfusion results using the AIF........................................................................... 307Generate results ............................................................................................................................. 307Generate a new imaging series....................................................................................................... 308
Basic T1 Perfusion Workflow........................................................................................................................ 308Start up the Basic T1 Perfusion package.......................................................................................... 308Navigate through images................................................................................................................. 308Adjust the threshold........................................................................................................................ 308Generate results ............................................................................................................................. 309Generate a new imaging series....................................................................................................... 309
SpectroView Workflow................................................................................................................................. 309Start up SpectroView....................................................................................................................... 310Select a script................................................................................................................................... 310Run the Script.................................................................................................................................. 312Select Relevant Voxels..................................................................................................................... 312Optimize spectrum display.............................................................................................................. 314Modify Layout.................................................................................................................................. 315Create screen captures.................................................................................................................... 316Storage and export of data.............................................................................................................. 316
SpectroView: Advanced Workflows.............................................................................................................. 317Scripts and script handling............................................................................................................... 318Processing steps.............................................................................................................................. 320Customization using the Peak Editor............................................................................................... 336Series Preferences Database........................................................................................................... 337
SpectroView: Process Unsuppressed Water Data........................................................................................ 338Workflow......................................................................................................................................... 338Truncate Graph Peak....................................................................................................................... 342
13 Printing................................................................................................................................................. 343
User Interface............................................................................................................................................... 343Printing in Overall Toolbars and Menus.......................................................................................... 343Print Setup....................................................................................................................................... 344

Table of contents
Philips MRI 11
Phili
ps H
ealth
care
4598
006
437
51/7
81 *
03/
2014
*7
Print Settings................................................................................................................................... 346
Workflows..................................................................................................................................................... 353Create Predefined Layout for Print Image....................................................................................... 353Create Protocol for Print Series....................................................................................................... 353Print Image...................................................................................................................................... 354Print Series....................................................................................................................................... 356
14 Administration (Patient Database)........................................................................................................ 357
Start up Administration................................................................................................................................ 357
Workflow ’Storage and transfer of patient data’.......................................................................................... 357
Select the source database or device........................................................................................................... 358
Select data from source database................................................................................................................ 358
Select destination database or device.......................................................................................................... 360
DICOM Export: Series Split functionality...................................................................................................... 363
Check status of background processes with the Job Queue......................................................................... 364
More functions within Administration......................................................................................................... 365
More about storage devices......................................................................................................................... 367
More about data transfer to DVD................................................................................................................. 370
15 Using USB storage devices.................................................................................................................... 375
USB Hard Drives............................................................................................................................................ 376
16 Miscellaneous Chapters........................................................................................................................ 377
Remote Desktop........................................................................................................................................... 377Workflow......................................................................................................................................... 378
Remote Software Installation (RSI)............................................................................................................... 380
Customer Feedback...................................................................................................................................... 383
17 Artifacts................................................................................................................................................ 385
Artifacts on high field strengths.................................................................................................................... 385Dielectric shading effect.................................................................................................................. 385
Motion artifacts............................................................................................................................................ 386Cardiac motion artifact.................................................................................................................... 386Artifact caused by breathing........................................................................................................... 387Artifact due to blood flow............................................................................................................... 388CSF pulsation artifact....................................................................................................................... 389Flow void artifact............................................................................................................................. 389
Chemical shift artifacts................................................................................................................................. 390Water-Fat shift................................................................................................................................. 390Water-Fat dephasing....................................................................................................................... 391
Aliasing artifacts............................................................................................................................................ 392
Magnetic material artifacts........................................................................................................................... 393

Table of contents
12 Philips MRI
Phili
ps H
ealth
care
4598
006
437
51/7
81 *
03/
2014
*7
Susceptibility artifacts................................................................................................................................... 393
Ringing (Gibbs) artifacts................................................................................................................................ 394Zebra stripe artifact......................................................................................................................... 394
MRA inflow artifacts..................................................................................................................................... 395Venetian blind artifact..................................................................................................................... 395Staircase artifact.............................................................................................................................. 395
Fat suppression artifact................................................................................................................................ 396
Quadrupole artifact...................................................................................................................................... 397
Multiple stack artifact................................................................................................................................... 398
REST artifact.................................................................................................................................................. 398
SENSE Artifacts.............................................................................................................................................. 399Intrinsic backfolding........................................................................................................................ 399Intrinsic backfolding of artifacts...................................................................................................... 399Cut-line artifacts.............................................................................................................................. 400Single-shot sequences and Fat Shift Direction................................................................................ 400
MR Spectroscopy Artifacts............................................................................................................................ 400Truncation at the end of the signal................................................................................................. 401Truncation with maximum echo sampling...................................................................................... 402Saturation........................................................................................................................................ 402Frequency drift................................................................................................................................ 403Ghosting.......................................................................................................................................... 404Baseline distortions......................................................................................................................... 404DC-Offset......................................................................................................................................... 405Incomplete water suppression........................................................................................................ 405Residual signals................................................................................................................................ 405
Index.................................................................................................................................................... 406

About these Instructions for Use
Philips MRI 13
Phili
ps H
ealth
care
4598
006
437
51/7
81 *
03/
2014
*7
About these Instructions for UseThese Instructions for Use consist of three volumes:
1. Your MRI System
2. Operation in the Magnet Room
3. Operation at the MR console
This volume 3 of these Instructions for Use, "Operation at the MR console", contains informa-tion on how to operate the MR console, e.g. scanning of examinations, viewing and postpro-cessing of MR data.
This manual may contain descriptions regarding the features and functionalities that are notimplemented on the current equipment shipped for Japan and/or the product(s) that is/are notcurrently sold in Japan due to limitations and restrictions under the applicable local laws andregulations in Japan.
Within these Instructions for Use, the most extensive configuration of the system is described,with the maximum number of options and accessories. Not every function described may beavailable on your system.
1

About these Instructions for Use
14 Philips MRI
Phili
ps H
ealth
care
4598
006
437
51/7
81 *
03/
2014
*7

System startup and switch off
Philips MRI 15
Phili
ps H
ealth
care
4598
006
437
51/7
81 *
03/
2014
*7
System startup and switch off
NOTICEIf your system has been upgraded to the current release, your hardware may differ from thesystems described in this manual.
If this is the case please refer to the Instructions for Use originally delivered with your Systemfor proper system startup and switch off. Even when this system is switched off some subsys-tems remain powered.
Powering and system startup must be performed by a Philips service representative. This in-cludes final adjustments of hardware compensation and control settings.Under normal circumstances it is not possible to switch off the system completely or partly.When not in use the system will switch into standby mode after approximately two hours ofinactivity. Power consumption is then minimized.
WARNINGThe system and all subsystems remain powered.
Danger of an electric shock.
It is only possible to shut down the computer as described in chapter “Computer shutdown” onpage 17.
CAUTIONIt is strongly recommended to keep the computer running permanently.
It is sufficient to exit the system software and to switch off the display without using Shut-down. When the computer is running the system will remain available for remote servicingand will run scheduled tasks (quality checks).
• It is only necessary to switch off the computer if a system hang up occurs.
• Never exit the system software while a background process (such as hard copy, DVD re-cording or Network) is still running.
• It is advisable to switch off the display unit on the Operator's Console at night.
Switch off by Philips service representative
Please contact your local Philips service representative if a serious reason exists that requiresthe complete system to be switched off.
2

System startup and switch off Computer start up
16 Philips MRI
Phili
ps H
ealth
care
4598
006
437
51/7
81 *
03/
2014
*7
CAUTIONSystem switch off and opening the technical cabinets may only be done by or under guidanceof Philips service.
CAUTIONHelium boil-off will occur when the system is completely switched off. The cryogen cooler willnot work and the system may quench.
Computer start up1. Switch on the computer in the operator’s console.
2. When the logon screen appears on the monitor press Ctrl+Alt+Delete keys on the key-board. The logon dialog box is displayed.
3. Log in: Type in Username and Password and confirm by clicking |OK| or pressing the Re-turn key. The system software will start.
NOTICEAfter first logon a different password must be entered of at least seven characters.
Initial settings of username and password are "MRuser" and "Philips".
NOTICEVerify that there is no (bootable) CD/DVD in your system.
The system may try to start up from the CD/DVD drive.
NOTICEThe user interface of the system does not provide direct visual feedback of the user that iscurrently signed-in.
The signed-in user can be revealed by pressing |Ctrl-Alt-Del|. The user name is displayed inthe subsequent dialog box. Exit the dialog by pressing ‘Esc’ or click on |Cancel|.
Exit system software
Fig. 1: 5: System menu.

Exit system software System startup and switch off
Philips MRI 17
Phili
ps H
ealth
care
4598
006
437
51/7
81 *
03/
2014
*7
1. Select ‘Exit’ from the System menu.The Exit confirmation window is displayed: Confirm the request to exit, cancel/proceed.
2. Click |Proceed|.
The ‘Stop’ status box is displayed until the software has been logged off. The Logon dialog box is then displayed. To start-up the system software again see chapter “System startup and switch off” on page 15.
Computer shutdownThe computer can be shut down directly or indirectly.
System shutdown with start menu
1. Press the Windows Start key on your keyboard.
2. Select ‘Shutdown’. The Shutdown window is displayed.
3. Click on one of the following options:
Log Off Exits the system software
Shutdown Shuts down the System.
Restart Restarts the system.
Cancel Cancels the shutdown procedure.
Computer shutdown from system Software
1. Exit the system software as described.This will display the logon screen.
2. Press |Ctrl + Alt + Del buttons|.The logon dialog box is displayed
3. Click |Shutdown|.The dialog box ‘It is safe to turn off your computer’ is displayed.

System startup and switch off Exit system software
18 Philips MRI
Phili
ps H
ealth
care
4598
006
437
51/7
81 *
03/
2014
*7

Within the application software Help and User Documentation
Philips MRI 19
Phili
ps H
ealth
care
4598
006
437
51/7
81 *
03/
2014
*7
Help and User DocumentationBoth the Help information and the user documentation are available on the system.Furthermore there is an editable Help available for the ExamCards.
The user documentation also includes a Technical Description, a DICOM Conformance State-ment and other information.
Within the application softwareFrom within the MR application software, the Help information and the user documentationcan be viewed in the configured application language.
Context sensitive Help
1. Move the cursor on a field that you want more information about.
2. Press |F1| on your Keyboard.
If the selected field includes context sensitive information the related topic is displayed on yourscreen. If not available, the start page of the Help is displayed and you can search for a topicmanually.
Help
The Help system is a compilation of information from the Instructions for Use (three volumes),the Technical Description and the parameter help.
1. Select ‘Help’ on the main menu bar.
2. Select ‘Help topics’. The Help is displayed.
You can search through the help using the table of contents, the index or the word search.
User Documentation
The user documentation includes the Instructions for Use (three volumes), the Technical De-scription and the DICOM Conformance Statement.
1. Select ‘Help’ on the main menu bar.
2. Select ‘User Documentation’.
A browser window is opened where you can select the user documentation.
From the Windows Start menuAll provided documents can be accessed from the Windows start menu:
1. Press the Windows Start key.
2. Select ‘User documentation’ and 'index.html'.
3. Scroll to the required language and select the document you want to view:
3

Help and User Documentation From the Windows Start menu
20 Philips MRI
Phili
ps H
ealth
care
4598
006
437
51/7
81 *
03/
2014
*7
• Help system
• Instructions for Use
• Technical Description
• DICOM Conformance Statement.

From the Windows Start menu Operator-Patient Intercom
Philips MRI 21
Phili
ps H
ealth
care
4598
006
437
51/7
81 *
03/
2014
*7
Operator-Patient IntercomThe Operator-Patient Intercom enables communcation with the patient, it provides music tothe patient and signals when the patient uses the nurse call.
Fig. 2: Operator-Patient intercom
Number Description
1 Microphone
2 Emergency Stop button*
3 Talk volume
4 Music volume
5 Patient music on/off
6 Talk and Nurse call light ring
7 Listen on/off
8 Listen volume
*) Note that depending on your system configuration the intercom may not have an emergencystop button.
Emergency Stop button*
This button has the same functionality as the emergency stop button on the UIM.Pressing the Emergency stop button will stop the tabletop movement. This can be reset usingthe Resume button.
4

Operator-Patient Intercom From the Windows Start menu
22 Philips MRI
Phili
ps H
ealth
care
4598
006
437
51/7
81 *
03/
2014
*7
Talk volume +/- button
Use this button to adjust the talk volume to the patient. The level is indicated on the LED barnext to the button.
Music volume +/- button
Use this button to adjust the music volume for the patient. The level is indicated on the LED barnext to the button.
Patient music on/off Button
Use this button to toggle the music for the patient on and off. The button icon lights up whenmusic is turned on. Music is muted while the talk button is pressed.
Talk and Nurse call light ring
Press and hold this button to talk to the patient, releasing it will stop communication. Music ismuted while the talk button is pressed.
When the pinch ball of the nurse call is pressed more than once within 4 seconds or for morethan 1.5 seconds, a beep sounds and the light ring around the talk button flashes to attract theattention of he operator. Press the talk button to stop the beep and the flashing of the lightring.
Listen on/off Button
Use this button to toggle the listen function on and off. The button icon lights up when the lis-ten function is turned on. The listen function is muted while the talk button is pressed.
Listen volume +/- button
Use this button to adjust the speaker volume of the intercom. The level is indicated on the LEDbar next to the button.

Hospital administrator and user accounts Customizing your system
Philips MRI 23
Phili
ps H
ealth
care
4598
006
437
51/7
81 *
03/
2014
*7
Customizing your systemTo display the Windows Taskbar and Start button press the Windows key on your keyboard.
Hospital administrator and user accounts
About accounts
The default user account "MRuser" can be used by different system operators, but does notprovide a personified logging of the actions done by each operator.
Personified user accounts providing the logging of the actions done by each individual user maybe required by legislation: for example HIPAA. Each of these individual users has the same per-missions and rights as the default system user.
User accounts should be managed by the hospital administrator.It is also possible to create multiple hospital administrator accounts.
Connect system to hospital Active Directory
Domain privileges are needed to connect the system to the hospital Active Directory.
► Logon as Hospital Admin.
► Configure DNS in Network and Sharing Center on the Windows Control Panel.
► Add the system to the Hospital Domain in System on the Windows Control Panel.
Change password Policies
Fig. 3: Password Policies
► Click Windows Start and select MR System Management and System Management.
Create a new local user account
1. Logon with username HospitalAdmin (not case sensitive).
2. Password: ’Hospital’ (case sensitive) at first logon. You have to replace and confirm the ini-tial password ’Hospital’ by another password of minimum 7 characters *). The system doesnot start, but a restricted Windows environment is opened.
5

Customizing your system Hospital administrator and user accounts
24 Philips MRI
Phili
ps H
ealth
care
4598
006
437
51/7
81 *
03/
2014
*7
3. Open the Windows start menu, select Systems Management and User Management (Operators) or User Management (Hospital Administrators). The MR User Manager panel for user accounts or administrator accounts is displayed.
4. Select User and Add Local user.
5. Enter a personal username, a full name, an account description and define and confirm apassword of minimum 7 characters for the new user.
*) The Password policy can be changed by the Hospital Admin.
NOTICEOn first login the new user or administrator is forced to change the password (minimum 7characters).
Create an Active Directory (AD) account
The system must be connected to Hospital Active Directory for creating an AD account.
► Select User and Add AD user.
► The Select User dialog appears. Enter username (Check names).
► Depending on the account type of the hospital admin (local or domain) a domain passwordis needed.
Edit an account

Hospital/Institution name setting Customizing your system
Philips MRI 25
Phili
ps H
ealth
care
4598
006
437
51/7
81 *
03/
2014
*7
1. Open the User Management (Operators) or User Management (Hospital Administrators)panel.
2. Right-click on a user in the list and select Properties or select a user in the list and click onUser and Properties.
3. Change the account as required:
• Full name.
• Account description.
• Password.
• Disable the user account.
• Enable/disable blocking of the user account during a certain time when the wrong pass-word is entered repeatedly (Blocking time and occurrence of wrong password to be setby the Service Engineer).
• Delete the user account.
Delete an account
An account can be deleted in the User Management (Operators) or User Management (Hospi-tal Administrators) panel.
• Right-click on a user in the list and select Delete user or select a user in a list and click onUser and Delete user.
NOTICEThe system provides functionality to synchronize with customer Active Directory.
Hospital/Institution name settingThe hospital or institution name can be changed:
1. Click the Windows Start button and select MR User and MR System. The MR System Prop-erties window is displayed.
2. Select a name from the scroll list or enter a new name and click Apply.
NOTICEA new name entered will be added to the scroll list.
3. Click OK, the system will warn you that changes will only take effect after reboot of yoursystem.
After rebooting your system the hospital or institution name will have changed.

Customizing your system Language settings
26 Philips MRI
Phili
ps H
ealth
care
4598
006
437
51/7
81 *
03/
2014
*7
Language settingsThe application software and the Windows operating system can be set to the following lan-guages:
English Danish German
Greek Spanish French
Italian Japanese Norwegian
Dutch Russian Swedish
Simplified Chinese (PRC)
Change the language setting
1. Select Start and Control panel.
2. Click on the Region and Language, the Region and Language dialogue is displayed.
3. Select the Keyboard and Language tab.
Fig. 4: Region and Language dialogue.
4. Select your language from the scroll list and click Apply.
5. Click the Change keyboards button and select your keyboard layout.
If your keyboard layout is not present in the field click Add...:

Language settings Customizing your system
Philips MRI 27
Phili
ps H
ealth
care
4598
006
437
51/7
81 *
03/
2014
*7
• On the Add Input Language dialogue select the input language from the top scroll listand your keyboard layout.
• Confirm by clicking OK.
6. Confirm by clicking OK. The window closes.
7. For Greek and Russian ONLY:
• select the Advanced tab.
• from the scroll list select Greek or Russian.
8. Click OK on the Region and Language dialogue.The system will warn you that changes will only take effect after you logoff (exit systemapplication) and logon again.
CAUTIONThe system will ask you to logoff. However, when clicking Yes it will REBOOT, not logoff.
9. Click Yes to reboot the system.
After reboot the language setting will have changed.

Customizing your system Language settings
28 Philips MRI
Phili
ps H
ealth
care
4598
006
437
51/7
81 *
03/
2014
*7

The Keyboard Function Keys Keyboard and Mouse Interaction
Philips MRI 29
Phili
ps H
ealth
care
4598
006
437
51/7
81 *
03/
2014
*7
Keyboard and Mouse InteractionThe keyboard and the mouse are used to input information to the computer.
Mouse
The mouse has three buttons: a left, a middle and a right button. In these Instructions for Use,the following terms are used when referring to the use of the mouse:
• "Click" refers to a single click with the left button.
"Double-click" refers to a double click with the left button.
• "Right-click" refers to a single click with the right button.
• "Drag" refers to moving the mouse while pressing down the left button.
• "Right-drag" refers to moving the mouse while pressing down the right button.
• Other mouse actions such as combinations of mouse buttons are described where applica-ble.
Keyboard
The keyboard is used to enter text such as patient data and annotations. At times, keyboardentry is disabled by the system. When this occurs, all new keystrokes are ignored and an audi-ble signal is sounded. To rectify this, click on the window to make it active.
A keyboard overlay shows the functions of all function keys on your keyboard in the system ap-plication software.
Fig. 5: Keyboard overlay.
Windows Start key
Pressing the Windows Start key opens the Windows Start menu with Windows functionality,but also dedicated MR functionality.
Fig. 6: Windows Start key.
The Keyboard Function Keys
Help Topics... <F1>
To open the Help system.
6

Keyboard and Mouse Interaction The Keyboard Function Keys
30 Philips MRI
Phili
ps H
ealth
care
4598
006
437
51/7
81 *
03/
2014
*7
New Examination... <F2>
To enter/select examination data (e.g. patient name, birth date, patient weight) in order toscan a new examination.
For more information, refer to chapter “Entering examination data” on page 197.
Open for Review... <F3>
To display the list of examinations in order to view the imaging series of an examination.
Administration <F4>
To open the Patient Administration panel in order to e.g. copy, transfer, delete and import ex-aminations and/or images.
For more information, see chapter “Administration (Patient Database)” on page 357.
Refresh <F5>
To refresh the screen and to make the latest changes visible.
Manage Job Queue ... <F6>
To check the status of background processes. For more information, see chapter “Check statusof background processes with the Job Queue” on page 364.
Autoview <F7>
To display the latest reconstructed image of the current scan.
Start Scan <F8>
To start the next scan or ExamCard.
Menu Bar <F10>
To immediately display the corresponding menu, e.g. the Examination menu when you are inscanning mode.
Stop Scan <F12>
To stop the current scan.
• Pressing |F12| (or clicking 'Stop Scan') ONCE will stop the scan immediately: all high powerRF and Gradient output is terminated, including acoustic noise. The reconstruction com-mences if enough data is available.
• Pressing |F12| (or clicking 'Stop Scan') for the second time will stop the reconstruction.
• If tabletop movement is initated by the TTS function, pressing |F12| (or clicking 'Stop Scan')will abort tabletop movement.
Play (Movie) <Pause>

The Keyboard Function Keys Keyboard and Mouse Interaction
Philips MRI 31
Phili
ps H
ealth
care
4598
006
437
51/7
81 *
03/
2014
*7
• To play (or pause/stop) the current dataset as a movie.
NOTICETo view a MultiMovie, link the viewports first and then click 'Play (movie)'.
A MultiMovie shows multiple imaging series in a movie in parallel. For information about link-ing, refer to chapter “Review toolbar” on page 93.
The Movie functionality is a generic functionality occuring in Graphical PlanScan and all Reviewand Analysis packages. For more information about movies, refer to chapter “On Toolbars” onpage 55.

Keyboard and Mouse Interaction The Keyboard Function Keys
32 Philips MRI
Phili
ps H
ealth
care
4598
006
437
51/7
81 *
03/
2014
*7

ExamCard Terminology and Definitions
Philips MRI 33
Phili
ps H
ealth
care
4598
006
437
51/7
81 *
03/
2014
*7
Terminology and Definitions
ExamCardAn ExamCard (EC) is the electronic version of a clinical MR examination procedure. It has to bedefined once and can then be reused for following patients with similar examinations in orderto simplify the daily routine. An ExamCard consists of ExamCard items (see chapter “ExamCardItems” on page 34):
• Scan protocols (e.g. survey, T1- and T2-weighted scans in different orientations)
• SmartLine processing steps
These are postprocessing presets which will automatically be performed as part of an Exam-Card. See chapter “SmartLine Processing” on page 41 for more information.
NOTICEIn what follows, the term ExamCard item is used to refer to both, scan protocols and Smart-Line processing steps, as components of an ExamCard.
Furthermore an ExamCard contains
• Geometry reuse
– Scans within an ExamCard can share the same geometry settings. Planning one scanwith a specific geometry means that all scans with this geometry will be planned auto-matically.
• Online information about the scans
– A short description of the delivered scans is available including an example image.
ExamCards and scan protocols are indicated by the following icons:
ExamCard
Scan protocol
ExamCards and scan protocols can be accessed in the chapter “ExamCard Manager” on page78 and in the chapter “List View or Thumbnail View” on page 69.
ExamCard Databases (EC databases)ExamCards are available in three different EC databases. The table gives an overview:
7

Terminology and Definitions ExamCard
34 Philips MRI
Phili
ps H
ealth
care
4598
006
437
51/7
81 *
03/
2014
*7
EC Database Database contents Locked/Not locked
Philips Philips ExamCards and scan proto-cols
The Philips EC database is locked and cannot be modi-fied or overwritten by the operator or the hospital ad-ministrator. ExamCards and scan protocols in this data-base can only be used for scanning.
Hospital Hospital ExamCards and scan proto-cols
The Hospital EC database can be locked using passwordprotection. If the database is locked, its content cannotbe changed or overwritten. ExamCards and scan proto-cols in this database can always be used for scanning.
Other Reserved for Import/Export of Exam-Cards and scan protocols
This database cannot be locked. ExamCards and scanprotocols can always be stored in this database.
Some ExamCards are delivered for the different subanatomies in order to give an example. Youcan find these in the Philips database: folder ExampleCards.
Locking is indicated by means of a ’Lock’ icon in the ExamCard database tabs:
Fig. 7: The three tabs for the three ExamCard databases. In this example, the Philips and the Hospital database arelocked, 'Other' is not.
To store ExamCards in the Hospital ExamCard database
Remove the "lock" first:
► Right-click in the EC database window.
► Click "Unlock ExamCards Database".
If the Hospital EC database is password protected, the user will be asked to enter the pass-word.
Once the lock is removed, the ’Lock’ icon is not longer shown in the Hospital tab and Exam-Cards can now be saved in the Hospital EC database.
► Drag and drop ExamCards into the Hospital ExamCard database to save them there.
ExamCard ItemsAn ExamCard item (EC item)
• is part of the ExamCard.
• stands either for a scanning step (also referred to as "scan item") or a postprocessing step.
• corresponds to one single row.
NOTICEThe maximum number of ExamCard items is 125.

ExamCard Terminology and Definitions
Philips MRI 35
Phili
ps H
ealth
care
4598
006
437
51/7
81 *
03/
2014
*7
The display of the ExamCard items changes in real-time from planning to scanning and to scancompletion:
• different status icons are used,
• prior to scanning EC items are displayed in gray,
completed scan items are displayed in blue.
Fig. 8: Example of ExamCard showing EC items. On top: during planning, Bottom: partly scanned.
Number Object (More information can be found in the text below the table.)
1 EC item number (appears only when scanning is completed)
2 Status information about the EC item
3 if applicable: Warning signs indicating that scan item will be executed in first levelcontrol mode is due to high SAR (Specific Absorption Rate), high PNS (PeripheralNerve Stimulation) or high SED (Specific Energy Dose).
4 Properties of the EC item
5 Name of the EC item
6 Geometry name of the EC item
7 Geometry Link
8 Laterality: R(ight), L(eft), B(oth), blank - if not specified
9 Expand / Collapse button
10 EC Header Line with ExamCard icon, ExamCard name and the remaining ExamCard du-ration. This is the remaining scan time for the complete ExamCard.
11 Possibility to add a new scan item from the ExamCard databases.

Terminology and Definitions ExamCard
36 Philips MRI
Phili
ps H
ealth
care
4598
006
437
51/7
81 *
03/
2014
*7
ExamCard Item Number
The scanning and postprocessing steps will be numbered by two digits where the first digit in-creases for scanning steps and the second digit for the postprocessing steps. The ExamCardItem Number appears only when scanning is completed.
Number Serie characteristics
1.1. Survey
2.1. T2w/TSE
2.2. PicturePlus image enhancement (postprocessing)
3.1. DWI
3.2. Diffusion postprocessing
Tab. 1: Example: ExamCard Item Number in an ExamCard
Status information about the EC item
Icons indicate the current status of planning and/or planning of an EC item.
Button Status of the EC item
The item needs planning.
The item is being modified.
The item is ready to run as it has been fully planned.
The item contains a parameter conflict.
The item containing a parameter conflict is being modified.
The item awaits update.
The item awaits resources and will be started as soon as sufficient resources areavailable.
The item is being prepared for execution.

ExamCard Terminology and Definitions
Philips MRI 37
Phili
ps H
ealth
care
4598
006
437
51/7
81 *
03/
2014
*7
Button Status of the EC item
The item is in progress.
The acquisition of the item is completed, and the reconstruction is in progress.
The item is successfully completed.
The item is aborted, either by the operator or scanner or reconstruction fault.
The item is invalid and cannot be executed, e.g. because it originates from anolder release.
Properties of the scan item
The Properties column provides information in the following order on
• High SAR (Specific Absorption Rate), high PNS (Peripheral Nerve Stimulation) or high SED(Specific Energy Dose) values
• User Start required / Manual start
• Breathholds
• Table movement
Button Property Description
Warning
• Operator attention is required due to high SAR, PNS or highSED.
User Start Required
• User start is required. The scan will not start automatically.
Manual start
• Scan stops after the preparation phase. Manual start is re-quired.
Breathhold
• Scan stops when breathhold commands are required.
Table movement
• Operator action is required in order to perform table move-ment.

Terminology and Definitions ExamCard
38 Philips MRI
Phili
ps H
ealth
care
4598
006
437
51/7
81 *
03/
2014
*7
Geometry Name (or GeoName)
The GeoName is used to simplify planning:
Scans sharing the same geometry (same geometry name) by default have
• the same number of stacks,
• the same orientation,
• each stack with identical angulations and offcenters.
A blue border around the geometry field indicates that modification of the existing geometryname or new input is possible.
Geometry Link (or GeoLink)
The GeoLink between scans includes that scans with different geometry parameters are linkedto each other. The linked protocols are combined within a geometrically linked group.
A GeoLink
• groups scans that will be planned at once within planning in Graphical PlanScan.
• includes scan alignment to all scans within the group (applied constantly when planning theGeoLink until it is switched off).
• includes that all scans within a geometrically linked group will get the same scan number.
• is only possible for scans of the same scan type.
• can be defined once only under a specified name. E.g. a scan being stopped or aborted be-ing part of link "C", the remaining scans of this current link "C" have to be updated to anoth-er link name.
Button Property Description
Geometry link. • The current item belongs to a geometrically linked groupwhere ’X’ is the group name [A ... Z]. .
Typical applications are examinations with a large Field-of-View in Feet-Head direction, such asMobiFlex and Whole Body imaging. These examinations have to be performed in multiple sta-tions with table movement between the stations in order to cover the complete area.
Laterality
When applicable, the laterality ("R" for right, "L" for left, "B" for both, or blank if not specified).The parameter laterality is primarily used for paired anatomies such as knee, ankle, shoulder,elbow etc. The laterality value can be used by PACS systems.
NOTICEIt is recommended to store dedicated left and right ExamCards.

ExamCard Terminology and Definitions
Philips MRI 39
Phili
ps H
ealth
care
4598
006
437
51/7
81 *
03/
2014
*7
Expand / Collapse button
Clicking 'Expand' will expand an ExamCard item and show the corresponding SmartLine post-processing step.
Fig. 9: The effect of the Expand and Collapse buttons in ExamCards.
Characteristics
Saving and retrieving of examinations AND ExamCardsExamCards are saved to and retrieved from the patient database with the examination.
• Saving an examination will also save the corresponding ExamCard
– when saving into any patient database;
– when exporting to devices such as DVD.
• Retrieving an examination will also retrieve an ExamCard
– when retrieving from any patient database;
– when importing from devices such as DVD.
NOTICEExamCards are not retrieved for datasets acquired with previous software releases.
Automatic ExamCard backup• A backup of ExamCards is automatically generated and preserved for 3 hours. This can be
especially helpful after crashes.
– Simply reselect the examination and the ExamCard will be restored including plannedgeometry.
– Double-click on the ExamCard to confirm.

Terminology and Definitions ExamCard
40 Philips MRI
Phili
ps H
ealth
care
4598
006
437
51/7
81 *
03/
2014
*7
Preparation of ExamCardsExamCards can be created and edited without a current examination/case in any of the viewingslots. This facilitates the preparation of ExamCards without a patient who needs to be scanned.
Preparing ExamCards in such a way is referred to as ExamCard Prep Mode.
Password Protection of the EC Hospital folderIn order to ensure consistency and to protect the quality of the ExamCards, the contents of theHospital folder can only be modified by authorized users.
NOTICEThe default password for the ’Password Protection of the EC Hospital folder’ is Philips.
Enable/Disable EC Hospital folder password protection
► Select the 'ExamCard Password Manager’ via the Windows Start menu.
► Enter the current password. Press |Enter| or click ’OK’.
The ExamCard Password Manager opens.
Fig. 10: ExamCard password manager window.
► Enable or disable the ’(Hospital) Database locking’.
► Click ’OK’ to confirm.
A message will be displayed notifying that database locking has succesfully been enabled ordisabled and that the changes will be activated after a reboot.
► Reboot the system.
Change the password
This can only be done when logged in as MRUSER.
► Select the 'ExamCard Password Manager’ via the Windows Start menu.
► Enter the current password. Press |Enter| or click ’OK’.

SmartLine Processing Terminology and Definitions
Philips MRI 41
Phili
ps H
ealth
care
4598
006
437
51/7
81 *
03/
2014
*7
The ExamCard Password Manager opens.
► Enter the new password
• in the field "New password’ and
• in the field ’Confirm password’.
► Click ’OK’.
A message will be displayed notifying that the password has succesfully been changed andthat the new password will be activated after a reboot.
► Reboot the system.
Reset the password
This can be done by the hospital administrator or by Philips service engineers. When you arethe hospital administrator, then follow the procedure below:
► Log in to the MR system as hospital administrator.
► Select the 'ExamCard Password Reset’ application via the Windows Start menu.
► Click ’Reset password’.
The current password will be reset to the default password.
► A message will be displayed notifying that the default password will be activated after a re-boot.
► Reboot the system.
SmartLine ProcessingOnce the 'Generate Series' function is used during the analysis with a postprocessing package,
• a new imaging series will be generated, and
• a postprocessing item will be added to the ExamCard.
The performed operation will be part of the current ExamCard and in such a way will auto-matically be performed whenever the ExamCard is executed again.
SmartLine Processing applies for the following postprocessing packages:
• VolumeView
• MobiView
• Diffusion
• Diffusion registration
• Basic T1 Perfusion
• Neuro (T2*) Perfusion
• Picture Plus
• Image Algebra

Terminology and Definitions ExamCard Exchange
42 Philips MRI
Phili
ps H
ealth
care
4598
006
437
51/7
81 *
03/
2014
*7
• IViewBOLD (in this case, the IViewBOLD will only be launched with the correct paradigm)
NOTICEThe maximum number of SmartLine processing steps is 6.
Smart MPRIf a 3D scan is planned using SmartExam (e.g. VISTA Knee or 3D-TFE Brain) angulations can bestored relative to the volume in the Smart MPR.
This means that if this ExamCard is stored with the SmartLine MPR, every MPR will have thesame orientation.
ExamCard ExchangeExamCard Exchange is an internet-based service that enables fast and simple download of Ex-amCards from NetForum.
The ExamCard Exchange functionality provides ExamCard download at the touch of a button
• Philips updates of ExamCards
• Customer ExamCards
For information on how to import/export ExamCards and/or ExamCard databases, refer tochapter “Export/Import of ExamCards” on page 214.
Connect to NetForumIt is possible to connect to NetForum in two ways.
Directly from the scanner
• via a secure, fast and reliable connection
1. Press the Windows Start key or click the Windows Start button.
2. Select ’Favorites’.
3. Select ’Philips NetForum Community’.
From any PC connected to the Internet
1. Connect to the Internet as usual.
2. Go to the website http://www.philips.com/netforum.
Different User Levels on NetForumMuch of the information on NetForum (www.philips.com/netforum) is accessible for any visi-tors of the site.

ExamCard Exchange Terminology and Definitions
Philips MRI 43
Phili
ps H
ealth
care
4598
006
437
51/7
81 *
03/
2014
*7
However, registration is required for:
• Downloading ExamCards -Viewing restricted content, for instance scan protocols, some ap-plication tips
• Online training modules on use of Philips MR scanners and packages, use of coils, use ofEWS, MR safety.
• Submitting content
• Utilization services
Register / login for ExamCard ExchangeOn a first time vist, it is necessary to register. When registration already has taken place, thelogin can be performed at once.
To register
► Click |Register|.
► Enter your data.
• On a first time visit, the web site will try to acquire the configuration of the MR scannerautomatically. Clearly this is only possible if the website is accessed directly from the scan-ner.
– The website server will build configuration data of the user and save it for later use.
– If the information has been retrieved automatically, then the server will show a summa-ry to the user and ask for confirmation.
– If confirmed, the user will be taken to the next page. If not, the user is informed aboutpossible consequences and taken to the manual configuration page.
• If there is no access to the internet, a semi-automatic procedure is available. The user willbe instructed to copy a configuration file from the scanner to the computer that does haveaccess to the internet and where the configuration file can be uploaded to the scanner.
To login
1. Enter your User-ID.
2. Enter your Password.
Download or upload protocols1. Connect to NetForum.
2. Select ’Magnetic Resonance’ /’International’ or ’USA’.
3. Login as registered user.
4. Click ’ExamCard Sharing’ to access ExamCards for download.

Terminology and Definitions SmartExam
44 Philips MRI
Phili
ps H
ealth
care
4598
006
437
51/7
81 *
03/
2014
*7
NOTICEImages being exported with the ExamCard may not contain any patient data.
This is the customer’s responsibility.
SmartExamSmartExam is a tool that automates planning, scanning and processing in brain, knee, shoulder,breast, cervical and lumbar spine examinations. Automatic planning and scanning is realized bySmartPlan, automatic processing by SmartLine Processing.
The principle of SmartPlanSmartPlan makes use of an algorithm that automatically detects some typical anatomic struc-tures in a Smart survey, e.g. corpus callosum for brain examinations, but also symmetry aspectsare taken into account.
These typical structures are recognized, stored and used as a reference for further automaticplanning.
SmartPlan is available for head, knee, shoulder, breast, cervical and lumbar spine examinations.It is a tool that helps in automatically planning scans with respect to the geometry parame-ters ’offcenter’ and ’angulation’.
Geometry databases
SmartPlan makes use of geometry databases which specify the way of planning for each anato-my. These geometry databases are predefined with the most common way of planning and al-low for the immediate use of SmartExam. If another way of planning is preferred, user-specifiedgeometry databases can be created:
► Copy the Philips geometry database.
► Add planning samples to this database or remove samples.
NOTICEFor shoulder, breast, cervical and lumbar spine, all angulations in the Philips geometry data-bases are set to zero.
This is also referred to as ’Snap-to-table’.
Prerequisites for SmartExamThere are several prerequisites for a Smart ExamCard.

SmartExam Terminology and Definitions
Philips MRI 45
Phili
ps H
ealth
care
4598
006
437
51/7
81 *
03/
2014
*7
Smart survey
• The Smart ExamCard has to start with a Smart survey. The Smart survey is a dedicated 3Dsurvey scan covering the anatomic region completely.
Parameters of the Smart survey cannot be changed.
SmartGeometries
• In a Smart ExamCard, only SmartGeometries can be planned automatically.
• Existing ’normal’ geometries need to be
– replaced with existing SmartGeometries
– converted into SmartGeometries.
Refer to volume 2 of your Instructions for Use to find out which coils can be used and are sup-ported for SmartExam.
SmartExam SpineA SmartExam Spine examination requires additional features to cope with variations in planningprocedures compared to head, knee and shoulder examinations.
Every spine examination is unique. It is not always known beforehand at which disc level thetransverse scans need to be positioned. SmartExam Spine comes with a unique graphical userinterface. A schematic drawing of the spine allows easy definition of the precise levels for eachstack.
Often a high resolution scan is necessary to determine the precise locations at which the trans-verse stacks must be planned. A Philips-unique snapping mechanism is implemented: dragginga stack in the graphical planscan user interface from one disc level to another results in thestack snapping precisely to the new disc level. This snapping occurs according to the user pre-fered planning as learned during the training phase.
If necessary, all stacks can be freely manipulated to tweak and train SmartExam planning bet-ter. The graphical planscan user interface automatically differentiates between manual finetuning of individual stacks and dropping stacks at different levels.
NOTICESevere pathology or metal might cause SmartExam Spine to fail.
SmartExam BreastDifferent to other anatomies, Image Based (IB) Shimming is automatically performed as part ofSmartExam Breast, based on the IB-Smart segmentation algorithm.
IB-Smart requires that a SmartBreast survey is performed. The SmartBreast survey is designedto acquire the entire volume of tissue placed in the breast coil. It is important to position thepatient so that they are in the center of the chosen coil. As with other Smart Surveys, first 3D

Terminology and Definitions SmartExam
46 Philips MRI
Phili
ps H
ealth
care
4598
006
437
51/7
81 *
03/
2014
*7
images are acquired, then orthogonal reconstructions (including both left and right breasts) arecreated and automatically updated in the view ports upon completion of the SmartExam analy-sis.
Fig. 11: Smart Surveys with the orthogonal reconstructions.
To provide optimal shimming for the tissue of interest, IB-Smart uses the 3D volume acquiredduring the SmartBreast Survey: an automatic segmentation is performed that excludes thelungs, heart, arms and silicone if present.
Fig. 12: Segmentation of the breasts to exclude lungs, heart, arms and silicone.
Shimming is performed on the remaining breast and axillae, leading to a uniform flip angle inthe areas of interest and uniform fat suppression. Optimal shimming is obtained by calculatinga B0 map before shimming and making adjustments to the shim in order to optimize the B0 inthe segmented area.
Fig. 13: B0 maps.
Once calculations are completed they are available to the system to be applied to any sequencein which IB-Smart is the enabled shim parameter.
NOTICEIn order to utilize the segmentation algorithm for the SPIR and SPAIR sequences, enable 'IB-Smart' via the 'Shim' parameter on the 'Contrast' tab.
A shim box will not be visualized, and the values calculated by IB-Smart will be used.

Interactive Scanning Terminology and Definitions
Philips MRI 47
Phili
ps H
ealth
care
4598
006
437
51/7
81 *
03/
2014
*7
Additionally, if performing on a 3.0T system, RF shimming must be adaptive and therefore a B1calibration scan is required.
A system with SmartBreast enabled is delivered with trained Smart Geometries. The Smart-Breast geometries are trained at 0 angle, covering the breasts:
• Cor_PH –centered right to left
• Sag_PH – centered foot to head according to the breast tissue
• Tra_PH – centered to just anterior to the subcutaneous adipose tissue and chest wall, mid-way right and left between the breasts.
Fig. 14: Planning example.
If the provided Smart Geometries do not meet the user's individual needs, site specific geome-tries can be trained. For more information, refer to the section SmartExam: Workflow ’Set up aSmart ExamCard’.
Related parameters
• Shim (values relevant for SmartExam Breast: IB-Volume, IB-Smart)
• RF Shim (values relevant for SmartExam Breast: IB-Volume, IB-Smart)
• Interactive F0
Interactive Scanning
About Interactive ScanningInteractive Scanning is a tool to be used whenever planning is difficult, e.g. due to complexanatomy as in the heart, the pancreas or the parotids. It can be used to track spatial and tem-poral changes. Interactive Scanning means that specific scan parameters (geometry and a fewcontrast parameters) are changed while scanning whereas the effect is to be seen in real-time.In such a way the optimal slice plane can quickly be found e.g. in case of difficult anatomies.
Imaging parameters which can be modified interactively are:
• Orientation parameters as offcenters, angulations, slice orientation
• FOV and slice thickness
• Flip angle (in gradient echo techniques)

Terminology and Definitions Interactive Scanning
48 Philips MRI
Phili
ps H
ealth
care
4598
006
437
51/7
81 *
03/
2014
*7
• Trigger delay
• TFE prepulse on/off and TFE prepulse delay time
• Viewing settings as windowing or display of mirrored, flipped or rotated images
The key to Interactive Scanning is that scan geometry can be stored and be re-used in the fol-lowing scans.
Interactive scans
• Can be combined with:
– Any scan technique like SE, FFE, TSE, GRASE or EPI
– Respiratory and/or cardiac triggering
• Have the following constraints:
– Single-slice
– Single-phase
– Not combinable with dynamic scan mode
Interactive ModesInteractive Scanning can be performed in two different modes. Toggling between these modesis possible at any time during the interactive session.
Continuous mode
Also referred to as real-time mode.
The same slice is scanned repeatedly until a user action (e.g. a right click) instructs the scannerto use different scan parameters for the next image(s).
The ‘Image delay’ field (‘Scan parameters’ subwindow) defines the time between two images(relative to the time needed to scan a single image). Increasing this delay can be used to avoidhigh SAR or high temperature warnings and to increase SNR in TSE methods.
Applications
• Cardiac examinations
• Functional joint studies
– Typically gradient echo scans.
– TSE is not used due to saturation effects unless DRIVE is enabled.
Single-image mode
Means that only one single image is scanned after the user triggers the scanner, for examplethrough a right-click.
Applications
E.g. for tracking a needle in a biopsy guidance. Typically TSE scans which provide high spatialresolution and are less sensitive for field inhomogeneities.

Viewports and Windows Introduction to the User Interface and General Information
Philips MRI 49
Phili
ps H
ealth
care
4598
006
437
51/7
81 *
03/
2014
*7
Introduction to the User Interface andGeneral InformationiPatient provides patient-centric workflow: An intiuitive interface allows users to adapt imagingto the patient in a consistent manner, aided by SmartExam, SmartSelect and user guidance.
This chapter gives an introduction to the user interface and describes generic functionalityavailable throughout the complete user interface with respect to planning, scanning, reviewingand analysis.
For more information about:
• screen layout and the most important windows and menus, please refer to chapter “ScreenLayout, Menus and Windows” on page 61.
• Review and Analysis packages, please refer to chapter “Review and Analysis Packages” onpage 105.
• workflows, please refer to chapter “Workflows Scanning and Planning” on page 197.
Viewports and WindowsA window is a visual area containing some kind of user interface. The windows in the MRI userinterface have a rectangular shape that can overlap with the area of other windows. They areused for multiple purposes, e.g. they may allow input to processes, or they are used to displaynotifications and error messages.
A viewport is a window dedicated to the display of images, e.g. MR slices, reformats or parame-ter maps.
Viewport Buttons► Click any of the viewport buttons in the upper right corner of each viewport to:
• Hide the Toolbar
• Maximize or Minimize the View
• Close the View.
Typical ButtonsDepending on the kind of window, several controls/buttons apply:
Control/Button Function
Hide Hides the window.
OK Leaves the window/browser/editor with changes made, but without applyingthe current changes.
8

Introduction to the User Interface and General Information The various controls
50 Philips MRI
Phili
ps H
ealth
care
4598
006
437
51/7
81 *
03/
2014
*7
Control/Button Function
Apply Leaves the window/browser/editor with changes made, and applies the currentchanges.
Proceed Leaves the window/browser/editor: confirms a selected procedure and goesahead.
Cancel Leaves the window/browser/editor without any changes.
The |ESC| key on the keyboard can also be used to close windows similar to Cancel.
Switch between viewsOne view is always the “current view. If a series is displayed in that view, it is the "current ser-ies".
To select another view as current view
► Click on another view.
Fig. 15: 3 views in a tiled view: the upper left one is the current one (with orange tab and orange border).
The various controlsThe MR User Interface has various controls especially set up to meet the specific requirementsof each application. These controls are:
• the main menu bar with comprehensive menus to access essential functionality.
• the application-specific toolbars, e.g. for planning or reviewing. For easy and quick access, the most important functions can be performed via these tool-bars.
• dedicated functionality on all panels on the system.
• various right mouse menus (context menus)

Notifications and Alerts Introduction to the User Interface and General Information
Philips MRI 51
Phili
ps H
ealth
care
4598
006
437
51/7
81 *
03/
2014
*7
Right mouse menus are available throughout all applications to facilitate the use of the sys-tem and to offer various interaction possibilities.
– Simply right-click on any viewport/screen area to access the right mouse menu.
• Keyboard
Keyboard functions can be used for several purposes, e.g. for scrolling through images bymeans of the arrow keys.
Most of the functions in planning, reviewing or postprocessing can be performed via all con-trols. It's purely a matter of taste which control is going to be used.
For more information about menu bar, toolbars and panels available, refer to chapter “ScreenLayout” on page 61.
Fore more information about the keyboard functions, refer to chapter “Keyboard and MouseInteraction” on page 29.
More information about the right mouse menus is available where applicable.
Notifications and AlertsStandard notifications and error messages show up in the bottom row of windows.
Alerts or notifications that require user attention pop up in dedicated windows.
Image InformationInformation about images and imaging series is given at different locations in the Review andAnalysis packages.
About Imaging Series
Information about the imaging series can be displayed when hovering the cursor over theThumbnail View:
Fig. 16: Information about imaging series in tooltip.
Image Information
Image information in the upper left corner of every image appears when you open an imagingseries in any of the Review or Analysis packages.
Every image is displayed with text information:

Introduction to the User Interface and General Information Image Information
52 Philips MRI
Phili
ps H
ealth
care
4598
006
437
51/7
81 *
03/
2014
*7
Fig. 17: Typical examples. The upper left image shows the format of the image information: see table below.
Number Representing Possible values
1 scan number 1,1 or 2,1 or 3,1 or 4,1 where the first digit increases for scanning steps and the sec-ond digit for the postprocessing steps
2 slice number mostly 2 numbers separated by a "/"where the first digit is the current slice number and the seconddigit the total number of slices in this series
3 scan technique e.g. (T)SE - (Turbo) Spin Echo, FFE - Fast Field Echo, (B-)TFE -(Balanced) TFE
4 image type e.g. M - Modulus, P - Phase, R - Real, I - Imaginary, SW_M,R,I,P- Susceptibility Weighted-M,R,I,P
5 More • empty - if not applicable
• Dt (dynamic time) - only applicable for dynamic imagingseries
• Td (Trigger delay) - only applicable for triggered imagingseries
• Ec1, Ec2 - only applicable for multi-echo imaging series
Tab. 2: Format
Graphical information per viewport
By default, the following graphical information is given in every viewport:
• The fold-over indicator that indicates the fold-over direction in which typically MR artifacts occur.
• The 3D coordinate systemthat indicates the Head-Feet (H_F), the Anterior-Posterior (AP) and the Left-Right (LR) direc-tion.
• If applicable a Link symbolindicating that imaging series are linked.

Windowing, Zooming and Panning Introduction to the User Interface and General Information
Philips MRI 53
Phili
ps H
ealth
care
4598
006
437
51/7
81 *
03/
2014
*7
Fig. 18: Fold-over indicator, 3D coordinate system and Link symbol.
Increasing/decreasing the amount of information
In ImageView, you can increase or decrease the amount of information by means of the button'Image Information' which is available on the ImageView toolbar. For more information, refer tochapter “Toolbar” on page 107. The amount of information displayed cannot be changed in Re-view or Analysis packages other than ImageView.
Windowing, Zooming and Panning
Zoom, Pan, Window width and level
Zooming, panning and windowing are performed via direct mouse actions.
Direct mouse actions must start in the current viewport. Mouse movement is not limited to thisviewport but to the viewing area of the screen.
Parameter Mouse button(s) and movement Movement and Effect
Window level (Bright-ness)
middle
• upwards = darker
• downwards = brighter
Window width (Con-trast)
middle
• to the right = less contrast
• to the left = more contrast
Zoom middle + right • upwards = zooming in; Max. zoom factor of 8
• downwards = zooming out; Min. zoom factor of0.25

Introduction to the User Interface and General Information Scrolling through images
54 Philips MRI
Phili
ps H
ealth
care
4598
006
437
51/7
81 *
03/
2014
*7
Parameter Mouse button(s) and movement Movement and Effect
Pan middle + left • to pan in all directions.
Scrolling through imagesThe way of scrolling through images depends on the view settings and the number of imageattributes.
You can use the mouse or the arrow keys to scroll through images.
To scroll through ... Press the arrowkeys
Mouse move-ment
Effect on image attribute
1st image attribute Movement to the right increases (to the left de-creases) the number of the image attribute.
2nd image attribute Upwards movement increases (downwards de-creases) the number of the image attribute.
3rd image attribute not applicable Movement right-upwards increases (left down-wards decreases) the number of the image attrib-ute.
Example: Scrolling in a scan with only one image attribute
The image dataset has only slices.
Through slices (or resulting) maps
► In the image (or map) viewport, drag to the left or to the right.
► Alternatively use the left and right arrow keys.
Example: Scrolling in a scan with two image attributes
The dataset consists of multiple dynamics with multiple slices. The first image attribute are thedynamics, the second one are the slices. First all slices for the first dynamic are displayed, thenall slices for the second dynamic and so on.
Through dynamics
► In the image viewport, drag to the left or to the right.
Through slices
► In the image viewport, drag up- or downwards.

Generic functions for images Introduction to the User Interface and General Information
Philips MRI 55
Phili
ps H
ealth
care
4598
006
437
51/7
81 *
03/
2014
*7
Generic functions for imagesThe functions listed below can be performed throughout the complete user interface. They areavailable via the right mouse menus of the image viewports.
In Right Mouse Menus
Interaction Mode
• can be used to define the left mouse usage for interaction with images.
By default, dragging (by means of left mouse button) is used for scrolling. However, dependingon the preference of the user, this can be changed. The following options can be enabled:
Possible setting Corresponding icon Description (left mouse)
Scroll (default) Drag to scroll through the dataset.
Zoom Drag to zoom.
Pan Drag to pan.
Gray Level Drag to adjust the gray level.
In the Review and Analysis packages, more options might be available.
Reset Window (Viewing)
To reset images to original window level and width.
Reset Zoom / Pan (Viewing)
To reset images to original zoom and pan values.
On Toolbars
Play (Movie) <Pause>
• To play (or pause/stop) the current dataset as a movie.

Introduction to the User Interface and General Information Generic functions for images
56 Philips MRI
Phili
ps H
ealth
care
4598
006
437
51/7
81 *
03/
2014
*7
NOTICETo view a MultiMovie, link the viewports first and then click 'Play (movie)'.
A MultiMovie shows multiple imaging series in a movie in parallel. For information about link-ing, refer to chapter “Review toolbar” on page 93.
Movie ToolBox
• To adjust the movie settings.
► Select 'Movie ToolBox' from the Movie drop-down menu besides the icon.
Fig. 19: Movie ToolBox.
Number Purpose/ Description
1 Click this button to toggle between Play, Pause and Stop movie mode.
2 Click this button, then scroll to the image to start the movie with and click 'Play Movie'.
3 Click this button, then scroll to the image to end the movie with and click 'Play Movie'.
4 Select the type of movie from the drop-down menu:
• cyclic (loop): the images are displayed in the order 1 ... n, 1 ... n etc.
• bounce (yoyo): the images are displayed in the order 1 ... n, n ... 1, 1 ... n, etc.
5 Select type of image for the movie, e.g. slices or phases.
6 Adjust the movie speed by dragging the slider.
Viewing
To adjust the viewing settings:
Orientation (Viewing)
To change the orientation of the images:
• Mirror, Flip,
• Rotate clockwise, Rotate counterclockwise,
• Reset orientation,
• Display Images in Radiological View

Generic functions for images Introduction to the User Interface and General Information
Philips MRI 57
Phili
ps H
ealth
care
4598
006
437
51/7
81 *
03/
2014
*7
Image Information (Viewing)
• To define the amount of displayed image information:
• minimum: no text is displayed,
• standard: scan, image number and the scan name are displayed,
• maximum: also the offcenter values, the window values (width and level) and the caliperare displayed.
Interpolate (Viewing)
To interpolate the image(s).
Invert Gray Level (Viewing)
• To invert the images of the current dataset (change black and white in the grayscale).
Capture ...
To capture images and save them. Type of image and destination are to be defined in the 'Cap-ture' pop-up window. Check according to your preferences:
• 'Capture Selected Image' captures the current image.
• 'Capture ImageView' captures the current image including orange border and ImageViewtab.
• 'Capture Full Screen' captures the full screen.
• 'Capture Slices' captures all slices of the current imaging series.
• 'As Displayed and Annotated' or 'As Acquired' allow to capture images with or without theirwindow/zoom settings and annotations.
• 'Save to External Folder' allows to save the data to an external folder.
In this case, it is necessary to browse to this external folder.
• 'Save to Patient Database' allows to save the data to the patient database.
• In order to include the hospital name, check the eponymic option.
The function 'Capture ...' as part of Viewing is only available in Review and Analysis packages,not in Graphical PlanScan.
Save Presentation State <Ctrl+S> (Viewing)
To save a special way of presenting images.
Reload Presentation State <Ctrl+R> (Viewing)
To reload a special way of presenting images.

Introduction to the User Interface and General Information Generate Series and ExamCards
58 Philips MRI
Phili
ps H
ealth
care
4598
006
437
51/7
81 *
03/
2014
*7
Reset Window (Viewing)
To reset images to original window level and width.
Reset Zoom / Pan (Viewing)
To reset images to original zoom and pan values.
Generate Series and ExamCardsOnce the 'Generate Series' function is used and a new imaging series generated, a postprocess-ing item will be added to the ExamCard. The performed operation will be part of the currentExamCard and in such a way will automatically be performed whenever the ExamCard is execut-ed again.
For more information, see chapter “SmartLine Processing” on page 41.
ROIsIn MRI, a Region of Interest (ROI) is a selected subset of voxels within a dataset: contours needto be drawn to define the region of interest.
The ROI function is only applicable within some of the postprocessinges packages, e.g. QFlowand I View BOLD.
In the following sections, the various ROI functions Draw, Propagate, Edit, Rename and Deleteare described.
NOTICENot all of these ROI functions are not available in every package.
Draw a ROI
-> Smoothed Polygon
Click to start up the ROI definition.Draw with the left mouse button (no dragging).Click as often as needed to add new points and to define a smoothed polygon.Control points are created / deleted by pressing |Shift| and clicking on a contour or point.Double-click to end drawing and to confirm the shape.Clicking |ESC|, the entire contour is cancelled.

Scaling of Imaging Series Introduction to the User Interface and General Information
Philips MRI 59
Phili
ps H
ealth
care
4598
006
437
51/7
81 *
03/
2014
*7
-> Ellipse
Click twice to define one axis of the ellipse, click once more to define the other axis of the el-lipse. The area of the shape and the intensity mean value will be displayed by default.To move the shape, drag the center of the shape.To modify the shape, drag the outer edge of the shape.
-> Freehand
Click to start up the ROI definition.Draw with the left mouse button (no dragging).Click to end drawing and to confirm the ROI.The area of the shape and the intensity mean value will be displayed by default.
Delete and copy a ROI1. Right-click on the ROI to open the ROI context menu.
2. Select any of the options:
• Cut <Ctrl+X>
• Copy <Ctrl+C>
• Copy To All
• Delete <Del>
• Delete All
Rename a ROI
You can rename existing ROIs.
► Right-click on a ROI and select 'Rename'.
• It is advised to rename the ROIs for easier identification (e.g. left breast, right breast, tumor,cyst). It might be helpful to add the slice number to the name so that navigation to the re-spective ROI is facilitated.
• If multiple ROIs are renamed to the same name, automatically a numerical extension is add-ed to this name, e.g. Hemisphere, and Hemisphere 2
Edit a ROI• |Ctrl| in combination with the left mouse click, selects respectively deselects a ROI.
• |Shift| in combination with the left mouse click enter the ’ROI Edit’ mode.
Scaling of Imaging SeriesImaging series are linearly scaled.
Scaling is unique per imaging series. As a consequence, the scaling will also be different in e.g.
• imaging series with and without fat suppression:

Introduction to the User Interface and General Information Scaling of Imaging Series
60 Philips MRI
Phili
ps H
ealth
care
4598
006
437
51/7
81 *
03/
2014
*7
• pre- and post-contrast imaging series
NOTICETo ensure the same scaling for pre- and post-contrast imaging series, these scans should bescanned in dynamic mode.
The ExamCard function 'Split Dynamics' can be used to ensure a similar scaling of all requiredscans.

Screen Layout Screen Layout, Menus and Windows
Philips MRI 61
Phili
ps H
ealth
care
4598
006
437
51/7
81 *
03/
2014
*7
Screen Layout, Menus and Windows
Screen LayoutPlanning, scanning, reviewing and postprocessing can be done in one MRI environment. Screenareas are reserved for specific operations such as planning or reviewing.
Fig. 20: Screen layout in Plan mode (large image) and in Review mode (small image).
Number Item Purpose/Description More informa-tion
1 Main menu bar To access the corresponding menus withcomprehensive functionality.
chapter “Mainmenu bar andcorrespondingmenus” onpage 62
2 Launch pad with one tab forscanning and two tabs for re-viewing, the buttons 'Plan' and'Review' and information aboutthe current examination.
To switch between reviewing and scanningtabs and to switch between Plan and Reviewmode.
chapter“Launch Pad”on page 68
9

Screen Layout, Menus and Windows Main menu bar and corresponding menus
62 Philips MRI
Phili
ps H
ealth
care
4598
006
437
51/7
81 *
03/
2014
*7
Number Item Purpose/Description More informa-tion
3 List View= (Current ExamCard)
or
Thumbnail View (Pictorial Index)
To toggle between List View (Current Exam-Card) and Thumbnail View (Pictorial Index)
List View shows the items of the current Ex-amCard whereas Thumbnail View shows arepresentative image per series of all imag-ing series, e.g. scans, reformats.
chapter “ListView or Thumb-nail View” onpage 69
4 Graphical PlanScan area withPlanning toolbar.
To graphically plan the imaging series of anexamination.
chapter“GraphicalPlanScan area ”on page 72
5 Patient Status (PS) area To monitor scan progress and to monitor thestatus of the patient during the examination:physiology signals and e.g. SAR, SED and PNS.
chapter “Pa-tient Statusarea” on page77
6 Parameter Editor
or
ExamCard Manager
To access everything around parameters viathe Scan Dashboard, the Parameter Groupstabs, and the Scan Assistance.
To manage ExamCards in different views.
chapter “Pa-rameter Editor”on page 79
chapter “Exam-Card Manager”on page 78
7 Review toolbar To enable/disable/adjust generic reviewingsettings.
chapter “Re-view toolbar”on page 93
8 Reviewing area Reserved for reviewing imaging series with auser-defined layout.
chapter “Re-viewing area”on page 95
Main menu bar and corresponding menus
Fig. 21: Main menu bar in Plan and Review mode. Menus or menu options that are not applicable will be grayed out.
The Main menu bar allows to access menus with comprehensive functionality:
1. Patients menu
2. Examination menu
3. Review menu
4. Analysis menu

Main menu bar and corresponding menus Screen Layout, Menus and Windows
Philips MRI 63
Phili
ps H
ealth
care
4598
006
437
51/7
81 *
03/
2014
*7
5. System menu
6. Help menu
When function keys are part of a menu option, the indicated function key can be pressed in-stead of selecting a menu option, e.g. <F2> means that the function key F2 can be pressed in-stead of selecting the function 'New Examination' from the Patients menu.
Patients menuThis section describes the menu options that are available via the 'Patients' menu.
New Examination... <F2>
To enter/select examination data (e.g. patient name, birth date, patient weight) in order toscan a new examination.
For more information, refer to chapter “Entering examination data” on page 197.
Open for Review... <F3>
To display the list of examinations in order to view the imaging series of an examination.
... or <Patient Name>
To switch between reviewing and scanning (examination) tabs. This is an alternative to the 3 buttons in the chapter “Launch Pad” on page 68.
Three menu options are available which represent the three patients slots available for scan-ning and viewing. They are displayed as:
• ...when this patient tab is not filled with an examination
• <patient name>when this patient tab is filled with an examination
Administration <F4>
To open the Patient Administration panel in order to e.g. copy, transfer, delete and import ex-aminations and/or images.
For more information, see chapter “Administration (Patient Database)” on page 357.
Close Exam...
To close the current examination.
Examination menuThis section describes the menu options that are available via the 'Examination' menu.
Autoview <F7>
To display the latest reconstructed image of the current scan.

Screen Layout, Menus and Windows Main menu bar and corresponding menus
64 Philips MRI
Phili
ps H
ealth
care
4598
006
437
51/7
81 *
03/
2014
*7
Reuse Scan Items (from Previous Examinations) ...
To display the list of examinations in order to select and consequently reuse scan items from aprevious examination.
► Browse to the patient and the ExamCard to be reused.
► Drag this ExamCard into List View.
Fig. 22: Patient Database.
NOTICEThis function can be used to display the imaging parameters of previously scanned series.
Repeat Prescans
To repeat previously performed prescans for the current ExamCard.
SmartExam
To access SmartExam related functionality for the current examination. This menu entry opensa submenu with several SmartExam options:
• Show SmartGeometries
• Improve SmartGeometries with Current Planning ...
• Reset to SmartPlan
• Analyze SmartSurvey
• Stop offline analyzing
Enable Automatic Start Scan
To enable/disable the automatic start of a scan.
Enable Autopush to Workstation
To enable/disable the automatic transfer of an examination to a workstation, e.g. EWS, (if con-nected) upon completion.
Save ExamCard
To save the current ExamCard under a user defined name.

Main menu bar and corresponding menus Screen Layout, Menus and Windows
Philips MRI 65
Phili
ps H
ealth
care
4598
006
437
51/7
81 *
03/
2014
*7
Adjust Ventilation in Bore ...
To increase or decrease the ventilation in the bore. For more information, see chapter “AdjustVentilation in Bore” on page 226.
Depending on your system's configuration, this menu option is available or not.
Choose Physiology Properties ...
• To select the physiology signal (e.g. VCG, PPU, Respiratory) for display and adjust the dis-play settings.For more information, refer to chapter “Physiology Properties” on page 98.
Navigator Display ...
To enable/disable the display of navigator data.
Data Monitoring...
To monitor data transfer.
Review menuThe Review menu allows to access the reviewing packages that are available on your MRI sys-tem:
• ImageView
• VolumeView
• MobiView
For more information about these packages, refer to chapter “Review and Analysis Packages”on page 105.
NOTICEDepending on the commercially available options on your MRI system, less packages could beavailable.
Analysis menuThe Analysis menu allows to access the postprocessing packages that are available on your MRIsystem:
• PicturePlus
• ImageAlgebra
• Diffusion Registration
• Diffusion
• Basic T1 Perfusion

Screen Layout, Menus and Windows Main menu bar and corresponding menus
66 Philips MRI
Phili
ps H
ealth
care
4598
006
437
51/7
81 *
03/
2014
*7
• QFlow
• SpectroView
• NeuroPerfusion
• IViewBOLD
• FiberTrak
For more information about these packages, refer to chapter “Review and Analysis Packages”on page 105.
NOTICEDepending on the commercially available options on your MRI system, less packages could beavailable.
System menuThis section describes the menu options that are avaiable via the 'System' menu.
Capture the Screen ... <Ctrl+P>
• To make a screen capture and save it into a DICOM file with a default name. This function is available in the 'System' menu and on the Review toolbar.
Manage Job Queue ... <F6>
To check the status of background processes. For more information, see chapter “Check statusof background processes with the Job Queue” on page 364.
Print History
To display the previously initiated printing job by means of the Job Queue, see chapter “Checkstatus of background processes with the Job Queue” on page 364.
Enable Autopush To DICOM Node
To enable/disable the automatic transfer of an examination to a DICOM node (if connected)upon completion.
Manage ExamCards ...
To open the ExamCard Manager. For more information, refer to chapter “ExamCard Manager”on page 78.
SmartExam Tools
To modify SmartExam settings and/or the SmartGeometry database by means of the options:

Main menu bar and corresponding menus Screen Layout, Menus and Windows
Philips MRI 67
Phili
ps H
ealth
care
4598
006
437
51/7
81 *
03/
2014
*7
SmartExam Tools: User Confirmation Mode
• toggles between user confirmation mode and automatic confirmation mode.
SmartExam Tools: No automatic Add Samples Dialog
• adjusts how newly planned samples are treated:
'No automatic Add Samples Dialog' Effect
If Checked Samples will not automatically be added to a SmartGe-ometry.
As a consequence, the user will be asked after a plan-ning, if this planning has to be added to a SmartGeome-try:
"Improve SmartGeometries with current planning?"
If Unchecked Samples will automatically be added to a SmartGeome-try.
SmartExam Tools: SmartGeometry Database Editor ...
• Allows to view the existing SmartGeometries for all anatomic regions: the Philips prelearnedones and the user defined ones;
• Can be used to e.g. delete all samples of a user defined SmartGeometry.
NOTICEPhilips prelearned SmartGeometries are grayed out and cannot be deleted.
SmartExam Tools: Export SmartGeometry Database ...
• allows to export a SmartGeometry database to another device/directory.
• can only be done if the ExamCard window is empty (no current ExamCard) or if the currentExamCard does not contain any SmartGeometries.
SmartExam Tools: Import SmartGeometry Database ...
• allows to import a SmartGeometry database from another device/directory.
• can only be done if the ExamCard window is empty (no current ExamCard) or if the currentExamCard does not contain any SmartGeometries.
SPT ...
To access the System Performance Tool (SPT).
Feedback ...
To give customer feedback and report an issue to Philips.

Screen Layout, Menus and Windows Launch Pad
68 Philips MRI
Phili
ps H
ealth
care
4598
006
437
51/7
81 *
03/
2014
*7
For more information, see chapter “Customer Feedback” on page 383.
Exit
To exit the system software.
Help menuThis section describes the menu options that are available via the 'Help' menu.
User Documentation...
To access and open the User Documentation via the User Documentation window.
Help Topics... <F1>
To open the Help system.
About ...
To display system name, release number etc.
Launch PadThe Launch Pad allows to switch between up to three examinations. For this purpose, three ex-amination tabs are available, one for scanning/planning and reviewing, the other two only forreviewing. They can be filled with three different examinations which can be processed at thesame time and easily be switched between.
Furthermore the Launch Pad allows to switch between Plan mode and Review mode for theexamination currently being scanned.
Fig. 23: Launch Pad. 1 - Scanning Tab button. 2 - Reviewing Tab button. 3 - Registration ID, Date of Birth and Genderof current examination. 4 - Plan button. 5 - Review button. Note that the Plan and Review button are only availablefor the currently scanned patient (in the scanning tab).

List View or Thumbnail View Screen Layout, Menus and Windows
Philips MRI 69
Phili
ps H
ealth
care
4598
006
437
51/7
81 *
03/
2014
*7
Switch between Reviewing and Scanning/Planning Examination Tabs
► To switch to the examination in another tab, click on any of the buttons representing thesetabs:
Button Type of tab To replace an examination in this tab, use:
Scanning 'New Examination' from the Patient menu
An empty tab is indicated by the button with black out-line. The colored button represents a tab with an exami-nation loaded.
Reviewing 'Open for Review' from the Patient menu
An empty tab is indicated by the button with black out-line. The colored button represents a tab with an exami-nation loaded.
Switch between Planning and Reviewing
When the scanning tab is selected, the buttons 'Plan' and 'Review' are available. They allow toswitch between planning and reviewing for the current examination.
► Click the 'Review' button to switch to the reviewing environment.
The complete image area can be used for reviewing.
► Click the 'Plan' button to switch to the planning environment.
In planning mode, the image area is reduced to 3 view ports in the upper part of the screen.In the lower part, the Parameter Editor with its components is displayed.
List View or Thumbnail ViewYou can toggle between the List View which displays the Current ExamCard AND the ThumbnailView (Pictorial Index) which displays thumbnails of all imaging series for the current examina-tion.

Screen Layout, Menus and Windows List View or Thumbnail View
70 Philips MRI
Phili
ps H
ealth
care
4598
006
437
51/7
81 *
03/
2014
*7
Fig. 24: Left: Current ExamCard in List view, Right: Thumbnail View. 1 - 'Switch to List View' button (left: enabled,right: disabled), 2 - 'Switch to Thumbnail View' button (left: disabled, right: enabled), 3 - Current ExamCard, 4 -Thumbnail View, 5 - ExamCard Properties button (in both images: enabled), 6 - Button to expand/collapse the infor-mation about the current imaging series (blue frame around thumbnail), 7 - Information about imaging series. Thisinformation can be expanded by clicking '6' ( 'Expand' button).
The ExamCard Properties button is only available in Plan mode. For more information, refer tochapter “ExamCard Properties” on page 71.
Thumbnail View
The Thumbnail View (also referred to as Pictorial Index) is particularly useful in reviewing imag-ing series as it gives a preview of the imaging series. It shows one thumbnail (representativeimage per series) per imaging series, e.g. for scan protocols, reformats, if applicable. The Thumbnail View is empty for a new examination.
At the bottom of the Thumbnail View, image information about the current imaging series isdisplayed. This information can be expanded or collapsed. Hovering the cursor above the thumbnails also displays some of this information.
List View
The List View shows the ExamCard that is currently in use at the system for
• planning (including automatic planning by means of SmartExam)
• scanning
• automatic processing (SmartLine processing).
For more information about SmartExam and SmartLine processing, see chapter “Terminolo-gy and Definitions” on page 33.
In order to start scanning, it is required to select an ExamCard and make it the current one.
To make an ExamCard the current ExamCard,
► simply drag and drop the required ExamCard from the (Single or Double) ExamCard Data-base View (see chapter “ExamCard Manager” on page 78) into the List View.
The ExamCard opens and automatically shows up with all its ExamCard items:

List View or Thumbnail View Screen Layout, Menus and Windows
Philips MRI 71
Phili
ps H
ealth
care
4598
006
437
51/7
81 *
03/
2014
*7
ExamCard Properties
This window can be opened by clicking the 'ExamCard Properties' button in the List View.
It allows to define 'General' and 'Push Nodes' properties for all items of an ExamCard via thetabs 'General' and 'Push Nodes'.
Fig. 25: ExamCard Properties window.
General
The following properties can be set to any of the listed values:
• Patient Position: Supine, Prone, DecubRight, DecubLeft
• Patient Orientation: HeadFirst, FeetFirst
• Laterality: Left, Right, Unpaired, Both, MixedThe parameter Laterality is primarily used for paired anatomies such as knee, shoulder, an-kle etc. The laterality value can be used by PACS systems.
– Left or Right - to be used for left or right joint
– Unpaired - to be used for unpaired anatomies, e.g. abdomen
– Both - to be used when both joints are scanned within one scan
– Mixed - to be used when both joints are scanned within one ExamCard, but in differentscans
• Anatomic region: Abdomen, ... , AcroMioClavicularJoint, ... , Ankle joint, ... (DICOM standardvalues in alphabetical order)
NOTICEThe value of the parameter ’Anatomic region’ is used by the SpectroView package in order toselect the default basic processing script.
• Table Usage: Use, Ignore
• Heart rate [bpm]

Screen Layout, Menus and Windows Graphical PlanScan area
72 Philips MRI
Phili
ps H
ealth
care
4598
006
437
51/7
81 *
03/
2014
*7
• Align overlap [mm]
• GeoLink propagation: No, Yes
• Geometries: list of available geometries.
• Disengage Posterior Coil: No, Yes (this parameter is automatically set to 'Yes' or 'No' de-pending on the used coil/coil solution).
• Activate Manual Confirmation: No, Yes (when this parameter is enabled, a manual confir-mation will be required if the posterior coil is going to be disengaged)
Push nodes
The setting of this parameter is persistent. This means that even after restarting the system, thesetting will be the same.
When ’Push to workstation’ is enabled, the examination will automatically be pushed to the se-lected push node.
Graphical PlanScan areaIn a MRI examination, first survey images are performed. The consecutive scans are planned onthese survey images (mostly orthogonal images in multiple orientations), in the Graphical Plan-Scan area.
Images from any other series can also be used for planning purposes. Furthermore you can planon movies. This is especially helpful in Cardiac imaging.
Fig. 26: Graphical PlanScan area: toolbar and viewports.
In the Graphical PlanScan area, the Planning toolbar and the PlanScan Overlay are the essentialtools.
Initiate planning in the Graphical PlanScan area
► Double-click on a scan protocol in the List View to initiate planning.
Graphical PlanScan starts up with its planning toolbar and three view ports with images andoverlay.

Graphical PlanScan area Screen Layout, Menus and Windows
Philips MRI 73
Phili
ps H
ealth
care
4598
006
437
51/7
81 *
03/
2014
*7
Load images into the three viewports of the Graphical PlanScan area
⊳ After completion of the survey images:
► drag the completed EC item (e.g. survey) from the List View into the Graphicl PlanScan area.
If the EC item consists of images of different orthogonal orientations (e.g. Multistack Sur-vey), an image of each orientation will automatically be displayed in every viewport.
Planning toolbarThe planning toolbar is only available in Plan mode. It offers the following functions:
3 Point Planscan
• To enable/disable 3 Point Planscan. 3 Point Planscan is a tool which helps to define an irregular plane. The plane is determinedby the placement of three points on two or more images of different orientations.
Workflow
► Activate ’3PPS’. The 3PPS specific toolbar is displayed instead of the normal planning toolbar.
► Place the three points on any of the three images selected in the planning view ports:
• Click the icon for point 1 on the toolbar, then click in the image to define point 1.
• Click the icon for point 2 on the toolbar, then click in the image to define point 2.
• Click the icon for point 3 on the toolbar, then click in the image to define point 3.
► To restart or change the positioning of the points click |Off|.
► Click the icon |Compute plane| to perform the Three-point planscan.
► Click the icon |3PPS| again to return to normal planscan.
The angulation from the 3 Point PlanScan are taken over and displayed.
► Proceed with routine planning.
Stack A, B, ... drop-down menu
• To switch between stacks during planning.
Add Current Geometry
• To add the current geometry to the geometry database for reuse.

Screen Layout, Menus and Windows Graphical PlanScan area
74 Philips MRI
Phili
ps H
ealth
care
4598
006
437
51/7
81 *
03/
2014
*7
Delete Current Geometry
• To delete the current geometry from the geometry database.
Display ...
To adjust the display of the imaging volume in planningmode.
Box Mode
• To display the imaging volume as box.
3D Mode
• To display the imaging volume in 3D mode.
All Mid Planes
• To enable/disable the display of all midplanes.
Hide/Show
To hide/show the display of the imaging stack, the imaging volume or the slab.
Hide/Show Stack
• To hide/show the current stack.
Hide/Show Volume
• To hide/show the current volume.
Hide/Show Slab
• To hide/show the current REST slab.

Graphical PlanScan area Screen Layout, Menus and Windows
Philips MRI 75
Phili
ps H
ealth
care
4598
006
437
51/7
81 *
03/
2014
*7
Scan Align
• To align scans, especially with table movement to cover long anatomical areas.
Play (Movie) <Pause>
• To play (or pause/stop) the current dataset as a movie.
NOTICETo view a MultiMovie, link the viewports first and then click 'Play (movie)'.
A MultiMovie shows multiple imaging series in a movie in parallel. For information about link-ing, refer to chapter “Review toolbar” on page 93.
The Movie functionality is a generic functionality occuring in Graphical PlanScan and all Reviewand Analysis packages. For more information about movies, refer to chapter “On Toolbars” onpage 55.
Settings
• To adjust settings in the 'Settings' window, in most packages: display, stacks and propaga-tion settings.
Viewing
The Viewing drop-down menu is a generic menu occuring in Graphical PlanScan and all Reviewand Analysis packages. For more information, please refer to chapter “On Toolbars” on page 55.
PlanScan OverlayThis PlanScan overlay includes the display of volume or the stack(s) of slices, and if applicablee.g. (REST) saturation slab, shim box or navigator.It can be adjusted by means of the functions available on the toolbar, see chapter “Planningtoolbar” on page 73.
Display Conventions
Color Item displayed
yellow center slice and outer slices of stack or volume that is to be planned, or cross-sections withthese slices
red every slice of stack or volume that is to be planned, or cross-sections with these slices

Screen Layout, Menus and Windows Graphical PlanScan area
76 Philips MRI
Phili
ps H
ealth
care
4598
006
437
51/7
81 *
03/
2014
*7
Color Item displayed
blue saturation (REST) slabs
For information about REST slabs, refer to the Help. .
green shim volume
For information about RF Shimming, refer to the Help..
For information about B0 Shimming, refer to the Help..
white navigator
For information about Navigators, refer to the Help..
Fig. 27: Examples of planscan overlay according to above conventions.
NOTICETo see the slice intersections (as slices or as a box), the (survey) image must be perpendicularto the planned slices.
When the (survey) image is parallel to the planned slices, the box slice intersection is dis-played.
NOTICEAll images on the screen must have been scanned with the same subanatomy and patient po-sition (Head first/Feet first, supine/prone).

Patient Status area Screen Layout, Menus and Windows
Philips MRI 77
Phili
ps H
ealth
care
4598
006
437
51/7
81 *
03/
2014
*7
For workflow information on how to plan, refer to chapter “Plan the items of the ExamCardgeometrically” on page 203.
Exit Planscan► Click |Accept|.
The status of the EC item being planned changes to ‘ready to run’.
Another scan can be planned while execution of the scan(s) is in progress.
NOTICEClicking |Accept| accepts any changes made to parameters while clicking |Cancel| concedesthat all changes made will be lost.
Patient Status areaIn the Patient Status (PS) area , information about the currently running scan and ExamCard isavailable.
Fig. 28: Patient Status area. 1 - Patient name, 2 - Reserved for physiology signal (if connected), 3 - Scan progress bar,4 - Message line, 5 - ExamCard progress bar, 6 - Start Scan button, 7 - Date, time and thermometer if the room tem-perature is above 25o C (77 F), 8 - Autoview button, 9 - Status indication area, 10 - Stop Scan button.
Status Indication area
The Status Indication area indicates the status of:
• SED (Specific Energy Dose),
• SAR (Specific Absorption Rate),
• PNS (Peripheral Nerve Stimulation).

Screen Layout, Menus and Windows ExamCard Manager
78 Philips MRI
Phili
ps H
ealth
care
4598
006
437
51/7
81 *
03/
2014
*7
ExamCard ManagerThe ExamCard Manager is the starting point in every examination: it opens automatically afterentering examination via 'New Examination' from the Patient menu. It can also be started fromthe System menu: 'Manage ExamCards'.
The ExamCard Manager has two main functions:
• To select an ExamCard for the current examination in the scanning slot,
• To manage ExamCards (Copy, Edit, Delete ExamCards).
Fig. 29: ExamCard Manager including ExamCard Dashboard (dark gray area with buttons 2, 3, and 4).
1 Tabs to switch between the ExamCard databases: Philips, Hospital, Other, and to browse to Exam-Cards and scan protocols.
For more information, refer to chapter “ExamCard Databases (EC databases)” on page 33.
2 ExamCard (EC) Database View.
The figure shows the Single EC Database View. You can enable the Double EC Database View bymeans of button '3'.
3 Toggle button to switch between two ExamCard views:
• Single EC Database View (where only one EC database is open)
• Double EC Database View (where two EC database are displayed aside in order to manageExamCards).
The Double EC Database view allows inspection of the ExamCard databases in two differentbrowsers at the same time. ExamCards can be easily dragged from one EC database to anoth-er one, either within one browser or from one browser to the other.
4 Button 'Refresh ExamCards views' to make the most recent changes to the ExamCard databasevisible, e.g. after importing ExamCards.
5 Button 'Close' to close the ExamCard Manager.

Parameter Editor Screen Layout, Menus and Windows
Philips MRI 79
Phili
ps H
ealth
care
4598
006
437
51/7
81 *
03/
2014
*7
6 Scan Assistance with three tabs and a viewport. For more information, refer to chapter “Scan As-sistance” on page 92.
Parameter EditorThe Parameter Editor consists of multiple components:
• Dashboard which displays information about the currently planned EC item (see chapter“Dashboard” on page 79),
• Parameter Groups tabs which allow to access all imaging parameters (see chapter “Param-eter Groups tabs” on page 80),
• Summary tab which allows to modify the most important imaging parameters (see chapter“Summary tab” on page 81).
Fig. 30: Parameter Editor with: 1 - Dashboard, 2 - Parameter Groups tabs, 3 - Summary tab, 4 - Bottom line reservedfor messages and alerts.
Via the Parameter Groups tabs, more tools/windows can be accessed:
• Extended Parameter Editor which allows to edit all imaging parameters (see chapter “Ex-tended Parameter Editor” on page 82),
• Coil Selection UI which allows to change the automatic coil selection (see chapter “Coil Se-lection Tab” on page 88),
• Conflicts page which shows conflicting parameters (see chapter “Conflicts page” on page91).
DashboardThe Dashbard is a control panel housing instrumentation and controls for scanning operation. Itshows the effects of the planned protocol on SAR, SED and PNS immediately during planning. Insuch a way, planning can be optimized for each patient individually.

Screen Layout, Menus and Windows Parameter Editor
80 Philips MRI
Phili
ps H
ealth
care
4598
006
437
51/7
81 *
03/
2014
*7
Fig. 31: Dashboard with information (e.g. Rel. SNR, TE, TR, PNS, SAR) about EC item and the control buttons: 1 - Undoand Redo (the previous action), 2 - Accept (planning), 3 - Reset (to initial values), 4 - Cancel (planning).
For more information about SAR (Specific Absorption Rate), SED (Specific Energy Dose) and PNS(Peripheral Nerve Stimulation), refer to the Safety chapter.
Parameter Groups tabsThe MR imaging parameters are divided into different parameter groups. Initially the 'Summary'group is displayed.
The Parameter Groups tabs allow to access the
• Summary parameter group:
– Simply click the button 'Summary' to access this group.
• Physiology parameter group, if Wireless Physiology is connected:
– Simply click the button 'Physiology' to access this group.
• Extended parameter groups:
– Click the arrows button to expand/collapse the tabs and to show/hide the extended pa-rameter groups.
– Click any of the tabs to access one of the extended parameter groups.
Fig. 32: Parameter Groups tabs. Upper row: Summary tab and arrows button to expand the parameter groups. Lowerrow: Summary tab, tabs for the extended parameter groups and the arrows button to collapse the extended parame-ter groups tabs.
Button Parameter group More information
Summary The most commonly used parame-ters for easy access
chapter “Summary tab” on page 81
Geometry Geometry related parameters chapter “Extended Parameter Editor”on page 82
Contrast Contrast related parameters chapter “Extended Parameter Editor”on page 82
Motion Motion related parameters chapter “Extended Parameter Editor”on page 82
Dyn/ang Dynamic or angio related parameters chapter “Extended Parameter Editor”on page 82

Parameter Editor Screen Layout, Menus and Windows
Philips MRI 81
Phili
ps H
ealth
care
4598
006
437
51/7
81 *
03/
2014
*7
Button Parameter group More information
Postproc Parameters to control automaticpost-processing
chapter “Extended Parameter Editor”on page 82
Offc/ang Offcenters and angulations of stacks,slabs and navigators
chapter “Extended Parameter Editor”on page 82
Coils Coil selection parameters. (Opensthe Coil Selection UI)
chapter “Coil Selection Tab” on page88
Conflicts No parameters, but occuring con-flicts resulting from conflicting pa-rameter settings
chapter “Conflicts page” on page91
Summary tabThe Summary tab is meant to quickly check a scan protocol prior to execution. The most com-monly used parameters are displayed:
1. Field of View (FOV) in all directions (selection, phase- and frequency-encoding direction) inmillimetres,
2. Voxel size in all directions (selection, phase- and frequency-encoding direction) in millime-tres,
3. Matrix size in all directions (selection, phase- and frequency-encoding direction) in numberof voxels x number of voxels x number of slices,
4. Slice Gap (which can be enabled or disabled by checking the checkbox, and which can beadjusted by typing in a value) in millimetres,
5. Number of Signals Averaged (NSA),
6. Fat Saturation by means of SPIR (SPectral Inversion Recovery) (which can be enabled or dis-abled by checking the checkbox).
Fig. 33: Summary tab.

Screen Layout, Menus and Windows Parameter Editor
82 Philips MRI
Phili
ps H
ealth
care
4598
006
437
51/7
81 *
03/
2014
*7
Extended Parameter EditorThe Extended Parameter Editor allows modification of the items of an ExamCard on parameterlevel.
To open the Extended Parameter Editor
1. Double-click on an ExamCard scan protocol in order to open it in the Parameter Editor.
The Parameter Editor opens automatically for the current ExamCard item.
2. Click on the arrows besides the Summary tab to display the extended parameter grouptabs.
3. Click on one of the tabs Geometry, Contrast, Motion, Dyn/Ang, Postproc, Offc/Ang toopen the Extended Parameter Editor.
Fig. 34: Extended Parameter Editor. 1 - Parameters per group, 2 - Detailed information about the currently plannedscan.
The selected parameter group is displayed on one or more pages. A scroll bar indicates if moreparameters are available.
Besides the parameters with their current values, detailed information about the currentlyplanned scan is given, see chapter “Display the ’Scan Information Page’” on page 85.
Navigation and Editing
Select a parameter for editing► Click to select the parameter that has to be modified.
The parameter will be highlighted.
Once a parameter group has been selected, you can scroll to another parameter as follows:
► Use the |Arrow down| or |Arrow up| to scroll within a parameter group.
Alternatively you can search for a parameter:
1. Type in the first letter of the required parameter’s name.
The cursor jumps to the first parameter starting with this letter.

Parameter Editor Screen Layout, Menus and Windows
Philips MRI 83
Phili
ps H
ealth
care
4598
006
437
51/7
81 *
03/
2014
*7
2. Repeat typing in the first letter of the required parameter’s name.
The cursor jumps to the next parameter starting with this letter.
Example
• Required parameter: REST
– Typing in "R", the cursor jumps to "Respiratory compensation".
– Typing in "R"once more, the cursor jumps to "REST".
Modify the current imaging parameterThe current imaging parameter is the highlighted parameter (blue). There are different ways ofhow to change the value of the current imaging parameter:
1. Enter the value manually:
– Click into the value field to make it current.
– Click again to position the cursor in the value field.
– Delete with the |Del| or |Backspace| key and enter the value with the keyboard.
2. Select the value from the drop-down menu (applicable for parameters with text values):
– Click to open the drop-down menu,
– and select the value; or select the value field, type in the first letter of the wanted valueand press the |Enter| key when the right value is displayed.
3. Increase/decrease the parameter values (especially used for numerical values) with arrowkeys and 'Arrow up'/'Arrow down' buttons as shown in the table:
Effect Keyboard arrow keys
buttons
To increase parameter value by one Press -> key. Click the 'Arrow up' button.
To increase parameter value to high-est possible value.
Press and hold |Shift|, then press -> key.
Press and hold |Shift|, then click the 'Arrow up' button.
To decrease parameter value by one Press <- key. Click the 'Arrow down' button.
To decrease parameter value to low-est possible value
Press and hold |Shift|, then press <- key.
Press and hold |Shift|, then click the 'Arrow down' button.
Fig. 35: Left: selecting value from drop-down menu. Right: using 'arrow up/down' buttons to increase/decrease anumerical value.

Screen Layout, Menus and Windows Parameter Editor
84 Philips MRI
Phili
ps H
ealth
care
4598
006
437
51/7
81 *
03/
2014
*7
Restore original value
Pressing |Shift|+|Enter| restores the original (preset or last stored) parameter value.
’Undo’ Function
An ’Undo’ function is available by means of pressing ’Ctrl’ + ’Z’ or by clicking the 'Undo' icon.
The 'Undo' function doesn't work after having clicked 'Accept' (to accept the changes made).
Display helptext for imaging parameter
► Press |F1| or select 'Help Topics' from the Help menu to display the information about thecurrent imaging parameter.
NOTICENot all combinations of parameter values are possible.
This will be indicated by a conflict on the 'Conflict' page. To solve the conflict, refer tothe ’Conflicts' tab and the 'Assistance'.
Parameter benefits and trade-offs
NOTICEFor information about all MR imaging parameters, refer to the Parameter Help.
Press |F1| or select 'Help Topics' from the Help menu.
The relationships between MR imaging parameters are complex. The table shows the effects ofincreasing or enabling a parameter (set to “Yes”) on scan time, resolution, signal-to-noise ratio(SNR) and artifact level for some parameters.
↓ lower, ↑ higher, = unchanged, * more information available in following table
PARAMETER Scan time Resolution SNR Artifacts
NSA ↑ = ↑ ↓
REST ↑ = = ↓
Voxel Size ↓ ↓ ↑ ↓/↑
FOV (in combination with fixed matrixsize) *
= ↓ ↑ =
FOV (in combination with fixed voxelsize) *
↑ = ↑ =
Rectangular FOV (%) ↑ = ↑ =

Parameter Editor Screen Layout, Menus and Windows
Philips MRI 85
Phili
ps H
ealth
care
4598
006
437
51/7
81 *
03/
2014
*7
PARAMETER Scan time Resolution SNR Artifacts
Scan percentage (%) ↑ ↑ ↓ =
Slice thickness = ↓ ↑ =
Scan matrix ↑ ↑ ↓ =
Halfscan ↓ = ↓ ↑
SMART = = = ↓
Water Fat Shift = = ↑ ↑
3D Slices ↑ = ↑ =
SE Flip Angle = = ↓ =
Flowcomp FFE, TSE = = ↓ ↓
Flowcomp SE = = = ↓
Partial Echo = = ↓/↑ ↓/↑
SPIR / ProSet ↑ = = ↓
SENSE ↓ = ↓ =
The effect of the parameter FOV can differ depending on the way of working: you can eitheradjust the matrix size or the voxel size. The table illustrates the effects.
Way of working FOV Scan ma-trix
Pixel size TE TR Scan time SNR
Matrix size ↓ = ↓ ↑ 1) ↑ 2) ↑ ↓ 3)
Voxel size ↓ ↓ = = = ↓ ↓ 4)
Footnotes:
1. This is valid in case of TE = shortest.
For TE = user defined, this could lead to a conflict
2. This is valid in case of TR = shortest.
3. This is caused by smaller voxels.
4. This is caused by the reduction of scan time.
Display the ’Scan Information Page’The ’Scan Information Page’ (also referred to as Info Page) is automatically displayed in the Pa-rameter Editor window when an extended parameter group is worked on. It is not available to-gether with the 'Summary' tab. The Scan Information Page displays the most important scancharacteristics of a planned EC item, e.g. total scan duration and Rel. SNR.

Screen Layout, Menus and Windows Parameter Editor
86 Philips MRI
Phili
ps H
ealth
care
4598
006
437
51/7
81 *
03/
2014
*7
Fig. 36: Parameter Editor. Left: Geometry tab, right: Info Page .
The Info Page displays generic scan characteristics which are displayed for every current ECitem (e.g. total scan duration, Rel. SNR), but also dedicated scan characteristics such as Mini-mum TI, Number of Packages or Minimum Slice Gap which only apply for specific scan methods.The table below lists the generic scan characteristics applicable for every kind of scan.
Item displayed Description
Total scan duration Scan duration per current ExamCard item.
Rel. SNR Relative Signal-to-Noise Ratio, more info see below.
ACQ matrix M x P Acqusition matrix Measurement x Preparation direction.
ACQ voxel MPS (mm) Acquisition voxel size in Measurement, Preparation and Slice selec-tion direction in millimetres.
REC voxel MPS (mm) Reconstruction voxel size in Measurement, Preparation and Slice se-lection direction in millimetres.
Scan percentage (%) Current scan percentage considering all imaging parameters.
Actual WFS (pix) / BW (Hz) Actual Water-Fat Shift in pixels and Bandwidth in Hertz.
SAR / head Specific Absorption Rate / head in %. Depending on the anatomyscanned, the SAR could also be indicated as e.g. SAR/local torso orSAR/local extremities.
Whole body / level Whole Body SAR in W/kg, and the level indicated as normal or firstlevel controlled operating mode.
SED Specific Energy Dose in kJ/kg.
B1+rms Average RF deposition in the patient, also denoted as B1+RMS inuTesla.
Max B1+rms Maximum Average RF deposition in the patient, also denoted asMax B1+RMS in uTesla.
PNS / level Peripheral Nerve Stimulation, and the level indicated as normal orfirst level controlled operating mode..

Parameter Editor Screen Layout, Menus and Windows
Philips MRI 87
Phili
ps H
ealth
care
4598
006
437
51/7
81 *
03/
2014
*7
Item displayed Description
dB/dt The strength of the switching gradient used for imaging.
Sound Pressure level (dB) Sound pressure level. The sound pressure level is given with respectto an internal acoustic reference level which can be understood asthe standard system noise level. Accordingly, negative/positive val-ues indicate that the actual sound pressure level is below/above thisreference level.
More information on SAR, SED, B1, PNS and dB/dt can be found in IFU volume 1 and the Techni-cal Description.
Relative SNR
The Relative SNR
• shows the effects on the SNR (Signal-to-Noise Ratio) when modifying parameters.
• is displayed as factor where a value of 1.0 is identical to the SNR of the original scan proto-col.
• is not an absolute value, but relative to the SNR of the initial scan protocol.
It is important to realize that the Relative SNR is based on a relative calculation.
Example
If the original slice thickness is halved, the displayed Relative SNR will be 0.5 (relative to theoriginal procedure).
If this procedure is saved and retrieved again, the Relative SNR will still be displayed as 0.5.Modifications are always relative to the starting point which is the original scan protocol.
Parameters affecting the Relative SNR-calculation
The SNR of a scan and in such a way the Relative SNR-calculation is affected by e.g.: NSA, TR, TE,Flip angle, inversion time, voxel size, slice thickness, halfscan, FOV, (RFOV, matrix size, scan per-centage) and water-fat shift .
The `Reference Tissue' parameter is also included in the RSL-calculation, but it does not affectthe SNR of the image. It can be set to e.g. white matter, muscle, liver, bone marrow and CSF.The T1- and T2-values of the tissues are taken into account to give a more realistic interpreta-tion of the SNR changes.
E.g., in a Spin Echo sequence a relatively small change in TE will cause a more rapid loss of sig-nal in liver tissue than in white brain matter. That is why it is advised to leave this parameter setto white matter in brain imaging.
Actual phase percentage
The actual phase percentage relates to the parameter ’Phase percentage’ (motion page). Thisparameter determines the fraction of the number of requested phases that is acquired.
With ’Number of phases’ set to 30 and a phase percentage of 67%, only 20 phases are acquiredand reconstructed to 30 phases.

Screen Layout, Menus and Windows Parameter Editor
88 Philips MRI
Phili
ps H
ealth
care
4598
006
437
51/7
81 *
03/
2014
*7
With retrospective TFE, TFE shots are continuously acquired, mapped and stretched to an aver-age RR-interval and finally reconstructed to the requested number of phases.
Fig. 37: Actual phase percentage with retrospective TFE. 1: Acquisition (18 phases, 7 heart beats), 2: Stretching toaverage RR-interval, 3: Reconstruction (24 phases, 75% phase percentage).
Actual phase percentage with retrospective TFE.
The number of 20 acquired phases can only be achieved if 20 TFE shots fit exactly into one car-diac cycle. Generally this is not the case, but the actual acquired number of phases is a fractionhigher or lower.
When 20.5 phases are acquired and reconstructed to 30 phases, this leads to an actual phasepercentage of (20.5/30)*100=68.3%
• As long as the actual phase percentage is close to the requested phase percentage, the re-sulting image will be fine. The difference can increase when higher TFE-factors are used,and in that case you might need to tune the sequence (change number of phases, spatialresolution and/or SENSE factor) to avoid that the actual phase percentage is much lowerthan the requested phase percentage: this could lead to increased temporal blurring.
Coil Selection TabThe MR system automatically detects the connected coils. By default it selects the best-suitedcoil and coil elements for optimum signal-to-noise ratio for the current stack and/or scan.
About the automatic coil selection
The automatic coil and coil element selection is based on a Coil Survey scan that is automatical-ly performed during scan preparation.
The Coil Survey scan
• will be repeated whenever the patient is repositioned or after tabletop movement.
• does not appear as scan item in the ExamCard.
The Coil Selection Tab
• shows all configured coils;
• shows the connected coils;
• shows the automatic coil selection;

Parameter Editor Screen Layout, Menus and Windows
Philips MRI 89
Phili
ps H
ealth
care
4598
006
437
51/7
81 *
03/
2014
*7
NOTICESince the Q-Body coil is a built-in coil, it is always displayed as connected coil.
By default this coil will never be selected as part of the automatic coil selection. For more in-formation, refer to the workflow description ’Freely select the coil elements’.
Layout of the Coil Selection Tab► Click the 'Coils' tab.
The Coil Selection Tab opens:
Fig. 38: Layout of the Coil Selection Tab. 1 - Automatic coil selection in thumbnail view (image with coil name), 2 -toolbar of coil selection UI, 3 - Thumbnail view of all configured coil (images with names).
Toolbar of Coil Selection Tab
The toolbar of the Coil Selection Tab might be slightly different depending on the type of scanprotocol being planned.
Fig. 39: Toolbars in the Coil Selection Tab.
1 Checkbox 'SmartSelect': to enable/disable SmartSelect
For more information about SmartSelect, click chapter “SmartSelect” on page 90.
2 Button 'Navigators': to customize the coil (element) selection per navigator
► Click 'Navigators' to display the current selection.
► Modify the current selection by enabling/disabling elements in the Coil Panel.
3 Button 'Stacks': to customize the coil (element) selection per stack
► Click 'Stacks' to display the current selection.
► Modify the current selection by enabling/disabling elements in the Coil Panel.
NOTICEThe buttons 'Navigators' and 'Stacks' are only available when a protocol with multiple stacksand/or multiple navigators is planned.

Screen Layout, Menus and Windows Parameter Editor
90 Philips MRI
Phili
ps H
ealth
care
4598
006
437
51/7
81 *
03/
2014
*7
Coil Thumbnail Display
Fig. 40: Thumbnail of a detected coil.
1 Name of the coil.
2
1. Optional: Indication if this coil is proposed by the current ExamCard (when SmartSe-lect is 'On').
2. Optional: Indication if a coil is disconnected.
In case of user defined selection (when SmartSelect is 'Off'), this indicates that a re-quired coil is not connected to the scanner.
3. Optional: Indication if a coil's selection is locked for editing.
Although this coil is in the protocol or connected, its elements cannot be selected.
3 Optional: Indication of a conflict with the coil.
4 Checkbox to deselect/select a coil for scanning.
When the checkmark is off, no elements in this coil are selected; the coil is not used. Whenthe checkmark is on, one or more elements of this coil are selected; the coil is (partially)used. The state of this icon also changes as a result of explicit element selection.
5 Thumbnail image of the coil
SmartSelectSmartSelect can be enabled or disabled.
When SmartSelect is enabled (default setting)
• The MR system performs a Coil Reference scan during the scan preparation.
• Based upon the results of the Coil Reference scan, the MR system comes up with a sugges-tion which coils, coil elements or regions should be used for a specific examination.
• The selection as suggested by the MR system will be used throughout the examination anddoes not need to be changed by the operator.

Parameter Editor Screen Layout, Menus and Windows
Philips MRI 91
Phili
ps H
ealth
care
4598
006
437
51/7
81 *
03/
2014
*7
• Coil elements can be excluded from this coil selection by the operator.
For ease of use, the Graphical 3D Coil view automatically opens in this case.
NOTICEIn clinical routine MR examinations, it is advised to use SmartSelect for ease of use and opti-mal image quality.
When SmartSelect is disabled
• The operator can select any coil or any coil elements/regions.
• The MR system doesn't come up with a suggestion which coils, coil elements or regionsshould be used for a specific examination.
• A Coil Reference scan will not be performed.
Workflows
Scan with automatic coil selection
No action is required when the scans are to be performed with the automatic coil selection. Inthis case, you can use the Coil Selection UI simply to inspect the automatic selection and thenleave it again by clicking on another ExamCard tab.
Selection of the Q-Body coil
Since the Q-Body coil is a built-in coil, it is always displayed as connected coil. By default thiscoil will never be selected as part of the automatic coil selection.
When the Q-Body coil is to be used for scanning, follow the workflow procedure as describedabove. The Q-Body coil can only be selected or deselected as a total and not per element.
Conflicts page1. Click the |Conflicts| tab (from the Parameter Groups tabs) to display the occuring conflicts
resulting from the current parameter settings.
The conflicting parameters are displayed.
Fig. 41: Parameter Groups tabs.
2. Modify their settings to solve the conflict.
3. For advice how to solve the conflict best, click 'Assistance' in the Scan Assistance window,see chapter “Assistance” on page 92.

Screen Layout, Menus and Windows Scan Assistance
92 Philips MRI
Phili
ps H
ealth
care
4598
006
437
51/7
81 *
03/
2014
*7
Scan AssistanceBy clicking on the tabs, the Scan Assistance allows to switch between the display of:
• Info,
• Assistance,
• Autoview.
InfoThe Info tab gives information about the current ExamCard or the current scan protocol. Twotypes of information are available according to the template information: 'Tips' and 'Info' where'Info' describes the protocol or ExamCard and 'Tips' includes planning tips.
Fig. 42: Info about the current scan protocol.
The 'Info' for ExamCards or scan protocols in the Hospital Database can be edited according tothe changes made to the ExamCard.
Edit the Info
► Right-click on an ExamCard or a scan and select 'Edit'.
► Modify the info text.
► Deselect 'Edit' when completed.
AssistanceThe Assistance tab gives tips on how to efficiently solve conflicts.

Review toolbar Screen Layout, Menus and Windows
Philips MRI 93
Phili
ps H
ealth
care
4598
006
437
51/7
81 *
03/
2014
*7
Fig. 43: Conflict: "Current parameter set is invalid. Click Undo (if available) to reverse changes or resolve conflictmanually." Proposal for solution: "Select one of the following parameter adjustments: Undo last change. ChangeSENSE from Yes to No."
AutoViewAutoView is a tool that allows to monitor scanning and reconstruction. If enabled, the latestreconstructed image of the scan currently in progress is displayed here.
Review toolbarThe Review toolbar is only available in Review mode. It applies for all Review and Analysis pack-ages available and offers generic review functions.
To access Review mode
► Click any of the Reviewing Tab buttons to switch to a reviewing tab.
OR
► Click the Scanning Tab button to switch to the scanning tab, and then click the'Review' button.
The Review toolbar will be displayed.
The Functions on the Review toolbar
Tile All Views
• To arrange all views in a tiled layout.
Tab All Views
• To arrange all views in a tabbed layout.

Screen Layout, Menus and Windows Review toolbar
94 Philips MRI
Phili
ps H
ealth
care
4598
006
437
51/7
81 *
03/
2014
*7
Link
• To apply a link between selected imaging series.
► Select multiple imaging series in multiple viewports:
click on the first viewport, keep |Shift| or |Ctrl| pressed and click on the other viewports.
► Click 'Link'.
► Select from the drop-down menu:
• Scroll/MovieScrolling through images occurs simultaneously with linked imaging series. All imageviews of linked series show images with identical slice positions or with slice positions asclose to each other as possible. The same applies for movies of linked imaging series.
• Zoom/PanZooming/panning occurs identically for linked imaging series.
• Gray LevelGray level adjustments are automatically performed for all linked imaging series.
• AllScroll/Movie, Zoom/Pan and Gray Level will be applied in the same way for linked imag-ing series.
A Link symbol is displayed in the upper right corner of the viewport when imaging series arelinked.
Unlink All
• To remove all links between selected views.
Add to Link
• To add the current imaging series to the current link.
► Click 'Current Link' and select the link where you want to add a scan to.
► Select one or multiple imaging series.
► Click 'Add to Link'.
Remove from Link
• To remove the current imaging series from the current link.

Reviewing area Screen Layout, Menus and Windows
Philips MRI 95
Phili
ps H
ealth
care
4598
006
437
51/7
81 *
03/
2014
*7
Capture the Screen ... <Ctrl+P>
• To make a screen capture and save it into a DICOM file with a default name. This function is available in the 'System' menu and on the Review toolbar.
Set Selected Viewer as Source for Cross-Reference
• To select a viewer as source for cross-reference in order to display cross reference lines onthe other viewers. This function works in close cooperation with the function 'Enable Stack display mode selec-tion'.
► Click the viewer that is supposed to be the source for cross-reference.
► Click 'Set Selected Viewer as Source for Cross-Reference'.
► Click 'Enable Stack display mode selection' and select any of the options for the cross-refer-ence display.
Enable Stack display mode selection
• To enable the display of cross-reference lines on the viewers other than the source forcross-reference viewer. This function works in close cooperation with the function 'Set Selected Viewer as Sourcefor Cross-Reference'.
► Once a source for cross-reference is defined, click 'Enable Stack display mode selection'.
► Select any of the options for the cross-reference display from the drop-down menu:
• Box Mode
• Slice Mode
• 3D Mode.
Package Manager
• To open the Package Manger. The Package Manager is used to easily switch between examinations/views and to stop theexecution of packages. For more information, refer to chapter “Package Manager” on page 96.
Reviewing areaAll viewports are available for reviewing by means of the Review and/or Analysis packages andcan be divided in as many view ports as required.

Screen Layout, Menus and Windows Package Manager
96 Philips MRI
Phili
ps H
ealth
care
4598
006
437
51/7
81 *
03/
2014
*7
The Review toolbar and various controls of the Review and Analysis packages offer the mostimportant functions. For more information, refer to chapter “Review toolbar” on page 93 andto chapter “Review and Analysis Packages” on page 105.
Select an examination
Select an examination from the list of examinations
1. Select 'Open for Review' from the 'Patient' menu.
The list of available examinations with scans/reconstructions is displayed.
2. Select an examination from the list.
3. Click 'Proceed'.
The selected examination becomes the current examination.
Select an examination by switching between the reviewing slots
► Click on another 'Reviewing Slot' button.
Package ManagerThe Package Manager is used to easily switch between examinations/views and to stop the exe-cution of packages.
Furthermore the Package Manager assists the user in avoiding performance degration of thesystem. Performance degration may occur when too many packages are opened or too manyinstances of a package are opened.
The system status is indicated on the Reviewing toolbar as part of the 'Package Manager'icon. The icon is:
• Green; at normal system performance.
• Yellow; when system performance may degrade.
It is advised to close packages.
• Red; when the maximum number of packages is reached.
The workflow cannot be continued.
Access the Package Manager
► Click the 'Package Manager' icon on the Reviewing toolbar.

Package Manager Screen Layout, Menus and Windows
Philips MRI 97
Phili
ps H
ealth
care
4598
006
437
51/7
81 *
03/
2014
*7
Fig. 44: Package Manager window with the Package Overview.
For every currently loaded package, the following items are displayed in columns:
• Patient Name,
• Package Name,
• Series Name,
• Usage:Estimated memory usage, rated with one, two or three stars. The more stars, the higher thememory usage.
The window always stays on top and can be closed by clicking |Hide|.
Switch views
► Select the package to switch to by clicking on it.For ease of display, you can sort the packages by case, package, used data set or estimatedmemory usage by clicking in the header of the overview.
► Click 'Switch To'.
Stop packages
One or more packages can be stopped by the Package Manager:
► Select a package by clicking on the package line or select more packages simultaneously byusing the |Ctrl| or |Shift| key on your keyboard.
► Click |Stop| or |Stop All|.
The selected package or packages are stopped and removed from the overview.
Warnings
In the Package Manager window, warnings are displayed when:
• System performance may degrade (yellow indicator);
‘System performance may degrade. Avoid this by closing packages.’
• Too many instances of packages are open (red indicator);
‘Maximum number of packages already active.'
In the latter case the Package Manager is displayed automatically.

Screen Layout, Menus and Windows Physiology Properties
98 Philips MRI
Phili
ps H
ealth
care
4598
006
437
51/7
81 *
03/
2014
*7
Physiology PropertiesWhen Wireless Physiology (more information in volume 2 of the Instructions for Use) is con-nected to the system, the physiology signals will be displayed in the Patient Status Area.
Fig. 45: Physiology signals (VCG and respiratory signal) displayed in the Patient Status Area with actual heart frequen-cy.
Adjust the display of the physiology signals
The display of the physiology signals can be changed in the Physiology Properties window. Thiswindow can be accessed in two ways:
• Select 'Choose Physiology Properties...' from the Examination menu.
• Right-click the physiology display in the Patient Status Area and select 'Choose PhysiologyProperties...'.
Fig. 46: Physiology Properties window.
Number Function Description/Purpose
1 Display Gridlines Check or uncheck to enable/disable the display of grid-lines.
2 Hold Screen Check or uncheck to hold/resume the screen.

Settings window Screen Layout, Menus and Windows
Philips MRI 99
Phili
ps H
ealth
care
4598
006
437
51/7
81 *
03/
2014
*7
Number Function Description/Purpose
3 Magnet Display Check or uncheck to enable/disable the presentation ofthe physiology signals on the Magnet Display.
4 Signal Type Select the type of physiology signal, e.g. VCG, PPU orRespiratory, from the drop-down menu.Two physiology signals can be displayed at the sametime.
5 Signal Speed Select the signal speed and in such a way the time rangefrom the drop-down menu.The speed can be selected as 1, 2, 5, 10, 15 or 25 sec-onds.
6 Rescale Signals Click the button to rescale the physiology signals.
7 Battery Status/VCG Visually check the battery status (VCG and/or PPU) forwireless modules.
8 Communication Strength/VCG Visually check the communication strength (VCG and/orPPU) for wireless modules.
9 Wireless Connection/NetworkSelection
Select the network for Wireless Physiology from thedrop-down menu.
10 Hide Click the button to hide the window.
Settings window► Click 'Settings'.
A window pops up with three tabs representing parameters in three tabs: Display, Stacksand Propagate.
Fig. 47: Left: Settings window. Right: Directions for Display Settings.
Display settings
1. Click ’Display’ to open the window as shown in the figure above.

Screen Layout, Menus and Windows Settings window
100 Philips MRI
Phili
ps H
ealth
care
4598
006
437
51/7
81 *
03/
2014
*7
The three image directions indicated by arrows are associated with image dimensions, alsoreferred to as image attributes as slices, phases, types, echoes, dynamics, chemical shiftsand also stacks.
The rows and columns of the viewport area are ordered in two directions: X and Y. If availa-ble, the Z direction is associated with a third dimension.
2. Select a display mode and assign image dimensions to the image directions.
Display mode ’1D’
• Images are arranged along one dimension only. Actually all images are displayed in one row(X direction) which is wrapped to fill the entire screen. (Y and Z dimension are not used).
• With a data set containing multiple image dimensions, select another dimension for the X-direction if necessary.
• This mode can be used for all scans with one image dimension only, but is also suitable forscans with more dimensions.
• Sometimes this is referred to as ’Stack View’.
Display mode ’1D nested’
• All images of the data set are displayed along one dimension only in a nested sorting order,no matter how many dimensions are included. This requires a dialog to select the sortingpriority for each dimension.
– Click on an image dimension to make it current.
– Click |Up| or |Down| to move it within the list of dimensions.
– Click |Default| to restore the default settings.
Display mode ’2D’
• Two imaging dimensions are shown in the viewport area, one along the X-direction, onealong the Y-direction and in case of more than 2 dimensions as layers in the Z-direction.
• Sometimes this is referred to as ’Matrix View’.
Display mode ’2D wrapped’
• This mode is comparable to the 2D mode, however the X-dimension is wrapped so that allimage in that direction are visible.
• This mode is typically used for image data sets with few images in one dimension (e.g.image type). This dimension is preferably displayed in the X-direction.
1. Click |Default| to restore the default settings.
Stack settings
1. Click ’Stacks’ to specify how to display stacks and enable any of the stack display options.
• Reverse stacks: to enable reverse stack order.
• Merge stacks: by default ’stacks’ represent one imaging dimension. When ’Mergestacks’ is enabled, the multiple stacks of a multistack scan will be considered as one di-mension. This means that e.g. using the Movie fuction all images are scrolled through,and not only the current stack.

Smart Editor Screen Layout, Menus and Windows
Philips MRI 101
Phili
ps H
ealth
care
4598
006
437
51/7
81 *
03/
2014
*7
• Stack slice order: to enable reverse slice order within stacks.
2. Click |Default| to restore the default settings.
Propagate settings
1. Click ’Propagate’ to specify how view and window settings are propagated to preceding orfollowing images.
2. Click |Default| to restore the default settings.
3. Click |Close| to leave the ’Settings’ window.
Smart EditorThe Smart Editor
• is the essential tool in creating a Smart ExamCard.
• can be used to add a Smart survey to the current ExamCard.
• is to be used to assign existing SmartGeometries to scans or to create new SmartGeome-tries.
• indicates if the name of a SmartGeometry is known or unknown, unique or double.
If the new name conflicts with existing SmartGeometry names, this will be indicatedby an exclamation mark.
The SmartExam Editor can be accessed from the Examination menu via 'SmartExam' and 'ShowSmartGeometries'.
Fig. 48: Smart Editor.
1 Drop-down menu for the selection of the anatomic region
2 Enable/disable 'Add SmartSurvey to ExamCard' by checking
3 Name of the non-Smart geometry
4 Enable/disable SmartGeometryby checking
5 SmartGeometry name
6 Reserved for remarks like 'New Smart Geometry' or similar

Screen Layout, Menus and Windows SmartGeometry Database Editor
102 Philips MRI
Phili
ps H
ealth
care
4598
006
437
51/7
81 *
03/
2014
*7
For more information about SmartExam, refer to chapter “SmartExam” on page 44.
For more information about SmartExam workflows, refer to chapter “Validate a Smart Exam-Card” on page 220.
SmartGeometry Database EditorThe SmartGeometry Database Editor ... is new.
To open the SmartGeometry Database Editor
► Select 'SmartExam Tools' from the System menu.
► Select 'SmartGeometry Database Editor'.
Fig. 49: SmartGeometry Database Editor
More about SmartExam & ECThe ExamCard right mouse menu offers more possibilities concerning SmartExam.
► Right-click on the ExamCard window.
► Select ’SmartExam’.
► Select any of the options from the context menu.
Confirm vertrebrae count
• is valid for spine only,
• confirms/changes labeling of the detected vertebrae.
Improve SmartGeometries with current planning
• allows to improve SmartGeometries with the current planning even if the SmartGeometry isalready validated.
• allows to add samples of current planning even though scanning has not been performed.
Reset to SmartPlan
• resets the offcenter and angulation parameters of all geometries to the values of the Smar-tExam algorithm. Manual corrections are undone.

More about SmartExam & EC Screen Layout, Menus and Windows
Philips MRI 103
Phili
ps H
ealth
care
4598
006
437
51/7
81 *
03/
2014
*7
Importing ExamCards
When you import a Smart ExamCard with SmartGeometries which are unknown to the system,the new SmartGeometry will automatically be created. This will indicated by a message: "Thenew SmartGeometry has been created in the SmartGeometry database."

Screen Layout, Menus and Windows More about SmartExam & EC
104 Philips MRI
Phili
ps H
ealth
care
4598
006
437
51/7
81 *
03/
2014
*7

More about SmartExam & EC Review and Analysis Packages
Philips MRI 105
Phili
ps H
ealth
care
4598
006
437
51/7
81 *
03/
2014
*7
Review and Analysis PackagesThe available postprocessing packages are listed in the tables below. These packages can be ac-cessed via the 'Review' or 'Analysis' menu.
Review packages
Package Description More information
ImageView To view images (incl. movies) chapter “ImageView”on page 106
VolumeView For the calculation of Minimum / Maximum Intensity Projections,MultiPlanar Reformats and for Surface Rendering
chapter “Volume-View” on page 113
MobiView Fusing and viewing package for acquisitions in multiple stations, e.g.whole body, total spine, MRA.
chapter “MobiView”on page 121
Analysis packages
Package Description More information
PicturePlus To enhance images chapter “PicturePlus”on page 133
ImageAlgebra To perform image arithmetics e.g. subtract images chapter “Image Alge-bra” on page 136
QFlow Quantitative Flow postprocessing package chapter “QFlow pack-age” on page 127
Diffusion registration To correct for patient movement which occured during a dynamicscan
chapter “DiffusionRegistration package”on page 141
Diffusion To calculate parametric diffusion maps, e.g. ADC or FA maps chapter “Diffusionpackage” on page141
FiberTrak To visualize diffusion tensor data in the form of white matter tracts chapter “FiberTrakpackage” on page147
IViewBold Real-time and postprocessing package for BOLD imaging chapter “IView-BOLD ” on page 162
Neuro T2* Perfusion To evaluate neuro T2* dynamic scans and generate numerical andgraphical results and maps
chapter “Neuro T2*Perfusion package”on page 172
Basic T1 Perfusion To evaluate T1 dynamic scans and generate numerical and graphicalresults and maps
chapter “Basic T1Perfusion package”on page 181
10

Review and Analysis Packages ImageView
106 Philips MRI
Phili
ps H
ealth
care
4598
006
437
51/7
81 *
03/
2014
*7
Package Description More information
SpectroView Postprocessing package for MR Spectroscopy chapter “Spectro-View” on page 189
ImageViewThe ImageView package is optimized for viewing images.
Documentation
The following paragraphs give the following information:
• Screen layout
• Toolbar
• Settings window
• More Functions within ImageView
For information about workflows, refer to chapter “ImageView: Workflows” on page 279.
User Interface
Screen layoutThe ImageView package has a default layout of 2x2 viewports with the ImageView toolbar.
Fig. 50: ImageView layout with one large viewport.

ImageView Review and Analysis Packages
Philips MRI 107
Phili
ps H
ealth
care
4598
006
437
51/7
81 *
03/
2014
*7
Toolbar
Add / Remove Row and Add / Remove Column
• To add a column (to the right) or to remove a column.
OR/AND
• To add a row (below) or to remove a row.
• These function only affect the layout, not the current image data set.
• Alternatively press |Ctrl| and
– the |Arrow down| or the |Arrow up| keys to add/remove a row.
– the |Arrow right| key or the |Arrow left| key to add/remove a column.
Standard Layouts
• To select any of the standard screen layouts:1x1, 1x2, 1x3, 2x2, 2x3, 2x4, 3x3, 3x4
Play (Movie) <Pause>
• To play (or pause/stop) the current dataset as a movie.
NOTICETo view a MultiMovie, link the viewports first and then click 'Play (movie)'.
A MultiMovie shows multiple imaging series in a movie in parallel. For information about link-ing, refer to chapter “Review toolbar” on page 93.
The Movie functionality is a generic functionality occuring in Graphical PlanScan and all Reviewand Analysis packages. For more information about movies, refer to chapter “On Toolbars” onpage 55.
Text Box
• To overlay a text box to the images.
OR

Review and Analysis Packages ImageView
108 Philips MRI
Phili
ps H
ealth
care
4598
006
437
51/7
81 *
03/
2014
*7
• To overlay an arrow with text box to the images.
Select an option from the drop-down menu.The Text Box with and without arrow can also be enabled via 'Annotation' from the right-mousemenu for every image.
Measurements
To perform measurements on the imaging series and overlay them and the results to the im-ages.
• Depending on the type of graphical object chosen, different numeric results are provided.
• Every graphical object is defined by one or more anchor points. The anchor points are visi-ble upon creation and when the graphical object is 'current': simply click on a graphical ob-ject to make it current.
• Graphical objects can be modified in size or shape by dragging any of these anchor points.They can be moved to another location by dragging the object anywhere else.
• Dedicated right mouse menus offer more functionality such as the calculation and display ofhistograms and profiles.
Fig. 51: Examples of measurements (inverted display). 1 - line with the anchor points (a) and the transform possibili-ties. 2 - line with measurement (not current, no anchor points). 3 - Open Angle measurement with anchor points, 4 -Ellipse measurement with anchor points.
The available options for measurements are listed here:
-> Point
Click on an image to mark a point. The intensity value for this point will be displayed.
-> Line
Click and drag to draw a line. Release to stop drawing. The length of the line will be displayed.Press |Shift| while dragging to get an orthogonal line, either horizontal or vertical.

ImageView Review and Analysis Packages
Philips MRI 109
Phili
ps H
ealth
care
4598
006
437
51/7
81 *
03/
2014
*7
-> Open Angle
Click four times to define an open angle. The angle will be displayed.
-> Ellipse
Click twice to define one axis of the ellipse, click once more to define the other axis of the el-lipse. The area of the shape and the intensity mean value will be displayed by default.To move the shape, drag the center of the shape.To modify the shape, drag the outer edge of the shape.
-> Rectangle
Click twice to define one border of the rectangle (the width), click once more to define thelength of the rectangle. The area of the shape and the intensity mean value will be displayed by default.
-> Smoothed Polygon
Click to start up the ROI definition.Draw with the left mouse button (no dragging).Click as often as needed to add new points and to define a smoothed polygon.Control points are created / deleted by pressing |Shift| and clicking on a contour or point.Double-click to end drawing and to confirm the shape.Clicking |ESC|, the entire contour is cancelled.
-> Freehand
Click to start up the ROI definition.Draw with the left mouse button (no dragging).Click to end drawing and to confirm the ROI.The area of the shape and the intensity mean value will be displayed by default.
-> Right Mouse Menus
Right-click on any graphical object to have the following additional functionality available:
• Histogram (available for all measurements except 'Open Angle' and 'Point')
• Profile (available for the 'Line measurement')

Review and Analysis Packages ImageView
110 Philips MRI
Phili
ps H
ealth
care
4598
006
437
51/7
81 *
03/
2014
*7
Fig. 52: Inverted displays of: Left - Histogram (pixel frequency versus pixel value range, and right - Profile (pixel valueversus pixels.
• Add Text to add descriptive text to the graphical object
• Show Details
• Color to edit the color settings of the graphical object:
• Properties
to display and edit the properties of the graphical object such as ...
• Cut |Ctrl|+X
• Copy |Ctrl|+C to copy the current graphical object to the clipboard for reuse on another image
• if applicable: Paste |Ctrl|+V to paste the graphical object from the clipboard to the current image
• Copy To All to copy the current graphical object to all images in the imaging series
• Delete |Del|to delete the current graphical object
Lock Drawing Mode
• To lock the drawing mode. This means that once drawing mode is enabled, it stays enabled and more contours can bemore defined in one go for ease of use.
Hide/Show All Graphic Objects
• To enable/disable the display of all graphic objects including ROIs, annotations and lines.

ImageView Review and Analysis Packages
Philips MRI 111
Phili
ps H
ealth
care
4598
006
437
51/7
81 *
03/
2014
*7
Color LUT (Look-Up Table)
• To select the color look-up table for the maps:
When a color LUT is selected, a vertical color scale bar is shown alongside each image.
The window width and level can be adjusted with all types of color LUT.
Values:
Display
GrayScale Rainbow Blue To Red
Maximum White
Gray
Minimum Black
Settings
• To adjust settings in the 'Settings' window, in most packages: display, stacks and propaga-tion settings.
• In ImageView, these are Display parameters (e.g. order of image attributes on screen),Stacks parameters (e.g. order of stacks) and Propagate parameters (how to propagate viewand window settings).
Viewing
The Viewing drop-down menu is a generic menu occuring in Graphical PlanScan and all Reviewand Analysis packages. For more information, please refer to chapter “On Toolbars” on page 55.
More
► Click the arrow besides 'More'.⇨ The 'More' menu opens.
► Click on any menu option to select it.
Time-Intensity Diagram (TID)
To calculate and display a Time-Intensity Diagram. The calculation of a TID requires to define a Region-Of-Interest (ROI).
► Click on "Time Intensity Display".
► Select a type of ROI and draw the ROI as described below:

Review and Analysis Packages ImageView
112 Philips MRI
Phili
ps H
ealth
care
4598
006
437
51/7
81 *
03/
2014
*7
-> Smoothed Polygon
Click to start up the ROI definition.Draw with the left mouse button (no dragging).Click as often as needed to add new points and to define a smoothed polygon.Control points are created / deleted by pressing |Shift| and clicking on a contour or point.Double-click to end drawing and to confirm the shape.Clicking |ESC|, the entire contour is cancelled.
-> Freehand
Click to start up the ROI definition.Draw with the left mouse button (no dragging).Click to end drawing and to confirm the ROI.The area of the shape and the intensity mean value will be displayed by default.
For both ROI's, the shape is automatically copied to all images of the (dynamic) series and theTID displayed.
Fig. 53: TID Display with numeric ROI data on the left, the TID on the right and the buttons 'Export as' and 'Close'. Toexport the TID, click the button 'Export as', browse to the desired folder and click 'Save'.
Delete All Graphics
To delete all graphics such as ROI's or lines.
Deselect All Images
To deselect all images.
More Functions within ImageViewRight mouse menus and keyboard functions are available in order to facilitate the use of thepostprocessing package and to offer various interaction possibilities.
Keyboard functions
Keyboard functions can be used in the same way as in other postprocessing packages, e.g.scrolling through images can be done by means of the arrow keys or the mouse.
Right mouse menus
They provide many of the functions which are also available via the menu, toolbar or which areused throughout all postprocessing packages.

VolumeView Review and Analysis Packages
Philips MRI 113
Phili
ps H
ealth
care
4598
006
437
51/7
81 *
03/
2014
*7
► Right-click on any image to access the right mouse menus.
VolumeViewThe VolumeView package is to be used for the calculation of Minimum / Maximum IntensityProjections, MultiPlanar Reformats and for Surface Rendering.
Documentation
The following paragraphs give the following information:
• Suitable scans
• Screen layout
• Toolbar
• Generate Series window
• Navigation
• More Functions within VolumeView
For information about workflows, refer to the sections chapter “VolumeView: MaxIP and Min-IP” on page 280, chapter “VolumeView: MPR” on page 281, chapter “VolumeView: SurfaceRendering” on page 282.
Suitable ScansThe VolumeView package provides different render modes (algorithms) to calculate projectionsand / or reformats of the original data set.
The table below shows the algorithms available in VolumeView and the types of suitablescans.
Render Mode Suitable scans
Maximum Intensity Projection (MaxIP) • 3D PCA scan
• 3D/M2D Inflow scan
• CE-MRA scans
Minimum Intensity Projection (MinIP) • Black blood scan
• VENBOLD (PRESTO based) scans
• as slab MIP in Susceptibility weighted scan
• as slab MIP in M2D balanced-FFE
MultiPlanar Reformat MPR) • 3D scan. Best results are achieved with thin slices and prefera-bly isotropic voxels.
Surface Rendering (shaded or unshaded) • 3D scan. Best results are achieved with thin slices and prefera-bly isotropic voxels.

Review and Analysis Packages VolumeView
114 Philips MRI
Phili
ps H
ealth
care
4598
006
437
51/7
81 *
03/
2014
*7
User Interface
Screen layoutThe Volume View package has a default layout of one large and three small viewports.
Fig. 54: VolumeView screen layout.
1 VolumeView toolbar
2 3D view calculated in real-time, by default: a MaxIP
3 Orthogonal views that serve as reference views (from top to bottom: coronal, sagittal,transverse view).
Each of the views is overlaid by colored lines indicating the position of the shown slices. Theslices in the 3D view are linked to the slices in the orthogonal views.
Toolbar
Layout
• To select another screen layout.
► Click 'Layout' and select:
• 1x1: Displaying calculated image over whole volume.
• 2x2: Displaying transverse original and sagittal reference in upper row, coronalreference and whole volume in lower row

VolumeView Review and Analysis Packages
Philips MRI 115
Phili
ps H
ealth
care
4598
006
437
51/7
81 *
03/
2014
*7
• 3 right: Displaying transverse original, sagittal and coronal reference on the leftside, whole volume image on the right side
• 3 left: Displaying transverse original, sagittal and coronal reference on the rightside, whole volume image on the left side
View
• To display any non-rotated orthogonal view, click the <View> button successively.
Alternatively you can select any option from the <View> drop-down menu:
– Transverse, Coronal or Sagittal
– Rotate Left 90, Rotate Right 90
– Rotate Top 90, Rotate Bottom 90
Render Mode
• To select the render mode.
► Click 'Render Mode' and select:
• MPR (Multiple Planar Reformat)
• MinIP (Minimum Intensity Projection)
• MaxIP (Maximum Intensity Projection) which is the default setting
• Shaded Surface (Rendering)
• Unshaded Surface (Rendering)
Thickness
• To adjust the thickness of the real-time calculated object in the preview.
► Click 'Thickness' and select:
• 1, 2, 3 or 4 slices in case of MPR
• Maximum, Minimum, 50%, 20% or 10% in case of MaxIP or MinIP (where 100% refers tothe complete imaging volume)

Review and Analysis Packages VolumeView
116 Philips MRI
Phili
ps H
ealth
care
4598
006
437
51/7
81 *
03/
2014
*7
Display Clipbox
• To view the edges of the data set and to enable interaction to reduce the volume of inter-est.
► Click 'Display Clipbox'.
► Drag the sides of the Clipbox with |CTRL| being pressed to reduce the volume in all direc-tions.
Rotating the object enables viewing for the sides of the Clipbox from different angles.
Center point
• To define a center point used as reference for subseuent actions.
► Click 'Center point' to enable point selection mode.
► Click on the image to select the center of rotation.
The images and the colored lines on the images will be updated according to this centerpoint. The MIP can also rotate around this point.
Draw Contour
• To draw a contour and to go for a non-cubic volume. Select/enable:
– Cut outside: After drawing, the area outside the border will be cut away (Default).
– Cut inside: After drawing, the area inside the border will be cut away.
– Polygon: Point-to-point drawing where the points are connected in a straight line. Dou-ble-click to close the contour (Default).
– Bezier: Point-to-point drawing where the points are connected in a curved line. Double-click to close the contour.
– Free: click and draw while keeping the mouse pressed.
– AutoCut Mode: If enabled, cutting will automatically occur when drawing is complete(Default).
Undo
• To undo the last action.
This function can be used to undo multiple actions.
Redo
• To redo the last action.
This function can be used to redo multiple actions.

VolumeView Review and Analysis Packages
Philips MRI 117
Phili
ps H
ealth
care
4598
006
437
51/7
81 *
03/
2014
*7
Generate Series
• To calculate a new imaging series with the newly generated images.
A 'Generate Series' window pops up. It allows to specify which images are to be generated inwhich manner.
Viewing
The Viewing drop-down menu is a generic menu occuring in Graphical PlanScan and all Reviewand Analysis packages. For more information, please refer to chapter “On Toolbars” on page 55.
More
► Click the arrow besides 'More'.⇨ The 'More' menu opens.
► Click on any menu option to select it.
Reset All
• Click 'Reset All' to reset the orientation and to delete already drawn contours.
Reference Image Type
• To select the reference image type.
Can be set to:
• Source/Reformat
• Full Volume
Generate Series windowOut of the original dataset, you can easily generate new imaging series consisting of MaxIP,MinIP or MPR images.
You can
• set up and save protocols for the calculation of MaxIP, MinIP or MPR
• select and reuse the saved protocols for any other dataset.
• edit existing protocols
• delete protocols.
The Generate Series window shows up after clicking 'Generate Series'. It allows for the specifi-cation of the newly generated imaging series with respect to stack, propagation and geometryparameters.

Review and Analysis Packages VolumeView
118 Philips MRI
Phili
ps H
ealth
care
4598
006
437
51/7
81 *
03/
2014
*7
Fig. 55: Generate Series window in VolumeView
1 To select a protol.
'Compose' allows to compose a new protocol.
2 To delete the current protocol
3 To save the current protocol
4 To enter a series name for the new imaging series
5 To generate a new imaging series with the given name
6 To switch between the 'Generate series' parameter subsets, click on any of the tabs: Stack,Propagation, Geometry.
7 To change respectively enable or disable the Stack, Propagation or Geometry parameters.
Stack parameters in the Generate Series window
Parameter Possible settings Description
Orientation • Sagittal
• Coronal
• Transverse
To define the orientation of the newly gener-ated imaging series.
Stack Type • Radial
• Parallel
To define the stack type of the newly gener-ated imaging series, e.g. for MPR preferablyparallel or for MaxIP and MinIP preferablyradial.
Radial Axis • RL
• AP
• FH
To define the radial of the newly generatedimaging series if 'Stack Type' is set to radial.
Nr. of projections 1 ...
• Can be entered numerically.
• or via mouse interaction in the orthogo-nal views: press <SHIFT> and drag theouter yellow projection lines.
To specify the number of projections of thenewly generated imaging series.

VolumeView Review and Analysis Packages
Philips MRI 119
Phili
ps H
ealth
care
4598
006
437
51/7
81 *
03/
2014
*7
Parameter Possible settings Description
Thickness [mm] [mm]
• Can be entered numerically.
• or via mouse interaction in the orthogo-nal views
To specify the thickness of each projection.
Gap [mm] [mm]
• Can be entered numerically.
• or via mouse interaction in the orthogo-nal views: drag the outer yellow projec-tion lines.
To specify the gap between the projections.
Applicable for parallel stack only.
Radial Angle [deg] [deg]
• Can be entered numerically.
• or via mouse interaction in the orthogo-nal views: drag the outer yellow projec-tion lines.
To specify the radial angle between the pro-jections if 'Stack Type' is set to radial.
Reconstruction Accu-racy
• Best
• Fast
To specify the reconstruction accuracy:
• Best: best quality, longer calculationtime
• Fast: shortest calculation time, subopti-mal quality
Generate Slices in Re-verse Order
• Disabled
• Enabled
To generate a new imaging series with theslices in reverse order.
Propagation parameters in the Generate Series window
The Propagation parameters define how the settings are propagated. If propagation is appliede.g. for Dynamics, the settings of the current dynamic will be propagated to the Preceding orFollowing dynamics:
• Dynamics (preceding, following)
• Phases (all phases or the current phase, if not checked)
• Stations (all stations or the current station, if not checked)
• b-values (all b-values or the current b-value, if not checked)
• Diff.(usion) directions (all diffusion directions or the current diffusion direction, if notchecked)
Select 'Single Axis' for multiple stacks or multiple stations.
You can also enable/disable 'Generate Orthogonals'. If enabled, three orthogonal MaxIPs will becalculated additionally.
Geometry parameters in the Generate Series window

Review and Analysis Packages VolumeView
120 Philips MRI
Phili
ps H
ealth
care
4598
006
437
51/7
81 *
03/
2014
*7
The Geometry parameters allow entering of the offcentre and angulation values numerically,but also definition if the angulation of the new series is relative to the Volume or relative to theMagnet.
Select 'Magnet' for multiple stations. This compensates for planning differences between sta-tions and aligns the new imaging series.
NavigationThe 3D view and the orthogonal views can be used for navigation.
Scrolling
To scroll through the orthogonal views to any desired location, drag the colored lines.
You can scroll within the preview if the <Thickness> is less than Maximum. Right-click in the 3Dview and select Push/Pull. Drag to navigate through the volume.
To scroll through multiple dynamics if available, drag to the left or to the right on any of theorthogonal views. Alternatively you can press the left and right arrow key.
NOTICEFor DWI scans, drag diagonally to scroll through b-values.
Rotate in any direction
To rotate the dataset in any direction, right-drag on the 3D preview.
To display any non-rotated orthogonal view, click the <View> button successively. Alternativelyyou can select any option from the <View> drop-down menu.
More Functions within VolumeViewRight mouse menus and keyboard functions are available in order to facilitate the use of thepostprocessing package and to offer various interaction possibilities.
Keyboard functions
Keyboard functions can be used in the same way as in other postprocessing packages, e.g.scrolling through images can be done by means of the arrow keys or the mouse.
Right mouse menus
They provide many of the functions which are also available via the menu, toolbar or which areused throughout all postprocessing packages.
► Right-click on any image to access the right mouse menus.

MobiView Review and Analysis Packages
Philips MRI 121
Phili
ps H
ealth
care
4598
006
437
51/7
81 *
03/
2014
*7
Next Station and Previous Station
To display another station, right-click on any of the small viewports and select <Next station> or<Previous station>.
Hide Lines, Show Lines, Show Outline and Show Slices
Right-click on orthogonal view to toggle the display.
MobiViewMobiView can be used to fuse multistation datasets being acquired as different stacks in Head-Feet direction.
Typically, MobiFlex (or MobiTrak) and Whole Body scans are viewed in this way.
WARNINGAfter applying the fusion operation, double-check whether the result of the fusion operation iscorrect. Always keep the original images.
Horizontal lines on the image indicate where the operation took place. Check for any artifactsthat could indicate a fusion error, like cut-off objects or anatomy. The fused images must be ofthe same acquired plane. Be aware that the resolution at the edges of a station can be lowerthan in the center.
Documentation
The following paragraphs give the following information:
• About Fusing
• User Interface
– Screen layout
– Toolbar
– More Functions within MobiView
For information about workflows, refer to the section chapter “MobiView Workflow” on page283.
About FusingFusing
• creates one image from multiple images acquired at several stations.
• executes the following tasks:
– Zooming of the images.
– Panning in the image directions.

Review and Analysis Packages MobiView
122 Philips MRI
Phili
ps H
ealth
care
4598
006
437
51/7
81 *
03/
2014
*7
– Propagating these view settings to all images in such a way that the different stationsare aligned if being displayed in a column.
– Fusing the images and creating one image.
– Removing the overlapping area either smooth or with a hard-cut.
• includes that the fusing area is clearly indicated by markers on the fused images.
NOTICEUnfuse the images in case of artifacts.
This is to make sure that previously present artifacts which have not been visible on screenprior to fusing are not mistakenly interpreted as pathologies.
User Interface
Screen layoutThe MobiView package automatically comes up with a screen layout related to the number ofstacks within the selected scan, e.g.
• If the scan contains of 3 stations, the default screen layout is 3 x 3.
• If the scan contains of 5 stations, the default screen layout is 5 x 5.
• Corresponding slices (same AP, RL offcenter values) are automatically combined within oneview.
Image Info Display
The matrix information in the Image Info corresponds to the fused image.
E.g. the matrix is displayed as "252 / 3518 x 512r"
• where 252 represents the initially scanned resolution per station of 252 in FH direction
• where 3518 represents the resolution of the fused images in FH direction
• where 512r represents the resolution in LR direction (r=reconstructed).
Toolbar
Add / Remove Row and Add / Remove Column
• To add a column (to the right) or to remove a column.
OR/AND

MobiView Review and Analysis Packages
Philips MRI 123
Phili
ps H
ealth
care
4598
006
437
51/7
81 *
03/
2014
*7
• To add a row (below) or to remove a row.
• These function only affect the layout, not the current image data set.
• Alternatively press |Ctrl| and
– the |Arrow down| or the |Arrow up| keys to add/remove a row.
– the |Arrow right| key or the |Arrow left| key to add/remove a column.
Play (Movie) <Pause>
• To play (or pause/stop) the current dataset as a movie.
NOTICETo view a MultiMovie, link the viewports first and then click 'Play (movie)'.
A MultiMovie shows multiple imaging series in a movie in parallel. For information about link-ing, refer to chapter “Review toolbar” on page 93.
Movie ToolBox
• To adjust the movie settings.
► Select 'Movie ToolBox' from the Movie drop-down menu besides the icon.
Fig. 56: Movie ToolBox.
Number Purpose/ Description
1 Click this button to toggle between Play, Pause and Stop movie mode.
2 Click this button, then scroll to the image to start the movie with and click 'Play Movie'.
3 Click this button, then scroll to the image to end the movie with and click 'Play Movie'.
4 Select the type of movie from the drop-down menu:
• cyclic (loop): the images are displayed in the order 1 ... n, 1 ... n etc.
• bounce (yoyo): the images are displayed in the order 1 ... n, n ... 1, 1 ... n, etc.
5 Select type of image for the movie, e.g. slices or phases.
6 Adjust the movie speed by dragging the slider.

Review and Analysis Packages MobiView
124 Philips MRI
Phili
ps H
ealth
care
4598
006
437
51/7
81 *
03/
2014
*7
Toggle or Select the Running Attribute
• To toggle between running attributes or to select a running attribute, e.g. echoes, slices, dy-namics, image types.
Windowing Options
• To change the windowing characteristics for the multiple stations. Possible values are:
– NoneEach station is displayed with its own window settings: in each station the maximumintensity is displayed white and the minimum intensity black.
– AutomaticThe stations are windowed automatically based on the intensity values of all stationstogether: the maximum intensity of all stations is displayed white, the minimum intensi-ty of all current stations is displayed black.
– MIPThe maximum intensity values of the stations are upscaled and the lower intensity val-ues of the stations are downscaled to achieve a Maximum Intensity Projection (MIP) ef-fect in the images.
Fusing Mode
To fuse stacks from multiple stations in different ways:
Fuse Hardcut
• Hardcut Fusing Mode is to be used for scans without overlap between stacks.It is typically used in sagittal and coronal multiple station imaging series.
• First half of the overlapping area is 100% of the first image, other half is 100% of the otherimage.
Fuse Smooth
• Smooth Fusing Mode is to be used for scans with overlapping stacks.It is typically used in sagittal and coronal multiple station imaging series.
• A smooth transition between images is created by using a sinusoidal function.
Merge Series
• Merge Series is to be used for multiple station imaging series acquired in transverse orien-tation.
• When enabled, it allows to easily scroll through the complete set of transverse images ac-quired for the multiple stations.
• Merged imaging series stay merged when they are transferred to PACS.

MobiView Review and Analysis Packages
Philips MRI 125
Phili
ps H
ealth
care
4598
006
437
51/7
81 *
03/
2014
*7
Select No Fusing Mode
• 'No Fusing Mode' disables fusing.
Generate Series
• To calculate a new imaging series with the newly generated images.
A 'Generate Series' window pops up where the name of the new series can be entered.
Settings
• To adjust settings in the 'Settings' window, in most packages: display, stacks and propaga-tion settings.
Viewing
To adjust the viewing settings:
Orientation (Viewing)
To change the orientation of the images:
• Mirror, Flip,
• Rotate clockwise, Rotate counterclockwise,
• Reset orientation,
• Display Images in Radiological View
Image Information (Viewing)
• To define the amount of displayed image information:
• minimum: no text is displayed,
• standard: scan, image number and the scan name are displayed,
• maximum: also the offcenter values, the window values (width and level) and the caliperare displayed.
Interpolate (Viewing)
To interpolate the image(s).
Invert Gray Level (Viewing)
• To invert the images of the current dataset (change black and white in the grayscale).

Review and Analysis Packages MobiView
126 Philips MRI
Phili
ps H
ealth
care
4598
006
437
51/7
81 *
03/
2014
*7
Capture ...
To capture images and save them. Type of image and destination are to be defined in the 'Cap-ture' pop-up window. Check according to your preferences:
• 'Capture Selected Image' captures the current image.
• 'Capture ImageView' captures the current image including orange border and ImageViewtab.
• 'Capture Full Screen' captures the full screen.
• 'Capture Slices' captures all slices of the current imaging series.
• 'As Displayed and Annotated' or 'As Acquired' allow to capture images with or without theirwindow/zoom settings and annotations.
• 'Save to External Folder' allows to save the data to an external folder.
In this case, it is necessary to browse to this external folder.
• 'Save to Patient Database' allows to save the data to the patient database.
• In order to include the hospital name, check the eponymic option.
The function 'Capture ...' as part of Viewing is only available in Review and Analysis packages,not in Graphical PlanScan.
Save Presentation State <Ctrl+S> (Viewing)
To save a special way of presenting images.
Reload Presentation State <Ctrl+R> (Viewing)
To reload a special way of presenting images.
Reset Window (Viewing)
To reset images to original window level and width.
Reset Zoom / Pan (Viewing)
To reset images to original zoom and pan values.
More Functions within MobiViewRight mouse menus and keyboard functions are available in order to facilitate the use of thepostprocessing package and to offer various interaction possibilities.
Keyboard functions
Keyboard functions can be used in the same way as in other postprocessing packages, e.g.scrolling through images can be done by means of the arrow keys or the mouse.
Right mouse menus
They provide many of the functions which are also available via the menu, toolbar or which areused throughout all postprocessing packages.

QFlow package Review and Analysis Packages
Philips MRI 127
Phili
ps H
ealth
care
4598
006
437
51/7
81 *
03/
2014
*7
► Right-click on any image to access the right mouse menus.
Store Fused Images
The fused images are stored in an image file.
QFlow packageThe Quantitative Flow postprocessing package calculates quantitative information as flow ve-locity or flow rate.
Q-flow
WARNINGFor Q-Flow measurements the field-of-view (FOV) must be positioned in the isocenter of themagnet to avoid misinterpretations due to incorrect Q-Flow calculations.
WARNINGThe option to export the results to a file just gives the user a momentary snapshot of the re-sults as displayed on screen.
The correctness of these values is inconclusive.
Documentation
The following paragraphs give the following information:
• Suitable Scans
• User Interface
– Screen layout
– Toolbar
– Navigation matrix
– More Functions within QFlow
• Results
For information about workflows, refer to chapter “QFlow Analysis” on page 285.
Suitable ScansSuitable scans are Quantitative Flow scans which are triggered PCA scans containing at leastPCA/Phase images and FFE/Modulus and optionally PCA/Modulus images.

Review and Analysis Packages QFlow package
128 Philips MRI
Phili
ps H
ealth
care
4598
006
437
51/7
81 *
03/
2014
*7
Reliable results are achieved when the scan has been acquired perpendicular to the vessel(s) ofinterest.
User Interface
Screen layoutThe QFlow package has a default layout of four viewports.
Fig. 57: QFlow screen layout.
1 Toolbar
2 Reserved for graphical results
3 Reserved for numerical results (table)
4 large FFE/M image
5 large PCA/P image, optionally to be replaced by other image types
Toolbar
Display/Hide FFE/M, PCA/M, PCA/P
► From the drop-down menu, select any image type for display in the right lower viewport:
from left to right: FFE/M, PCA/M, PCA/PPCA/P Color overlays the PCA/P color mask to the recently chosen image type.

QFlow package Review and Analysis Packages
Philips MRI 129
Phili
ps H
ealth
care
4598
006
437
51/7
81 *
03/
2014
*7
Display/Hide PCA/P Color Images
► Click to enable/disable the overlay of the PCA/P Color image to the image in the right lowerviewport.
Draw Selected Contour
► Click 'Draw Selected Contour' to draw a ROI:
• Smoothed Polygon
• Ellipse
• Freehand
• Single Click.
Enable / Disable Active Contours
► Click 'Enable / Disable Active Contours' to enable or disable automatic contour detection.
By default, ’Active Contours’ is disabled to allow for automatic contour detection and adap-tation.
Play (Movie) <Pause>
• To play (or pause/stop) the current dataset as a movie.
NOTICETo view a MultiMovie, link the viewports first and then click 'Play (movie)'.
A MultiMovie shows multiple imaging series in a movie in parallel. For information about link-ing, refer to chapter “Review toolbar” on page 93.
The Movie functionality is a generic functionality occuring in Graphical PlanScan and all Reviewand Analysis packages. For more information about movies, refer to chapter “On Toolbars” onpage 55.
Settings
• To adjust settings in the 'Settings' window, in most packages: display, stacks and propaga-tion settings.
Viewing
The Viewing drop-down menu is a generic menu occuring in Graphical PlanScan and all Reviewand Analysis packages. For more information, please refer to chapter “On Toolbars” on page 55.

Review and Analysis Packages QFlow package
130 Philips MRI
Phili
ps H
ealth
care
4598
006
437
51/7
81 *
03/
2014
*7
More
► Click the arrow besides 'More'.⇨ The 'More' menu opens.
► Click on any menu option to select it.
Results Setup ...
► Click 'Results Setup ...’ to set up the results screen.
The 'Results Setup' window opens.
► Select the vessel to display the results for.
► Specify if the results are to be displayed inverted.
► Select the display type and the unit.
Export Results
► Click 'Export Results' to export the results and browse to an export destination.
Link Time Points
To link multiple time points, also for movie display.
More Functions within the QFlow packageRight mouse menus and keyboard functions are available in order to facilitate the use of thepostprocessing package and to offer various interaction possibilities.
Keyboard functions
Keyboard functions can be used in the same way as in other postprocessing packages, e.g.scrolling through images can be done by means of the arrow keys or the mouse.
Right mouse menus
They provide many of the functions which are also available via the menu, toolbar or which areused throughout all postprocessing packages.
► Right-click on any image to access the right mouse menus.
ResultsGraphical results and numerical results are presented in the reserved viewports.
The display of numerical results cannot be changed. The display of the graphical results howev-er can be displayed in different ways:
► Right-click on the graphical results and select the result to be presented:
• Area
• Maximum Velocity

QFlow package Review and Analysis Packages
Philips MRI 131
Phili
ps H
ealth
care
4598
006
437
51/7
81 *
03/
2014
*7
• Minimum Velocity
• Mean Velocity
• Peak Velocity
• Nr Pixels (number of pixels)
• Flux
• Standard Deviation.
A detailed description follows:
General Results
Heart Rate [bpm] • As derived from acquisition.
RR Interval [ms] • As derived from acquisition.
Flow Analysis Results for each ROI (vessel contour)
The results are available per slice, per phase and per vessel.
Positive flow is flow into the plane (maximum positive: displayed white), e.g. in Feet-to-Headdirection and in Right-to-Left direction.
Negative flow is flow out of the plane (maximum negative: displayed black), e.g. in Head-to-Feet direction and in Left-to-Right direction.
Trigger delay [ms] • Time between R-peak and acquisition of the specific slice.
Flux [ml/s] • Blood volume that passes the contour per second. This is the sameas ’mean velocity * area'. Note that this value is only calculated if theflow direction is perpendicular to the image.
Area [cm2] • Area of the pixels that are partially or fully included in the contour. Tovisualize this area, right-click in an image viewport and select 'Filledgraphics'.
Nr. of pixels • Pixels that are partially or fully included in the contour.
Mean velocity [cm/s] • Mean blood flow velocity.
Maximum velocity [cm/s] • Highest measured positive flow in the contour.
Minimum velocity [cm/s] • Highest measured negative flow in the contour.
Peak velocity [cm/s] • Either maximum velocity or minimum velocity, whichever has the high-est absolute value.
Velocity Standard Deviation [cm/s] • Standard deviation of the mean velocity.

Review and Analysis Packages QFlow package
132 Philips MRI
Phili
ps H
ealth
care
4598
006
437
51/7
81 *
03/
2014
*7
Fig. 58: The pixels that are taken into account for quantitative flow calculations.
Flow Analysis Results for a collection of ROI’s
These results are only generated for multiphase scans.
Temporal integral values of flux:
Forward flow volume [ml] • Amount of positive flow.
Backward flow volume [ml] • Amount of negative flow.
Regurgitant fraction • Fraction of backward to forward flow.
Stroke volume • Absolute value of the difference between forward and backward flow.
Absolute stroke volume • Absolute value of forward flow PLUS absolute value of backward flow.
Mean flux [ml/s] • Stroke volume x heartbeat / 60
Temporal integral values of mean velocity:
Stroke distance • Netto distance the blood proceeds in the vessel in 1 RR-interval.
Mean velocity • Stroke distance x heartbeat / 60
Note that the units for each result type can be chosen by the user. Available units are:
Result Available units Default unit
Area mm2, cm2 cm2
Velocity mm/s, cm/s, m/s cm/s
Flux mm3/s, ml/s, ml/min, 1/min ml/s
Volume mm3, ml, cc, cm3 ml
Distance cm, mm, m cm
Time ms, s depends on length of series

PicturePlus Review and Analysis Packages
Philips MRI 133
Phili
ps H
ealth
care
4598
006
437
51/7
81 *
03/
2014
*7
PicturePlusPicturePlus applies a filter that reduces the visibility of noise and artifacts, thereby enhancingthe anatomical structures in the images. It uses an intelligent algorithm of smoothing and edgeenhancement, e.g. background noise is smoothed while vessels are sharpened.
Documentation
The following paragraphs give the following information:
• Suitable Scans
• User Interface
• Workflow
For more information about workflows, refer to chapter “PicturePlus Workflow” on page 287.
Suitable ScansPicturePlus can be used for most image types (incl. modulus, real, flow) and all processed im-ages (MPR, MaxIP, MinIP, subtracted images). New imaging series containing the enhanced im-ages can be easily generated and stored.
User Interface
Screen layoutPicturePlus has a default layout of one viewport showing the center slice of the current scan.
Toolbar
Presets drop-down menu
• To display the list of available PicturePlus presets and select one of them for further proc-essing.
Edit Presets
► To open the PicturePlus presets Editor and to edit the presets.
Generate Series
• To calculate a new imaging series with the newly generated images.
A 'Generate Series' window pops up. It allows to specify which images are to be generated inwhich manner.

Review and Analysis Packages PicturePlus
134 Philips MRI
Phili
ps H
ealth
care
4598
006
437
51/7
81 *
03/
2014
*7
Settings
• To adjust settings in the 'Settings' window, in most packages: display, stacks and propaga-tion settings.
Viewing
The Viewing drop-down menu is a generic menu occuring in Graphical PlanScan and all Reviewand Analysis packages. For more information, please refer to chapter “On Toolbars” on page 55.
PicturePlus Presets EditorPreferred combinations of edge enhancement and smoothing can be saved as PicturePlus pre-sets.
Create and edit a PicturePlus presetYou can edit existing PicturePlus presets or create new presets.
► Click on the ’Presets ...’ to open the Preset Editor.
The Preset Editor opens. The available presets are displayed along with their names,smoothing and edge enhancement settings.
► Click on a preset to make it current
► To create a new preset, click on 'Add' (+).
The new preset is a copy of the current preset.
• Enter a new name for this preset.
• Click on the ’Smooth plus’/’minus’ buttons to increase or decrease smoothing.
• Click on the ’Edge plus’/’minus’ buttons to increase or decrease the edge enhancement.
• Click on 'Update' to update the changes in the list of presets.
• Click on 'Save' to save the preset.
• To close the Preset Editor, click on 'Hide'.

PicturePlus Review and Analysis Packages
Philips MRI 135
Phili
ps H
ealth
care
4598
006
437
51/7
81 *
03/
2014
*7
Fig. 59: Preset Editor.
Delete a PicturePlus preset► Open the Preset Editor.
► Selet the preset to be deleted.
► Click on the 'Delete' button to delete the current preset.
More Functions within PicturePlusRight mouse menus and keyboard functions are available in order to facilitate the use of thepostprocessing package and to offer various interaction possibilities.
Keyboard functions
Keyboard functions can be used in the same way as in other postprocessing packages, e.g.scrolling through images can be done by means of the arrow keys or the mouse.
Right mouse menus
They provide many of the functions which are also available via the menu, toolbar or which areused throughout all postprocessing packages.
► Right-click on any image to access the right mouse menus.
Interaction Mode
• can be used to define the left mouse usage for interaction with images.
The table below lists the functions which are specific for this package. For information aboutthe generic functions, see chapter “Generic functions for images” on page 55.

Review and Analysis Packages Image Algebra
136 Philips MRI
Phili
ps H
ealth
care
4598
006
437
51/7
81 *
03/
2014
*7
Possible setting Corresponding icon Description
Enhance Drag to adjust the image enhancement.
Image AlgebraThe Image Algebra package can be used to perform pixelwise image calculations, e.g. subtract-ing one dynamic scan from the consecutive dynamic scans. A preview is available which showsthe resulting image for the current scan/scans. New imaging series can be easily generated andstored.
Documentation
The following paragraphs give the following information:
• Available Calculations
• User Interface
• Workflow
For information about workflows, refer to chapter “Image Algebra Workflow” on page 288.
Available CalculationsThe package provides the possibility to perform different calculations for two e.g. (groups of)slices or dynamic scans, being referred to as A and B. It is possible to apply a weighting factor,depending on the type of calculation for A or for B.
Addition of images
• Result = A + B
Subtraction of images
• Result = B - A or
• Result = A - B
Relative subtraction of images
• Result = ( (B - A) / (A + B) / 2) * 100
• Result = ( (A - B) / (A + B) / 2) * 100
Ratio calculations
• Result = (B / A) * 100
• Result = (A / B) * 100
Cumulation
• Result = Sum of multiple echoes
Magnetic Transfer Coefficient
• Result = ( (B - A) / B) * 100
• Result = ( (A - B) / A) * 100

Image Algebra Review and Analysis Packages
Philips MRI 137
Phili
ps H
ealth
care
4598
006
437
51/7
81 *
03/
2014
*7
ASL subtraction
where ASL stands for Arterial Spin Labeling
• Result = B - A
Requirements for Image Algebra datasets
The components A and B can be images of one scan, but also images of different scans. In orderto perform calculations with A and B, they have to have the same slice distance (slice thicknessand slice gap), FOV and patient position.
User Interface
Screen layoutThe Image Algebra package has a default layout of four viewports.
Fig. 60: Image Algebra screen layout
1 Toolbar
2 Sliders for weighting factor and for slice selection
3 Component A
4 Preview, calculated in real-time
5 Component B
Toolbar
Adjust B0 Threshold
• To adjust the B0 threshold and to enable (default) or disable the display of the thresholdmask.
Setting a threshold mask will exclude background pixels from the functional map calcula-tions. All pixels with values below the mask value will be displayed blue. Only pixels withintensity above the mask value are used for the calculations, colored areas will be excludedfrom the calculation
In Image Algebra, you can adjust the threshold values for the components A and/or B, and insuch a way focus on specific anatomy.
► Click 'Threshold A' or 'Threshold B' to enable the display of the threshold mask.
► Right-drag up- and downwards to adjust the threshold.

Review and Analysis Packages Image Algebra
138 Philips MRI
Phili
ps H
ealth
care
4598
006
437
51/7
81 *
03/
2014
*7
Link Threshold for A and B
► To link the thresholds for A and B: adjusting 'Threshold A', 'Threshold B' will automaticallybe adjusted in the same way.
Select the Operation drop-down menu
► To select the required operation from the drop-down menu, e.g. addition, subtraction, rela-tive subtraction, ratio calculations, cumulation, magnetic transfer coefficient calculationand ASL subtraction.
Generate Series
• To calculate a new imaging series with the newly generated images.
A 'Generate Series' window pops up. It allows to specify which images are to be generated inwhich manner.
Settings
• To adjust settings in the 'Settings' window, in most packages: display, stacks and propaga-tion settings.
Viewing
The Viewing drop-down menu is a generic menu occuring in Graphical PlanScan and all Reviewand Analysis packages. For more information, please refer to chapter “On Toolbars” on page 55.
Sliders
Fig. 61: Image Algebra sliders viewport.
1 Display of weighting factor for A (or possibly for B), in this case: 1.00
You can apply a weighting factor, and in such a way perform calculations with defined per-centages of A or B.
2 Selection Icon: Toggle between single selection and range selection ("Switch to single selec-tion" and "Switch to range selection")

Image Algebra Review and Analysis Packages
Philips MRI 139
Phili
ps H
ealth
care
4598
006
437
51/7
81 *
03/
2014
*7
3 Sliders for slice selection (depending on setting: either single slice selection or range selec-tion)
Note that for a dynamic scan another slider for the dynamic scans is available.
4 Slider for weighting factor for A (range: from 0.0 to 2.0)
5 Display of link symbol if A and B are linked for image selection
More about the Sliders for Slice Selection
You can select either multiple images or a single image as A and/or B.
Single selection for a single image
► Click on the selection icon and ’Switch to single selection’.
A single selection box is displayed on the bar representing the slices.
► Drag the box to the position of the required slice.
Fig. 62: Sliders: Single selection (S) with the single selection box (1): in the upper example, the first image is selected.In the lower example, the single selection box is dragged to another slice.
Range selection for multiple images
► Click on the selection icon and ’Switch to range selection’
► Drag the anchor points at the outer edges of the range bar to select the range.
The selected slices will be indicated as slice number on top of the slider.
Fig. 63: Sliders: Range selection (R) with anchor points (1 and 2) at the outer edges of the range bar.
Example: Dynamic scan
With dynamic scans, a slider bar for A and B is available for the dynamic scans and another onefor the slices.

Review and Analysis Packages Image Algebra
140 Philips MRI
Phili
ps H
ealth
care
4598
006
437
51/7
81 *
03/
2014
*7
Fig. 64: The figure shows the example of a subtraction (B-A): post-contrast scan minus pre-contrast scan. The compo-nents A and B consist of 60 dynamics and 30 slices each. The selected range for A is: dynamic 1, all slices (pre-con-trast scan). The selected range for B is: dynamic 2 to 60, all slices. In this case, dynamic 1 will be subtracted from thedynamics 2 to 60 for all slices.
More Functions within ImageAlgebraRight mouse menus and keyboard functions are available in order to facilitate the use of thepostprocessing package and to offer various interaction possibilities.
Keyboard functions
Keyboard functions can be used in the same way as in other postprocessing packages, e.g.scrolling through images can be done by means of the arrow keys or the mouse.
Right mouse menus
They provide many of the functions which are also available via the menu, toolbar or which areused throughout all postprocessing packages.
► Right-click on any image to access the right mouse menus.
Interaction Mode
• can be used to define the left mouse usage for interaction with images.
Possible setting Corresponding icon Description
Scroll (default) Drag to scroll through the dataset.
Threshold Drag to adjust the B0 threshold.
Set As Mask (Defining)

Diffusion Registration package Review and Analysis Packages
Philips MRI 141
Phili
ps H
ealth
care
4598
006
437
51/7
81 *
03/
2014
*7
Diffusion Registration packageThe Diffusion Registration package is a postprocessing package. It can be used to correct forpatient movement which occured during a dynamic brain scan. In such a way, diffusion registra-tion improves image quality in calculated diffusion images.
• Images of successive dynamic series are compared.
• Images are realigned to correct for motion.
• A new series with the corrected images is generated in the patient database.
• The processing step ’Diffusion Registration’ is stored in the current ExamCard and will beperformed automatically when the ExamCard is executed again.
It is recommended to execute this package on all brain diffusion data prior to any kind of post-processing, as it improves diffusion maps (resulting from the Diffusion postprocessing package)and the fiber tracking results (generated by the FiberTrak package).
For information about workflows, refer to chapter “Diffusion Registration Workflow” on page289.
Diffusion packageThe process of diffusion of water molecules through brain tissue can be measured using MRIwith diffusion weighted scanning. The actual diffusion properties depend on the local tissue.Furthermore, the water diffusion can be anisotropic: fast diffusion in one direction and slow dif-fusion in other directions.
For ease of evaluation, the Diffusion package generates various parameteric maps related todiffusion weighted and diffusion tensor imaging. New imaging series can easily be generatedand stored.
WARNINGFor ADC measurements the field-of-view (FOV) must be positioned in the isocenter of themagnet to avoid misinterpretations due to incorrect ADC calculations.
Documentation
The following paragraphs give the following information:
• User Interface
• Parametric Maps
• Transfer of DWI iso and ADC images
For information about workflows, refer to chapter “Diffusion Workflow” on page 290.

Review and Analysis Packages Diffusion package
142 Philips MRI
Phili
ps H
ealth
care
4598
006
437
51/7
81 *
03/
2014
*7
User Interface
Screen layoutThe Diffusion postprocessing package has a default layout of two large viewports.
Fig. 65: Screen layout of Diffusion postprocessing package.
1 Toolbar
2 Center b0 slice with threshold mask (blue) overlaid
3 Corresponding map, calculated in real-time
Toolbar
Select b-values
► To select at least 2 b-values for processing.
Generate Series
• To calculate a new imaging series with the newly generated images.
A 'Generate Series' window pops up. It allows to specify which images are to be generated inwhich manner.
Possible maps are:

Diffusion package Review and Analysis Packages
Philips MRI 143
Phili
ps H
ealth
care
4598
006
437
51/7
81 *
03/
2014
*7
• DWI iso map, ADC map, eADC map, ADC iso map, eADC iso map, FA (greyscale) map and/orFA color map.
Settings
• To adjust settings in the 'Settings' window, in most packages: display, stacks and propaga-tion settings.
Viewing
The Viewing drop-down menu is a generic menu occuring in Graphical PlanScan and all Reviewand Analysis packages. For more information, please refer to chapter “On Toolbars” on page 55.
More Functions within the Diffusion packageRight mouse menus and keyboard functions are available in order to facilitate the use of thepostprocessing package and to offer various interaction possibilities.
Keyboard functions
Keyboard functions can be used in the same way as in other postprocessing packages, e.g.scrolling through images can be done by means of the arrow keys or the mouse.
Right mouse menus
They provide many of the functions which are also available via the menu, toolbar or which areused throughout all postprocessing packages.
► Right-click on any image to access the right mouse menus.
Interaction Mode
• can be used to define the left mouse usage for interaction with images.
The table below lists the functions which are specific for this package. For information aboutthe generic functions, see chapter “Generic functions for images” on page 55.
Possible setting Corresponding icon Description
B0 Threshold Drag to adjust the B0 threshold.

Review and Analysis Packages Diffusion package
144 Philips MRI
Phili
ps H
ealth
care
4598
006
437
51/7
81 *
03/
2014
*7
Adjust B0 Threshold
• To adjust the B0 threshold and to enable (default) or disable the display of the thresholdmask.
Setting a threshold mask will exclude background pixels from the functional map calcula-tions. All pixels with values below the mask value will be displayed blue. Only pixels withintensity above the mask value are used for the calculations, colored areas will be excludedfrom the calculation
Fig. 66: Left: Adjusting the B0 Threshold. Right: FA color map calculated in real-time.
Parametric MapsThe results will be provided as parametric maps. The type of the map is indicated in the map’sscan type field.
Fig. 67: Example of ADC and eADC map, FA and FA color map.
Scrolling through the maps shows which types of maps are available for the current scan (not alltypes of maps are suitable for every type of diffusion scan).
If an ADC iso and eADC iso map are available, directional ADC and eADC maps can also be gen-erated (even though they are not available in the preview).

Diffusion package Review and Analysis Packages
Philips MRI 145
Phili
ps H
ealth
care
4598
006
437
51/7
81 *
03/
2014
*7
DWI iso
The DWI iso map is calculated by first finding the average ADC from all of the available gradientdirections.
This average ADC is then used together with the b=0 image to create the DWI iso map. Sincethis uses all available directions, the SNR of the DWI iso map is improved especially with DTIscans.
• DWI iso images are identical to the isotropic images if 3 diffusion directions are scanned.
• The DWI iso images show a better image quality when the number of diffusion directionincreases. The DWI iso images will have less noise. There is an increase in signal when morethan 16 directions are acquired. Higher signal gives a sharper appearance.
• The option to create DWI iso images is not available for diffusion scans that are acquiredwith gradient overplus as the P_oblique, M_oblique and S_oblique directions are not savedin the database. The DWI iso option is also only available when 2 b values are selected, andwhen the lowest b value is less than or equal to 100.
Fig. 68: DWI isotropic images acquired in 6 directions. From left to right: Default DWI iso image without diffusionregistration being used. Postprocessed DWI iso map without diffusion registration being used. Default DWI iso imagewith diffusion registration being used. Postprocessed DWI iso map with diffusion registration being used.
Fig. 69: DWI isotropic images acquired in 32 directions. From left to right: Default DWI iso image without diffusionregistration being used. Postprocessed DWI iso map without diffusion registration being used. Default Default DWIiso image with diffusion registration being used. Postprocessed DWI iso map with diffusion registration being used.
ADC and ADC iso
The Apparent Diffusion Coefficient (ADC) identifies the average diffusion as measured by thediffusion imaging sequence.
The ADC is given in ’mm2/s’ and can be expected to have an order of magnitude of 0.6 to 1.0 x10⁻³ mm2/s for a tissue like white matter.

Review and Analysis Packages Diffusion package
146 Philips MRI
Phili
ps H
ealth
care
4598
006
437
51/7
81 *
03/
2014
*7
The ADC can be obtained for each separate diffusion direction (identified as ’ADC’) but also theaverage or isotropic ADC (ADC iso) can be obtained when enough non-colinear diffusion direc-tions were acquired.
NOTICEThe values given by the map are multiplied by a factor of 1000 for display purposes. Thus, anADC map ROI mean value of '900' is identical to an ADC of 0.9 x 10⁻³ mm2/s.
Tissue characteristics Signal DW images Signal ADC maps Signal eADC maps
High ADC (rapid diffusion) hypointense, more signalattenuation
High signal intensity Low signal intensity
Low ADC (slow diffusion) hyperintense, less signal at-tenuation
Low signal intensity High signal intensity
Tab. 3: Signal in ADC and eADC maps
ADC maps provide anisotropic information and are available for each diffusion direction: S, M,P.
eADC and eADC iso
The exponential-ADC or eADC is used to show the diffusion weighting effect of a tissue. TheeADC is calculated as exp(-b*ADC). In the eADC maps, CSF has very low signal so that subtleperiventricular (e)ADC differences are more easily noticed.
FA (Fractional Anisotropy) map
Fractional anisotropy (FA) maps can be calculated from the DTI information. The FA values indi-cate the degree of anisotropy and range from 0 to 1. In case of no anisotropy (or normal iso-tropic diffusion, e.g. in grey matter tissue) the FA equals 0. For most white matter regions theFA value is much higher (for example, in the corpus callosum the FA value is around 0.6).
At least six different diffusion directions are needed to uniquely describe the diffusion patternand to calculate the diffusion tensor matrix per pixel. From this calculation, the fractional aniso-tropy can be displayed in a FA map. High signal intensity corresponds to high fractional aniso-tropy and low signal intensity to low anisotropy.
Two different types ofFA map are available: FA greyscale map (also referred to as FA map) andFA color map.
FA (greyscale) map
Directional information is not provided.
FA Color map
The color indicates the most important diffusion direction:
• Blue for FH-direction.

FiberTrak package Review and Analysis Packages
Philips MRI 147
Phili
ps H
ealth
care
4598
006
437
51/7
81 *
03/
2014
*7
• Red for RL-direction.
• Green for AP-direction.
Transfer of DWI iso and ADC images
Diffusion data and interoperability
To enable easy transfer of the DWI iso and ADC images, it is possible to create separate DWI isoand ADC series with the Diffusion processing package.
The generated series can be recognized by a prefix in both the Thumbnail Viewer as well as inthe Administration window: iso for DWI iso images and d for ADC map, enabling the user toeasily select the iso and ADC series for transfer to a PACS or other network node.
FiberTrak packageThe FiberTrak (FT) package enables visualization of the diffusion tensor data in the form ofwhite matter tracts. In order to achieve FiberTrak results an algorithm is applied using specificsettings. These fibertract settings include signal-threshold, FA values and curvature of the fiber-tract.
WARNINGWhen fibertract settings are changed to low values (meaning no signal threshold, very low FA,and very high curvature acceptance) the white matter tracts may include erroneous results.
This may consequently lead to misdiagnoses.It is advised to use default settings whenever possible.
WARNINGWith FiberTrak the resulting fibers depend strongly on the parameter settings in the package.
Low SNR in the DTI dataset can influence the results, leading to structures without anatomicalrelevance.
Documentation
The following paragraphs describe:
• Requirements for a FT dataset
• User Interface of the FiberTrak package
For more information about workflows, refer to chapter “Fiber Tracking Workflow” on page291 and to chapter “FiberTrak: Advanced Workflows ” on page 293.

Review and Analysis Packages FiberTrak package
148 Philips MRI
Phili
ps H
ealth
care
4598
006
437
51/7
81 *
03/
2014
*7
Requirements for a FT datasetDiffusion tensor data with a minimum of 6 diffusion directions is used to calculate the preferreddiffusion direction. This diffusion direction indicates the orientation of the local fibertracts. TheFiberTrak package uses all this information to delineate the various fibertract bundles.
In order to provide good Fiber Tracking results, a certain minimum quality of data is needed.ExamCards and preset procedures may be used to generate such data.
Diffusion Tensor Imaging (DTI) scan
At least 6 diffusion directions are needed. This corresponds to the setting ’low’ of the imagingparameter ’DTI directional resolution’.
However, it is better to use the setting ’medium’ which includes 15 diffusion directions. Thisprovides a better rotationally invariant accuracy of fiber directions.
Typical scan characteristics
• Medium DTI (15 directions)
• Single-shot SE-EPI scan
• SENSE factor in the range of 1.5 to 3.0
• Isotropic data if possible
NOTICEDTI data can be processed by means of the Fiber Trak package when being acquired with re-leases from Release 10 onwards.
Anatomical reference scan
In order to visualize the obtained tracts with respect to the anatomical and pathological fea-tures, any scan may be used as an anatomical reference. However, it is advised to use scanswith a high through-plane resolution. For example, T1w 3D/TFE protocols can be used as theyshow a clear delineation of white and grey matter.
User Interface
Screen LayoutThe FiberTrak package has a default layout of one large viewport and three small viewports.

FiberTrak package Review and Analysis Packages
Philips MRI 149
Phili
ps H
ealth
care
4598
006
437
51/7
81 *
03/
2014
*7 Fig. 70: FiberTrak package layout with the 3D view on the left and the orthogonal views on the right hand side.
The large viewport contains the 3D view which is meant to display the dataset and the obtainedfibers in a 3D manner. Rotating, panning and zooming this 3D view allows viewing of white mat-ter tracts from all angles.
The orthogonal views serve as reference views (from top to bottom: coronal, sagittal, trans-verse view). Each of the views is overlaid by colored lines indicating the position of the shownslices. The slices in the 3D view are linked to the slices in the orthogonal views.
The image type being displayed in the 3D or the orthogonal viewports can be chosen freely,either FA, B0, Anatomical, ADC iso, eADC iso or DWIiso map. For more information, see chapter“Colors: Fibers and ROIs” on page 161.
Toolbar
Layout
• offers options:
– to show or hide statistics (see chapter “Statistics: Fibers, ROIs and current voxel” onpage 161)
– to show or hide orthogonal views
– to reset the layout to the default FiberTrak package layout.

Review and Analysis Packages FiberTrak package
150 Philips MRI
Phili
ps H
ealth
care
4598
006
437
51/7
81 *
03/
2014
*7
Switch To View
• defines the orientation in which the large viewport (3D view) is viewed: either transverse,sagittal or coronal.
View Slices: Show Transverse, Show Sagittal, Show Coronal
• allows the display of a transverse, sagittal or coronal slice in the 3D view or display of thecorresponding reference line in the non-rotated 3D view.
Track Single ROI Fibers
• Can be used to define a single ROI. Fibers will automatically be tracked for each single ROI.For more information, refer to chapter “Fiber Tracking Workflow” on page 291.
Define multiple ROIs
• Can be used to define multiple ROIs consecutively. To start the fiber calculation, se-lect ’Track Multiple ROI Fibers’.
Track Multiple ROI Fibers
• Can be used to track multiple fibers if multiple ROIs have been drawn. Only those fibers willbe tracked which originate from all of the ROIs. For more information, refer to chapter “Fi-ber Tracking Workflow” on page 291.
Select ROI Type
• To select a ROI type.
► Click on the down arrow besides the icon to display the possible options.
• Freehand ROI(default)
• Seeded-2D ROI
• Seeded-3D ROI
• Single-Point ROI

FiberTrak package Review and Analysis Packages
Philips MRI 151
Phili
ps H
ealth
care
4598
006
437
51/7
81 *
03/
2014
*7
2D Cross-section Tract Series
• Can be used to generate 2D cross-section tract series of the FiberTrak dataset. For moreinformation, refer to chapter “Output Series” on page 293.
3D Projection Tract Series
• Can be used to generate 3D projection tract series of the FiberTrak dataset. For more infor-mation, refer to chapter “Output Series” on page 293.
Settings
• To adjust settings in the 'Settings' window, in most packages: display, stacks and propaga-tion settings.
The Settings icon serves to define the initial colors for ROIs, fibers and the default image typefor the 3D view and the orthogonal view. See chapter “Colors: Fibers and ROIs” on page 161 formore information.
Viewing
The Viewing drop-down menu is a generic menu occuring in Graphical PlanScan and all Reviewand Analysis packages. For more information, please refer to chapter “On Toolbars” on page 55.
More
► Click the arrow besides 'More'.⇨ The 'More' menu opens.
► Click on any menu option to select it.
Algorithm Settings
• enables determination of the algorithm for fiber calculation and the definition of Seeded-2Dand -3D ROIs.
• is also available via the right mouse menu of the Fiber and ROI legend. See chapter “Algo-rithms: Fibers and Seeded ROIs” on page 159 for more information.
Save Statistics
• saves the ’statistics’ concerning ROIs, fibers and the current voxel in the directory ’E:/Export’. The file name includes patient and scan name. It is a tabulated file with the exten-sion ’.tsv’ which can be opened by packages like Microsoft Excel. For more information, seechapter “Statistics: Fibers, ROIs and current voxel” on page 161.

Review and Analysis Packages FiberTrak package
152 Philips MRI
Phili
ps H
ealth
care
4598
006
437
51/7
81 *
03/
2014
*7
Fiber LegendThe fiber legend shows the list of fibers for the current dataset. The list of fibers contains thename of the fiber set (e.g. fiber01) and the color that is assigned to it.
The checkmark indicates that the fiber is displayed.
Fiber display features
The legend can be used to modify many of the fiber display features. right-click on the name ofa fiber in the Fiber Legend to
• select all or no fibers,
• show or hide the current fiber,
• rename or delete the current fiber,
• change the color of the current fiber,
• modify the algorithm settings with respect to fibers, 2D and 3D seeded ROIs. See sectionchapter “Algorithms: Fibers and Seeded ROIs” on page 159 for more information.
Fiber Statistics
The legend can be extended to display statistical information on fibers, ROIs and the currentvoxel.
► Click on the arrows icon to open the Fiber Statistics window. Clicking on the mirrored arrowsymbol closes the statistics window again. See chapter “Statistics: Fibers, ROIs and currentvoxel” on page 161 for more information.
ROI LegendThe ROI legend shows the list of ROIs for the current dataset with ROI names (ROI01, ROI02etc.) and the color that is assigned to the ROI. The checkmark indicates that the ROI is dis-played. Note that only displayed ROIs will be taken into account in the multiple ROI FiberTrakcalculation.
ROI display features
The legend can be used to modify many of the ROI display features. right-click on the name of aROI in the ROI Legend to
• select all or no ROIs,
• show or hide the current ROI,

FiberTrak package Review and Analysis Packages
Philips MRI 153
Phili
ps H
ealth
care
4598
006
437
51/7
81 *
03/
2014
*7
• rename or delete the current ROI,
• merge multiple ROIs into a single ROI,
• change the color of the current ROI,
• change the type of ROI into either ’include’ (default) or ’exclude’. The latter means that thisROI will be used to exclude tracts in the fibertract algorithm.
See chapter “ROIs” on page 156 for more information on ROIs.
Seechapter “Algorithms: Fibers and Seeded ROIs” on page 159 for more information on algo-rithms.
NavigationIn this section, various navigation possibilities are described. The 3D view or the orthogonalviews can be used for navigation.
Zooming, panning and windowing are performed as usual.
Scroll through the dataset
► Right-click on an image.
► Select ’Scroll’.This is the default setting.
► Drag in the 3D view to scroll through the slices.
OR:
► Drag the colored lines (blue: FH-, green: AP- and red: RL-image position) on the orthogonalviews to any desired location. The image in the 3D view will be updated to the current loca-tion.
Rotate the dataset
► Right-drag on the 3D view to rotate in any direction.
By default, all of the orthogonal planes will be displayed in the 3D view. The intersection of theshown slices is accentuated by a white line. Note that the display of the orthogonal planes canbe enabled or disabled.
Fig. 71: Rotated 3D views without and with transverse plane being displayed.

Review and Analysis Packages FiberTrak package
154 Philips MRI
Phili
ps H
ealth
care
4598
006
437
51/7
81 *
03/
2014
*7
View Slices: Show Transverse, Show Sagittal, Show Coronal
• allows the display of a transverse, sagittal or coronal slice in the 3D view or display of thecorresponding reference line in the non-rotated 3D view.
Switch to an orthogonal view
• Select ’Switch To View’ from the FiberTrak toolbar: either transverse, sagittal or coronal.The image in the 3D view will be replaced by either an orthogonal (non-angulated) trans-verse, sagittal or coronal view.
Modify display for 3D view and Orthogonal views
The image display in the 3D viewport and the orthogonal viewports can be chosen. FA coloringof the selected image type can be enabled or disabled to overlay FA colors to the currentimage.
► Click on the ’Settings’ icon from the FiberTrak toolbar.
Fibers ROIs 3D slices Ortho slices
► Select ’3D Slices’ or ’Ortho Slices’.
► Select either
• FA
• B0
• Anatomical
• ADC iso
• eADC iso
• DWI iso
► Select or deselect ’FA coloring’ to switch FA coloring ON or OFF.
View cross-sections or projections
Within the orthogonal views, there are two ways to view the obtained fibertracts. Default isthat the complete tract is projected on top of the selected slice: even when the tract is actually"behind" the viewed slice. The second option is called "cross section". With this view only theintersection between the tracts and the current slice in the orthogonal view is displayed.
► Right-click on any of the orthogonal viewports.
► Select 'View Fibers' and then either ’Projection’ or ’Cross-Section’.
NOTICEWhen reformatted output is generated with the ’2D-Cross section Tract series’ tool the "crosssection" view is chosen, indepedent of the setting in the orthogonal view.

FiberTrak package Review and Analysis Packages
Philips MRI 155
Phili
ps H
ealth
care
4598
006
437
51/7
81 *
03/
2014
*7
Adjust Opacity
• The opacity parameter allows to make the slices translucent to different extents in order tofacilitate viewing of the fibers.
Right-click on the view, select 'Opacity' and then drag up and downwards to adjust theopacity.
More Functions within FiberTrakRight mouse menus and keyboard functions are available in order to facilitate the use of thepostprocessing package and to offer various interaction possibilities.
Keyboard functions
Keyboard functions can be used in the same way as in other postprocessing packages, e.g.scrolling through images can be done by means of the arrow keys or the mouse.
Right mouse menus
They provide many of the functions which are also available via the menu, toolbar or which areused throughout all postprocessing packages.
► Right-click on any image to access the right mouse menus.
Interaction Mode
• can be used to define the left mouse usage for interaction with images.
The table below lists the functions which are specific for this package. For information aboutthe generic functions, see chapter “Generic functions for images” on page 55.
Possible setting Corresponding icon Description
Track Single ROI Fibers The left mouse can be used to define a single ROI. Fibers willautomatically be tracked for each single ROI.
Define Multiple ROIs The left mouse can be used to define multiple ROIs consecu-tively. To start the fiber calculation, select ’Track Multiple ROIFibers’.
Opacity Drag to adjust the opacity.
See section ’Navigation’ for more information.
Threshold Drag to adjust the b0 threshold.
See section ’Algorithms: Fibers and Seeded ROIs’ for more in-formation.
Fiber Colors
• changes the colors of the displayed fibers.
• is also available via the Fibers and ROI Legend. See chapter “Colors: Fibers and ROIs” onpage 161 for more information.

Review and Analysis Packages FiberTrak package
156 Philips MRI
Phili
ps H
ealth
care
4598
006
437
51/7
81 *
03/
2014
*7
ROI Colors
• can be used to change ROI colors
• is also available via the Fibers and ROI Legend.
ROIsFibers can be calculated from either a single ROI or multiple ROIs.
This section describes the
• available ROI Types
• available ROI Operations.
ROI Types
Different ROI types are available for optimum results.
Freehand ROI
The freehand ROI enables the drawing of an irregular ROI within a given slice.
In case of multiple ROI fibertracking, it is advised to draw the ROI slightly larger than the givenbundle. It is important to ensure that the whole bundle is included.
Seeded-2D ROI
The seeded-2D ROI can be used to identify regions with a single mouse click. These ROI's will beperpendicular to the tract at the place of the mouse click and are thus not in-plane but opti-mized to best delineate the local tract.
The plane of a 2D-seeded ROI's is made to be perpendicular to the local preferred diffusion di-rection. As an example, in the mid-sagittal plane the cortical spinal tract will show up with ablue FA color (feet-head direction). If - with a single mouse click - a 2D seeded ROI is drawn inthis tract the final ROI will be transverse, and thus will not fall within the sagittal plane. In thismanner the optimal ROI is generated to identify the tract.
The size of the seeded-2D ROI depends on the settings of the ROI algorithm. See chapter “Algo-rithms: Fibers and Seeded ROIs” on page 159 for more information on this algorithm and onhow to change the settings.
Example for Middle Cerebellar Peduncle (MCP)
An example of using multiple seeded-2D ROIs is given below for the middle cerebellar peduncle(MCP).
► Set the interaction mode to ’Multiple ROI’ and the ROI type to ’Seeded 2D’.
► Create two seeded-2D ROIs, each by a single mouse click on the green areas with the whitearrows.
► Perform fiber tracking by clicking on the ’Track Multiple ROI Fibers’ icon.

FiberTrak package Review and Analysis Packages
Philips MRI 157
Phili
ps H
ealth
care
4598
006
437
51/7
81 *
03/
2014
*7
Fig. 72: MCP Example
A A coronal view is given at the height of the MCP. The two white arrows indicate the crossingof the MCP in this plane
B Two seeded-2D ROIs have been created in both (green) areas of the MCP.
C The final result is shown in a transverse view. Note that the ROI's do not fall within the coro-nal plane, but are perpendicular to the MCP.
Seeded-3D ROI
The seeded-3D ROI uses the seeding algorithm to create a 3D region of interest. These regionsare thus larger. This ROI type is best used in combination with single-ROI Fibertracking to identi-fy a large number of starting points.
Single Point
The single-point algorithm can be used to identify "single" tracts. In combination with the"Track Single ROI Fibers" interaction mode it can be used to identify tracts in a fast manner:
► Keep the left mouse button pressed while dragging the mouse over the data in the 3D view-port.
The tracts, originating from the current pixel, will be shown and updated in real-time.
ROI Operations
Most fiber bundles can be defined using 2 or 3 correctly placed ROI's. Within the FiberTrakpackage only the ROI's which are visible are used in the generation of fiber bundles. Specialpossibilities exist to manipulate ROI's to improve the obtained fibertracts.
Select the best suited ROI type
► Click on the ROI icon or select ’ROI settings’ from the FiberTrak menu.
► Select either of the ROI types.
Hide, rename or delete a ROI
► Right-click on a ROI or on a ROI name in the ROI legend.
► Either select ’hide’, ’rename’ or ’delete’ (or press |Delete| key). In case of renaming, a newname needs to be entered.
Change the ROI color
► Right-click on a ROI or on a ROI name in the ROI legend.

Review and Analysis Packages FiberTrak package
158 Philips MRI
Phili
ps H
ealth
care
4598
006
437
51/7
81 *
03/
2014
*7
► Select ’Change Color’. The ’Color Settings’ window will open.
► Select either ’Fixed’ or ’Directional’ where
• Fixed stands for a fixed color to be used, e.g. red only
• Directional stands for the standard color codes being used within diffusion weightedimaging: Blue for FH-direction, Red for RL-direction, Green for AP-direction.
► Select any color.
► Click ’Okay’ to apply the changes. Clicking ’Cancel’ leaves the window without any changes.
Change the ROI ’Include/Exclude’ type
In some cases the obtained fibertracts may have too many extensions. For example, they in-clude many more white matter tracts than of interest in a certain pathology. In this case it isuseful to define a ROI to exclude certain tracts.
► Right-click on a ROI or on a ROI name in the ROI legend.
► Select ’Type’.
► Select either ’Include’ or ’Exclude’.
• Include: the ROI will be used as a criterion. The resulting fiber must pass through thegiven ROI.
• Exclude: the resulting fibers must not pass through that ROI.
Example
Fig. 73: Example of an Exclude ROI. A: The left and right inferior fronto-occipital (IFO) tracts are generated using twolarge ROIs. This IFO result (in purple) does also show two spurious tracts (see arrows). B: In order to remove thesetracts, two ROIs were created and set to ’exclude’ (orange and red ROI). With the total setup of four ROIs, the IFOwill be generated as shown in orange.
Merge ROIs
It is also possible to turn separately drawn ROIs into one single ROI with the ’Merge’ function.Such a merged ROI is then considered as a single ROI by the FiberTrak package.
► Select multiple ROIs by clicking on their names in the ROI legend with |Ctrl| being pressed.
► Right-click on either of the selected ROIs.
► Select ’Merge’ and the current ROIs will turn into a single ROI.

FiberTrak package Review and Analysis Packages
Philips MRI 159
Phili
ps H
ealth
care
4598
006
437
51/7
81 *
03/
2014
*7
The colors of the individual ROIs will now be identical while the multiple entries in the leg-end will be reduced to a single entry.
Fibers
ROIs
Motor F.
MergedROI02
Fig. 74: Example: Two ROIs were defined to identify one tract that includes both, the left and the right corticospinaltract. The upper ROI (yellow) consists of two individual manually drawn ROI's which were merged so that the left andright motor tracts are defined as one.
Modify ROI colors
The ROI colors can be modified using the ROI right mouse menu.
Algorithms: Fibers and Seeded ROIsThis section describes the algorithms for fiber calculation and Seeded ROI definition togetherwith the involved parameters. The results of the white matter tracts will depend on the appliedalgorithm settings. Also the setting of the (B0) threshold has an effect.
Adjust Threshold
The B0-threshold identifies which pixels will be used in the fibertracking process. If the value ofthat pixel in the non-diffusion-weighted image (or the b=0 image) is lower than the thresholdvalue it is excluded from processing. Tracts may thus end at this position. Note that the b=0image can be viewed via the ’Settings’ button (selecting ’B0’ image).
Fibers
Starting points
There are two processes to define white matter tracts: a single ROI approach and a multi-ROIalgorithm. The main difference between the two approaches relates to the starting points fromwhich fibers are displayed.
In case of a single ROI
Only the pixels within this single ROI will be used as starting points to find fiber bundles. Tractswill be displayed immediately and the ROI will not be saved or displayed.

Review and Analysis Packages FiberTrak package
160 Philips MRI
Phili
ps H
ealth
care
4598
006
437
51/7
81 *
03/
2014
*7
With multiple ROIs
The ROIs are the criteria for newly created bundles. Only fiber tracts that pass through all de-fined and visible ROIs will be shown. Note that hidden ROIs will not be considered. In order tofind all the bundles two sets of starting points are used: all pixels within the ROIs and pixelswithin and around obtained fibers.
End / Stop fibertracts
Each fibertract will be extended until one of the following criteria is no longer met.
Minimum FA
• As soon as the FA is smaller than the threshold value the tract will no longer be continued.
Maximum Angle Change
• When the tract has a too high curvature the tract will no longer be continued.
Minimum length
• Fibers shorter than this minimum length will be discarded.
NOTICEFor existing tracts, the settings can be changed by using the Fiber Legend right mousemenu ’Fiber Algorithm’ and modify the settings for each specific tract.
Optimum Settings for FiberTrak algorithm
It is difficult to define the best settings for the fibertracking. They depend on the actual qualityof the data, the curvature of the expected tracts, and many other qualities of the underlyingdata. For testing, one could change the chosen algorithm settings for a given tract by pressingthe right-mouse-button on the fiber and change settings in the given window. Lowering the FAand enlarging the Angle options will yield more fibers. This should only be done as long as theresulting tracts are shown as a coherent fiberbundle. Erroneous fibers will be shown whenthese values are too low.
Seeded-2D and Seeded-3D ROI
The size of seeded ROIs also depends on the parameters
• Minimum FA
• Max. Angle Change [%]
NOTICEFor new tracts or new seeded ROIs, these settings can be changed via ’Algorithm Settings’from the FiberTrak menu.

FiberTrak package Review and Analysis Packages
Philips MRI 161
Phili
ps H
ealth
care
4598
006
437
51/7
81 *
03/
2014
*7
NOTICEFor new seeded ROIs, the size of the ROIs depends on the parameters Minimum FA and Maxi-mum Angle Change. These settings can be changed via the ’Settings’ icon from the FiberTraktoolbar.
Colors: Fibers and ROIsIt is possible to change the colors of new or existing ROIs and fibers.
Define initial colors
The initial values will be used for every FiberTrak session.
• Click on the ’Settings’ icon of the FiberTrak toolbar.
Change colors for current FT session
• Select ’ROI Colors’ or ’Fiber Colors’ either/or
– from the right mouse menu of the Fiber legend or the ROI legend.
– from the FiberTrak menu (item belonging to ’ROI settings’).
See section ’Change the ROI color’ for more information.
Statistics: Fibers, ROIs and current voxelStatistical information concerning fibers, ROIs and the current voxel is provided in the Fiber Sta-tistics window.
This window can be accessed in two different ways:
► Click on the arrows symbol within the fiber legend.
Clicking on the mirrored arrow symbol closes the statistics window again.
OR:
► Select ’Layout’ / ’Show Statistics’ from the FiberTrak menu.
To display Fiber and ROI Statistics
Fibers ROIs 3D slices Ortho slices
► Click on either of the tabs.
The current voxel statistics show the values of ADC, FA etc. for the voxel at the pointer’sposition.
Results
The following results per fiber, ROI (each identified by name) or voxel are shown. Note that forvarious statistics the result is given as the average plus or minus its standard deviation.
FA value

Review and Analysis Packages IViewBOLD
162 Philips MRI
Phili
ps H
ealth
care
4598
006
437
51/7
81 *
03/
2014
*7
• Average FA value for current fiber, ROI or voxel.
ADC value
• Average ADC value [10-3 mm2/s]for current fiber, ROI or voxel.
Voxels
• Number of voxels included in current ROI or fiber where the voxel size is equal to the origi-nal reconstructed DTI dataset.
Lines
• Number of lines included in current fiber.
Length [mm]
• Length of current fiber.
Coordinates [mm] (LPH)
• Coordinates of current voxel with respect to the patient frame where L stands for Left, P forPosterior and H for Head. The LPH frame has the three axis in the Left-Right, Posterior-Ante-rior and Head-Feet direction respectively.
Eigenvalues: primary, secondary, tertiary
• The Eigenvalues [10-3 mm2/s] are the apparent diffusion coefficients along the preferred dif-fusion direction (primary) and two slower diffusion directions (secondary and tertiary). Thedirection of these three principle diffusion directions (PDD) are given with respect to theLPH patient frame. The LPH frame has the three axis in the Left-Right, Posterior-Anteriorand Head-Feet direction respectively.
Save Statistics
The statistics can be saved in a file for further processing. This can be done via ’Save Statistics’which is available
• in the FiberTrak menu.
• in the right mouse menu in the Fiber legend if the Fiber Statistics window is open.
This function saves the ’statistics’ concerning ROIs, fibers and the current voxel in the directo-ry ’E:/Export’. The file name includes patient and scan name. It is a tabulated file with the ex-tension ’.tsv’ which can be opened by packages such as Microsoft Excel.
IViewBOLDThe IViewBOLD package can be used in two different ways since the package can be used in twomodes:
1. The default mode is the Real-time BOLD analysis. The data will be analyzed as soon asBOLD scanning has started.
2. The other mode is the Postprocessing mode (for existing BOLD scans). In this case, the re-al-time data from active BOLD scans will be ignored and detailed processing and analysiscan be done on existing datasets.

IViewBOLD Review and Analysis Packages
Philips MRI 163
Phili
ps H
ealth
care
4598
006
437
51/7
81 *
03/
2014
*7
WARNINGMisinterpretation of the results of the IViewBold technique is possible due to several causeson the system for which operator attention and training is required.
Overlaying the resulting parameter maps from the BOLD analysis on anatomical images, isvery helpful in finding the anatomical location of specific areas in the parameter maps. How-ever the anatomical location of these areas should be verified using the source images fromthe dynamic scan at all times. This verification is required since various factors (like patientmovement and differences in scan techniques) may disturb the geometrical correspondencebetween the overlaid parameter map and the anatomical image resulting in an under/over es-timation of the activation area.
WARNINGFor the interpretation of the displayed correlation values and its threshold, the user is referredto the literature. Interpretation is the sole responsibility of the interpretor.
Correlation of the functional images and their underlying anatomical images may be influ-enced by patient motion and therefore depends on the accuracy of fixation of the patient. Theoperator is responsible for the correspondence between the programmed paradigm and theactually applied paradigm.
WARNINGAttention is needed for operator instructions displayed on the viewing screen.
Documentation
The following paragraphs give the following information:
• User Interface
• Statistical Parametric Maps (SPMs): t-test map, Standard Deviation map, Statistical andviewing parameters
• Time-Intensity Diagram
For information about workflows, refer to chapter “BOLD imaging Workflow” on page 297, tochapter “BOLD imaging: Paradigm Handling” on page 299 and to chapter “BOLD imaging: Esyssynchronization” on page 303.

Review and Analysis Packages IViewBOLD
164 Philips MRI
Phili
ps H
ealth
care
4598
006
437
51/7
81 *
03/
2014
*7
User Interface
Screen layoutThe IViewBOLD package has a layout of up to four tile viewers, depending on the number oftasks performed.
In a tile viewer, the following items are displayed:
Fig. 75: Default screen layout of IViewBOLD for a BOLD measurement running two tasks (represented in two tileviewers): a language and a motor task. These areas highlight Broca's and the motor areas respectively.
1 Toolbar with control buttons for the parameters
2 SPM identification line with the statistic’s name, e.g. Left (t-test), Right (t-test, MC), STD -where MC stands for motion correction and STD for standard deviation
3 Images and/or SPMs in viewports
4 Dynamic task display: The Dynamic Task Display can be extended with the Time IntensityDiagram. See chapter “Calculate a TID” on page 299 for more information.
ToolbarBesides many generic toolbar functions, the IViewBOLD toolbar allows to create, edit and de-lete paradigm; and to change the viewing parameters of the Statistical Parametric Maps(SPMs). Real-time mode and Motion Correction can be enabled.

IViewBOLD Review and Analysis Packages
Philips MRI 165
Phili
ps H
ealth
care
4598
006
437
51/7
81 *
03/
2014
*7
Fig. 76: Icons from left to right: Cluster Size, t-test Threshold, Mask Threshold and Negative Statistics.
Paradigm
allows to: Select Paradigm, New Paradigm, Edit Paradigm. See chapter “BOLD imaging: Paradigm Handling” on page 299 for more information.
(Real-Time) Mode
This function enables or disables Real-Time Mode.
NOTICEWhen the IViewBOLD package is started, without a selected scan in the Thumbnail View, thepackage will start in real-time mode.
This is only possible for the acquisition context.
In real-time mode, a message is displayed indicating that the system is waiting for a new scan tostart: "Waiting for new scan to start."
Motion
• allows to enable or disable Motion Correction.
• allows to save motion corrected series as new imaging series.
Motion Correction
• registers images with respect to the first dynamic.
• performs a rigid transformation of the volume.
• is enabled by default.
The use of Motion Correction is indicated by the abbreviation MC in the heading of a SPM view.
NOTICEThis option is not available if the loaded scan has been corrected already.
Save Motion Corrected Series
This function saves motion corrected series as new imaging series.
When this option is enabled, a complete registered series will be saved to the database thenext time that the SPM’s are computed. Afterwards this option will be disabled again automati-cally.

Review and Analysis Packages IViewBOLD
166 Philips MRI
Phili
ps H
ealth
care
4598
006
437
51/7
81 *
03/
2014
*7
Add View -> ’SPM name’ (as defined in paradigm)
This function adds another tile viewer of the chosen SPM to the current layout.
Viewing
The Viewing drop-down menu is a generic menu occuring in Graphical PlanScan and all Reviewand Analysis packages. For more information, please refer to chapter “On Toolbars” on page 55.
Layout
• To select another screen layout.
Cluster (Size)
The SPMs provide a statistical view on whether the time intensity changes are corresponding tothe applied paradigm. However, statistics do not provide an absolute answer, and it is possiblethat a pixel will have a high t-test value. Such spuriously activated pixels (called "false posi-tives") can generally be found spread out over the image.
Clustering is used to identify with an even larger likelihood which areas are reacting to the ap-plied paradigm assuming that neighboring pixels with high t-test values more robustly identify amain response.
Only pixels belonging to clusters of the entered size or larger are displayed.
A cluster is defined, after application of the threshold, as a group of pixels within a slice that areconnected to each other in horizontal or vertical (not diagonal) direction. Positive and negativepixels are not considered part of one and the same cluster.
Threshold
For the ’Standard Deviation’ statistic, only pixels with a value at or above the threshold valueare displayed as part of the color overlay.
For the ’t-test’ statistic, pixels with a value at or above the threshold value are displayed as partof the color overlay. Also pixels with a value at or below minus the threshold value are dis-played if the ’Negative Statistics’ option is checked.
Thresholds are always equal to or larger than zero.
Mask
The mask function excludes pixels from being displayed. Only pixels with intensity above themask value are displayed. Masking is based on the pixel values of the first dynamic scan of thefunctional dataset.
Negative Statistics
If enabled, the negative statistics are displayed combined with the positive values in viewingthe SPMs.

IViewBOLD Review and Analysis Packages
Philips MRI 167
Phili
ps H
ealth
care
4598
006
437
51/7
81 *
03/
2014
*7
Generate Series
• To calculate a new imaging series with the newly generated images.
A 'Generate Series' window pops up where the name of the new series can be entered.
Settings
• To adjust settings in the 'Settings' window, in most packages: display, stacks and propaga-tion settings.
SPM IdentificationThis line indicates the type of SPM which is displayed in the tile viewer.
SPM type Description
(t-test, MC) t-test statistical map calculated from a dynamic scan on which retrospective mo-tion correction is applied
(t-test) t-test statistical map
(STD, MC) standard deviation map calculated from a dynamic scan on which retrospectivemotion correction is applied
(STD) standard deviation map
More Functions within IViewBOLD
Adjust Blending and Threshold
This function allows to adjust the threshold and the blending (or transparancy) with the mouse.
1. Right-click on a map.
2. Select ’Adjust Blending and Threshold’.
3. Drag up- and downwards to adjust the threshold.
4. Drag to the right or the left to adjust the blending.
Load anatomical reference images
You can load an anatomical scan as underlay by simply dragging it from the List View into thepackage.
• Only one anatomical underlay can be loaded into the package.
• You can hide the anatomical scan (per tile viewer).

Review and Analysis Packages IViewBOLD
168 Philips MRI
Phili
ps H
ealth
care
4598
006
437
51/7
81 *
03/
2014
*7
NOTICEAlso MPRs (Multiple Planar Reformats) and Fiber Tracking results (2D Cross-section resultsonly) can be used as underlay.
Fig. 77: FLAIR sequence underlaid as anatomical reference.
SmartLine Processing
When the paradigm is stored as part of an ExamCard and this ExamCard is executed again, theIViewBOLD package will automatically be launched with the correct paradigm: The paradigmchoice is stored in the current ExamCard.
Statistical Parametric Maps (SPMs)In order to assess the likelihood that certain brain areas show a signal correlation with the ap-plied paradigm, statistical tests are performed for each voxel. This results in theStatistical Para-metric Maps (SPMs).
Fig. 78: Statistical Parametric Maps.
The IViewBOLD package calculates the t-test map for each task and if required also the Stand-ard Deviation map.

IViewBOLD Review and Analysis Packages
Philips MRI 169
Phili
ps H
ealth
care
4598
006
437
51/7
81 *
03/
2014
*7
t-test mapStatistical Parametric Maps (SPM) are a statistical tool to assess the statistical significance of apriori models of brain activation. As every statistical tool, SPMs cannot provide certainty of lo-calization of brain function.
The SPMs are based on the General Linear Model (GLM). The GLM assumes that time intensitypattern of a pixel can follow certain predefined patterns. These are for example:
1. a general offset (the "average" signal of brain tissue)
2. a linear signal change in time
3. a time pattern following the applied instructions (paradigm)
The contribution of all these different sources of temporal variance, either noise or real brainfunction (correlating with the paradigm), can be separated with the GLM. The significance ofthe paradigm time pattern can be assessed with a t-test SPM at each location in the brain.
The t-test identifies the certainty with which the third component (the paradigm) is needed toexplain (part of) the time intensity changes.
With a perfect non-changing time-pattern it is unlikely that the third component is needed toexplain the observed signal pattern of that pixel. However, if the signal pattern of a pixel closelyfollows the applied paradigm it is highly likely (high t-test value) that the applied paradigm cor-relates to such signal changes.
Standard Deviation mapThe Standard Deviation indicates the range of variation of a pixel’s intensity over time.
• A small SD indicates that the pixel’s intensity over time is close to the average.
• Head motion will increase the SD, especially at the edges of the brain.
Statistical and viewing parametersFor each SPM, a number of parameters is defined.
• Smoothing (Width)
• Hemodynamic Delay
• Threshold
• Cluster (size)
• Map Color Range
• Negative Statistics
• Mask

Review and Analysis Packages IViewBOLD
170 Philips MRI
Phili
ps H
ealth
care
4598
006
437
51/7
81 *
03/
2014
*7
Smoothing (Smoothing width)
• is used to prepare images for the statistical calculation and reduce the noise level.
• increases the statistical power at the cost of spatial resolution.
• means that the value of every pixel is replaced with a weighted average of a group of pixelsaround that pixel (also referred to as kernel).
– This kernel is a square of 1x1, 3x3 up to 9x9 pixels.
– The pixels in the kernel are weighted using a Gaussian distribution.
• is the Full-Width-Half-Maximum (FWHM) of the Gaussian curve given in pixel sizes.
A large width will cause a broad smoothing effect. Note that smoothing is only applied forthe kernel. A large width thus requires a large kernel (see table below).
Smoothing Width Yields a Kernel Size of
• 0 - 0.6 • 1 pixel
• 0.7 - 1.2 • 9 pixels ( 3x3)
• 1.3 - 1.9 • 25 pixels (5x5)
• 2.0 - 2.7 • 49 pixels (7x7)
• 2.8 - 3.4 • 81 pixels (9x9)
• >= 3.5 • 81 pixels (9x9, cut off)
Hemodynamic Delay
• accounts for the physiological delay of the hemodynamic response with respect to the startof the paradigm.
• shifts the task combination by the specified number of dynamics in the calculation of theSPM.
Cluster (Size)
The SPMs provide a statistical view on whether the time intensity changes are corresponding tothe applied paradigm. However, statistics do not provide an absolute answer, and it is possiblethat a pixel will have a high t-test value. Such spuriously activated pixels (called "false posi-tives") can generally be found spread out over the image.
Clustering is used to identify with an even larger likelihood which areas are reacting to the ap-plied paradigm assuming that neighboring pixels with high t-test values more robustly identify amain response.
Only pixels belonging to clusters of the entered size or larger are displayed.
A cluster is defined, after application of the threshold, as a group of pixels within a slice that areconnected to each other in horizontal or vertical (not diagonal) direction. Positive and negativepixels are not considered part of one and the same cluster.

IViewBOLD Review and Analysis Packages
Philips MRI 171
Phili
ps H
ealth
care
4598
006
437
51/7
81 *
03/
2014
*7
Threshold
For the ’Standard Deviation’ statistic, only pixels with a value at or above the threshold valueare displayed as part of the color overlay.
For the ’t-test’ statistic, pixels with a value at or above the threshold value are displayed as partof the color overlay. Also pixels with a value at or below minus the threshold value are dis-played if the ’Negative Statistics’ option is checked.
Thresholds are always equal to or larger than zero.
Map Color Range
The displayed pixels of the SPMs are colored according to gradually changing colors.
Fig. 79: Color bar and color coding with positive or negative values. With this example, a color overlay will be dis-played when the t-test is larger than 3.0. At the value of 5.0 the color will be bright yellow indicating a large correla-tion with the applied paradigm.
1 Pixels at threshold level plus color range
2 Pixels at threshold level
3 Positive values
4 Negative values
5 Pixels at minus threshold level
6 Pixels at minus threshold level minus color range
Note that the threshold only forms one end of the color range in the paradigm. This can bechanged in the viewers where the SPMs are displayed.

Review and Analysis Packages Neuro T2* Perfusion package
172 Philips MRI
Phili
ps H
ealth
care
4598
006
437
51/7
81 *
03/
2014
*7
Negative Statistics
If enabled, the negative statistics are displayed combined with the positive values in viewingthe SPMs.
Mask
The mask function excludes pixels from being displayed. Only pixels with intensity above themask value are displayed. Masking is based on the pixel values of the first dynamic scan of thefunctional dataset.
Time-Intensity Diagram (TID)The TID can be used to review the signal response over time. If the signal response was takenfrom a region of interest with a high statistical value, the response should closely follow theapplied paradigm.
Fig. 80: TID result for a paradigm of single-thumb motion, based on 2 ROIs: an average signal response of about 3% isgiven. The signal plateau during activation is only reached after about 2 dynamics which is related to the physiologi-cal delay in the hemodynamic response of the brain.
The display of the TID can be changed via the TID right mouse menu. The following parameterscan be enabled or disabled:
Parameter Description
Autoscale Automatic scales the graphs such the graph display makes optimum use of thespace available. Either for horizontal and vertical axis.
Autoscale horizontal Or for horizontal axis only.
Autoscale vertical Or for vertical axis only.
Relative values Enables or disables display of relative values.
Note that the baseline is defined as the mean value of the 10% lowest valuesover all measured timepoints within the ROI.
Neuro T2* Perfusion packageThis postprocessing package is meant to evaluate dynamic T2* studies and generate numericaland graphical results and maps.
The NeuroPerfusion tool is able to measure Index and Negative Integral (NI) using a deconvolu-tion between the time courses of tissue signal and an Arterial-Input-Function (AIF).

Neuro T2* Perfusion package Review and Analysis Packages
Philips MRI 173
Phili
ps H
ealth
care
4598
006
437
51/7
81 *
03/
2014
*7
WARNINGThe results of deconvolution perfusion analysis may under- or overestimate the true perfusiondepending on various factors.
• Inaccurate definition of the AIF. The AIF may suffer from partial-volume effects, thus itdoes not represent a 100% blood signal. For this reason the AIF time course will not cor-rectly represent a 100% blood signal.
• Patient motion. Patient motion during the scan may introduce irregularities in the defini-tion of the AIF and individual tissue signal time courses, causing deviations from the cor-rect Index and Negative Integral.
• Temporal resolution. The temporal resolution of the measurement may be too low, caus-ing large errors on the blood flow/volume results.
• Poor bolus injection. If the contrast bolus is too slow, the Index and Negative Integralmay be incorrectly calculated.
Documentation
The following paragraphs give the following information:
• User Interface
• Results
For information about workflows, refer to chapter “Neuro T2* Perfusion Workflow” on page306.
User Interface
Screen layoutThe Neuro T2* Perfusion package has a default layout of four viewports.

Review and Analysis Packages Neuro T2* Perfusion package
174 Philips MRI
Phili
ps H
ealth
care
4598
006
437
51/7
81 *
03/
2014
*7
Fig. 81: Screen layout of T2* Analysis package.
1 Neuro T2* Perfusion toolbar
2 Numerical results
3 Original image (with threshold mask overlaid) in the middle of the imaging volume
4 Graphical results
5 In real-time calculated Parametric map
Toolbar
Adjust B0 Threshold
• To adjust the B0 threshold and to enable (default) or disable the display of the thresholdmask.
Setting a threshold mask will exclude background pixels from the functional map calcula-tions. All pixels with values below the mask value will be displayed blue. Only pixels withintensity above the mask value are used for the calculations, colored areas will be excludedfrom the calculation

Neuro T2* Perfusion package Review and Analysis Packages
Philips MRI 175
Phili
ps H
ealth
care
4598
006
437
51/7
81 *
03/
2014
*7
Apply Spatial Smoothing
• To spatially smooth the resulting maps.
Possible settings are: None (no smoothing), Weak, Medium or Strong.
Spatial smoothing smoothes the maps ONLY, not the original images. Spatial smoothingdoesn’t have any effect on the numerical results.
Apply Temporal Smoothing
• To temporally smooth the resulting maps.
Possible settings are: None (no smoothing), Weak, Medium or Strong.
Color LUT (Look-Up Table)
• To select the color look-up table for the maps:
When a color LUT is selected, a vertical color scale bar is shown alongside each image.
The window width and level can be adjusted with all types of color LUT.
Values:
Display
GrayScale Rainbow Blue To Red
Maximum White
Gray
Minimum Black
Fitting routine
► To select a fitting routine for the calculation of the maps.
The initial Neuro Perfusion maps are based on automated fitting routines. Three different rou-tines are available:
1. Gamma Variate Fitting
This is the automated fitting routine that is used by default. It is based on a curve fit algo-rithm.
2. Model free
The 'model-free' algorithm does not make any assumptions about the contrast agent boluspassage through the brain. Instead it uses numerical integration to calculate the NegativeIntegral and the MTT, then derives the other parameters from those values.
3. Arterial Input Function (AIF)

Review and Analysis Packages Neuro T2* Perfusion package
176 Philips MRI
Phili
ps H
ealth
care
4598
006
437
51/7
81 *
03/
2014
*7
Using the AIF, another algorithm (deconvolution) is used that is based on the knowledge ofthe Arterial Input Function to calculate the perfusion values. As such the AIF method is analternative to the default perfusion calculation.
With the AIF calculation the curvature of the intensity curve of an arterial vessel is used tocalculate the perfusion maps. This AIF needs to be identified by the user.
Draw ROI
• Click to start up the ROI definition.
• Draw with the left mouse button (no dragging).
• Click to end drawing and to confirm the ROI.
Generate Series
• To calculate a new imaging series with the newly generated images.
A 'Generate Series' window pops up. It allows to specify which images are to be generated inwhich manner.
Settings
• To adjust settings in the 'Settings' window, in most packages: display, stacks and propaga-tion settings.
Viewing
To adjust the viewing settings:
Orientation (Viewing)
To change the orientation of the images:
• Mirror, Flip,
• Rotate clockwise, Rotate counterclockwise,
• Reset orientation,
• Display Images in Radiological View
Image Information (Viewing)
• To define the amount of displayed image information:
• minimum: no text is displayed,
• standard: scan, image number and the scan name are displayed,
• maximum: also the offcenter values, the window values (width and level) and the caliperare displayed.

Neuro T2* Perfusion package Review and Analysis Packages
Philips MRI 177
Phili
ps H
ealth
care
4598
006
437
51/7
81 *
03/
2014
*7
Interpolate (Viewing)
To interpolate the image(s).
Invert Gray Level (Viewing)
• To invert the images of the current dataset (change black and white in the grayscale).
Capture ...
To capture images and save them. Type of image and destination are to be defined in the 'Cap-ture' pop-up window. Check according to your preferences:
• 'Capture Selected Image' captures the current image.
• 'Capture ImageView' captures the current image including orange border and ImageViewtab.
• 'Capture Full Screen' captures the full screen.
• 'Capture Slices' captures all slices of the current imaging series.
• 'As Displayed and Annotated' or 'As Acquired' allow to capture images with or without theirwindow/zoom settings and annotations.
• 'Save to External Folder' allows to save the data to an external folder.
In this case, it is necessary to browse to this external folder.
• 'Save to Patient Database' allows to save the data to the patient database.
• In order to include the hospital name, check the eponymic option.
The function 'Capture ...' as part of Viewing is only available in Review and Analysis packages,not in Graphical PlanScan.
Save Presentation State <Ctrl+S> (Viewing)
To save a special way of presenting images.
Reload Presentation State <Ctrl+R> (Viewing)
To reload a special way of presenting images.
Reset Window (Viewing)
To reset images to original window level and width.
Reset Zoom / Pan (Viewing)
To reset images to original zoom and pan values.
More Functions within the Perfusion packagesRight mouse menus and keyboard functions are available in order to facilitate the use of thepostprocessing package and to offer various interaction possibilities.

Review and Analysis Packages Neuro T2* Perfusion package
178 Philips MRI
Phili
ps H
ealth
care
4598
006
437
51/7
81 *
03/
2014
*7
Keyboard functions
Keyboard functions can be used in the same way as in other postprocessing packages, e.g.scrolling through images can be done by means of the arrow keys or the mouse.
Right mouse menus
They provide many of the functions which are also available via the menu, toolbar or which areused throughout all postprocessing packages.
► Right-click on any image to access the right mouse menus.
Interaction Mode
• can be used to define the left mouse usage for interaction with images.
The table below lists the functions which are specific for this package. For information aboutthe generic functions, see chapter “Generic functions for images” on page 55.
Possible setting Corresponding icon Description
Threshold Dragging the left mouse adjusts the threshold.
Draw freehand ROI Dragging the left mouse, a freehand ROI can be drawn.Releasing the left mouse button, the freehand ROI willbe closed and the interaction mode will be set to its de-fault setting ’Scroll’ again.
View
• To select the type of image to be displayed:
– the Source Image or
– the Subtracted Image.
Set as Subtraction Reference
• To select a dynamic other than the first one as subtraction reference.
For subtraction purposes, by default the first dynamic (precontrast) is selected as reference. Adifferent dynamic can be used as reference via this function.
NOTICEThis function is applicable only to T1 Perfusion.
Set as Mask
Enabled / disabled.

Neuro T2* Perfusion package Review and Analysis Packages
Philips MRI 179
Phili
ps H
ealth
care
4598
006
437
51/7
81 *
03/
2014
*7
Modify the Results Display
1. Right-click on the graph viewport.
2. Select one of the options (see table) to modify the display.
Function Possible values
Autoscale Enabled/Disabled: If enabled, the graph will be automatically scaled.
Intensity Enabled/Disabled: If enabled, intensity will be displayed versus time as graph(TID).
Base-log Corrected Enabled/Disabled: If enabled, the graph will be base-log corrected (practically asort of inversion).The vertical axis (intensity) uses a logarithmic scale resulting inan optimized display of the graphs.
Deconvolution Enabled/Disabled.
Follow Mouse Enabled/Disabled: If enabled, results per pixel will be generated where the re-sults originate from the current pointer position.
Current Slice Average Enabled/Disabled: If enabled, the graph displays the current slice average.
AIF Average Enabled/Disabled: If enabled, the graph displays the AIF average.
ROI Average Enabled/Disabled: If enabled, the graph displays the ROI average.
Results of the Neuro T2* Perfusion packageThe package calculates the following results:
Graphical and numerical results
• The graphical results present a Time-Intensity Diagram (intensity versus time).
In 'Follow Mouse' mode, the graph correlates to a specific pixel and shows the intensity val-ue (intensity) over the time for this pixel.
• The results will be provided as parametric maps and in a table of results.
Scrolling through the maps, the type of the map is indicated in the map’s scan type field.The used values can be found in the descriptions below in brackets.
Fig. 82: Example of Table of Results as shown on screen. The table contains one column per ROI.

Review and Analysis Packages Neuro T2* Perfusion package
180 Philips MRI
Phili
ps H
ealth
care
4598
006
437
51/7
81 *
03/
2014
*7
Fig. 83: Graphical results within Neuro T2* Perfusion package.
NOTICEYou can drag the columns to change their order in the table.
NOTICEThe table of results will not be updated with a new ROI column when a new ROI is drawn inAIF mode.
Right-click on the AIF graphs and select 'Proceed'. Then the results will be recalculated.
The figure below gives an overview of the T2* Analysis results.
Fig. 84: Time Intensity Diagram with definitions of NI, T0, TTP, MTT.
Mean Transit Time [s] (MTT)
• The mean transit time of the bolus.
T0 - Time of Arrival [s] (T0)
• Arrival of the contrast agent, i.e. begin of the enhancement curve.

Basic T1 Perfusion package Review and Analysis Packages
Philips MRI 181
Phili
ps H
ealth
care
4598
006
437
51/7
81 *
03/
2014
*7
Time to Peak [s] (TTP)
• Time till contrast agent bolus reaches peak intensity.
Negative Integral (NI)
• Calculated area under the curve.
Index (Index)
• Defined as NI divided by the MTT.
NOTICEUsing the AIF function, also the Index and the Negative Integral will be displayed with units:Index [ml/100g/min} and Negative Integral [ml/100g].
The calculation is based on known delay-insensitive deconvolution techniques and results maybe influenced by incorrect assumptions in such a model.
Delay maps with AIF algorithm
If the AIF algorithm has been chosen for processing, the ’Generate Series’ window provides thepossibility of enabling the calculation of a ’Delay’ map. For each pixel, the delay map shows thetime between the AIF peak contrast agent concentration, and the tissue peak contrast agentconcentration. The time is measured in seconds, with accuracy defined by the TR of the acquisi-tion sequence.
Basic T1 Perfusion packageThis postprocessing package is meant to evaluate dynamic T1 studies and generate numericaland graphical results and maps.
Documentation
The following paragraphs give the following information:
• User Interface
• Results
For information about workflows, refer to chapter “Basic T1 Perfusion Workflow” on page 308.
User Interface
Screen layoutThe Basic T1 Perfusion package has a default layout of four viewports.

Review and Analysis Packages Basic T1 Perfusion package
182 Philips MRI
Phili
ps H
ealth
care
4598
006
437
51/7
81 *
03/
2014
*7
Fig. 85: Screen layout of Basic T1 Perfusion package.
1 Basic T1 Perfusion toolbar
2 Numerical results
3 Original image in the middle of the imaging volume
4 Graphical results
5 In real-time calculated Parametric map
Toolbar
Adjust B0 Threshold
• To adjust the B0 threshold and to enable (default) or disable the display of the thresholdmask.
Setting a threshold mask will exclude background pixels from the functional map calcula-tions. All pixels with values below the mask value will be displayed blue. Only pixels withintensity above the mask value are used for the calculations, colored areas will be excludedfrom the calculation
Apply Spatial Smoothing
• To spatially smooth the resulting maps.
Possible settings are: None (no smoothing), Weak, Medium or Strong.
Spatial smoothing smoothes the maps ONLY, not the original images. Spatial smoothingdoesn’t have any effect on the numerical results.

Basic T1 Perfusion package Review and Analysis Packages
Philips MRI 183
Phili
ps H
ealth
care
4598
006
437
51/7
81 *
03/
2014
*7
Color LUT (Look-Up Table)
• To select the color look-up table for the maps:
When a color LUT is selected, a vertical color scale bar is shown alongside each image.
The window width and level can be adjusted with all types of color LUT.
Values:
Display
GrayScale Rainbow Blue To Red
Maximum White
Gray
Minimum Black
Draw ROI
• Click to start up the ROI definition.
• Draw with the left mouse button (no dragging).
• Click to end drawing and to confirm the ROI.
Generate Series
• To calculate a new imaging series with the newly generated images.
A 'Generate Series' window pops up. It allows to specify which images are to be generated inwhich manner.
Settings
• To adjust settings in the 'Settings' window, in most packages: display, stacks and propaga-tion settings.
Viewing
To adjust the viewing settings:
Orientation (Viewing)
To change the orientation of the images:
• Mirror, Flip,
• Rotate clockwise, Rotate counterclockwise,
• Reset orientation,
• Display Images in Radiological View

Review and Analysis Packages Basic T1 Perfusion package
184 Philips MRI
Phili
ps H
ealth
care
4598
006
437
51/7
81 *
03/
2014
*7
Image Information (Viewing)
• To define the amount of displayed image information:
• minimum: no text is displayed,
• standard: scan, image number and the scan name are displayed,
• maximum: also the offcenter values, the window values (width and level) and the caliperare displayed.
Interpolate (Viewing)
To interpolate the image(s).
Invert Gray Level (Viewing)
• To invert the images of the current dataset (change black and white in the grayscale).
Capture ...
To capture images and save them. Type of image and destination are to be defined in the 'Cap-ture' pop-up window. Check according to your preferences:
• 'Capture Selected Image' captures the current image.
• 'Capture ImageView' captures the current image including orange border and ImageViewtab.
• 'Capture Full Screen' captures the full screen.
• 'Capture Slices' captures all slices of the current imaging series.
• 'As Displayed and Annotated' or 'As Acquired' allow to capture images with or without theirwindow/zoom settings and annotations.
• 'Save to External Folder' allows to save the data to an external folder.
In this case, it is necessary to browse to this external folder.
• 'Save to Patient Database' allows to save the data to the patient database.
• In order to include the hospital name, check the eponymic option.
The function 'Capture ...' as part of Viewing is only available in Review and Analysis packages,not in Graphical PlanScan.
Save Presentation State <Ctrl+S> (Viewing)
To save a special way of presenting images.
Reload Presentation State <Ctrl+R> (Viewing)
To reload a special way of presenting images.

Basic T1 Perfusion package Review and Analysis Packages
Philips MRI 185
Phili
ps H
ealth
care
4598
006
437
51/7
81 *
03/
2014
*7
Reset Window (Viewing)
To reset images to original window level and width.
Reset Zoom / Pan (Viewing)
To reset images to original zoom and pan values.
More Functions within the Perfusion packagesRight mouse menus and keyboard functions are available in order to facilitate the use of thepostprocessing package and to offer various interaction possibilities.
Keyboard functions
Keyboard functions can be used in the same way as in other postprocessing packages, e.g.scrolling through images can be done by means of the arrow keys or the mouse.
Right mouse menus
They provide many of the functions which are also available via the menu, toolbar or which areused throughout all postprocessing packages.
► Right-click on any image to access the right mouse menus.
Interaction Mode
• can be used to define the left mouse usage for interaction with images.
The table below lists the functions which are specific for this package. For information aboutthe generic functions, see chapter “Generic functions for images” on page 55.
Possible setting Corresponding icon Description
Threshold Dragging the left mouse adjusts the threshold.
Draw freehand ROI Dragging the left mouse, a freehand ROI can be drawn.Releasing the left mouse button, the freehand ROI willbe closed and the interaction mode will be set to its de-fault setting ’Scroll’ again.
View
• To select the type of image to be displayed:
– the Source Image or
– the Subtracted Image.
Set as Subtraction Reference
• To select a dynamic other than the first one as subtraction reference.

Review and Analysis Packages Basic T1 Perfusion package
186 Philips MRI
Phili
ps H
ealth
care
4598
006
437
51/7
81 *
03/
2014
*7
For subtraction purposes, by default the first dynamic (precontrast) is selected as reference. Adifferent dynamic can be used as reference via this function.
NOTICEThis function is applicable only to T1 Perfusion.
Set as Mask
Enabled / disabled.
Modify the Results Display
1. Right-click on the graph viewport.
2. Select one of the options (see table) to modify the display.
Function Possible values
Autoscale Enabled/Disabled: If enabled, the graph will be automatically scaled.
Intensity Enabled/Disabled: If enabled, intensity will be displayed versus time as graph(TID).
Base-log Corrected Enabled/Disabled: If enabled, the graph will be base-log corrected (practically asort of inversion).The vertical axis (intensity) uses a logarithmic scale resulting inan optimized display of the graphs.
Deconvolution Enabled/Disabled.
Follow Mouse Enabled/Disabled: If enabled, results per pixel will be generated where the re-sults originate from the current pointer position.
Current Slice Average Enabled/Disabled: If enabled, the graph displays the current slice average.
AIF Average Enabled/Disabled: If enabled, the graph displays the AIF average.
ROI Average Enabled/Disabled: If enabled, the graph displays the ROI average.
Results of the Basic T1 Perfusion packageThe package calculates the following results:
Graphical and numerical results
• The graphical results present a Time-Intensity Diagram (intensity versus time).
In 'Follow Mouse' mode, the graph correlates to a specific pixel and shows the intensity val-ue (intensity) over the time for this pixel.
• The results will be provided as parametric maps and in a table of results.
Scrolling through the maps, the type of the map is indicated in the map’s scan type field.The used values can be found in the descriptions below in brackets.

Basic T1 Perfusion package Review and Analysis Packages
Philips MRI 187
Phili
ps H
ealth
care
4598
006
437
51/7
81 *
03/
2014
*7
Fig. 86: Example of Table of Results as shown on screen.
The figure below gives an overview:
t
SI
S1
S0
T0 T1
TTP
BrevEnh
WI
WO
Fig. 87: Results.
Abbreviation Description
SI Signal intensity
t Time
S0 Initial intensity
S1 Peak intensity
T0 Time of Arrival (time of initial intensity)
T1 Time of peak intensity
WO Wash-Out Rate
WI Wash-In Rate
TTP Time to Peak
BrevEnh Brevity of Enhancement
Relative Enhancement [%] (RELENH)

Review and Analysis Packages Basic T1 Perfusion package
188 Philips MRI
Phili
ps H
ealth
care
4598
006
437
51/7
81 *
03/
2014
*7
• The signal enhancement of a pixel of certain dynamic relative to that same pixel in the ref-erence dynamic. The reference dynamic is normally the first, pre-contrast dynamic. The ref-erence dynamic can be set to another dynamic via the right mouse menu function ’Set asSubtraction Reference’.
Relative Enhancement = [ - 1 ] x 100 I(D)
I(Dref)
Fig. 88: Formula
• where I(D) stands for pixel intensity of current dynamic and I(Dref) stands for pixel intensityof reference dynamic.
Maximum Enhancement (MAXENH)
• Difference between peak intensity S1 and S0.
Maximum Relative Enhancement [%] (MAXRELENH)
• Maximum of all relative enhancements over all dynamics.
T0 - Time of Arrival [s] (T0)
• Arrival of the contrast agent, i.e. begin of the enhancement curve.
Time to Peak (TTP)
• Time between T0 and the time of peak intensity (T1).
Wash-In Rate [l/s] (WASHIN}
• Maximum slope between T0 and time of peak intensity T1.
Wash-In = Maximum [ ] I(D) - I(D-1)
T
Fig. 89: Formula
Wash-Out Rate [l/s] (WASHOUT)
• Maximum slope between time of peak intensity T1 and the end of the measurement.
Wash-Out = ABS (Maximum [ ] ) I(D) - I(D-1)
T
Fig. 90: Formula
Brevity of Enhancement [s] (BREVENH)
• Time between point of maximum wash in rate and maximum wash out rate.
Area under the curve (AREACURV)
• Sum of all intensities under the curve.

SpectroView Review and Analysis Packages
Philips MRI 189
Phili
ps H
ealth
care
4598
006
437
51/7
81 *
03/
2014
*7
SpectroViewThe SpectroView package is used to present spectroscopy data after processing. Single Voxel(SV) and Chemical Shift Imaging (CSI) datasets can be analyzed. SpectroView handles both timeand frequency domain data presented in the following form possibilities.
• Graphs
– Processed spectra
– Fitted spectra
• Tables providing information on
– Peak position including label
– Amplitude
– Ratios
• Metabolite images (in color overlay)
• Ratio images (in color overlay)
• Spectral grids on reference images
– Display of user-selected subset from an array of spectra
Using the basic script tool, additional apodization and processing steps for time domain datacan be performed.
Documentation
The following paragraphs give the following information:
• User Interface
For information about workflows, refer to the sections chapter “SpectroView Workflow” onpage 309, chapter “SpectroView: Advanced Workflows” on page 317 and to chapter “Spectro-View: Process Unsuppressed Water Data” on page 338.

Review and Analysis Packages SpectroView
190 Philips MRI
Phili
ps H
ealth
care
4598
006
437
51/7
81 *
03/
2014
*7
User Interface
Screen Layout
Fig. 91: SpectroView layout: Left for Single Voxel (SV), right for Chemical Shift Imaging (CSI).
For wide screen consoles, the SpectroView package has a default layout of three small view-ports for anatomical images and maps, one large viewport for the graph of the spectrum (spec-tra) and two tables.
The results table is shown below the graph.
In the viewport on the right hand side of the screen, the tabs allow to toggle between acquisi-tion parameters, script parameters and status information.
The Status tab appears when an error has been detected after the last script has been run. Itwill be colored red and be brought to the front. It contains information about failing voxelswhere only the first 5 failing voxels are identified, followed by a " multiple errors occurred"message if more voxels failed.
The planscan images in the ’Image Display Area’ are overlaid by the position and orientation ofthe single voxel or spectral grid.
SpectroView Toolbar
SpectroView Toolbar
For easy and quick access, the most important functions can be performed via the SpectroViewtoolbar. Depending on the dataset (SV or CSI) being analyzed the toolbar is slightly different.The table lists the icons used and gives an explanation:
Correspondingicon
Menu item text Description
Select Script • Allows to select a script.
• chapter “Select a script” on page 310

SpectroView Review and Analysis Packages
Philips MRI 191
Phili
ps H
ealth
care
4598
006
437
51/7
81 *
03/
2014
*7
Correspondingicon
Menu item text Description
Run Script
• Allows to run a script.
• chapter “Run the Script” on page 312
Edit Script
• Allows to edit a script.
• chapter “Scripts and script handling” on page 318
Save Script
• Allows to save an edited script.
• chapter “Scripts and script handling” on page 318
Delete Script
• Allows to delete a script.
• chapter “Scripts and script handling” on page 318
Select Relevant Voxels
• Allows to select the voxels for result display.
• chapter “Select Relevant Voxels” on page 312
Modify Layout
• Allows to modify the layout.
• chapter “Modify Layout” on page 315
Graph Display Mode
• Allows to modify the display of the graph.
• chapter “Optimize spectrum display” on page 314
None
Select Slice
• Toggle between slices in multislice 2D- or 3D-SI datasets. Proc-essing is performed on a slice by slice baseis.
Store Processing Parame-ters
• Stores the processed FD (frequency domain) spectrum and thecorresponding script parameters and, in case of CSI, selectedvoxels to the database. A new series name can be specified.
Process Unsuppressed Wa-ter Data
• Allows to switch between the suppressed and unsuppressed da-ta sets, if a series contains unsuppressed water data.
Expert Mode
• To make some advanced features appear, you need to activate“Expert Mode”.
Peak Editor
• Opens the peak editor. chapter “Customization using the PeakEditor” on page 336

Review and Analysis Packages SpectroView
192 Philips MRI
Phili
ps H
ealth
care
4598
006
437
51/7
81 *
03/
2014
*7
Correspondingicon
Menu item text Description
Delete Series Preferences
• Can be used to erase all Series Preferences for this series. chap-ter “Series Preferences Database” on page 337 for more infor-mation.
More
As part of the toolbar a More drop-down menu is available. It offers the following options:
• Delete Script
• Peak Editor
• Delete Series Preferences
• Enable CSV Output
More Functions within SpectroViewRight mouse menus and keyboard functions are available in order to facilitate the use of thepostprocessing package and to offer various interaction possibilities.
Keyboard functions
Keyboard functions can be used in the same way as in other postprocessing packages, e.g.scrolling through images can be done by means of the arrow keys or the mouse.
Right mouse menus
They provide many of the functions which are also available via the menu, toolbar or which areused throughout all postprocessing packages.
► Right-click on any image to access the right mouse menus.
Right-mouse menus in SpectroView are described in this section. They are available for:
• Anatomical image (overlaid grid)
• Map
• Spectrum
– Spectrum for CSI dataset
– Spectrum for SVS dataset
– Spectrum Display Options
Available options Description
Show Grid To show/hide the grid overlay per viewport.
Use for Underlay Image To select a different anatomical underlay image.
Running Attribute To select the running attribute if more attributes are present in the anatomi-cal series.

SpectroView Review and Analysis Packages
Philips MRI 193
Phili
ps H
ealth
care
4598
006
437
51/7
81 *
03/
2014
*7
Available options Description
Select All Processed Voxels To select all voxels that were processed with the last used script.
Settings These options can be used in the same way as throughout the complete userinterface.
Reset Window
Reset Zoom/Pan
Interpolate
Export Picture
Export Picture As
Tab. 4: Anatomical image (overlaid grid)
Available options Default Description
Adjust blending and threshold
OFF If selected, dragging the left-mouse up and down changes the threshold of thecolor overlay. Dragging the left-mouse left to right changes the opacity of thecolor overlay
Show Grid To show/hide the grid overlay per viewport.
Interpolate Maps Allows to display map images calculated by SpectroView in non-interpolatedmode (color reflects metabolite value or ratios for the corresponding voxel) orinterpolated mode (colors/values are "smoothed" across voxel boundaries).
Display Map Enables the display of maps.
Settings
These options can be used in the same way as throughout the Advanced View-ing Environment.
Reset Window
Reset Zoom/Pan
Interpolate
Export Picture
Export Picture As
Tab. 5: Map
Spectrum
Dependent on the selected dataset (SVS or CSI), different features are available. The tables be-low describe these features.
Available options Default Description
Show Annotation
OFF Enables or disables the display of an abbreviated list of spectrum qualities inthe upper left corner of the spectrum viewport.

Review and Analysis Packages SpectroView
194 Philips MRI
Phili
ps H
ealth
care
4598
006
437
51/7
81 *
03/
2014
*7
Available options Default Description
CSI Graph Annotation NAA/Cr and Cho/Cr Specifies which quantities are displayed in the upper right corner of each spec-trum box, Choices include whatever metabolite map quantities are currentlydisplayed in the middle and in right viewports as well as some standard peakarea ratios: NAA/Cr, Cho/Cr, NAA/Cho, Cho/NAA, and (if applicable) Cho/Ctand (Cho+Cr)/Cit.
Spectrum Display Options Allows to optimize the spectrum display. chapter “Optimize spectrum display”on page 314 for more information on the available options.
Subtract Baseline From GraphDisplay
OFF Subtracts the fitted baselines from both the original and fitted spectrum.
Display Graph: x,y To select the spectrum from voxel x,y for display only. Disabling the stepswitches back to the last used selection.
Display Time Domain Data forVoxel x.y
OFF Allows inspection of the time-domain data within a pop-up window.
Graph Display Mode Geometrical Sets the type of display for selected spectra:
• Horizontal: displays spectra horizontally.
• Stack displays spectra vertically.
• Geometrical: displays spectra corresponding to the arrangement of vox-els.
• Compressed: displays spectra in a square or rectangle array with a mini-mum of blank entries.
Phase Mode Modulus for CSI max.echo,
Real for CSI half echo
Defines which part of the spectrum is displayed.
• Real: real component.
• Imaginary: imaginary component.
• Phase: phase information.
• Modulus: magnitude.
• Power: modulus squared spectral signal.
Display Average OFF Computes and displays an average of all selected spectra in single voxel for-mat, if enabled. The table of results will be updated to show the values of theaverage spectrum. Choosing this entry runs the script again for the selectedset of voxels and then displays the average with fitted spectrum in single voxelformat. Clicking this entry again returns to multi-voxel display, with only thatspectra, that contributed to the average selected.
Screen layout matches SVS layout.
Line Display OFF Active only for stack display. Enables or disables display of a vertical line thatfollows the position of the mouse, for comparing peak positions in differentspectra.
Set Spectrum Limits --- Specifies left/right values for X-axis and minimum/maximum for Y-axis.

SpectroView Review and Analysis Packages
Philips MRI 195
Phili
ps H
ealth
care
4598
006
437
51/7
81 *
03/
2014
*7
Available options Default Description
Display Full Width OFF Displays the full spectrum if enabled.
Display Full Height --- Scales the spectrum amplitude so that the tallest peak fills the spectrum view-port.
Reset View --- Restores default chemical shift limits and adjusts the spectrum amplitude todisplay its full height.
Note: The default display range is defined in the selected script. An autoscalemechanism is used to zoom the spectrum to fill the entire spectrum displayarea.
Tab. 6: Spectrum for CSI dataset
The graph display mode is also accessible via the main toolbar. For more information on hori-zontal, vertical, geometrical and compressed display, refer to the section ’Modify Layout.
Available options Default Description
Show Annotation
OFF See table above: ’Spectrum for CSI dataset’.
Spectrum Display Options chapter “Optimize spectrum display” on page 314for more information on the avail-able options.
Subtract Baseline From GraphDisplay
OFF
See table above: ’Spectrum for CSI dataset’.
Display Time Domain Data forVoxel x.y
OFF
X-axis Units ppm Changes the X-Axis units to Hz or ppm.
Phase Mode Real for SVS See table above: ’Spectrum for CSI dataset’.
Difference Mode OFF Enables or disables the possibility of adding vertical lines which can serve as markersfor comparison. Two nr’s for each line indicate peak position and amplitude. Dx andDy represent the difference in position and the difference in amplitude between theselected points. The integral of the spectrum between 2 markers is displayed aswell.
Set Spectrum Limits ---
See table above: ’Spectrum for CSI dataset’.Display Full Width OFF
Display Full Height ---
Reset View ---
Tab. 7: Spectrum for SVS dataset
Available options Default Description
Show Spectrum ON Enables or disables the display of the original spectrum.

Review and Analysis Packages SpectroView
196 Philips MRI
Phili
ps H
ealth
care
4598
006
437
51/7
81 *
03/
2014
*7
Available options Default Description
Show Metabolite Labels ON Enables or disables the display of the metabolite names in the spectrum.
Show Fitted Spectrum ON Enables or disables the display of the fitted spectrum.
Show Fitted Baseline ON Enables or disables the display of the fitted baseline.
Show Residual OFF Enables or disables the display of the difference spectrum.
Tab. 8: Spectrum Display Options
The Spectrum Display Options can be used to modify the display of the spectrum with respectto the graph and metabolite labels.

Entering examination data Workflows Scanning and Planning
Philips MRI 197
Phili
ps H
ealth
care
4598
006
437
51/7
81 *
03/
2014
*7
Workflows Scanning and Planning
Entering examination dataEnter examination data in two steps:
1. Enter or select the patient data. This can be done by:
• Entering new patient data.
For more information, see chapter “Entering 'New Examination' data” on page 197.
• Entering Asian patient names.
For more information, see chapter “Entering Asian patient names” on page 199.
• Selecting existing patient data.
For more information, see chapter “Select existing patient data” on page 201.
• Selecting patient data from RIS.
For more information, see chapter “Select patient data from RIS” on page 201.
2. Select an ExamCard.
Entering 'New Examination' data1. From the main menu bar, select ‘Patients’ and then ‘New Examination...’.
2. Enter the examination data.
Press the |Tab| key to proceed to the next data field or click to make a data field current.The active data field is identified by the pointer.
3. Click |Confirm and Proceed|.
The highlighted examination becomes the current examination. The system switches toscan mode.
Clicking |Enter|, the examination is added to the examination list and highlighted, but notmade the current examination. This function can be used to enter examination data prior to the actual examination forpreparation purposes.
Format of the Examination Data
• Patient name: max. 64 characters for Asian names, see next section.
• Registration ID: max. 64 characters.
• Date of birth: MM/DD/YYYY (A future date is not accepted).From this date, the patient's age is calculated and displayed.
– The format can be changed by Customer Support (Service) personnel into e.g. DD-MM-YYYY or DD-MMM-YYYY.
– MM must be in the range of 1 to 12.
11

Workflows Scanning and Planning Entering examination data
198 Philips MRI
Phili
ps H
ealth
care
4598
006
437
51/7
81 *
03/
2014
*7
– DD must be in the range of 1 to 31.
WARNINGVerify that the birth date of the patient is filled-in correctly.
Sound levels may be unacceptable for patient of below 3 years of age and a warning is dis-played.
• Gender: Male, Female or Phantom/Other.
• Exam name: maximum 10 characters.
• Accession number: numeric value
• Patient weight: maximum 3 digits, value not greater than 400 kg.
WARNINGVerify that the patient weight is filled-in correctly.
Incorrect weight leads to incorrect SAR values. SAR values are calculated based on patientweight.
NOTICEYour system has been set for entering the patient weight in either kilograms or lbs.
Please contact Philips Customer Support (Service) to change the weight unit.
NOTICEEnter the patient weight accurately in the correct unit to control power deposition to the pa-tient.
Your system has been set for entering the patient weight in either kilograms or lbs. Pleasecontact Philips Customer Support (Service) to change the weight unit. Patient weight conver-sion: 1 kg = 2.2 lbs; 1 lbs = 0.454 kg).
• Referring Physician: max. 30 characters
• Performing Physician: max. 30 characters
• Study Comments: maximum 30 characters

Entering examination data Workflows Scanning and Planning
Philips MRI 199
Phili
ps H
ealth
care
4598
006
437
51/7
81 *
03/
2014
*7
Entering Asian patient namesYour system can be set to enable entering patient names in Chinese, Japanese or Korean. This isdone with the Windows© Input Method Editor (IME).
Fig. 92: Windows© Input Method Editor (IME)
Please refer to the Microsoft (MS) Windows help for more information.
When your system is set to Japanese or Simplified Chinese, entering patient names in the se-lected language is possible by default. For all other system languages the patient name lan-guage must be selected by changing the MS Windows input settings.
For Asian languages the 'Patient name' line consists of three fields:
• field 1 (left), name in Latin characters, maximum 64 characters.
• field 2, name in ideographic characters, maximum 30 characters.
• field 3, name written phonetically, maximum 30 characters.
Fig. 93: Example of the 3 input fields for 'Patient name'.
Changing MS Windows input settings
Change the MS Windows input settings when your patient name language is different than yoursystem language.
1. Press the |Windows| key on your keyboard to show the Windows task bar.
2. Select ‘Start’ -> ‘Control panel’.
3. Double-click the ‘Region and Language’ icon.
The 'Region and Language' window is displayed.
4. Click 'Change keyboards...'.
NOTICEDo not change the default input language.
5. In Installed services:
Check your keyboard layout (Chinese, Japanese or Korean).
If your keyboard layout is not present in the field click |Add...|:
• On the ‘Add Input Language’ window select the input language from the top scroll listand your keyboard layout.
• Confirm by clicking |OK|.
6. Confirm by clicking |OK| to close the window..

Workflows Scanning and Planning Entering examination data
200 Philips MRI
Phili
ps H
ealth
care
4598
006
437
51/7
81 *
03/
2014
*7
7. Click |OK| to close the 'Region and Language' window.
The IME is displayed on your screen. If the IME is not visible press the |Windows| key onyour keyboard.
8. Select the patient name language on the IME.
9. From the main menu bar, select ‘Patients’ and then ‘New Examination...’.
10. Enter the patient name as described below.
Entering Japanese patient names
1. Field 1: Enter the patient name in Latin characters.
2. Field 2 and 3:
• Open the IME (Input Method Editor) by right-click in the field and selecting |Open IME|or by shortcut |Alt|+|~|.
• Enter the patient name.
• Press the |Space Bar|, open the scroll list with the |arrow-down| key and select thecorrect writing by:
• using the arrow keys and press |Enter|, or
• right-click, select the correct writing with the cursor and press |Enter|.
3. Close the IME by right-click in a field and selecting |Close IME| or by shortcut |Alt|+|~||.
Reconversion
If an incorrect writing is chosen in field 2 or 3 it can be corrected:
• Highlight the name to be changed.
• Right-click in the field and select |Reconversion|
• Select the new writing and press |Enter|.
Entering Chinese names
1. Field 1: Enter the patient name in Latin characters.
2. Field 2:
• Open the IME (Input Method Editor) by right-click in the field and selecting |Open IME|or by shortcut |Alt|+|~|.
• Enter the character(s).
• Press the |Enter| key or |Space Bar| to confirm or press the |Arrow-back| key to opena list with proposed characters, select the correct character and confirm by pressing the|Enter| key.
3. Field 3: Enter the patient name phonetically in Pinyin.
NOTICETo close the IME right-click in a field and select |Close IME| or shortcut |Alt|+|~|.

Entering examination data Workflows Scanning and Planning
Philips MRI 201
Phili
ps H
ealth
care
4598
006
437
51/7
81 *
03/
2014
*7
NOTICEWhen the IME is active click |Ctrl+Space Bar| or |shift| to switch between entering Latin orideographic characters.
Entering Korean names
1. Field 1: Enter the patient name in Latin characters.
2. Field 2 and 3: Enter the patient name in Korean characters.
Select existing patient dataA patient whose data has already been entered into the database can be selected for scanningas follows:
1. From the main menu bar, select ‘Patients’ and then ‘New Examination...’.
2. Select a patient from the patient list
• Clicking |Patient name| sorts the patient data in alphabetical order.
3. Click |Confirm and Proceed|.
The selected examination becomes the current examination. The system switches to scanmode.
Select patient data from RISIf the operators console (OC) is connected to the Radiology Information System (RIS), the datacan be copied from the RIS to the OC.
1. From the main menu bar, select ‘Patients’ and then ‘New Examination...’.
2. Click 'More....' and 'RIS'.
A new window (RIS) appears. It contains the patient’s worklist from the current day (today)and the following day (tomorrow).
NOTICEDownloading the list can take up to a few minutes!
3. Click on a patient’s data to select.
Only one patient at a time can be selected.
4. Click |Enter|.
The patient entry will be transferred to the ‘New Examination’ window.
This may be repeated until |Proceed| or |Cancel| have been clicked.
5. Click |Confirm and Proceed|.

Workflows Scanning and Planning Entering examination data
202 Philips MRI
Phili
ps H
ealth
care
4598
006
437
51/7
81 *
03/
2014
*7
The patient entry will become the current examination. The RIS window will close. The sys-tem switches to scan mode.
|Cancel| can be used to close the ‘RIS’ window.
|Refresh| can be used to refresh the downloaded list from ‘RIS’.
After scanning has been ended the examination data can be marked by selecting the examina-tion in Patient Administration and clicking:
• |Ready|, for examinations which have been completed succesfully,
• |Incomplete|, for examinations which have not been completed (aborted).
A MPPS message is then sent to the RIS and the scan data also automatically stored to PACS.The MPPS (Modality Performed Procedure Step) informs a DICOM partner about what has beenperformed by tracking the acquisition status. A MPPS partner can for example be, a PACS orRIS.
Combine Accession Numbers (RIS)The Combine Accession Number functionality is used to combine several studies of one pa-tient, as scheduled on the RIS, into a single study. The rationale behind combining several studyrequests from RIS is based on reimbursement requirements. For example, there may be no re-imbursement for a Total Neuro examination, but there is for an examination of the Spine andan examination of the HeadCNS. However, for the patient it is more convenient if the examina-tion is performed in one go, as one examination.
When combined examinations are sent to PACS, the user has to split the examination data inthe PACS to accommodate for the initial request of multiple examinations.
Workflow
⊳ In the RIS, two entries with different accession numbers are present for one patient, e.g. aSpine and a HeadCNS examination.
► From the main menu bar, select ‘Patient’ and then 'New Exam'.
► Click |RIS|.A new window opens.
► Select the examinations to be combined, and then click More.... The Worklist (RIS) window opens.
► When examinations are combined into one, a common examination name has to be chos-en. To do so: Select the future common examination name from the Procedure Setup Description drop-down menu, in this case either: Spine or HeadCNS.
► Perform the examination as usual.
► After completion of the examination, select ‘Administration’ from the ’Patient’ main menuor press |F4|.
► Click the combined examination to make it the current examination.

Run an ExamCard Workflows Scanning and Planning
Philips MRI 203
Phili
ps H
ealth
care
4598
006
437
51/7
81 *
03/
2014
*7
► Click Ready to report back to the RIS that the examination has been completed. Currently only the specified procedure step will be reported back to the RIS as completed. Ifthe combined examination has been set to Spine, Spine will be set to completed whereasHeadCNS will still be there in the RIS view.
Run an ExamCard
Select an ExamCard and make it the Current ExamCard⊳ In the ExamCard Manager:
1. Select either the |Philips| or the |Hospital| database.
NOTICEThe database ’Other’ is meant for importing and exporting.
2. Browse to the required ExamCard:
• Double-click on the required anatomy (first time: ExampleCards folder).
The required anatomy folder opens, and the list of available subanatomies is displayed.
• Double-click on the required subanatomy.
The required subanatomy folder opens, and the list of available items (ExamCards andscan protocols) is displayed.
ExamCards are indicated by the ExamCard icon:
3. Drag and drop this ExamCard into the List View, OR
hover over the ExamCard, click the green plus icon .
In both cases, the ExamCard opens in the List View and expands so that all ExamCard itemswithin this ExamCard are visible.
Start the ExamCard1. Click |Start scan| to start the ExamCard.
The survey procedure starts. The survey images will automatically be loaded into the view-ports.
Plan the items of the ExamCard geometrically1. Select suitable images for planning.

Workflows Scanning and Planning Run an ExamCard
204 Philips MRI
Phili
ps H
ealth
care
4598
006
437
51/7
81 *
03/
2014
*7
Scroll to the slice best suited for planning. Window, zoom and pan to optimize the displayof anatomic structures needed for planning.
2. Double-click on an ExamCard item to enable planning.
The icon 'Being Modified' indicates the ExamCard item currently being planned ormodified.
3. Move the volume, stack or slab:
• Click on the circle in the center.
• Drag in any direction.The values of the Offcenter parameters are automatically adapted.
4. Angle the volume, stack or slab:
• Click on one of the outer squares on the mid slice.
• Drag up- or downwards to change the angulation. The values of the Angulation parame-ters are automatically adapted.
5. Optional:
• Drag the upper or lower yellow line to change the gap.
• Press and hold |Shift|, drag the upper or lower yellow line to change the number of sli-ces.
6. Repeat the previous steps for all ExamCard geometries.
7. Click 'Accept' to accept the planning. Clicking 'Cancel' ends the planning session without applying the changes.
Resume the ExamCard1. Click |Start scan| to resume the ExamCard.
All of the items within the ExamCard will be performed now.
Tabletop movement during scanning
If an ExamCard issue requires tabletop movement for optimum isocenter positioning, a mes-sage will pop up asking if tabletop can be performed. If this is confirmed, another message willpop up indicating that the tabletop is moving automatically. In order to stop this automatic tab-letop movement, click 'Stop'.

Manage ExamCards Workflows Scanning and Planning
Philips MRI 205
Phili
ps H
ealth
care
4598
006
437
51/7
81 *
03/
2014
*7
Moving TableTop
The tabletop is moving automatically.
• Stop
Manage ExamCards► Select 'Manage ExamCards ...' from the System menu to open this view.
► Enable the Double EC Database View by clicking the 'Toggle DB View' button.
► Browse to a folder or ExamCard in both windows.
► Drag an ExamCard from one EC folder to the other one.
► Optional: Double-click the ExamCard to edit its contents: the EC items (scan protocols, post-processing steps).
Create (and/or Edit) an ExamCard
NOTICEThe maximum number of ExamCard items is 125. The maximum number of inline postprocess-ing steps is 6.
Select scan protocols1. From the main menu bar, select ‘System’ and then ‘Manage ExamCards’.
2. Select either the |Philips| or the |Hospital| database.
NOTICEThe database ’Other’ is meant for importing and exporting.
3. Browse to the required scan protocol(s):
• Double-click on the required anatomy.
The folder opens, and the list of available subanatomies is displayed.
• Double-click on the required subanatomy.
The folder opens, and the list of available items (ExamCards and scan protocols) is dis-played.

Workflows Scanning and Planning Create (and/or Edit) an ExamCard
206 Philips MRI
Phili
ps H
ealth
care
4598
006
437
51/7
81 *
03/
2014
*7
4. Click on the required scan protocol(s).
Multiple selections are possible.
• Scan protocols are indicated by the Scan Protocol icon:
5. Drag and drop the scan protocol(s) into List View,
OR hover over the ExamCard, click the green plus icon ,OR double-click the scan protocol.
In all cases, the scan protocol will be added to the current ExamCard in ListView.
Fine-tune the ExamCard
Change the ExamCard name► Click on the ExamCard Header.
► Right-click on the ExamCard Header and select 'Edit Name' from the context menu.
► Edit the current name or enter a new name.
Select and Deselect Items
Selecting/Deselecting Procedure Effect
Select one item Click on the item’s name. The border color of the selecteditem(s) will change.
Select multiple consecutiveitems
Hold |Shift| while dragging over the items.
Select multiple individualitems
Hold |Ctrl| while clicking on the items.
Deselect Hold |Ctrl| while clicking on the item.
Fig. 94: Selected (lower row) and non-selected item upper row).
Duplicate, Copy, Cut, Paste, Delete and Move itemsAll these functions work on selected items only.
► Select an item first and then proceed as described below.

Create (and/or Edit) an ExamCard Workflows Scanning and Planning
Philips MRI 207
Phili
ps H
ealth
care
4598
006
437
51/7
81 *
03/
2014
*7
Procedure Effect
Duplicate an item ► Drag while keeping |Ctrl| pressed. The item is copied to the current ExamCard,thus generating a duplicate.
Copy an item ► Either:
• Press the combination of |Ctrl| and |C|.
Or:
• Right-click on the EC window and select 'Copy' from theEC context menu.
The item is copied to the clipboard.
Cut an item ► Either:
• Press the combination of |Ctrl| and |X| .
Or:
• Right-click on the EC window and select 'Cut' from theEC context menu.
The item is removed from the current Exam-Card and moved to the clipboard.
Paste an item ► Either:
• Press the combination of |Ctrl| and |V| .
Or:
• Right-click on the EC window and select 'Paste' fromthe EC context menu.
The item is moved from the clipboard to thecurrent ExamCard. It will be inserted after thecurrently selected item.
Delete an item 1. Either:
• Right-click on the EC window and select 'Delete' fromthe EC context menu.
Or:• Press the |Del| key.
The item is deleted from the current Exam-Card.
Items can only be deleted if they are not yetexecuted (prepared, running, in reconstruc-tion or similar).
Move an item 1. Drag the item to the desired position. Items can only be moved if they are not yetexecuted (prepared, running, in reconstruc-tion or similar).
Otherwise a copy will be created.
Print an item 1. Right-click on a sequence in the ExamCard editor.
2. Select ’Save Protocol to Text File’.
3. Open the text file with e.g. Notepad.
4. Print the text file.
The scan protocol will be saved to a text fileand can then easily be printed.
Assign a scan geometry to an itemInitially a geometry named "Geo1" is assigned to a scan protocol when dragged into ExamCard.

Workflows Scanning and Planning Create (and/or Edit) an ExamCard
208 Philips MRI
Phili
ps H
ealth
care
4598
006
437
51/7
81 *
03/
2014
*7
ExamCard items with the same geometry name have the same slice orientation, the same off-centers and angulations.
1. Click on the ’Geometry’ column to select it for editing.
2. Enter a Geometry name, edit the current name or select an existing geometry from thedrop-down list.
For survey scans, the geometry name can be deleted. Doing so indicates that the scan does notneed further planning and is ready to run.
Propagate the coverageScans sharing the same geometry (same geometry name) by default have
• the same number of stacks,
• the same orientation,
• each stack with identical angulations and offcenters.
Enabling ’Propagate Coverage’, these scans do also share
• the FOV (including RFOV and fold-over direction)
• the slice coverage (volume in slice direction):
– In 3D scans, the number of slices will be adapted.
– In 2D scans, the slice thickness will never be touched, but only the FOV, the rectangularFOV and the fold-over direction.
– In M2D and MS scans, it depends on the kind of scan from which the geometry has tobe taken over. Refer to the table below for more informations.
The following parameters are affected by 'Propagate Coverage':
• Number of stacks and/or slices
• FOV in measurement, phase and slice direction
• Slice thickness and gap
• Fold-over direction and the amount of fold-over suppression
• Fat shift direction
NOTICEWhen using ’Propagate Coverage’, always be aware of the fact that the fold-over direction istaken over.
Take over geometry What happens?
3D scan -> M2D or MS • The number of slices will be adapted such that the coverage of the M2D orMS scan is identical to the 3D scan.

Create (and/or Edit) an ExamCard Workflows Scanning and Planning
Philips MRI 209
Phili
ps H
ealth
care
4598
006
437
51/7
81 *
03/
2014
*7
Take over geometry What happens?
M2D or MS -> M2D or MS Number of slices
• The number of slices will always be taken over to guarantee comparable sli-ces.
Slice thickness and slice gap
• If the slice thickness has initially been the same, it will stay the same andchanges to this parameter will be taken over, i.e. increasing the slice thick-ness from 5 mm to 6 mm, all other scans will also increase from 5 mm to 6mm - if their initial value has been 5 mm. The slice gap will be adapted also.
• If the slice thickness has initially NOT been the same, the slice thickness andthe slice gap will be adapted to the new slice distance (distance betweenadjacent slice centers) where the thickness / gap ratio stays the same. I.e.changing the slice thickness from 5 mm to 4 mm, in a scan with initially 4mm / 0.8 mm will change to 4.58 mm / 0.92 mm. This is done in such a waywith respect to IR scans where typically a slice gap of 20% of the slice thick-ness is used.
Workflow
1. Select multiple ExamCard items with the same geometry name in order to propagate thecoverage. To select multiple successive items, press |Shift| and click to select. To select multiple items, press |Ctrl| and click to select.
2. Right-click and select ’Propagate Coverage’ from the context menu.A checkmark indicates that 'Propagate Coverage' is enabled.
3. Double-click one of the EC items (with 'Propagate Coverage' enabled) to open it for editing.
4. Change geometry parameters as needed.
5. Click 'Accept' to confirm planning.
6. Automatically all other EC items with 'Propagate Coverage' enabled will have the same cov-erage settings.
Link items (GeoLink)For more information about GeoLink, refer to chapter “” on page 38.
1. Move the cursor over the ’GeoLink’ column.
The geometry field turns blue.
2. Click on the column to select it for editing.
3. Enter a letter representing the geometrically linked group, e.g. ’X’.
Insert a user start / manual start prior to an item1. Move the cursor over the ’Characteristics’ column.

Workflows Scanning and Planning Create (and/or Edit) an ExamCard
210 Philips MRI
Phili
ps H
ealth
care
4598
006
437
51/7
81 *
03/
2014
*7
Blue borders appear around the geometry field.
2. Click on the column to select it for editing.
3. Click on the arrow symbol to display a drop-down menu.
4. Select 'User Start Required'.
To indicate the pause or the manual start (e.g. after an injection), the corresponding sym-bol appears in this column.
Fig. 95: Inserting a user or manual start.
You can also select 'Requires Manual Start |Ctrl|+|U|' from the right mouse menu, or press |Ctrl|+|U|.
Group and Ungroup ItemsMain purpose of grouping scans is to make sure that a scan is not started before another one isplanned. Group items cannot be modified after the scan has been started.
This is especially relevant for contrast uptake studies e.g. BolusTrak where the pre-contrastscan, the 2D real-time reconstructed scan and the post-contrast scan are typically grouped. Insuch a way, the subtraction results will be reliable due to identical pre- and post-contrast scans.
Fig. 96: Grouped items within a MobiFlex ExamCard.
Workflow of Grouping
1. Select multiple consecutive items.

Create (and/or Edit) an ExamCard Workflows Scanning and Planning
Philips MRI 211
Phili
ps H
ealth
care
4598
006
437
51/7
81 *
03/
2014
*7
2. Right-click on the ExamCard window and select 'Group' from the ExamCard context menu(alternatively press |Ctrl|+|G|).
Instead of a border around every item, the group of items will be surrounded by one bor-der only.
Workflow of Ungrouping
1. Click on the group to make it current.
2. Right-click on the ExamCard window and select 'Ungroup' from the ExamCard contextmenu (alternatively press |Ctrl|+|G|).
Instead of a border around the group, now every item will be surrounded by its own bor-der.
Split dynamics1. Click on the group to make it current.
2. Right-click on the ExamCard window.
The context menu appears.
3. Select "Split".
The current dynamic scan consisting of multiple dynamic series will be split up in singlescans.
The resulting ExamCard items cannot be ungrouped, but unsplit: right-click and select 'Unsplit'.
Align scans1. Click ’Scan Align’ on the planning toolbar in Graphical PlanScan.
Scan Align
• To align scans, especially with table movement to cover long anatomical areas.
This function is comparable to the imaging parameter ’Stack Align’.
Start the ExamCard1. Click |Start scan| to start the ExamCard.
The survey procedure starts. The survey images will automatically be loaded into the view-ports (when no geometry name was assigned to the survey scan).
Plan the items of the ExamCard geometrically1. Select suitable images for planning.

Workflows Scanning and Planning Create (and/or Edit) an ExamCard
212 Philips MRI
Phili
ps H
ealth
care
4598
006
437
51/7
81 *
03/
2014
*7
Scroll to the slice best suited for planning. Window, zoom and pan to optimize the displayof anatomic structures needed for planning.
2. Double-click on an ExamCard item to enable planning.
The icon 'Being Modified' indicates the ExamCard item currently being planned ormodified.
3. Move the volume, stack or slab:
• Click on the circle in the center.
• Drag in any direction.The values of the Offcenter parameters are automatically adapted.
4. Angle the volume, stack or slab:
• Click on one of the outer squares on the mid slice.
• Drag up- or downwards to change the angulation. The values of the Angulation parame-ters are automatically adapted.
5. Optional:
• Drag the upper or lower yellow line to change the gap.
• Press and hold |Shift|, drag the upper or lower yellow line to change the number of sli-ces.
6. Repeat the previous steps for all ExamCard geometries.
7. Click 'Accept' to accept the planning. Clicking 'Cancel' ends the planning session without applying the changes.
Access the ExamCard properties
ExamCard Properties
►Click on the ExamCard Properties button in the List View.
► Select either ’General’ or ’Push nodes’.
► For 'General': set the general ExamCard parameters to the appropriate value.
► For 'Push nodes': Select the push node for this ExamCard.
For more information about the ExamCard Properties, refer to chapter “ExamCard Properties”on page 71.

Create (and/or Edit) an ExamCard Workflows Scanning and Planning
Philips MRI 213
Phili
ps H
ealth
care
4598
006
437
51/7
81 *
03/
2014
*7
Enable or disable ’Push to workstation’► Right-click on the ExamCard header (name).
► Select ’Enable Autopush to Workstation’.
The checkmark indicates that the function is enabled.
► Optionally for the current ExamCard this function can also be enabled from the main menubar 'Examination'.
After selecting the whole ExamCard, it is possible to deselect series. In general, pushing to aworkstation is possible on ExamCard level, but also on scan level and postprocessing step level.
Resume the ExamCard1. Click |Start scan| to resume the ExamCard.
All of the items within the ExamCard will be performed now.
When an item is finished, the scanner will automatically proceed with the next item in thelist, if the item is planned and has the status ’Ready to run’.
Save the ExamCard1. Click on the ExamCard header to enable editing of the ExamCard’s name. Rename the Ex-
amCard.
2. From the main menu bar, select 'System' and then 'Manage ExamCards'.
3. Browse to the anatomy / subanatomy folder where the ExamCard has to be saved in.
• Double-click on the desired anatomy folder.
The folder opens, and the list of available subanatomies is displayed.
• Double-click on the desired subanatomy folder.
The folder opens, and the list of preset procedures and ExamCards is displayed.
4. Select the current ExamCard by clicking on the header.
5. Drag the ExamCard into the open folder.
Alternatively:
► Right-click on the ExamCard in List View.
► Select 'Save ExamCard'.
The ExamCard will automatically be saved in the folder 'Other'/'Saved'.
Save some items of the current ExamCard as a new ExamCard1. Click on the ExamCard header to enable editing of the ExamCard’s name. Rename the Ex-
amCard.
2. From the main menu bar, select 'System' and then 'Manage ExamCards'.
3. Browse to the anatomy / subanatomy folder where the ExamCard has to be saved in.

Workflows Scanning and Planning Export/Import of ExamCards
214 Philips MRI
Phili
ps H
ealth
care
4598
006
437
51/7
81 *
03/
2014
*7
• Double-click on the desired anatomy folder.
The folder opens, and the list of available subanatomies is displayed.
• Double-click on the desired subanatomy folder.
The folder opens, and the list of preset procedures and ExamCards is displayed.
4. Select the several items of the ExamCard which have to be saved within a new ExamCardby clicking on them combined with pressing |Ctrl|.
An orange frame marks the selected items.
5. Drag the ExamCard items as a new ExamCard into the open folder.
Export/Import of ExamCardsExamCards can be exported/imported for several purposes:
1. Use/reuse of an EC or EC DB on another Philips MRI scanner.
2. Backup of the Hospital ExamCard database.
3. Availability of several EC DBs to switch between for scanning.
NOTICEWhen an ExamCard or ExamCard database is to be reused on another Philips MRI scanner, al-ways make sure that the configuration of the systems are identical. Otherwise the Exam-Card(s) might not work or even provide lower quality than expected.
ExamCards can be exported/imported in two ways:
• Specific ExamCard(s), or
• The complete Hospital ExamCard database.
Export specific ExamCardsIn order to export hospital ExamCards:
► Right-click on the ExamCard or ExamCards in the ExamCard database.
(Multiple selection is possible in combination with the |Alt| or |Ctrl| key.
► Select ’Export ExamCards...’.
► Select the directory/drive to be copied to.
Make sure that the releases are the same or newer for the system where you want to import anExamCard to.

Export/Import of ExamCards Workflows Scanning and Planning
Philips MRI 215
Phili
ps H
ealth
care
4598
006
437
51/7
81 *
03/
2014
*7
NOTICEThe function ’Export to NetForum’ exports the selected ExamCard(s) to the FTP-destination E:\\Export\ExamCards\*.NetForumExamCard.
Import ExamCardsIn order to import ExamCards from a directory or drive,
1. Right-click in the ExamCard database.
2. Select ’Import ExamCards...’.
3. Browse to the ExamCard which has to be imported.
4. Double-click on this ExamCard. The ExamCard will be copied into the Inbox in the Exam-Cards database.
5. Return to the ExamCard environment to proceed.
During import of ExamCards from the ExamCards database, geometry filtering takes placewhich removes the unused geometries from the ExamCard.
Export Hospital ExamCard Database► Right-click on any of the tabs (Philips, Hospital, Other) in the ExamCards window.
► Select ’Export ExamCard Database As …’ from the right-mouse menu (context menu).
► Browse to the desired folder and enter a name which represents the current ExamCard da-tabase.
NOTICEDo not use spaces or special characters in the file name.
► Click ‘Save’ to start the export procedure to the desired folder.
In the bottom row of the ExamCards window, the progress will be indicated: “Preparing forexport of Database. Please wait.” “Export of Database completed.”
The ExamCard database is saved as Database Archive file in a zip file format.
Import Hospital ExamCard DatabaseFour slots are available for ExamCards databases. Slot 1 is reserved for the ‘Default Database’which is the current Hospital EC database. It is greyed out and cannot be overwritten. The slots2 to 4 can be filled with any ExamCard database. Initially these slots are empty and marked as“…”.
► Right-click on any of the tabs (Philips, Hospital, Other) in the ExamCards window.
► Select ’Import ExamCard Database’ from the right-mouse menu.

Workflows Scanning and Planning Workflow ’Add Postprocessing to ExamCard’
216 Philips MRI
Phili
ps H
ealth
care
4598
006
437
51/7
81 *
03/
2014
*7
► Click on the slots where to import the database to.
► Browse to the ExamCard database to be imported.
► Click ‘Open’ to start the import procedure of the desired ExamCard database.
In the bottom row of the ExamCards window, the progress will be indicated: “Importing Da-tabase. Please wait.” and “Importing of Database completed.”
When importing of the database is completed, the slot will automatically be renamed to thename of the ExamCard Database. In order to switch to this database, you still need to selectit by means of ’Select Hospital ExamCard Database’.
Select Hospital ExamCard Database► Right-click on any of the tabs (Philips, Hospital, Other) in the ExamCards window.
► Select ’Select ExamCard Database’ from the right-mouse menu.
► Select the EC database you want to use by clicking on the corresponding slot.
The ’Hospital’ tab will be replaced by the selected ExamCard database.
► To return to your Hospital ExamCard database, select ’Select ExamCard Database’ again andselect ’Default Database’ in the first slot.
Workflow ’Add Postprocessing to ExamCard’► Switch from the Thumbnail View to the List View.
► Start up the postprocessing package by performing one of the following actions:
• Right-click on a suitable scan and select the postprocessing package from the rightmouse menu.
A tentative step will be visible in the ExamCard.
► Click on the ’Generate series’ icon (while the ExamCard is running).
The postprocessing step is added to the ExamCard.
► Close the package as usual.
► Save the ExamCard to the database.
The next time that this ExamCard will be performed, postprocessing steps will already be visiblein the ExamCard.
Workflow ’Perform Automated Processing’• If no user interaction is required, the postprocessing step is carried out automatically as
soon as the source images are available.
• If user interaction is required, double-clicking the processing step will open the package.This allows for customization of the parameters.

Workflow ’Set up a Smart ExamCard’ Workflows Scanning and Planning
Philips MRI 217
Phili
ps H
ealth
care
4598
006
437
51/7
81 *
03/
2014
*7
• A pause can be specified for a processing step in the ExamCard. A double-click will be neces-sary to open the package allowing for manual parameter adjustments.
Workflow ’Set up a Smart ExamCard’
Select an ExamCard1. Browse to the ExamCard that you want to make a Smart ExamCard.
2. Drag this ExamCard into the List View.
Alternatively drag scan protocols into the ExamCard window to create a new ExamCard.
NOTICEFor joint or extremity examinations, ensure that the ExamCard parameter ’Laterality’ is set toleft when scanning the left extremity and set to right when scanning the right extremity.
Open the Smart Editor► From the Examination menu, select 'SmartExam' and then 'Show SmartGeometries'.
The SmartExam Editor opens.
Fig. 97: Smart Editor.
1 Drop-down menu for the selection of the anatomic region
2 Enable/disable 'Add SmartSurvey to ExamCard' by checking
3 Name of the non-Smart geometry
4 Enable/disable SmartGeometryby checking
5 SmartGeometry name
6 Reserved for remarks like 'New Smart Geometry' or similar

Workflows Scanning and Planning Workflow ’Set up a Smart ExamCard’
218 Philips MRI
Phili
ps H
ealth
care
4598
006
437
51/7
81 *
03/
2014
*7
Select the Anatomic Region1. Click on the ’anatomic region’ drop-down menu.
2. Select one of the anatomic regions:
• Brain
• Knee
• Shoulder
• Breast
• Cervical spine
• Lumbar spine
NOTICEIn case of ’Cervical spine’ or ’Lumbar spine’, one more column will be displayed in the SmartEditor window: the ’Grid Snap’ column.
This ’Grid Snap’ column only applies for spine acquisitions.
Fig. 98: SmartEditor without Grid Snap for Brain and with Grid Snap for Lumbar Spine.
Add a SmartSurvey to the current ExamCardA Smart ExamCard has to start with a SmartSurvey. This SmartSurvey is a dedicated 3D surveyscan that covers the chosen anatomic region completely.
1. Make sure that ’Add SmartSurvey to ExamCard’ is enabled.
A check sign indicates that the function is enabled.
A Smart survey scan will be added to the current ExamCard.
Convert an ExamCard geometry into a SmartGeometryIn order to convert a scan within an ExamCard into a smart scan, you can perform one of thefollowing actions:
1. Create a new SmartGeometry
2. Assign an existing SmartGeometry to the scans

Workflow ’Set up a Smart ExamCard’ Workflows Scanning and Planning
Philips MRI 219
Phili
ps H
ealth
care
4598
006
437
51/7
81 *
03/
2014
*7
3. Convert an existing spine geometry into a SmartGeometry
Create a new SmartGeometry Assign existing SmartGeometries toscans
Convert spine geometries intoSmartGeometries
1. Enable 'Smart' by clicking onthe ’Smart’ entry field.
A check sign indicates that thefunction is enabled.
1. Enable 'Smart' by clicking onthe ’Smart’ entry field.
A check sign indicates that thefunction is enabled.
1. Enable 'Smart' by clicking onthe ’Smart’ entry field.
A check sign indicates that thefunction is enabled.
’Set Grid Snap’ is displayed asremark indicating that ’GridSnap’ has to be set to ei-ther ’yes’ or ’no’.
1. Enter a SmartGeometry (in thefield ’Replace with’) by typing anew name.
Alternatively, existing Smart-Geometries can be assigned toscans.
1. Click on the ’Replace with’drop-down menu to display theexisting SmartGeometries.
2. Select one of these SmartGeo-metries.
1. Set ’Grid Snap’ to ’no’ for theSmartGeometries where ac-quisition is always done for athe same range, e.g. in the sag-ittal spine.
2. Set ’Grid Snap’ to ’yes’ for theSmartGeometries where ac-quisition is done on differentdisc levels, e.g the transversespine.
► Click |Apply|.
The Smart survey will be added to the current ExamCard. The geometries in the ExamCard window will be re-placed.
NOTICEEach SmartGeometry name should refer to a unique planning.
Use unique geometry names throughout all anatomic regions.
Fig. 99: Selecting an existing SmartGeometry from the 'Replace with' drop-down menu.

Workflows Scanning and Planning Workflow ’Set up a Smart ExamCard’
220 Philips MRI
Phili
ps H
ealth
care
4598
006
437
51/7
81 *
03/
2014
*7
Fig. 100: Converting spine geometries into Smart spine geometries: In the upper image Smart is enabled with GridSnap not yet defined. The message 'Set Grid Snap' is displayed as remark. In the lower image 'Grid Snap' is set to 'no'for the sagittal Smart spine geometry and to 'yes' for the transverse Smart spine geometry. Note the different Smarticons besides the new geometry name.
1 Smart icon: not level specific.
2 Smart icon: level specific.
Fig. 101: Example: After applying the changes, the geometries have been replaced by SmartGeometries and theSmartSurvey has been added to the ExamCard. Note that the T1w_TSE axial scan is level specific.
Validate a Smart ExamCardA newly defined SmartGeometry has to be planned and executed several times before it willturn into a validated SmartGeometry and doesn’t require planning anymore. Proceed as fol-lows:
► Start the Smart ExamCard that needs to be validated. The SmartSurvey and the reference scan will be executed automatically.
► When the SmartSurvey is completed, double-click on the EC items of the diagnostic scans toplan them.
► Plan as accurately as possible. Keep in mind that the planning will contribute to the Smart-Geometry samples.
► As soon as planning is complete and confirmed, the diagnostic scans will be executed auto-matically.
► When scanning is finished, you can add the planned samples to the SmartGeometry data-base. To do so, click 'Proceed' in the pop-up window.

Workflow ’Execute a Smart ExamCard’ Workflows Scanning and Planning
Philips MRI 221
Phili
ps H
ealth
care
4598
006
437
51/7
81 *
03/
2014
*7
Optional: Replace the Non-Smart ExamCard by the new Smart ExamCard
► First open the ExamCard database.
► Then select 'Delete' to delete the old ExamCard. Click 'Proceed' to confirm.
► Rename the current Smart ExamCard to indicate that it is a Smart ExamCard.
► To save this new Smart ExamCard, drag it into the Hospital folder. This ExamCard can nowbe used for all similar examinations.
Workflow ’Execute a Smart ExamCard’A Smart ExamCard can contain Smart items in different states. Depending on the status of theSmart items, the workflow is different. This section describes:
• Smart icons indicating the status of Smart items
• Workflow ’Smart items are in validating mode’
• Workflow ’Smart items are validated’
• Parameters ’Laterality’ and ’Patient Position’
• Switch to User-Confirmation Mode
Smart icons indicating the status of Smart itemsThe states are indicated by Smart icons. Note that Philips delivers predefined SmartGeometries.These predefined SmartGeometries are locked and as a consequence cannot be modified or de-leted. They allow immediate usage of SmartExam without the need of validating SmartGeome-tries.
Icon Status of the item More about the status
Smart item that is validated (enoughplanning examples).
Final status.
Smart item that is in validating mode(not enough planning examples).
Collect more planning examples to finalize the validatingprocess.
Locked SmartGeometry. This Philips preset SmartGeometry cannot be deletednor modified.
Locked level-specific (e.g. transversespine) SmartGeometry.
This Philips preset SmartGeometry cannot be deletednor modified.
NOTICEValidated geometry databases for the SmartExam anatomic regions are provided with yoursystem which can immediately be used.

Workflows Scanning and Planning Workflow ’Execute a Smart ExamCard’
222 Philips MRI
Phili
ps H
ealth
care
4598
006
437
51/7
81 *
03/
2014
*7
Workflow ’Smart items are in validating mode’When the Smart items of the ExamCard are still in ’validating mode’, the workflow is:
1. Select an ExamCard.
2. Start the ExamCard (to acquire survey images).
3. Plan the items of the ExamCard geometrically within the Graphical PlanScan OR fine-tunethe suggested planning and confirm.
4. Resume the ExamCard.
5. When the ExamCard is finished, you are asked to add (or ’not to add’) the samples to theSmartGeometry database.
Workflow ’Smart items are validated’When the Smart items of the ExamCard are ’validated’, the workflow is:
1. Select an ExamCard.
2. Start the ExamCard (to acquire survey images).
The validated items will show up as ’ready to run’ and all the items of the ExamCardare planned and will run automatically.The Smart items in validating mode have to be planned.
Parameters ’Laterality’ and ’Patient Position’Always ensure that the settings of the parameters ’Laterality’ and ’Patient Position’ correspondto the actual patient position. Otherwise SmartExam will detect inconsistencies between posi-tioning and parameter settings, and will abort the scan.
This is especially true for knee and shoulder examinations.
Laterality
For knee and shoulder examinations, ensure that the ExamCard parameter ’Laterality’ is set toleft when scanning the left extremity and set to right when scanning the right extremity.
Patient position
For knee examinations, ensure that the knee is positioned supine when the parameter ’Patientposition’ is set to ’supine’.
Be careful with heavy exo-rotation, since a ’decub-right’ or ’decub-left’ position might be de-tected instead of a ’supine’ patient position.
Switch to User-Confirmation ModeA validated Smart ExamCard will be executed automatically. However, it is possible to ask foruser confirmation of the planning.

Workflow SmartExam Spine Workflows Scanning and Planning
Philips MRI 223
Phili
ps H
ealth
care
4598
006
437
51/7
81 *
03/
2014
*7
► To do so, select 'SmartExam Tools' from the System menu, and enable 'User ConfirmationMode'..
With user confirmation enabled, the ExamCard will stop so that planning can be inspectedand/or modified.With user confirmation disabled, the system automatically confirms Smart planning.
Workflow SmartExam SpineFor SmartExam Spine acquistions, two features have been introduced:
• Vertebrae labelling and
• (disc) Level specific scanning.
Vertebrae labelling
Vertebrae labelling has to be confirmed to allow level specific scanning.
1. Start the SmartExam Spine ExamCard.
2. When the SmartSurvey is finished, thevertebrae labelling window pops up.
3. When labelling is correct press |Proceed| to continue.
4. Adjustments can be made by clicking the ‘up’ or ‘down’ arrow
5. Check ’Manual’ to continue with manual planning.
6. Click |Proceed| to continue.
Fig. 102: Vertebrae labelling window.

Workflows Scanning and Planning Workflow SmartExam Spine
224 Philips MRI
Phili
ps H
ealth
care
4598
006
437
51/7
81 *
03/
2014
*7
1 Window 'Confirm Vertebrae Labelling'
2 Click 'Up' or 'Down' to fine-tune the vertebrae labelling.
Check 'L6 present' if L6 exists in a patient.
3 Continue planning: Manual or Smart.
This allows to switch from 'Smart' planning to 'Manual' planning or vice versa.
4 Click |Cancel| to quit without any changes.
5 Click |Proceed| to confirm the vertebrae labelling.
Level specific scanning
In all scans with a level specific Smart Geometry (if 'level specific' is enabled by means of acheckmark), another tab is available in the Parameter Editor: the 'smartstacks' tab.
Fig. 103: Tabs in planning a level specific scan.
1 initial
2 geometry
3 contrast
4 motion
5 dyn/ang
6 postproc
7 offc/ang
8 conflicts
9 smartstacks
Clicking on the 'smartstacks' tab, the level specific planscan user interface (UI) pops up.

Workflow SmartExam Spine Workflows Scanning and Planning
Philips MRI 225
Phili
ps H
ealth
care
4598
006
437
51/7
81 *
03/
2014
*7
Fig. 104: Level specific planscan UI.
1 Indication of the scan 'Geometry' (in this case: transverse)
2 Indication of the level 'Definition' (in this case: L5 - S1)
3 Schematic display of the upper spine (use scrollbar to scroll down or up) with
• gray lines representing possible new stacks
• red line representing defined stack
• arrows up/down to shift the stacks up or down
4 Schematic display of the lower spine (use scrollbar to scroll up or down).
• gray lines representing possible new stacks
• red line representing defined stack
• arrows up/down to shift the stacks up or down
5 Window with Guidance (in this case: Define the desired stack by selecting stacks in the sche-matic spine)
You can define the disc levels to be scanned beforehand or after scanning the high resolutionsagittal scan. Both ways are described here:
Workflow: Define the disc level(s) to be scanned beforehand
1. In the Parameter Editor, click on the ’smartstacks’ tab.
The graphical planscan user interface pops up.
2. Use the scrollbar to scroll to the required disc level.
3. Click on a gray stack line to add a stack.
4. Click on a red stack line to remove this stack.
5. Click on the ’Up’ or ’Down’ arrow to shift the stacks up or down.
6. Start the ExamCard.

Workflows Scanning and Planning Adjust Ventilation in Bore
226 Philips MRI
Phili
ps H
ealth
care
4598
006
437
51/7
81 *
03/
2014
*7
Workflow: Define the disc level(s) after scanning on the high resolution scan
1. Check the high resolution T2w sagittal scan.
2. In Planscan, drag the stacks to the desired scanning location.
3. The snapping mechanism (’Grid Snap’) recognizes the levels automatically and snaps thetransverse stacks to the required levels.
4. Resume the ExamCard.
NOTICEDuring the validating phase, fine tuning adjustments can be made without snapping.
Adjust Ventilation in BoreThe MR system has a recommended ventilation level. This is a static level based on averagescans and system specific conditions.The system does not change the recommended ventilation level for e.g. high SAR scans, ambi-ent temperature and patient weights, clothing and conditions. It is solely the responsibility ofthe operator to determine the level of ventilation for different scans and conditions togetherwith the patient.
NOTICEFor interventional procedures it is advised to scan with patient ventilation switched off and innormal operating mode. Recommended room temperature is 18 - 22oC.
The ventilation in the bore can be adjusted from the UIM (see Instructions for Use volume 2) ,as well as from the console.
Workflow
1. Select 'Examination' and 'Adjust Ventilation in Bore...‘ from the System menu.The Patient Ventilation Control is displayed.
Fig. 105: Patient Ventilation Control with the text: Current patient ventilation level. Level 5 is recommended. Use the<=> and <-> buttons above to modify the patient ventilation level. Refer to the Instructionf For Use for informationabout patient ventilation. |Proceed|

Adjust Ventilation in Bore Workflows Scanning and Planning
Philips MRI 227
Phili
ps H
ealth
care
4598
006
437
51/7
81 *
03/
2014
*7
2. This control displays the current ventilation level and the recommended level.
3. Manipulate the current level by clicking the plus and minus buttons.
4. Click 'Proceed' to close the window.Note that a Patient Ventilation Warning is displayed if the patient ventilation level is belowthe recommended level and a scan is started:
Fig. 106: Patient Ventilation Warning.
Text displayed in warning dialog
The patient ventilation is below the recommended level.Press <Modify...> to modify the patient ventilation.Refer to the Introductions for Use for information about patient ventilation.
Press <Proceed> to proceed with the current patient ventilation.Press <Cancel> to cancel the scan.
The Patient Ventilation Warning requires a deliberate action by clicking one of the followingbuttons:
• Modify...The Patient Ventilation Control is displayed again to modify the ventilation to the recom-mended level.
• CancelThe scan is not started. The Patient Ventilation Warning disappears.
• ProceedThe set ventilation level is accepted. The Patient Ventilation Warning disappears and a scancan be started.
NOTICEOnce Proceed is clicked and ventilation is below recommended level, the set level is acceptedfor the current scan and all subsequent scans of the current patient.The Patient Ventilation Warning will not be displayed anymore for this patient.
With a new patient and ventilation set below recommended level, the Patient VentilationWarning is displayed again when a scan is started.

Workflows Scanning and Planning Delayed reconstruction
228 Philips MRI
Phili
ps H
ealth
care
4598
006
437
51/7
81 *
03/
2014
*7
Delayed reconstructionIn general, MRI scans are automatically reconstructed immediately after their acquisition. How-ever the automatic reconstruction can be switched off, and a manual reconstruction can beperformed instead.
Such a delayed reconstruction can be performed at anytime, and the reconstruction parame-ters can be defined according to the user's personal preference. This offers the possibility togenerate multiple imaging series with different reconstruction settings and compare them oncompletion.
Parameters that can be defined during the delayed reconstruction are e.g. :
• Uniformity,
• Recon voxel size,
• Reconstruction matrix,
• Preset window contrast,
• Multichannel images.
Delayed reconstruction is integrated in the ExamCard overview.
A prerequisite for delayed reconstruction is that raw data are saved during scanning.
Workflow
► Make sure that the parameter 'Save raw data' is enabled in the scan where delayed recon-struction is to be used.
This postproc parameter can be set to 'Yes' or 'No'. ’Yes’ will save the raw data and allow fordelayed reconstruction.
► After scan completion, right-click on the scan in the List View.
► Select 'Reconstruction' and 'Delayed Reconstruction' from the right-mouse menu.
A Delayed Reconstruction processing step is automatically added to the current ExamCardunder the corresponding scan.

Delayed reconstruction Workflows Scanning and Planning
Philips MRI 229
Phili
ps H
ealth
care
4598
006
437
51/7
81 *
03/
2014
*7
Fig. 107: Adding a Delayed Reconstruction processing step to the current ExamCard. 1: Scan to add delayed recon-struction to. 2: (Extract of) Right-mouse menu. 3: 'Reconstruction' option. 4: 'Delayed reconstruction' option. 5: De-layed Reconstruction processing step is added to the ExamCard.
► Rename the delayed recon processing step so that it can easily be identified.
► Double-click the delayed recon processing step.
The Delayed Recon Parameter Editor opens with the subset of parameters available for de-layed reconstruction.
► Edit the parameters as usual in the ExamCard environment.
The user interface is identical to the ExamCard Parameter Editor.
► Click 'Accept' to confirm the parameters.
► To start the reconstruction, click the 'User Specified Pause' icon in the delayed recon proc-essing step.
Delayed reconstruction is performed as background process and doesn't affect the perform-ance of the system, e.g. the acquisition of further scans.
Fig. 108: Click 'User Specified Pause' icon to start the reconstruction. 1: click the icon first, 2: then click the emptyspace under the arrow.
Reuse of Delayed Reconstruction processing steps
Once a Delayed Reconstruction processing step is defined, it can easily be reused:
• Simply drag and drop it to another scan in the same ExamCard.
• Or right-click on the source to copy this step,

Workflows Scanning and Planning Arterial Spin Labeling (ASL)
230 Philips MRI
Phili
ps H
ealth
care
4598
006
437
51/7
81 *
03/
2014
*7
and then right-click on the destination scan to paste it.
It is recommended to rename copied processing steps immediately for ease of identification.
NOTICEYou can also copy/paste or drag/drop a delayed recon processing step to another ExamCard inthe Hospital dababase.
Arterial Spin Labeling (ASL)Arterial Spin Labeling (ASL) is a method to obtain brain perfusion imaging without the use ofcontrast agent. ASL uses magnetically labeled blood water in the arterial blood stream as anendogenous trace.
The two major parts of ASL are labeling/control. Perfusion images are generated by subtractingthe control images from the label images. Perfusion estimation relies on the signal changes(1%-2%).
Additionally it is possible to measure the perfusion at multiple time points after labeling, this iscalled multiphase ASL. In this case the same area is imaged multiple times after labeling (or con-trol) and multiple perfusion images result.
Applications
Typical applications are cerebral perfusion studies.
Properties of an ASL scan
An ASL scan consists of the following parts:
1. saturating the imaged area (pre- and postsaturation)
2. labeling / control (inverting spins)
3. read-out, possibly repeated multiple times
4. repeating steps 1-3 to gain SNR
PresaturationLabeling / Control Postsaturation 4 Read-out
Ph 1 Ph 2 Ph 3 Ph 4
CycDur
PhIntTD 1TD 2TD 3TD 4
1 2 3
Fig. 109: ASL complete sequence. 1: Presaturation, 2: Labeling / Control, 3: Postsaturation, 4: Read-out, TD1-TD4:Trigger Delay 1 - 4, Ph1-4: Phase 1 - 4, PhInt: Phase Interval, CycDur: Cycle Duration.

Arterial Spin Labeling (ASL) Workflows Scanning and Planning
Philips MRI 231
Phili
ps H
ealth
care
4598
006
437
51/7
81 *
03/
2014
*7
Labeling
During labeling, the spins are inverted by a single hyperbolic secant RF pulse During control,two RF pulses are used with the total power being equal to the RF pulse used during labeling.After labeling the imaged area can be saturated again using a simple single RF pulse.
The area which needs to be labeled is depicted by the white slab visible on screen when ASL isenabled.
Read-out
After a delay time in which the labeled spins perfuse into the brain any imaging technique canbe used. Usually a fast technique such as single-shot EPI is used; this can be repeated multipletimes using the same mechanism as used in multiphase cardiac imaging. This is controlled onthe motion page by the parameter “Multiphase ASL”, where the number of phases and thephase interval can be specified. The total label or control experiment duration is controlled bythe parameter “Cycle duration”.
Postprocessing
Evaluation of the scan can be done with the ’Image Algebra’ package.
New imaging series can be easily generated and stored.
Analyses are stored in the current ExamCard and performed automatically when the ExamCardis executed again. For more information, see chapter on ExamCards, Inline Processing.
Workflow ASL
MultiSlice Single-Phase or MultiSlice MultiPhase ASL
1. Start a normal survey (and reference) scan.
2. Select a single-phase or a multiphase ASL protocol.
3. Plan the scan.
Fig. 110: Planning ASL scan. The white band is the label area, a thickness of 100 mm to 130 mm is recommended. Alabel gap of 20 mm to 25 mm is fine.
4. Start the ASL scan.
5. After completion, select the ASL scan and open the DynamicView / ImageAlgebra package.

Workflows Scanning and Planning Arterial Spin Labeling (ASL)
232 Philips MRI
Phili
ps H
ealth
care
4598
006
437
51/7
81 *
03/
2014
*7
6. Select the ’ASL subtraction’ function to calculate ’Labeled’ image type minus ’Control’image type.
Subtraction: (B-A)
Addition: (A+B)Subtraction: (B-A) Subtraction: (A-B)Relative Subtraction: (B-A) / (A+B) / 2) *100 Relative Subtraction: (A-B) / (A+B) / 2) *100 Ratio: (B/A) *100
Ratio: (A/B) *100CumulationMagnetic Transfer Coefficient: ((B-A) / B *100)Magnetic Transfer Coefficient: ((A-B) / A *100)ASL Subtraction: (B-A)
Fig. 111: Select the algorithm from the drop-down menu, in this case ASL subtraction (Example of screen in English).
The images from the ASL sequence are automatically loaded in the corresponding viewports. Allthe phase and slice images are automatically loaded with their default viewing settings.
3 4
1 2 1a
1b
Fig. 112: Layout of ASL subtraction window (right) with Image Algebra control area for different scans (left).
1 Image Algebra control area.
This control area looks slightly different a MultiSlice SinglePhase scan (see 1a) compared toa MultiSlice MultiPhase scan (see 1b).
2 Preview: Perfusion image = Label image (B) minus Control image (A)
3 Control image type = A
4 Label image type = B

Arterial Spin Labeling (ASL) Workflows Scanning and Planning
Philips MRI 233
Phili
ps H
ealth
care
4598
006
437
51/7
81 *
03/
2014
*7
NOTICEDo NOT change the setting of any of the corresponding sliders.
ASL subtraction comes up with the correct settings for weighting factor, slices and phases.
1. Click |Generate| to generate ASL-subtracted image series.
2. Select the newly generated series from the Thumbnail View to view the data.
Examples of ASL perfusion images
Fig. 113: Multiphase ASL scan (FFE-EPI/ Perfusion) where s stands for the slices and p for the phases.

Workflows Scanning and Planning BolusTrak Workflow
234 Philips MRI
Phili
ps H
ealth
care
4598
006
437
51/7
81 *
03/
2014
*7
Fig. 114: FE-EPI/Perfusion single-phase scan.
BolusTrak WorkflowBolusTrak is a contrast-enhanced MRA technique. It provides fluoroscopic information of thevessels. It needs to be combined with a CE-MRA scan. The BolusTrak functionality offers thepossibility to track the bolus and immediately start the CE-MRA scan on bolus arrival. Part ofthe realization are real-time reconstruction and -viewing.
1. Select a BolusTrak ExamCard.
2. Plan this ExamCard.
3. Start the ExamCard.
Preparation-only scan or Pre-contrast scan will be performed.
Then the ExamCard will pause.
4. Start the contrast agent injection as a bolus simultaneously with the 2D real-time recon-structed scan. |Resume| the ExamCard to do so.
5. Use the ’Fast Next Scan’ functionality
• to interrupt the 2D real-time reconstructed scan.
• to start the post-contrast scan at bolus arrival in vessels of interest.
6. Postprocessing, e.g. subtraction of pre-contrast mask, Maximum Intensity Projection (MIP)or TID.
The total procedure can be run first without contrast agent (this will take only 1 minute) tomake the patient familiar with the examination procedure.

Workflows MobiTrak and MobiFlex Workflows Scanning and Planning
Philips MRI 235
Phili
ps H
ealth
care
4598
006
437
51/7
81 *
03/
2014
*7
Workflows MobiTrak and MobiFlexMobiTrak and MobiFlex are CE-MRA techniques using moving table technique with slowly in-fused contrast agent.
Two acquisitions will be performed per station:
• pre-contrast (mask)
• post-contrast (contrast-enhanced)
The pre-contrast scan will be subtracted from the post-contrast scan to eliminate signal frombackground tissue.
MobiTrak and MobiFlex provide a large coverage in FH-direction as multiple overlapping sta-tions in FH-direction will be scanned sequentially which have been planned as a single volume.
Applications
Peripheral vessels from abdominal aorta down to pedal arch.
Patient safety
NOTICEPatient observation during table motion must never be neglected.
NOTICEIf patient safety is endangered during table top movement, the tabletop must be stopped im-mediately.
In a MobiTrak examination the tabletop will move over large distances. Extra attention mustbe paid to guarantee patient safety.
WARNINGBefore starting a scan which initiates tabletop movement, always check that nothing can getcaught or hit during tabletop movement.
Check patient, patient extremities, clothing, equipment and accessories. Guide cables and in-travenous lines. This especially applies when Transmit/Receive coils are used, which are con-nected to the T/R socket below the left UIM.
All instructions listed below must be followed strictly:
• Use ankle, knee and arm support in a correct manner.
• Secure intravenous lines to avoid lines being caught during table movement.

Workflows Scanning and Planning Workflows MobiTrak and MobiFlex
236 Philips MRI
Phili
ps H
ealth
care
4598
006
437
51/7
81 *
03/
2014
*7
• Connect patient alarm and hand it to the patient.
• Remove all RF coils from the tabletop before a MobiTrak/MobiFlex scan is started.
Table movementIt is important that all stacks are scanned in the isocenter of the magnet to avoid parts of theFOV getting cut off by the shutter. Therefore table movement between stacks is mandatory. Itcan be initiated by:
• |Proceed| on the operator's console/keyboard.
• |Travel to scanplane| at the operator’s console.
• |Start scan| at the magnet.
• With the tumble switch at the magnet.
NOTICETable top movement can be stopped by pressing |Stop scan|.
Table top movement can be resumed by pressing |Proceed| or |Travel to scanplane| or |Startscan| again.
Total table stroke is computed at the start of the scan
The total travel distance for the tabletop to reach optimal positions for all scans and all stacks,is computed at the start of the ExamCard and displayed on the Scan safety message(s) screen.
If the table can not move in far enough for one of the stacks to reach the position for optimalimage quality, the scan will not start. The operator has to adjust the feet-head offcenter ofstack A or reposition the patient.
Workflow MobiTrak1. Patient preparation and patient and coil positioning
2. Transverse survey scan in three stacks
• Table movement during stacks.
• Automatically calculated MIPs.
3. Contrast bolus timing scan and test bolus injection
• Dynamic coronal scan (for visualization of entire aorta) started together with the testbolus injection.
• To be planned just before the abdominal aortic bifurcation. Use the |Reset| geometryfunction.
• To determine the acquisition delay between the contrast injection and the second dy-namic scan. It equals the contrast bolus arrival time just before the abdominal aortic bi-furcation.

Workflows MobiTrak and MobiFlex Workflows Scanning and Planning
Philips MRI 237
Phili
ps H
ealth
care
4598
006
437
51/7
81 *
03/
2014
*7
4. Perform MobiTrak scan first dynamic
• Acquires pre-contrast images in three stacks with table movement.
• To be used for subtraction.
5. Start of contrast agent infusion
6. MobiTrak scan second dynamic
• To be started after the acquisition delay (see contrast bolus timing scan).
• Acquires contrast-enhanced images in three stacks with table movement.
NOTICEAlways allow automatic table movement.
In this way, the scan will be started as soon as the table has reached the optimal position with-out prompting for an additional |Proceed|.
7. Postprocessing MobiFlex
• MIP calculation of the three stacks and combination of the MIPs.
NOTICEUndo subtraction can be done by means of a weighting factor of +1 after a subtraction havingbeen performed with a weighting factor of -1.
MobiTrak scan
The MobiTrak scan has the following characteristics:
• Two dynamic scans, each consisting of three stacks: Stack A: lower legs, Stack B: upper legs,Stack C: abdomen. Abdominal stack with breathhold commands.
• To be planned on sagittal MIP’s of survey scan. Easiest is to align the stacks and define astack overlap.
• Scan time per stack: 20 s to 30 s. If scan time has to be reduced, reduce the number of slicesand increase the slice thickness.
Workflow MobiFlex
MobiFlex ExamCard
The table summarizes the scans of a typical MobiFlex ExamCard with e.g. their item propertiesand their GeoLinks.

Workflows Scanning and Planning Workflows MobiTrak and MobiFlex
238 Philips MRI
Phili
ps H
ealth
care
4598
006
437
51/7
81 *
03/
2014
*7
Scan EC Item properties Geo Link Part of anato-my
Comparable to
1 A Lower Legs Scan 1, dyn=1
2 A Upper Legs Scan 2, dyn=1
3 A Abdomen Scan 3, dyn=1
4 BolusTrak scanin order totrack the bolusarrival
5 A Abdomen Scan 3, dyn=2
6 A Upper Legs Scan 2, dyn=2
7 A Lower Legs Scan 1, dyn=2
Workflow
1. Patient preparation and patient and coil positioning
2. Setup or select a MobiFlex ExamCard including Geometrical Links.
• 6 scans for 3 stations (8 scans for 4 stations on 3.0T) plus a BolusTrak scan.
All stations need to have the same GeoLink (same bookmark behind the sequence).
• BolusTrak scan prior to post-contrast scans (injection enabled).
• Abdominal stack with breathhold commands.
• Manual start for post-contrast scans.
NOTICEIf you like to have pre-contrast source images, integrate your subtraction postprocessing(Image Algebra) into your ExamCard. Three types of images will be available.
To do so, disable the imaging parameter ’Immediate subtraction’ in the sequence.
3. Perform the transverse survey scan in three stacks
• Table movement during stacks.
• Automatically calculated MIPs.

Workflows MobiTrak and MobiFlex Workflows Scanning and Planning
Philips MRI 239
Phili
ps H
ealth
care
4598
006
437
51/7
81 *
03/
2014
*7
4. Fuse the automatically calculated MIPs with MobiView.
5. Plan the scans on fused sagittal MIP’s of the survey scan.
• Use the |Scan Align| button of the ExamCards window to align the scans (comparableto ’Stack Align’ function).
• For shorter scan times, reduce the number of slices and increase the slice thickness.
6. Perform MobiFlex scans pre-contrast
• Acquires pre-contrast images in three scans with table movement.
• To be used for subtraction.
7. Perform the BolusTrak scan with the start of the contrast agent infusion.
8. Check the bolus arrival in the |Autoview| window.
9. Press 'Next Scan' upon arrival of the bolus in the abdominal aorta to abort the BolusTrakscan.
MobiFlex scans post-contrast are automatically started due to the ’Fast next scan’ function-ality.
• Acquires contrast-enhanced images in three scans with table movement.
NOTICEAlways allow automatic table movement. In this way, the scan will be started as soon as thetable has reached the optimal position without prompting for an additional |Proceed|.
10. Postprocessing MobiFlex:
MIP calculation of the three scans and combination of the MIPs.
NOTICEUndo subtraction can be done by means of a weighting factor of +1 after a subtraction havingbeen performed with a weighting factor of -1 .
Important: modifying the MobiFlex ExamCard
If the MobiFlex ExamCard is modified such that the amount of data on a certain station increas-es too much, the message "This can lead to discontinuities between stations" might show up.This message indicates that discontinuities between stations could appear which might be visi-ble in the fused images.
To solve this problem,
• reduce the reconstruction matrix.
• set the reconstruction mode from ’real-time’ to ’immediate’.

Workflows Scanning and Planning Workflows MobiTrak and MobiFlex
240 Philips MRI
Phili
ps H
ealth
care
4598
006
437
51/7
81 *
03/
2014
*7
Furthermore, a multiple station CE-Angio could be acquired with different resolutions at the dif-ferent stations. In this case, different geometry corrections might be used which may result inslight displacements of vessels between the stations.
Postprocessing MobiFlex
Calculate Multistation MIPs
1. Select one of the pre- or post-contrast scans.
2. Click on the ’Volume View’ button.
3. Select the left upper view port.
4. Select the 2nd dynamic (subtracted images).
5. Click on the ’Generate series’ button in order to calculate a set of new images out of theoriginal data set -> a new window pops up.
6. Click |Stack| to define orientation, stack type, projections, radial axis and angle, e.g. coro-nal orientation, radial, FH axis, 9 projections, 12 degrees.
7. Click |Propagation| and select propagations to "All stations" and "Single Axis".
8. Click |Geometry| with an "Angulation relative to: Magnet".
9. Click |Generate| to run the protocol.
10. View the resulting images.
11. Hardcopies can be performed in the usual way.
Viewing these MIPs with MobiView
Use the MobiView package to view these MIPs. The MobiView package is described in detail inthe Total Body Imaging chapter.
Fusing multiple stations created by the MobiFlex/MobiTrak package could lead to a mismatch inthe connection between the stations. The area of overlap is indicated by brackets in the Mobi-View application. In case of doubt, it is best to use the ’hard cut’ fusing algorithm.
Integration of BolusTrak with MobiTrak/MobiFlexWith the availability of BolusTrak software, the bolus arrival time can be synchronized with thestart of the 3D MobiTrak/MobiFlex scan.
Prepare the following scans:
1. 3D MobiTrak (no contrast)
2. 2D BolusTrak scan
3. 3D MobiTrak (contrast-enhanced)
Set the parameters to the values as listed in the table below:

Interactive Scanning Workflows Workflows Scanning and Planning
Philips MRI 241
Phili
ps H
ealth
care
4598
006
437
51/7
81 *
03/
2014
*7
Parameter subset Parameter Required setting
Dyn/ang CE profile order / stack • Yes
Dyn/ang Order for stack A,B,C • low-high, low-high, low-high
Geometry Stack scan order • descending
Postproc Reconstruction mode • delayed
Postproc Preparation phases • full
Tab. 9: Scan 1: 3D MobiTrak (no contrast)
Parameter subset Parameter Required setting
Dyn/ang CE profile order / stack • Yes
Dyn/ang Order for stack A,B,C • low-high, low-high, low-high
Geometry Stack scan order • descending
Postproc Reconstruction mode • immediate
Postproc Preparation phases • auto
Tab. 10: Scan 3: 3D MobiTrak (contrast-enhanced)
Due to the fact that the pre- and post-contrast scans are acquired in two separate scans, sub-traction and MIP images of the subtracted scan are not automatically available, but have to bepostprocessed by the operator after the delayed reconstruction of the pre-contrast scan is per-formed.
NOTICEFor successful subtraction it is important to keep all geometry offcenters identical for pre- andpost-contrast scan.
Best way to ensure this is to plan the pre-contrast scan and use the copy scan function for thepost-contrast scan.
Interactive Scanning Workflows
Interactive Scanning parameter► Click the 'Geometry' tab to access the geometry parameter subset.
► Set the parameter 'Interactive Positioning' to 'Yes' to enable interactive scanning.
All geometries that exist in ExamCards or are entered before Interactive Scanning is started,show up in Interactive Scanning (even if all scans are deleted again before Interactive Scanningis started).

Workflows Scanning and Planning Interactive Scanning Workflows
242 Philips MRI
Phili
ps H
ealth
care
4598
006
437
51/7
81 *
03/
2014
*7
Workflow► Start an interactive scan.
During preparation the ’Interactive viewer’ window pops up.
► Click |Scan pars...| in the ‘Interactive viewer’ window.
The scan parameters window pops up.
► Change the scan parameters.
The modified parameter settings will be used for the acquisition of the next image of thesame scan.
► Click on |Rescan| to rescan the image or scan a new image with modified parameters.
► Store the geometry under a certain name or store an image in the patient database.
► Click |Next scan| to stop the interactive scan.
The next scan in ListView will be started automatically and, if the ’used geometry’ parame-ter is set, will take over the previously stored geometry.
More about Interactive Scanning► Right-click in the Interactive viewer window
• To retrieve the current scan parameters and pass them to the scanner
• To scan an image and display the new image in the current viewport.
In single mode a right-click is necessary while in continuous mode every change is applied im-mediately.
Different ways of how to scan a new image
• By modifying the yellow intersection lines; Click/drag the offcenter and angulation handlesof the yellow intersection line displaying intersections between images in different view-ports.
• By clicking |Tra|, |Sag|, or |Cor| to scan a transverse, sagittal, or coronal image throughthe offcenter of the current image.
• By clicking |Orthog. flip| to scan an image orthogonal to current one.
• By clicking |Tilt| and define the tilt ’Angle’ to scan a tilted image.
• By clicking |Pull/push| and define the step size in the ‘Step’ field (in mm) to scan a parallelimage.
• By clicking |Inplane transf| to scan a translated or rotated image.
– Move the red cross to where the offcenter of the next image should be.
– Rotate the cross to define the rotation for the next image.
• By using 3-point Planscan: Click |P1*| and defining the P1 point. Drag P1 for repositioning.
– Click |P2*| and |P3*| to define P2 and P3 in a similar way.

Interactive Scanning Workflows Workflows Scanning and Planning
Philips MRI 243
Phili
ps H
ealth
care
4598
006
437
51/7
81 *
03/
2014
*7
– Click |Scan| to scan an image through P1, P2 and P3 with its offcenter in the centre ofgravity of the triangle.
Store geometry for later use
► Click ‘geom’ |Store|.
All geometries will be stored in ExamCards. An asterisk after the name indicates that a ge-ometry was already stored. If the slot was already filled it will be overwritten.
Scan with stored geometry
► Select a geometry.
Store image
► Click ‘image’ |Store| to store the current image with its geometry, window and view set-tings etc. (without graphical overlays) in interactive memory.
The image is also stored in the patient database (within current scan).
Measure the distance between two points
► Click |Distance|, define two points on the same or on different images.
Display conventions
Radiol. view
• Corresponds to looking towards the lower left front side of the patient:
– Transverse image: "A" near the top,"L" on the right,
– Sagittal image: "H" near the top, "P" on the right,
– Coronal image: "H" near the top, "L" on the right.
Ignore view
• Results in a view "as close as possible" to the previous image.
Useful when rotating an image plane to prevent a sudden ‘flip’ of the orientation.
User defined view
• Means that viewing directions and in-plane rotations can be redefined through the mirrorand rotate buttons.
Intersection mode button
• Allows the user to toggle between three different modes:
– Current image shown on other images (default mode). Each non-current image is over-laid with an yellow intersection line, indicating how the current image intersects thenon-current image.
– No intersection lines shown.
– Non-current images shown on current image.

Workflows Scanning and Planning Interactive Scanning Workflows
244 Philips MRI
Phili
ps H
ealth
care
4598
006
437
51/7
81 *
03/
2014
*7
The current image is overlaid with at most three intersection lines in different colors in-dicating how the current image is intersected.
Redefine the patient coordinate system with |Rotate view|
• Used to redefine the AP and RL axes of the patient coordinate system, in case the patientdoes not lie exactly aligned with the L,P,H axes in the scanner.
With a transverse image in the current viewport:
► Click |Rotate view|.
A red cross appears representing the (AP, RL) axis pair.
► Rotate the cross to define the new axes for the patient coordinate system.
► Right-click to store the orientation.
The stored definition is used for scanning and displaying subsequent images.
► Click |Rotate view| again and right-click in the viewport to reset the coordinates to the orig-inal view.
NOTICEOnly if the current image is really transverse (with angulations (0,0,0)), the patient related ax-es relate to the system axes by rotation around the FH axis only.
The effect is only visible in the orientation of the images displayed within the Interactive View-er.
If these images are stored in the database and loaded outside the Interactive session, the re-defined orientation is not used.
‘Previous image’ and ‘Next image’
In the current viewport up to 16 previous images can be retrieved even if these images werenot stored. ‘Image’ |Previous| and ‘image’ |Next| are only active in ‘Single image’ mode.
Hide the ‘Interactive viewer’ window
For switching to another viewing context the interactive viewer window must be hidden byclicking the |Interactive| button. It can be mapped to the foreground by once again clicking the|Interactive| button.
Toggling Interactive switches back and forth between normal planning and interactive until |Next| or |Stop Scan| is pressed.
NOTICEWhen applicable, warnings are displayed in the ‘Scanner Status’ window.

Interactive Scanning Workflows Workflows Scanning and Planning
Philips MRI 245
Phili
ps H
ealth
care
4598
006
437
51/7
81 *
03/
2014
*7
Interactive scanning on ERDThe Examination Room Display (ERD) is a 1280 x 1024 monitor, situated in the examinationroom. The monitor of the operator console (OC) has a 1920 x 1200 resolution. The ERD alwaysdisplays a rectangular subwindow (1280 x 1024) of the OC monitor.
The ERD is equipped with a trackerball that supports the panning (movement) of the OC con-tents in the ERD-window. The following picture shows the relative sizes of OC and ERD.
Fig. 115: Relative sizes of OC and ERD (red frame indicates size of ERD).
During Interactive scanning, the 2nd, 3d and 4th viewport are only partly displayed on the ERD.Additionally, in specific examinations (like biopsy guidance) it is required to display only the 1stviewport as a full-size image on the ERD.
Three different screen layouts can be selected to optimize the Interactive display.
• original layout, optimized for display on the OC,
• full-screen display of 1st viewport, optimized for ERD,
• original layout, optimized for display on ERD.
The following images indicate the layout as presented on the OC and on the ERD (red rectangle)if layout 2 or 3 are selected:

Workflows Scanning and Planning Planning the Cardiac Views
246 Philips MRI
Phili
ps H
ealth
care
4598
006
437
51/7
81 *
03/
2014
*7
Fig. 116: Top: full-screen layout of 1st viewport. Bottom: Original layout optimized for ERD.
Tips and Hints
Complete visualization of a duct
To check if e.g. a duct is completely visualized in a slice, it is recommended to scan with a 90o
flipped slice orientation. On the resulting slice, the duct can be seen in the third dimensionmaking optimal planning possible.
Double-oblique planning
To define a view orthogonal to two other views, it is recommended to
• Push the first oblique to another viewport,
• Define the second oblique with 90o tilt on this first oblique,
• Push that to another viewport,
• Define the final view with 90o tilt on the second oblique,
• Check if the yellow intersection line is perpendicular on both orthogonal views.
Planning the Cardiac ViewsPlanning the cardiac views is complex because angulations in the 3 different directions could benecessary to visualize the different connections between chambers.
Important is to follow a systematic way to create the different views. Always plan perpendicularon the previous scan.
Useful tools to facilitate planning are:
• the Interactive Scanning Tool

Planning the Cardiac Views Workflows Scanning and Planning
Philips MRI 247
Phili
ps H
ealth
care
4598
006
437
51/7
81 *
03/
2014
*7
• 3 Points Planscan
• PlanAlign.
Interactive Scanning ToolInteractive scanning (more information, see chapter “Interactive Scanning” on page 47 andchapter “Interactive Scanning Workflows” on page 241) is especially useful for cardiac imaging,because the required geometry angulations can be found in real time for the different cardiacviews.
An interactive scan has to fulfil the following prerequisites:
• One slice only
• Scan mode 2D, M2D or MS
• Cardiac triggering possible
• One heart phase only
• No dynamic scan
• Any scan technique as SE, FFE, TFE, TSE, GRASE or EPI.
When the correct planes have been found and saved in the interactive scan:
• |Next scan| has to be clicked in order to start the next scan in List View which is the diag-nostic scan (e.g. a breath-hold scan). The geometry parameters are automatically takenover.
• |Stop Scan| has to be clicked to plan the next scans with use geometry (the stored geome-try parameters within interactive).
For cardiac applications, interactive scanning should be performed in continuous mode which isalso referred to as real-time mode.
NOTICETSE is not used due to saturation effects using continuous mode.
NOTICE3 Points Planscan can also be used during interactive scanning.
NOTICEInteractive scanning can be combined with SENSE. Use phase oversampling (P os factor) toavoid SENSE backfolding.

Workflows Scanning and Planning Planning the Cardiac Views
248 Philips MRI
Phili
ps H
ealth
care
4598
006
437
51/7
81 *
03/
2014
*7
3 Points Planscan (3PPS)3 PPS is a tool which helps to define an irregular plane which is determined by the placement ofthree points on one or more images of different orientations.
It can be used in any application, however it is especially useful in planning aortic arch and cor-onary arteries.
Workflow
► In the Planscan window, click |3PPS|.⇨ The 3 PPS window is overlaid.
► Place the three points on any of the three images selected in the Planscan view port.
► To change the positioning of the points, click on |P1 or P2 or P3|and and then click on thenew position in Planscan.
► To restart click |Off|.
► Click |Compute plane| to perform the 3 Points Planscan
► Click |3PPS| again to close the 3PPS window.
► The angulations from the 3 PPS are taken over and displayed. Proceed with routine plan-ning.
PlanAlignPlanAlign is developed for applications where double oblique scans are made with large angula-tions in e.g. cardiac scanning. It is a powerful tool to avoid in-plane rotation and to avoid SENSEartifacts. When switched to yes, any modification of the angulations will result in a recalculationof the angulations such that the resulting images show no in-plane angulation.
• Transverse scans are aligned such that the horizontal image direction (RL) is in a non-angu-lated coronal plane.
• Sagittal scans are aligned such that the vertical image direction (FH) is in a non-angulatedcoronal plane.
• Coronal scans are aligned such that the vertical image direction (FH) is in a non-angulatedsagittal plane.
• Double angulated coronal scans tending to sagittal are aligned like sagittal scans. Thismeans that the scans are aligned such that the vertical image direction (FH) is in a non-an-gulated coronal plane.
NOTICEWhen the geometry has been planned using InterActive scanning, PlanAlign will be set to ’No’.

Planning the Cardiac Views Workflows Scanning and Planning
Philips MRI 249
Phili
ps H
ealth
care
4598
006
437
51/7
81 *
03/
2014
*7
Basic ViewsBelow a poster will illustrate how to obtain the different basic views.
Fig. 117: Cardiac Views where S stands for Setup, C for Chambers & Outflow and V for Valves.
► Start with a transverse image through the left ventricle.
► Define the RAO (Right Anterior Oblique) or VLA (Vertical Long Axis) view on the transverseimage by selecting a line through apex and centre of mitral valve.
► Define an approximate Four Chamber or HLA (Horizontal Long Axis) view on the RAO by de-fining a line through the apex and centre of the mitral valve.
► Define the Short Axis view, three methods are available:

Workflows Scanning and Planning Planning the Cardiac Views
250 Philips MRI
Phili
ps H
ealth
care
4598
006
437
51/7
81 *
03/
2014
*7
Place a line orthogonal to the (long axis) line through the apex and the centre of the mitralvalve (this is the most accurate method).
Place a line parallel to the mitral valve (this method makes it easier to decide whether toinclude the basal slice/s during post-processing).
Place a line orthogonal to the septum (this is the best method for Right Ventricle view).
► From the Short Axis view, the true Four Chamber view can be defined by placing a linethrough the centre of the Left Ventricular Cavity and the inferior margin of the right ventri-cle.
Outflow Tracts
Right Two Chamber (R2CH) view
• can be derived from the true Four Chamber view.
• can be defined by placing a line through the tricuspid valve parallel to the septum.
Left Two Chamber (L2CH) view
• can be derived from the true Four Chamber view.
• can be defined by placing a line through the apex and the center of the mitral valve.
Left Ventricular Outflow Tract (LVOT)
• can be derived from the true Four Chamber view.
• An additional basal short axis scan can be defined which is used to plan the Left VentricularOutflow Tract (LVOT) by placing a line through the Left Ventricle and Aorta.
Right Ventricular Outflow Tract (RVOT)
• is best planned on a transverse view that shows the pulmonary artery valves.
Pulmonary valve
• is planned on the RVOT by placing a line through the pulmonary valve seen already on theRVOT view.
Tricuspid valve
• is planned on the R2CH by placing a line through the tricuspid valves seen on the R2CHview.
Mitral valve
• is planned on the L2CH by placing a line through the mitral valves already seen on the L2CHview.
Aortic valve
• is planned on the LVOT by placing a line through the aortic valves already seen on the LVOT.

Cardiac Function Workflows Scanning and Planning
Philips MRI 251
Phili
ps H
ealth
care
4598
006
437
51/7
81 *
03/
2014
*7
Cardiac AnatomyImage sets (Black blood or white blood in 3 orientations: Sag, Cor, Tra).
Abbreviation Explanation
AA Ascending aorta
Arch Aortic arch
DA Descending aorta
IVC Inferior vena cava
LA Left atrium
LB Left bronchus
LPA Left pulmonary artery
LPV Left pulmonary vein
LSPV Left superior pulmonary vein
LV Left ventricle
MPA Main pulmonary artery
PA Pulmonary artery
RA Right atrium
RB Right bronchus
RPA Right pulmonary artery
RPV Right pulmonary vein
RV Right ventricle
SVC Superior vena cava
Tab. 11: List of Abbreviations
Cardiac FunctionCine scans are typically used to study wall motion and ventricular function. A variety of scanmethods are available for cine scans. However, balanced FFE is the preferred method forbreath-hold cine scans.
Stress-Test (Physical or Dobutamine)
The workflow as presented here is based on the standardized acquisition guidelines by theSCMR (Society for Cardio-vascular Magnetic Resonance). More information can be found on thewebsite of the SCMR: www.scmr.org

Workflows Scanning and Planning Cardiac Function
252 Philips MRI
Phili
ps H
ealth
care
4598
006
437
51/7
81 *
03/
2014
*7
The intention of this section is only to give an illustration of how the workflow may look like inclinical practice. Philips Healthcare cannot take liability for dose regimen, infusion schemes etc.
Coronary artery disease can result in inducible ischemia. One of the first signs for myocardialischemia is myocardial wall motion abnormality that occurs much earlier than ECG changes oranginal pain. Cine scans acquired under stress conditions can therefore help to identify theseinducible ischemic areas.
The left ventricle is divided into 17 segments following the standards suggested by the Ameri-can Society of Echocardiography. For all the segments the wall motion is classified as normal,hypokinetic, akinetic or dyskinetic.
1
17
2 67
8 12
15104
9 113 5
13
14 16
1714 16
9 12
3 6
1
7
13
17 1510
4
SA4CH LA
ANT
INF
Fig. 118: Segmentation of the left ventricle according to the standards of the American Society of Echocardiographyin the views: SA - Short Axis, 4CH - Four Chamber, LA - Long Axis.
Label Heart segment Label Heart segment Label Heart segment
1 basal anterior 7 mid anterior 13 apical anterior
2 basal anteroseptal 8 mid anteroseptal 14 apical septal
3 basal inferoseptal 9 mid inferoseptal 15 apical inferior
4 basal inferior 10 mid inferior 16 apical lateral
5 basal inferolateral 11 mid inferolateral 17 apex
6 basal anterolateral 12 mid anterolateral
Tab. 12: Labeling of Heart Segments
WorkflowAll 17 segments can be covered using a combination of three SA slices, a 4CH slice and a L2CHslice.
Step Scan / Action
1 Survey scan
2 L2CH- and 4CH-scans
3 Three-slice SA scan
4 Dobutamine infusion
5 Three-slice SA-, L2CH- and 4CH-scans
6 Dobutamine infusion

Cardiac Function Workflows Scanning and Planning
Philips MRI 253
Phili
ps H
ealth
care
4598
006
437
51/7
81 *
03/
2014
*7
Step Scan / Action
7 Three-slice SA-, L2CH- and 4CH-scans
8 Next stress levels: Repeat the steps 7 and 8 for each stress level.
Tab. 13: Workflow Overview
Workflow Step-by-Step
► Perform the survey scan.
► Plan and perform the L2CH- and 4CH-scans following the approach as described in the sec-tion Planning the cardiac views .
► Plan the three-slice SA scan on the 4CH view such that the most apical slice covers seg-ments 13-16, the mid slice covers segments 7-12 and the most basal slice covers segments1-6.
• Set the number of slices to five for planning purposes only.
• Select an end-systolic image.
• Position the slices: first one on apex, fifth through mitral valve.
• Set the number of slices back to three: leaving the slice position and slice gap un-changed, these three slices now cover the desired cardiac segments.
► Perform this scan.
Fig. 119: Planning three SA slices on end-systolic 4CH view.
► Start the Dobutamine infusion to stress the patient’ s heart.
► Repeat the Three-slice SA-, the 4-CH- and the L2CH-scans after 3 min. of infusion.
► Increase the Dobutamine infusion rate to reach the next stress level.
► Repeat the Three-slice SA-, the 4-CH- and the L2CH-scans after 3 min. of infusion.
► Repeat the two previous steps for each stress level.
► If at the maximum stress level the sub-maximum age-predicted heart rate (= 0.85 x (220 -age)) is not reached, give atropine and repeat the three scans again.

Workflows Scanning and Planning Myocardial Perfusion (Temporal Enhancement)
254 Philips MRI
Phili
ps H
ealth
care
4598
006
437
51/7
81 *
03/
2014
*7
NOTICEThe patient’s cardiac frequency will most likely vary depending on the stress level.
For each stress level the cardiac frequency should be adjusted.
When the TFE shot mode is set to ‘default’ this change in heart rate will not lead to a changein breath-hold duration or number of phases.
Make sure that the cine scans tolerate a certain variation in heart rate. This can be achievedby setting the R-R window range to 25%, 35%.
Myocardial Perfusion (Temporal Enhancement)The workflow as presented here is based on the standardized acquisition guidelines by theSCMR (Society for Cardio-vascular Magnetic Resonance). More information can be found on thewebsite of the SCMR: www.scmr.org
The intention of this section is only to give an illustration of how the workflow for myocardialperfusion may look like in clinical practice. Philips Healthcare cannot take liability for dose regi-men, infusion schemes etc.
About Myocardial PerfusionMRI can be used to analyze myocardial perfusion using first pass contrast passage enabling thedetection of perfusion abnormalities.
To perform good quality perfusion scans with a high temporal resolution, dynamic slices haveto be acquired as quickly as possible. In order to carefully study the contrast uptake all dynamicscans belonging to one slice should be performed at the same moment within the cardiac cycle.That is the reason that cardiac perfusion scans are cardiac triggered.
Obvious compromises have to be made regarding the image quality, or more specific, spatialresolution. The aim is now to find the right balance between the number of slices, the spatialresolution and the temporal resolution.
Following the standards suggested by the American Society of Echocardiography the left ventri-cle can be divided into 17 segments.
A three-slice approach as presented in the Cookbook is sufficient to cover 16 out of those 17segments: the highest possible spatial resolution is chosen where three slices fit in a singleheart beat. The number of dynamic scans and thus the number of R-R intervals determine thetotal scan time.
The aim of perfusion scanning is to identify inducible ischemia areas which often (in the pres-ence of coronary artery stenoses) only occurs under stress conditions. Therefore the perfusionscan should be done both in rest and during stress, such as pharmacological vasodilatation. Thiscan be achieved using e.g. adenosine or dipyridamole.

Myocardial Perfusion (Temporal Enhancement) Workflows Scanning and Planning
Philips MRI 255
Phili
ps H
ealth
care
4598
006
437
51/7
81 *
03/
2014
*7
Workflow
Survey scan
First a survey scan is performed after which a 4CH view and a L2CH view is performed underrest conditions as described in the section Planning the cardiac views . The three-slice SA scan isplanned such that each slice covers six segments of the left ventricle (See “Stress perfusion"workflow below for more information about slice positioning).
Stress perfusion
The next step is first to perform the stress perfusion. Stress is done first to have the best imagequality for the most important scan since there is no enhancement yet due to earlier contrastinjections. The perfusion scan is planned exactly the same as the three-slice SA scan to cover 16out of the 17 segments. Foldover-artifacts have to be avoided. Therefore it is advised to firstrun the scan without contrast to make sure that no backfolding is present. This is especially im-portant in the case that a (b)TFE SENSE scan is used. If necessary the FOV has to be increased.During the test scan also the breath-hold instruction can be practiced with the patient.
Although adenosine mainly acts as a vasodilator also the heart rate increases. Therefore thescan should be defined such that it will run with higher heart rates. The simplest choice availa-ble is reducing the in-plane resolution. Decreasing the matrix size ensures that all three slicesstill fit into the R-R interval.
Adenosine infusion
After the test scan the infusion of adenosine is started to stress the patient’s heart. In the Cook-book an infusion rate of 140 ig/kg/min is suggested for maximum six minutes. During stress ex-aminations monitoring of the patient is mandatory. Among blood pressure, pulse oximetry andsymptoms also the heart rhythm is monitored.
Contrast injection
The best results for contrast uptake curves are obtained when a short compact bolus injectionis used. The Cookbook suggests a Gd-DTPA contrast dosage 0.05 mmol/kg body weight appliedwith an injection rate of 4 ml/s. A saline flush of 20 ml with the same injection rate is necessaryto facilitate a compact bolus passage.
Performing perfusion scan
The perfusion scan is started 4 minutes after the start of the adenosine infusion.
When the perfusion scan is running and the first images appear in the autoview window thecontrast injection is started.
Carefully the contrast arrival is monitored and at the desired moment a breath-hold instructionis given. The breath-hold command is needed to ease postprocessing afterwards. Ask the pa-tient to hold their breath as long as possible when the contrast agent is to arrive in the rightventricle which in most of the patients happens roundabout after twice inhaling and exhaling. Ifthe patient cannot hold breath anymore, let him/her breathe once and then hold breath again.Alternatively, let the patient breathe shallowly after he/she cannot hold breath anymore.

Workflows Scanning and Planning Myocardial Perfusion (Temporal Enhancement)
256 Philips MRI
Phili
ps H
ealth
care
4598
006
437
51/7
81 *
03/
2014
*7
1:startscan
4:endscan
2:injectioncontrast
3:breath-holdcommand
A: contrastarrival
RV
B: contrastarrival
LVC: enhancement
myocardium
Fig. 120: Perfusion sequence
1 Start scan
2 Injection contrast
3 Breath-hold command
4 End scan
A Contrast arrival RV (right ventricle)
B Contrast arrival LV (left ventricle)
C Enhancement myocardium
Fig. 121: Example of myocardial perfusion scans at rest and at adenosine stress.
Fifteen minutes after termination of the adenosine infusion the heart has recovered from theapplied stress. Then the perfusion scan can be repeated during rest.
Image analysis and postprocessing
After excluding the left ventricular cavity and the pericardium, the myocardium is divided into 6equiangular segments per slice following the standards suggested by the American Society ofEchocardiography. Postprocessing can be performed on the ViewForum (EWS) systems.

Late Enhancement (Spatial Enhancement) Workflows Scanning and Planning
Philips MRI 257
Phili
ps H
ealth
care
4598
006
437
51/7
81 *
03/
2014
*7
Late Enhancement (Spatial Enhancement)The following paragraphs describe the late enhancement technique and workflow. It comprisesthese chapters:
• About Late Enhancement
• Workflow
• Phase Sensitive Inversion Recovery (PSIR)
The intention of this section is only to give an illustration of how the workflow for viability ex-aminations using late contrast enhancement looks like in clinical practice. Philips Healthcarecannot take liability for dose regimen, infusion schemes etc.
Different MRI techniques can be used to visualize injured myocardium.
• Cine scans are used to look at wall thickness.
• Low doses dobutamine stress examinations have the potential in differentiating betweenviable myocardium (stunned and hibernating) and non-viable myocardium.
• Only the late contrast enhancement scans have the potential of visualizing the transmuralextend of an infarction.
About Late EnhancementDamaged cells take up contrast agent while in viable myocardium the contrast agent stays ex-tracellular. The contrast washout for damaged cells evolves much slower than the washout ofthe extracellular contrast only. After a while the contrast concentration for viable myocardiumis much lower than for injured myocardium. And thus the T1 relaxation rates evolve at differentrates. An inversion pulse is then applied and the inversion time is chosen such that the normalmyocardium appears black, maximizing the contrast between normal (black) and injured(white) myocardium.
Fig. 122: Example of late enhancement scans.

Workflows Scanning and Planning Late Enhancement (Spatial Enhancement)
258 Philips MRI
Phili
ps H
ealth
care
4598
006
437
51/7
81 *
03/
2014
*7
180º (a ) enhanced
myocardium
(b) myocardium
Fig. 123: The inversion pulse is used to cancel out any signal from the myocardium. Infarcted areas where still con-trast is visible show high signal intensities. a - Enhanced myocardium curve, b - (unenhanced) myocardium.
WorkflowPrior to performing the viability scan it is necessary to wait until the contrast agent has clearedfrom the (non-damaged) myocardium. This usually takes 10 minutes. During this time any kindof other scans can be performed, such as series of cine scans. 10 minutes after the (last) con-trast injection the late enhancement scans can be performed.
Late Enhancement sequence
This sequence is a single-phase multishot TFE scan that utilizes a single 180º-inversion prepulse.
• The shots should be acquired in mid-diastole to keep the cardiac motion as small as reason-able.
• The inversion delay time to cancel the normal myocardium is patient dependent and cannot be calculated on beforehand. It also depends on the time after the contrast injection. Alonger time after injection results in a slower T1 relaxation and less contrast in the (non-damaged) myocardium. Longer inversion times should be used. Usually the inversion timevaries in a range of 200 to 300 ms.
There are three ways to find out the patient specific inversion time:
1. Use a “Look-Locker” sequence which is a cine scan that utilizes a single inversion pulse ap-plied once every heart beat immediately after the R-peak. T1 relaxation is made visibleover the individual cardiac phases.
2. By trial and error: Start with a TI of 200 ms, then increase the TI using small steps of 20 or30 ms.
3. Change the inversion delay in real-time during an interactive scan. Make sure that the scanis running in continuous mode. The inversion time depends on the steady state that isreached over multiple heartbeats.
Remember that the inversion time found is valid only for a small period of time. Due to thewashout of the contrast media from the myocardium the T1 relaxation rate decreases slowlyover time.

Late Enhancement (Spatial Enhancement) Workflows Scanning and Planning
Philips MRI 259
Phili
ps H
ealth
care
4598
006
437
51/7
81 *
03/
2014
*7
Fig. 124: ‘Look-Locker’ technique to quickly find the zero crossing point of the myocardium within a breath-hold.
Tips and hints
Depending on the parameter settings, specific effects could occur:
Effect / Appearance Cause Measure
Speckled appearance of the myocardium:appears as suppressed myocardium inter-spersed with white spots.
It occurs if the TI is very close to the optimalinversion delay.
Increase the TI by just 10 ms to attain opti-mal suppression.
Dark signal at the endocardial boundary It is caused by a slightly shorter effective TIof the tissue at the blood-myocardial inter-face (especially with large voxels).
Increase the TI to obtain uniform suppres-sion of the myocardium.
Insufficient suppression / lack of contrast ofmyocardium over a broad range of TI
This indicates that the contrast has eitherwashed out (i.e. the scanning is done muchlater, e.g. more than 30-min. after injection)or insufficient amount of Gd-DTPA was in-jected.
It may be helpful to check if the entire dou-ble dose of Gd-DTPA was given (check forleaks etc.).
The blood-pool appears too dark The TI is too short. Increase its value to allow sufficient recov-ery.
Less contrast between blood-pool and in-jured myocardium
The TI is too long. Decrease its value.
SNR is too low Due to the inversion prepulse, the SNR willbe relatively low, especially if the heart rateis high and magnetization cannot recovercompletely before the next TFE shot is ac-quired (in the next RR-interval).
To increase SNR, the TFE shot interval canbe set to ’user defined’ and then to 2 beatsto allow for more recovery, but the scan willtake longer.
Tab. 14: Effects, causes and measures
Phase Sensitive Inversion Recovery (PSIR)The PSIR (“AutoViability”) IR-TFE sequence can be used for late enhancement assessment. Theadvantage of this technique is that it is less sensitive to suboptimal inversion delays.
PSIR is a 2 heart-beat sequence
PSIR needs 2 cardiac cycles (per inversion prepulse).

Workflows Scanning and Planning Late Enhancement (Spatial Enhancement)
260 Philips MRI
Phili
ps H
ealth
care
4598
006
437
51/7
81 *
03/
2014
*7
• It is more robust against variations in heart rate, and the SNR and CNR will both be bettercompared to a single heart-beat technique.
• It is intrinsically slower than single heart-beat techniques.
• The loss in imaging speed can be compensated for by using SENSE.
In the PSIR sequence, the second heartbeat is used for determination of the phase. The inver-sion pulse is given only once every two heartbeats, so that the acquisition in the second heart-beat has had more time for relaxation (so that the magnetization of all tissues should be posi-tive again), and can be used as a reference.
PSIR provides Corrected Real Images
The “CR” image type (Corrected Real) is the desired final phase corrected image.
NOTICEPSIR and imaging parameters: not all can be combined, others are mandatory.
Halfscan and partial echo cannot be used with PSIR.
SENSE can be used with PSIR.
CLEAR is mandatory with PSIR.
Related parameters
• TFE prepulse (no, saturate, invert)
• PSIR (no, yes)
• Flip angle (default: 5o)
The flip angle parameter “Flip angle (deg)” specifies the flip angle of the 2nd TFE shot in the2nd heart beat, which is typically taken smaller than the flip angle in the 1st heart beat (toprevent saturation).
Tips & Tricks
MR cardiac analysis on the EWS
PSIR datasets can be analyzed by means of the 'Spatial Enhancement' application in the CardiacExplorer.
They cannot be analyzed by means of the 'Spatial Enhancement' application on the EWS, sincethey contain CR-images. Analysis can only be performed on the IR-M images, even if the imagecontrast is suboptimal due to incorrect inversion delay time.
Work-around
• Use 'Split image types' in Review Case to separate the CR-images from the IR/M images.
• Load the IR/M images in the 'Spatial Enhancement' application.

Coronary Angiography Workflows Scanning and Planning
Philips MRI 261
Phili
ps H
ealth
care
4598
006
437
51/7
81 *
03/
2014
*7
• For optimal contrast in the IR/M image, use IR_TFE_LL_2beats to determine the optimal in-version delay time for the PSIR sequence prior to scanning PSIR.
Optimal inversion delay time
PSIR uses two RR intervals per inversion pulse. Compared to enhancement techniques whichuse a single RR interval per inversion pulse, a longer TI should be used for PSIR (because there ismore time for relaxation). It’s always better to use an inversion delay time which is a bit toolong (with positive myocardium). This will result in optimal contrast between normal and scar-red myocardium. This is less important for PSIR scans, where a too short TI still results in opti-mal contrast between the normal and scarred myocardium in the CR-image.
2D vs 3D
PSIR can be used for 2D and 3D, but for practical reasons, PSIR is mainly useful for 2D imaging.This is mainly because of breathhold times.
Navigator echo technique and PSIR
When using navigators with PSIR, the following happens with respect to the acceptance of RRintervals.
• If the first RR interval is accepted, also the second one will be accepted.
• If the first RR interval is rejected, also the second one will be rejected.
Coronary AngiographyMRI of the coronary arteries, with the advent of the MotionTrak method is now feasible in aclinical setting.
This chapter will introduce the various aspects needed to perform a successful coronary exami-nation. Covered here will be the utilization of MR methods, scan parameters, a recommendedclinical scan procedure and angulation techniques.
About Coronary AngiographyCoronary scans can be made with a variety of techniques:
Balanced TFE is the most frequently used method because it is fast due to the very short TR’sthat are used and it gives a nice strong signal from blood. Other methods include TFE and BlackBlood TSE.
Breath holding could be used for respiratory motion reduction, but the total breath-hold timeavailable is not sufficient to achieve good quality images. Another problem for breath-hold ap-proaches is the high risk of unwanted movement of the diaphragm during breath holding.

Workflows Scanning and Planning Coronary Angiography
262 Philips MRI
Phili
ps H
ealth
care
4598
006
437
51/7
81 *
03/
2014
*7
The best way to acquire high-resolution images is to correct for any respiratory motion usingnavigators. Navigators correct for sub-millimeter motion and allow for longer scan times, moredata acquisition and thus a higher spatial resolution. In the past these scans could easily exceed10 minutes of scanning, but good results can be obtained in scans that last for a more practical3 to 5 minutes of effective scan time.
There are two different approaches: the whole heart approach and the targeted approachwhere typically one scan is needed to catch the right coronary artery (RCA) in one scan, and asecond scan is needed to catch the left coronary artery (LCA) and circumflex (LCX) together.
Remark
The most frequently made mistake is to determine the spatial resolution of coronary scan fromthe voxel size only (FOV and scan matrix), totally ignoring the influences of respiratory motionto the resolution. In other words, decreasing the acquisition resolution from 0.7 mm to 0.5 mmdoes not improve the resolution if the total amount of respiratory blurring is more then 0.7mm. Try not to focus too much on the voxel size alone. Focussing on patient comfort is moreimportant, reducing the risk of patient motion gives much better results!
WorkflowThe best results are achieved when the patient is not moving at all since very small vessels areto be imaged. The slightest movement of the patient during scanning results in blurred images.It is therefore important to make sure that the patient lays very comfortable inside the magnet.Music through the head phones can help to create a more relaxed atmosphere. Explain to thepatient the importance of keeping still during the whole examination.
ProcedureThis procedure describes the targeted approach for the coronary arteries and the whole heartexamination.
Multistack survey
• can best be performed in a breath hold (expiration).
This allows for better planning of the navigator beam that is used for respiratory gating andmotion tracking.
High Temp Cine scan
• is a b-FFE cine scan with a sufficient number of phases (40 or more) to allow the precisedetermination of the trigger delay and shot duration.
► Position the scan in transverse orientation through the left and right ventricle. The idea isthat this scan shows the motion of RCA and thus the precise moment that diastole startsand early systole begins.
► Acquire this scan in free breathe as breath-hold might affect the patient's heart rate. It isimportant to define the precise start of diastole during free breathe since the actual coro-nary scan is acquired in free breathe too (navigator).

Coronary Angiography Workflows Scanning and Planning
Philips MRI 263
Phili
ps H
ealth
care
4598
006
437
51/7
81 *
03/
2014
*7
Coronary survey (only needed for the targeted appraoch)
• is a high-resolution survey scan that covers the whole heart and that is needed for planningof the coronary scans.
• utilizes SENSE b-TFE to speed up the image acquisition.
• uses a navigator for respiratory gating and motion tracking. Position the navigator on theright hemi diaphragm.
• uses a trigger delay set to mid-diastole (if higher heart rates result in conflicting parameters,the trigger delay could also be set to longest).
Fig. 125: Coronal image that shows the main pulmonary artery: position the stack such that the first slice is locatedhalfway the pulmonary artery, including as much of the heart as possible.
While this scan is running, the precise trigger delay and shot duration can now be determinedfrom the previous high temp cine scan:
► Browse through the phases and find out at what moment diastole starts. This should be thetrigger delay for the coronary scan.
► Browse through the phases to find the precise moment that the right coronary artery startsmoving again at early systole. The difference between this moment and the previously men-tioned trigger delay is the acquisition duration. The acquisition duration is displayed on theinfo page and can be controlled by changing the TFE factor.
► Alternatively, the TFE shot duration can be set in milliseconds directly on the 'Contrast' tab.The TFE factor is automatically calculated and displayed on the info page.

Workflows Scanning and Planning Coronary Angiography
264 Philips MRI
Phili
ps H
ealth
care
4598
006
437
51/7
81 *
03/
2014
*7
Fig. 126: Browse through the phases of the high temp cine scan to find out the precise moments where the coronarymotion starts and stops.
Coronary scan
Coronary scan Approach
Whole Heart Coronary scan for whole heart approach
Right Coronary scan (RCA) for targeted approach
Tab. 15: Use one of these coronary scans
► Enter the trigger delay as found using the High Temp Cine scan.
► Adjust the TFE factor or the TFE shot duration on the 'Contrast' tab.
When the images of the previous scan (coronary survey) are loaded into the main planningviewport, three-points-planscan can be used to position the stack of slices such that they coverthe whole right coronary artery at once. To avoid any risk of respiratory ghosting artifacts overthe image select a feet-head fold-over direction.
For the whole heart approach, the examination would be finished by now. For the targeted ap-proach, another scan for the LCA could be necessary.

Coronary Angiography Workflows Scanning and Planning
Philips MRI 265
Phili
ps H
ealth
care
4598
006
437
51/7
81 *
03/
2014
*7
Fig. 127: Place the first point at the origin of the RCA, the second point more lateral at the most apical position andthe third point at the most distal, inferior position.
Left coronary artery (LM, LAD and LCX) scan - for targeted approach
• The left main (LM), left anterior descending (LAD) and the left circumflex (LCX) can be ac-quired in a single 3D volume.
• Use three-points-planscan to position the stack.
• Fold-over direction should be set to LR to avoid any risk of respiratory ghosting artifacts.
Fig. 128: Place the first point at the origin of the LM, the second point more distal in the LAD and the third point atthe LCX.

Workflows Scanning and Planning Coronary Angiography
266 Philips MRI
Phili
ps H
ealth
care
4598
006
437
51/7
81 *
03/
2014
*7
Technical backgroundThe coronary scans make use of the ‘3D-K-space shutter’ which saves 20% of the scan-time andincreases signal to noise. The technique utilizes a radial profile order, which means that the out-er corners of 3D K-space are not acquired during acquisition resulting in improved image quali-ty. As a result of this radial profile order, each individual TFE shot starts at the center of 3D K-space (low-high profile order). Because of this REST and SPAIR or SPIR pulses become more ef-fective. Therefore it is also allowed to select fold-over suppression with only 1 NSA (implicit useof REST slabs).
A SPAIR or SPIR fat suppression pulse is used to enhance the contrast between the coronaryartery and the surrounding epicardial fat.
A T2Prep pulse is used to further enhance the contrast between the coronary arteries and themyocardium. The T2Prep pulse is a non-selective pre-pulse that suppresses tissues with shortT2 relaxation’s using a train of refocusing pulses over a short period of time. Both the numberof refocusing pulses (1, 2 or 4) and the period of time (echo time) can be adjusted for theT2Prep pulse.
It is recommended to use volume shim, which is done selectively over a volume that can befreely chosen, but is restricted to a minimum value. Large transitions as air/tissue boundariesshould be excluded from the selected volume and also areas where large homogeneity varia-tions occur. When ‘ShimAlign’ is set to 'yes', any modification of the stack off-centers and angu-lations will result in a recalculation of the shim volume such that the shim volume will bealigned to the stack:
• Off-centers are adjusted such that the volume will be inside the stack.
• Angulations will be equal to the stack.
• The volume will be slightly thicker than the stack allowing easier selection in planscanmode.
Sequence descriptionIn order to eliminate the contribution of fat signal into the navigator beam a second SPIR pulseis implemented to suppress the fat in the navigator beam. This results in a steady navigator sig-nal. The excitation of the navigator is moved close to the acquisition train to ensure a minimumamount of residual motion. The order of pulses is:
• T2 prep pulse
• SPIR for navigator
• Navigator
• SPIR for image acquisition
• Implicit REST for fold-over suppression
• Acquisition train (Balanced TFE, TFE or TFE-EPI)

Workflow MultiNuclei (MN) MR Spectroscopy Workflows Scanning and Planning
Philips MRI 267
Phili
ps H
ealth
care
4598
006
437
51/7
81 *
03/
2014
*7
SPIR NAV RESTT2 prep (B) TFE
MotionTrak
50 20 20 20 15 70 msSPIR
1 2 3 4 5 6
TD
Fig. 129: Navigator coronary sequence.
1 T2 prep
2 SPIR
3 Navigator
4 SPIR
5 REST
6 (B)-TFE
Workflow MultiNuclei (MN) MR SpectroscopyProton resonances are not always uniquely identifiable as the MRS fingerprints of different mol-ecules may overlap. Thus spectroscopy of other nuclei is also interesting for biochemical or clin-ical research. Some compounds that are not readily identified in in-vivo proton spectra, areeasily identified in 31P or 13C spectra.
Besides Proton spectroscopy, Phosphorous spectroscopy is the most commonly used one. Mol-ecules that are examined in Phosphorous Spectroscopy are:
• Phosphorous (31P);
• Adenosine triphosphate (ATP);
• Phospho-creatine (PCr);
• Inorganic phosphate (Pi);
• Phospho-monoesters;
• Phospho-diesters.
Pulse sequences and MRS protocolsSix main scan types are available for 31P Spectroscopy:
• No localization: ’Pulse and Acquire’
• Single voxel, localized with ISIS (Image Selected In-vivo Spectroscopy; FID based volume se-lection method)

Workflows Scanning and Planning Workflow MultiNuclei (MN) MR Spectroscopy
268 Philips MRI
Phili
ps H
ealth
care
4598
006
437
51/7
81 *
03/
2014
*7
• Single voxel parameter series
• Double voxel (an extension of ISIS that acquires data from two aligned voxels, using a 16-step localization cycle).
• One dimensional Spectroscopic Imaging (typically with two dimensions of spatial localiza-tion to define a bar).
• Two dimensional Spectroscopic Imaging (typically with slice selection, i.e. one dimension ofspatial localization).
The scan setup is very flexible: phase encoding and spatial localization dimensions can be speci-fied independently (the ’FID volume sel changes’ parameter may need to be set to user de-fined). However, more extensive spatial localization requires a longer TR to stay below SAR lim-its. The minimum TR for Single Voxel ISIS in the brain is 5000 ms. Slice selected 2DSI requiresfewer pulses, and hence TR can be reduced to ~4000 ms.31P imaging protocols and ExamCards are provided for the most common anatomical areas.
PlanningFor accurate planning, make use of the marker in the Phosphorous coil which is buried at thecenter of the coil.
Localize the marker in the phosphorous coil
1. Acquire images in all three orthogonal directions with the Q-Body coil.
Fig. 130: Localization of the marker. The red arrows indicate the position of the marker.
2. Position the volume of interest at the same level as the marker in the coil.
• This will provide the best SNR.
• The penetration depth of the coil is ± half the diameter of the coil.
Acquiring DataOnce planning is completed and 'Start Scan' has been pressed, the following steps are execut-ed:
• Manual adjustment of coil tuning and matching.

Workflow MultiNuclei (MN) MR Spectroscopy Workflows Scanning and Planning
Philips MRI 269
Phili
ps H
ealth
care
4598
006
437
51/7
81 *
03/
2014
*7
• Preparation phases/steps of other nucleus measurement (shimming, F0 determination etc.;this can be skipped for repeated scans of the same voxel).
• Measurement.
Manual tuning and matchingAn MRI coil is part of a tuned circuit, and for maximum performance, its resonance frequencyshould equal that of the nuclei of interest: 51.73 MHz for 31P at 3.0T. Moreover, to minimize theamount of reflected power, its impedance should be 50 ohms. Because the presence of a pa-tient "loads the coil" and greatly changes the characteristics of the tuned circuit, long flexiblerods attached to variable capacitors are used to optimize coil sensitivity for a particular anato-my.
Fig. 131: Tuning (left) and Matching (right).
In manual tuning mode, low power RF is swept through the resonance frequency, and reflectedpower is monitored as a function of frequency:
Fig. 132: Manual Tuning window. 1 - Buttons with functions like 'Autoscale', 'Show grid' and 'Show dots'. 2 - tuningsignal presented as intensity versus frequency [kHz], 3 - signal types, 4 - numeric display of minimum and maximumvalues.
• The rod that is attached closer to the center of the coil adjusts the tuning - the frequency atwhich the tuned circuit resonates. Turning it will move the ’V’ on the display left or right.When adjusted properly, it should be centered at zero frequency offset.

Workflows Scanning and Planning Workflow MultiNuclei (MN) MR Spectroscopy
270 Philips MRI
Phili
ps H
ealth
care
4598
006
437
51/7
81 *
03/
2014
*7
• The rod that is attached closer to the cable adjusts the matching - the impedance of theloaded coil. Turning it adjusts the sharpness and depth of the ’V’. When adjusted properly,the ’V’ should be as sharp as possible, and the reflected power minimized at zero offset fre-quency.
Tips and hints for coil tuning and matching
► Click on ’Display on Magnet’ in the monitoring window to display the manual tuning win-dow on the magnet-mounted screen.
► For better visualization of the ’V’, turn on the ’Autoscale’ and ’Grid’ display options.
Coil response on resonance is characterized by a quality factor Q. SNR is proportional to Q1/2.Patient loading lowers Q, but correct tuning and matching can minimize the drop. The systemcalculates Q after manual tuning and before each subsequent scan. Q can be inspected in Log-ging Application UI (only accessible when logged in as service user).
► From the Windows Start menu, select MR System Management > Diagnostics > Logging Ap-plication UI.
► Enter ’coil q:’ (without quotes) in the free text box and click on ’Search’.
Some typical loaded Q values with the P-140 coil at 3.0T are:
Anatomy Q
Calf muscle 40 ... 60
Liver 35 ... 50
Brain (coil at the back on the head) 65 ... 95
Disk A positioned 1 cm away from the coil 35 ... 37
NOTICEMake sure that the cables are connected to the MN box.
Loose cable connections at the MN box will give noise on the tuning/matching curve with alow power response and will finally result in bad spectra.

Workflow MultiNuclei (MN) MR Spectroscopy Workflows Scanning and Planning
Philips MRI 271
Phili
ps H
ealth
care
4598
006
437
51/7
81 *
03/
2014
*7
Fig. 133: Bad tuning/matching curve resulting from loose cable connections to MultiNuclei box.
Preparation of other nucleus measurementThe preparation steps F0 determination, power optimization, and shimming are actually per-formed on the proton signal from the selected voxel or VOI. The only user-selectable step is theshimming, with three choices for the higher order shimming (HOS) parameter when planningthe scan:
Type of HOS Way of working Advantages Disadvantages
HOS = NO • launches iterative shimwhich seeks to maximizepeak height by cyclingthrough adjustment of thestatic currents supplied tothe X, Y, and Z gradients.
• A monitor window displayfor a visual assessment ofthe shim prior to the ac-quisition.
• Less sensitive to motion.
• Very slow.
• Can be less accurate whenlocal minima in field inho-mogeneity are present.
HOS = First • uses a fast pencil beamprojection method to setthe first-order shim cur-rents.
HOS = Sec-ond
• uses a fast pencil beamprojection method to setboth, the first- and second-order shim currents (thischoice is available only ifsecond-order shim hard-ware is present and opera-tional).
• Fast.
• Employs the five second-order shims (Z2, X2-Y2, XY,XZ and XZ) for better ho-mogeneity over large vox-els.
• No visible display of shimquality prior to scanning.
• Possibly more sensitive tomotion.
Tab. 16: Table title

Workflows Scanning and Planning Workflow MultiNuclei (MN) MR Spectroscopy
272 Philips MRI
Phili
ps H
ealth
care
4598
006
437
51/7
81 *
03/
2014
*7
MeasurementFor single voxel acquisitions, a spectrum monitor window displays an update of the averagedsignal, once dummy shots are completed. Note that for ISIS, an accurate assessment of the lo-calized spectrum is available only after every eighth shot (i.e., after excitation 8n, withn=1,2,...).
A spectrum monitoring window also appears for 1D Spectroscopic Imaging, but it displays thecollected signal from the entire volume, and is therefore not a real representation of the finalresults. No spectrum monitoring is available for 2DSI.
Processing with SpectroViewThis section gives some tips and hints for a phosphorous measurement being processed withSpectroView.
Basic processing
Once a time-domain spectroscopy dataset is selected, a Basic processing script is executed au-tomatically to generate a frequency domain spectrum for display.
Different basic scripts are available, for both single voxel and CSI data, and optimized for vari-ous anatomic regions. If none is specified, a pop-up will be presented to allow selection of theanatomic region, before the basic script is executed.
Single Voxels
Once time-domain processing is complete, or after choosing a spectrum from the Pictorial In-dex, select a script from the drop-down menu in the SpectroView toolbar. All the scripts whichare relevant for the selected anatomy will be available.
Either run the appropriate script as it is or edit the script.
Select peaks
The list of in vivo metabolites from which to choose includes ATP, PCr, Pi (inorganic phosphate),PME (phosphomonoesters), PDE (phosphodiesters), and "dnt" ("dinucleotide" - a small peaknear the a-ATP doublet that has been variously labeled in the literature).
Default choices for each script and possible changes are detailed in the following table.
Script Default metabolites Changes to consider
31PMuscle_sv PCr, ATP, Pi Add PDE if the spectrum is protondecoupled.
Add dnt if the SNR is good.
31PLiver_sv ATP, Pi, PME, PDE PCr shouldn’t appear in liver spectra,but it usually does a contaminantfrom surrounding muscle - if so, addit.
Add dnt if the SNR is good.

Workflow MultiNuclei (MN) MR Spectroscopy Workflows Scanning and Planning
Philips MRI 273
Phili
ps H
ealth
care
4598
006
437
51/7
81 *
03/
2014
*7
Script Default metabolites Changes to consider
31PBrain_sv PCr, ATP, Pi, PME, PDE Add dnt if the SNR is good.
In the 31P_Phantoms_sv script, there are three entries for the three 31P phantoms:
• ’Disk A’ = phosphoric acid (singlet at 2.86 ppm relative to PCr)
• ’Disk B’ = hypophosphorous acid (triplet centered at 13.53 ppm, JPH =549 Hz)
• ’Sphere B’ = methylphosphonic acid (quarted centered at 32.5 ppm, JPH = 17.2 Hz)
Peak Fitting
Some modifications to consider are as follows:
• The default Gaussian character is 50%. However, if Gaussian or Gaussian-to-Lorentzianapodization has been applied to the data in the time domain, a better choice would be~90%.
• The number of baseline terms characterizes the flexibility of the baseline function duringthe fitting process - more terms allow for more wiggle. For spectra without underlyingbroad components - like those from muscle - the number of baseline terms should be small(0-2). For brain spectra, more terms (7-9) may be needed to fit the broad phospholipidhump centered roughly on the PDE peak.
• If the SpectroView fit is to be used for pH information, Lock Relative Frequency should beOFF to let the fitted Pi and PCr chemical shifts vary independently. However, unless the SNRis very good, these extra degrees of freedom can impair the robustness of the fit. More reli-able results can be obtained with Lock Relative Frequency = ON. (For pH measurements,right-mouse-click in the graph area to turn on Difference Mode, then move the vertical linecursors to the Pi and PCr peaks for a display of their chemical shift difference.)
Fig. 134: Peak fitting parameters in the script Parameter Editor where 1 - Analysis range, 2 - Display range, 3 - Base-line Terms (slider), 4 - Gaussian Character (slider), 5 - Phase, 6 - checkbox 'Lock Relative Frequency', 7 - 'Lock Widths'.Note that 'Lock Relative Frequency' is disabled.
• If peaks are not located correctly during the fitting routine, a manual peak assignment canbe performed. This function is also used to center the PCr-peak to 0 ppm.
2D CSI Data
If processing 2D CSI data, enable ’Voxel selection’ by clicking on the corresponding icon.

Workflows Scanning and Planning Workflow MultiNuclei (MN) MR Spectroscopy
274 Philips MRI
Phili
ps H
ealth
care
4598
006
437
51/7
81 *
03/
2014
*7
Select all voxels of interest to be proceeded.
Possible scripts are:
• 31PMuscle_csi
• 31PLiver_csi
• 31PBrain_csi
• 31P_Phantoms_csi
These are nearly identical to the single voxel scripts. Additionally, metabolite and/or ratio mapscan be generated.
To specify a ratio map, choose a numerator from the left column and a denominator from theright column. All metabolites selected for maps must also be chosen for fitting on the ’SelectPeaks’ page.
Examples of 3.0T with the P-140 Coil
2DSI of calf muscle
Fig. 135: Calf muscle spectral results.

Workflow MultiNuclei (MN) MR Spectroscopy Workflows Scanning and Planning
Philips MRI 275
Phili
ps H
ealth
care
4598
006
437
51/7
81 *
03/
2014
*7
Fig. 136: Calf muscle spectral results.
Brain Single Voxel
Fig. 137: Brain pulse acquired results. Resolved phosphomonoesters and phosphodiesters: PE = phosphorylethanola-mine, PC = phosphorylcholine, Pi = inorganic phosphate, GPE = glycerophosphorylethanolamine, GPC = glycerophos-phorylcholine, PCr = Phosphocreatine, γATP = gamma ATP, αATP = alpha ATP, βATP = beta ATP.

Workflows Scanning and Planning Workflow MultiNuclei (MN) MR Spectroscopy
276 Philips MRI
Phili
ps H
ealth
care
4598
006
437
51/7
81 *
03/
2014
*7
Brain 2DSI
Fig. 138: Brain 2DSI results. Upper row: planning. Lower row: spectra from two voxels.
Liver Single Voxel
Fig. 139: Liver SV spectral results.

Workflow MultiNuclei (MN) MR Spectroscopy Workflows Scanning and Planning
Philips MRI 277
Phili
ps H
ealth
care
4598
006
437
51/7
81 *
03/
2014
*7
Liver 2DSI
Fig. 140: Liver 2DSI spectral results.
31P Liver Metabolite Maps
Fig. 141: 31P Liver Metabolite maps.

Workflows Scanning and Planning Workflow MultiNuclei (MN) MR Spectroscopy
278 Philips MRI
Phili
ps H
ealth
care
4598
006
437
51/7
81 *
03/
2014
*7

Start up a Review or Analysis package Workflows Review and Analysis packages
Philips MRI 279
Phili
ps H
ealth
care
4598
006
437
51/7
81 *
03/
2014
*7
Workflows Review and AnalysispackagesThis chapter describes the various workflows for the Review and Analysis packages.
For information about the user interface and if applicable about suitable scans and results ofthese packages, refer to chapter “Review and Analysis Packages” on page 105.
Start up a Review or Analysis package⊳ In Review mode:
► Select the imaging series first and then the Review or Analysis package. You can select multiple scans.
• To select multiple successive imaging series, press |Shift| and click to select.
• To select multiple imaging series, press |Ctrl| and click to select.
There are different ways of how to start up a Review or Analysis package.
1. Right-click on an imaging series in Thumbnail View and select the required package fromthe context menu.
2. Click on an imaging series in Thumbnail View and select the required package from the 'Re-view' or ‘Analysis’ menu.
3. Double-click on an imaging series in Thumbnail View. The default package (ImageView)opens automatically.
4. Drag an imaging series from List or Thumbnail View into the reviewing area. The defaultpackage (ImageView) opens automatically.
NOTICEOnly those Review or Analysis packages are displayed in the pop-up or 'Review' or 'Analysis'menu which apply to the current scan.
The other packages are either not in the list or they are grayed out.
The selected and thus the current view is indicated by an orange tab and border.
ImageView: WorkflowsFor information
• about generic image functions, see chapter “Generic functions for images” on page 55.
• about ImageView and the ImageView toolbar, see chapter “ImageView” on page 106.
12

Workflows Review and Analysis packages VolumeView: MaxIP and MinIP
280 Philips MRI
Phili
ps H
ealth
care
4598
006
437
51/7
81 *
03/
2014
*7
Start up ImageViewPreferred workflow
⊳ In Review mode:
► Drag an imaging series from List or Thumbnail View into any viewport of the reviewing area.
The ImageView package opens.
Typical ImageView workflows• Windowing, zooming and panning: see chapter “Windowing, Zooming and Panning” on
page 53.
• Scrolling: see chapter “Scrolling through images” on page 54.
• Changing the layout: see chapter “” on page 107.
• Reviewing Planscan: see chapter “” on page 95.
• Comparing imaging series: see chapter “” on page 94.
• Performing measurements: see chapter “” on page 108.
• Playing a movie: see chapter “” on page 107.
VolumeView: MaxIP and MinIP
Start up VolumeView1. Right-click on a suitable scan in the Thumbnail View.
A context menu appears.
2. Click ’VolumeView’.
The VolumeView package opens.
Optional: Select the Image Type► Drag to the left or to the right on the orthogonal views to select another image type, e.g. in
a PCA imaging series PCA/M or FFE/M images.
Select the Render Mode
For Maximum Intensity Projection (MaxIP)
► This step can be skipped, since MaxIP is the default setting.

VolumeView: MPR Workflows Review and Analysis packages
Philips MRI 281
Phili
ps H
ealth
care
4598
006
437
51/7
81 *
03/
2014
*7
For Minimum Intensity Projection
► Click ’Render Mode’ and select MinIP from the drop-down menu.
Define the volume to be reconstructedYou can define the volume of interest in several ways, e.g. using the clipbox function or drawinga contour.
The most common way of drawing a contour is described here.
1. Click ’Draw Contour’ to define the volume of interest.
• Default settings are: Free, Cut Outside, AutoCut Mode Enabled.
2. For Free:
• click once to start drawing,
• move the mouse to define the contour,
• click once more to close the contour.
Calculate the result images as new imaging series► Click ’Generate Series’ to calculate a new imaging series out of the original data set.
A new window pops up.
► Click |Stack| to define orientation, stack type (e.g. radial for a Single- and Multi-StationMaxIP or parallel for a slab MinIP), projections, radial axis and angle.
► Enter a series name and click 'Generate' to generate new imaging series.
VolumeView: MPR
Start up VolumeView1. Right-click on a suitable scan in the Thumbnail View.
A context menu appears.
2. Click ’VolumeView’.
The VolumeView package opens.
Select the Render Mode
For Multiple Planar Reformats
► Click ’Render Mode’ and select MPR from the drop-down menu.

Workflows Review and Analysis packages VolumeView: Surface Rendering
282 Philips MRI
Phili
ps H
ealth
care
4598
006
437
51/7
81 *
03/
2014
*7
Calculate the result images as new imaging series► Click ’Generate Series’ to calculate a new imaging series out of the original data set.
A new window pops up.
► Click |Stack| to define orientation, stack type, projections, radial axis and angle.
► Enter a series name and click 'Generate' to generate new imaging series.
VolumeView: Surface Rendering
NOTICEOnly one object can be rendered at a time.
Start up VolumeView1. Right-click on a suitable scan in the Thumbnail View.
A context menu appears.
2. Click ’VolumeView’.
The VolumeView package opens.
Select the Render Mode► Click ’Render Mode’.
► Select 'Shaded Surface Rendering' (surface rendering with use of light source)
OR
► Select 'Unshaded Surface Rendering' (surface rendering without use of light source)
Define the volumeIf necessary, define the volume to be reconstructed.

MobiView Workflow Workflows Review and Analysis packages
Philips MRI 283
Phili
ps H
ealth
care
4598
006
437
51/7
81 *
03/
2014
*7
MobiView Workflow
NOTICEIf the scans which have to be fused don’t have GeoLinks (e.g. due to scan aborts), select multi-ple scans to overcome this problem: in this case, fusing will be done for these multiple scans.
Start up MobiView1. Right-click on a suitable scan in the Thumbnail View.
A context menu appears.
2. Click ’MobiView’.
The MobiView package opens.
Fuse the coronal or sagittal imaging series
NOTICEIt is recommended to window and level each station prior to fusing.
1. Select 'Fuse Hardcut' OR 'Smooth Fuse' from the toolbar.
2. Check whether the result of the fusion operation is correct.
Fused images can be windowed and zoomed in the usual way as other images.
NOTICEThe fusing area is indicated by markers on the multistation images.
Merge the transverse imaging series
NOTICEIt is recommended to window and level each station prior to fusing.

Workflows Review and Analysis packages MobiView Workflow
284 Philips MRI
Phili
ps H
ealth
care
4598
006
437
51/7
81 *
03/
2014
*7
1. Select 'Merge Series' from the toolbar.
2. Check whether the result of the fusion operation is correct.
Merged images can be windowed and zoomed in the usual way as other images.
NOTICEThe fusing area is indicated by markers on the multistation images.
Save the fused images to database1. Click 'Generate Series' to save the fused images to database.
2. Click |Yes| to confirm.
• Each time the 'Generate Series' button is clicked, the fused data is stored as a new ser-ies.
• The name of this new series is derived from its original name extended with a "m".
• The saved images will be marked as derived images, i.e. not originally scanned images.
• The fusing area indication is saved with the images.
Workflow for Multi-Station imaging series with Multiple Image TypesWith multiple stations and multiple image types, fusing automatically occurs for one imagetype, e.g. Modulus or InPhase image. In order to also fuse the second image type, proceed as follows:
For coronal or sagittal multi-station imaging series
► Select your imaging series and start up MobiView.
► Select the first image type (e.g. InPhase image).
► Fuse the images (either Smooth or Hardcut ) and store the resulting fusedimage.
► Select the second image type (e.g. Water image).
► Fuse the images and store the resulting fused image.
For transverse multi-station imaging series
► Select your imaging series and start up MobiView.
► Select the first image type (e.g. InPhase image).
► Merge the images and store the resulting merged image.
► Select the second image type (e.g. Water image).

QFlow Analysis Workflows Review and Analysis packages
Philips MRI 285
Phili
ps H
ealth
care
4598
006
437
51/7
81 *
03/
2014
*7
► Merge the images and store the resulting merged image.
QFlow Analysis
Start up the QFlow package1. Right-click on a suitable scan in the Thumbnail View.
A context menu appears.
2. Click ’QFlow’ .
The QFlow package opens.
Prepare the environment for drawing a ROI
Select the end diastolic FFE/M image:
• Drag to scroll through the images.
The end diastolic FFE/M image shows the largest diameter which is best for the automatic con-tour detection.
Define the vessel contour
Select the type of ROI
Active Contours algorithm
► ’Active Contours’ is disabled by default to allow for automatic contour detection and adap-tation.
Draw a ROI
For Smoothed Polygon, Ellipse, Freehand:
► Click 'Draw Selected Contour'.
► Click once in the image viewport to start drawing a ROI.
► Move the mouse to define the contour.
► Double-click to close the contour.
The drawn contour will be adapted to the closest automatically detected contour if ’ActiveContours’ is enabled.
For Single Click ROI:
► Click once within the vessel.
The contour detection algorithm will automatically come up with the vessel contour.

Workflows Review and Analysis packages QFlow Analysis
286 Philips MRI
Phili
ps H
ealth
care
4598
006
437
51/7
81 *
03/
2014
*7
Propagate the ROI to the other images
► Right-click on the ROI and select ’Propagate All’ to propagate the ROI to all images.
NOTICERepeat the steps of drawing a ROI and propagating the ROI if more ROIs for several vesselshave to be drawn.
Check the ROIs on all images
► Use the movie function to check the ROIs on the images.
Show the resultsA graphical chart and the numerical results (in a table) are automatically displayed in the upperviewports.
► Click ’Results Setup ...’.
The ’Results Setup’ window opens.
► Click to select any of the display options as:
• Select the vessel to display the results for.
• Define if the results are to be displayed inverted.
• Select the result type.
• Select the unit.
► Right-click on the image to open a pop-up menu offering the possibilities:
• Window (settings): No copy, Copy to right, Copy to all
• Interpolate
• Filled graphics
• Display analysis graphics
► Right-click on the image and select an image type for display.
► Scroll through the numerical results by means of the vertical scroll bar on the right side.
► Right-click on the graphical chart and select an item for display:
• Area
• Maximum velocity
• Minimum velocity
• Mean velocity
• Peak velocity
• Nr. of pixels

PicturePlus Workflow Workflows Review and Analysis packages
Philips MRI 287
Phili
ps H
ealth
care
4598
006
437
51/7
81 *
03/
2014
*7
• Flux
• Standard deviation
► Click on the graphical chart to navigate through images.
In the lower viewports the corresponding image will be displayed indicated by a vertical lineon the graphs.
Export and print the results1. Click the 'Export results' button from the 'More' drop-down menu.
2. Select an ’Export’ destination.
3. Click |Okay| to confirm.
4. Hardcopies can be performed in the usual way.
NOTICEThe results are exported as CSV (Comma Separated Values) file.
This file type has to be opened via Microsoft Excel in order to present the results.
PicturePlus Workflow
Start up PicturePlus1. Right-click on a suitable scan in the Thumbnail View.
A context menu appears.
2. Click ’PicturePlus’ .
PicturePlus opens.
Enhance ImagesIt is possible to define the degree of smoothing and edge enhancement:
► To change edge enhancement, right-drag horizontally.
Movement to the right increases and movement to the left decreases edge enhancement.
► To change smoothing, right-drag vertically.
Downward movement decreases smoothing. Upward movement increases smoothing.
► To select one of the PicturePlus presets,
• click in the ’Presets’ field
• select a preset from the drop-down menu and
• click ’Apply’.

Workflows Review and Analysis packages Image Algebra Workflow
288 Philips MRI
Phili
ps H
ealth
care
4598
006
437
51/7
81 *
03/
2014
*7
Generate a new imaging series► Click ’Generate series’.
A new imaging series will be generated within the current examination.
Image Algebra Workflow
Start up Image AlgebraYou can perform Image Algebra either on two different scans or on a single dynamic scan. Thisrequires the selection of one or two scans when starting up the package.
1. Select the scan(s):
A context menu appears.
• To perform Image Algebra with a single dynamic scan, right-click on this scan in theThumbnail View.
• To perform Image Algebra with different scans, press and hold |Shift| and then click inthe Thumbnail View to select the two scans.
2. Select ’ImageAlgebra’.
The ImageAlgebra package opens.
Select the type of operation► Click on the field 'Select the operation' to display the drop-down menu with the available
algorithms.
► Click to select the required algorithm.
Select the images for processing (A and B)► Click on the selection (toggle) icon and ’Switch to single selection’ or 'Switch to range selec-
tion' .
► Select the images for A and B by dragging the slider.
Apply a weighting factor► Define the weighting factor by clicking on the slider and dragging.
The image in the preview will be updated in real-time.
Fig. 142: Slider for the weighting factor.

Diffusion Registration Workflow Workflows Review and Analysis packages
Philips MRI 289
Phili
ps H
ealth
care
4598
006
437
51/7
81 *
03/
2014
*7
Adjust the threshold values► Click on either of the threshold buttons.
► Drag up- and downwards to adjust the threshold.
Generate a new imaging series► Click ’Generate series’.
A new imaging series will be generated within the current examination.
Diffusion Registration Workflow1. Right-click on a suitable diffusion dataset in the Thumbnail View.
A context menu appears.
2. Click ’Diffusion Registration’.
The diffusion registration is performed as a background process.
The start of this background process is indicated on screen: ’The registration has been sub-mitted’.
3. From the main menu bar, select 'System' and then 'Manage Job Queues' to check the sta-tus of the package.
4. The new imaging series appears automatically in the Thumbnail View when the diffusionregistration process is finished.
The new imaging series can be recognized by the prefix ’Reg’.
5. View the new imaging series with the ’ImageView’ package.
6. Compare the diffusion registered images with the original images in movie mode to get animpression on the effects of the diffusion registration package.
NOTICEWhen the diffusion registration package is part of an ExamCard, it will be performed as a back-ground function without notifying the user.
Diffusion registration
Diffusion

Workflows Review and Analysis packages Diffusion Workflow
290 Philips MRI
Phili
ps H
ealth
care
4598
006
437
51/7
81 *
03/
2014
*7
Fig. 143: A diffusion map (FA map) without diffusion registration (left) and with diffusion registration (right).
Diffusion Workflow
Start up the Diffusion package1. Right-click on a suitable diffusion dataset (at least two different b-values) in the Thumbnail
View.
A context menu appears.
NOTICEUse a registered dataset if available.
2. Click ’Diffusion’.
The Diffusion package opens, and the center slice with a corresponding map will be shown.
Navigate through imagesThrough slices (or resulting) maps
► In the image (or map) viewport, drag to the left or to the right.
► Alternatively use the left and right arrow keys.
Adjust the B0 ThresholdBy default, the 'Adjust Threshold' function is automatically enabled: the threshold mask is laidover the original image.
Setting a threshold mask will exclude background pixels from the functional map calculations.
1. Right-drag up- and downwards to adjust the threshold.

Fiber Tracking Workflow Workflows Review and Analysis packages
Philips MRI 291
Phili
ps H
ealth
care
4598
006
437
51/7
81 *
03/
2014
*7
Select b-values1. Click ’Select b-values’.
2. Select at least two b-values which are to be processed.
3. Click |Okay| to confirm the selection.
Generate a new imaging series1. Click ’Generate series’.
2. Select the map type to be calculated:
DWI iso map, ADC map, eADC map, ADC iso map, eADC iso map, FA (greyscale) map and/orFA color map.
3. Define a unique name for the new series in the entry field.
4. Click |Okay| to confirm and to start the calculation.
Fiber Tracking Workflow
Start up FiberTrak1. Right-click on any DTI dataset in the Thumbnail View.
A context menu appears.
2. Click 'FiberTrak’.
The FiberTrak package opens.
Load anatomical data1. Drag the required anatomical dataset into the package from the Thumbnail View.
Navigate through the dataThere are various ways to navigate through the data. It is important to identify the structures ofinterest prior to tracking fibers and to display them in the 3D view in such a way that ROIs caneasily be drawn. The most important navigation tools are:
Scroll through the dataset
► Right-click on an image.
► Select ’Scroll’.This is the default setting.
► Drag in the 3D view to scroll through the slices.
OR:

Workflows Review and Analysis packages Fiber Tracking Workflow
292 Philips MRI
Phili
ps H
ealth
care
4598
006
437
51/7
81 *
03/
2014
*7
► Drag the colored lines (blue: FH-, green: AP- and red: RL-image position) on the orthogonalviews to any desired location. The image in the 3D view will be updated to the current loca-tion.
Rotate the dataset
► Right-drag on the 3D view to rotate in any direction.
See chapter “Tips for Fiber Tracking” on page 295 for an example concerning the IFO.
Track fibersEither single ROI or multiple ROI Fiber Tracking can be performed. Single ROI Fiber Tracking isfast in delineating fibertracts, but may be less accurate. Multiple ROI Fiber Tracking is the meth-od of choice for a more accurate determination of the complete fibertract bundle.
For more information, see chapter “Algorithms: Fibers and Seeded ROIs” on page 159.
1. Click ’Track Single ROI Fibers’ on the toolbar.
2. Draw a freehand ROI (default ROI type) manually. The fibers originating from this ROI willbe shown immediately.
This can be done repeatedly.
OR
3. Click ’Define multiple ROIs’ on the toolbar.
4. Draw multiple freehand ROIs (default ROI type) manually which should all include the re-quested fiber.
5. Click ’Track Multiple ROI Fibers’ (toolbar or via right-click on image) when all ROI’s aredrawn. Tracts will be generated if they comply to the criterion that they pass through allROIs.
Generate result series⊳ On the FiberTrak toolbar,
1. select either/or
• ’2D Cross-section Tract Series’
• ’3D Projection Tract Series’ .
2. Specify the series:
• In case of 2D Cross-section Tract Series: select orientation, slice range and the numberof frames.
• In case of 3D Projection Tract Series: define the number of frames and store viewpoints.
See section ’Output Series’ for more information.
3. Click ’Generate’ to start the calculation.

FiberTrak: Advanced Workflows Workflows Review and Analysis packages
Philips MRI 293
Phili
ps H
ealth
care
4598
006
437
51/7
81 *
03/
2014
*7
The resulting color images can be sent to PACS or general archive.
View FiberTrak results in movie mode⊳ In ImageView,
1. Click the ’Movie’ icon to view the generated FiberTrak series in movie mode.
2. Right-click when the movie is running to export such movies to a user defined networkdrive or USB device.
FiberTrak: Advanced WorkflowsThis section provides more information about the FiberTrak package in order to achieve bestresults and to optimally handle the package:
• ROIs
• Algorithms: Fibers and Seeded ROIs
• Colors: Fibers and ROIs
• Statistics: Fibers, ROIs and current voxel
• Output Series
• Tips for Fiber Tracking
Output SeriesThe FiberTrak package can generate output series of the FiberTrak dataset. It is possible to ren-der 2D cross-section or 3D projection tract series.
2D Cross-section Tract Series
The ’2D Cross-Section Tract Series’ will show slices of the dataset where the intersection of fi-bers is shown. Note that the coloring of the orthogonal view is used for the slices.
3D Projection Tract Series
In some cases, a 3D rotating, zooming and moving view of the resulting tracts is needed to viewthe interaction of tracts and pathology. The ’3D Projection Tract Series’ are made by defining ascript consisting of multiple viewpoints. The series is generated from smooth transitions be-tween these viewpoints.
Creating and viewing of 2D Cross-section Tract Series
1. Click ’2D Cross-section Tract Series’ on the FiberTrak toolbar.
The window to define 2D Cross-section tract series will open.Orientation Coronal Sagittal Transverse
Slice range1 64
Nr. of frames 1 per slice 1024 Generate Close
Fig. 144: Window to define 2D Cross-section tract series.

Workflows Review and Analysis packages FiberTrak: Advanced Workflows
294 Philips MRI
Phili
ps H
ealth
care
4598
006
437
51/7
81 *
03/
2014
*7
2. Define the orientation of the resulting series by selecting / deselecting either: coronal, sag-ittal or transverse.
3. Define the slices to be included in the calculation of the tract series:
• Click on the selection icon to toggle between ’range selection’ (where multiple imagescan be chosen) and ’single selection’ (where only one slice can be chosen).
• Select the slice or the slice range by clicking on the slider besides the icon and by drag-ging. The selected slice(s) will be indicated as slice number on top of the slider and asred lines or red box on the orthogonal views.
Single selection
Range selection
164
2 64
Fig. 145: Example: The upper row shows a single selection of slice 1. The lower row shows a range selection of slices2 to 64.
4. Define the number of frames
• either by selecting ’1 per slice’ where one frame will be calculated per slice.
• or by setting a number of frames where interpolation will occur between slices in orderto reach the required number of frames.
5. Click |Generate| to generate the output series.
Clicking |Close| closes the window without generating output series.
6. Define the image resolution (128, 256, 512 or 1024) of the 2D tract series and enter a ser-ies name.
7. Click |OK| to confirm.
The output series will be generated.
Creating and viewing of 3D Projection Tract Series
3D Projection Tract Series are created by defining multiple viewpoints to a script (list of storedviewpoints). These viewpoints can also be deleted or updated within the script.
1. Click ’3D Projection Tract Series’ on the FiberTrak toolbar.
The window to define 3D Projection tract series will open.
2. Navigate through the FiberTrak dataset to display the data at the first desired viewpoint.
Note that all elements of navigation can be used to define each view in the script. E.g.transparancy can be differently between views so that it appears that a slice is slowly dis-appearing.
3. Click on the ’Add’ icon to add this viewpoint to the script. This view will be saved as ’view0(start)’.
4. Navigate through the FiberTrak dataset to display the data at the next desired viewpoint.
5. Define the number of frames between the previous and the current viewpoint, e.g. 20.
6. Repeat the steps 3 to 5 as often as required.
7. Click |Preview| to check if the viewpoints have been chosen correctly.

FiberTrak: Advanced Workflows Workflows Review and Analysis packages
Philips MRI 295
Phili
ps H
ealth
care
4598
006
437
51/7
81 *
03/
2014
*7
If necessary,
8. Select a viewpoint by simply clicking on it. Navigate to a different view and click |Update|to change this viewpoint.
9. Click |Generate| to generate the output series. Clicking |Close| closes the window withoutgenerating output series.
10. Define the image resolution (512 or 1024) of the 3D tract series and enter a series name.
11. Click |OK| to confirm.
The output series will be generated.
Script Editor ’3D Projection Tract Series’
The script editor offers several options concerning the adminstration of these scripts, e.g.scripts can be stored, deleted or a preview can be generated. The following table summarizesthe possibilities.
Icon Description
A new script will be created. All of the entry fields within the ’3D Projection Tract Series’ willbe cleared in order to enter new values and to save new views.
The current script will be stored. It will be necessary to enter a name for this script.
The current script will be deleted.
The current script will be shown as a preview.
The preview will be stopped.
The current viewpoint will be updated to the actual navigation settings.
Tips for Fiber Tracking
Drawing ROIs in Multiple ROI Fibertracking
When a fiber is to be identified using two ROIs it is important that the ROIs are created in thecorrect fashion. One example is given below:

Workflows Review and Analysis packages FiberTrak: Advanced Workflows
296 Philips MRI
Phili
ps H
ealth
care
4598
006
437
51/7
81 *
03/
2014
*7
Fig. 146: Coronal planes of occipital and frontal lobe with ROIs.
Fig. 147: Resulting fibers. Left: Transverse view. Final tract.. Right: Oblique coronal view. The ROI fully includes thetract. If the ROI had been too small, only part of the IFO would have been identified.
In order to identify the "inferior fronto-occipital fasciculus" (IFO), two (coronal) ROIs have to bedefined in the frontal and occipital lobe respectively. It is advised to overlay FA colors to theanatomical background to guide the drawing of ROIs. The given delineation (yellow line) isclearly drawn in a "wide" manner: the combination of the two ROI's will identify the tract.
Quick Fiber Search
In some cases it is convenient to perform a quick search for tracts first, after which the accuratedelineation can take place. One way to do this is to combine ’Single ROI Fiber Tracking’ with afreehand ROI. Drawing a ROI anywhere in the images will quickly identify the tracts in this area.
Combine fMRI results with the FiberTrak results
It is possible to combine fMRI results with the FiberTrak package. In order to do so the fMRIresults should have been saved from within the IViewBOLD package into a separate series.These series can simply be loaded into the FiberTrak package and viewed as the "anatomic".

BOLD imaging Workflow Workflows Review and Analysis packages
Philips MRI 297
Phili
ps H
ealth
care
4598
006
437
51/7
81 *
03/
2014
*7
BOLD imaging Workflow
Patient preparation and positioningBOLD imaging demands for optimum patient cooperation.
► Instruct the patient carefully about what to expect and about the paradigms he/she has toperform. It might be helpful to train the patient already outside of the scanner.
► Tell the patient what he/she has to do, e.g. "Move the right thumb", and practice.
► Tell him/her also what is not desired, e.g. "Do not move the whole hand or even the arm"as this might give a stimulus correlated activation which may influence the functional result.
► With visual stimulations, ensure that the patient can see the required information on screenby means of a mirror on the coil.
► Position the patient as usual.
Start up IViewBOLD
Real-time BOLD analysis
1. Start a BOLD imaging ExamCard.
In general, a survey and a reference scan are performed.
2. Select ’IViewBOLD’ from the Analysis menu (without selecting a thumbnail dataset).
In real-time mode, a message is displayed indicating that the system is waiting for a newscan to start: "Waiting for new scan to start."
The IViewBOLD package opens with the last-used paradigm.
NOTICEWhen the IViewBOLD package is started, without a selected scan in the pictorial index, thepackage will start in real-time mode.
This is only possible for the acquisition context.
3. Optional: Select a paradigm if the current paradigm is not the correct one (or edit the cur-rent paradigm or generate a new paradigm).
4. Instruct the patient and start the BOLD scan.
5. View the SPMs in real-time.
Postprocessing (existing BOLD scans)
1. Right-click on a suitable BOLD dataset (minimum of 6 dynamics) in the Thumbnail View.
A context menu appears.

Workflows Review and Analysis packages BOLD imaging Workflow
298 Philips MRI
Phili
ps H
ealth
care
4598
006
437
51/7
81 *
03/
2014
*7
2. Click ’IViewBOLD’.
3. The IViewBOLD package opens with the last-used paradigm.
4. Optional: Select a paradigm if the current paradigm is not the correct one (or edit the cur-rent paradigm or generate a new paradigm).
5. Click ’Compute’ to calculate the Statistical Parametric Maps (SPMs).
In the info line, the message appears: ’Analyzing scan. X dynamics processed. ... Ready.’
NOTICEIn real-time mode, the computation is performed automatically.
6. View the SPMs.
View the SPMsStatistical Parametric Maps (SPMs) are computed using the General Linear Model (GLM) andrepresent the results of statistical tests (e.g. t-tests), computed at every voxel in the images.These t-tests will show a larger value when it is even more likely that the signal changes ’follow’the applied paradigm.
Modify the results display
1. Click on the up/down arrows besides the toolbar icons to increase or decrease the valuesof 'Cluster Size', 'Threshold', 'Mask' or manually enter a value.
2. Click ’Negative Statistics’ to enable or disable this function.
Fig. 148: Icons from left to right: Cluster size, Threshold, Mask, Negative Statistics.
3. To change the color range: mid-drag while pressing the |Ctrl| key.
Horizontal movement increases or decreases the color range, vertical movement shifts therange. The SPM and the tile viewer will automatically be refreshed.
Load anatomical reference images
1. Drag the required anatomical dataset from the pictorial index into the package .
NOTICEMultiPlanar Reformats and Fiber Tracking results (2D cross-section) can be used as an under-lay.

BOLD imaging: Paradigm Handling Workflows Review and Analysis packages
Philips MRI 299
Phili
ps H
ealth
care
4598
006
437
51/7
81 *
03/
2014
*7
Enable or disable Motion correction
1. Enable or disable ’Motion correction’ from the ’IViewBOLD’ menu.
2. Click ’Compute’ to recalculate the maps.
Adjust Blending and Threshold
1. Right-click on a map.
2. Select ’Adjust Blending and Threshold’.
3. Drag up- and downwards to adjust the threshold.
4. Drag to the right or the left to adjust the blending.
Save results
1. Right-click on a map.
2. Select ’Save results’.
3. Select either ’Statistics’ or ’Color Overlay’.
A new series will be generated.
The new series can be viewed with ImageView.
Calculate a TID1. Click ’Show Time Intensity Curve’ to open the TID window.
2. Click ’ROI type’ and select the ROI type:
• Freehand (for any kind of shape),
• Bezier (for paraboloid or sinusoid shape of ROI),
• Ellipsoid (for circular or any kind of ellipsoid ROI)
3. Click ’Draw ROI’.
• Click once to start drawing.
• Drag to define the contour.
• Click to close the contour.
4. Click ’Compute’ to calculate the TID.
5. Right-click on the graph display to access the right mouse menu and change the graph dis-play.
For more information, chapter “Time-Intensity Diagram (TID)” on page 172.
BOLD imaging: Paradigm HandlingThis paragraph describes how to handle paradigms in the IViewBOLD package:
• Select a paradigm

Workflows Review and Analysis packages BOLD imaging: Paradigm Handling
300 Philips MRI
Phili
ps H
ealth
care
4598
006
437
51/7
81 *
03/
2014
*7
• Set up a new paradigm
• Edit a paradigm (starting up with the current paradigm)
• Paradigm Editor
• Delete a paradigm
Select a paradigm► Select ‘Select Paradigm’ from the IViewBOLD toolbar.
A list of the available paradigms is displayed.
► Select the desired paradigm.
► Click |Ok| to apply the selected paradigm.
Clicking |Cancel| closes the dialog box without applying the changes made.
NOTICEThe ’Select paradigm’ option is disabled when a calculation is running.
Delete a paradigm1. Select ‘IViewBOLD’ on the toolbar.
2. Select ‘Select Paradigm’.
A list of the available paradigms is displayed.
3. Select the paradigm that has to be deleted.
4. Click |Delete|.
A prompt appears:
’Are you sure you want to permanently delete the selected paradigm?’
5. Click |Yes| to delete the paradigm.
Clicking |No|, no paradigm is deleted.
The list of paradigms will be updated.
Set up a new paradigm► Select ‘New Paradigm’ from the IViewBOLD toolbar.
The paradigm editor opens with an empty (paradigm editor) dialog box.
► Create a paradigm according to the tasks performed and save this paradigm under a newname.
See chapter “Paradigm Editor” on page 301 for more information.

BOLD imaging: Paradigm Handling Workflows Review and Analysis packages
Philips MRI 301
Phili
ps H
ealth
care
4598
006
437
51/7
81 *
03/
2014
*7
Edit a paradigm► Select ‘Edit Paradigm’ from the IViewBOLD toolbar.The paradigm editor opens and displays
the settings of the current paradigm.
► Edit the settings of the chosen paradigm.
► After editing, |OK| can be used to apply this paradigm.
Or |Save| can be used to save the changes for later usage.
For more information, see chapter “Paradigm Editor” on page 301.
Paradigm EditorThe paradigm editor allows to define and edit paradigms. The figure shows the layout of theparadigm editor.
Fig. 149: Definition of a language-speech paradigm using the paradigm editor: generation of words during the first 10dynamics, rest during the 10 next dynamics. Note that "Paradigm Repetition Length" equals 20 to include both 10dynamics of activation, and 10 dynamics of rest.
Paradigm Name
• Enter a paradigm name.
The name should reflect the general identity of the BOLD examination.
Paradigm Repetition Length
• Specify the paradigm repetition length, either numerically or by using the up- and down ar-rows.
The paradigm repetition length is defined by the number of dynamics which are to be per-formed repeatedly, e.g. the paradigm repetition length is 20 in an experiment of 10 activa-tion dynamics alternating with 10 rest dynamics.
NOTICEIn the above example, the ’Paradigm Repetition Length’ is set to 20 and the language task (ac-tive) is defined as dynamics 1 to 10. This automatically results in dynamic 11 to 20 being thedynamics in rest.

Workflows Review and Analysis packages BOLD imaging: Paradigm Handling
302 Philips MRI
Phili
ps H
ealth
care
4598
006
437
51/7
81 *
03/
2014
*7
SPMs
• Enter a SPM name, e.g. ’visual’.
• Drag the left mouse on the grid to mark or unmark the dynamic scans with brain activation(the dynamics where a stimulus is presented or a task has to be performed).
Only 50 dynamics are visible simultaneously. To view more dynamics, a scrollbar can be used.
See chapter “Statistical Parametric Maps (SPMs)” on page 168 for more information on the sta-tistics.
NOTICEDynamics in rest may not be marked as task, because all inactive dynamics are considered asreference in the SPM calculation.
If however this would be the case, an error message would be displayed in the bottomline: ’Task 1 has all dynamics defined as active’.
Icons
• Click on the up/down arrows to increase or decrease the values or manually enter a value.
Fig. 150: Icons
1 Smoothing
2 Hemodynamic Delay
3 Cluster Size
4 Threshold
5 Map Color Range
6 Negative Statistics
See chapter “Statistical and viewing parameters” on page 169 for more information.
Standard Deviation
• Click on the check box to enable or disable the calculation of the standard deviation map.By default, the calculation of the standard deviation map is disabled.

BOLD imaging: Esys synchronization Workflows Review and Analysis packages
Philips MRI 303
Phili
ps H
ealth
care
4598
006
437
51/7
81 *
03/
2014
*7
Save the paradigm
• Click |Save| to save the paradigm.
The paradigm is only saved, but not applied in this case.
In case of saving a paradigm without changing its name, a window pops up: "Confirm file re-place: Paradigm already exists. Do you want to replace it?"
Click |Yes| to confirm file replacement.
Asterisk
An asterisk behind the name of the current paradigm indicates that the original paradigm hasbeen edited (but has not been saved).
NOTICEThe Info line at the bottom of the window indicates if a paradigm is valid or not and gives hintson how to correct a problem.
• Click |Ok| to apply the paradigm and to leave the paradigm editor.
Clicking |Cancel| closes the dialog box without applying the changes made.
BOLD imaging: Esys synchronizationThis chapter describes the basic functionality of the Esys Synchronization Protocol (ESP). Thissynchronization will assure that the Esys will initialize, start paradigms etc., all automatically,started from instructions sent by the scanner. ESP will also update the operator behind thescanner console of the status of the Esys. This means that the operator will no longer need toperform any activity on the Esys itself during standard clinical BOLD imaging, when the ESP isused.
Workflow1. Turn the Esys on.
2. Enter the patient and examination data at the scanner’s console.
The patient name and session number will be sent to the Esys when the first fMRI BOLDscan is performed. This creates a new unique Esys session linked to this patient name.
3. Prepare the patient and position him/her in the scanner with the required Esys devices:
• keyboard with buttons needed for paradigm interaction
• a display attached to the head coil
• the dedicated Eloquence headset
4. Select and start a BOLD ExamCard with IViewBOLD as inline processing step.
The surveys and reference scans are performed.

Workflows Review and Analysis packages BOLD imaging: Esys synchronization
304 Philips MRI
Phili
ps H
ealth
care
4598
006
437
51/7
81 *
03/
2014
*7
Fig. 151: Typical BOLD ExamCard with IViewBOLD SmartLine processing step.
5. Plan the anatomical scans and resume the ExamCard.
The ExamCard is executed.
When the BOLD scan is started, the paradigm name and the specific timings of the BOLDexperiment are sent to the Eloquence. Then the instructions of the paradigm are started atthe Esys.
6. Let the patient confirm by pressing the ’Okay’ button that he/she understood the instruc-tions.
• Automatically, the information that the Eloquence and the patient are ready is sent tothe scanner. The IViewBOLD package and the ExamCards info bar display an appropriatemessage.
• When the preparation of the BOLD scan is finished, a pop-up window appears to startthe BOLD scan.
7. Click |Proceed| to start the BOLD scan.
• The FBI box creates an RF-trigger which identifies the exact beginning of the paradigm.
• When the scan is finished, an ’end’ message is sent to the Esys, and the Esys will getready for the next paradigm.
• The IViewBOLD package is launched automatically with the correct paradigm.
8. Proceed with the IViewBOLD analysis.
Add IViewBOLD SmartLine processing to ExamCardIn general, postprocessing steps can be added to the ExamCard as SmartLine processing stepswhich are executed automatically as part of the ExamCard.
This chapter describes how to add an IViewBOLD processing step to an BOLD ExamCard.
Workflow
1. Select a preferred BOLD ExamCard or preset procedure.
NOTICEDo not yet start the scan.

BOLD imaging: Esys synchronization Workflows Review and Analysis packages
Philips MRI 305
Phili
ps H
ealth
care
4598
006
437
51/7
81 *
03/
2014
*7
2. Start IViewBOLD.
3. Select or create a paradigm with a name that exactly matches the name of the paradigm onthe Esys (including language). For example, if you want to start the "Cognitive" paradigm,using the run name "N-Back" with the language set to "Italiano", a paradigm must be start-ed/created with the following name: "Cognitive+N-Back+Italiano".
NOTICEThe paradigm name, run name and language must be separated by + characters.
4. Make sure that all the settings for analysis are set correctly. Note that the information ontiming (e.g. how many dynamics for a certain block etc) will be sent to the Esys, and thiswill influence the actual paradigm run.
5. Start the BOLD scan.
6. Close the IViewBOLD package when the scan is finished.
Now there is a newly created processing step with the name of the desired paradigm, andlinked to the performed BOLD scan.
7. Save the ExamCard.
The next time that this ExamCard is executed, the IViewBOLD package and the Esys willstart automatically.
NOTICENot only the entire ExamCard will be saved, but also the processing step itself (with a specificparadigm name).
In this way, various processing steps can be saved and attached to BOLD scans at any time. Eachprocessing step will be linked to a specific paradigm and run so that the processing steps basi-cally determine which paradigm is chosen.
NOTICEMake sure that the correct paradigm name is used with the notation "Paradigm+ Run+Lan-guage" where the three components exactly match the paradigm name on the Esys.
More about the synchronization• In case of a scan abort initiated by the operator, the paradigm-run will automatically be
stopped.

Workflows Review and Analysis packages Neuro T2* Perfusion Workflow
306 Philips MRI
Phili
ps H
ealth
care
4598
006
437
51/7
81 *
03/
2014
*7
• If the Eloquence doesn’t know the paradigm name (e.g. due to a typo), the Eloquence willrespond with a message "Paradigm is not available, cannot proceed". In this case, the se-quence can be stopped or continued.
• If the paradigm cannot be run because of timing problems, the Eloquence will respond witha message "Paradigm available, but cannot proceed". In this case, the sequence can bestopped or continued. In this case the synchronization of the paradigm will very likely beincorrect. Reasons for timing problems might be a conflict between paradigm repetitionlength (in ms) and a TR which has been set to a too large value.
Protocol requirementsIn order to assure correct synchronization, the following prerequisites must be met:
• The parameter ’Synch. ext. device’ must be set to ’Yes’ and the first RF trigger must be setto the dynamic ’1’.
• A manual start is needed.
• The parameter ’Real-time reconstruction’ must be enabled to allow for the presentation ofpre-scan calibrations and presentation of instructions to the patient.
Neuro T2* Perfusion Workflow
Start up the Neuro T2* Perfusion package1. Right-click on a suitable neurological perfusion data set in the Thumbnail View.
A context menu appears.
2. Select 'Neuro T2* Perfusion’.
The package opens.
Moving the cursor over either the original image or the map, the curve and the numerical re-sults originating from the current pixel will be shown.
Navigate through imagesThrough dynamics
► In the image viewport, drag to the left or to the right.
Through slices
► In the image viewport, drag up- or downwards.
Through maps
1. In the map viewport, drag to the left or to the right.

Neuro T2* Perfusion Workflow Workflows Review and Analysis packages
Philips MRI 307
Phili
ps H
ealth
care
4598
006
437
51/7
81 *
03/
2014
*7
Adjust the thresholdBy default, the 'Adjust Threshold' function is automatically enabled: the threshold mask is laidover the original image.
Setting a threshold mask will exclude background pixels from the functional map calculations.
1. Right-drag up- and downwards to adjust the threshold.
Calculation of the perfusion results using the AIF1. Select ’Arterial Input Function’ from the 'Select Algorithm' drop-down menu.
A red square shows up in the image viewport. This red square spans the size of 7 by 7 vox-els. In the right viewport the dynamic curves of these 7x7 voxels are shown.
2. Move the red square to the arterial vessel from which the AIF is supposed to be derived.
3. Click on the individual graphs if they are to be included in the definition of the AIF.
The selected graphs will be green.
4. Right-click on the graphs and press 'Proceed' to confirm.
Now the AIF is identified and the resulting maps will be shown.
Generate results
Results per pixel
In order to generate results per pixel, you have to select a pixel. This can easily be done bypointing at a pixel on the original image or the map. Prerequisite is that the pointer is inthe ’Follow Mouse’ mode.
1. Right-click on the curve view port.
2. Click to enable ’Follow Mouse’.
3. Move the pointer over the image or the map.
Results will be updated with every move of the pointer.
Results per ROI
1. Right-click on one of the image viewports and set the Interaction mode to ’Draw ROI’.
2. Drag the left mouse over the image to draw a ROI.
Release the left mouse button to close the ROI.
3. Right-click on the graph and select ’ROI average’.
You can draw up to 5 ROIs on any desired slice. Scroll through the slices between drawing ifnecessary.
• When 5 ROIs are drawn, the function 'Draw ROI' is automatically disabled.

Workflows Review and Analysis packages Basic T1 Perfusion Workflow
308 Philips MRI
Phili
ps H
ealth
care
4598
006
437
51/7
81 *
03/
2014
*7
• The 5 ROIs are initially called ROI A, ROI B, ROI C, ROI D and ROI E. The names are given in arandom order.
Generate a new imaging series► Click ’Generate series’.
A new imaging series will be generated within the current examination.
Note that several output choices are provided in the ’Generate’ box.
Basic T1 Perfusion Workflow
Start up the Basic T1 Perfusion package1. Right-click on a suitable perfusion data set in the Thumbnail View.
A context menu appears.
2. Select 'Basic T1 Perfusion’.
The package opens.
Moving the cursor over either the original image or the map, the curve and the numerical re-sults originating from the current pixel will be shown.
Navigate through imagesThrough dynamics
► In the image viewport, drag to the left or to the right.
Through slices
► In the image viewport, drag up- or downwards.
Through maps
1. In the map viewport, drag to the left or to the right.
Adjust the thresholdBy default, the 'Adjust Threshold' function is automatically enabled: the threshold mask is laidover the original image.
Setting a threshold mask will exclude background pixels from the functional map calculations.
1. Right-drag up- and downwards to adjust the threshold.

SpectroView Workflow Workflows Review and Analysis packages
Philips MRI 309
Phili
ps H
ealth
care
4598
006
437
51/7
81 *
03/
2014
*7
Generate results
Results per pixel
In order to generate results per pixel, you have to select a pixel. This can easily be done bypointing at a pixel on the original image or the map. Prerequisite is that the pointer is inthe ’Follow Mouse’ mode.
1. Right-click on the curve view port.
2. Click to enable ’Follow Mouse’.
3. Move the pointer over the image or the map.
Results will be updated with every move of the pointer.
Results per ROI
1. Right-click on one of the image viewports and set the Interaction mode to ’Draw ROI’.
2. Drag the left mouse over the image to draw a ROI.
Release the left mouse button to close the ROI.
3. Right-click on the graph and select ’ROI average’.
You can draw up to 5 ROIs on any desired slice. Scroll through the slices between drawing ifnecessary.
• When 5 ROIs are drawn, the function 'Draw ROI' is automatically disabled.
• The 5 ROIs are initially called ROI A, ROI B, ROI C, ROI D and ROI E. The names are given in arandom order.
Generate a new imaging series► Click ’Generate series’.
A new imaging series will be generated within the current examination.
SpectroView WorkflowThe table summarizes the workflow for processing of spectral data:
Single Voxel Spectroscopy (SVS) Chemical Shift Imaging (CSI)
1 • Start up SpectroView • Start up SpectroView
2 • Select a script • Select a script
3 • Select relevant voxels
4 • Run the script
• If necessary: zooming and panning.
• Run the script
5 • Optimize the spectrum display • Optimize the spectrum display

Workflows Review and Analysis packages SpectroView Workflow
310 Philips MRI
Phili
ps H
ealth
care
4598
006
437
51/7
81 *
03/
2014
*7
Single Voxel Spectroscopy (SVS) Chemical Shift Imaging (CSI)
6 • Modify the layout • Modify the ayout
7 • Create screen captures
• Storage and export of data
• Create screen captures
• Storage and export of data
Start up SpectroView► Right-click on a suitable spectroscopic dataset in the Thumbnail View.
A context menu appears with several selection possibilities.
► Click on the ’SpectroView’ icon.
The SpectroView package opens.
SpectroViewFig. 152: SpectroView icon
Alternatively:
• Double-click on a spectroscopic dataset OR
• Drag a spectroscopic dataset into the viewports.
NOTICEIf ’Anatomic Region’ is specified on ExamCard level, the corresponding Basic script is automati-cally executed for processing time domain data.
NOTICEIf no ’Anatomic Region’ is specified on ExamCard level, a pop-up is displayed, indicating thata ’brain’ processing script is executed.
After processing, a new Basic script can be selected.
NOTICEIf voxels fail, there will be a pop-up after all voxels have been processed, that gives informa-tion about the error(s).
More information is found in the ’Status’-tab.
Select a scriptA script is a set of processing steps that are performed to analyze and display a spectrum (or setof spectra).
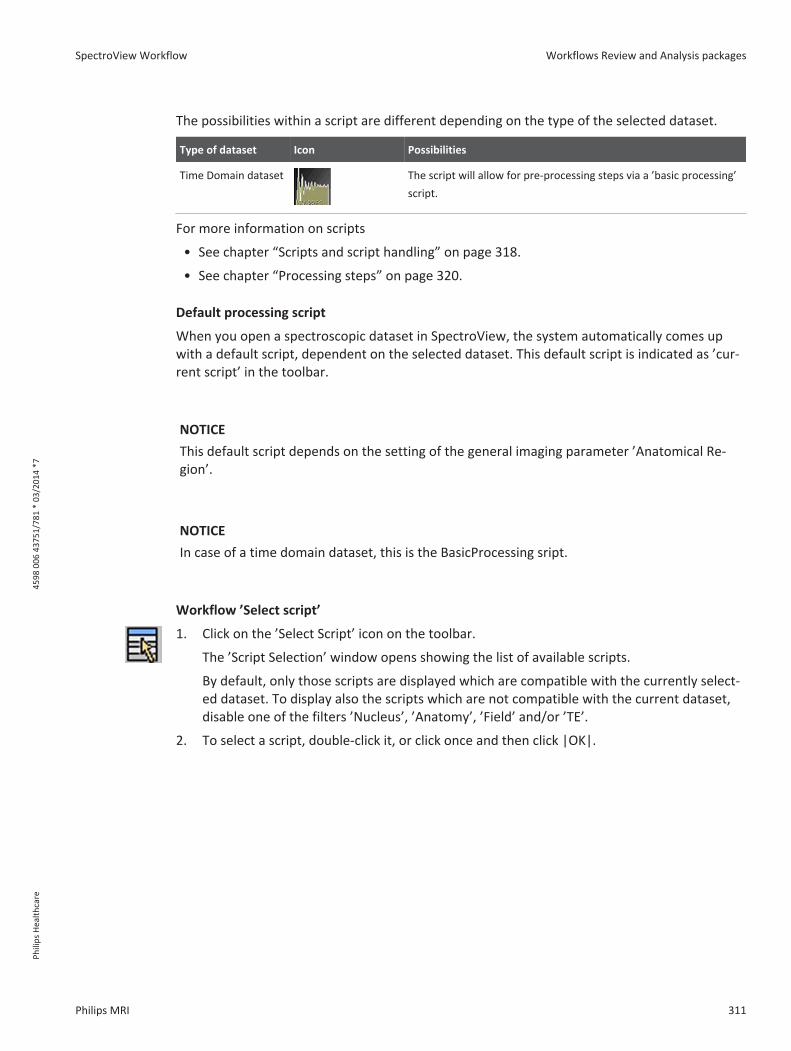
SpectroView Workflow Workflows Review and Analysis packages
Philips MRI 311
Phili
ps H
ealth
care
4598
006
437
51/7
81 *
03/
2014
*7
The possibilities within a script are different depending on the type of the selected dataset.
Type of dataset Icon Possibilities
Time Domain dataset The script will allow for pre-processing steps via a ’basic processing’script.
For more information on scripts
• See chapter “Scripts and script handling” on page 318.
• See chapter “Processing steps” on page 320.
Default processing script
When you open a spectroscopic dataset in SpectroView, the system automatically comes upwith a default script, dependent on the selected dataset. This default script is indicated as ’cur-rent script’ in the toolbar.
NOTICEThis default script depends on the setting of the general imaging parameter ’Anatomical Re-gion’.
NOTICEIn case of a time domain dataset, this is the BasicProcessing sript.
Workflow ’Select script’
1. Click on the ’Select Script’ icon on the toolbar.
The ’Script Selection’ window opens showing the list of available scripts.
By default, only those scripts are displayed which are compatible with the currently select-ed dataset. To display also the scripts which are not compatible with the current dataset,disable one of the filters ’Nucleus’, ’Anatomy’, ’Field’ and/or ’TE’.
2. To select a script, double-click it, or click once and then click |OK|.

Workflows Review and Analysis packages SpectroView Workflow
312 Philips MRI
Phili
ps H
ealth
care
4598
006
437
51/7
81 *
03/
2014
*7
Fig. 153: Script selection window (English only). Currently selected dataset is a MRS proton short-TE dataset acquired in the brain on a1.5T system. Only compatible scripts are listed since all filters are enabled. If you disable ’Anatomy’, besides the brain scripts also themuscle, breast and prostate scripts will be shown.
Run the Script1. Click on the ’Run Script’ icon on the toolbar.
Alternatively click |Run| within the script editor.
Zoom, Pan and Window for SpectroView
If necessary, zooming and panning can be performed now.
To zoom the spectrum,
• press middle and right mouse simultaneously. Move the mouse up and down to increase ordecrease the displayed peak heights. Move the mouse left and right to increase or decreasethe displayed chemical shift range.
To pan the spectrum,
• press middle and left mouse simultaneously. Move the mouse to pan the spectrum.
To change color range and threshold of color overlays,
• Press <CTRL> and middle mouse simultaneously to change the color settings. OR
• Select "adjust blending and threshold" from the image viewport menu to adjust treshold oropacity of the color overlay. If selected, dragging the left-mouse up and down changes thethreshold of the color overlay. Dragging the left-mouse left to right changes the opacity ofthe color overlay.
This is only relevant for CSI data where metabolite maps are generated:
Select Relevant Voxels
NOTICEThis operation is only valid for CSI data sets or for dynamic single voxel data sets.

SpectroView Workflow Workflows Review and Analysis packages
Philips MRI 313
Phili
ps H
ealth
care
4598
006
437
51/7
81 *
03/
2014
*7
There are two possibilities of how to select relevant voxels, either by clicking on voxels or bydrawing a ROI.
In both cases:
1. Click on the ’Voxel selection’ icon in the toolbar.
The drop-down menu opens.
2. Select one of the possibilities:
• Select Individual Voxels
• Select Voxels by Drawing
In voxel selection mode, the left mouse behaviour in the spectral grid is changed.
In case of ’Select Voxels by Drawing’
1. Draw a freehand ROI by holding the left mouse and selecting a region over which you wantto investigate. The voxels are automatically included based on the ROI drawn
In case of ’Select Individual Voxels’
1. Click on a voxel to select it.
The corresponding spectrum and the table of results will be displayed. The screen layoutmatches the SVS screen layout. (Note that the table of results will only be shown if a script hasbeen run before).
A new single click will select a new voxel and deselect the previously selected voxel. The spec-trum and the table of results will be displayed again.
Multivoxel Selection Mechanisms
1. Click to select another voxel while simultaneously pressing <CTRL>.
<CTRL> + left mouse click will select any unselected voxel and deselect any selected voxel.The other voxel will be selected additionally to the previously selected one. The spectrafrom the selected voxels are displayed.
2. Click to select one voxel, click once more to select another voxel while simultaneouslypressing <Shift>.
The two points define a box. All voxels in this box will be selected. The spectra from theselected voxels are displayed.

Workflows Review and Analysis packages SpectroView Workflow
314 Philips MRI
Phili
ps H
ealth
care
4598
006
437
51/7
81 *
03/
2014
*7
NOTICEVoxel select can be chosen before a script is run to choose which voxels get processed.
If no voxels are chosen before processing, a default grid of 5x5 voxels in the PRESS volume isdisplayed after processing.
Voxel color description
To facilitate further processing, the voxels are overlaid by a colored grid to indicate their cur-rent processing state:
• Blue outline: Voxels have been included in processing steps.
• Yellow shaded voxels: Voxel is currently displayed.
• Red outline: Voxel failed processing.
Right-clicking in the image display viewport and selecting "select all processed voxels", the pre-viously processed voxels will be reselected.
NOTICEFollowing the initial script generation, additional voxels can be added to the original process-ing as long as the script has not been changed.
Fig. 154: Example of voxel colors.
Optimize spectrum displayThe spectrum display can be modified for any single spectrum display: SVS, one voxel CSI or oneaverage of CSI.
1. Right-click on the spectrum display area to access the ’spectrum display’ context menu.This menu offers possibilities as e. g.
• show or hide list of spectrum data
• show or hide spectrum and/or metabolite labels

SpectroView Workflow Workflows Review and Analysis packages
Philips MRI 315
Phili
ps H
ealth
care
4598
006
437
51/7
81 *
03/
2014
*7
• show fitted spectrum and/or fitted baseline
• select spectrum component for display (e.g. modulus, real)
2. Access the spectrum viewport context menu for multi-voxel display, via a right mouse clickon the spectrum grid area. This menu offers possibilities as e.g.
• show or hide list of spectrum data
• specify quantities to be displayed
• set spectrum limits
• define type of display for spectra
• select spectrum component for display (e.g. modulus, real)
See section chapter “User Interface” on page 190, for more information on both menus.
Modify Layout1. Click on the Layout icon to change the screen layout and select an option:
The resulting layout will be:
As layout requirements are different for SVS and CSI-cases, either one of the icons is grayedout, depending on the scan that is currently selected in SpectroView.
• the default screen layout with three image viewports at the top of the screen, agraph display area and a result display area.
• a screen with spectra only. The graph display area will be enlarged to fill theentire screen.
• a screen with a table of results only. The result display area will be enlarged to fillthe entire screen.
• a screen with spectra on the image.
In case of CSI
1. Select the type of display from an array of selected spectra.
2. Click on either of the following icons:
• Horizontal display: The graphs are displayed horizontally. This is a multiple grapharea mode.
• Stack display: The graphs are displayed vertically in one box with no dividing lines.This is a multiple graph area mode.

Workflows Review and Analysis packages SpectroView Workflow
316 Philips MRI
Phili
ps H
ealth
care
4598
006
437
51/7
81 *
03/
2014
*7
Spacing between spectra in stack display mode can be changed as follows: Press <Shift>and simultaneously, press both middle and right mouse icons. Moving the mouse up-wards increases the space between spectra; moving the mouse down decreases thespacing between spectra. This does not affect the spectra themselves and is not applica-ble in other CSI display modes.
• Geometrical display (default layout): The graphs are displayed in viewports beingstructured in the same layout as in the CSI grid. Voxels that are not selected in the CSIgrid have an empty corresponding graph.
• Compressed display: The graphs are displayed compactly, one by one in a squareor rectangular array with a minimum of blank entries.
Create screen capturesThere are different possibilities to create screen captures. These are listed below:
• Select ’Screen Capture’ or ’Screen Capture as’ from the Tools menu.
• Select ’Print Screen’ via the corresponding icon on the general toolbar.
• Select ’Export Picture’ to store the current viewport with overlays included as a *.png file inthe E:\export directory.
Storage and export of dataThere are three different data formats with respect to storage of data:
1. DICOM-data (that is stored in the database) For single voxel, entry x.1 = time domain data,entry x2 to x.n are processed spectra. For CSI, x.1 is time-domain data, x.2 is image series.
Each time a processing script is performed, the results can be stored via the toolbar op-tion ’Store Processing Parameters’. A new entry is added to the database.
2. Export of spar/sdat This export functionality is available in research tools only: If a spectro-scopy dataset is selected for export in the DBIMEXP-research tool, spar/sdat data is export-ed to E:\export. In case of CSI series, par-rec data of the corresponding spectroscopic im-ages is also exported.
3. Output to a spreadsheet application
– Create a file named csvoutput.txt in E:\export. (empty file, it is used as a flag to tellSpectroV to enable CSV output. )
– Only if enabled: Each time you run a script, the following files are placed in the G:\site\spectro folder:[name].Fdd.csv - the Frequency Domain Data from the BasicProcessing Script[name]Baseline.csv - the fitted baseline data[name]Fitted.csv - the fitted peak data

SpectroView: Advanced Workflows Workflows Review and Analysis packages
Philips MRI 317
Phili
ps H
ealth
care
4598
006
437
51/7
81 *
03/
2014
*7
[name]ScaledRaw.csv - the scaled unfitted data[name]Script.txt - a textual description of the script used to produce the results[name]Table.csv - the table of Processing Results
By default this is disabled to prevent unnecessary pollution of the export directory. Thisfunction can be enabled via the toolbar function 'More'/'Enable CSV Output'. When thepackage gets closed the functionality is disabled by default.
NOTICEIn case of running BasicProcessing Script, the only files created are "Fdd.csv" and "Script.txt".
These files use the naming scheme:
<patient name>-<DICOM Study ID>-<DICOM Series ID>-<Date>-<Time>filename.ext
• <patient name> = the patient name with all the illegal filename characters and whitespaceremoved
• <DICOM Study ID>
• <DICOM Series ID>
• <Date> = the date of the script run
• <Time> = the time of the script run
The ".csv" files can be opened directly in Microscoft Excel and contain headers identifying eachcolumn. The data will contain X, Y, Z and T (time for dynamics) voxel coordinate columns (voxelsare 4-dimensional objects).
• For single slice data sets, the Zcoord column will always be "1"
• For non-dynamic data sets, the Tcoord column will always be "1"
• For single voxel data sets, the coordinates will always be (1,1,1,t).
• In CSI data sets, the voxel with coordinate (-1,1,1,t) is the "average voxel", it contains theaverage of all the currently selected voxels.
• Spectrum values in these files are expressed in PPM
A maximum of 20 datasets can be present in the folder. If more than 20 sets are in the folder,SpectroView deletes the oldest set, as determined by the timestamp in the filename.
SpectroView: Advanced WorkflowsThis section provides more information about the SpectroView package in order to achieve bestresults and to optimally handle the package.
It covers:
• User Interface
• Scripts and script handling

Workflows Review and Analysis packages SpectroView: Advanced Workflows
318 Philips MRI
Phili
ps H
ealth
care
4598
006
437
51/7
81 *
03/
2014
*7
• Processing steps
• Customization using the Peak Editor
• Series Preferences Database
Scripts and script handlingA script is a set of (pre-)processing steps that are performed to analyze and display a spectrum(or set of spectra). There are two different types of scripts:
• Basic Processing Scripts
A Basic Processing Script defines the pre-processing steps that can be enabled or disabled.
• Fitting Scripts
A Fitting Script defines the processing steps that can be enabled or disabled for the fittingprocess.
– chapter “Processing steps” on page 320 for more information about the (pre-) process-ing steps.
Scripts can be selected from a list, modified and then saved with changes.
The following paragraphs describe the script handling how to edit and save a script and how todelete a script.
Edit ScriptIt is possible to define user defined scripts. This can be done by editing an existing script:
1. Click on the ’Edit Script’ icon in the toolbar.
The script editor displays
• the name of the current script
• a description of the script and its purpose

SpectroView: Advanced Workflows Workflows Review and Analysis packages
Philips MRI 319
Phili
ps H
ealth
care
4598
006
437
51/7
81 *
03/
2014
*7
• anatomy, nucleus, echo time and supported field strengths
• a list with all possible processing steps, each with a checkbox to allow the user to enableor to disable the corresponding step.
2. Select a nucleus: 1H, 31P or 13C. In such a way, you can make a 31P script out of a 1H script.
3. Set the Echo time property to ’short’ or ’long’ (longer than 75 ms).
4. Click in the Field Strength checkboxes to specify whether this script is tuned for a specificfield strength or a range of field strengths.
NOTICEThe properties ’Nucleus, Echo Time and Supported Field Strengths’ are only used to drive theScript Selection Dialog filtering.
Changes to these properties do not impart any automated tuning to an existing script.
5. Click on the checkbox of a processing step to enable or disable the step for the script.
The enabled step will be highlighted. Once a step is highlighted, a page of parameters asso-ciated with the step will be displayed.
6. Set the parameters to the desired values.chapter “Processing steps” on page 320 for moreinformation on the processing steps and corresponding parameters. chapter “Scripts andscript handling” on page 318 for more information on the scripts.
NOTICEEdited scripts are renamed using the following format: <unnamed>date-time.
7. Click |Cancel| to close the dialog box without applying the changes made.
Clicking |Run| applies the script immediately and exits the script editor.
Clicking |Ok| can be used when a script has not been saved yet. It closes the dialog box andstores the edited script temporarily until another script or spectroscopic data set is select-ed. The edited script can still be run or edited later. This is an useful option in order tojudge the quality of a script prior to saving.
8. Save Script
The script is only saved, but not applied in this case.
• Click the ’SaveScript’ icon in the toolbar to save the script.
• Enter a name (when editing a Philips supplied script) and optionally a script description.
Delete Script• Click ’Delete Script’ on the SpectroView toolbar to delete the current script.

Workflows Review and Analysis packages SpectroView: Advanced Workflows
320 Philips MRI
Phili
ps H
ealth
care
4598
006
437
51/7
81 *
03/
2014
*7
Processing stepsThis section describes the processing steps which can be performed within a basic processingscript and/or fitting script.
Once a processing step is enabled, a page of parameters associated with the step will be dis-played in the Script Editor.
Fig. 155: Processing steps in Basic Processing Script for Single Voxel Imaging.
Fig. 156: Processing steps in Peak Fitting script.
1 General properties
2 Processing steps
3 Reserved for parameters belonging to the selected and thus highlighted processing step

SpectroView: Advanced Workflows Workflows Review and Analysis packages
Philips MRI 321
Phili
ps H
ealth
care
4598
006
437
51/7
81 *
03/
2014
*7
Available pre-processing steps in Basic Processing Script
For Single-Voxel Spectroscopy For Chemical Shift Imaging
• Dual Volume Decode
• Residual Water Subtraction • Residual Water Subtraction
• Time Domain Signal Shifting • Time Domain Signal Shifting
• Apodization Filtering • Apodization Filtering
• Zero-Fill and FT • Zero-Fill and FT
• Spectrum Phase Adjustment • Spectrum Phase Adjustment
• Shift Peak Frequency • Shift Peak Frequency
• Graph Display • Graph Display
• Integration Ranges for Maps
Available processing steps in Peak Fitting Script
For Single-Voxel Spectroscopy For Chemical Shift Imaging
• Dual Volume Decode
• Spectrum Phase Adjustment • Spectrum Phase Adjustment
• Initial Baseline Subtraction • Initial Baseline Subtraction
• Shift Peak Frequency • Shift Peak Frequency
• Select Peaks • Select Peaks
• Peak Fitting • Peak Fitting
• Results Table • Results Table
• Graph Display • Graph Display
• Generate Maps
• Correct for DSA Filter
Dual Volume Decode• is used to decode the (A+B) and (A-B) encoding used in Dual Volume acquisitions. There are
no adjustable parameters for this script step.
• appears at the top of all single voxel BasicProcessing scripts and at the top of all single voxelPeak Fitting scripts.

Workflows Review and Analysis packages SpectroView: Advanced Workflows
322 Philips MRI
Phili
ps H
ealth
care
4598
006
437
51/7
81 *
03/
2014
*7
Residual Water Subtraction• removes residual water signal by applying a high pass filter over which data points are com-
bined and subtracted from the original signal.
• gives the possibility to adjust the high pass filter by means of a slider.
Typical application
If the water suppression applied during acquisition is imperfect, the residual water peak can attimes interfere with the metabolite peaks of interest. One way to minimize its effect is to applya high pass filter in the time domain (D. Marion, M. Ikura, and A. Bax, "Improved Solvent Sup-pression in One- and Two-Dimensional NMR Spectra by Convolution of Time-Domain Data," J.Magn. Reson. 84, 425-430, 1989). Because water is at or near resonance, a high pass filter willselectively remove the low frequency water signal.
High Pass Filter
The filter works by first smoothing the input time-domain signal using Gaussian convolution.Each point is replaced by the average over a Gaussian-weighted window of points with a useradjustable width. The smoothed version of the input signal is then subtracted from the originalsignal to leave only the higher frequency "wiggles."
Slider values
The slider defines the width in points (specifically the FWHM) of the Gaussian-weighted win-dow of time-domain points.
Narrow window - broad filter
Only a few neighboring points are averaged together to replace each input point. Only the high-est frequency wiggles are smoothed away. When this function is subtracted from the original,only the highest frequency wiggles remain: a broad filter has been applied in the frequency do-main.
Wide window - narrow filter
Many points are averaged together, resulting in a very smooth function. When this is subtract-ed from the original, only frequencies very close to resonance will be affected: a narrow filterhad been applied in the frequency domain
Time Domain Signal Shifting• Can be used to shift the time domain signal to either remove spurious signals or to align
spectra. It will not be applied with standard acquisitions.
• Can be done with
– Shift with zero padding
This is a function to shift a time domain signal with an integer number of sample pointsby inserting zeroes. The point index for each point is changed by the parameter shift.The shift can be negative. Points that fall outside the array will be lost. If shift is greater

SpectroView: Advanced Workflows Workflows Review and Analysis packages
Philips MRI 323
Phili
ps H
ealth
care
4598
006
437
51/7
81 *
03/
2014
*7
than the total number of points N the result will be all zeroes. Typical use of the func-tion is to remove spurious signals at the beginning of a FID that can cause baseline dis-tortions in the spectrum.
– Cyclically shift
This is a function to shift a time domain an integer number of sample points. The pointindex for each point is changed by the parameter shift. The shift can be negative. Pointsthat fall outside the array will be appended at the other end. If shift is greater than thetotal number of points N, the result will be identical to a cyclic shift with parameter<shift> = (<shift> - k *N) points where k is any integer number. Typical use of the func-tion is to align spectra.
Note that the default shift is zero.
Apodization Filtering• improves the signal-to-noise in a dataset by partially filtering out the noise in a MRS signal
prior to Fourier transform (FT): before the Fourier transform (FFT) there is a decaying signalin a constant background of noise. This means that the signal to noise in the first points ofthe signal is better than in the last points of the signal. A weighting function can be appliedto emphasize the points with good signal to noise. The best weighting function is one thatfollows the decay of the signal. Because the peak areas should not be changed, the functionmust not change the data point of the FID corresponding to time zero. The intensity of thispoint before FFT is proportional to the total of the peak areas.
• allows to choose more than one filter if requested.
• The choice of filters includes the following:
Available Filters Description of Filter
Gaussian Multiplication • Applied to transform a Lorentzian line shape to a more compact Gaussian shape (thefoot of a Gaussian is smaller than Lorentzian shape, thus overlap of peaks is reduced).
• This can only be positive apodization.
• It causes a line broadening effect.
Exponential Multiplication • Applies a decaying exponential to increase the apparent SNR at the cost of a reduc-tion in resolution.
• Can be applied as an apodization or negative (for cancellation of T2 decay).
• Use of a positive value gives a an effect equal to ’Lorentzian line broadening’.
Convolution Difference • Can be used as a method for broad line suppression.
• The signal is multiplied with an exponential filter as in the exponential multiplicationfunction. The result of this operation is subtracted from the original filter.
• The difference is then scaled.

Workflows Review and Analysis packages SpectroView: Advanced Workflows
324 Philips MRI
Phili
ps H
ealth
care
4598
006
437
51/7
81 *
03/
2014
*7
Available Filters Description of Filter
Lorentzian-to-Gaussian • To change a line shape that is naturally Lorentzian, to a Gaussian line shape (if this ispreferred for analysis or presentation)
• The signal is first multiplied with a Lorentz window with a negative line width param-eter. Then the signal is filtered with a Gaussian function.
Broad Line Suppression • Multiplies the time domain signal with a function that has low intensity in the firstfew data points and is unity for all other points.
• Filters out broad line components
Sine Window • Applies a filter for suppressing artifacts in spectroscopic images.
• Usually not applied to the time domain of chemical shift data, but on the spatiallyencoding dimensions in a one or two-dimensional spectroscopic imaging
Sine Squared Window • This is the squared sine function. It is equivalent to 1/2 times a sine function of dou-ble width plus a lift of 1/2.
• This is known as the Hanning window.
It is often easier to use the exponential multiply and Gaussian multiply functions rather thanthe LG function. Performing the function in two steps allows more flexibility. It is therefore themost commonly used form of apodization filtering.
Use the Exponential multiplication with a negative line broadening value to get a line sharpen-ing (or de-convolution of the Lorentzian line shape). Combine this with a gaussian multiplicationwith a positive line broadening value. This positive line broadening must exceed the (negative)EM line sharpening value to have a noise filtering effect.
An example that should work for most proton spectra:
• Gaussian +3Hz, Exponential -1.5 Hz
This will result in an effective line broadening of 1,5 [Hz].
Related parameters
This section describes all related parameters of this script step, for all selectable filters.
Symmetry point
• is a value between 0.0 and 100.0 % giving the relative position of the echo top in the FID.
• is the point where the filter function should have the value one and should correspond withtime point zero.
– For a half echo FID (echo acquisition = half) it is at the start of the FID: the symmetrypoint = 0%.
– For a full or symmetric echo (echo acquisition = symmetric) the echo top position will bein the middle at 50 %.
– For maximum echo (echo acquisition = maximum) the position of the echo top will besomewhere between 0 and 50 %.
The symmetry point can either be selected at "echo max": the echo top position is automatical-ly defined, or at "xxx%", to manually specify the echo top position.

SpectroView: Advanced Workflows Workflows Review and Analysis packages
Philips MRI 325
Phili
ps H
ealth
care
4598
006
437
51/7
81 *
03/
2014
*7
Gaussian mult [Hz], Exp mult [Hz]
• sets the line broadening values for the respective filters.
Line broadening [Hz]
• appears when the Convolution Difference (CD) filter is selected. The purpose of the CD filteris to selectively remove broad underlying features in the spectrum, leaving only sharp lines.
• is the estimated line width of the broad component. Broad peaks decay quickly in the timedomain; hence the CD filter has a small value at the echo center (as defined by the symme-try point). Away from the echo center, it climbs quickly to a value of unity. As a result, broadsignal components are suppressed, whereas narrow components (which decay slowly in thetime domain) are only slightly affected.
• The filter function is defined as follows:
Wi = 1 - SC exp[ -N |i/N - SP| pi LB / (2 BW) ]
where
Wi = weighting factor for time point i
i = time point index
N = number of acquired time-domain points
SP = symmetry point of filter
SC = scale factor (0.0 < SC < 1.0)
LB = line width of the broad component
BW = bandwidth
Scale factor
• appears when the Convolution Difference (CD) filter is selected. The purpose of the CD filteris to selectively remove broad underlying features in the spectrum, leaving only sharp lines.
• controls how completely the broad component is minimized. Allowed values for SC lie be-tween zero and one.
Peak width [Hz]
• appears when the Lorentz-Gauss Multiply (LGM) filter is selected. The purpose of the LGMfilter is to convert Lorentzian lineshapes to Gaussian lineshapes to improve resolution. (Lor-entzian lines have broader "tails" than Gaussian lines with the same full width at half-maxi-mum).
• should be set to the line width for which the user desires the filter to work best.
Suppression factor
• appears when the Broad Line Suppression (BLS) filter is selected. The purpose of the BLSfilter is to selectively remove broad underlying features in the spectrum, leaving only sharplines.
• controls how completely the broad component is minimized.
Cut-off frequency

Workflows Review and Analysis packages SpectroView: Advanced Workflows
326 Philips MRI
Phili
ps H
ealth
care
4598
006
437
51/7
81 *
03/
2014
*7
• appears when the Broad Line Suppression (BLS) filter is selected. The purpose of the BLSfilter is to selectively remove broad underlying features in the spectrum, leaving only sharplines. (As such, it is similar to the Convolution Difference filter.)
• is the estimated dividing line in Hz that separates the width of broad components from thewidth of narrow components. Broad peaks decay quickly in the time domain; hence the BLSfilter has a small value at the echo center (as defined by the symmetry point). Away fromthe echo center, it climbs quickly to a value of unity. As a result, broad signal componentsare suppressed, whereas narrow components (which decay slowly in the time domain) areonly slightly affected.
• The filter function is defined as follows:
Wi = 1 / { 1 + SF exp[ -N |i/N - SP| pi Fc / (2 BW) ] }
where
Wi = weighting factor for time point i
i = time point index
N = number of acquired time-domain points
SP = symmetry point of filter
SF = suppression factor
Fc = cut-off line width between broad and narrow features
BW = bandwidth
Final points to zero
• allows the user to zero out a selected number of points at the end of the time-domain sig-nal -- the ultimate filter. Choosing 200, for example, will set the last 200 time-domain signalpoints equal to zero.
Multiple filters: workflow
1. Define first set of filter parameters.
2. At the top of the parameter panel, set ’Number of Filters’ from ’1’ to ’2’.
3. At the top of the parameter panel, set ’Edit Filter’ to ’2’.
4. All the parameters should be "reset" and you can now set them for ’Filter 2’.
5. To change the parameters for ’Filter 1’, change ’Edit Filter’ to ’1’.
6. For only 1 filter, change ’Number of Filters’ to ’1’.
Note that the order of filter selection doesn't matter as they are all multiplication filters.
Zero-Fill and FT
FT
• This processing step cannot be disabled, FT is always performed.To view time domain sig-nals, select right mouse menu item ’Display time domain signal for voxel x,x’.

SpectroView: Advanced Workflows Workflows Review and Analysis packages
Philips MRI 327
Phili
ps H
ealth
care
4598
006
437
51/7
81 *
03/
2014
*7
DC correction
• Enables or disables the use of DC correction (to remove DC offset). A DC offset can becaused by hardware imperfections, or by the presence of a non-relaxed low-frequency sig-nal (typically water), and will be presented as a spike.
• The window width is defined as a percentage of the total acquisition window, and is select-able between 1 and 15%.
Zero-Fill
• Is used to increase the number of points in a spectrum to a user defined value. The appa-rent digital resolution of the spectrum will be increased by increasing the digital number ofpoints.
More about zerofill
The acquisition time should be set to record the FID or echo until well past the point where thesignal disappeared into the noise. Rather than recording a signal with nothing in it but noise,some additional resolution may be obtained by zero filling.
Doubling the signal length by appending zeros will actually add information present in the imag-inary part of the complex points to the absorption spectrum. Zero filling more than a factor twowill just interpolate the spectrum without adding any more real definition.
Fig. 157: Zero filling results in interpolation in the frequency domain. The black line is a two peak spectrum with alow resolution. Zero filling the data to double the amount of points reveals two resolved peaks (gray line). The dash-ed thin grey line shows the smoothing effect of further zero filling. The resolution can improve significantly and azero filled spectrum will look better.
Zerofill the spectral transform to
• defines the total number of points in the spectrum (= acquired number of points + zerofillednumber of points)
– Recommended value: twice as high as the acquired nr of points.
– If zerofilling is not required, the number selected should be equal to the acquired num-ber of points.

Workflows Review and Analysis packages SpectroView: Advanced Workflows
328 Philips MRI
Phili
ps H
ealth
care
4598
006
437
51/7
81 *
03/
2014
*7
Spectrum Phase Adjustment• Allows the user to correct the phase of the spectrum using both zero-order (global) and
first-order (linear) terms.
• Both auto phasing and manual phasing can be selected.
Although any spectrum can be adjusted, this capability is most relevant for (a) non-protonspectra or (b) proton spectra acquired without an unsuppressed reference scan.
Autozeroth (global) term
• Zero order phase correction; being used if there are small delays between the transmit andreception of the signal in which the phase error has an influence on all peaks.
• Correction on a voxel-by-voxel basis.
Autofirst (linear) term
• First order phase correction in the case of phase differences which are present over variousresonance frequencies.
• Correction on a voxel-by-voxel basis.
Manual Phase Adjustment
If enabled,
• the selection of the above options is disabled.
• the script will stop once phase adjustment is required, popping up a separate window inwhich both global and linear phase correction can be manually adjusted by the user:
Ref. Voxel
Zero Order Term0 degrees
First Order Term0 degrees
GraphRealImaginaryModulus
Fine
Fine
Next step
Please set the pivot point and adjust the phase correction terms.
Fig. 158: Window ’Manual Phase Adjustment’: Sliders are just to interactively change the phase. Radio buttons areavailable for fine adjustments: the step size is reduced. Once phasing is completed, press ’Next Step’ to resume theexecution of the Basic Processing script.

SpectroView: Advanced Workflows Workflows Review and Analysis packages
Philips MRI 329
Phili
ps H
ealth
care
4598
006
437
51/7
81 *
03/
2014
*7
Provide phase values below
• allows you to program exact values into the script itself. The default values shown here rep-resent the values specified during the last Manual Phase Adjustment, as supplied by theSeries Preferences database. As in Manual Adjustment, these values are applied to all se-lected voxels. Clinically, this option is probably not useful, but for experiments requiring youto process the same dataset using the same parameters more often– this improves work-flow.
Integration Ranges for Maps• allows the upper and lower bounds of a peak to be selected (in ppm) to which the estimat-
ed metabolite map is created
Initial Baseline SubtractionDistortion of the spectral baseline caused by broad line resonances or missing data points canbe corrected for visual presentation with the function ’Initial Baseline Subtraction’.
’Initial Baseline Subtraction’ is used to remove large distortions from the spectral baseline asthey might confound later processing steps.
In this initial step, the ci variables are adjusted quickly and without knowledge of peak posi-tions. As such, this step is omitted by default for short-TE brain spectra – the simple-mindedalgorithm does not distinguish well between broad peaks and true baseline variation.”
‘Baseline estimation occurs again during the fitting process, where it is done more accurately.
'Baseline Polynomial Terms’ parameter
The baseline is modeled as a function of position x across the analysis range (e.g. 4.5 ppm to 0.0ppm) with x defined from -1.0 to 1.0. The baseline is assumed to be a polynomial of x; for exam-ple:
c3x3 + c2x2 + c1x + c0.
Using a slider, the user can choose the degree of the polynomial - the highest power of x to beconsidered and in such a way the number of terms. The ci variables are adjusted for the best fit- quickly and without knowledge of peak choices here in this step - and later with more careduring the peak fitting process.
Select PeaksThe next step for processing is to select and/or deselect the peaks that need to be fitted andquantitated.
'Metabolites’ parameters
A list of metabolite peak names is provided in which the user can select or deselect the peaks ofchoice.
Note that the default ON/OFF settings for peak selection are defined by the target anatomy andTE as conveyed by the choice of the script.

Workflows Review and Analysis packages SpectroView: Advanced Workflows
330 Philips MRI
Phili
ps H
ealth
care
4598
006
437
51/7
81 *
03/
2014
*7
Peak FittingAn iterative nonlinear least-squares technique is used to fit spectra as the sum of a set of peaks(each modeled as a linear combination of a Gaussian and a Lorentzian function) plus a baseline(modeled as a polynomial function of position). In particular, an algorithm developed by Mar-quardt and Levenberg is used that efficiently searches for the best fit. This fitting process gener-ates a list of optimized peak heights, widths, positions, and areas.
Definitions
Brief definitions are as follows:
Iterative
The fitted spectrum is not calculated in one shot. Rather, the initial estimate of the fitted spec-trum is refined over a series of steps (typically 6 to 10).
Nonlinear
Some of the variables in the fitted spectrum are not simply scaling factors (like the variablesthat describe the baseline), but rather are incorporated within the model functions used for thefit. An example is the set of peak width variables, these appear in the expressions for Gaussianand Lorentzian line shapes in complicated ways.
Least-squares fit
The least-squares fit minimizes the sum over the analysis range of (pi - fi)2, where
• pi is the value of the initial spectrum at point i
• fi is the value of the fitted spectrum at point i.
Parameters
Analysis Range parameter
These parameters refer to the range of chemical shifts (expressed in ppm). which has to be con-sidered while fitting the spectrum. The start and end value of this range can be entered as leftand right analysis limit.
The default range is 4.35 ppm to 0.0 ppm.
Display Range parameters
These parameters refer to the default range of chemical shifts (in ppm) to be displayed afterthe script is run. The initial choice is from 4.0 to 0.0 ppm. These limits can be modified using thecontext menu (activated with a right-mouse click) in the spectrum viewport.
Gaussian Percentage parameter
This parameter defines the percentage of Gaussian character of the fitted peak lineshapes. Thedefault value is 85%, based on trial-and-error adjustment of proton brain spectra. In general,metabolite peaks for in vivo proton spectroscopy are more Gaussian in nature than Lorentzian.An example of both lineshapes is presented in figure.
Gaussian Percentage Effect
0 % Pure Lorentzian line.

SpectroView: Advanced Workflows Workflows Review and Analysis packages
Philips MRI 331
Phili
ps H
ealth
care
4598
006
437
51/7
81 *
03/
2014
*7
Gaussian Percentage Effect
100% Pure Gaussian line.
Fig. 159: Lorentzian (shaded area) versus Gaussian (black line) lineshape. The two peaks shown have the same inte-gral area.
The Gaussian line is broader near the resonance frequency but trails off to zero more rapidlythan the Lorentz line.
Baseline Terms parameter
This parameter specifies how many polynomial terms are used to model the baseline during thepeak fitting process. A similar parameter is used in the ‘Initial Baseline subtraction’ step. Bothfunctions correct for distortions of the spectrum baseline.
However, the initial baseline subtraction is to remove large variations in the baseline so thatautomatic peak assignment is more likely to succeed. It is done quickly without any prior knowl-edge where the peaks are. It’s too crude a technique for short TE spectra, because it can’t read-ily distinguish between broad J-coupled (or lipid) peaks and rolls in the baseline. It is much bet-ter at long TE where the difference between peak and baseline is more obvious.
During the actual fitting process, the baseline (or the “residual baseline,” if it has been trimmedin the residual baseline subtraction step) needs to be included as part of the overall spectrumfit. Otherwise the peaks will not be modeled properly. The baseline function should be flexibleenough to follow the baseline, but not so flexible that it interferes with fitting the peaks them-selves. As noted above, the Baseline Terms slider controls this flexibility by specifying the num-ber of polynomials terms used during the fitting process.
Phase Parameter
Either the real spectrum or the modulus spectrum can be used in the fitting process. “Real” isthe default for single-voxel acquisitions, and “Modulus” is the default for CSI. However, if theCSI echo acquisition type was set to half echo instead of maximum, this phase parametershould be changed to “Real.”
Lock Relative Frequency parameter
When this fitting parameter is enabled, the number of free variables used to model the posi-tions of N peaks is reduced from N to one. It makes use of the fact that peak positions are usu-ally not independent of each other. For example, if the NAA peak position is known, one ex-pects creatine to be 1.01 ppm away, choline to be 1.20 ppm away, etc. Reducing the number offree variables typically makes for a more robust fit.
Lock Releative Frequency Effects
ON • More robust fit.
• Less chance of peak functions moving away from their initial positions to fitbaseline features.

Workflows Review and Analysis packages SpectroView: Advanced Workflows
332 Philips MRI
Phili
ps H
ealth
care
4598
006
437
51/7
81 *
03/
2014
*7
Lock Releative Frequency Effects
OFF • Better fine control of the fitting. If peak positions are free to move a littlebit, then J-coupled lineshapes and moderately misshapen singlet peaks canbe modeled more precisely.
• Safer in general, when spectrum quality is high (i.e. minimal baseline varia-tion, minimal peak shape distortion and good SNR).
Lock Widths parameter
This feature is similar to locking relative peak frequencies and is intended primarily for long TEspectra. It is well known that the linewidths of NAA, Creatine and Choline are inherently similar.They should widen together when the shim is bad and narrow together when the shim is good.Based on this knowledge it is possible to replace three separately adjustable widths with oneoverall width parameter.
Lock Widths Effects
ON • Useful when the SNR is low and peak shapes are distorted by noise in thespectrum.
• Ignores any possible differences between peak widths.
• The peak area ratio value is not likely to be distorted by baseline noise onpeak shapes.
• All resulting peak area ratios will equal the corresponding peak height ratios.
OFF • Better fine control of the fitting.
Parameter(s) How to change the parameter value
Left analysis limit Enter value in data entry box. Default: 4.2 ppm.
Right analysis limit Enter value in data entry box. Default: 0.0 ppm.
Left display limits Determines which part of the spectrum is displayed initially.
Right display limits Determines which part of the spectrum is displayed initially.
Baseline terms Slider to change the number of baseline polynomials. Maximum: 15, Default: 9.
Gaussian percentage Slider to change this percentage. Default: 85%.
Phase Real / Modulus
Determines phase aspect during peak fitting
Lock relative frequency Click in checkbox to select or deselect. Default: ON.
Lock widths Click in checkbox to select or deselect. Default: OFF.
Tab. 17: Parameters for processing step 'Peak Fitting'
Peak Editor
The Peak Editor makes it possible to add peaks into the peak fitting table. This peak will showup in the ’Edit script’ environment. chapter “Customization using the Peak Editor” on page 336for more information.

SpectroView: Advanced Workflows Workflows Review and Analysis packages
Philips MRI 333
Phili
ps H
ealth
care
4598
006
437
51/7
81 *
03/
2014
*7
Shift Peak FrequencyIf peaks are not located correctly during the fitting routine, a manual assignment of peak posi-tions can be performed. If peaks are assigned to their correct value, it will improve the fitting ofthe lesser, more difficult peaks.
• You can select “Specify shift interactively” to manually assign a ppm-position to a selectedpeak.
• You can deselect "Specify shift interactively", you have to specify the frequency shift valuein ppm in the supplied textbox.
The default values shown in the textbox will represent the values specified during the lastinteractive Shift Peak Frequency, as supplied by the Series Preferences database.
Workflow
If ’Shift Peak Frequency’ is enabled, the execution of the script is stopped, and a pop-up win-dow allows the user to manually assign a ppm-position to a selected peak. Once completed allsteps, the processing script is resumed.
The workflow is the same for SVS and CSI, but in SVS there is no "reference voxel" (step 2):
1. From the "Peak" ComboBox, select the peak to shift.
2. If CSI, select the reference voxel from the "Ref Voxel" ComboBox. Refer to the graphs in thegraph area to find a voxel that has a good spectrum that can be used to set the shift.
3. A graph of the reference voxel is displayed and the cursor is labeled with the selected peakand positioned at a point determined by the "Peak Fitting" algorithm. The annotation inthe graph describes the X and Y coordinates of the peak, as located by "Peak Fitting".
4. Examine the X coordinate and verify that it is located on the correct PPM value.
5. If it IS on the correct X PPM value, go to step 8
6. If it IS NOT on the correct X PPM value, use the mouse to move the cursor to the correctvalue. Click on the "Re-Process" button.
7. The pop-up will close, the "Peak Fitting" step will be repeated, the pop-up will return andthe graph will now show the corrected result. If the X PPM value is not correct, go back tostep 4. If the X PPM value is correct, continue with step 8.
8. Click on the ’Next Step’ button to continue processing.
NOTICEUser definition of peaks is mainly important for multi-nuclei spectroscopy, where ppm-posi-tions are usually assigned/changed for PCr.
In general, this step is not required for proton spectroscopy.

Workflows Review and Analysis packages SpectroView: Advanced Workflows
334 Philips MRI
Phili
ps H
ealth
care
4598
006
437
51/7
81 *
03/
2014
*7
Results TableYou may specify up to 4 different denominators (or none at all), including unsuppressed waterwhich will be provided in the Results Table ratio calculations. The Results Table will contain theheight and area ratios for each denominator. Your selection of denominators is determined bythe peaks specified in the Select Peaks script step.
All Peak Fitting scripts have been defined with Cr as a single ratio, to provide backward compat-ibility with R2.5. When running older user-defined scripts, which don’t have a Results Tablestep, we assume the same single Cr ratio to provide backward compatibility.
Correct for DSA Filter
NOTICEThis processing step is only available for datasets acquired prior to R2.
The processing step is disabled in all Philips Scripts.
This processing step
• is available for CSI data sets only and is only applicable if a DSA filter was applied duringreconstruction.
• corrects for the intensity distorting effects of the DSA filter used by the reconstructor.
The DSA filter is a method to reduce residual water signals during reconstruction. The DSA filterworks by shifting all FIDs over n points and subtracting these from the originals. The signalswith zero frequency (water frequency) will then be nulled. The other frequencies are also atte-nuated except for an optimum frequency. Depending on the selected optimum frequency, theappearance of spectra, extracted from a CSI data set will be different as different weighting isapplied to the various points in the spectrum. This will also have an influence on peak fittingand the results.
NAA-Lac
Cho-Cre
100 0 -100 -200 -500
Fig. 160: Effect of DSA filter with different optimum frequency on the appearance of a spectrum.
In the figure above, the upper row shows a spectrum from a CSI data set with DSA filter opti-mized for NAA and lactate. The lower row shows the same spectrum with DSA filter optimizedfor choline and creatine.

SpectroView: Advanced Workflows Workflows Review and Analysis packages
Philips MRI 335
Phili
ps H
ealth
care
4598
006
437
51/7
81 *
03/
2014
*7
The DSA filter does a good job of removing large residual water peaks, and hence it is appliedby default during reconstruction. The DSA filter correction step in the script does not changethe appearance of spectra. Instead, when enabled, it compensates for the frequency-depend-ent effect of the filter. It corrects the reported values of peak heights, peak areas, peak heightratios, and peak area ratios. It also corrects how these quantities are displayed in metabolitemaps and ratio maps.
Generate MapsThis step is used to generate maps based on individual metabolites or ratios between metabo-lites.
Individual metabolite maps
Once a metabolite has been selected a choice can be made whether to generate metabolitemaps.
• based on the fitted area where fitted area is based on FWHM
or
• based on the fitted height where fitted height is based on the overall intensity of the peak.
Ratio Maps
To create a ratio map, select a single metabolite in both the numerator and denominator. Mul-tiple selections of metabolites in both/either the numerator or denominator can also be utilizedfor grouped ratios.
To add or remove a map
• Select the metabolites of interest (maps) in either one or both columns. Then click ’Add’or ’Remove’.
Description
Anatomy
Processing Step Generate Maps
Initial Baseline CorrectionSelect PeaksPeak FittingCorrect for DSA FilterGenerate Maps
New Map
NAA (fitted area)Cr (fitted area)Cho (fitted area)NAA/Cr (fitted area)Cho/Cr (fitted area)Cho/NAA (fitted area)
Numerator
Denominator
ChoCr
ChoCr
Fitted area
Maps to generate
Add Remove
OK Run Cancel
Fig. 161: Example: Window ’Generate Maps’.

Workflows Review and Analysis packages SpectroView: Advanced Workflows
336 Philips MRI
Phili
ps H
ealth
care
4598
006
437
51/7
81 *
03/
2014
*7
Graph DisplayThis function enables or disables the display of graphs with the spectral results. It also config-ures the layout. It allows to define the following:
• Display mode: geometrical, compressed, horizontal or stack
• Layout: default, full-screen graph or full-screen table
• Spectrum display options: enables/disables display of spectrum, fitted baseline, fitted spec-trum, residual or metabolite labels
• Spectrum limits: Override X and Y range
• Show annotation: enabled or disabled.
These functions are only available via the graph right-mouse menu.
Customization using the Peak EditorThe Peak Fitting algorithms in SpectroView use a database of known peaks with attributes todrive the fitting, display and calculation results.
Commonly accepted peak definitions (known as PDPs or Philips Defined Peaks) are provided bydefault and may not be modified or deleted.
Users may add their own peak definitions to the database and may edit them or delete them.This can be done by means of the Peak Editor.
This section describes the Peak Editor and the following issues:
Start up the Peak Editor (PE)
1. Select ’Peak Editor’ from the SpectroView toolbar.
The Peak Editor opens.
Fig. 162: Peak Editor layout.
1 Peak database filter combo box: Nucleus
2 Peak database filter combo box: (Magnetic) Field
3 Peak database filter combo box: Anatomy

SpectroView: Advanced Workflows Workflows Review and Analysis packages
Philips MRI 337
Phili
ps H
ealth
care
4598
006
437
51/7
81 *
03/
2014
*7
4 Peak database filter combo box: Echo time Te
5 List of peaks
6 Control box: Apply
7 Control box: Store
8 Control box: Cancel
Peak database filter combo boxes
When a dataset is loaded, appropriate peaks are selected from the peak database according tothe nucleus, field strength, anatomy and Te of this dataset. These filters are set to the valuesfound in the currently loaded dataset. However, these filters may be changed at any time.
Table of peaks
The table shows all peaks which are part of the database.
Control buttons
Cancel
• exits the Peak Editor and discards all changes made in the current instance of the dialog.Changes made in previous instances of the dialog (by using the Apply button) remain in ef-fect.
Apply
• applies changes to the database and exits the Peak Editor, but does not save the databaseto disk. The peak changes are immediately available for the next script run, but if you exitSpectroViewing without doing a Store, all applied changes will be discarded.
Store
• saves the updated database to disk and exits the Peak Editor. Once changes are saved todisk, they will be permanent, even across software updates.
Peak attributes
The table below lists the peak attributes which are supported in the peak database.
Add a new peak
Series Preferences DatabaseThe Series Preferences Database facilitates the workflow for those series that do not have theproper anatomy settings included. Whenever loading such a series, it is necessary to specify thecorrect anatomy (e.g. brain or prostate).
SpectroView maintains a database containing “preferences” for the last series (approximatelylast 100 series) that were processed. For each series, the following information is captured:
• Anatomy
• Expert Mode On/Off
• Shift Peak Frequency Reference Voxel

Workflows Review and Analysis packages SpectroView: Process Unsuppressed Water Data
338 Philips MRI
Phili
ps H
ealth
care
4598
006
437
51/7
81 *
03/
2014
*7
• Shift Peak Frequency Shift Value
• Shift Peak Frequency Reference Peak
• Shift Peak Frequency Graph Cursor Position
• Shift Peak Frequency Graph X and Y Axis Scaling
• Manual Phase Adjust Reference Voxel
• Manual Phase Adjust Pivot Point
• Manual Phase Adjust Zeroth Order Correction
• Manual Phase Adjust First Order Correction
• Manual Phase Adjust Graph Phase Real/Imaginary/Modulus
• Manual Phase Adjust Graph X and Y Axis Scaling
When a series is reloaded, these preferences are also reloaded and applied to the ScriptEditor,interactive dialogs, etc.
Since it is possible you might make a mistake during processing (like selecting the wrong anato-my), you can clear all the preferences for the current series by clicking on the “Delete SeriesPreferences” menu item or button.
SpectroView: Process Unsuppressed Water DataAn exciting feature of SpectroView is the ability to visualize and fit the unsuppressed water sig-nal. The benefits are as follows:
• The width of the water peak is a straightforward measure of shim quality.
• Artifacts are often easier to see (and interpret) in an unsuppressed water spectrum than ina normal suppressed spectrum.
• Most important, the size of the unsuppressed water peak is a useful denominator for peakarea ratio (or height ratio) calculations. Moreover, if the water concentration is known forthe tissue of interest, absolute metabolite concentrations can be estimated.
Workflow1. Start up SpectroView with a suitable dataset. The dataset loads.
2. Click the ’Process Unsuppressed Water Data’ icon to start the analysis.
The icon remains highlighted. The dataset reloads, now with the unsuppressed water datainformation.

SpectroView: Process Unsuppressed Water Data Workflows Review and Analysis packages
Philips MRI 339
Phili
ps H
ealth
care
4598
006
437
51/7
81 *
03/
2014
*7
Fig. 163: Spectra: initially and after starting the analysis 'Unsuppressed water'. A - A typical SV spectrum as initiallydisplayed, acquired with Spectral Correction ON. B - Unsuppressed water spectrum is distorted because Residual Wa-ter Subtraction is ON.
3. Select a basic processing script which is optimized for unsuppressed brain water.
Make sure that the following parameters are set as follows:
• Residual Water Subtraction: Off
• Spectrum Phase Adjustment: On, and set to Auto Zeroth Order
• Use the same apodization filter settings for water and for metabolites
Name: Basic watery brain
Description: Based on Basic Processing (1H SV)
Anatomy: Brain Supported field strengths:
Nucleus: 1H 1.0T 1.5T 3.0T 7.0T
Echo time: Short Long
Dual Volume DecodeResidual Water SubtractionTime Domain Signal ShiftingApodization filteringZero-Fill and FTSpectrum Phase AdjustmentShift Peak FrequencyGraph Display
Spectrum Phase Adjustment
Auto zeroth (global) termAuto first (linear) term
Manual Phase Adjustment
Provide Phase Values Below
Fig. 164: Example: Script parameters of basic processing script for unsuppressed water analysis.
NOTICEIf you start off with Unsuppressed Water in SpectroView, it might be necessary that you createa new script with settings as described above.

Workflows Review and Analysis packages SpectroView: Process Unsuppressed Water Data
340 Philips MRI
Phili
ps H
ealth
care
4598
006
437
51/7
81 *
03/
2014
*7
4. Run this script.
Figure shows the resulting spectrum.
Fig. 165: Unsuppressed water, auto-phased and undistorted by “residual” water subtraction.
5. Select a water-fitting script for the brain.
Name: Water-fitting script
Description: Based on Basic Processing (1H SV)
Anatomy: Brain Supported field strengths:
Nucleus: 1H 1.0T 1.5T 3.0T 7.0T
Echo time: Short Long
Dual Volume Decode
Initial Baseline Subtraction
Results TablePeak Fitting
Spectrum Phase Adjustment
Shift Peak Frequency
Graph Display
Select PeaksAll None
Select Peaks
AcChoCrCr2GlxH2OLaclipmINAA
Fig. 166: Water-fitting script for the brain: Dual Volume Decode = off, Spectrum Phase Adjustment = off, Initial Base-line Subtraction = off, Shift Peak Frequency = off, Select Peaks = on, Peak Fitting = on, Results Table = off, GraphDisplay = on.
NOTICEIf you start off with Unsuppressed Water in SpectroView, it might be necessary that you createa brain water-fitting script.
In this case, start up with the standard water-fitting script and change its anatomy to ’Brain’.
6. Run this script. Figure shows the result.

SpectroView: Process Unsuppressed Water Data Workflows Review and Analysis packages
Philips MRI 341
Phili
ps H
ealth
care
4598
006
437
51/7
81 *
03/
2014
*7
Fig. 167: Peak fitting results for the analysis 'Unsuppressed water'. Although the peak area and peak height are thequantities needed for ratio calculations, the peak width is valuable too as a measure of shim quality.
7. After analysis of the unsuppressed water is done, return to the usual water-suppressedspectrum by clicking off the "Process Unsuppressed Water Data" icon.
8. Select a generalized brain-fitting script to display metabolite ratios with respect to unsup-pressed water.
NOTICEIf you start off with Unsuppressed Water in SpectroView, it might be necessary that you createa new generalized brain-fitting script.
Name: Generalized brain-fitting script
Description: Based on Basic Processing (1H SV)
Anatomy: Brain Supported field strengths:
Nucleus: 1H 1.0T 1.5T 3.0T 7.0T
Echo time: Short Long
Dual Volume Decode
Initial Baseline Subtraction
Results TablePeak Fitting
Spectrum Phase Adjustment
Shift Peak Frequency
Graph Display
Results Table
Select Peaks
Denominator #1 Cr(3.03)
Denominator #2 Unsupp H2O
Denominator #3 NAA (2.01)
Denominator #4 None
Fig. 168: Generalized brain-fitting script, processing step: Results Table. In this example, NAA has been selected as“Denominator #3” as well.
9. Run this script. Figure shows the results.

Workflows Review and Analysis packages SpectroView: Process Unsuppressed Water Data
342 Philips MRI
Phili
ps H
ealth
care
4598
006
437
51/7
81 *
03/
2014
*7
Fig. 169: Results: Metabolite ratios with respect to unsuppressed water.
A table is also displayed providing the ratios in numeric values.
Make sure that ’Unsupp. H2O’ is selected as one of the denominators on the Results Table scriptpage.
Truncate Graph PeakWhen processing unsuppressed water data, the resulting spectra often looks like this:
Fig. 170: The overwhelming water peak causes smaller peaks and ripples to be scaled down to a flat line.
To overcome this situation, you can use the option ’Truncate Graph Peak’ from the graph right-mouse menu. This option only appears when “Expert Mode” is enabled, since careless use cancause misleading results. Once activated, we see:
Fig. 171: Now the details of the “noise” surrounding the water peak can be visualized.

User Interface Printing
Philips MRI 343
Phili
ps H
ealth
care
4598
006
437
51/7
81 *
03/
2014
*7
PrintingPrinting can be performed as
• Print ImageThe purpose of this function is to compose a printout with multiple images of different ser-ies with a customizable layout.
• Print Series The purpose of this function is to compose a printout with multiple images of one or moreseries (maximum of 6 series) with layouts that have previously been predefined and set up.
The function Print History from the System menu allows to manage the printing jobs in thesame way as the function Manage Job Queue manage all other types of jobs. Furthermore PrintHistory enables you to easily redo a printing job by clicking 'Retry Jobs'.
User Interface
Printing in Overall Toolbars and MenusPrinting functions are available in toolbars and right mouse menus:
1. in the right mouse menu of the Thumbnail View;
2. in the Printing drop-down menu of the ImageView toolbar;
3. in the right mouse menu of ImageView.
Icon Function Shortcut Description Available in
Add Series To PrintSetup
Ctrl+Shift+S
To add series to the Print Setup.
This function opens the window Print Setup(S) where (S) stands for series, if this windowis not in use.
• right mousemenu of theThumbnail View
• Printing drop-down menu ofImageView tool-bar
Add Image To PrintSetup
Ctrl+Shift+I
To add images to the Print Setup.
This function opens the window Print Setup(I) where (I) stands for image, if this windowis not in use.
• Printing drop-down menu ofImageView tool-bar
• right mousemenu of Image-View
Tab. 18: Available Print functions
13

Printing User Interface
344 Philips MRI
Phili
ps H
ealth
care
4598
006
437
51/7
81 *
03/
2014
*7
Print SetupPrint Setup allows
• setting up the printout with respect to output device, format and layout;
• adding ROIs, annotations and lines to the printout;
• creating and editing print presets.
Print Setup is available for Print Image and for Print Series.It opens automatically in a dedicated window when images or series are added to it:
• Add Series To Print Setup opens the Print Setup(S) window where S stands forseries. When Multiple Series (A|B or A|B|C) is enabled, this is indicated in the toolbar tab as PrintSetup(MS).
• Add Image To Print Setup opens the Print Setup(I) window where I stands for image.
Print Setup Toolbars
The toolbars for Print Setup(S) and Print Setup(MS) are the same whereas the toolbar for PrintSetup(I) is slightly different.
Fig. 172: Toolbars Print Setup(S) and Print Setup(I). Functions which are also available in ImageView or Review orAnalysis packages are neither numbered in this figure nor described in the section below.
Number Icon Func-tion(andShortcut)
Description
1 Print Pre-view (Ctrl+Shift+Q)
To display the Print Preview.
• This function can be used to verify the correct setup of theprintout prior to printing.
• The function Print Settings which is available in the Print Set-up(S) and Print Setup(I) windows determines the printout andthe Print Preview.
• Example of preview and output on paper, see chapter “” onpage 346.

User Interface Printing
Philips MRI 345
Phili
ps H
ealth
care
4598
006
437
51/7
81 *
03/
2014
*7
Number Icon Func-tion(andShortcut)
Description
2 Print (Ctrl+Shift+P)
To print the printout according to the settings as defined by meansof Print Setup and Print Settings.
3 Default drop-downmenu
SelectPreset(initially'Default')
To select any of the available presets so that the print setup is readyfor printing with the selected preset values or settings.
4 Print Set-tings
To adjust print settings such as layout, annotation and format.
5 MultipleSeries 2
To enable Multiple Series printout for 2 series and to allow for thisseries to be loaded for printing.When Multiple Series printout is enabled, the toolbar of the PrintSetup is displayed as Print Setup(MS).
6 MultipleSeries 3
To enable Multiple Series printout for 3 to 6 series and to allow forthese series to be loaded for printing.When Multiple Series printout is enabled, the toolbar of the PrintSetup is displayed as Print Setup(MS).
7 Load Pro-tocol
To load a printout protocol for Multiple Series that has previouslybeen saved.
8 More drop-downmenu
Morefunctions
More provides the functions:
Save Layout
Only available for Print Image: Enable Move Image Mode When enabled, images can be moved to other locations in the PrintSetup(I).
Only available for Print Image: Delete the current PageTo delete all images from the current page to be able to newly setup the printout. This function needs to be used in order to remove empty pages.
Delete All Graphics
9 Scroll To scroll through pages in Print Setup(I).
Others Please refer to chapter “Toolbar” on page 107 for information about the other icons available on thePrint Setup toolbars.

Printing User Interface
346 Philips MRI
Phili
ps H
ealth
care
4598
006
437
51/7
81 *
03/
2014
*7
Fig. 173: Print Preview. Left: Output on film. Right: Output on paper.
Print Setup Right Mouse Menus
Print Setup right mouse menus are slightly different for Print Image and Print Series. They pro-vide many of the functions which are also available via the Print Setup toolbar or which areused throughout all postprocessing packages. These are the functions available:
Available in PrintSetup ...
(I) (S) Function Description
Yes Only for PrintSetup(MS)
Split Vertical To split a cell in Print Series(I) to allow for an even moreflexible layout.
To split a page in Print Sereis(MS) to allow for more ser-ies to be put on the Print medium.
Yes Only for PrintSetup(MS)
Split Horizontal
No Yes Propagation Scope To adjust how view/window settings are propagated tothe other images.
Yes Yes Remove Image To remove the current image from the printout.
Yes Yes Remove Page To remove the current page from the printout.
Yes Yes Reset Window To reset the window settings to the initial ones.
Yes Yes Reset Zoom/Pan To reset the viewing settings to the initial ones.
Print SettingsThe Print Settings are part of Print Setup, and as such accessible via the Print Setup(I) and PrintSetup(S) toolbars.
For Print Image and for Print Series, Print Settings allows
• to adjust the layout of the printout.

User Interface Printing
Philips MRI 347
Phili
ps H
ealth
care
4598
006
437
51/7
81 *
03/
2014
*7
• to enable or disable the display of various forms of annotation on the printout.
• to select printer, film size, number of copies and number of pages.
For Print Series, additional functionality is available which allows:
• to create, edit or delete protocols for the Print procedure.
• to enable, disable or edit the display of planscan images on the printout.
• to specify image range and way of sorting on the printout.
Fig. 174: Print Settings windows. Left: for Print Series. Right: for Print Image. 1 - Print Protocol Area, 2 - ParameterArea where parameters can be accessed via the tabs, 3 - Control Area.
Print Protocol Area
The Print Protocol Area is only available for Print Series. The following controls are availablehere:
• Drop-down for the Print protocols:
either select an existing print protocol or enter a name for a new protocol.
• Delete icon to delete the currently selected Print protocol.
• Save icon to save the current settings as a Print protocol.
NOTICEPrint protocols can be set up for up to six series within one printing job.

Printing User Interface
348 Philips MRI
Phili
ps H
ealth
care
4598
006
437
51/7
81 *
03/
2014
*7
Parameter Area with Tabs
Fig. 175: Parameter Area with: 1 - tabs, 2 - Different parameters for editing depending on the tab selection.
NOTICEIn Print Series, more tabs are available than in Print Image.
This is caused by the fact that Print Series offers more functionality with respect to the crea-tion of Print protocols.
Layout Tab
The Layout tab is available for Print Series and Print Image, however with slight differences.
Fig. 176: Layout tab: Print Series (left) versus Print Image (right). See table for more information.
Number Function Possible Values Description
1 Number of Rows • up to 8 rows This parameter specifies the number of rowson the printout(s).
2 Number of Columns • up to 8 columns This parameter specifies the number of col-umns on the printout(s).
3 Film Layout • All film layouts ever createdand saved
Any layout can be selected for Print Image.
4 Separator Lines • Checked
• Unchecked
The display of separator lines can be ena-bled/disabled.
5 Patient Description • Checked
• Unchecked
The display of the patient description can beenabled/disabled.
6 Patient Name • Checked
• Unchecked
The display of the patient name can be ena-bled/disabled.

User Interface Printing
Philips MRI 349
Phili
ps H
ealth
care
4598
006
437
51/7
81 *
03/
2014
*7
Number Function Possible Values Description
7 Patient ID • Checked
• Unchecked
The display of the patient ID can be enabled/disabled.
Tab. 19: Layout tab
Annotations Tab
The Annotations tab is available for Print Series and Print Image, however with slight differen-ces.
Fig. 177: Annotations tab: Print Series (left) versus Print Image (right). See table for more information.
Number Function Possible Values Description
1 Image Text • Checked
• Unchecked
The display of Image Text can be enabled/disabled.
2 Caliper • Checked
• Unchecked
The display of the Caliper can be enabled/disabled.
3 Fold-over Indicator • Checked
• Unchecked
The display of the Fold-over Indicator can beenabled/disabled.
4 Orientation Annota-tor
• Checked
• Unchecked
The display of the Orientation Annotator canbe enabled/disabled.
5 ROIs and lines • Checked
• Unchecked
The display of ROIs and lines can be enabled/disabled.
6 Series Info • Checked
• Unchecked
The display of Series Info can be enabled/disabled.
7 Location of Series In-fo
• Once at start
• Every page
If enabled, the location of the Series info canbe selected.
Tab. 20: Annotations tab
Printer Settings Tab
The Printer Settings tab is available for Print Series and Print Image, however with slight differ-ences.

Printing User Interface
350 Philips MRI
Phili
ps H
ealth
care
4598
006
437
51/7
81 *
03/
2014
*7
Fig. 178: Printer Settings tab: Print Series (left) versus Print Image (right). See table for more information.
Number Function Possible Values Description
1 Printer • Any printer available Any configured printer can be used as outputdevice and selected in this drop-down meny.
2 Film Size • Any film size available Any film size for the printout can be selectedin this drop-down menu.
3 Number of Copies • 1 to 100 The Number of Copies can be increased ordecreased by clicking the +/- buttons.
4 Color • Checked
• Unchecked
Depending on the printer connected, a colorprintout can be enabled/disabled.
5 Print to File • Checked
• Unchecked
Print to File can be enabled/disabled. Notethat this function can only be selected whena printer is configured (even though itdoesn't require a printer).
6 Number of PagesWarning
• Checked
• Unchecked
This parameter enables/disables if a messagewill be displayed indicating the total numberof pages.
7 Page Range • All
• User Defined: From ... To ...
This parameter specifies which pages of thePrint Setup will be printed.
Tab. 21: Printer Settings tab
Planscan Tab
The Planscan tab is available for Print Series only.

User Interface Printing
Philips MRI 351
Phili
ps H
ealth
care
4598
006
437
51/7
81 *
03/
2014
*7
Fig. 179: Planscan tab: available for Print Series only.
Number Function Possible Values Description
1 Planscan Image • Checked
• Unchecked
The display of the Planscan Image can be en-abled/disabled.
2 Inset Planscan • Checked
• Unchecked
The display of the Inset Planscan can be ena-bled/disabled.
3 Location of PlanscanImage
• Once at start
• Once at end
• Repeated at the start ofeach film
• Repeated at the end of eachfilm
This parameter specifies the location of thePlanscan Image on the film(s).
4 Which PlanscanImage
• A
• B
• C
• All
This parameter specifies which PlanscanImage will be used.
5 Planscan Display • Lines
• Box
This parameter specifies how the Planscanwill be displayed.
6 Inset Planscan
upper or lower left orright corner
This parameter (icons only) specifies the lo-cation of the Inset Planscan.
7 Which Inset Planscanimage
• A
• B
• C
This parameter specifies which Inset Plan-scan image will be used.
Tab. 22: Planscan tab
Images Tab
The Images tab is available for Print Series only.

Printing User Interface
352 Philips MRI
Phili
ps H
ealth
care
4598
006
437
51/7
81 *
03/
2014
*7
Fig. 180: Images tab: available in Print Series only. The number of slider bars displayed as "Range" depend on thetypes of images in the series.
Number Function Possible Values Description
1 Descending Slice Or-der
• Checked
• Unchecked
If enabled, descending slice order will beused for printing.If disabled, ascending slice order will beused.
2 New Film Every • None
• to be defined
This parameter specifies when a new filmwill be started.
3 Every Nth Image • Any number Click +/- to increase/decrease n.
4 Sorting Dimensions • Order of attributes, such as: slice, dynamics, image types.
• Attributes can be moved upor down by means of theeponymous buttons.
The parameter affects the order of imageson the printing output.
5 Range (here Slice/Echoes)
• There is a slider per attrib-ute, e.g. a slider for slices,another one for echoes. Theattributes depend on thetype of the scan. Other op-tions besides slices and ech-oes are e.g. image types, dy-namics.
Drag the slider to define start and end sliceor echo.
6 Range Start/End • Pressed
• Not pressed
• To select the first image, click on thisimage and then click 'Start'.
• To select the last image, click on thisimage and then click 'End'.
Tab. 23: Images tab

Workflows Printing
Philips MRI 353
Phili
ps H
ealth
care
4598
006
437
51/7
81 *
03/
2014
*7
Control Area
For an image of the Control area, figure 174 on page 347.
► Click |Apply| to apply the changes.
► Click |OK| to save the changes without applying.
► Clicking |Cancel| closes the window without applying the changes made.
Workflows
Create Predefined Layout for Print Image
► Right-click on an image in ImageView and select Add Image To Print Setup.
The window Print Setup(I) opens with its default layout.
► First change the layout:
• To resize a cell, drag the lines up- or downwards or to the left or right.
• To create multiple cells out of one, right-click on this cell and select 'Split Horizontal' or'Split Vertical'.
You can undo ONE action when dragging images or resizing cells.
► Click Print Settings in order to create/edit a predefined layout for Print Image.
• Click the Layout tab and edit according to your preferences.
• Click the Annotations tab and edit according to your preferences.
• Click the Printer Settings tab and edit according to your preferences.
► Click |OK| to save these settings with the selected layout.
Available layouts are displayed as icon showing their rows/columns.
Fig. 181: Example of Print Image Layouts.
Create Protocol for Print Series► Select 'Add Series To Print Setup'
• in the right-mouse menu of the Thumbnail View,
• in the Printing drop-down menu of the ImageView toolbar.
The window 'Print Setup(S)' opens with its default layout.

Printing Workflows
354 Philips MRI
Phili
ps H
ealth
care
4598
006
437
51/7
81 *
03/
2014
*7
► First change the layout:
• Select another layout or add/remove columns and/or rows.
• To print multiple series, click one of the 'Multiple Series' buttons (A|B or A|B|C).
The Print Setup(S) wiil then be renamed to Print Setup (MS) and the printing area will besplit in two or three parts, every part meant for one series.
► Click 'Print Settings' in order to create/edit a protcol for Print Series.
• Click the 'Planscan' tab and edit according to your preferences.
• Click the 'Layout' tab and edit according to your preferences.
• Click the 'Images' tab and edit according to your preferences..
• Click the 'Annotations' tab and edit according to your preferences.
• Click the 'Printer Settings' tab and edit according to your preferences.
► Enter a name for the protocol, and click |Save| to save these settings as protocol.
Print Image► Right-click on an image in ImageView and select Add Image To Print Setup.
The window Print Setup(I) opens with its default layout.
► Click Tiled View to display the windows ImageView and Print Setup(I) besides each other.
► In ImageView, select more images that have to be placed on the printout.
► Click Add Image To Print Setup for every image needed.
► Repeat the last two steps as often as required.
Optional: In order to select multiple images, hold |Ctrl| while clicking on the images. Thenselect Add Image To Print Setup.
► Images of the multiple selection are indicated by a blue selection icon.

Workflows Printing
Philips MRI 355
Phili
ps H
ealth
care
4598
006
437
51/7
81 *
03/
2014
*7
Fig. 182: ImageView and Print Setup(I) windows besides each other. Multiple images are selected in ImageView indi-cated by the blue selection icon. The right-mouse menu is open showing the option 'Add Image To Print Setup'.
► Optional: right-click on any cell and select any of the available options to e.g. remove animage or reset view/window settings.
► Optional: to resize a cell, drag the lines up- or downwards or to the left or right.
► Optional: to create multiple cells out of one, right-click and select 'Split Horizontal' or 'SplitVertical'.
► Optional: select Enable Image Move Mode from the More drop-down menu (toolbar) anddrag the images to other positions.
You can undo ONE action when dragging images or resizing cells.
NOTICEIf there is an image in the target cell already, this image will be lost if another image is draggedto this location.
► In order to select a preset for Print Image, click Print Settings, and select one of the availa-ble layouts.
► To move images from one cell to another, in Print Setup(I) click and drag this image to thenew location.

Printing Workflows
356 Philips MRI
Phili
ps H
ealth
care
4598
006
437
51/7
81 *
03/
2014
*7
► Click Print Preview to verify everything is set up as needed.
► Click Print to initiate printing.
Print Series► Right-click and select Add Series To Print Setup:
• in the right-mouse menu of the Thumbnail View,
• in the Printing drop-down menu of the ImageView toolbar.
The window Print Setup(S) opens with its default layout.
► Click the Print Preset drop-down menu and select a Print protocol.For information on how to set up such a print protocol, refer to chapter “Create Protocolfor Print Series” on page 353.
► Optional: right-click on any cell and select any of the available options to remove an imageor reset view/window settings.
► Click Print Preview to verify everything is set up as needed.
► Click Print to initiate printing.
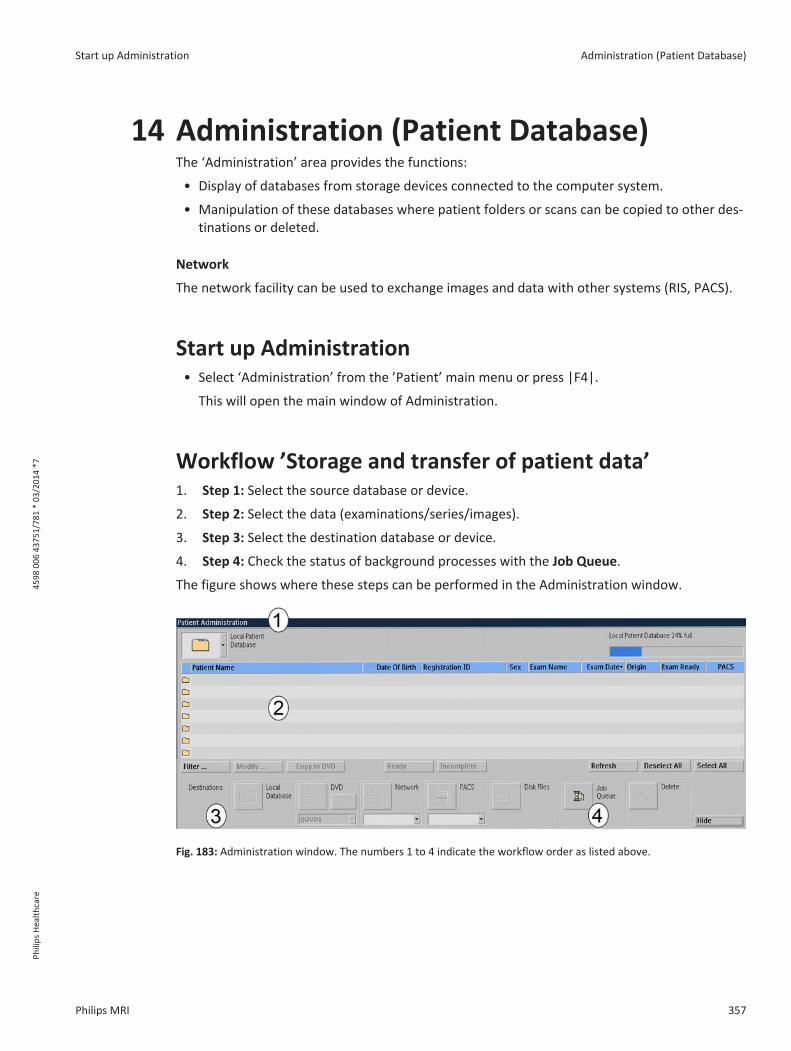
Start up Administration Administration (Patient Database)
Philips MRI 357
Phili
ps H
ealth
care
4598
006
437
51/7
81 *
03/
2014
*7
Administration (Patient Database)The ‘Administration’ area provides the functions:
• Display of databases from storage devices connected to the computer system.
• Manipulation of these databases where patient folders or scans can be copied to other des-tinations or deleted.
Network
The network facility can be used to exchange images and data with other systems (RIS, PACS).
Start up Administration• Select ‘Administration’ from the ’Patient’ main menu or press |F4|.
This will open the main window of Administration.
Workflow ’Storage and transfer of patient data’1. Step 1: Select the source database or device.
2. Step 2: Select the data (examinations/series/images).
3. Step 3: Select the destination database or device.
4. Step 4: Check the status of background processes with the Job Queue.
The figure shows where these steps can be performed in the Administration window.
Fig. 183: Administration window. The numbers 1 to 4 indicate the workflow order as listed above.
14

Administration (Patient Database) Select the source database or device
358 Philips MRI
Phili
ps H
ealth
care
4598
006
437
51/7
81 *
03/
2014
*7
NOTICEIn case the transfer is interrupted due to network failure, it may be needed to logout or restartthe computer.
Afterwards the "failed" job in the queue must be reselected and submitted again.
Select the source database or deviceThe current source database or device is indicated in the source selector field. By default, thesource device is defined as ’Local Patient Database’.
1. Click on the arrow in the source selector field.
2. Select the source database or device from the drop-down menu.
The content of the selected database or device will be listed.
Icon Description
Local Patient Database (default setting)
MOD
DVD
Queue DVD
DICOM Network Node
PACS (Archive)
Disk files
Select data from source database
Select examinations
1. Click on an examination to select it.
You can select multiple examinations:

Select data from source database Administration (Patient Database)
Philips MRI 359
Phili
ps H
ealth
care
4598
006
437
51/7
81 *
03/
2014
*7
• Hold |Ctrl| and select multiple single examinations, or
• Hold |Shift| and click on two examinations successively to select these two examina-tions AND the examinations which are between them in the list.
2. Continue
• either with ’Select destination database or device’ chapter “Select destination databaseor device” on page 360
• or with ’Select series’:
Select series
To display the series within an examination,
1. click on the folder icon of an examination or double-click on an examination.
The list of series for the current examination is displayed.
Fig. 184: Folder icon in list of examinations.
Fig. 185: List of series for the current examination.
NOTICEAbout 1300 items can be listed.
If a list contains too many items, a message "List contains too many items to be displayed atonce" is displayed. Use the ‘Filter ... ’ option to find other selections.
2. Click on a series to select it.
3. Continue
• either with ’Select destination database or device’ chapter “Select destination databaseor device” on page 360
• or with ’Select images (or an image range)’:
Select images (or an image range)
It is possible to select a subset of images.

Administration (Patient Database) Select destination database or device
360 Philips MRI
Phili
ps H
ealth
care
4598
006
437
51/7
81 *
03/
2014
*7
NOTICEThis function cannot be used with PACS as destination.
1. Click the |Scan| button to open the ’Select image range’ window.
The ’Select image range’ window opens.
Fig. 186: Scan button.
2. Select the required image type (e.g. SE/M, FFE/M, FFE/P).
3. For the selected image type, define
Range Step (size)
Slice e.g. 5-15 e.g. 1
Echo e.g. 1 e.g. 1
Phase e.g. 1 e.g. 1
Dynamic scan e.g. 1 e.g. 1
Chemical shift e.g. 0 e.g. 1
Gradient orien(tation) e.g. 1 e.g. 1
Diffusion BVal(ues) e.g. 1 e.g. 1
Functions within ’Select image range’ window:
Button / Function Description
Reset To deselect: all ranges are reset to their default ranges.
Invert To invert selection: selected image types are deselected and vice versa.
Cancel To exit this window without selection.
Delete To delete all selected images.
Keep To keep all selected image and delete the rest.
Select To confirm selection and exit this window.
Select destination database or deviceWhen the source data selection is complete, select the destination database or device.
1. Click on any of the applicable destination devices.

Select destination database or device Administration (Patient Database)
Philips MRI 361
Phili
ps H
ealth
care
4598
006
437
51/7
81 *
03/
2014
*7
Grayed-out devices are currently not available, or are not allowed to be used, i.e. a PACSonly accepts complete scans/series.
Fig. 187: Toolbar for the selection of destination devices.
Number Function More ...
1 Local Patient Database (default setting)
2 Queue DVD Export to Queue DVD.
• Allows to suppress patient data.
Fig. 188: Export to Queue DVD window indicating the to-tal size and the available size on the DVD. The checkboxallows to enable the suppression of patient data.
3 DICOM Network Node
4 PACS (Archive)
5 Disk files Export to Disk Files, see chapter “” on page 362
• Allows to suppress patient data.
• Allows to select Enhanced or Classic Dicom.
Classic Dicom is recommended for multivendor ap-plications.
• Allows to export scans to a number of different re-search formats.
6 Queue Manager
7 Delete 1. Click |Delete| to delete the selected source data.
This command works on local database, local diskfile or Queue DVD only.
2. If applicable, answer the questions in the pop-updialogue boxes and click |Proceed|.

Administration (Patient Database) Select destination database or device
362 Philips MRI
Phili
ps H
ealth
care
4598
006
437
51/7
81 *
03/
2014
*7
NOTICEYou can only suppress patient data (and/or enter an alternative patient name) when you copyan examination or series to Queue DVD or disk files.
Patient data cannot be suppressed when you copy an examination or series to other locationsor burn them to DVD.
Export to Disk Files
⊳ Destination device is selected as 'Disk Files'.
► Click on one of the tabs to select the type of export:
• Dicom Export
• Non Dicom Export
Dicom Export
Output: Exported Dicom data can be imported at other MR consoles or any Dicom Viewers.
► Select the source data for export, e.g. a single or multiple examinations, a single or multipleimaging series.
► Browse to the destination device and folder.
► Select the output format by checking one of the options: Enhanced Dicom or Classic Dicom.
► Enable the suppression of patient data by checking this option.If done so, you can enter an alternative patient name.
► Click 'Proceed' to export data.
Fig. 189: FileExport 'Dicom Export' with 1 - Destination (folder) to browse to, 2 - Selection between Enhanced andClassic Dicom, 3 - functionality 'Suppress patient data'.
Non Dicom Export
Output: exported non-dicom data is provided in the different research formats.
• XML-REC: This format is generally used for Philips PRIDE and home-built packages based on IDL orMATLAB.
• NIfTI:This format is generally used for fMRI analysis packages like SPM, BrainVoyager and FSL.

DICOM Export: Series Split functionality Administration (Patient Database)
Philips MRI 363
Phili
ps H
ealth
care
4598
006
437
51/7
81 *
03/
2014
*7
• SPAR-SDAT: This format is generally used for spectroscopy packages like jMRUI and LCMODEL.
► Select the source data for export, e.g. a single or multiple imaging series.
► Browse to the destination device and folder.
► Enter an Export file name or check 'Use Scan Name' to use the name of the scan as filename.
► Select the export type by checking.Note that by default all possible export types are selected for export.
► Click 'Proceed' to export data.
Fig. 190: FileExport 'Non Dicom Export' with 1 - Destination (folder) to browse to, 2 - Specification of Export FileName, 3 - Check boxes for the selection of the Export Type.
Export of image and video data
WARNINGTo limit the output size, Export2Office uses storage formats with lossy compression.
This compression can result in loss of detail.
DICOM Export: Series Split functionalityImaging series with multiple dimensions (such as echoes, dynamics, or b-values) can be split in-to multiple series during DICOM export. This allows for an image sorting order based on theseries number and is especially useful for those PACS/Workstations that cannot sort on thesedimensions.
Each new series can easily be identified since its series number is derived from the series num-ber of the original dataset.
Splitting is done in case of
• MultiEcho scans (resulting in a series per echo)
• Dynamic scans (resulting in a series per dynamic)
• Diffusion scans (resulting in a series per b-value)
• conventional DICOM MR images

Administration (Patient Database) Check status of background processes with the Job Queue
364 Philips MRI
Phili
ps H
ealth
care
4598
006
437
51/7
81 *
03/
2014
*7
• SC (Secondary Capture) images, e.g. screen grabs
• Private images (imaging protocols, ExamCards)
With the Series Split functionality, the presentation states will not be exported.
During import on the MR console, the new split series will be merged into one series again.
NOTICEFor automatic Series Split functionality you need a special configured network node.
The network nodes can be configured according to your needs together with your CustomerSupport Organization.
Check status of background processes with the JobQueueThe status of background processes (including image transfer) can be viewed using the tool ’JobQueue’.
To open the Job Queue
1. Select ’Manage Job Queue’ from the ’System’ menu or from the ’Administration’ window.
A list of jobs with the job name, patient name, status, priority and submit time is displayedin the Job Queue window.
Fig. 191: Job Queue window.

More functions within Administration Administration (Patient Database)
Philips MRI 365
Phili
ps H
ealth
care
4598
006
437
51/7
81 *
03/
2014
*7
Number Drop-down or button Possible values Description
1 Queue name • All queues (default)
• Image transfer
• MIP,
• MPR,
• Postprocessing
• RIS
• to select which queues aredisplayed in the Job Queuewindow
2 Queue status • Disabled
• Enabled
• to dis/enable backgroundjobs; - to disable/enable oneof the queues
3 Priority • Normal
• Rush
• to set the priority: higherpriority with |Rush|
4 Delete failed jobs - • to delete failed jobs fromthe queue
5 Delete finished jobs - • to delete finished jobs fromthe queue
6 Delete - • to delete the current jobfrom the queue
7 Job status / Queue status - • displays the informationconcerning the current job
8 Suspend - • to stop the current job, butkeep it in the queue
9 Resume - • to resume the selected (sus-pended) job
10 Retry (jobs) • to retry a previously failedjob
11 Stop - • to stop the current job
Hide - • to hide the Job Queue win-dow
More functions within Administration
Modify display of the list of examinations
For each storage device it can be specified which data columns are displayed or hidden in theAdministration window:
Data columns to be hidden or displayed are:

Administration (Patient Database) More functions within Administration
366 Philips MRI
Phili
ps H
ealth
care
4598
006
437
51/7
81 *
03/
2014
*7
• Date of birth
• Exam date
• Exam name
• Patient name
• Registration ID
• Sex
1. Right-click in the (blue) header of the patient list to display the Show/Hide columns dialogwindow.
2. Select the data to be hidden in the 'Show' list and click |Hide|.
3. Select the data to be displayed in the `Hide' list and click |Show|.
4. Click |Proceed|.
Refresh
• Click |Refresh| to update the display of the examinations window.
– This does not change the selection state. Opened exams will stay open.
Deselect All and Select All
• Click |Select All| to select the entire list.
• Click |Deselect All| to deselect all files.
Manipulate a selected patient list
• Click |Filter ...| to display the ’Filter ...’ menu.
It allows selective display of parts of the patient list according to the selection criteria. Thefollowing find criteria can be entered:
Find criterion To be entered as
Patient name String including wild cards *.
Registration ID String including wild cards *.
Date of birth Date in the current date format.
Exam name String including wild cards *.
Exam date Date in the current date format. Specified as interval from ... to ...
Exam status ’Ready’ or ’Not Ready’: to find patients which are (not) ready according to the RIS.
Functions to be used within this menu:
Button / Function Description
Clear To clear all search fields.
Cancel To exit this window without taking filter settings into account.
Display all To display the contents of the storagedevice and exit this window.

More about storage devices Administration (Patient Database)
Philips MRI 367
Phili
ps H
ealth
care
4598
006
437
51/7
81 *
03/
2014
*7
Button / Function Description
Apply filter To apply the filter settings without exiting this window.
Proceed To apply the filter settings and exit this window.
Sorting order
• Click one of the following buttons in the Main Menu bar to present the contents in a differ-ent order:
– |Patient name|
– |Date of birth|
– |Registration ID|
– |Exam Name|
– |Exam Date|
– |Sex|
– |Origin|
– |Exam ready|.
Modify examination data
Patientexamination data of local and retrieved examinations can be modified.
1. Select the examination whose examination data have to be modified.
2. Click |Modify|.
3. Enable |Presentation mode|.
4. Modify the examination data, e.g. delete existing data, enter new data.
5. Click |Proceed| to confirm.
An asterisk in front of the patient name indicates a modified examination.
WARNINGExaminations modified in presentation mode are not longer compatible with the original RISentry.
They should not be archived, but be stored on DVD.
There is a risk of mixing patients’ data if this function is not used carefully.
More about storage devicesThe following storage devices can be available on the system. They can easily be recognized bytheir icons.

Administration (Patient Database) More about storage devices
368 Philips MRI
Phili
ps H
ealth
care
4598
006
437
51/7
81 *
03/
2014
*7
NOTICEContact your local Customer Support Organization for setup.
Icon Storage device
Local Patient Database
• containing the patient examination list
DVD
• contents of the currently assigned (DICOM) DVD.
• DICOM media.
Queue DVD
• content of the selected Queue (DICOM) DVD slots.
There are 5 Queue DVD slots available.
chapter “More about data transfer to DVD” on page 370
DICOM Network Node
• contents of the currently configured DICOM network node.
Remote (DICOM) patient databases. Accessible via drop-down menu in the |Network| des-tination.
PACS
• contents of the currently assigned PACS
Remote (DICOM) patient databases. Accessible via drop-down menu in the |Archive| desti-nation.
Disk files (Local DICOM directory)
By default, files are written to E:\DICOM. It is also possible to browse to a different destina-tion folder, create a new folder or copy to a PC via a network connection.
Database capacity indicator bar
In the upper right corner, a blue bar is available which indicates how much space of the currentdatabase/device is used.
The bar color changes to red when 80% or more are used.
NOTICEWith DVD the indicator shows 100% always, multi session for DVD discs is not supported.

More about storage devices Administration (Patient Database)
Philips MRI 369
Phili
ps H
ealth
care
4598
006
437
51/7
81 *
03/
2014
*7
Retrieving data from PACS
During retrieval of data from a PACS, the scanner allows to delete data from the patient justbeing retrieved. Please check the QueueManager for completion of the job before taking newactions within administration.
Autopush to Workstation
If a DICOM node, e.g. EWS (Extended MR WorkSpace) is connected to the MR console, exami-nations can automatically be transferred to this DICOM node, to facilitate the workflow. All ex-aminations are then available on the DICOM node where they can be viewed and postpro-cessed directly.
To enable automatic transfer, proceed as follows:
1. From the 'Examination' menu, select ‘Autopush to Workstation’ to enable the autopushfunction.
Since this is a persistent setting, this action has to be done only once.
Automatically push scans to a network node
You have to perform two steps in order to automatically push scans to a network node.
1. Enable the ’Push to workstation’ function for the ExamCards/protocols. Every time theseExamCards/protocols are executed, the resulting scans will automatically be pushed to thenetwork node.
2. Select the network node (push node) to which these ExamCards/scans have to be pushed.
Enable ’Push to Workstation’
1. Right-click on the protocol(s)/ExamCard and select ’Push to workstation’.
2. Save the ExamCard to ensure re-use of the settings.
Fig. 192: Right-mouse menu in ExamCard environment. The 'Push to workstation' function is enabled.
NOTICEPush to workstation has to be set once per ExamCard.
Select the workstation

Administration (Patient Database) More about data transfer to DVD
370 Philips MRI
Phili
ps H
ealth
care
4598
006
437
51/7
81 *
03/
2014
*7
1. Click the ’ExamCard Properties’ button in the List View.
2. Click the ’Push Nodes’ tab.
Fig. 193: 'General' EC parameters and 'Push Nodes' tab.
3. Select the push nodes by setting the parameter to ’Yes’.
The above-mentioned steps have to be repeated each time the system is started and only haveeffect on the ExamCards / scans that have "Push to workstation" enabled.
DICOM
Please refer to the ‘DICOM Conformance Statement’.
NOTICEPrior to examination transfer to PACS, make sure that the examination is not in use in theviewing and/or scanning environment.
Otherwise it (or parts of it) could be locked and not be transferred. In this case, a messageappears describing the cause of the problem.
More about data transfer to DVDA DVD provides high-capacity storage of images.
NOTICEThe DVD recorder is compatible with Philips DVD+RW 4-speed media only.
NOTICEOnly perform one action at the time with DVD storage: writing a DVD, storage to Queue DVDor browsing a Queue DVD slot.

More about data transfer to DVD Administration (Patient Database)
Philips MRI 371
Phili
ps H
ealth
care
4598
006
437
51/7
81 *
03/
2014
*7
General
The DVD writer is a consumer product. The lifetime of consumer products in general is less thanthe lifetime of medical products. Of course lifetime also depends on the usage.
If writing to DVD is unsuccessful, please retry with a new DVD+RW 4x before contacting aPhilips representative.
NOTICEThe quality of a DVD will decrease over time.
For long-term storage it is advised to use an approved medical archiving solution (e.g. PACS).
Queue DVD
A Queue DVD is a storage directory for data before it is written to a DVD.
There are five Queue DVD slots available to compile patient data for multiple DVD’s.
Refreshing of the information on Queue DVD
• Click the |Refresh| button for a complete rewrite of the directory. This may take severalminutes. Click |Cancel| to cancel the operation.
• Select ‘QDVDx’ from the pull-down menu for a fast refresh.
Copy to DVD
It is also possible to write directly to a DVD by clicking the button |Copy to DVD| while you arein local database control.
This function can be used to quickly provide a patient with a copy of the exam or for PhilipsService or Application Support services.
DICOM viewer
On every DVD a DICOM viewer will be installed. This viewer enables viewing of images on everyPC running Windows XP.
In Windows Explorer, the DICOM viewer can be started by double-clicking on ‘pmsdview.exe’.
This viewer is not intended for clinical and/or diagnostic purposes.
To read data from a DVD
• ensure that the DVD is placed in the DVD reader and not in the DVD burner.
About DVDs
• Use Philips 4-speed DVD+RW media (medical grade) only. Other types are not supported.
• Please handle DVDs according to the manufacturer’s instructions. Realize that DVDs are vul-nerable and need to be handled with care.
• Do not use adhesive labels on the DVD. These labels may cause unbalance to the DVD andthe adhesive can damage the surface.
• For labeling only use special pens available for writing on DVDs.

Administration (Patient Database) More about data transfer to DVD
372 Philips MRI
Phili
ps H
ealth
care
4598
006
437
51/7
81 *
03/
2014
*7
• Remove fingerprints on DVDs according to the manufactures instructions atwww.philips.com (consumer products).
• The DVD content is optimized for backup of the patient image data. Next to image data italso contains the "presentation states" (Window width, level, pan and zoom settings, ROIs,annotations, lines) and private objects for MRS. Basic DICOM viewers might not be able tohandle these presentation states or private objects or enhanced DICOM objects.
• A DVD can contain about 30000 to 40000 images. In case of large datasets this limit can bereached for one patient. Divide the examination by opening the examination in ‘Administra-tion’ and selectively write scans to DVD.
NOTICETake extra care when modifying the patient data in combination with storage on DVD.
The same image data with the original patient data and the modified patient data cannot bestored on the same DVD.
Procedure
1. Select the local patient database.
2. Select the data to be transferred.
3. Select one of the five Queue DVD slots.
Fig. 194: Queue DVD slots.
4. Start the transfer by clicking on the |Export selection to Queue DVD| button.
5. Answer the questions in the pop-up dialogue boxes and click |Proceed|.
The above steps can be repeated until the selection is completed.
6. Select ‘Queue DVD’ in the top-left corner of the Administration window.
7. Start the transfer to DVD by clicking on the |Copy all to DVD| button. The DVD is automati-cally ejected when the writing session has finished.
If writing to DVD was succesfull, the data is automatically removed from the Queue DVD slot.

More about data transfer to DVD Administration (Patient Database)
Philips MRI 373
Phili
ps H
ealth
care
4598
006
437
51/7
81 *
03/
2014
*7
NOTICEDuring a writing session the status can be displayed by pressing the |Windows| key to displaythe Windows task bar and selecting the application tab ‘Burn DVD’.
NOTICEThe DVD content is automatically verified after the writing session.
A window is displayed to indicate the result (when the host is not being rebooted).
NOTICEIt is recommended to check to contents of the DVD after writing.
Check images randomly using the viewer on the DVD.
NOTICECopy data to DVD is only available as a single session.
It is not possible to copy additional data to an existing DVD (no multi session).

Administration (Patient Database) More about data transfer to DVD
374 Philips MRI
Phili
ps H
ealth
care
4598
006
437
51/7
81 *
03/
2014
*7

More about data transfer to DVD Using USB storage devices
Philips MRI 375
Phili
ps H
ealth
care
4598
006
437
51/7
81 *
03/
2014
*7
Using USB storage devices
NOTICEUsing USB devices might be disabled by your system administrator.
Using USB storage devices can be enabled by the Hospital Admin.
USB storage devices (flash drives, hard drives) are recognized by the system and can be used forexchanging data. The operating system automatically assigns a drive letter to the device.
CAUTIONDo not remove the USB storage device without using the "Safely Remove Hardware" option.
Removing the device without using this option can corrupt the data on the USB memory de-vice.
NOTICEThe USB storage device may contain confidential information.
Take appropriate measures to protect this information. It is not possible to prevent the trans-fer of data to removable media.
Enable USB Devices (by Hospital Admin)
► Logon as Hospital Admin.
► Click on the Windows Start Button and select MR System Management followed by SystemManagement and Enable or Disable Removable Media.
► Click Yes to enable or No to disable the use of USB devices.
15

Using USB storage devices USB Hard Drives
376 Philips MRI
Phili
ps H
ealth
care
4598
006
437
51/7
81 *
03/
2014
*7
Using "Safely Remove Hardware" option
1. Close all applications that access the USB storage device.
2. Select ‘system’ -> ‘show taskbar’ or press the |windows| key on your keyboard to show theWindows taskbar.
3. left click once on the ‘Safely Remove Hardware’ icon in the notification area of the taskbarand select ‘Safely remove USB Mass Storage Device - Drive (<drive letter>:)’.
4. You can safely remove your USB storage device when the ‘Safe To Remove Hardware’ mes-sage appears.
USB Hard Drives
CAUTIONConnecting a USB-powered external hard drive may cause the USB ports of the host computerto stop working. All USB connected devices will not work anymore.
The hard drive may consume too much power causing the host computer to shut down theUSB ports because of safety reasons.
When this occurs the USB ports can be reactivated by:
1. Disconnect the USB hard drive.
2. Shut down the host computer and remove the power for 10 seconds.
3. Reconnect the power and start up the host computer.The USB ports are reactivated.
The problem can be prevented by using an external USB drive with an external power connec-tion or using an external drive with a data USB cable and a power-to-USB cable.
When using a power-to-USB cable:
► First connect both USB cables to the computer.
► Connect the power-to-USB cable to the external device.
► Connect the USB data cable to the device.

Remote Desktop Miscellaneous Chapters
Philips MRI 377
Phili
ps H
ealth
care
4598
006
437
51/7
81 *
03/
2014
*7
Miscellaneous Chapters
Remote DesktopThis section describes the Remote Desktop application of your system.
Remote Desktop enables remote support or assistance on your system.This functionality enables remote users to access your system:
• ViewOnly: remote viewing of the system desktop.
• TakeOver: remote control of the system desktop.
In a ‘Single Session’ (ViewOnly or TakeOver) you allow the remote user to view your system orcontrol your system for one session only. After a session is stopped or after a log-off or rebootof your system the remote connection has to be re-enabled by the local user.
In ‘Fixed Duration’ (TakeOver) you allow the remote user to control your system for a limitedtime period, from 1 to 60 hours. The remote user can access your system independently for thecomplete duration of the session by using a password protected connection. This password isset at the connection start up. When a reboot of the system is necessary, it can be done by the remote user. After starting aFixed Duration session the assistance of the local user is not required.
A Fixed Duration session may be used to service your system during the time that it is not used.
WARNINGFixed duration session shall only be performed with appropriate safety, security and privacymeasures taken according to hospital policies.
Every session can be stopped at all times by the local user. The remote connection is thenclosed and has to be re-enabled by the local user if necessary. This also applies to a Fixed Dura-tion session.
NOTICEWhen starting a Remote Desktop session a dialog box appears displaying a warning text. Thesession cannot be started before the local user agrees by clicking the |I agree| button.
WARNINGDuring a single TakeOver session, the local user must stay at the system console and monitorthe activities performed by the remote user.
16

Miscellaneous Chapters Remote Desktop
378 Philips MRI
Phili
ps H
ealth
care
4598
006
437
51/7
81 *
03/
2014
*7
WARNINGThe local user must be present at the console at all times during scanning of a patient in aRemote Desktop session.
WARNINGThe local user is responsible for ensuring the safe and secure use of the system and for thesafety of his patient. It is possible to terminate a session at all times using the |Stop| buttonon the screen.
WARNINGOnly expert users are allowed to run a TakeOver session.
WARNINGDuring a TakeOver Fixed Duration session where the local user is not present, the local userhas to verify that no person is present in the examination room. Take appropriate measures toinform people that a TakeOver session is running.
Remember that scanning is only possible when the door of the examination room is closed.
WorkflowContact Philips customer support in case of a system failure or problem. The service engineermay want to view your system desktop while you are scanning or access it to remotely serviceyour system.
NOTICEIt is advised to keep contact on the phone for the complete length of the session.
1. Click the Windows |Start| button, go to |MR user| and select |Enable Remote Desktop| tostart the Remote Desktop application. A dialog box appears displaying the following text:
Enable Remote Desktop Session A Remote Desktop session has been requested.If you accept this Remote Desktop request, you confirm that you know that this is an au-thorized Remote Desktop session. You further confirm that you are the responsible local operator for the system during thisRemote Desktop session and have been fully informed about the possible consequences re-garding Safety, Security and Privacy arising from permitting remote operation of the sys-tem, including those discussed in the system's "instructions for use".

Remote Desktop Miscellaneous Chapters
Philips MRI 379
Phili
ps H
ealth
care
4598
006
437
51/7
81 *
03/
2014
*7
During a single windows Take Over session, you must stay at the system console and moni-tor the activities performed by the remote user. You can end the Remote Desktop sessionany time by pressing the "STOP" button on your screen. As the operator of the system, youare responsible for the safe and secure use of the system. Note that certain private information, including electronic Protected Health Information(ePHI) about patients, will become accessible to the remote operator. Be sure to stay withinyour institution's policy regarding disclosure of confidential information to third parties. |I Agree| or |Exit Session|
2. If in doubt about the message click |Exit Session| to cancel. Click |I agree| to confirm. An ‘Enable Remote session’ box appears on the screen.
3. Select:
(a) |Single Windows Session| or(b) |Fixed Duration| and the amount of time (1 to max. 60 hours) you allow the remoteuser to access your system, and click |OK|.
The application is active and a ‘VNC’ icon is displayed in the tray of your Windows taskbar.
• Single Windows Session A red Stop button appears on the screen. With this button you can stop the session. Thebutton always stays on top and can be placed anywhere on the screen.
• ¥Fixed Duration A dialog box appears on the screen with a |Stop| button and fields to enter/confirm apassword.
NOTICEThe password has to be entered by the remote user.
4. Inform the service engineer that the application is active.The service engineer will start up the remote connection and a ‘VNC server acceptance’box appears on the screen.

Miscellaneous Chapters Remote Software Installation (RSI)
380 Philips MRI
Phili
ps H
ealth
care
4598
006
437
51/7
81 *
03/
2014
*7
Fig. 195: VNC server acceptance box
5. Click:
• |Approve| to confirm a TakeOver session or
• |View only| to confirm a ViewOnly session.
When the Remote connection is active the background color of the ‘VNC’ icon in the tray ofyour Windows taskbar changes from white to black.
For a Fixed Duration the service engineer has to enter a password. After the password has beenconfirmed the box minimizes to the |Stop| button. With this button you can stop the session.The button always stays on top and can be placed anywhere on the screen. The remaining ses-sion time is displayed in the header of the button.
NOTICEError messages may appear on the screen when the password is not entered correctly.
These messages are for the remote user only.
Stopping a session
The local user can stop a Remote Desktop session at all times:
• Click the red |Stop| button to stop the session. A confirmation box appears on the screen:‘Are you sure you want to stop the remote session’.
• Click |OK| to confirm. The session is stopped.
When finishing a Single Windows Session the local user as well as the remote user can close thesession.
NOTICEThe start/stop of every Remote Desktop session is logged by your system.
The Remote Service Network logs who has been the remote user.
Remote Software Installation (RSI)The Remote Software Installation application (RSI) detects software updates or fixes which areuploaded to your system and ready to install.This application is started automatically at logon of your system.

Remote Software Installation (RSI) Miscellaneous Chapters
Philips MRI 381
Phili
ps H
ealth
care
4598
006
437
51/7
81 *
03/
2014
*7
When new updates or fixes are available, a flashing RSI icon will appear in the tray of your Win-dows taskbar. The taskbar is shown automatically. Hide the taskbar again by clicking on an arbi-trary application.
1. Click on the |RSI| icon. The MR software Installation dialog appears.
In the Installation dialog the following is listed:
• Updates and fixes list.
• ‘Name’, name of the update or fix.
• ‘Release notes’, name of the Release Notes.
• ‘Application notes’, name of the Application Notes, if available.
• ‘Patient data deleted?’, the value is ‘yes’ when patient data is deleted before instal-lation of the update or fix.
• ‘Installation time’, displays the estimated installation time of the update or fix.
• ‘Status’, displays the status of the update or fix (ready for installation, or installed).
• Buttons.
• ‘Open Release Notes’, to view the Release Notes.
• ‘Open Application Notes’, to view the application Notes.
• ‘Install All’, to install all listed updates and fixes.
• ‘Close’, to close the installation dialog.
Fig. 196: RSI dialog
NOTICEThe ‘Install All’ button is not available to operators.
Installation of updates and fixes can only be performed by the hospital administrator or MRservice engineers.
NOTICEThe operator should inform the hospital administrator or MR service engineers when updatesor fixes are available.

Miscellaneous Chapters Remote Software Installation (RSI)
382 Philips MRI
Phili
ps H
ealth
care
4598
006
437
51/7
81 *
03/
2014
*7
NOTICEA Warning is displayed in the dialog when patient data will be deleted at installing of updatesand fixes: ‘Patient database will be deleted. Archive the patient database before installation‘.
2. Click on the row of the update of fix of which information is needed.
3. Click the ‘Open Release Notes’ or ‘Open Application Notes’ button to open the requireddocument.
NOTICEA warning is displayed when no row is selected.
Installation
Installation of updates and fixes can only be done by the hospital administrator or MR serviceengineers.
1. Logon as hospital administrator.
NOTICEIf necessary contact your local Philips service representative for logon details.
2. Double-click on the |RSI| icon. The MR software Installation dialog appears.
3. Click the ‘Install All’ button. The installation procedure of all updates and fixes will be start-ed.
When patient data is going to be deleted a confirmation dialog is displayed: ‘The Patientdata will be deleted. Has the patient data been archived?’
4. Click ‘Yes’ to install the updates and fixes or ‘No’ to cancel the installation, the RSI applica-tion is then closed.
The installation starts with creating a backup of the MR application software and site spe-cific configurations. When the backup is successful the updates and fixes will be installed.
After installations the system has to be rebooted and a dialog will appear.
5. Confirm to reboot the system or cancel.
After successful installation all updates and fixes will be deleted and the status is set to ‘Instal-led’.The Release and Application Notes remain on the system and in the RSI dialog.

Customer Feedback Miscellaneous Chapters
Philips MRI 383
Phili
ps H
ealth
care
4598
006
437
51/7
81 *
03/
2014
*7
NOTICEPlease contact your local Philips service representative if an installation was unsuccessful.
A system restore may be required.
Customer FeedbackProblems found while working with the system can be described using the Customer Feedbacktool, also called FPR (Field Problem Report) Utility.
The problem reports can be read out by your Philips service engineer.
NOTICEPlease inform your local Philips service representative in case you submitted a problem reporton the system.
Prepare DICOM images
If DICOM images are to be included, these images need to be prepared first.
► Clean the 'Disk Files' partition first:
• Select ‘Administration’ from the ’Patient’ main menu or press |F4|.
• Select 'Disk Files' as source database or device.
• Click 'Select All'.
• Click 'Delete' to clean the 'Disk Files' partition.
► Select the images you want to include and choose the destination:
• Select ‘Administration’ from the ’Patient’ main menu or press |F4|.
• Select 'Local Patient Database' as source database or device.
• Select the images to be included.
• Select 'Disk Files' as destination.
• Optional: Enable 'Suppress Patient Data'.
• Press 'Proceed' to confirm.
The selected images will be combined in a zip file on the Disk Files partition.
Submitting a FPR
1. Click |System| in the main menu and select 'Report Issue to Philips...'. The Customer Feedback window opens.
2. Select the |Submit FPR| tab, if it's not active. The table below shows the data fields withinthe |Submit FPR| tab.

Miscellaneous Chapters Customer Feedback
384 Philips MRI
Phili
ps H
ealth
care
4598
006
437
51/7
81 *
03/
2014
*7
• 'Hospital Name' and 'System ref number' cannot be changed.
• Enter 'Occurence date/time' when the problem occurred or select drop-down for calen-dar.
• Enter your name as 'Submitter'.
• Give a short description of the error case in the field 'Error Description'.
• Describe which actions have been done just before the error occured in the field 'Ac-tions prior to error".
3. Check the box ‘Include DICOM images’ if you want to include the prepared images (seeworkflow 'Prepare DICOM images') with the problem report.
NOTICEAn error message is diplayed if no DICOM images can be selected, because they have not beenprepared.
In this case, follow the directions given to include DICOM images.
4. Click |Proceed| to submit the FPR.
Field Data
Hospital Name Cannot be changed.
System ref number Cannot be changed.
Occurrence date/time Enter date and time when the problem occurred or select drop down for calendar.
Submitter Enter your name.
Error Description Give a short description of the error case.
Actions prior to error Describe which actions have been done just before the error occurred.
Tab. 24: Overview of Data for the FPR Utility

Artifacts on high field strengths Artifacts
Philips MRI 385
Phili
ps H
ealth
care
4598
006
437
51/7
81 *
03/
2014
*7
ArtifactsArtifacts can occur in MRI for a number of reasons, degrading the image quality and sometimeshindering diagnosis. They may be caused by technical problems and data handling or by physio-logical effects from the patient. Since most artifacts can be reduced, it is important to recognizethem, and to know what can be done to prevent them.
This includes methods of correcting or mitigating such artifacts (e.g. changing bandwidth, gradi-ent moment nulling, pre-saturation, B0 and RF shimming, etc.).
Artifacts on high field strengths
Dielectric shading effect
Artifact appearance Hypo- or hyperintense areas.
Caused by Non-uniform RF distribution in the body, caused by changes of the RF wave dueto the electrical properties of tissue.
This physical phenomenon is more pronounced at 3.0T since the RF wavelengthat 3.0T (approximately 25 cm) approaches the size of the body, resulting in astanding wave.
Countermeasures • MultiTransmit technology addresses this problem at the source, no addi-tional countermeasures have to be taken.
• On 3.0T systems without MultiTransmit technology, dielectric shading ef-fects can occur depending on the patient, particularly in body imaging. Toavoid these effects, it is advised to used Body tuned CLEAR - a specific B1filter that is designed to overcome receive inhomogeneities in body imag-ing.
Fig. 197: Left: Dielectric shading effect on 3.0T system without MultiTransmit. Right: Same patient scanned with Mul-tiTransmit. No dielectric shading.
17

Artifacts Motion artifacts
386 Philips MRI
Phili
ps H
ealth
care
4598
006
437
51/7
81 *
03/
2014
*7
Fig. 198: Formation of dielectric shading on 3.0T system using single transmission (no MultiTransmit). Without Multi-Transmit , a standing wave (2) could be generated since the wavelength of the RF-wave (1) at 3.0T lies in the samerange as the size of the body: 20 cm to 25 cm.
Fig. 199: MultiTransmit technology is designed to avoid the occurence of dielectric effects. With MultiTransmit, si-multaneous parallel RF transmission fully adresses the dielectric shading effect.
Motion artifactsPatient motion is the largest physiological effect that causes artifacts. Motion during the acquis-ition results in inconsistencies in phase and amplitude, which lead to blurring and ghosting.These artifacts appear in the phase encoding direction, independent of the direction of the mo-tion. The different motion artifacts and their remedies are shown below.
Cardiac motion artifact
Artifact appearance Blurring and ghosting.
Caused by Signal variation during data collection due to movement of the heart.
Countermeasures • Cardiac Synchronization.
• Triggering in combination with Flow Compensation and REST provides max-imum artifact reduction.

Motion artifacts Artifacts
Philips MRI 387
Phili
ps H
ealth
care
4598
006
437
51/7
81 *
03/
2014
*7
Related topics • Cardiac Synchronization
• REST
Preset Procedures Cardiac Synchronization is used in all heart and thorax procedures to suppressthese artifacts.
Fig. 200: T-spine image without cardiac triggering.
Artifact caused by breathing
Artifact appearance Blurring and ghosting.
Caused by Signal variation during data collection due to movement of the chest and the ab-dominal wall.
Countermeasures Respiratory Compensation techniques:
• Respiratory Triggering: for TSE and TFE scans with a long TR (1800 ms ...2500 ms).
• Breathhold techniques: to be used in FFE- and TFE.
• PEAR to be used in SE, FFE and IR.
Navigator echo technique
Related topics • Respiratory Triggering.
• Breathhold techniques.
• PEAR.
• SMART.
Respiratory compensation
• is the recommended method for abdominal scans.
• is of minor importance in the thorax area. Most artifacts are caused by cardiac motion.
• should be combined with Cardiac Synchronization in lung imaging.
• is not necessary in the pelvic area, but improves SE images.

Artifacts Motion artifacts
388 Philips MRI
Phili
ps H
ealth
care
4598
006
437
51/7
81 *
03/
2014
*7
Fig. 201: Transverse abdomen, left: without RC, right: with RC.
Artifact due to blood flow
Artifact appearance Repeated ghost signal in the phase encoding direction or unwanted highblood signal.
Caused by Flowing blood due to a misregistration effect of blood flowing within orthrough the image plane, because of the difference in time between thepreparation and read-out gradient.
Countermeasures • REST and Shared REST: especially useful when applying two parallelREST slabs in transverse imaging to saturate the signal of blood flowingthrough plane. Blood will appear as a signal void instead of high signalintensity.
• REST in combination with Flow Compensation (FC) for optimum results.
• REST in Inflow MRA to suppress venous or arterial flow.
• Cardiac Synchronization in MRA to get rid of pulsation artifacts of ves-sels.
Related topics • REST (Regional Saturation Technique).
Fig. 202: Transverse scan of abdomen, left: without REST and FC, right: with REST and FC.

Motion artifacts Artifacts
Philips MRI 389
Phili
ps H
ealth
care
4598
006
437
51/7
81 *
03/
2014
*7
CSF pulsation artifact
Artifact appearance Ghost artifacts superimposed in the image.
Caused by Signal variations during data collection due to pulsatile CSF flow.
Countermeasures • Flow Compensation has proved to be very useful in sagittal spine im-ages and axial liver images.
• Cardiac Triggering is an additional option if Flow Compensation is ap-plied and there are still flow artifacts.
• Inherently compensated: b-FFE (balanced FFE).
Related topics • Flow Compensation.
• Cardiac Triggering.
• b-FFE.
Fig. 203: C-spine, left: without FC, right: with FC.
Flow void artifact
Artifact appearance Black hole like artifacts in axial and sagittal T2W TSE scans with a high TSE-factor.
Caused by Fast flowing CSF.
Countermeasures • Increasing the TSE-factor (minimize echo spacing) so that the scans areless sensitive to flow.
• Flow Compensation.
• Cardiac Triggering.
• Use of b-FFE (balanced FFE).
• Performing a 3D TSE multichunk instead of a MS TSE scan.
Related topics • Flow Compensation.
• Cardiac Triggering.

Artifacts Chemical shift artifacts
390 Philips MRI
Phili
ps H
ealth
care
4598
006
437
51/7
81 *
03/
2014
*7
Fig. 204: Transverse TSE spine with flow voids.
Chemical shift artifacts
Water-Fat shift
Artifact appearance Hypo- and hyperintense lines between tissue boundaries
• in frequency encoding direction for non-EPI/GRASE scans
• in phase encoding direction for EPI/GRASE scans.
Caused by Resonance frequency diffference between water and fat resulting in dis-placement between water and fat by a number of pixels. The hypointenselines are originated by empty voxels and hyperintense lines by superim-posed signals.
Countermeasures • Set the parameter WFS (Water-Fat Shift) to a user defined value. Notethat using a smaller WFS decreases the artifact at the cost of SNR.
• Change the Fat-Shift direction.
Related topics • Water-Fat Shift.
• Fat-Shift Direction.
Fig. 205: From left to right: WFS on phantom. Small WFS. Large WFS.

Chemical shift artifacts Artifacts
Philips MRI 391
Phili
ps H
ealth
care
4598
006
437
51/7
81 *
03/
2014
*7
NOTICEThe chemical shift artifact increases with the field strength.
Water-Fat dephasing
Artifact appearance Signal dephasing in voxels containing both water and fat showing up asblack lines around anatomic structures.
Caused by • Resonance frequency differences between water and fat AND
• Use of an ‘out of phase TE’ (water and fat signals are out of phase).
Countermeasures • Choose an ‘in phase echo time’ (field strength dependent). See tablebelow.
Related topics • Water-Fat Shift.
• Fat Shift Direction.
Fig. 206: Left: water and fat are in phase, right: water and fat are out of phase.
In phase TE’s and out of phase TE’s
1.0T 1.5T 3.0T
In phase TE [ms] 6.9
13.8
20.7
27.6
4.6
9.2
13.8
18.4
23.0
2.3
4.6
6.9
9.2
11.5
Water and fat are in phase when the TE is amultiple of ... [ms]
6.9
4.6
2.3

Artifacts Aliasing artifacts
392 Philips MRI
Phili
ps H
ealth
care
4598
006
437
51/7
81 *
03/
2014
*7
1.0T 1.5T 3.0T
Out of phase TE [ms] 3.45
10.35
17.25
24.15
2.3
6.9
11.5
16.1
20.7
1.15
3.45
5.75
8.05
10.35
NOTICEThese values are based on calculations.
Actual values depend on fat characteristics.
Aliasing artifactsAliasing artifacts are also referred to as fold-over artifact.
Artifact appearance Tissue outside the FOV which is folded back into the image, most commonlyoccuring in fold-over direction (phase encoding direction).
• In 3D scans also possible in slice direction.
Caused by The spins within the FOV acquire a maximum phase shift of n x 360o. Spinsjust outside the FOV have a phase shift of more than one cycle. This resultsin misregistration of those spins.
Countermeasures • Fold-over suppression: Signal from outside the FOV is suppressed.
• Increase RFOV so there is no tissue outside the FOV.
• Change the fold-over direction if possible so there is no tissue to foldback. This also depends on other artifacts that might occur.
• Use REST slabs to saturate tissue outside the FOV.
Related topics • Fold-over suppression.
• REST.
• RFOV.
• SENSE.

Magnetic material artifacts Artifacts
Philips MRI 393
Phili
ps H
ealth
care
4598
006
437
51/7
81 *
03/
2014
*7
Fig. 207: Transverse scan. Left: Fold-over Direction=LR, no Fold-over Suppression. Middle: Fold-over Direction=AP, noFold-over Suppression. Right: Fold-over Direction=RL with Fold-over Suppression.
Magnetic material artifactsArtifact appearance Signal loss around ferromagnetic material or metallic material.
Caused by • Magnetic field distortions by ferromagnetic metal implants such as hipprostheses, surgical wires and clips, and also some eye cosmetics andsmall metallic particles.
• Eddy currents induced in non-ferromagnetic metallic material byswitching gradients.
Countermeasures • Remove any kind of ferromagnetic and metallic material.
Susceptibility artifactsArtifact appearance • Signal dephasing resulting in misregistration at interfaces of tissues
with different magnetic susceptibility.
• in FFE- and EPI-scans.
Caused by • Different magnetic susceptibility (different local magnetic fields). Forexample, at interfaces between air and tissue, inhomogeneities are in-duced.
Countermeasures • Larger matrix size or smaller FOV (smaller pixels).
• Shorter TE.
• A smaller WFS value and control of Fat Shift Direction.
• Full acquisition (scan percentage 100%).
Related topics • FFE and EPI.
• Fat Shift direction.

Artifacts Ringing (Gibbs) artifacts
394 Philips MRI
Phili
ps H
ealth
care
4598
006
437
51/7
81 *
03/
2014
*7
Fig. 208: Left: Sagittal brain with magnetic field distortion (hairpin). Middle: Same patient, transverse scan. Right:Susceptibility artifact in EPI scan.
Ringing (Gibbs) artifactsArtifact appearance Ring like or linear truncation artifact, also called Gibbs artifact.
Caused by Reduced acquisition. The artifacts are induced by high contrast transititions,and are particularly common with scan percentages below 80%.
Countermeasures • Ringing filtering: Pre-reconstruction filter which also smooths theimage.
• Higher ‘Scan Percentage’ value.
Related topics • Scan Percentage.
Zebra stripe artifact
Artifact appearance Zebra stripes.
Caused by REST saturation pulse interfering with the data acquisition in 3D-TSE scans.
Countermeasures • Change the number of REST slabs.
• Decrease the TSE factor.
• Use an even number of ‘true’ NSA.
NOTICEThis artifact does not occur anymore in TSE scans with more than 1 ‘true’ NSA.
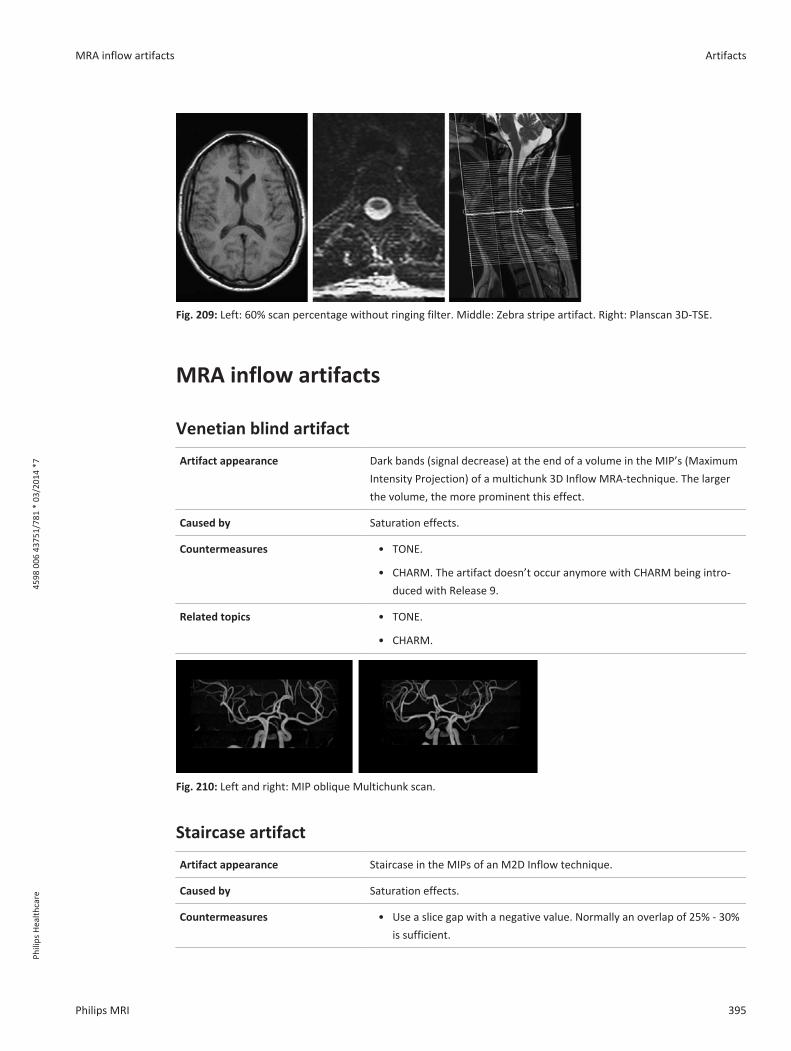
MRA inflow artifacts Artifacts
Philips MRI 395
Phili
ps H
ealth
care
4598
006
437
51/7
81 *
03/
2014
*7
Fig. 209: Left: 60% scan percentage without ringing filter. Middle: Zebra stripe artifact. Right: Planscan 3D-TSE.
MRA inflow artifacts
Venetian blind artifact
Artifact appearance Dark bands (signal decrease) at the end of a volume in the MIP’s (MaximumIntensity Projection) of a multichunk 3D Inflow MRA-technique. The largerthe volume, the more prominent this effect.
Caused by Saturation effects.
Countermeasures • TONE.
• CHARM. The artifact doesn’t occur anymore with CHARM being intro-duced with Release 9.
Related topics • TONE.
• CHARM.
Fig. 210: Left and right: MIP oblique Multichunk scan.
Staircase artifact
Artifact appearance Staircase in the MIPs of an M2D Inflow technique.
Caused by Saturation effects.
Countermeasures • Use a slice gap with a negative value. Normally an overlap of 25% - 30%is sufficient.

Artifacts Fat suppression artifact
396 Philips MRI
Phili
ps H
ealth
care
4598
006
437
51/7
81 *
03/
2014
*7
Fat suppression artifactArtifact appearance Fat is not completely suppressed using the SPIR-, SPAIR- or ProSet-techni-
que.
Caused by • locally distorted magnetic field (B0): water could partially be sup-pressed instead of fat.
and/or
• locally distorted RF field (B1): the flip angle used for the SPIR- and Pro-Set-pulse could slightly vary over the FOV.
Countermeasures • There are several ways for complete fat suppression. See following list.
Related topics • STIR.
• SPIR.
• SPAIR.
• ProSet.
• Shimming.
NOTICESPAIR, SPIR and ProSet are critical with regard to the magnetic field homogeneity.
Countermeasures
Patient preparation
• Remove all metal (also dentures, dental devices) from the patient.
• Ask the patient to remove eye make-up (often containing metallic particles).
• Make sure the patient has been to the toilet, because high signal intensities (e.g. full blad-der) may disturb the autoshim.
Positioning
• Ensure that the area of interest is as close as possible to the isocenter (less than 80 mm inany direction).
• Always move the table whenever ‘travel to scan plane’ is prompted.
• Avoid placing two objects (knees, ankles) in one FOV.
• Do not use sandbags inside or near the FOV, because they may enlarge susceptibility ef-fects.

Quadrupole artifact Artifacts
Philips MRI 397
Phili
ps H
ealth
care
4598
006
437
51/7
81 *
03/
2014
*7
• In some cases, the use of pads made out of special material (e.g. satpads®) may help. Notethat by putting the pad between surface coil and patient, the SNR may adversely be affect-ed (larger coil-patient distance).
Parameter settings
• Adjust the FOV to the anatomy of interest.
• Use volume shimming and select the area that needs to be fat suppressed.
Alternative
Do not use spectral fat suppression on anatomies that suffer from large susceptibility effects(neck, cervical spine, thoracic spine). Use STIR instead.
STIR-sequence
• IR or IR-TSE with a short TI.
• providing good fat suppression.
• not useful in combination with contrast agents since they will suppress all tissues with ashort T1 including contrast enhanced tissues.
Quadrupole artifactArtifact appearance Signal intensity variations with SPIR, especially in abdomen and pelvis.
Caused by Eddy currents in the patient. This results in B1 disturbance from left to rightand from anterior to posterior.
Countermeasures STIR or SPAIR instead of SPIR.
Related topics • STIR.
• SPIR.
• ProSet.
• Shimming.
Fig. 211: Left: Coronal oblique. Right: transverse.
NOTICEBoth, SPIR and ProSet are very critical with regard to the magnetic field homogeneity.

Artifacts Multiple stack artifact
398 Philips MRI
Phili
ps H
ealth
care
4598
006
437
51/7
81 *
03/
2014
*7
Multiple stack artifactArtifact appearance Black line artifacts in a multistack scan where slices of the different stacks
overlap or cross over.
Caused by When the stacks are measured in one package, the measurement is done inan interleaved manner. Interference between the different slices occurswhich results in signal loss.
Countermeasures • Planning the stacks in different packages (Parameter ‘Stacks as pack-ages’).
• Changing the position or angulation of the stacks such that they do notoverlap.
Related topics • Stacks.
Fig. 212: A: Planscan of B. B: Transverse spine imamge with multistack artifact.
REST artifactArtifact appearance Signal distortion in the region where the REST has been applied.
Caused by Two free REST slabs which intersect each other.
Countermeasures Applying the REST slabs such that they do not overlap.
Related topics REST.
Fig. 213: REST artifact.

SENSE Artifacts Artifacts
Philips MRI 399
Phili
ps H
ealth
care
4598
006
437
51/7
81 *
03/
2014
*7
SENSE Artifacts
Intrinsic backfolding
Artifact appearance Backfolding in the center of the image or or the 3D volume:
• in-plane (fold-over direction) in M2D and MS scan mode,
• also in slice direction in 3D scan mode
Caused by FOV, RFOV or 3D volume have been planned too small. Special attention hasto be given to double-oblique cardiac scans.
Countermeasures Enlarge FOV, RFOV or 3D volume. Increase the flexible fold-over suppressionarea.
Fig. 214: Left: 3D - intrinsic backfolding in slice direction. Right: MS - intrinsic backfolding in plane.
Fig. 215: Left and right: The ear folds back in MS scan.
Intrinsic backfolding of artifacts
Artifact appearance Fold-over of ghost artifacts from just outside the FOV.
Caused by FOV, RFOV or 3D volume have been planned slightly too small.

Artifacts MR Spectroscopy Artifacts
400 Philips MRI
Phili
ps H
ealth
care
4598
006
437
51/7
81 *
03/
2014
*7
Countermeasures Enlarge FOV, RFOV or 3D volume. Increase the flexible fold-over suppressionarea.
Cut-line artifacts
Artifact appearance Dark area separated from a bright area by a cut-line.
Caused by The coil elements move during the scan due to breathing.
Countermeasures Right mouse: repeat prescans.
Single-shot sequences and Fat Shift Direction
Artifact appearance Susceptibility related artifact in single-shot EPI sequences with SENSE, fold-over direction AP and fat shift direction A(nterior):
• E.g. high signal at the border of the frontal sinus.
• Especially in b0 images in diffusion weighted scans. Less pronounced inhigh-b images which in turn might result in low signal in the calculatedADC-map.
Caused by Fat shift direction set to A(nterior) in these scans.
Countermeasures Set the ’Fat shift direction’ to ’P(osterior)’ in all cases.
Related topics SENSE.
Fat shift direction.
Fig. 216: Upper row: Fat Shift Direction = Anterior. Lower row: Fat Shift Direction = Posterior.
MR Spectroscopy ArtifactsLike MR-imaging, MR-spectroscopy techniques can suffer fromartifacts. Some of these artifactsare hard to recognize, but can completely alter the outcome of the spectrum. It is important torecognize the artifacts and to know how to avoid them.

MR Spectroscopy Artifacts Artifacts
Philips MRI 401
Phili
ps H
ealth
care
4598
006
437
51/7
81 *
03/
2014
*7
Truncation at the end of the signal
Artifact appearance Artifacts presented as sinc wriggles around the peaks appear in the spectrum. Thewriggles are mainly seen around the residual water peak.
Caused by Signal sampling is stopped before the signals have decayed to (close to) zero resultingin abrupt signal intensity changes which cannot be handled well by theFourier trans-form.
Countermeasure / Solu-tion
Re-acquisition with increased Tacq is the best solution, but time is not always availa-ble to do so. For signal to decay completely to zero, the Tacq should be at least 5 x T2*relaxation time.
Increase Tacq by:
• Increased number of sampled with equal bandwidth.
• Reduce bandwidth with equal number of samples.
If re-acquisition is not an option, filtering of the time domain signal is used to influ-ence the signal such that abrupt signal intensity changes are removed. Note that line-width increases by applyingfilters.
Time domain signal Spectrumafter
Fourier transform
A B
Fig. 217: Time-domain signal (A) that is cut off before signal has decayed, and the resulting spectrum (B). The base-line is distorted by sinc wriggles.
Time domain signalSpectrum
afterFourier
transform
A B
Fig. 218: Same time domain signal (A), with additional Gaussian filtering applied (6Hz). No truncation artifacts in re-sulting spectrum (B), at the cost of spectral resolution.

Artifacts MR Spectroscopy Artifacts
402 Philips MRI
Phili
ps H
ealth
care
4598
006
437
51/7
81 *
03/
2014
*7
Tacq=64 ms Tacq = 128 ms Tacq = 256 ms Tacq = 512 ms
Fig. 219: Image examples in healthy volunteer: SVS TE 144 ms. Different Tacq's.
Truncation with maximum echo sampling
Artifact appearance Artifacts presented as sinc wriggles appear around the baseline of the spectrum.
Caused by If maximum echo signal sampling is used and signal sampling only starts close to theecho top position, abrupt signal intensity changes which cannot be handled well bythe Fourier transform will occur at the start of signal sampling. This will mainly hap-pen if maximum echo is used with short TE.
Countermeasure / Solu-tion
Asymmetric filtering is applied with the symmetry point set to the echo top position.
Fig. 220: A: Unfiltered signal versus B: filtered signal (asymmetric filter) where TD is the time domain signal and Spthespectrum: truncation effect is seen in the unfiltered time domain signal, resulting in wriggles in the baseline ofthe spectrum whereas the artifacts are minimized when applying an asymmetric filter.
Saturation
Artifact appearance Saturation effects in the spectrum.

MR Spectroscopy Artifacts Artifacts
Philips MRI 403
Phili
ps H
ealth
care
4598
006
437
51/7
81 *
03/
2014
*7
Caused by Incomplete T1 relaxation.
To maximally measure the metabolite signals, full T1-relaxation is required before thenext excitation is performed.
Saturation effects are seen if T1-relaxation is not complete. The amount of saturationis different for the various metabolites and saturation effects will affect the valuesfound during peak fitting.
Even though the saturation effect is not hindering spectral quality, it is mentioned inthe artifact section, as it something to be aware of.
Countermeasure / Solu-tion
To allow full T1-relaxation, the TR used should be ³ 5*T1 of the metabolite of interest.
As T1-relaxation times of metabolites are long, scan times would increase tremen-dously.
Fig. 221: Brain spectra (inverted) from a healthy volunteer. The Cho/Cre ratio is changed from 1.69 (1000 ms) to 1.44(4000 ms).
NOTICEIf full T1-relaxation is not achieved within the TR chosen, it is important to acquire some start-up acquisitions.
These shots are used to place the spin system into steady state.
Frequency drift
Artifact appearance Increased linewidths. Peaks smear out.
Caused by Frequency drift.
As part of the preparation phases, af0 determination is performed. During the longspectroscopy scan, thisf0 frequency could change slightly,
Countermeasure / Solu-tion
• Save each FID separately, correct for the drift in post-processing.

Artifacts MR Spectroscopy Artifacts
404 Philips MRI
Phili
ps H
ealth
care
4598
006
437
51/7
81 *
03/
2014
*7
Blue lines:measured signal in each respective excitation
Red lines:e=resultant spectrum
(B)
(R)
Fig. 222: As the frequency of the peak slightly changes over time, the resultant spectrum will show up as a broaderpeak with reduced amplitude. Blue lines (B): measured signal in each respective excitation, Red lines (R): resultantspectrum.
Ghosting
Artifact appearance Distorted spectra in row of voxels with equal phase encoding gradient.
For CSI: even in two directions as phase encodings is done in two directions.
Caused by (Pulsatile) through-plane flow:
Like in MR imaging, (pulsatile) through-plane flow can cause ghosting in the phase en-coding drections in spectroscopic imaging.
Countermeasure / Solu-tion
To reduce the signal intensity of through-plane flow, parallel REST slabs can be posi-tioned above and below the stack of CSI-slices.
Baseline distortions
Artifact appearance Baseline distortions, mainly seen in short TE spectra.
Caused by Signals of fast realaxing macromolecules and/or signals of unsuppressed water whichare still present in the first few points in the time domain signal.
These baseline distortion hamper good fitting and quantification.
Countermeasure / Solu-tion
• In time-domain: take out the first points of the FID with shift with zero padding.
• In frequency-domain:fit polynomial spline.
It is caused in the first few points in the time-domain signal, where signals of fast-relaxing mac-romolecules and/or signals of non-suppressed water are still present.
These baseline distortion hamper good fitting and quantification.

MR Spectroscopy Artifacts Artifacts
Philips MRI 405
Phili
ps H
ealth
care
4598
006
437
51/7
81 *
03/
2014
*7
DC-Offset
Artifact appearance Spike signal in the spectrum at zero frequency.
Caused by Time domain signal decay to a constant, but not to zero.
Countermeasure / Solu-tion
• Phase cycling, to cancel the effect in subsequent measurements.
• Subtract the last 10% of the FID.
Incomplete water suppression
Artifact appearance Wriggle artifacts around the (residual) water peak.
Caused by Incomplete water suppression: residual water signal from outside of the volume of in-terest gives rise to stimulated echoes, causing artifacts.
Countermeasure / Solu-tion
• Phase cycling (is already implemented in preset procedures).
• REST slabs around the VOI to suppress non-suppressed water.
• Longer duration of the spoiler gradients.
Residual signals
Artifact appearance Signals around -2ppm and +10ppm in corrected spectra.
Caused by Presence of high fat signal in the reference measurement.
Countermeasure / Solu-tion
Reprocess without use of reference measurement.

Index
406 Philips MRI
4598
006
437
51/7
81 *
03/
2014
*7
Phili
ps H
ealth
care
IndexSymbols’Snap-to-table’ 0
Numerics3 Point Planscan 733 Points Planscan 2483D Mode, display planning 743D-K-space shutter
Coronary Angiography 2664CH-scan
DSMR 253
AAbout ... 68ACQ voxel MPS 86Activate Manual Confirmation 72Actual phase percentage 87ADC iso map 146ADC map 145Adenosine infusion
Cardiac MRI 255Administration 30, 63, 357Aliasing 392All Mid Planes 74American Society of Echocardiography 252, 254Analysis and Review packages (Overview) 105Analysis menu 65Anatomic region 71Annotation 108Anonymize patient data 361Aortic valves 250Apodization Filtering 323Apply 50Archiving and Networking 357Area 131Area under the curve
Dynamic View, T1 Analysis 188Arterial Input Function 176Arterial Spin Labeling 230
ArtifactBlood flow 388Breathing 387Cardiac motion 386CSF pulsation 389Cut-line artifact 400Fat suppression artifact 396Flow void 389Intrinsic backfolding of artifacts with SENSE 399Intrinsic backfolding with SENSE 399Magnetic material 393Multiple stack artifact 398Quadrupole artifact 397REST artifact 398Ringing 394SShot and Fat Shift direction 400Staircase artifact 395Susceptibility 393Venetian blind artifact 395Water-Fat dephasing 391Water-Fat Shift 390Zebra stripes 394
Artifacts 400Asymmetric filtering 402Autoarchive (AutoPush) 369Automatic coil selection 88Autopush to DICOM Node 66, 369Autopush to EWS 369Autopush to Workstation 64, 369Autoview 93
Menu entry 30, 63Axial stitching 124
BB1+rms 86Baseline distortions 404Baseline Polynomial Terms 329Basic views 249BolusTrak 234BolusTrak combined with MobiTrak/MobiFlex 240Box Mode 74Brevity of Enhancement
Dynamic View, T1 Analysis 188

Index
Philips MRI 407
Phili
ps H
ealth
care
4598
006
437
51/7
81 *
03/
2014
*7
CCancel 50Capture Screen 66, 95Cardiac views 249
Planning 246CE-MRA 235Chinese characters, patient data 199Cine scans 251, 252Close Exam 63Cluster size 166, 170Coil Selection User Interface 88Coil selection, automatic 88Coils (parameters)
ExamCard 81Color LUT 111, 175, 183Combine Accession Number 202Computer start up 16Confirm vertrebrae count 102Conflicts page, ExamCard 81Context sensitive Help 19Continuous mode 48Contrast (parameters), ExamCard 80Contrast bolus timing scan 236Coronary Angiography 261Coronary arteries
Targeted approach 262Whole heart examination 262
Correct for DSA Filter 334Current image 50Current view 50Customer Feedback tool 383Customer Feedback window 67
DDashboard 79
ExamCard Manager 78Data handling 357Data Monitoring 65dB/dt 87Delay maps
Dynamic View, T2* Analysis 181Delayed reconstruction 228DICOM 370DICOM Conformance Statement 20DICOM Export 363Dielectric shading 385Diffusion 141
Diffusion postprocessing package 141Diffusion registration 141Disengage Posterior Coil 72Dobutamine 251Dobutamine infusion
DSMR 253Dual Volume Decode 321DVD 370, 371DWI iso map 145Dyn/ang (parameters), ExamCard 80
EeADC iso map 146eADC map 146Emergency Stop button 21Enable Automatic Start Scan 64Enable CSV Output 317Enable Stack display mode selection 95ERD 245Esys 303Esys Synchronization Protocol (ESP) 303ExamCard 33ExamCard Databases 33ExamCard Exchange 42ExamCard folders 33ExamCard Locking 40ExamCard Manager 78ExamCard Prep Mode 40ExamCard properties 71, 212Examination data, Entering 197Examination data, modify 367Examination menu 63Examination Room Display (ERD) 245Examination tabs 68Exit 68Exit system software 17Export2Office 0
Ff0 determination 403f0 frequency 403FA map 146FA value 146Fat suppression
Coronary Angiography 266Feedback 67FiberTrak 147

Index
408 Philips MRI
4598
006
437
51/7
81 *
03/
2014
*7
Phili
ps H
ealth
care
FiberTrak package 147FiberTrak, workflow 291Field Problem Report 383Filters 401Fit polynomial spline 404Flow void 389Flux 131Fold-over artifact 392Four Chamber view 249, 250Fourier transform 401Fractional anisotropy (FA) 146Frequency drift 403Fuse Hardcut 124Fuse Smooth 124Fusing 121, 124
GGenerate Maps 335GeoLink 38, 209Geometry (parameters), ExamCard 80Geometry databases, SmartExam 44Geometry Link 38Ghosting 404Gibbs artifact 394Graph Display 336Graphical PlanScan area 72
HHelp menu 68Help system 19Help Topics 29, 68Hemodynamic delay 170Hide 49Hide/Show Slab 74Hide/Show Stack 74Hide/Show Volume 74High Temp Cine scan 262HLA (Horizontal Long Axis) 249Hospital/Institution name 25
IIB (Image Based) Shimming 45Image Algebra
Postprocessing package 136Image Based Shimming 45Image Information 57, 125, 176, 184ImageView 106
Improve SmartGeometries with current planning 102In phase TE 391Index 181Information Page 85Initial Baseline Subtraction 329Integration Ranges for Maps 329Interactive Modes 48Interactive Scanning 47Interactive Scanning tool 247Intercom 22Interpolate images 57, 125, 177, 184Invert Gray Level 57, 125, 177, 184iPatient 49IViewBold 162
JJapanese characters, patient data 199, 200Job Queue 30, 66, 364
KKeyboard 29Keyboard functions 51Keyboard overlay 29Korean characters, patient data 199
LL2CH-scan
DSMR 253Language setting 26Late enhancement 257Late Enhancement sequence 258Laterality 71Laterality, ExamCards 38Launch Pad 68Layout 107Left Two Chamber (L2CH) view 250Left Ventricular Outflow Tract (LVOT) 250Links
Add to 94Apply Link 94Remove from 94
List View 69Look-Locker sequence 258Look-Up Table 111, 175, 183
MMax B1+rms 86

Index
Philips MRI 409
Phili
ps H
ealth
care
4598
006
437
51/7
81 *
03/
2014
*7
Maximum EnhancementDynamic View, T1 Analysis 188
Maximum Intensity Projection 113Maximum Relative Enhancement
Dynamic View, T1 Analysis 188Maximum velocity 131MaxIP 113Mean Transit Time (MTT) 180Mean velocity 131Merge Series
MobiView 124Metabolite maps 335Metabolites parameters 329Minimum Intensity Projection 113Minimum velocity 131MinIP 113MIP 113Mitral valves 250MobiFlex 235
Workflow 238MobiTrak 235
Workflow 236MobiTrak/MobiFlex with BolusTrak 240MobiView package 121Motion (parameters), ExamCard 80Motion Correction, BOLD imaging 165Mouse 29Movie Settings 56, 123Movie Toolbox 56, 123MPR 113MultiNuclei (MN) MR Spectroscopy 267MultiPlanarReformat 113
NNegative Integral (NI) 181NetForum 42NeuroPerfusion tool 172New Examination 30, 63, 197No automatic Add Samples Dialog 67Nr. of pixels 131
OOffc/ang (parameters), ExamCard 81OK 49Open for Review 30, 63Orientation 56, 125, 176, 183Out of phase TE 392
Outflow Tracts 250
PPackage Manager 96Panning 54Paradigm repetition length 301Parametric maps
Diffusion package 144Password protection of EC Hospital folder 40Patient data, entering 197Patient data, modify 367Patient Status area 77Patients menu 63Peak Editor 336Peak Fitting 330Peak velocity 131Perform Scan 211Performing First Scan 203Performing first scan planning 203, 211Performing Scan
(Automatic) Coil Selection 88Perfusion
Cardiac MRI 254Perfusion workflow
Myocardial perfusion 255Peripheral Nerve Stimulation (PNS) 77Phase Adjustment 328Phase percentage 87Phosphorous spectroscopy 267Physiology 65Pictorial Index 69PicturePlus
Postprocessing package 133PlanAlign 248Planning geometrically 203, 211Planscan 72Play (movie) 30, 55, 75, 107, 123, 129PNS 35, 37, 62, 77, 79, 86Postproc (parameters), ExamCard 81Postprocessing
Review and Analysis packages 279Postprocessing packages (overview) 105Presentation State 57, 126, 177, 184Print History 66, 343Print Image 343Print Preview 346Print Series 343

Index
410 Philips MRI
4598
006
437
51/7
81 *
03/
2014
*7
Phili
ps H
ealth
care
Print Settings 346Print Setup 344Printing 343Proceed 50Propagate Coverage 209Propagate FOV 209Pulmonary valves 250Push node 212Push nodes 72Push to workstation 72
QQFlow
Postprocessing 127Q-flow 127Quadrupole artifact 397Quantitative Flow
Postprocessing 127Queue Manager 30, 66, 364
RRAO (Right Anterior Oblique) view 249Ratio Maps 335Real-Time Mode
BOLD imaging 165REC voxel MPS 86Reference Tissue 87Relative Enhancement (Dynamic View /T1 Analysis) 187Relative Signal Level (RSL) 87Relative SNR 87Remote Software Installation (RSI) 380Report Issue to Philips 67Reset to SmartPlan 102Reset Window 55, 58, 126, 177, 185Reset Zoom / Pan 55, 58, 126, 177, 185Residual signals 405Residual Water Subtraction 322Results Table
SpectroView 334Review and Analysis packages (Overview) 105Review menu 65Review Planscan 95Review Result 279
ImageView package 106Start up ImageView 280
Right mouse menus 51Right Two Chamber (R2CH) view 250
Right Ventricular Outflow Tract (RVOT) 250Ringing 394RIS 201, 202RSL 87
SSAR 35, 37, 62, 77, 79, 86Saturation effects in the spectrum 402Save ExamCard 64Scaling 59Scan Align 75, 211Scan Align button 239Scan Preparation
Edit an EC 0Extended Parameter Editor 82
Screen Capture 66, 95Script 310, 318Script editor 318Script running 312SED 35, 37, 62, 77, 79, 86Segmentation left ventricle 252Select Peaks 329Selecting Examcard 203Series Preferences Database 337Series Split functionality 363Set Selected Viewer as Source for Cross-Reference 95Shaded Surface Rendering 113Shift Peak Frequency 333Short Axis view 249Shutdown 17Sinc wriggles 401, 402Single-image mode 48Smart MPR 42SmartExam 44
Menu entry 64SmartExam Breast 45SmartExam Spine 45SmartExam Tools 66SmartExam, User-Confirmation 223SmartGeometry Database Editor 67SmartLine Processing 41, 44SmartSelect 89, 90Smoothing (width) 170Sound Pressure level 87Specific Absorption Rate (SAR) 77Specific Energy Dose (SED) 77Spectrum Phase Adjustment 328

Index
Philips MRI 411
Phili
ps H
ealth
care
4598
006
437
51/7
81 *
03/
2014
*7
Spike signal at zero frequency 405Split dynamics 211SPM 168SPT
System Performance Tool 67Stack All Views 93Stack view 93Start menu 19Start Scan
Menu entry 30Statistical Parametric Maps 298Statistical Parametric Maps (SPMs) 168Status Indication area 77Stop Scan
Menu entry 30Stress MR Test 251Stress perfusion
Cardiac MRI 255Summary (parameters), ExamCard 80Suppress patient data 361Susceptibility artifact 393Switch to View
FiberTrak 150System menu 66System Performance Tool (SPT) 67System Preparation
Entering Examination Data 197Select Prior Examinations 201
TT0 - Time of Arrival 180
Dynamic View, T1 Analysis 188T2Prep pulse
Coronary Angiography 266Tab All Views 93Tabletop movement 0
Pop-up message 204Text Box 107Three-slice SA-scan
DSMR 253Thumbnail View 69TID
IViewBOLD 172Tile All Views 93Tile view 93Time Domain Signal Shifting 322
Time to Peak 181Dynamic View, T1 Analysis 188
Time-Intensity DiagramIViewBOLD 172
Toggle or Select the Running Attribute 124Tricuspid valves 250Trigger delay 131Truncation artifact 394t-test map 169
UUnshaded Surface Rendering 113USB Hard Drives 376USB storage devices 375User account 23User Confirmation mode 67User Documentation 19, 68
VVelocity Standard Deviation 131Venetian blind artifact 395Ventricular function 251Vertebrae labelling 223View Exam 30, 63VLA (Vertical Long Axis) view 249VolumeView 113Voxel selection 313
WWall motion 251Wash-In Rate
Dynamic View, T1 Analysis 188Wash-Out Rate
Dynamic View, T1 Analysis 188Water-Fat dephasing 391Water-Fat Shift 390Water-Fat Shift (WFS) 86Windowing 53Windowing Options
MobiView 124Windows Start key 29Wriggle artifacts 405
ZZebra stripes artifact 394Zero-Fill and FT 326Zooming 53

Philips Healthcare is part of Royal Philips
www.philips.com/[email protected]
Manufacturer’s addressPhilips Medical Systems Nederland B.V.Veenpluis 4-65684 PC BestThe Netherlands
EU RepresentativePhilips Medical Systems Nederland B.V.Quality & Regulatory AffairsVeenpluis 4-65684 PC BestThe Netherlands
Copyright addressPhilips Medical Systems Nederland B.V.Veenpluis 4-65684 PC BestThe Netherlands
0344
© 2014 Koninklijke Philips N.V.All rights are reserved. Reproduction or transmission in whole or in part, in any form or by any means, electronic, mechanical or otherwise, is prohib-ited without the prior written consent of the copyright owner.
Printed in The Netherlands4598 006 43751/781 * 03/2014 *7 - en-US