instrulllents and methods an itnproved coherent radar ... · the radar uses pulse compression and...
TRANSCRIPT
J ournal qfGlaeiolog)~ rlol. +4, No. 148, 1998
Instrulllents and Methods
An itnproved coherent radar depth sounder
S. GOGINENI,l T. CHUAH/ C. ALLEN,l K. JEZEK,~ R. K. MOO R El
lRadar Systems and Remote Sensing LahoralolY, T he C'niversify cif Kansas, 2291 iruil1g Hill Road. Lawrence, it"allsas 66045 -2969. CS Ll. ~ Silieoll l !lireless, 2025 Careia Avenue, 1\ fountain Fiew, CaLifornia 940+3, US.A.
:'B),rd Polar Research Centel; Tlu Ohio State Ul1iversi~)I, 108 Seoll HaIL. 1090 Carmaek Road, Columbus, Ohio -13210 -1002, CS.A.
ABSTRACT. The U ni ve rsity of K a n sas developed a coherent radar de pth sounde r during the 1980s. This system was origin a ll y de\ eloped fo r g lac ial ice-thick ness measurements in the Anta rctic. During the field tcs ts in the Anta rctic and Greenl and , we found the system performa nce to be less than o ptimum. The field tes ts in Greenl a nd we re performed in 1993, as a pa rt o f the NASA Progra m for Arctic C l im ate Assessme lll (PARCA). \Ve redes igned a nd rebuilt thi s system to improve the perfo rmance.
The rada r uses pulse compression a nd coherent signa l processing to obta i n high se nsitivit y a nd fin e along-track resolution. It o pe rates at a centn frequency of 150 ~ r H z \Vith a radio frequency ba ndwidth of about l7 MHz, which gives a ra nge reso lutio n o f a bout 5 m in ice. \Ve ha\-c been o pera ting it from a NASA P-3 ai rc ra ft fo r coll ec ting ice-thickn ess data in conjuncti on with laser surface-e leva ti on measurem e nts ove r th e Greenl a nd ice sheet during the las t 4 years. \Ve ha\'e dem o nstra ted that thi s rada r ca n measure the thi ckness o f m ore than 3 km of cold ice and can obtain ice-thic kness infurma ti u n over out let glac iers a nd ice ma rg ins.
In this paper we prov ide a brief survey o f rada r sounding of glac ia l ice, fo llowed by a desc riptio n of the system a nd subsystcm des ig n and pcr fo rm a nce. \Ve a lso show sample res ults from the fi eld exp eriments over th e G reenland ice sheet a nd its ou tkt g lac iers.
1. INTRODUCTION
In 1991, NASA bega n a coordinated p rogra m of a irbo rn e and sp ace borne observations of the Greenla nd ice shcc t. The prima ry obj ecti\'e o f thi s prog ra m is to determine th e mass bala nce of the ice sheet a nd its impact on globa l sea b ·el (Kra bill and others, 1995 b). To assess th e mass ba lance, three prim a ry measurem ents a re required : surface topography, ice thickness a nd ice \·elocity. Acc ura te measurements of surface topography prov ide a n indicatio n of whether th e sec ti ons o f the ice shee t a re in mass equilibrium; repeated measurem ents yield a di rect measure of varia ti ons in icesheet volume (Krabill a nd others, 1995a). R egiona l measurements of ice thickness combined with m easurements o f surface ve loc it y can be used to estim ate thinning or thickening ra tes th rough applicati on of mass-continuit y argumen ts (Paterson, 1994).
Surface topography is determined to the 10 cm level using a n a irborne laser operated on the NASA P-3 aircrafl. Aircra ft navigati on is with a global p ositioning sys tem (GPS). Surface veloc ity is estimated by re peated GPS measuremen ts of stati ons fi xed o n the ice-shee t surface. Tee thickness a nd the internal str ucture of the ice shee t are measured using the ice-sounding rada r, a lso on the P-3. T he rada r a lso measures the intern a l structure of the ice sh eet a nd the physica l p roperti es of the g lacier bed. The la tter inform ati o n is used to hel p explain the d yna mic behavior of the ice sheet a nd , hence, in developing a hypothes is to ex pla in a ny detected cha nges in ice-sheet volume.
In thi s paper wc di sc uss the des ign a nd a pplicati on of a new a nd improved ice-sounding rada r, the improved
coherent A rctic radar de pth sO llnder (lCA RDS). The system was des igned to be no\\' n in an a ircraft o r operated from the ice-shee t surface. It has been show n to be cfTcctive in acquiring ice-thickn ess data for ice thickn esses in excess of 3 km [or co ld ice. Perhaps m ore importa nt, it has proven very effecti ve fo r acquiring ice- thi ckness a nd intern al-structu re data o n o utlet glac iers located around the ice-shcet ma rgin . Because ice wastage occurs thro ug h thc outlet glaciers a nd a ro und the ma l'g ins of the Greenl a nd ice sheet, data from thi s rada r prov ide new info rma tion about proccsses occ urring in the dy na mically ac tive ice-sheet peri me tcr.
2. BACKGROUND
R adio-echo so unding (RES ) has been used fo r the purpose o[ obtaining thickness measurem ents of glacia l a nd sheet ice since the ead y 19605. The o rig ins of this approach can be traced to 1933 a t Admiral Byrd's base, Litt le America, Antarctica, wh ere the first indicat io n th at snow a nd ice are transpa rent to high-frequency radio signa ls was obsen ed. An investigation by U.S. A rm y resea rchers, prompted by pilot reports o f the lIselessness o f rada r altime ters m'er ice, a nd suggesting the transpa re ncy of pola r ice a nd sno\V in the VHF a nd U HF bands, led \ Va ite and others to demonstrate in 1957 that a rada r a ltimeter (the SCR 718 operating a t 440 MHz ) co uld measure the thickness a nd other features of po la r glaciers (Wa ite a nd Schmidt, 1961; Robin , 1972). This observati on res ulted in onc of the m os t importa nt technical ad vances in glacio logy, na mely, the dewlopment a nd wide a pplicati on of RES sys tems.
659
J oumal (j/Glaciolag),
Fo llowing \\'a ite's dem onstration, Evans at Cambridge U nive rsit y's ScolL Pola r Resea rch Insti t ute (SPRI ) developed the first or se\'eral V HF systems specifically [or radioech o so unding in 1963. \Vithin the nex t few years seyera l o ther resea rch groups began de\Tloping and using RES systems, includ ing the US. Army Elec tronics Laboratory (USAEL ), the British Anta rctic Sun-ey, the Arctic and Anta rctic Scientific Research I ns titute in L eningrad, the G eop hys ica l and Pola r Resea rch Center a t the Unive rsity o f \\'iseons in, (he US. Army Cold Regions Research and Eng inee ring Laboratory, the Canadian D epartment of Energy, l\lines and R esources, the Technical University of D enmark (T U D ), Stanford Research Institute, and the Institut G eografii of the U S. S.R. Academy of Sciences (Evans, 1967; E\ 'ans and Smith, 1969; Gudmandsen, 1969; Web er a nd Andri eux, 1970; Robin, 1975a; Macheret a nd Zhura\'!c\', 1982). These systems, a ll short-pul se-type rad ar systems with operating frequencies 01' 30- 600 MHz, successfully sO Llndrd ice sheets, ice caps and glaciers (both ten'lpera te a nd pola r) in bo th Greenland and A ntarctica. Bo th surface-based and airborne measurements were conducted. Thickness est im ates from R ES system s agree with those fi'om se ism ic and g rav i ty-based esti m ates (Drewry, 1975). R eOections from intern a l layers have a lso been observed since the fi rs t R ES obseryations, and a va ri ety of sources for these internal rell ec tions ha\T been identified, ineluding layers ofliquid water (Bamber, 1987; D avis and others, 1990), laye ring il1\'oh-ing sma ll permittivity changes due to cha nges in ac idity (from la rge vo lca nic events) (Milla r, 1981), changes in the size or shape of air bubbles within th e ice (Ackl ry and Kdiher, 1979), and va r ia tions in ice-crys ta l orienta tion and densit y (H a rri son, 1973). L ayers produced b y th e small permittivity changes represent isoe rones and are useful in the interpretation of clima te inform ation (G udm andsen, 1975; J aeobel and H odge, 1995). In addition to measurements of ice thickness and layers, other features and characteri stics observed include regions of bottom melting a nd freez ing (Neal, 1979), ice-bottom sliding velocity (Doake, 1975), glacier velocity (Doake and others, 1976), sub-ice lakes formed by pressure melting (O swald, 1975), and bottom creyasses Oezek and oth ers, 1979). Information on oth er ice parameters, including sign a l abso rption (Neal, 1976), signa l fading p atterns (H arrison, 1971; Berry, 1975), p ropagati on veloc ity (R obin, 1975 b) and birefringence (Bentley, 1975; H arg reaves, 1977; \ VoodrufT and Doake, 1979), ha\'C been obta ined from RES data.
In the nex t generati on of RES systems we see more speciali zation. For exampl e, to reduce the reOections from n ea rby walls in sounding vall ey glaciers, the system frequency is increased to improve system directivity. A 620 MHz system succeeded in sounding Rusty Glacier in Yukon Terr itory, Canada, where a 35 NIH z system and conyentional seismic systems had previously been unsuccessful due to echo obsc ura tion by the transm itted radio and seismic pulses and due to the proximity of the vall ey wall s (C la rke and Goodman, 1975). Also, severa l low-frequency RES systems were developed specifically fo r sounding temp erate g lac iers where absorp tion losses a rc significant due to higher ice temperatures and the presen ce of liquid water. Systems with frequencies of 1- 32 MHz have been successfull y used by numerous resea rchers to sound tempera te glaciers (Strangway a nd others, 1974; \ Va tts and England, 1976; Bj ornsson and oth ers, 1977; Sverrisson and others, 1980; Watts and Wr ight, 1981).
660
Techn iques have a lso been de\'eloped for determining addi tiona l inform ati on on both the geography and roughness of subglacia l terrain. Significant cha nges in the polarizati on of th e returned echoes from land ice a nd an ice shelf indicate tha t tida l strain on crystal orienta tion a t the hinge zone resul ts in a large cha nge in birefrin gence of th e ice, sugges ting tha t polarization could be used to di stingui sh fl oating fro m grounded ice (\ Voodruff and D oake, 1979). 1\
method fo r continuously m onitoring the returned echo power fi'om a subglacia l ice/roc k or ice/wate r interface can detect ch a nges in the reOection coeffi cient a nd the absorption p rop erties orthe ice, as wel l as identify ing the changing nature of the basal refl ec ti on properties a long a fl owline (Neal, 1976). As part of a phys ics experiment investigating a theoretical fifth force a ffecting Newton's inverse square law for gravita tion, an extensive seri es of RES m easurements were m ade a round the D ye-3 complex in southern Greenland. Sounding data were coll ected along 124 radi al lines, each a bo ut 5 km in leng th . This produced a m ap of bedrock topography with an uncerta inty of < 5 m over most of the survey a rea (Fisher and others, 1989). A precise grid pattcrn was fl own over the summ it region of Greenland with the T U D RES system to obtain both ice-surface a nd ice-bottom topography to acc uracies o f ± 6 m and ± 50- 125 m, depending on the bottom roughness (Hodge a nd others, 1990).
As enabling technologies emerged, RES systems became more ca pa bl e. Digital da ta acqui sition, sig na l process ing and record ing significantly improved system capabilities, not the least of which is d ynamic range (G ood man, 1975; Sivaprasad , 1978; Wright a nd others, 1989). \ Valford and others developed a coherent RES system p e rmitting the measurem ent of both the amplitude and phase of the received signa l (Walford a nd others, 1977; Walford and H arper, 1981). Synthetic ap e rture rada r (SAR ) techniques were applied to RES data by researchers from the British Antarctic Survey to produce two-dimensiona l m aps of echo streng th sh owing the grounding line of a glacier in the Antarctic Peninsul a (Musil and D oake, 1987). Th e coherent Antarctic r adar depth sounder (CARDS ), the first RES system designed completely with so lid-state, computeri zed components, which is coherent a nd employs pulse compression to reduce p eak transmit power requirements, was fi eld-tested in Anta rctica by resea rche rs at the University of Kansas (R aju and others, 1990).
In the 1990s, a new genera ti on of sp ecia li zed RES systems has emerged to address specific glaeiological questions. A miniatu re impulse RES system capable of op erating from I to 200 MHz was develop ed and field-tested by Canadian research ers for sounding g laciers and ice caps (Narod and Cla rke, 1994). Researchers from the University of MLLl1ster develop ed a nd fielded two ground-based 35 MHz RES systems: the first was a single-pulse system intended to measure the refl ec tions from interna l layering with high resolution; the second uses a burst tran smitter des igned to penetrate the sheet ice and obse rve th e underlying bedrock (Hempel and Thyssen, 1993). Nor wegia n researchers applied SAR techniques to image the internal structure of the subpolar glacier Slakbreen in Spilsb ergen, Svalbard, Norway, using range-gated synthetic pul se (stepped frequency modul ation) system s operating from 5 to 20 MHz a nd from 320 to 370 MHz to investigate various geophysical phenomena (H amra n a nd Aarholt, ]993). Resea rchers from the University of Al as ka at Fairbanks used a 1.7 MHz impulse-type RES sys tem to measure a cross-section of Taku Glacier,
Alaska, a nd estim a te the mass-ba la nce flu x (Nola n a nd others, 1995).
Fina ll y, the \'a lue of R ES data dep ends on acc ura te knowledge of locatio n. Therefo re naviga ti on and positionmeasurement techniques a re of g reat sig nificance to RES system s. When R ES systcms were first fi eld- tes ted, navigati on reli ed on observation by sys tem o perators, which is sig nifi cantl y hampered in regions witho ut discerni ble la ndma rks. In 1967, nav igati o n records, includ ing a ga h-a nom e ter showing a ircraft hcading, a ir tempcra ture, static prcssure a nd a irspeed, we re r ecorded a long with a irborn e RES d a ta. By 1971 , a n inerti a l navigation sys tem , thc Lilton 51C, was used to a nnolale the RES data with pos ition informa ti o n (Evans a nd olhers, 1972; Robin, 1975a ). Position-measuremenl sys tems employing microwave sig na ls a nd lra nspo nders a t known geographic points have been used in gro undbased RES experiments within limited a reas with a n acc uracy of ± 10 m (Goodma n, 1975). By the la te 1970s, LORA N a nd satellite na\'iga ti o n were avail able, provid ing less acc ura te yet a fforda ble posit ion info rma tion on a g loba l bas is suitable for R ES applica lions (Sverrisson and olhers, 1980). A Doppler navigator linked throug h aTaclica l Air Na vigatio n Sysll:m naviga lion computer was used in 1983 to provide a continuous read-out of latitude a nd longitude wilh sub-kil ometer acc uracy (Drewry a nd Li es tol , 1985; Gorma n a nd Cooper, 1987). C ur rentl y, difTerenli a l G PS da ta a re co llected with RES measurements, reducing positional unce rta inties to ± 2- 5 m (Nola n and others, 199.,)).
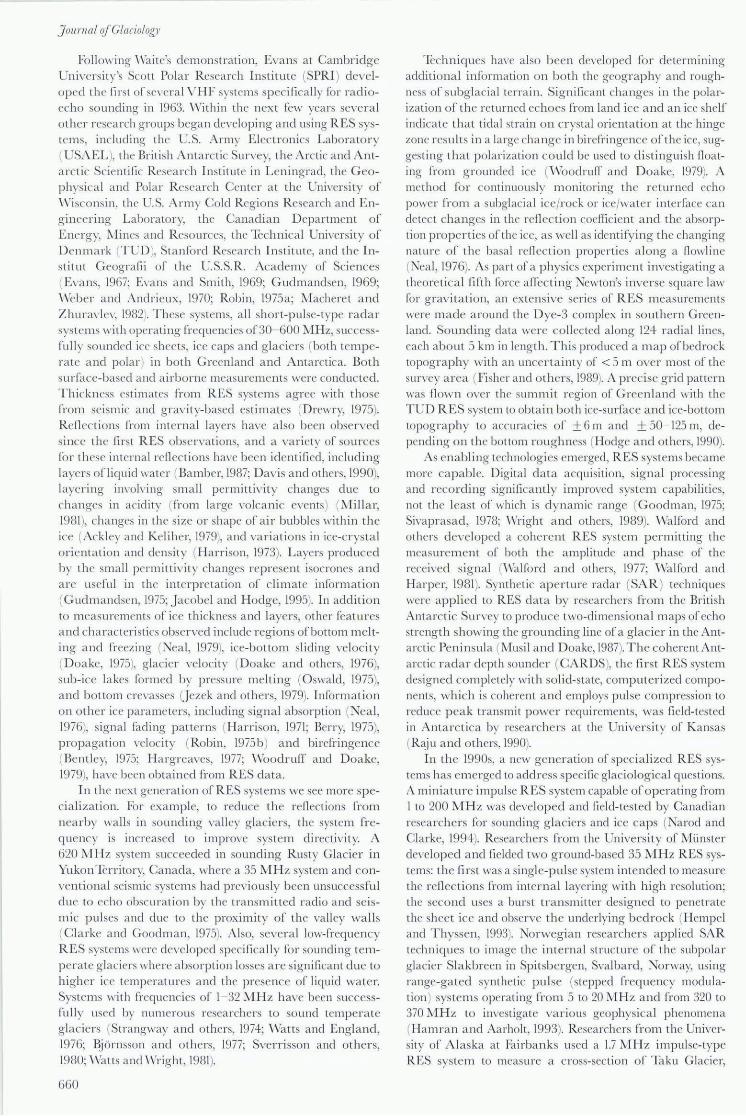
Tabl e I shows a n upda ted summa r y o f the charac teri sli cs of th e va ri ous time-do m a in radar sets; it was fi rst tabul a ted by Goodm an (1975).
3. SYSTEM DESIGN AND EVALUATION
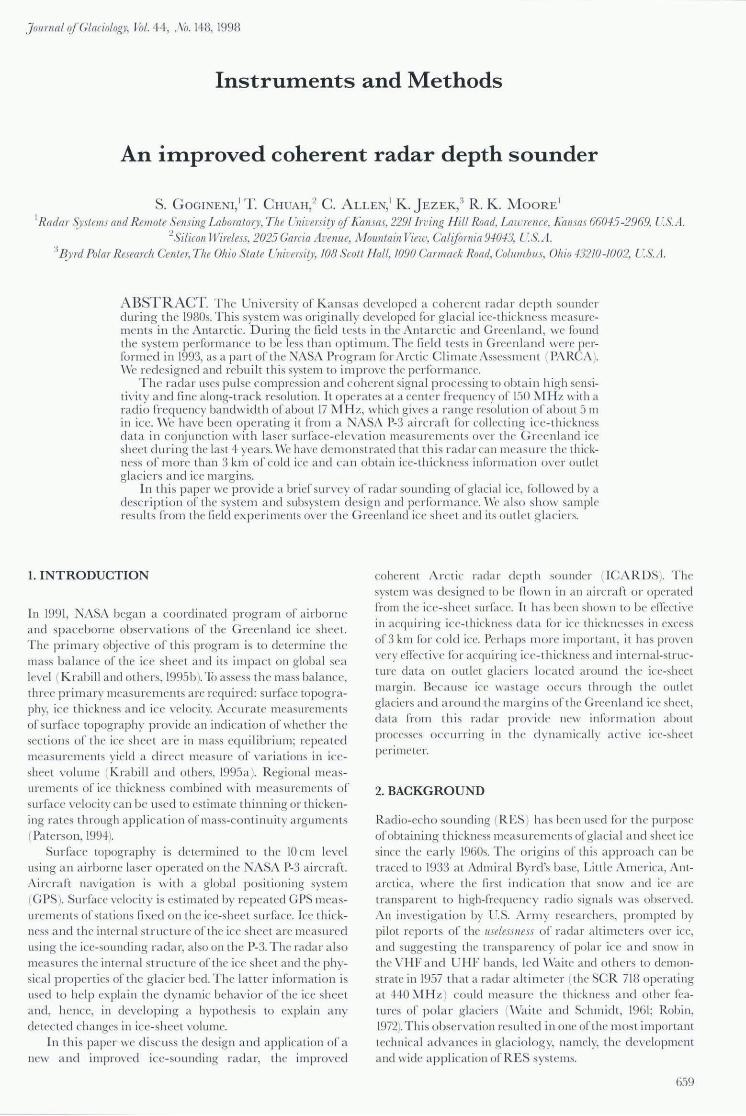
The system desc ribed here is a modifi ed a nd im proved \'C' rsion of t he radar system repon ed by R aj u a nd others (1990). Fig ure I shows the bas ic elements of th e rad a r system. It o pera tes a t a center CreCJu ency of 150 MHz w ith peak lransmit power of abo ut 200 \ \ '. Th e tra nsmitter generates a 1.6 ps lo ng pulse using a surface aco usti c I\'ave (SAW ) expander. T hi s pulse is co upled to the lra nsmit a ntenna consisting o f a four-element dipolc a rray. An identical receive a ntenna co llects the renec ted sig na l. This signa l is a mplified using a lo \.\"-
31.!l Mlr. r - - - - - - - - - - , CIo<k
GPS
Cotnputer System:
Dlla Acquisition
&
Display
PRF LO
r--------1 1
RcYr'. I mook ' RCVI'.
~~~~w~~ , ~
CIri. Citroil src
src , w~~ · - -------CIri.
R.uiYedPult.
Fig. 1. BLock diagram if ICtlRDS. Blocks shaded al a darker gray level were redesigned and rebuilt. Th e light£y shaded block was modifiedJor imjJ 1"Oved jJeljormall ce.
Cogilleni and olhers: instmll1eJ1tJ and lIlethodJ
noise rece iver a nd compressed using a SA\\' filt er to a pul se about 60 ns wide. A cohere nl d e teclor ge nera les in-phase (I ) and CJuadra ture (Q) sig na ls fro m the compressed signal. Two identi cal AID converters d igiti ze the I a lld Q sig nals. These digiti zed sig nals a re cohe rently summed , de te("[ed a nd stored o n a di sk for furth e r processing. Impo rtant system parameters a re provided in Tablc I (CARDS, u. S. A.).
3.1. Transmitter
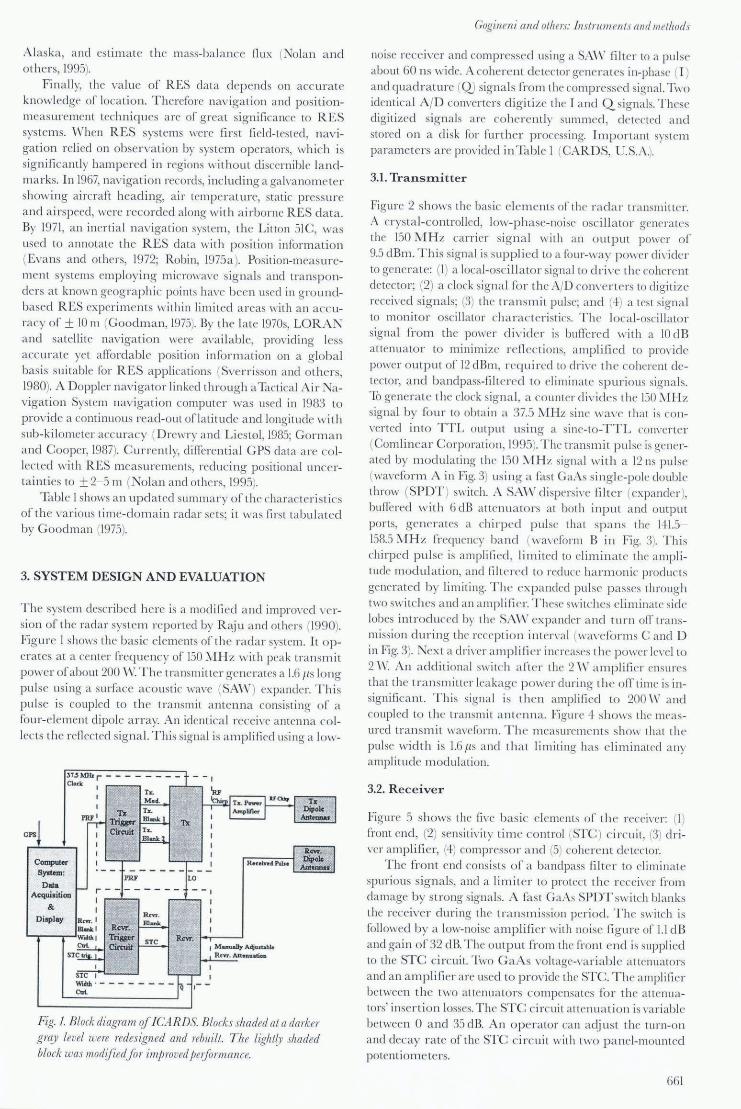
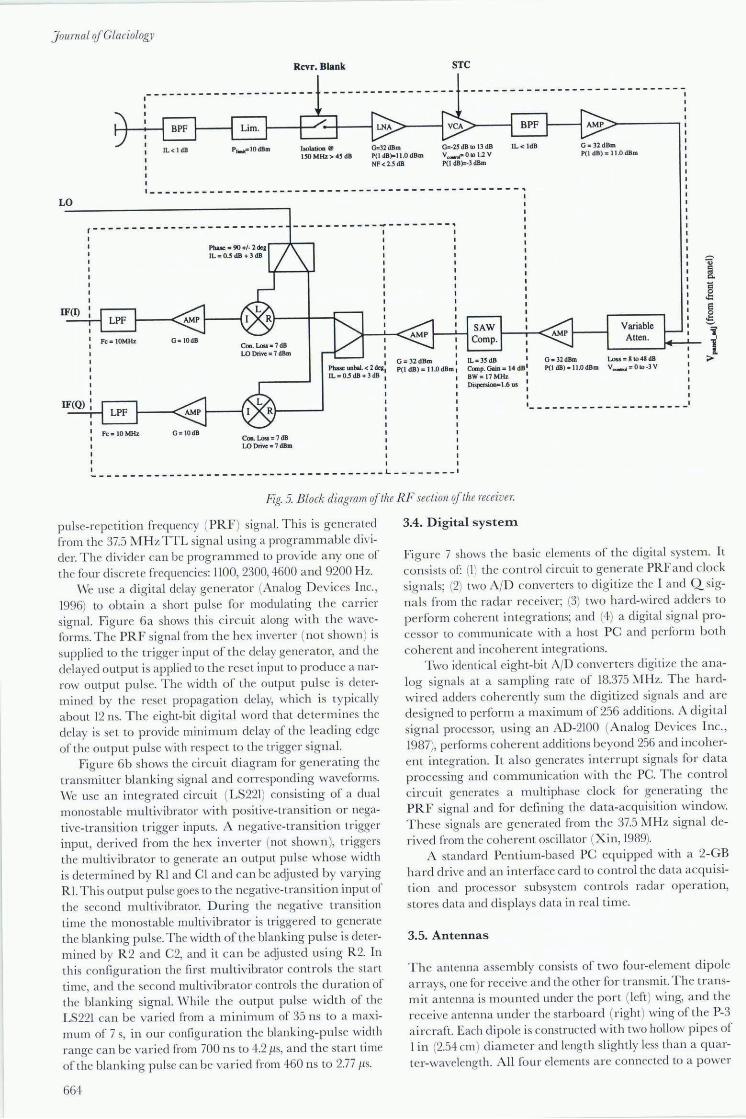
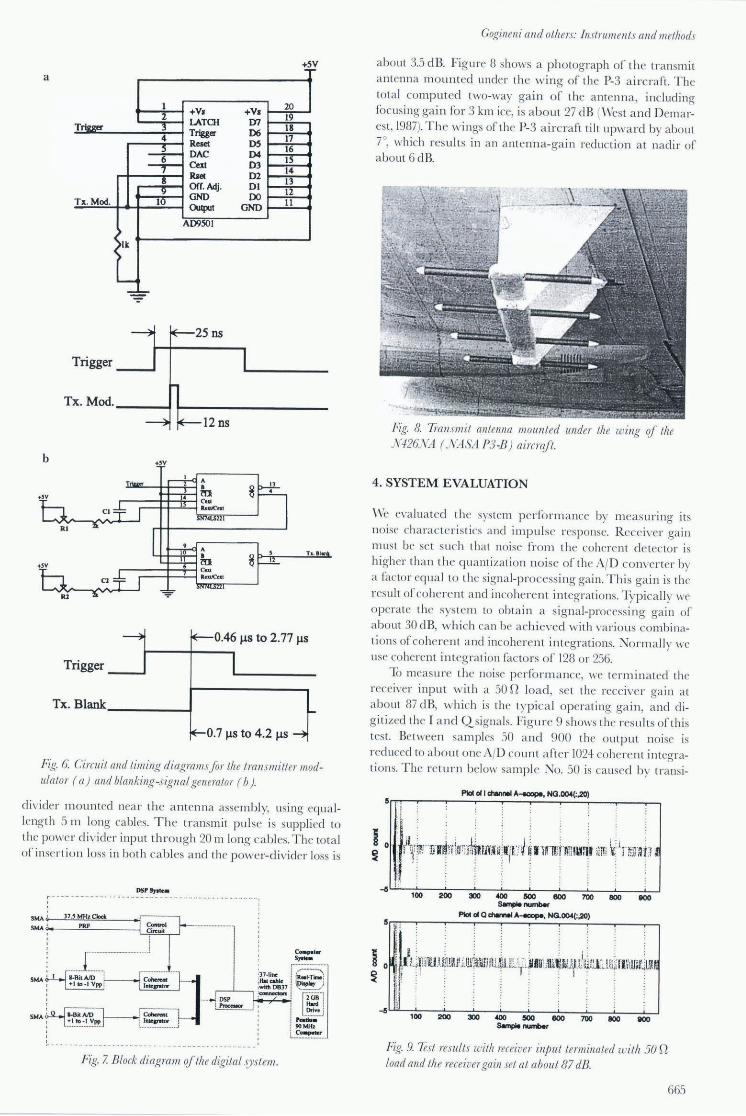
Figure 2 shows the basie ele m ents of the r a d a r lransmitter. A crysta l-controlled, low-phase-noise osc illa tor genera les the 1501\IHz ca rrier sig na l with an o ut pu t power of 9.5 dBm . This signal is suppl iedto a four-\\'ay power d i\ 'idcr to ge nera te: (1) a local-oscill a tor signal to dri\ 'C' th e coherent detecto r; (2) a clock sig na l for the AID cO Il\ 'e rters to digiti ze recei\'ed sig na ls; (3) the t ra nsmi t pulse; a nd (+) a tes t signa l to monito r oscill ator cha rac teri sti cs. The local-oscill ato r signal fro m the pOll'er divide r is buffered with a 10 dB attenua lo r to mi nimize re fl ec ti ons, amplifi ed to prO\'ide power o utp ut of 12 dBm, reCJuired to dri\ 'C th e coherent detecto r, a nd ba nd pass-fi It e red to cl i mina te s pu ri ous signa ls. To ge nera le the e10ek sig na l, a ("O llll ler di\·ides th e 150 "'1Hz signal by fo ur to obta in a 37.5 ~[Hz sine Wa\'C th at is con\'erred into TTL outp ut us ing a sine-to-TTL CO l1\Trter (Comli11ea r Corporatio n, 1995). The transm i t p ulse is ge nerated by m odula ting the ISO J\IHz signal with a l2 11S pulse (wm'dorm A in Fi g. 3) using a fas t GaAs sing le-pole double lhrow (SPDT) switch. A SAW di spersi\'C filt e r (expander ), buffered w ith 6 dB a ttenu a to rs at both in p ut a nd ou tp ut ports, generates a chirped pulse tha t sp a ns the 1+1.5 158.5 MHz frequency bancl (waw'form B in Fi g. 3). Thi s chirped pul se is amplifi ed , limited to elimina te the a mplitude modula ti on, a nd filtered to red uce ha rm onic products genera tecl by limiting. The ex pa nded pul se p asses throug h [WO swilches a nd a n amplifi e r. These switches eliminate side lobes introduced by the SA\\ ' cx pandrr a nd turn oITt ransmission during the receplio n inten 'al (\\'a\'C fo rlll s C and D in Fi g. 3). Nex l a dri \Tr a mplifi e r increases the p ower In 'CI to 2 \\'. An a dditi onal switch a ft e r the 2 \\' a mplifi e r ensures that the t ransm iller lea kage powcr duri ng the oIT ti me is insignifica nt. This signa l is lhen amplifi ed to 200 \\' a nd coupl ed to the transmit a nlenna . Figure + shows the mcasuredtra nsmit wm·erorm. Th e meas urements shol\' th at the pulse widlh is 1.6 liS a nd tha t limiting has e liminated a ny amplitude m odul ati on.
3.2. Receiver
Figure 5 shows the fi ve bas ic elemenls of th e receiH'r: (I) front cnd , (2) sensiti\·ity time control (ST C ) c ircuit. (3) d river amplifie r, (+) compresso r a nd (5) coherent de tector.
The fro nt end consists o f a ba nd pass filt e r to elimin ate spurious sig na ls, and a limite r to prOlec t the rece i\'cr from damage by strong signa ls. A fas t Ga As SPDT switch blanks the receiver during the tra nsmission peri od. T he switch is foll owed by a low-noise a mplifi e r with noise fi g ure of 1.1 dB and gain o f 32 dB.The output from th t' fro nt e nd is suppli ed to the STC c ircuit. Two GaA s \,o llage-\ 'a ri a bl e a Ltenuators and a n a mplifi er a rc used to prO\'idc the STG The amplifi e r betwee n the two attenua LO rs compensa tes fo r the attenualors' inse rti o n losses. The ST C circuit attenua ti o n is \'ar iabl e between 0 a nd 35 dB. An o pe ra tor ca n adj ust the turn- on a nd decay ra le of the STC c i rc uit with two pa nel-mounted potentio l11e ters.
661
JOllrnal qfGlaciologl'
Table t. AlIlI/Jdaled slImmm)' of variolls lime-domain radars used in mdioglaciofog)l
!iJ'slem h eq. Peak j}ower Bandwidlh P"I w! w idlh Rauge S),slem jJe!/3 ,1111. ga iu BeGmwirilh
Austra li a 1
DE:":\ ' l Canada )
L'ni"crsityof BC Canada
TUD (Denmark )
TUD (Denma rk )
TCD Denmark I
SPR I -"l a rk I England )
SPR l :-I a rk I1 (England )
SPRI :-1ark III (England )
"1Hz
lOO
6'20.
840.
3D
(jO
300
35
35/50.
150.
SPRll\Ia rk 1\ ' 3.'i/6D I Engla nd )
1\lark I (Icdand
:-I ark 11 (In' land )
Norway
SCR-718 U.S. l\ .1
CSAEL (U.SA)
ADCOLE C.S.A .
,\ :\/IR E ( UXA.
2 5
2 10
20.5
110
30
600
100
:-IHz
5000 10
30.0.0 10. 30.
+100. 40
160.0. I/H
ID DOD'l6DD/ 1+,'+/1 1000
1I
500- 800
300 30
3DOjl500 1+/15
800.0 3
1250/3000 3
+0 H
3
20.0 +00 3
ID 150.
.1000 10
CSGS (C.S.A.)
H5 +00 C/OOD 10
CA RDS . C.S.A .)
Uni"crsit y of Alas ka (U.S.A
11\ /+ (C.S.S.R.)
R\ ·-I D. -1 7 IL.S.S.R.)
RLS- 62D (U.S.S. R.
150
1.7
213
l ~O
620
20.0.
:;()OOO-800.00
820
17
6
1.1
ns
300
70./500.
50.
60./10.0.0
10.0.0./500./ 25Djl25/6D
60.
300.
2fO
lOO
250./350 1000
80.0.
10.0/200
'lOo.
500
50.0.
30.0.
100.0 66
160.0
250.0
50.0.
100 1000
I Ra nge accu racy refers tn resolution in ice n = 1.78).
armra(),l
m dB dB
175 11
2.5 7 15+ 159 15
+ 121 31
5/60. 168/180 28
5/'25 205/218
127
ID 160. ID
'2.5 150. 13
5 160. 8j18
20. 150 ID
8 1.10. ID
5 120. 11
20 128 -I·
20. 150. 25
0.0.15 90. I -~
173 11
50
.'i 190. 21
60. 180 I -~
130 2
1+6 185 19.5
2 SySU.' 1l1 perfornlanct' is total difference betwecn lranSllliuC'ci power and rcc c i\-er scnsiti\·ity. ~ Systenl perfornlcul('(' includes an lf'nna ~a iI1.
662
5.'2
18 x H
20.
2'2 x liD
20.
12/90.
16
50
3D
3D
32
90.
18
3D
10.0.
IS
/) )'I)(l!l1 . Source ,~allge I
dB
90.
30
70.
70.
l\1organ and Budd (1975
Goodman 1970..1975.; Goodman and others (1975)
;'\Iarod and C larkc (1980)
Gudmandsen (1970, 1975)
Gudmandscn (1977\ Hodgc and others (1990)
Drewr)' and 1\1eldrum 19781
Walford (196+)
E,'ans and Smith (19691: J rzck and ol hers (1979); .Jczck (19851
hans 1970.
35/60 E"ans and Smit h (19()9):
10
10
Doake and ot hers (19761: Gorman and Coopn 1987
S\'Crrisson a nd o thers (1980)
Bj6rnsson and others \ 19771; S\'crrisson and others (1980.)
Personal C0l11111Unication from G. Om'em, 1970, in Goodman 1975 ,
Sinshril11cr (19+7); Weber ancl Andricux (1970)
Rinker andl\1ock (1967
hans 1967 ; Rinker unpublished
Watts and others (1975); Watts ancl \\'r ight (1981)
R,~u ancl Ollwrs (1990.
Nolan and oth(TS (1995)
Fedoro\' (1967)
Do\\'deswclJ a nd o thers 198+: Kotlyak",' a nd 1\1acheret (1987
Dowdes\\'c lJ and ot hers 1198+): KOl lya ko\' and ~lachcr('t 1987)
Gogilleni ({lid a/hers: llls/mlllfll/s and me/hods
SMA500hm
, ... r------------------------------------------.
I so MHz Crystal Oscillator Pout = 9.S dBm @ +IS V
21-----' I IOdS AIUl. I VSWR< 1.3
0- 11.!Ii dB 11.5dBm romp.
Fo. ISO MHz 4-8i( COUtIt.er 3dB8W-7.5MHz Converter ,
31---" : '- - - - - - - - - - - - - - - - - - - - - - - - - - - - - - - - - - - - - - - - - - - l
4
lL =O.S dB G-8.0dD G-8.0dD
Computer
LO (Rcvr.)
6dBAttn . VSWR< 1.2 18.0 dBm romp. 18.0 dBm comp. Fo - 150 MHz
3dB BW.7.jMHz Tx. Mod. (12 AS Impulse)
r--------
0.12.5 dD G-8.0d8 Fo-lSOMHz IlOlation > ""OdB IL-3SdB 6dBAttn. 6dB AIIn. VSWR< 1.2 11.5 dBm romp. 18.0 dBm comp. 3dB 8W _1.S MHz 18.0 dBm canp.
6 dB Aan. VSWR< 1.2 I , SW - 11 MHz 1 VSWR < 1.2
Tx. Blank. 1
, , Dispenioo '"' 1.6 us I
IsolAlion :> 45.0 dB G. 1.0 dB G. B.O dB 3 dB Aun. Iwiatioo>45.0dB FC)II:lSOMHz 3dBAttn . Limit - -, dBm G- 12,' dB G .. 32.0 dB 0- 32.0 dB 18.0dBm comp. 18.0dBm comp. IB.O dBm comp. VSWR < 1.2 18.0 dBm romp. 3 dB BW-22.S MHL VSWR < 1.2 17.5 dBm camp. 11.0dBm camp. 11.0 dBm camp.
-----------------------------------r------r-------------~Tx. Blank. 1
, ,
3dBAIlD. VSWR< 1.2
G '"' 35.0 dB Isolation - 50.0 dB lsolatioo - 30.0 dB 33 dBm comp. 33.0 dBm oomp. 33.0 dBm camp.
G _ 20.0 dB
53 dBm romp.
~ ____________________________________ ~ ____________ J
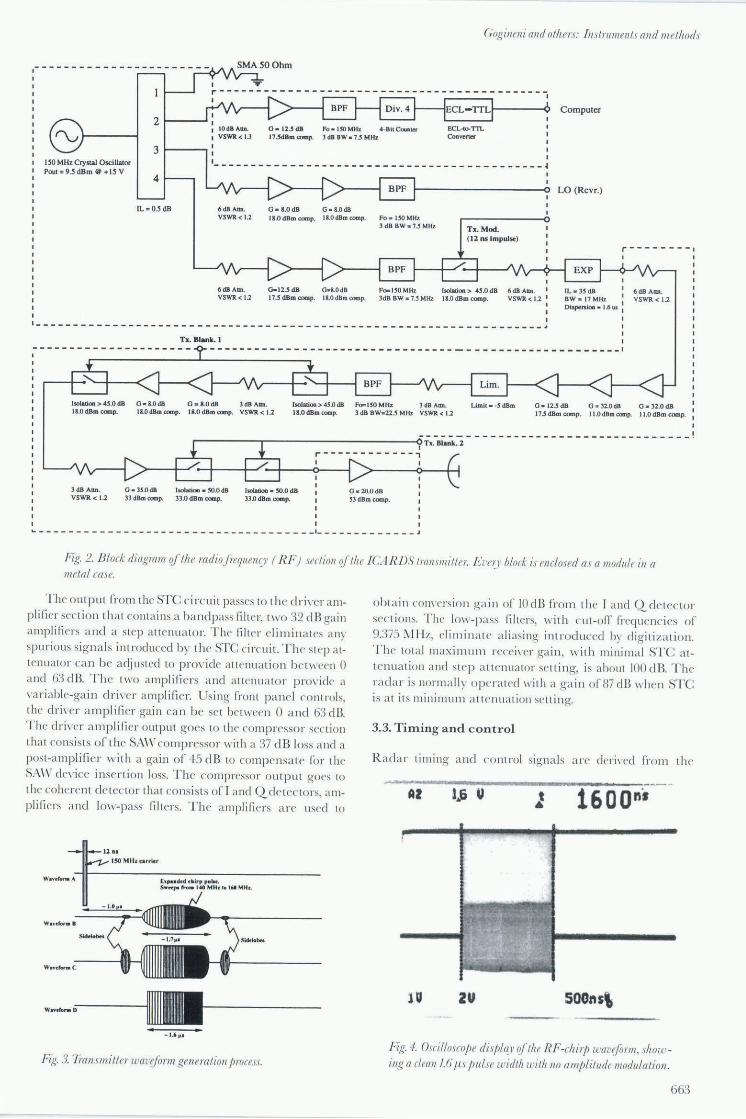
F(f!,. 2. Block diagram qflhe radioji"f(j llfllC)' ( RF) see/ioll q/ /h e ICIRD,)' /ranslIlilln Ez'elJ block iJ fIIc/osed as a modllll' ill a lIIe/al case.
Th e o utput from the STC eirc uit passes to th c dri\Tr amplifier sec tion tha t conta ins a bandpass filter, t\\'o 12 dB ga in a mplifi ers a nd a step anenuator. The filter eliminates any spurious sig na ls introduced by thc STC ci rcuil. The step a ttenuator ca n be adjusted to prO\·ide att enuatio n be twee n 0 a nd 61 dB. The t\\'o amplifi e rs a nd all enuator prm·icle a \·ari ablc-gain dri\Tr amplifi e r. U sing front panel control s, th e dri\"CT a mplifier gain ca n be se t between 0 a nd 63 c1B. The c1rin' r amplifier output goes to th e compressor sec ti on that consists o f the SAW compressor with a 37 dB loss a nd a post-a mplifi e r w ith a gain of ·1-5 c1B to compensate fo r th e SAW deyice insert ion loss. The compressor o utput goes to th e coherent detector thal cons ists on and Q detec tors, amplifiers a nd low-pass filters. The am plifi ers a rc used to
tlp .. dtd t~irp polar. SWetp! fro", I .. Mlb '0161 ,,"niL
W."dor ••
Siddoba
Fig. 3. Tiwlsmiller 11'{ll'efonn genemlion jll'OceJs.
obtain comTrsio n ga in of IOdB from the J and Qdetec tor sec lio ns. The I()\\·-pass filt ers, with c ut-off frequenci es of 9.37S l\JHz, elimina te a li as ing introd ucecl by di g iti za ti on. The tOlal ma ximulll rccci\Tr ga in , Wilh minimal STC at le nuat ion a nd ste p a ttelluator se tling, is about 100 dB. The n1da r is norma ll y operatcd with a ga in 0("87 dB when STC is a t it s minimum a tte nuat ion se lling.
3.3. TiIlling and control
Rad a r timing and cOl1trol signal s are c\eri\TcI from the
1.6 U
2U SOOns\
Fig. -I. Osrillo.I(OjJe diJjJh!)' of/he RF-chirjJ l('{ll'iform, show ing a deall l.G Jl.l jill/se width wilh no all7jJ/illlde modllla/ioN.
663
J ournal ofGLacioLogy
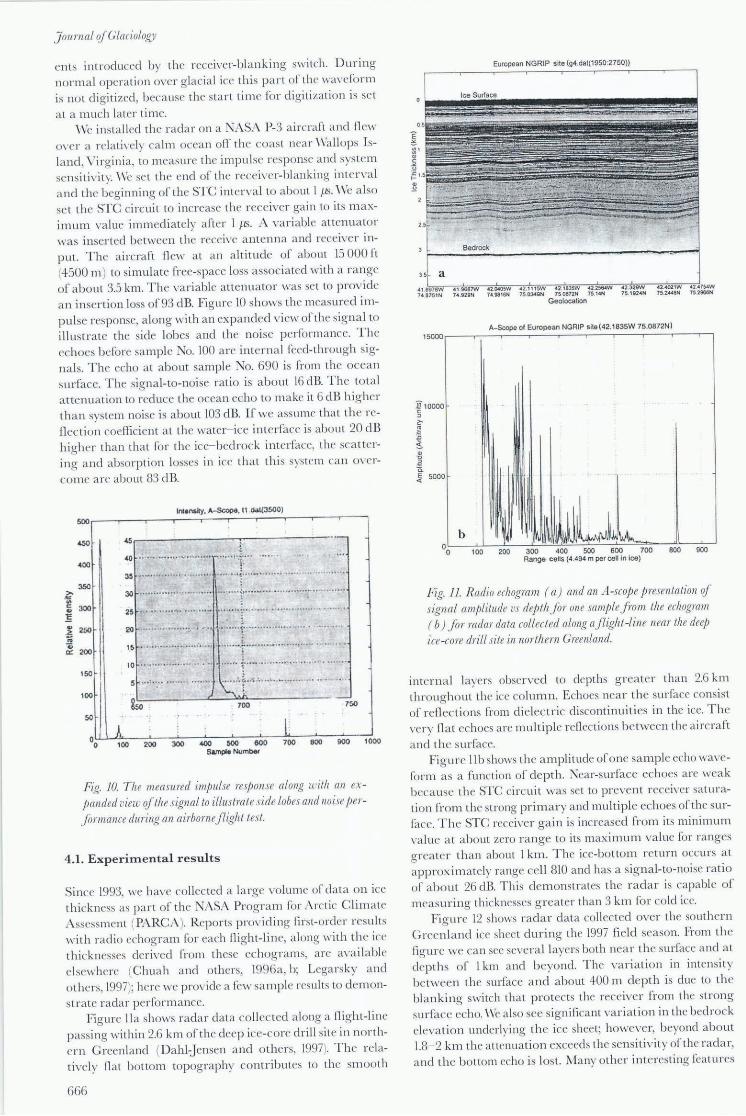
Rcvr.Blsnk STC
IL< I dB IlOIation@ G=32dBm HO MHz > 4!j:dB p( ldB)=II.O dBm V_OIDI.2V
NF < 2.5 dB P(I dB):·3 dBm
LO
,-------------------------
Fc~ lOMHz G= 10 dB Con. Loss = 7 dB 1..0 Drive = 1 dBm
Pba.se unbal. < 2 de! IL=0.5dB+3dB
G=32dBm P(I dB) = II.OdBm I
I -- ______ 1
IL=35 dB Comp. Gain = 14 dB BW = 17 M/Iz I Dispenion=1.6us I
G=31d8m Loss=81048dB P(IdB).ILOdBm V_=OID·3V
1- ____________________ I
Fig. 5. BLock diagram of/he RF section of the receiver.
pulse-repetition frequency (PRF) signa l. This is generated from the 37.51VfHz TTL signa l using a programma ble di\·ider. The divider can be programmed to providc any one of the four discrete frequencies: 1100,2300,4600 a nd 9200 H z.
'Ve use a d igital del ay gener ator (Analog D evices Inc., 1996) to obta in a short pul se fo r modulating the car rier signaL Figure 6a shows thi s ci rcuit along with the waveforms. The PRF signal from the hex inverter (no t shown) is suppli ed to the trigger input of the delay genera tor, a nd the delayed output is applied to the rcsc t input to produce a narrow output pulse. The width of the output pul se is determined by the rese t propagatio n del ay, which is typicall y abo ut 12 ns. Th e eight-bit digita l word that de term ines the delay is se t to prO\·ide minimum delay of the leading edge of the output pulse with respect to the trigge r signa L
Figure 6b shows the circui t di agram for genera ting the transmiller bl a nking signa l and corresponding waveform s. \Ve use an integrated circuit (LS221) consisting of a dual m onostabl e multivibrator with positive-transition o r negati\·e-transition trigger inputs. A negati ve-transition trigge r input, derived from the hex inve rter (not shown), triggers the multivibra to r to generate a n output pulse whose width is determined by RI and C l and can be adjusted by varying RI. This output pulse goes to the negative-transition input of the second muitivibrator. During the negati\·e transition time the monostable multivibrato r is triggered to generate the blanking pu lse. The wid th of the blanking pulse is determined by R 2 a nd C2, and it can be adjusted using R 2. In this configura tio n the first multi\·ibrator controls the sta rt time, and the second multi vibra tor controls the duration of the blanking signaL While the output pulse width of the LS221 can be vari ed from a minimum of 35 ns to a max imum of 7 s, in our configuratio n the blanking-pu lse width range can be va ri ed from 700 ns to 4.2 {IS, and the sta rt time of the bl anking pulse can be varied from 460 ns to 2.77 {IS.
664
3.4. Digital system
Fig ure 7 shows the basic elements of the digita l system. It consists of: (I) the cont rol circuit to generate PRF and clock sign a ls; (2) two AjD converters to dig iti ze the I and Q signa ls from the rada r receiver; (3) two ha rd-wired adders to perform coherent integrations; and (4) a digital signa l processor to communicate with a host PC a nd perform both coherent and inco her ent in tegrations.
Two identi ca l eig ht-bit A jD converters digitize the analog signals at a sampling rate of 18.375 MHz. The h a rdwired adders coherently sum the digitized signals a nd a re des igned to perform a m ax imum of 256 addi tions. A digita l sig na l processor, using an AD-2100 (Analog Devices Inc. , 1987), performs coher ent addi tions beyond 256 and incoherent integration. It a lso generates interrupt signals for da ta processing and communication with the PG The control circuit generates a mu ltiphase cloek for generating the PRF signal and fo r d efining the da ta-acquisition window. These signals are generated from the 37.5 MHz signa l derived from the coherent oscill ator (Xin, 1989).
A standa rd Pentium-based PC equipped with a 2-GB ha rd drive and a n interface cardlO control the data acqui sition a nd processo r subsystem controls radar operati on, sto res data and d isp lays data in real time.
3.5. Antennas
The a ntenna assembly consists of two four-element dipole arr ays, one for receive a nd the other for transmit. The transm it a t1lenna is mounted under the por t (left ) wing, a nd the receive antenna under the sta rboard (right) wing of the P-3 ai rcra ft. Each dipole is constructed with two hollow pipes of I in (2.54cm) di am ete r and length slightly less than a quarter-wavelength. A ll fo ur elements a re connected to a power
+5V
a
1 +V. +V. 20
2 19 Trigger 3
LATCH r:n 18 4
Trigger D6 17
--t-Reset OS 16 DAC D4 15 -r- Cext 03 14 )be( D2
8 Off. Adj . 01
13 9 12
Tx. Mod. 10 GND 00 11 ~ GND
AD9501
~Ik ~ '--
- "-
Trigger
Tx. Mod. ___ -I 1-________ _
b
TLB
Trigger
Tx. Blank ____ --!
0.7 IlS to 4.2 IlS
Fig. 6. Circuit and till7ing diagralllsJor the translI1iller l17odulator ( a) and blanking-signal gfllerator ( b).
di\'ider mounted nea r th e a ntenna assembly, using equ a l
leng th 5 m long cables. Th e transmit pu lse is suppli ed to the power divider input thro ugh 20 m long cables. The to ta l
of insertion loss in both cables and the power-d ivider loss i '
DS'~.
=L '''~= _ : i ....... ~.;.'. "' .... u.'.·' .. '.I .... r- mm'l- : ,~ SMA ~_v~~;~m ! }~I::.. I (R!""!r"';l
1 +1 &0-1 Vpp ! witt\08J7 1pbpI )
, i OSP i ~! ' [""i"GR" l
SU • • :~---! c..o.n... i! _...... : ! ;:'~ j m", ~ .. :.~.~ .. ~ ~ .. ~.I!.J i Jnrqmor ! ' : , ....
I ...... -.... ...... ..... :.hh ................. J ~~~.~m
. --- ..
Fig. 7 Block diagram rifthe digital Sjlstem.
Gogineni and oLhers: fnstl'umenLs and meLhods
about 3.5 dB. Fig ure 8 shows a pho tograph of the tra nsmit
a ntenna m o unted under the w ing of the P-3 aircraft. The
tota l computed two-way ga in of the antenna, inc luding fo cusing ga in for 3 km ice, is a b o ut 27 dB (\ Vest a nd D emar
est, 1987). The wings of the P-3 a irc ra ft tilt upward by abo ut r, \\'hich res ults in an antenn a-gain reducti on a t nadir of
about 6 dB.
Fig. 8. Ti'ClI1smit antenna mounted under the wing if the .\ 426. YA (. \ /lSA P3-B ) aircraft.
4. SYSTEM EVALUATION
\ Ve eva lua ted t he system p e rform a nce by ll1easuri ng its
no isc cha rac teristics and impulse response. R ece i\'er gain must be sc t such th at noise fro m th e cohercnt detector is
hi gher than the quantizat ion no ise or th c i\fD convertcr by
a fac tor equa l to the signa l-process i ng ga in . Thi s ga in is the res ult oCco he re nt and incoheren t int egrati ons. Typicall y we
o pera tc the sys tem to obtain a sig na l-processing ga in of
about 30 dB, wh ich ca n be achieved with \'a ri o us combinations of co he rent a nd inco here nt integrati ons. Norma ll y wc
use coherent integrati on factors o f 128 or 256.
To measure the noisc performance, we tcrminated thc
rece ivcr input w ith a 50 n load, se t th e receiver gain a t about 87 dB, which is th e typical operating ga in, and di
g iti zed the I a nd Q signa ls. Fig ure 9 shows the res ults o l'thi s
tes t. Betwee n sa mpl es 50 a nd 900 th c output noise is
red uced to a bo ut o ne AID counl after 1024 coherent integra
ti ons. The return bclo\\' sampl e No. 50 is caused by trans i-
PIal 011 ctlannel A--ICC)!Ie, 00.004(:.20)
S~--~--~--~---'----r---~---r--~----r-;
~ ~ ~ - ~ ~ ~ ~ ~ s.mpie number
Fig. 9. Test l'esu{Ls wilh receiver injJllL terminated wiLiz 50 n load and the receivergaill seL at ahouL 87 dB.
665
Journal if(;laciologv
ents introduced by the receiver-bl a nking switch. During norm al operati on O\'er glac ia l ice thi s p a rt of the \\'a\'Cform is no t d igiti zed , because the sta rL ti me fo r digiti zati on is se t a t a much later time.
'Vc install ed the rada r on a T\'ASA P-3 airc raft and ne\\' o\'Cr a relat i\'ely ca lm ocean off the coast nea r Wallops Island , Virginia, to m eas ure the impulse response and sys tem sensiti\·ity. We se t the cnd of the receiver-bl an king int en 'a l a nd the beginning of the STC inten 'a l to about 1 ps. We a lso se t the STC circuit to increase the rece iver gain to its m aximum value immediately after I ps. A \'ariable attenua tor was insert ed between the receive a ntenna and rece ive r input. The a ircra ft new a t an a ltitude of about 15000 fl (4500 m ) to simulate free-space loss associated \\'ith a range of a bout 35 km. The \'a ri ablc altenua tor \·\·as set to provide a n inserti on loss of 93 dB. Figure 10 shows the measured impul se response, a long with an expanded view of the signa l to illustrate the side lobes and the noise perfo rmance. Th e echoes before samp le No. 100 arc interna l feed-through signa ls. The echo at about sample No. 690 is from the ocea n sur face. The signa l-to-noise rati o is a bo ut 16 dB. The to ta l at tenua tion to rcduce the ocean echo to make it 6 dB hig her tha n system noise is abo ut 103 dB. I f wc assume that the refl ec tion coe fficient a t the water- ice interface is about 20 dB higher than th at for the ice- bedrock interface, the sca ttering and absorpti on losses in ice tha t thi s system can overcome a re abo ut 83 dB.
>-"" '" c .. ];
'" 2 ;; -.; c:::
InllnsJIy. A-Soop •. n .GaI(3500) 500
450 45 .--------~~-------·-
" 400
··'··1· .:···· 1
40 . ...•..• _ .. •• ' .... ·.n ... ·
350
.~.' .' 1~" ~''''' '''H''' •. •• " .. , .. .... ... . ~ .. _ ................. ..
300
30 ....... .. ... , .......... . .H······1v ........... .. ...... ....... .. ........ .
25 .••.•.•. , ............ - • ••.• • 10'; .......... . ........... . ...... .
, 250
200
150
100
~ 700 1 50
Fig. 10. The measured impulse resjJollse along l.I.'ith all erpanded view o/the signal to illustrate side Lobes alld noise jJerj'orl7lance during all airborne/lig/z l tesl.
4.1. Experimental results
Since 1993, we ha\'e co ll ected a la rge volume of da ta on ice thi ckness as pa rt of the NASA Progra m for Arctic C lim a te Assessment (Pi\RCi\ ). Reports p ro\'iding fi rs t-order result s with radio echogram for each fli ght-line, a long with the ice thicknesses derived from these echograms, a re availabl e elsewhere (Chuah and others, 1996a, b; Legars ky a nd o thers, 1997); here wc provide a few sample res ults to dem onstrate rada r perform ance.
Figure Ila shows rada r data collecLed a long a night-line p assing within 2.6 km of the deep ice-core d rill site in no rthern G reenland (D ahl:Jensen a nd o thers, 1997). The relati\ 'el y fl a t bottom topography contributes to the sm oo th
666
European NGRIP sll. (g4.dal(1950:2750»
Bedrock
a ".~w-~~,,~~~~w-~~ .. ~~.,~ __ ~~,,~ ... ~ 74 74 ;816N 7 S.0J.4~N 750812N 751 4N 75.1924N
Geolocation
A- Scope of European NGRIP slle(42.1835W 75.0872Ni 15000
~ 10000 §
1
~
~
~ " ~ c. 11 5000 . I U b ~I 11 ~
100 200 300 400 500 600 700 800 900 Range cells (4.494 m per cell in Ice)
Fig. 11. Radio ecllOgram (a) and an A-scope jJ resenlaliol1 if sigllaL amplitude vs dejJthj'or one sal71jJleji'o ll1 the ecllOgram ( b) /01' rad([1 data col/ecled along aflight -line lIear the deej) ice-core drill site ill nortlzem Creenland.
interna l layers obse rved to depths greater than 2.6 km th ro ug ho ut the ice colum n. Echoes near the surface consist of refl ec ti ons from d ielec tr ic discontinuiti es in the ice. The \'ery fl a t echoes arc m ultiple refl ections be tween the aircra ft and the surface.
Fig ure II b shows the a mplitude of one sample echo \\'a\ 'eform as a functi on of depth. Nea r-surface echoes a rc weak because the STC circuit was set to prevent recei\'er saturati on from the strong prima ry and multiple echoes of the surface. The STC recei\ 'e r ga in is increased from its minimum va lue a t a bout zero range to its max imum va lue for ranges g reate r than about I km. The ice-bottom return occurs at approx imately range cell 810 and has a sig nal-to-noise ratio of abo ut 26 dB. This dem onstrates the rad a r is capabl e of measu r ing thicknesses g reater than 3 km fo r co ld ice.
Fig ure 12 shows rada r data co ll ected over the southern Greenl and ice sheet during the 1997 fi eld season. From th e fi g ure we can sec several layers both near the surface and a t depLh s of I km and beyond. The \'ari a tion in intensity bet ween the sLII{ace and a bout 400 m depth is due to th e bl an king switch that pro tects thc receive r from the strong surface echo. Wc a lso sce significant \'ar ia ti on in the bedrock elevatio n underl ying th e ice sheet; however, beyo nd abo ut \.8- 2 km t he attenua tion exceeds the sensitivit y of the rada r, and the bo ttom echo is lost. ~Iany other interesting fea tures
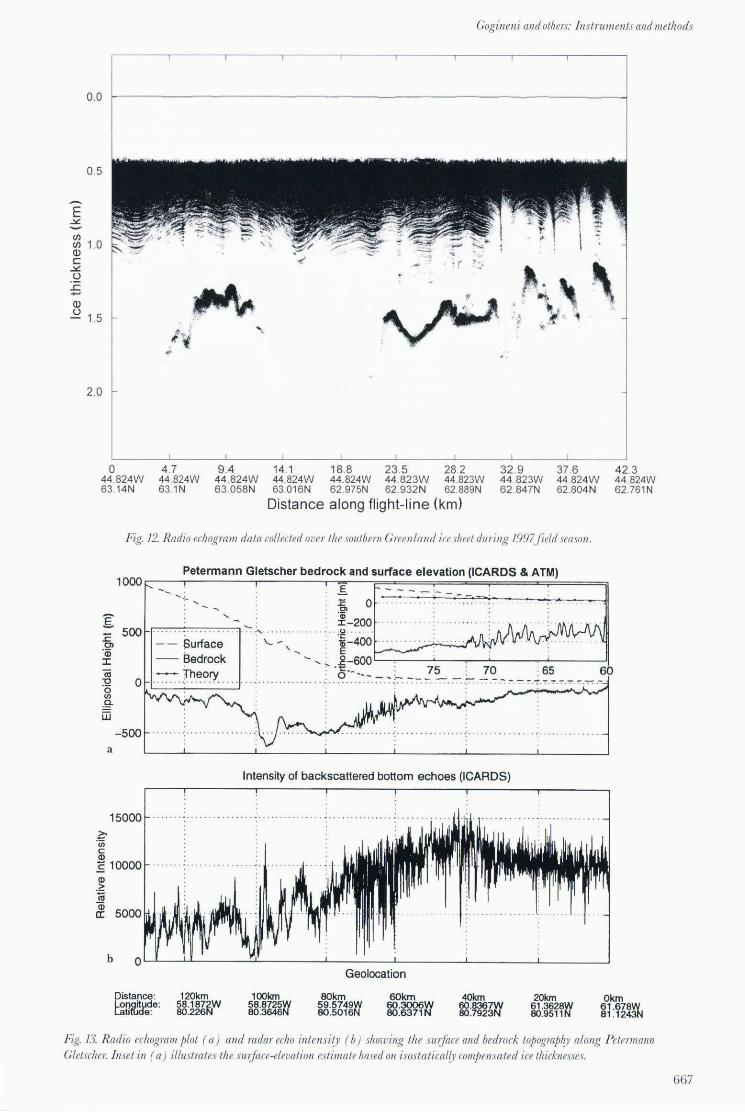
Coginelli alld others: Instruments and methods
E .Y.
C/) C/) Q) c
.Y. U
.s:: -Q) u
0.0
0.5
1.0
1.5
2.0
o 44 .824W 63 .14N
1~ ¥
4 .7 44.824W 63 .1N
",>,
9.4 44 .824W 63.058N
. r .. -
14.1 18.8 23 .5 28.2 44 .824W 44.824W 44.823W 44 .823W 630 16N 62 .975N 62 .932 N 62 .889N
Distance along flight-line (km)
~
• > , ~
32 .9 44 .823W 62.847N
~ . 1
37.6 44.824W 62 .804 N
Fig 12. Radio ec/lOgram data collerted over the sOllthem Creenland ire sheet during 1997Jield season.
42.3 44.824W 62 .761N
Petermann Gletscher bedrock and surface elevation (ICARDS & ATM) 1000c---.-------.--------.~--r======T==~~~====~====~ I -- -----
E 500 1::
0> 'iD :c
-- Surface -- Bedrock
<1i u . -... -... Theory ..... '0 IJ)
.9-W
a
15000 ... ... ... .
~ '(jj C ID E 10000 . . . . . . . ... .. .. . ..... .
ID .~ <U Qi a:
'- ,
-£, 0
~-200 . . ·u . ... ·
·~-400 . E ~-.-.-
, ~ .~-MOL-~: ----~~--~----~----~I 6'-" __ ~ :_ 75
Intensity of backscattered bottom echoes (ICARDS)
b O~---LL-----~~-------L------~--------~------~----__ ~
Distance: LOr)Qitude: LallflJde:
120km 58.1872W 8O.226N
100km 58.8725W 80.3646N
Geolocation
80km 59.5749W 8O.5016N
60km 6O.3006W 8O.6371N
40km 6O.8367W 8O.7923N
20km 61.3628W 8O.9511N
Okm 61 .678W 81.1243N
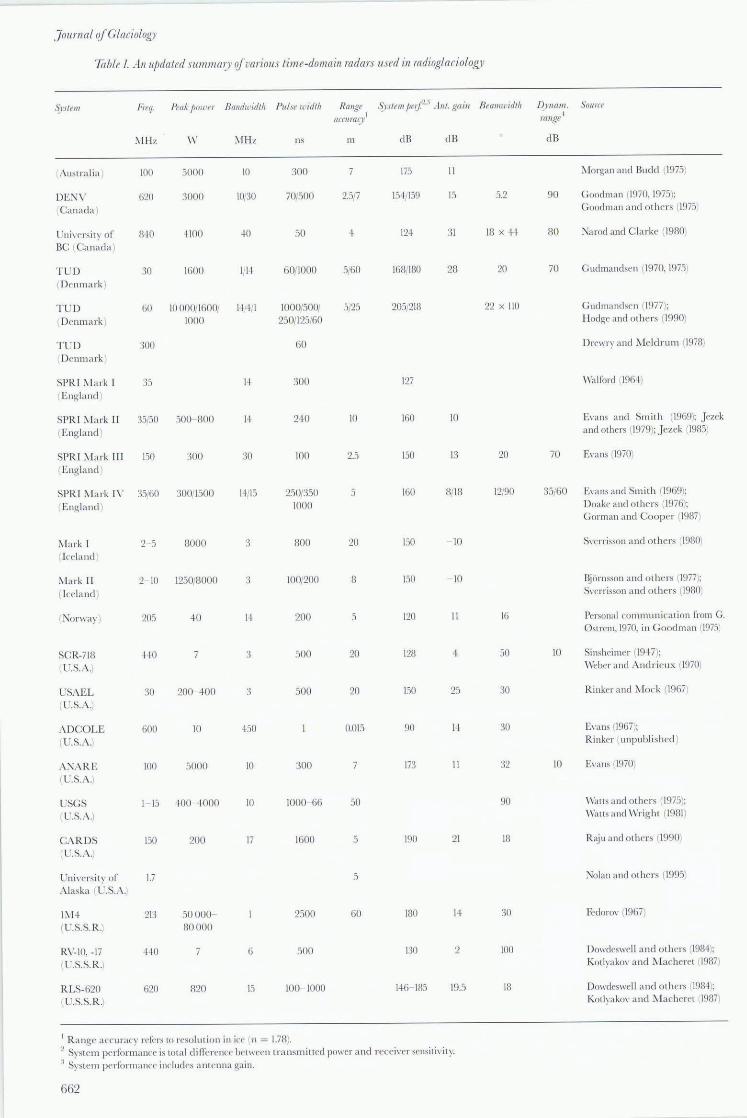
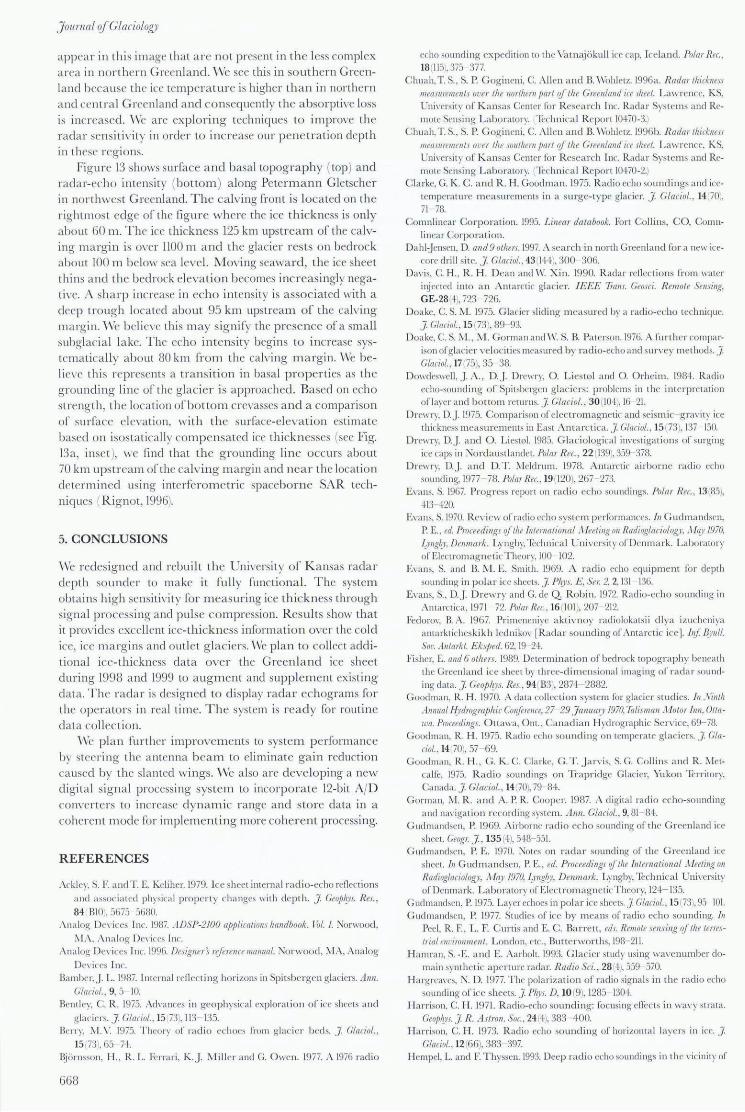
Fig 13. Radio ec/lOgram /)Iot ( a) and mdar erlio intensity (b) showing the sU1jace alld bedrock tOjJograplD' along Petermalln Cletscher. Inset in ( a) illustrates the surfitce-elevation estimate based on isostatical[y comjJensated ice thicknesses.
667
J ou maf (j/G/aciofogy
appea r in this image that a re not present in the less complex a rea in northern Greenland . ' Ve see this in southern Greenland because the ice tcmpera ture is higher tha n in northern and central Greenland and consequentl y the absorptive loss is increased . \Ve are exploring techniques to improve the rada r sensiti\'ity in order to increase our p enetration depth in these regions.
Figu re 13 shows surface and basal topography (top) and radar-echo intensity (bottom.) along Petermann Gletscher in northwest Greenland. The calving front is located on the rightm os t edge of the fi gure where the ice thickness is only about 60 m. The ice thickness 125 km upstrea m of the calving m argin is o\"Cr 1100 m and the glacier r es ts on bedrock about 100 m below sea level. !-.10ving seaward, the ice sheet thins and the bcdrock elevation beeomcs increasingly negati\ "C. A sharp increase in echo intensity is associated with a deep trough located about 95 km upstream of the calving ma rgin . \ Vc belie\'e this may signify the presence of a small subglacia l lakc. The echo intensity begins to increase systematically about 80 km from thc ca lving m a rgin. We beli cve this represents a transition in basal properties as the grounding line of the glacier is approached. Based on echo streng th, the location of bottom crevasses and a compari son of surface elevation, with the surface-elevation estimate based on isostati ca lly compensated ice thicknesses (sec Fig. l3a, inse t), wc find that the grounding line occurs about 70 km upstream ofthe calving margin and near the location determined using interferometric spaceborne SAR techniques (Rignot, 1996).
5. CONCLUSIONS
\Ve redesigned and rebuilt the University of Kansas radar depth so under to make it fully functional. The system obtains hig h sensitivity [or nl.easuring ice thickness through signal processing and pul se compression. R esults show that it provides excellent ice-thickness information ove r the cold ice, ice m argins and outlet glaciers. We plan to collect additional ice-thickness data over the Greenland ice shee t during 1998 and 1999 to augment and supplem ent existing data. The rada r is des igned to di splay radar echograms for the opera tors in real time. The system is rea dy for routine data collec tion.
\ Ve pl a n further improvements to systenl. performance by steering the antenna beam to eliminate gai n reduction caused by the slanted wings. "Ve al so are developing a new digita l signal processing system to incorporate 12-bit AID converters to increase dynamic range and store data in a coherelll mode for implementing more coherent process ing.
REFERENCES
Acklcy. S. F a ndT E. Kclihcr.1979. Ice sheet internal ra dio-echo rellections
and associa ted ph ysica l pro pe rt y cha nges with depth. ] Geopl!J's. Res., 841 BIO ), .'i(175 .'i()BO.
,\na log Dc,' ices Inc. 1987 . . IDSP-2100 appliraliolls handbook. fol. I. "lorwood ,
\1:\ . . \na log De"ices Inc. ,\na log J)c" ices I ne. 1996. /)esigned' reftrl'llCPlIlallual. Norwood , ?-.IA, Ana log
DC" iccs I nc. Bamber, j. L. 1987. Interna l rdl cc ting hori zons in Spitsbc rgcn glaciers. Anll.
Glarial. . 9, 5-10. Bentley, c:. R. 1975. Ach"ances in geophysica l ex ploratio n o f ice sheets and
glac iers. ] GI([riol .. 15 173). 113 135. Berr y, ]\1. \'. 1975. Theory of radi o echoes from glac ier beds. ] Glaciol.,
15 173 1.65 7+. Bj i)rnsson, H .. R. L. Fcrra ri. K.} Y[ill cr and G. O we n. 1977. A 1976 radio
668
echo so unding expedition to the Va tnaj okull ice cap, Iceland. Polar Ra .. 18 (11.'i).375 377.
C huah. T 5., S. P. C ogincni, C. Alien a nd B. \\ 'ohletz. 1996a . Radar thickness measure/llellls over the lIorlhern pari if Ihe Gremland ire slzeel. L aw rence, KS, Gni 'Trsit y oCKa nsas Center lo r R esea rch Ine. Rada r Systems and Relllote Sensing La boratory. ,clechnical Report 10+70-3.1
C hua h,T. S., S. P. G ogineni. C. Ali en a nd B. Wohlc tz. 1996b. Radar Ihicklle.u II/{'ajllrflllellls ot'er lite joulhem I,arl q! Ihe Greelllalld ia sheel. Lawrence. KS, Uni" ersit y of K a nsas Cemer for Resea rch Ine. Rada r Systems and Remote Sensing L a boratory. (Technical Report 10470-2.)
Clarke, G. K. C. a nd R. H. Goodma n. 1975. R adio echo soundings and icetemperature m easurements in a surge-t ype glacier. J Glacio/., 14 (70), 71- 78.
Comnlinea r Co rpo ra tion. 1995. Lillear data.book. Fort Collins, C O. Comn· linea r Corpo ra tio n.
Dahl·Jensen. D. and 9 ollters. 1997. A search in north Greenland fo r a new iceco re drill site. J GI([cio/ .• 43 (14+), 300- 306.
Davis. C. H. , R. H. D ean and \\'. Xin. 1990. Radar rellec tions fi"om water iruectcd into a n Antarcti c glacier. IEEE 7/"IIIIs. Geosci. Remole Sellsiug. GE-28 (4),723 726.
D oa ke, C. S. ,vI. 1975. Glacier sliding m easured by a radio-echo technique. ] Glllliol .. 15 (73), 89 93.
D oake, C. S. M. , 1\ l. G orman and W. S. B. Pa tcrson. 1976. A furth er comparison of glacier veloc iti es measured by radio-echo and sUr\ 'ey methods.] Glalio/. . 17 (75),35- 38.
D owdeswell, J A. , D.J Drewry. O. Lies tol a nd O. Orheim. 198+. Rad io echo-sounding of Spitsbergen glacier s: p roblems in th e interpretation of layer and bo n o m returns. ] GlacioL .. 30(104), 16-21.
Drewr)', D.j. 1975. Compari son of electromagnetic and seismic-gravit y ice thickness measurcments in Eas t Anta rctica. ]' GLalio/., 15 (73), 137 150.
Drcwry, D.j. a nd O. LiestO!. 1985. Glac iological im'csti ga ti ons of surging ice caps in No rdaustl andet. Polar Rec., 22 (139), 359-378.
Drewry. D..J. a nd D. T. l\fcldrum. 1978. Anta rctic airborne radio echo sounding, 1977-78. Polar Ra .. 19 (120), 267 273.
E,·a ns. S' 1967. Prog ress report on radio echo soundings. Polar Ra., 13 (85), +13- +20.
E,·a ns. S. 1970. Rc, ·iew of radio echo system performances. In Gudmandsen, PE .. ed. ProceediJ/gs o/Ilte IlIlernalional .Ifeelillg 011 Rarlioglaciolo!D', JIc!v 1970, Sl'l'g~r. Dell mark. L)"ngby, Technical Unive rsit y of Denmark. Laboratory of El ectromagnetic Theory, 100 102.
E" ans, S. and B. 1\ I. E. Smith. 1969. A radio echo equipment lo r depth sounding ill po lar ice sheets. ] PI!),s. E, Se?: 2, 2, 131 136.
E\'a ns. S., D.J Drew ry and G. de Q Robin. 1972. Radio-echo sounding in Antarctica, 1971 72. Polar RI'c. 16 (101 ), 207-212.
Fedoro", B. A. 19b7. Primencniye akti \' noy radiolokatsii dl ya izucheni ya antarkticheskikh ledniko\' [Radar sounding ol"Anta rctic iceJ. Inf B)'uii. SOl". Anlm·kl. Eksped. 62, 19-2-k
Fisher. E. and 6 olhers. 1989. Determina ti o n of bedrock topography benea th the Greenl and ice sheet by th ree-dimens ional imaging 0 [" rada r sound· ing data. ] GeojJl!),s. Res .. 94(B3), 2874-2882.
G oodman. R. H. 1970. A data coll ec tio n system [or glacier studies. In. 'iinlh Annual J1.JldrograjJlzic Conferenre. 27-29 ] anuat)1 1970. Tct/isman -'folor Inn. Ol/a wo. Proceedings. Ouawa, ant .. Canadia n H ydrographic Sen ·ice. 69-78.
Goodman. R. H. 1975. Radio echo sou nding on temperate glac iers. }. Gla cio/., 14 (70), 57 69.
G oodman. R. H. , G. K. C. Clarke, G. T. J a n 'is, S. G. Collins a nd R . I\letca lie. 1975. R adi o soundings on ~II-apridgc Glacier, Yukon Terri tory, Canada . ] GLano/.. 14 (70), 79-8+.
Gorman, ?-.l. R. a nd A. P. R. Cooper. 1987. A digital radio echo-sounding andna\' iga ti o n recording system. d llll . Glaciol., 9, 81 8+.
Gudmandsen, P. 1969. Airborne radi o echo sounding of the Greenland ire sheet. Geogr. ] , 135 (,,), 548-551.
Gudmandsen, P. E. 1970. ~otes on rada r sounding of the Grecnland ice shec l. In Gudma ndscn, P. E .. erl. Proceedings q/ Ihe IlIlemational .lleeling on Radioglariology, !If,,)' 1970. Lyngby. D fllmark . Lyngby. ' Iechnica l U ni'Trsit y of Denmark. L a boratory 0 [" Electrom agnetic Theory, 124- 135.
Gudmandscn, P. 1975. La\'er echoes in pola r ice sheets. ] (;laliol .. 15(73 ). 95 ID!. G udmandsen, P. 1977. Studies of ice by means of radio echo sounding. In
Peel, R. E, L. F. C urti s and E. C. Ba rrett, eds. Remole jellsing o/Ihe lerresIrial elll"lrollm.elll. L ondon, ete., Bu tterworths, 198-211.
H amran. S. -E. a nd E. Aarholt. 1993. Glac ier stud y using wm'cnumber domain synthetic a perture radar. Radio Sci .. 28 (+).559-570.
Ha rgrea\Ts, N. D. 1977. The polarizatio n of radio signals in the radio echo sounding of ice sheets.] PIz)'S. D, 10(9), 1285- 1304·.
Harriso n. C. H. 19 71. Radio·echo sounding: focusing elTee ts in wa,'), strata. Gea/ll!n. ] R. Aslroll. Soc .. 24 (+1. 383 400.
Harrisoll, C. H . 1973. Raclio echo sounding of hori zonta l laye rs in ice. ] Gialiol .. 12(66), 383 397.
Hempel, L. and F. Thyssen. 1993. Deep radio echo soundings in the "icini ty of
GR IP and G ISP2 drill site" Grcen land. Palm/orsc/lllug, 62 (1 ).1992, 11 - 16. Hodge, S. ~I.. D. L. \\'ri ght. J A. Bradlry, R.\\'. J acobd, N. Skou and B.
\ 'a ughn. 1990. D eterm ination of the surl;tce a nd bed topogra phy in ce ntnt! G reenland.]' Glarial., 36 1122), 17 30.
Jacobel. R. \\'. and S. M. Hodge. 1995. R adar interna l layers from the Greenland summit. Geal)/~rs. Res. Lell., 22 5 , 587-.')90.
J ezek. K. 1985. Rada I' measurements of bore hole geometry on the Greenland and Antarctic ice sheets. Geop/, )'SI'c" 50 (2), 2-}2 251.
J ezek, K. C. C R. Bentlcy andJ W. C lough. 1979. Electromag neti c sounding of bottom cre\ 'asses on the R.oss Ice Shelf. Anta rc tica. ]. Glariol., 24 901. 321 330.
KotlyakO\', \ ' ~1. and Yu. ) ;\. i\l acheret. 1987. Radio echo-sounding of subpolar g laciers in Sya lbard: some proble ms and results o f SO\'ie t slUdies. • ·11/1/. (;Iariul .. 9, 1.')1 159.
Krabill , W.B., R.I-i .Thomas. C F. '\I a nin , R.N. Swift and I':. H. H·ederick. 1995a. ,\ ccurac)' of a irborne lase r altimetry 0\'Cr the Greenland ice shee l. 1nl.]. Rfll10le Sensing. 16 1 h 1211 1222.
Krabill , W. , R. Thomas, K. J ezck. 1< .. Kui\ 'incn and S . .\I an izade. 1995b. Greenland ice sheet thickn ess changes mcasured by I,,"e r a!timetry. Gea-1)/eP . Res. L,'II., 22 (]7 ,23-}1 234+.
Legarsky, Jj.. S. P. Gogincni, C. Allrn , T. S. Chuah and Y. C . \\'ong. 1997. Radar Ihirkness measurPluenl.r over Ihe I/arlhnn 1)lIrl q/lhe Grt'fl/lal/d ire sheel: 1996 resuits. Law rence, KS, Universit y o f Kansas CC l1le r for Research 1nl'. Radar Sys tems and Remote Sensing Laboratory. ' Icchnica l Report 10-+70-6.
J\ lacheret, Yu.\a. and .\. R. Zhura\·IC\·. 1982. Radio echo-sound ing ofS\'a lbard g laciers.]' G/f/cio/', 28 1991, 295 31-}.
~lil1 ar, D. H. i\l. 1981. Radio-echo laye ring in polar ice shce ts and past \'01-can ic aCl i\·it y. . \ alllre, 292 15822 1, ++1 ++3.
~ lorgan, \ '. 1. a nd \\'. F Budd. 1975. R ad io-echo sounding of the La mbert Glacier basin.]' G/f/cial .. 15 73 1.103 Ill.
~Ius il. G.j. and C. S . .\1. Doake. 1987. l maging subglacia l lOpography by a synthetic apcrture radar tcch nique .. 11/1/. Glacio/., 9, 170 175.
:-\arod. B. B. a nd C. K . C. Clarke. 1980. Airborn e UHFradio echo-sounding of lhree Yukon g lac icrs.]' GLf/cial., 25 (9 1),23 31.
Narod. B. B. a nd G. K. C. Clarke. 199 J.. i\lini ature high-powcr impulsc transmitter for radio-ccho sounding. ]. Glacial .. 40 13 I·). 190 19+
;\ea l. c:. S. 1976. R ;tcii o-ccho power proli ling. ]' GLariol .. 17 77 ),527530. :'\1ea!. C. S. 1979. The ch namics of th e Ross Ice Shelf re\'l'alcd b) radio ccho
sounding. ]. Glaciol.. 24 901,295 307. ;\lola n. ~I.. R.J. J\lot yka , K. Echclme-ye r a nd D. C:. l i ·abanl. 1995. Icc-lhick
II CSS IllcaSUrCmelllS ofT,tku G lacier. ,\I aska, USe\ .. and th e ir rc1C\'ance to it s recellll)('hm·ior.]. Glaciol. . 41 139), 5+1.~5:1.
O~\\·a l d. G. K. .\ . 1975. ImTstiga ti on o f sub-ice bedrock charaC'lerisl ics by radio-echo sounding.]' Glacial.. 15 73\ 75 87.
Pall'!'son. \I'. S. 13. 199+. The 1)ltl'Jics,!/glf/cim. Third ediliol/. Oxlurd, e tc., EIsC\·icr. Raju, C .. \I '. :-';in and R. K. Moore. 1990. D cs ign, den:loplllcl1l , li e ld obsCl'
\'a ti ons, a nd preliminary rcsul ts of the coherelll Alll arc ti c radar depth sounder I C.-\ R DS I of the UniHTsity 01' Ka nsas. L.S .. \ . .J Glaciol .. 36 123. 2-}7 25-J..
Ri g nol. E. 1996. Tidal motion. icc \ '( Iocit\· a nd mclt rat e o f Pe tcrmann Glctscher, Grccnland. meas ured from radar illlerferomclry . .7 Glaciol .. 42 1-}2" +76 +R5.
Gogineni and olhers: Jnslrlll71enls and methods
Rinker, j. "i. Lnpubli shcd. \lonocycle radio ice measurcmcllls. 1966 Greenland field tests. HanO\Tr. :'\1 1-! . U.S .. \rm )' Corps of Enginee rs. Cold Reg ions Resea rch and Engineering Laboratory. (H .. cpon .'
Rinker, j. N. and S . .J. i\loc k. 1967. Radar ice thickncss prolilcs nOrLh\\,cst Greenland. CRREL Spec. Rei). 103.
Ro bin. G. de Q 1972. Pol ar ice shcets: a IT\·ic\\,. Polar Rec., 16 100.5- 22. Robin. G. de Q 1975a. Radio-echo sound ing : g lac io logica l int crpretat ions
a nd applicat ions.]. Glacio/.. 15173. I·g G+. Robin, G. de Q 1975b. Ve locityofradio w",'Cs in icc by mC'an, ofa bore-hoil'
interferomctrie technique . .7 (;Ia riol .. 15 73 ), 151 159. Sinshcimcr. R. L. 19+7. Altitude determination. [ 11 H all, .J. S .. ed. Radarair/, 10
IICll'igalioll. :\c\\')ork, e tc .. :--lcG ra\\'- I-l ill , 131- 1+2. i\ ll T Radia tion La
boratory Series 2 . Si\·a prasad. K .. erl. 1978. Rel}arl ojrarlio ,'(lto SOlllldillg 0/ i((' ,,'arks/lUjJ. Dllrholll.
. \ ;,l1' [-lall/jJlhire. Durha m, :'\11-1 , Un in'!'si ry o f Ncw Hampshire. D epartm ent of El ec tri ca l and Computer Engincering.
Strangway. D. \\'. alld 7 ollieu. 197-+. Rad io-liTque nc), interfcrometry a nc\\' tcchn iquc lor stud ying glac iers.]. Glaciol .. 13 67. 123 132.
SH'rrisson. \1. .. E. j ohan ne%on and H. Bj ii rnsson. 1980. Rad io-echo equipment for depth sou nding ortcmperate glaciers . .7 (;Io(iol .. 25 ,93. +77- 186.
\\'a itl', .\. H. and S . .J. Schmidl. 1'l61. Gross crrors in heiglll indication from pulsed raclar alli nle tcrs operat ing o\'Cr thick ice or snuw. I lI jlilule '!IRarlio t ;lIgillee!S IlIlernaliollal COIl1'elllioll Rnwd. 5. 38 5:1.
\\·alford. ~L E. R. 196+. R adio ccho sounding lhrough a n ice shell: . \ illllre. 204 -}956. 317 319.
\\ 'allord. H E. R. and ~ l. F L. Harper. 1981. The dCLailrd stud) of glacier beds using radio-echo lcchniqucs. (;(ol)le1'S . J R . . I,lmll. Soc .. 67 3 " ·1 87- 5H.
\\'a ll()rd. ~l. E. R .. PC. H oldorf and R. G. Oakbng. 1977. Phase-sensiti\'C racJio-echo sounding a t the DC\'on Island ice cap, Canada. ]. Glaciol., 18 791,217 229.
Wa tb, R. D. and .\ . \\ '. Engla nd . 197G. Rad io-ec ho ,ounding of tcmperate g lacie rs: ice propert il's and sounder des ig n critnia . .7 (;I(lciol .. 17 (5 ), 39 -}8.
\\ 'all s, R . D. a nd D. L. Wright. 1981. Sys tcllls 101' Ill casu rin g thi ckness ofl('mpcra tc and pola r ice from the ground or from the ai r.]. Glaciol .. 27 971, ·1.')9 +69.
WallS, R . D., .\ . \\ '. Eng land. R. S. \ 'iekers and J\ 1. F :-OleicI'. 197.'). Radio
echo sou nding on SOllth Ca,cadc Glacier. \\ ·a shing ton. using a longwa\·e!ength. mono-pulsc source .. \bstracl. .7 (;I(I(iol., 15 ,73, -}59 +61.
\\'clxr, .J. R. and 1'. ,\ndril'ux. 1970. Rada r soulld ings on the Pcn ny Ice Cap, Hal Tin Island . .7 Glacio/ .. 9 551. -I l) 5+.
\\·cst. .J. c:. and K. R. Dcmaresl. 1987. The radia ti o ll charartlT isties of an a rbitr,1I') alllClllla pos itioned on a polar ice sheet. (,',ol"!t'.>ifl. 52 12. IG89 169(i.
\\ 'oodrul1: .\ . H. \\'. and C. S. 711. Doake. 1979. Dcpolarizat ion of radio \\'a\'c:-. can di slillg-ui:-;h bl'lw('en fl oat illg and g rounded ice sheets. J Gla c;ol., 23 189. 22:1 :n2.
"'r ig ht , D. l... S. H Hodge a ndJ .\ . Bradlc\'. 1989. USl' ora nc\\' high-specd di g ital c1ata acq ui siti on sys telll fi,l' a irborne ice-sounding. IEEE T;-olls. (;eo.lci. Rell/ole St'/lIillg, GE-27 5 . . i61 .i67.
:-';i n. \ \ '. 1989. Dala IJrO(fl\illg~1'<lell/ ojthe (oht'fPIII . llIlart lir radar d(plh .\Qullder. Lawrence, KS. Lni\ 'C rsily of Kansas Cl'l1lcr for Research [ne. R adar Systellls and Rcmote Scnsing LaboraLOry. ' ll'(' hnica l Report 8070-3.1
. \IS receil'ed 26. \ (member 1997 alld accepled ill rel'isedJonn .5 JJn,.)l199R
669