instrumentation for far-infrared spectroscopy - idc · pdf files0207-instrumentation for...
TRANSCRIPT

S0207-
Instrumentation for Far-infrared Spectroscopy
Peter R. Griffiths1 and Christopher Homes2
1 University of Idaho, Moscow, ID, USA2 Brookhaven National Laboratory, Upton, NY, USA
1 SOURCES FOR FAR-INFRAREDSPECTROMETRY
Measurements of far-infrared spectra are made far moredifficult than the corresponding measurement of mid- ornear-infrared spectra because of the weakness of the source.The spectral energy density of a blackbody at 1400 K isalmost 5800 times weaker at 10 cm�1, and about 60 timesweaker at 100 cm�1, than it is at 1000 cm�1. Since thesensitivity of any measurement of a mid- or far-infraredspectrum is directly proportional to the spectral energydensity of the source, it is apparent that far-infrared sourcesshould be as hot as possible and have an emittance of closeto unity.
For measurements between about 400 and 100 cm�1,the radiant power emitted by a silicon carbide (Globar)source is as high as any conventional infrared source.Although Nernst glowers can be operated at higher tem-perature than Globars, they become quite transparent belowabout 200 cm�1, so that their emissivity drops to the pointthat they are of little use as far-infrared sources, despitetheir high temperature. Below 100 cm�1, the emissivity ofa Globar also becomes low and it is customary to usea high-pressure mercury lamp for measurements between¾50 cm�1 and the onset of the microwave region of thespectrum. The reason why mercury lamps have proved to beso successful for far-infrared spectrometry is because emis-sion from the plasma reinforces the emission from the hotquartz envelope of the lamp. However, the mercury lamphas significant flicker noise, so even if the energy is better,the signal-to-noise ratio (S/N) may not be. It should alsobe noted that microwave sources have been developed thatemit highly monochromatic radiation at shorter wavelengths
John Wiley & Sons Ltd, 2001.
than 1 mm (10 cm�1) but they will not be covered in thisarticle. Because wavelengths between 1 mm and 100 µmrequire a different measurement technology than the mid-infrared, measurements made in this region are sometimescalled “submillimeter wave” spectroscopy.
The radiance of synchrotron sources in the far-infraredcan be as much as three orders of magnitude greater thanany of the sources mentioned above.1 From the standpointof obtaining the highest photon flux, therefore, synchrotronsare easily the best sources of far-infrared radiation. Theyhave two important disadvantages, however, in that “beamtime” must be obtained and the experiment must be trans-ported to the synchrotron and not vice versa. If these factorsdo not provide an excessive limitation, the synchrotron iscertainly the ideal source of far-infrared radiation, par-ticularly for etendue-limited applications such as reflec-tion–absorption infrared spectroscopy of thin films.
2 DETECTORS
2.1 Pneumatic amplifiers
The first type of detector to be routinely used for far-infrared spectroscopy using both grating monochromatorsand slow- or step-scanning interferometers was the Golaypneumatic amplifier detector.2 A schematic of one of thesedetectors is shown in Figures 1 and 2. A chamber con-taining a gas of low thermal conductivity is sealed at oneend with an infrared transparent window (A) through whichradiation reaches a thin absorbing film (B). This film has alow thermal capacity, so that its temperature rises rapidly,in turn warming the gas with which it is in contact. A risein the temperature of the gas in the chamber leads to a con-comitant increase in its pressure and, therefore, a distortion

S0207-
2 Instrumentation for Mid- and Far-Infrared Spectroscopy
Window
Incidentradiation
A
B
Absorbingfilm
Pneumaticchamber
Ballastingreservoir
Leak
D
CFlexiblemirror
Figure 1 Front section of a Golay detector. Chopped incidentQ4radiation passes through the window onto a blackened film,causing the pressure of the gas in the pneumatic chamber tofluctuate and a flexible mirror to deform with the same modulationfrequency as the chopper. A pinhole leak minimizes the effect oflong-term temperature variation. (Reproduced by permission ofCathodeon Ltd.)
of the mirror membrane (C) with which the other end ofthe chamber is sealed. A fine leak (D) connects the detec-tion chamber with a ballasting reservoir of gas on the otherside of the mirror membrane to prevent slow changes inambient temperature from affecting the detector.
The temperature of the absorbing film follows the fre-quency at which the incident radiation is modulated. Visible
light from a source (E) passes through a condensing lens(F) to a line grid (E) and is focused on the flexible mirror.A meniscus lens (H) between the line grid and the mir-ror focuses the beam so that in the absence of any otherdeformation, an image of one part of the line grid is super-imposed on another part of the same grid. If the image ofa gap between lines coincides with a gap in the grid, lightwill be transmitted by the grid and hence the intensity oflight reaching the sensor is measured.
Golay detectors are remarkably sensitive and were com-monly used with slow- and step-scanning interferometersand lamellar grating interferometers (vide infra). Theseinstruments do not modulate the infrared beam at a fre-quency above about 0.1 Hz, so that the beam is usuallyfurther modulated by a rotating chopper typically operatingat ¾13 Hz. When the older interferometers were supersededby the type of rapid-scanning interferometers incorporatedin bench-top Fourier transform infrared (FT-IR) spectrome-ters, the slow response speed of Golay detectors precludedtheir use and they were, in turn, superseded by pyroelectricbolometers.
2.2 Pyroelectric bolometers
Pyroelectric bolometers incorporate as their heat-sensingelement ferroelectric materials that exhibit a large spon-taneous electrical polarization at temperatures below theirCurie point. If the temperature of these materials is changed,the degree of polarization is changed. The change in polar-ization may be observed as an electrical signal if electrodesare placed on opposite faces of a thin slice of material
HeadGrating
Mirror
Mirror and lens block
Lightsource
E
To amplifier
P-FETlightsensor
L
K
FG
H
Figure 2 Rear section of a Golay detector. Visible radiation is passed through a grating and is focused onto the flexible mirror shownin Figure 1. The reflected radiation passes back through the grating and is measured by a light sensor. When the flexible mirror isundistorted, the grating prevents any light from reaching the detector. The greater the distortion of the mirror, the greater is the measuredsignal. (Reproduced by permission of Cathodeon Ltd.)

S0207-
Instrumentation for Far-infrared Spectroscopy 3
to form a capacitor. When the polarization changes, thecharge induced on the electrodes can either flow as a cur-rent through a relatively low external impedance or producea voltage across the slice if the external impedance is rel-atively high. The detector will only give a signal when thetemperature of the element changes.
The most commonly used material for pyroelectric detec-tors is deuterated triglycine sulfate (DTGS). The DTGSelement is usually mounted so that the thermal resistancebetween the element and its surroundings is large, so thatthe thermal time constant is long. The voltage responsivityof pyroelectric detectors is approximately proportional tothe reciprocal of the frequency at which the incident radi-ation is modulated. The frequency at which radiation ofwavenumber Qn is modulated by a rapid-scanning interfer-ometer is equal to VQn Hz, where V is the optical velocity(in cm s�1). For an optical velocity of 0.316 cm s�1 (5 kHzlaser frequency), the highest modulation frequency of far-infrared radiation (corresponding to 400 cm�1) is ¾125 Hz,and the lowest (corresponding to 10 cm�1) is 3 Hz. In prin-ciple, therefore, the performance of DTGS detectors fittedwith a polyethylene window should be quite good for mea-surements of far-infrared spectra using a rapid-scanninginterferometer. However, it should be noted that this fre-quency range includes electrical line frequency (60 Hz inthe USA) and its first harmonic, and so spikes are often seenin far-infrared spectra measured with a rapid-scanning inter-ferometer. In addition, low-frequency building vibrationscan lead to “spikes” (glitches) in the spectra at other fre-quencies, so that good vibration isolation is often necessary.
2.3 Liquid helium cooled bolometers
Because the intensity of far-infrared radiation emitted bymost sources is very low, spectra measured using pyroelec-tric or Golay detectors are often quite noisy. To improvethe S/N, it may be necessary to use a detector with muchhigher performance than either of these two detectors. Inthis case, the use of liquid helium (LHe) to cool the elementis often called for.
Two types of LHe-cooled detectors have been usedfor the measurement of far-infrared radiation. The firstare either boron-doped silicon or germanium doped withcopper, gallium or antimony. When cooled with liquid 4He,these detectors have a low frequency cut-off of ¾20 cm�1.The fundamental factor limiting the sensitivity of thesedetectors is Johnson noise, the power of which is given by:
Vn D√
4kBQnRT �1�
where kB is Boltzmann’s constant, Qn is the bandwidth ofthe detector, R is the resistance of the bolometer and T
is the operating temperature. The noise equivalent power(NEP) of these bolometers is ¾1.5 ð 10�13 W Hz�1/2. Tominimize the effect of the mid-infrared photon flux fromambient grey bodies, LHe-cooled filters must be placedin front of these detectors. For increased sensitivity, thesedetectors may be operated at ¾1.5 K by pumping the heliumbath through the lambda point. In this case, the NEP maybe reduced as low as 8 ð 10�14 W Hz�1/2. The lambdapoint of liquid 4He is reached by pumping on the LHereservoir. At a pressure of 37.8 mm Hg, the LHe undergoesa superfluid transition at 2.172 K. Continued pumping ofthe superfluid down to a pressure of about 1 mm Hg lowersthe temperature of the fluid to 1.27 K.
A further increase in sensitivity can be achieved usingpumped liquid 3He, for which the lowest operating tem-perature is ¾0.32 K. A pumped liquid 3He bolometer alsohas a lower bandwidth (�80 cm�1 as opposed to 700 cm�1
for a 4.2 K detector). When these two factors are takenin tandem, the reduction in Vn is an order of magnitude,and a further restriction of bandwidth can improve thisfigure even more. The 3He bolometer has a typical NEP of1.4 ð 10�15 W Hz�1/2, and has been used down to 1 cm�1
using a mercury arc lamp source and a lamellar gratinginterferometer.
The NEP of these bolometers may be compared to thetypical value for a DTGS detector of ¾5 ð 10�9 W Hz�1/2.Thus the typical increase in sensitivity of bolometers cooledto 4.2 K over that of the DTGS detector at ambient temper-ature is more than four orders of magnitude. This improve-ment factor may be increased to six orders of magnitudeby cooling with pumped 3He.
The second type of far-infrared detector is the InSb hot-electron detector. Absorption of radiation by free-carrierelectrons causes their mean temperature Te to rise abovethat of the host lattice. Since electron mobility is pro-portional to T3/2
e , this temperature rise can be sensed asa change in conductivity. The very low thermal massof free electrons, with short energy relaxation times of¾10�7 s, leads to very fast submillimeter and millimeterwave detectors. In one modification of this type of detector,a specially-shaped n-type InSb crystal is coupled directlyto a low-noise preamplifier without sacrificing bandwidthor introducing noise. The typical wavenumber response ofthese detectors is from 2 to 50 cm�1.
3 INTERFEROMETERS
3.1 The early days
In the late 1950s and early 1960s, two manufacturers intro-duced double-beam grating spectrometers for far-infrared

S0207-
4 Instrumentation for Mid- and Far-Infrared Spectroscopy
spectrometry. These were the Perkin-Elmer (Norwalk, CT,USA) Model 301 and the Beckman (Irvine, CA, USA)IR-11. Although these instruments allowed spectra to bemeasured down to 33 cm�1, the spectra were noisy, espe-cially when high resolution was required. At about the sametime, John Strong, at Johns Hopkins University in Balti-more showed that it was possible to measure significantlybetter far-infrared spectra with an interferometer providedthat the long computing times required could be tolerated.(Remember that the fast Fourier transform algorithm wasnot reported until 1964 and that the power of the best com-puters at that time was not much better than that of a smallchip that played the Christmas carol “God Rest Ye Merry,Gentlemen” in Christmas cards sold in the mid 1990s.)
After Strong’s work, the key developments of Michel-son interferometers for far-infrared spectroscopy was car-ried out in the 1960s by Alastair Gebbie’s group at theNational Physical Laboratory (NPL) in Teddington, Middle-sex, UK. Their instruments were quite small and, at least bytoday’s standards, crude, but allowed far-infrared spectra ofremarkably high quality to be measured to below 10 cm�1.Fortunately, because the tolerances required for interferom-etry are proportional to the wavelength, it was a relativelysimple matter to make interferometers for far-infrared mea-surements where the wavelengths could be as long as1 mm. The first commercial far-infrared Fourier transformspectrometers were based on the interferometers developedat the NPL. These instruments were made by Researchand Industrial Instruments Co. (RIIC) (Strathclyde, UK)and Grubb-Parsons (Newcastle-upon-Tyne, UK). RIIC wastaken over by Beckman in the early 1970s.
The first of these far-infrared interferometers, the RIICFS-520, was introduced in 1964. As with most far-infraredspectrometers, the entire optical path was evacuated. TheFS-520 incorporated a continuous drive, where the opticalpath difference could be varied at a rate between about0.5 and 500 µm s�1, with 5 µm s�1 being a typical valuefor measurements between 100 and 400 cm�1. At this slowspeed, the Fourier frequencies were well below 0.1 Hz sothat the radiation from the mercury lamp source had to bemodulated by a 13-Hz chopper. The throughput allowedfor this spectral region was very large and the FS-520 hada poly(ethylene terephthalate) (PET) beamsplitter that wasover 20 cm in diameter. (The most common commercialsources of PET are du Pont, who market it as Mylar, andICI, who marketed it as Melinex. Beamsplitters fabricatedfrom PET are commonly known in the USA as Mylar
beamsplitters and will be referred to as such throughoutthe rest of this article.) After the beam passed throughthe sample compartment, the interference record was mea-sured with a Golay detector, and the detector signal wasdemodulated with a lock-in amplifier. The instrument was
equipped with a Moire fringe reference device that actuateda punched paper tape at equal intervals of path differenceand the spectrum was computed off-line. As crude as thisinstrument sounds, its sensitivity was remarkably high, inpart because of its very high optical throughput.
By about 1965, the NPL group had switched to a muchmore compact and easily fabricated design that becamethe basis of the Grubb-Parsons Mark II interferometer, aphotograph of which can be seen in the first article ofthis volume. This interferometer, which was an almost Q1
exact replica of the NPL “cube”, operated in the step-and-integrate (step-scan) mode in which the moving mirror wasdriven by a precise stepping motor so that there was noneed for any fringe referencing. It allowed spectra to bemeasured at resolutions up to ¾0.1 cm�1. It may be notedthat efficient vibration isolation was needed to obtain thebest performance of this instrument.
These two instruments were so successful that theyspawned a number of other slow-scan or step-scan inter-ferometers for far-infrared spectrometry made by Beckman-RIIC in the UK, Coderg in France, and Polytec in Germany.By the mid-1970s, however, they started to be super-seded by rapid-scanning interferometers that had startedto gain popularity for mid-infrared measurements. Sincethese instruments are identical to most rapid-scanning inter-ferometers used for mid-infrared spectrometry, and theseinstruments were described in the article by Jackson3 inthis Handbook, we will not consider their design here.
3.2 Beamsplitters for far-infraredinterferometers
The biggest drawback to the use of Michelson interferom-eters for far-infrared spectrometry was the low efficiencyof Mylar beamsplitter. The modulation efficiency of theinterferometer, h�Qn�, is given by 4 R0(Qn) T0�Qn�, where R0�Qn�and T0�Qn�, are the reflectance and transmittance of thebeamsplitter at wavenumber Qn, respectively. The maximumefficiency is found when R0�Qn� D T0�Qn�, D 0.5, in whichcase h�Qn� D 1.
The sinusoidal variation of modulation efficiency withwavenumber is known variously as “interference fringes”,“channel spectra”, “dielectric resonances” and “Fabry-Perotfringes”. If one considers the waves on a non-absorbing,parallel-sided sheet of a dielectric, the reflectance andtransmittance are:
R0 D 2R2�1 � cos υ�
1 C R2 � 2R cos υ�2�
and
T0 D �1 � R�2
1 C R2 � 2R cos υ�3�

S0207-
Instrumentation for Far-infrared Spectroscopy 5
where υ D 4p Qnnt d cos qt is the relative phase shift (inradians) between two adjacent emerging rays, d is thethickness of the film, nt is its refractive index, and qt isthe angle of the beam inside the film to the surface normal.The beamsplitter efficiency has maxima at υ D �2m � 1�pand minima at υ D 2mp, for m D 1, 2, 3, . . .
Radiation polarized with its electric field polarized paral-lel to the plane of incidence is denoted by p, while radiationpolarized with its electric field polarized perpendicular tothe plane of incidence is denoted by s. For any non-zeroangle of incidence at the beamsplitter, the reflectance forp- and s-polarized radiation have different forms.
Rp D tan2�qi � qt�
tan2�qi C qt��4�
and
Rs D sin2�qi � qt�
sin2�qi C qt��5�
where qi and qt are the angles of incidence and trans-mission, respectively, and are related by n D sin qt/sin qt.In a conventional Michelson interferometer, qi D 45°. Therefractive index of PET is about 1.6 and the index of absorp-tion k D 0 at most wavenumbers in the far-infrared. Thisyields Rp D 0.013 and Rs D 0.115. At a maximum in thebeamsplitter response:
T0 D(
1 � R
1 C R
)2
�6�
The relative beamsplitter efficiencies of a PET beamsplit-ter for the two polarizations are summarized in Table 1.It can be seen that, because of the large difference inefficiencies for the p and s polarizations, a Michelson inter-ferometer equipped with a PET beamsplitter is far moreeffective for s-polarized than p-polarized radiation.
Figure 3 shows the variation in the calculated efficiencyof four common Mylar beamsplitters as a function ofwavenumber for s-polarized radiation. To cover the entirefar-infrared region from 400 to 10 cm�1 with a beamsplitterefficiency greater than 0.5, it can be seen that severalbeamsplitters must be used. The spectral range typicallycovered by Mylar beamsplitters is shown in Table 2. At
Table 1. The beamsplitter efficiencies for pand s polarizations for a PET beamsplitter(nt D 1.6) for a conventional 45° Michelsoninterferometer.
Polarization R0 T0 4 R0T0
P 0.052 0.95 0.20s 0.37 0.63 0.93None 0.29 0.71 0.83
1.0
0.8
0.6
4R0T
0
0.4
0.2
0 200 400 600
Frequency (cm−1)
800 1000
23 µm 12 µm 6 µm 3.5 µm
Figure 3 Variation in the efficiency of 3-µm, 6-µm, 12-µm and25-µm Mylar beamsplitters as a function of wavenumber fors-polarized radiation.
Table 2. Spectral range covered by Mylar
beamsplitters of different thicknesses.
Thickness (µm) Spectral range (cm�1)
3 450–1206 450–120
12.5 225–6025 100–3050 50–15
100 25–8
long wavelengths (>200 µm), where the efficiency of thesebeamsplitters is poor and blackbody sources are weak,measurements become quite difficult. Measurement of afar-infrared spectrum over the full range from 400 to10 cm�1 using Mylar beamsplitters requires five differentbeamsplitters, as shown in Table 2.
The beamsplitter efficiency may be improved if a mate-rial with a larger refractive index than Mylar is used. Thedata in Figure 4 show the variation of R0 and T0 for boths- and p-polarized radiation as a function of the refrac-tive index of the material from which the beamsplitter isfabricated for incidence angles of 45° and 15°. The differ-ence between the values of R0 for s and p polarization (R0s
and R0p, respectively) may be reduced not only by choos-ing a material with higher refractive index such as silicon(n ¾ 3.4) or germanium (n ¾ 4.0), but also by reducingthe angle of incidence at the beamsplitter. The values ofR0s and R0p are much more similar at 15° incidence, but todesign an interferometer for which the incidence angle isso small is not trivial.
Several manufacturers of FT-IR spectrometers haveapplied variants of this technology in their far-infraredspectrometers. For example, Nicolet Instrument Corpora-tion (Madison, WI, USA)4 have used solid silicon platesfor their far-infrared beamsplitters. (Thick Ge plates can-not be used as far-infrared beamsplitters because of the

S0207-
6 Instrumentation for Mid- and Far-Infrared Spectroscopy
θi = 45°
θi = 15°R0s
R0p
R0
(ideal)
1.0
0.8
0.6
0.4
0.2
0.01 2
Mylar Si
3
n
4
Figure 4 Variation of R0 for s- and p-polarized radiation asa function of the refractive index of the material from whichthe beamsplitter is fabricated at 45° and 15° incidence. Note themuch smaller difference between the values of R0s and R0p at anincidence angle of 15° compared to 45°.
strong phonon absorption of germanium.) If the Si plateis several millimeters thick, then the beamsplitter responseconsists of many closely spaced cycles (spacing ¾0.7 cm�1
for a 2-mm piece of silicon) that gives a single-beambackground spectrum that is quite unsuitable for spectro-scopic applications. If the resolution required is less thanthis spacing, e.g., Qn � ¾2 cm�1, then only the averagebeamsplitter response of 4R0T0 ¾ 0.73 is observed overessentially the entire wavenumber range. This beamsplit-ter has excellent long-wavelength response and has been
Silicon (2 mm)
3.5 µm Mylar
12 µm Mylar
∆ν= 2 cm−1∼
1.5
1.0
0.5
0 200 400
Frequency (cm−1)600
Inte
nsity
(ar
b. u
nits
)
Figure 5 Comparison of single-beam spectra measured with a3-µm and 12-µm Mylar film and a 2-mm thick silicon beam-Q3splitter. Note that the silicon beamsplitter covers a much widerspectral range than either of the Mylar beamsplitters.
used to obtain spectral information down to 1 cm�1. Pro-vided that the sides are highly parallel, this beamsplittershould operate continuously into the mid-infrared, with theexception of a strong phonon band at ¾620 cm�1. Except inthose cases where very high resolution is required, a thickSi beamsplitter can replace all of the Mylar beamsplitters,as demonstrated by the data in Figure 5.
If high resolution is required, however, the Si beamsplit-ter should be only a few micrometers in thickness and itis difficult to produce a free-standing Si film with highlyparallel surfaces that is so thin. To circumvent this prob-lem, Bruker Optics (Karlsruhe, Germany) have depositeda thin film of germanium onto a PET substrate. The resultis a multilayer dielectric germanium beamsplitter that hasall the advantages of the thick beamsplitter discussed pre-viously, but it can be used for measurements at higherresolution and, because of the very thin germanium coating,the absorption caused by phonons is minimal. The improvedefficiency at long wavelength that is achieved after coatinga 6- µm Mylar beamsplitter with a thin film of germaniumis seen by the data in Figure 6. The inset in this figure isfor the same source/detector combination, only with a filtercooled to 4.2 K with a100-cm�1 cut-off in place. Cuttingoff the high frequency region of the spectrum shows theadvantage of the coated beamsplitter at low frequency evenmore effectively.
Using a similar rationale, Perkin-Elmer (Beaconsfield,UK) have successfully vapor-deposited thin irregular metallayers on a stretched polypropylene (PP) substrate for use as
0
2
4
6
200 400 600
Inte
nsity
(ar
b. u
nits
)
Frequency (cm−1)
Ge/Mylar
∆ν = 2 cm−1∼
00.0
0.5
1.0
1.5
2.0
20 40 60 80 100
Mylar
Figure 6 Single-beam spectra measured with an uncoated 6-µmMylar beamsplitter and the same material coated with a thin layerof germanium. (Inset) The single-beam spectrum measured withthe same source/detector combination, only with a filter cooled to4.2 K with a 100-cm�1 cut-off in place.

S0207-
Instrumentation for Far-infrared Spectroscopy 7
a beamsplitter with wide wavelength coverage. Both metalmesh and metal layers deposited in a “polka-dot” pattern ona dielectric substrate can make very efficient beamsplittersat long wavelengths. Metal layers deposited in a “polka-dot” pattern are essentially the inverse of a metal mesh.Either a metal mesh or the polka-dot require an optimizedpattern for high efficiency.
3.3 Rapid-scanning interferometers forfar-infrared spectrometry
Even though excellent spectra were measured using theinterferometers described in the previous section, the out-standing performance of laser-referenced rapid scanninginterferometers for mid- and near-infrared spectrometry ledinstrument manufacturers to modify these instruments forfar-infrared operation. At first, the only change made inthe interferometer when switching from mid-infrared tofar-infrared operation was the substitution of a Mylar
beamsplitter for the Ge/KBr beamsplitter. At first, how-ever, the performance of these instruments was quite poorbecause of several effects. First, as noted in the previoussection, the efficiency of the Mylar beamsplitter is poor.Secondly, the Mylar film (which is stretched taut but isstill quite flexible) can be easily set into vibration when themoving mirror reaches the end of its scan and is rapidlydecelerated, causing the interferogram to be extremely unre-producible. (This effect has been called “drum-heading”.)
In principle, the optical bench of a far-infrared canbe either evacuated or purged to eliminate water vapor.For many reasons, however, evacuated instruments are farpreferable to purged spectrometers for far-infrared opera-tion. For example, it is extremely difficult to remove alltraces of water vapor from the single-beam spectrum andthe effect of residual rotational lines of water vapor arecommonly seen in ratioed spectra, especially when theyare measured at high resolution. Furthermore, in a purgedsystem vibrations caused by the incoming gas can createa real problem, leading to artifacts in the spectrum. Evenlow-frequency vibrations caused by the effect of peoplewalking near the instrument and building vibrations also ledto interferences below 200 cm�1, so that careful vibrationand electrical isolation is called for. Finally, another factorthat degrades the performance of far-infrared spectrometersbased on rapid-scanning interferometers is interference byharmonics of the line frequency (60 Hz in the USA, 50 Hzin the UK). When the velocity of the moving mirror is setto give a laser frequency of 5 kHz (the most common veloc-ity for operation with a pyroelectric detector), the “glitch”caused by the 60-Hz interference is at ¾190 cm�1, whichis right in the middle of the far-infrared region.
Some of these problems were easily overcome. The turn-around of contemporary interferometers is far smoother andsevere drum-heading is less commonly seen in contempo-rary interferometers. To a greater or lesser effect, however,drum-heading is still frequently seen even in contempo-rary interferometers. The effect of vibrations and electricalinterference has been overcome by better mechanical andelectronic design. Evacuated instruments were designed andbuilt to preclude interference by water vapor. The perfor-mance was still rather poor, however, because of the lowefficiency of PET beamsplitters. If measurements are onlyrequired down to 180 cm�1, beamsplitters made with ananalogous optical design to mid-infrared beamsplitters canbe used, with CsI replacing the KBr substrate and compen-sator plate and a thicker layer of germanium being used. Formeasurements below ¾180 cm�1, however, either Mylar
or some of the special beamsplitters described in the previ-ous section, are required.
3.4 The Genzel interferometer
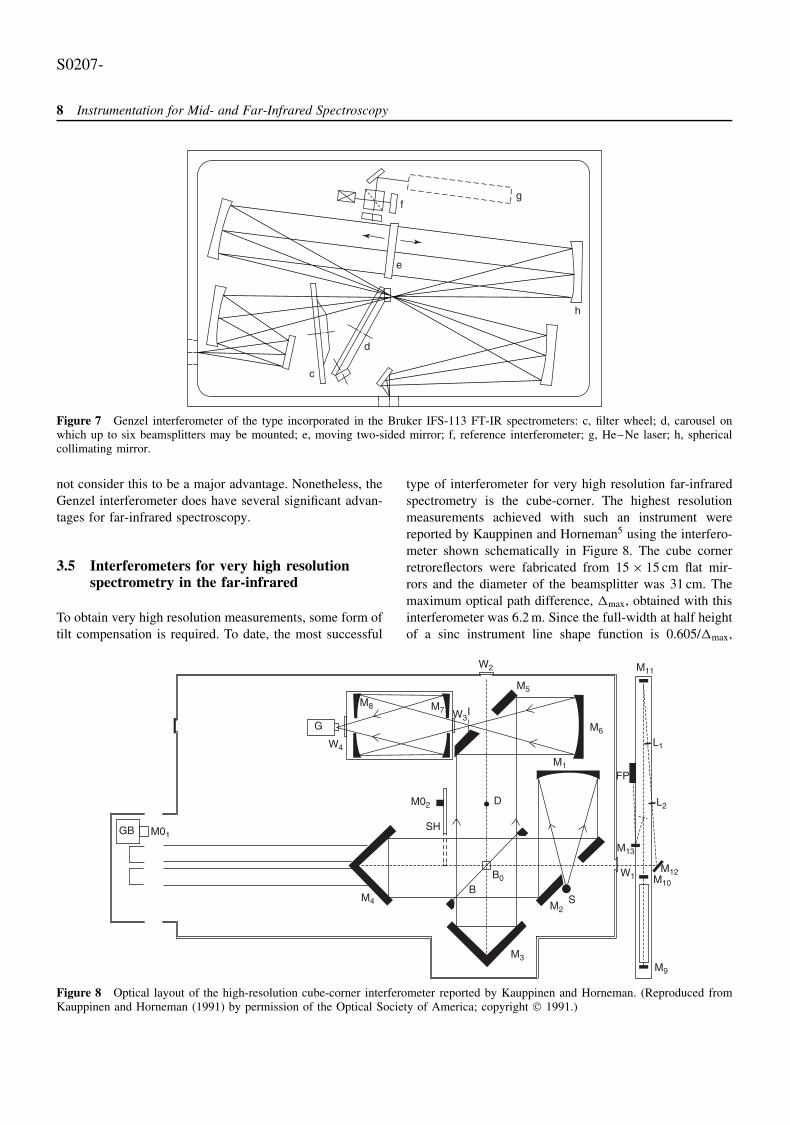
Another innovative concept for far-infrared spectroscopyis being used by Bruker in their in their IFS113v spec-trometer which incorporates a Genzel interferometer. Thedesign of this instrument is shown in Figure 7. Unlike astandard Michelson interferometer where the light is col-limated at the beamsplitter and is never focused until itemerges, in the Genzel interferometer the light is focusedonto the beamsplitter. The beams that are transmitted andreflected by the beamsplitter pass to two collimating mirrorsand hence to a double-sided moving mirror. As the mirrormoves, the path in one arm increases and the path in theother arm decreases. The small size of the beamsplitter inthe Genzel interferometer allows several beamsplitters tobe mounted on a wheel and interchanged without break-ing the vacuum. The reduction in size significantly reducesthe amplitude of the drum-head vibrations commonly asso-ciated with large-diameter Mylar beamsplitters. Anotherfeature of the Genzel interferometer is that the angle ofincidence at the beamsplitter (¾15°) is much smaller than astandard Michelson interferometer. This has the advantageof reducing the difference between the s and p polariza-tions (as shown in Figure 4), allowing optical polarizationstudies without having to reorient the sample.
For a displacement, x, of the moving mirror, an opticalpath difference of 4x is generated by the Genzel interfer-ometer. Although this has been claimed as an advantagefor the Genzel over the Michelson interferometer, any tiltintroduced on moving the mirror leads to a doubling of theerror in comparison to the error introduced in a standardMichelson interferometer with the same tilt. Thus we do
S0207-
8 Instrumentation for Mid- and Far-Infrared Spectroscopy
gf
e
h
d
c
Figure 7 Genzel interferometer of the type incorporated in the Bruker IFS-113 FT-IR spectrometers: c, filter wheel; d, carousel onwhich up to six beamsplitters may be mounted; e, moving two-sided mirror; f, reference interferometer; g, He–Ne laser; h, sphericalcollimating mirror.
not consider this to be a major advantage. Nonetheless, theGenzel interferometer does have several significant advan-tages for far-infrared spectroscopy.
3.5 Interferometers for very high resolutionspectrometry in the far-infrared
To obtain very high resolution measurements, some form oftilt compensation is required. To date, the most successful
type of interferometer for very high resolution far-infraredspectrometry is the cube-corner. The highest resolutionmeasurements achieved with such an instrument werereported by Kauppinen and Horneman5 using the interfero-meter shown schematically in Figure 8. The cube cornerretroreflectors were fabricated from 15 ð 15 cm flat mir-rors and the diameter of the beamsplitter was 31 cm. Themaximum optical path difference, max, obtained with thisinterferometer was 6.2 m. Since the full-width at half heightof a sinc instrument line shape function is 0.605/max,
M13
W2
W4
W1
W3I
GB
S
G
SH
D
B0
B
FP
M01
M02
M8 M7
M5
M6
M1
M10
M4
M3
M11
L1
L2
M12
M9
M2
Figure 8 Optical layout of the high-resolution cube-corner interferometer reported by Kauppinen and Horneman. (Reproduced fromKauppinen and Horneman (1991) by permission of the Optical Society of America; copyright 1991.)
S0207-
Instrumentation for Far-infrared Spectroscopy 9
0.00095 cm−1
61.425−0.05
−0.00
0.05
0.10
0.15
0.20
0.25
0.30
61.420
Wavenumber (cm−1)
61.415
Abs
orba
nce
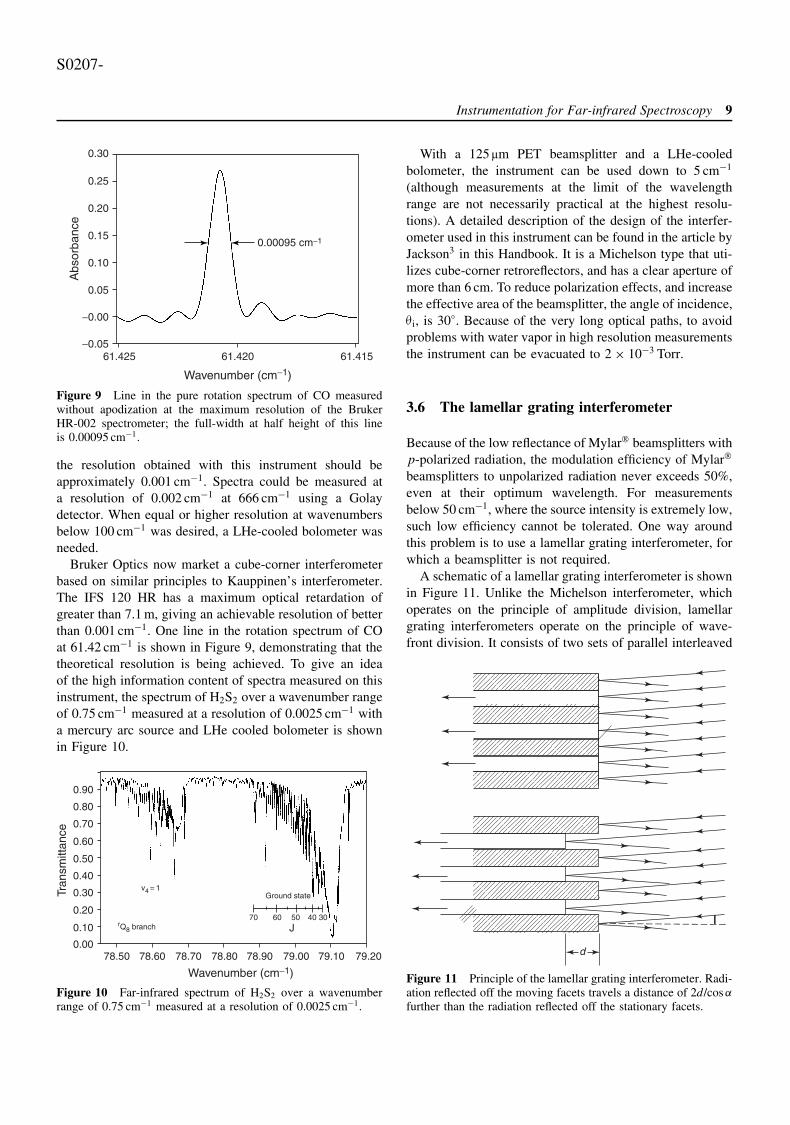
Figure 9 Line in the pure rotation spectrum of CO measuredwithout apodization at the maximum resolution of the BrukerHR-002 spectrometer; the full-width at half height of this lineis 0.00095 cm�1.
the resolution obtained with this instrument should beapproximately 0.001 cm�1. Spectra could be measured ata resolution of 0.002 cm�1 at 666 cm�1 using a Golaydetector. When equal or higher resolution at wavenumbersbelow 100 cm�1 was desired, a LHe-cooled bolometer wasneeded.
Bruker Optics now market a cube-corner interferometerbased on similar principles to Kauppinen’s interferometer.The IFS 120 HR has a maximum optical retardation ofgreater than 7.1 m, giving an achievable resolution of betterthan 0.001 cm�1. One line in the rotation spectrum of COat 61.42 cm�1 is shown in Figure 9, demonstrating that thetheoretical resolution is being achieved. To give an ideaof the high information content of spectra measured on thisinstrument, the spectrum of H2S2 over a wavenumber rangeof 0.75 cm�1 measured at a resolution of 0.0025 cm�1 witha mercury arc source and LHe cooled bolometer is shownin Figure 10.
78.500.00
0.10
0.20
0.30
0.40
0.50
0.60
0.70
0.80
0.90
78.60 78.70 78.80 78.90 79.00 79.10 79.20
Tran
smitt
ance
70 60 50 40 30
J
Ground statev4 = 1
rQ8 branch
Wavenumber (cm−1)
Figure 10 Far-infrared spectrum of H2S2 over a wavenumberrange of 0.75 cm�1 measured at a resolution of 0.0025 cm�1.
With a 125 µm PET beamsplitter and a LHe-cooledbolometer, the instrument can be used down to 5 cm�1
(although measurements at the limit of the wavelengthrange are not necessarily practical at the highest resolu-tions). A detailed description of the design of the interfer-ometer used in this instrument can be found in the article byJackson3 in this Handbook. It is a Michelson type that uti-lizes cube-corner retroreflectors, and has a clear aperture ofmore than 6 cm. To reduce polarization effects, and increasethe effective area of the beamsplitter, the angle of incidence,qi, is 30°. Because of the very long optical paths, to avoidproblems with water vapor in high resolution measurementsthe instrument can be evacuated to 2 ð 10�3 Torr.
3.6 The lamellar grating interferometer
Because of the low reflectance of Mylar beamsplitters withp-polarized radiation, the modulation efficiency of Mylar
beamsplitters to unpolarized radiation never exceeds 50%,even at their optimum wavelength. For measurementsbelow 50 cm�1, where the source intensity is extremely low,such low efficiency cannot be tolerated. One way aroundthis problem is to use a lamellar grating interferometer, forwhich a beamsplitter is not required.
A schematic of a lamellar grating interferometer is shownin Figure 11. Unlike the Michelson interferometer, whichoperates on the principle of amplitude division, lamellargrating interferometers operate on the principle of wave-front division. It consists of two sets of parallel interleaved
d
Figure 11 Principle of the lamellar grating interferometer. Radi-ation reflected off the moving facets travels a distance of 2d/cos afurther than the radiation reflected off the stationary facets.

S0207-
10 Instrumentation for Mid- and Far-Infrared Spectroscopy
mirrors, or facets. One set is fixed, while the other set canmove in a direction perpendicular to the plane of the fixedfacets. When the moving facets have traveled a distanced, the path difference between the rays that strike the fixedfacets and the rays that strike the moving facets is 2d/cos a,where a is the angle of incidence of the median ray ofthe beam. Because almost all the radiation from the sourcereaches the detector, the efficiency of a lamellar grating canbe significantly higher than that of a Michelson interferom-eter with a PET beamsplitter.
The low-wavenumber cut-off QnL of a lamellar interfer-ometer is determined by the cavity effect, by which themodulation of waves whose electric vector is parallel to thesides of the cavity starts to decrease. This occurs when QnL <�0.3a��1, where a is the grating constant. Thus if the facetsare 1 cm across, QnL ¾ 3 cm�1. The lowest frequency thathas been measured with a lamellar grating spectrometer is1.5 cm�1. The high-wavenumber limit results from the factthat the grating can be considered as a series of long rect-angular slits. Diffraction of the beam at this grating resultsin the interference being cancelled at the exit aperture. Thehigh-wavenumber limit QnH is given by F/aS, where F is thefocal length of the collimator and s is the diameter of theexit aperture. In practice, QnH rarely exceeds about 150 cm�1.
The lamellar grating interferometer is the instrument ofchoice for measurements made below about 20 cm�1, andBeckman-RIIC once sold one of these instruments (the FS-820) that was optimized for this spectral region. However,there now is little interest in the measurement of spectra atsuch long wavelengths, and there are no instruments of thistype currently available commercially.
One other instrument that was developed in the late1960s and early 1970 was the Martin-Puplett polarizinginterferometer.6 This instrument is described in some detailby Polavarapu7 and will not be described here. Suffice it tosay that, like the lamellar grating spectrometer, the perfor-mance of the polarizing interferometer in the far infrared isalso not limited by the poor efficiency of the PET beamsplit-ter and excellent results were obtained on this instrument.
4 WINDOW MATERIALS FORFAR-INFRARED SPECTROMETRY
Since NaCl and KBr are opaque below ¾650 and¾380 cm�1, respectively, they cannot be used as windowmaterials for far-infrared spectroscopy. Cesium iodide istransparent to about 150 cm�1 and hence can be used, notonly as a window for measurements down to this wavenum-ber, but also for the preparation of alkali halide disks.
Silicon cuts on below 400 cm�1 and is often useful,although its high refractive index does lead to some lossof energy. Both quartz and sapphire also transmit at long
wavelength. Diamond is transparent throughout the entirefar-infrared. However, its small size and high cost preventsit from being a general-purpose window. The main useof bulk diamonds for far-infrared spectrometry has beenas a window of a Golay detector. On the other hand,thin diamond films may be fabricated by chemical vapordeposition, have high strength and are not extortionatelyexpensive.
The best general purpose window material for far-infrared spectroscopy is polyethylene. High-density poly-ethylene (HDPE) is often used as a window for gas andliquid cells; however, this material has a fairly weak crystallattice mode at 72 cm�1. When windows are at least 5 mmthick, the transmittance of this band can be less than 50%.Low-density polyethylene (LDPE) has lower crystallinitythan HDPE, so that this band is far weaker in LDPE thanHDPE. As a result, however, LDPE is also less rigid andnot as suitable as HDPE as a window material. The melt-ing point of LDPE is about 140 °C and so this material iseasily melted. One useful way of preparing solid samplesfor far-infrared spectroscopy is to grind them with pow-dered LDPE and compress the mixture while heating it toabout 140 °C. In view of the fact that blackbody sourcesemit much higher power in the mid- than the far-infraredregion of the spectrum, it is often preferable to remove asmuch of the short-wavelength radiation as possible if verylong wavelengths are to be measured. In this case, blackpolyethylene, of the type commonly used in garbage col-lection bags, comes in useful as an optical filter since itabsorbs most of the energy above about 600 cm�1 whilehaving a transmittance greater than 50% below 200 cm�1.
Two other polyolefins that have been proposed for useas windows for far-infrared spectrometry are PP and poly-(4-methyl-pentene-1), or TPX. These materials are struc-turally related as 4-methyl-pentene-1 is a propylene dimer.These materials have one great advantage over polyethy-lene for use as a window. Whereas polyethylene is typicallybarely translucent, PP and TPX are transparent to visiblelight. TPX is significantly more susceptible to air oxida-tion when illuminated with ultraviolet light, so that if amercury lamp is used as the source, optical filtering, e.g.,with black polyethylene, is necessary. Many far-infraredspectroscopists tend to use PP thin films in preference toTPX when used in a vacuum, since PP has a fairly highburst pressure.
5 SUMMARY
Fourier transform spectrometers developed in three distinctspectral regions in the early 1960s. Pierre Connes and hisco-workers in France developed remarkably sophisticatedstep-scan interferometers that permitted near-infrared

S0207-
Instrumentation for Far-infrared Spectroscopy 11
spectra to be measured with a resolution of better than0.01 cm�1. These instruments may be considered the fore-runners of the step-scan interferometers made by Bruker,Bio-Rad (Cambridge, MA, USA) and Nicolet although theirprincipal application was in the field of astronomy. Low-resolution rapid-scanning interferometers were developedby Larry Mertz and his colleagues at Block Engineering(Cambridge, MA, USA) for remote sensing. Nonetheless,the FT-IR spectrometers that are so prevalent in chemicallaboratories today are direct descendents of these instru-ments. The interferometers that were developed for far-infrared spectrometry in Gebbie’s laboratory have had nocommercial counterparts for at least 15 years. However,it could be argued that these instruments did as much todemonstrate the power of Fourier transform spectroscopy tothe chemical community as any of the instruments devel-oped for mid- and near-infrared spectrometry. Their per-formance was every bit as good as today’s rapid-scanninginterferometers. However, the market for these instrumentsis so small today that it has proved more lucrative tomodify rapid-scanning interferometers that were originallydesigned for mid-infrared spectrometry than to competewith these instruments with slow continuous scan or step-scan interferometers.
ABBREVIATIONS AND ACRONYMS
DTGS Deuterated Triglycine SulfateFT-IR Fourier Transform Infrared
HDPE High-density PolyethyleneLDPE Low-density PolyethyleneLHe Liquid HeliumNEP Noise Equivalent PowerNPL National Physical LaboratoryPET Poly(ethylene terephthalate)PP PolypropyleneRIIC Research and Industrial
Instruments Co.S/N Signal-to-noise Ratio
REFERENCES
1. G.P. Williams, ‘Synchrotron and Free Electron Laser Sourcesof Infrared Radiation’, in “Handbook of Vibrational Spec-troscopy”, John Wiley and Sons, Chichester, Vol. 1 (2001).
2. P.R. Griffiths and J.A. de Haseth, ‘Fourier Transform InfraredSpectrometry’, Wiley Interscience, New York, 209–212(1986).
3. R.S. Jackson, ‘Continuous-scanning Interferometers for Mid-infrared Spectrometry’, in “Handbook of Vibrational Spec-troscopy”, John Wiley and Sons, Chichester, Vol. 1 (2001).
4. Nicolet Instrument Corporation, US Patent 4632553. Q2
5. J. Kauppinen and V.-M. Horneman, Appl. Opt., 30, 2575(1991).
6. D.H. Martin and E. Puplett, Infrared Phys., 10, 105 (1969).
7. P. Polavarapu, ‘Polarization Interferometers for InfraredSpectrometry’, in “Handbook of Vibrational Spectroscopy”,John Wiley and Sons, Chichester, Vol. 1 (2001).