instrumentation in raman spectroscopy, part 2: how to...
TRANSCRIPT

14th June, 2012 Raman spectroscopy applied to Earth sciences and cultural heritage – M.C. Caumon 1/20
Instrumentation in Raman spectroscopy, part 2:
how to calibrate your spectrometer.
Jean Dubessy, Marie-Camille Caumon,
Shiv Sharma, Fernando Rull

14th June, 2012 Raman spectroscopy applied to Earth sciences and cultural heritage – M.C. Caumon 2/27
Introduction
• Raman spectroscopy provides information on:
– Molecules or minerals and their physical-chemical environment
– Quantities or proportions of each compound
– Geometry (crystal)
– Spatial arrangement
• Expected information:
– Number of peaks
– Peak position (Raman shift, cm-1)
– Peak intensity (relative or absolute)
– Spatial positioning (x, y, z)
2500 3000 3500 40000
2k
4k
H2
CH4
N2
Raman shift (cm-1)
inte
nsit
y (
a.u
.)
1/3 N2
1/3 CH4
1/3 H2

14th June, 2012 Raman spectroscopy applied to Earth sciences and cultural heritage – M.C. Caumon 3/27
Introduction
• Required to know:
– Spectral resolution
– Raman shift wavenumber accuracy and precision
– Intensity response of the device used (spectrometer, optics, sampling
system)
– Confocality (z: axial resolution)
– Spatial resolution (x, y: lateral resolution)
• Depend on:
– Optics (mirrors, objectives, optical geometry)
– Spectrometer (grating, detector, focal length of the spectrometer, slit
and confocal apertures)
– Excitation wavelength (laser)
– Time
– Temperature
Must be determined at least once but more often depending on:
- Time stability of the device- Required precision and accuracy

14th June, 2012 Raman spectroscopy applied to Earth sciences and cultural heritage – M.C. Caumon 4/27
Outline
1. Raman shift wavenumber calibration:
• Detector
• Laser
2. Raman intensity calibration:
• spectrometer response
• cross section
3. Spectral resolution
4. Confocality: axial resolution
5. Spatial resolution : lateral resolution
14th June, 2012 Raman spectroscopy applied to Earth sciences and cultural heritage – M.C. Caumon 5/27
Outline
1. Raman shift wavenumber calibration:
• Detector
• Laser
2. Raman intensity calibration:
• spectrometer response
• cross section
3. Spectral resolution
4. Confocality: axial resolution
5. Spatial resolution : lateral resolution

14th June, 2012 Raman spectroscopy applied to Earth sciences and cultural heritage – M.C. Caumon 6/27
1. Raman shift wavenumber
•Raman shift wavenumber depends on laser wavelength:
•Raman wavelength λR, j scattering by grating :
jR,ν
jRjR
jRabs
jR
jR
,0,
,0,
,
11
11
λλν
νννλ
−=
−==
Parameters to be known:
•CCD pixels’ correspondence to wavelength and grating position
•Exact laser wavelength
grating
CCD

14th June, 2012 Raman spectroscopy applied to Earth sciences and cultural heritage – M.C. Caumon 7/27
1. Raman shift wavenumber
The scattered beam highlights the CCD along the largest dimension:
CCD image of a Ne lamp emission
pixel
Raman shift (cm-1)3130 3480
0 1024pixel
Raman spectrum of a Ne lamp
?
14th June, 2012 Raman spectroscopy applied to Earth sciences and cultural heritage – M.C. Caumon 8/27
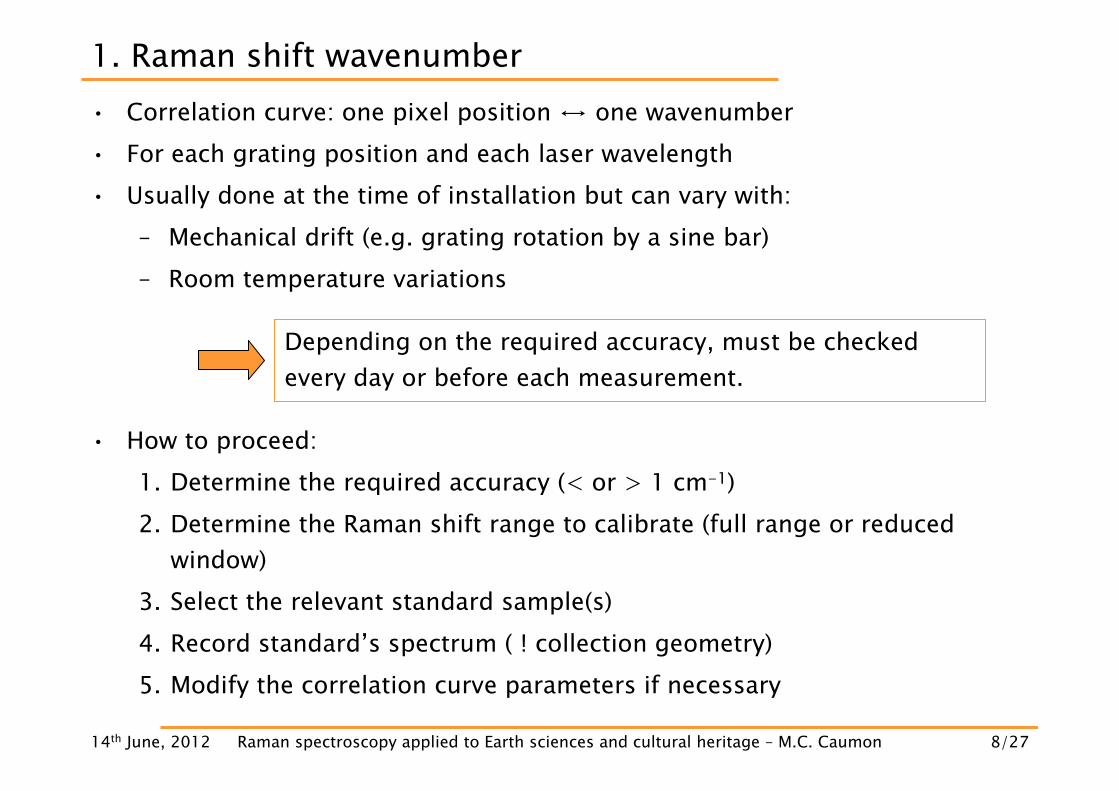
• How to proceed:
1. Determine the required accuracy (< or > 1 cm-1)
2. Determine the Raman shift range to calibrate (full range or reduced
window)
3. Select the relevant standard sample(s)
4. Record standard’s spectrum ( ! collection geometry)
5. Modify the correlation curve parameters if necessary
1. Raman shift wavenumber
• Correlation curve: one pixel position ս one wavenumber
• For each grating position and each laser wavelength
• Usually done at the time of installation but can vary with:
– Mechanical drift (e.g. grating rotation by a sine bar)
– Room temperature variations
Depending on the required accuracy, must be checked
every day or before each measurement.

14th June, 2012 Raman spectroscopy applied to Earth sciences and cultural heritage – M.C. Caumon 9/27
• Low accuracy (> 1 cm-1) and/or full range:
– Silicon wafer (520.7 ± 0.5 cm-1)
– Air: O2 (1555 ± 1 cm-1) and N2 (2332 ± 1 cm-1)
– Laser (0 cm-1)
– Organic compounds (e.g. cyclohexane, polystyrene)
1. Raman shift wavenumber
Modify (slightly) the correlation curve parameters to fit the exact peak position.
15
60
105
1300 1600 1900 2200 2500
inte
nsi
ty (
a.u.
)
Raman shift wavenumber (cm-1)
O2
N2

14th June, 2012 Raman spectroscopy applied to Earth sciences and cultural heritage – M.C. Caumon 10/27
1. Raman shift wavenumber
284.1 ± 0.78 1444.4 ± 0.30
426.3 ± 0.41 2664.4 ± 0.42
801.3 ± 0.96 2852.9 ± 0.32
1028.3 ± 0.45 2923.8 ± 0.36
1157.6 ± 0.45 2938.3 ± 0.51
1266.34 ± 0.94
Cyclohexane Raman spectrum: Cyclohexane Raman peaks’ positions (cm-1) from ASTM E 1840-96:
Correlation curves obtained from cyclohexane using a multiplexed VPH grating.
Inte
nsit
y (
a.u
.)
Raman shift (cm-1)

14th June, 2012 Raman spectroscopy applied to Earth sciences and cultural heritage – M.C. Caumon 11/27
1. Raman shift wavenumber
How to proceed:
1. Fit the standard peaks (Lorentzian)
2. Correlate the measured peak positions to the expected ones
Accuracy close to the spectrometer spectral resolution can be reach.
• High accuracy (< 1 cm-1):
– Ne, Ar, Hg, etc. lamps
– Gas laser atomic emission lines
NeonAr+ laser

14th June, 2012 Raman spectroscopy applied to Earth sciences and cultural heritage – M.C. Caumon 12/27
1. Raman shift wavenumber
• Gas lasers: atomic emission stable over a long period of time and known
with an accuracy ~1pm (0.04 cm-1 at 500 nm)
• Solid and semi-conductor lasers: less stable with time
⇒ emission wavelength must be checked (and corrected)
Laser wavelengthLaser wavelengthLaser wavelengthLaser wavelength
How to proceed:
1. Calibrate the Raman shift wavenumber (detector)
2. Select a relevant standard sample (organic compounds)
3. Record the spectrum of the standard
4. Modify the laser wavelength to reach the best correspondence
between the measured and expected peak positions of the
standard.

14th June, 2012 Raman spectroscopy applied to Earth sciences and cultural heritage – M.C. Caumon 13/27
Outline
1. Raman shift wavenumber calibration:
• Detector
• Laser
2. Raman intensity calibration:
• spectrometer response
• cross section
3. Spectral resolution
4. Confocality: axial resolution
5. Spatial resolution : lateral resolution
14th June, 2012 Raman spectroscopy applied to Earth sciences and cultural heritage – M.C. Caumon 14/27
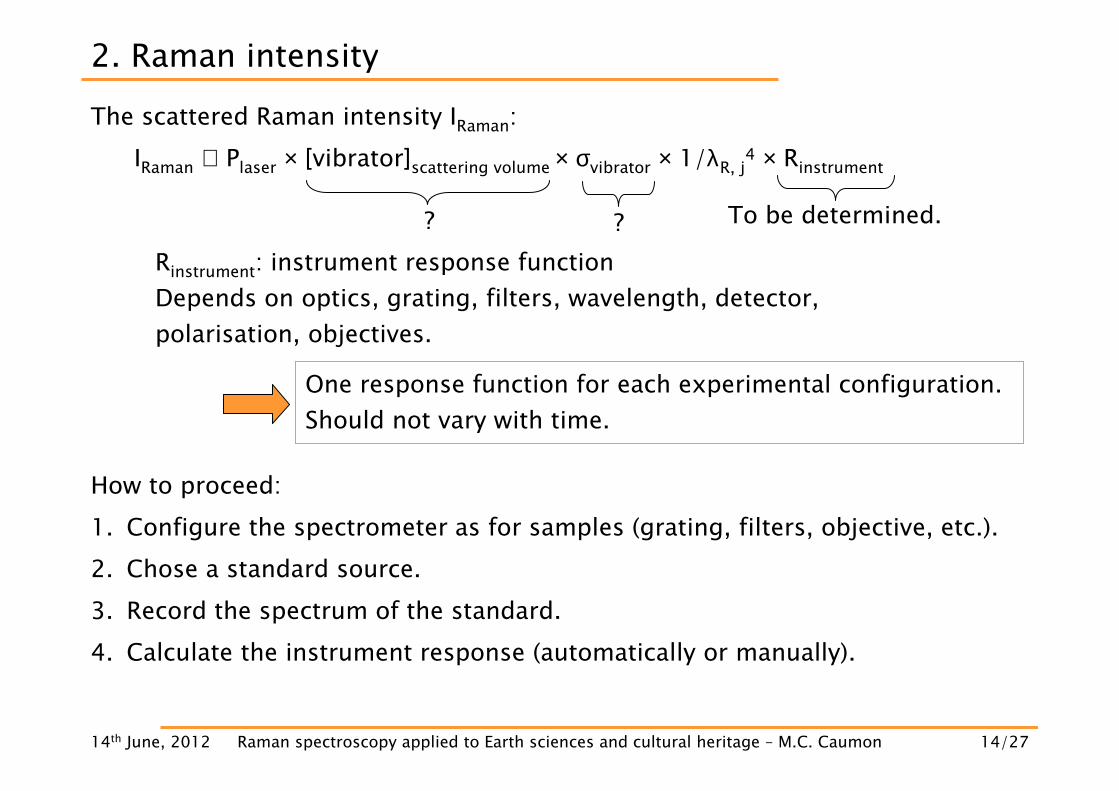
2. Raman intensity
The scattered Raman intensity IRaman:
IRaman ∝ Plaser × [vibrator]scattering volume × σvibrator × 1/λR, j4 × Rinstrument
? ? To be determined.
One response function for each experimental configuration.
Should not vary with time.
How to proceed:
1. Configure the spectrometer as for samples (grating, filters, objective, etc.).
2. Chose a standard source.
3. Record the spectrum of the standard.
4. Calculate the instrument response (automatically or manually).
Rinstrument: instrument response function
Depends on optics, grating, filters, wavelength, detector,
polarisation, objectives.

14th June, 2012 Raman spectroscopy applied to Earth sciences and cultural heritage – M.C. Caumon 15/27
2. Raman intensity
• Instrument response R = Imeasured/Itrue vs. λ.
Standard source:
White lamp (tungsten): do not reproduce sample positioning
Luminescent standards: laser wavelength and temperature dependants
HCA Kaiser Optical Systems, Inc.
Example of a system to ensure
a reproducible positioning of
the source:

14th June, 2012 Raman spectroscopy applied to Earth sciences and cultural heritage – M.C. Caumon 16/27
2. Raman intensity
Ex: cyclohexane with 2 ≠ lasers:
• When to measure instrument response?
– To compare spectra of one sample recorded
• on different spectrometers
• using different lasers ( ! λ4)
– To determine true σ Raman cross section

14th June, 2012 Raman spectroscopy applied to Earth sciences and cultural heritage – M.C. Caumon 17/27
2. Raman intensity• Semi-quantitative measurements: internal standard
• First require to record calibration curves
IRaman ∝ Plaser × [vibrator]scattering volume × σvibrator × 1/λR, j4 × Rinstrument
IA/IB = ([A] × σ*A)/([B] × σ*B)
with σ*A (and σ*B) = σA × Rinstrument × 1/λR, A4
(effective Raman cross section of A)
CO2 solubility (mol/kg) in water.Internal standard: water
From Isabelle Daniel

14th June, 2012 Raman spectroscopy applied to Earth sciences and cultural heritage – M.C. Caumon 18/27
Outline
1. Raman shift wavenumber calibration:
• Detector
• Laser
2. Raman intensity calibration:
• spectrometer response
• cross section
3. Spectral resolution
4. Confocality: axial resolution
5. Spatial resolution : lateral resolution

14th June, 2012 Raman spectroscopy applied to Earth sciences and cultural heritage – M.C. Caumon 19/27
• Spectral resolution: ability of the spectrometer to separate two peaks.
• Depends on:
– Wavelength
– Grating (no of grooves/mm)
– CCD (no and size of pixels)
– Focal length of the spectrometer
– Entrance slit aperture
– Natural bandwidth of the peak
3. Spectral resolution
a: unresolvedb, c: resolved
Distance between 2 peaks ≥ 2FWHM
14th June, 2012 Raman spectroscopy applied to Earth sciences and cultural heritage – M.C. Caumon 20/27
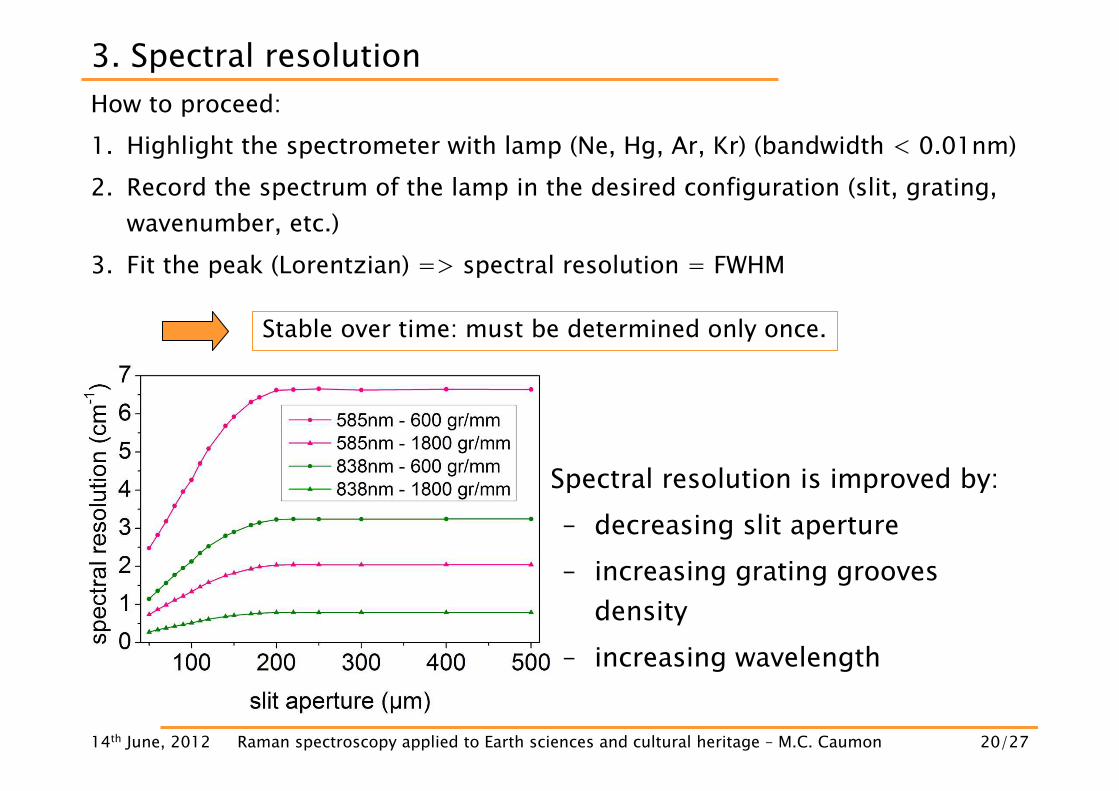
3. Spectral resolution
How to proceed:
1. Highlight the spectrometer with lamp (Ne, Hg, Ar, Kr) (bandwidth < 0.01nm)
2. Record the spectrum of the lamp in the desired configuration (slit, grating,
wavenumber, etc.)
3. Fit the peak (Lorentzian) => spectral resolution = FWHM
Stable over time: must be determined only once.
• Spectral resolution is improved by:
– decreasing slit aperture
– increasing grating grooves
density
– increasing wavelength

14th June, 2012 Raman spectroscopy applied to Earth sciences and cultural heritage – M.C. Caumon 21/27
Outline
1. Raman shift wavenumber calibration:
• Detector
• Laser
2. Raman intensity calibration:
• spectrometer response
• cross section
3. Spectral resolution
4. Confocality: axial resolution
5. Spatial resolution : lateral resolution
14th June, 2012 Raman spectroscopy applied to Earth sciences and cultural heritage – M.C. Caumon 22/27
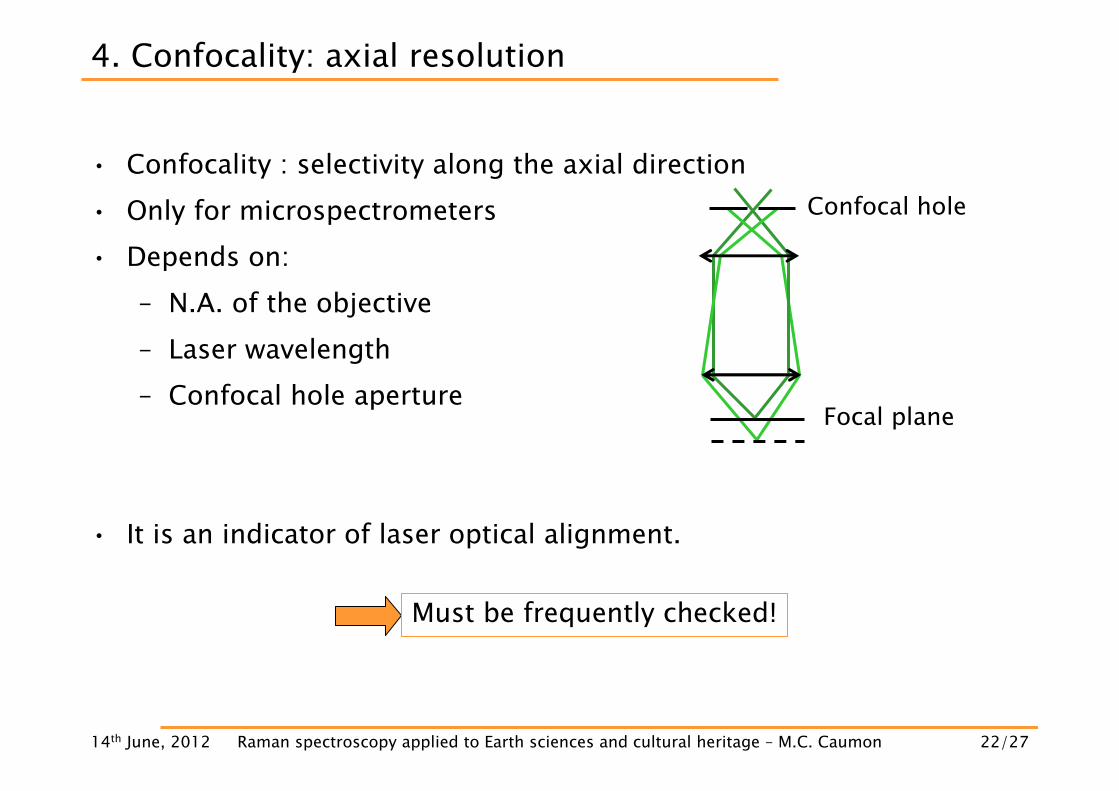
4. Confocality: axial resolution
• Confocality : selectivity along the axial direction
• Only for microspectrometers
• Depends on:
– N.A. of the objective
– Laser wavelength
– Confocal hole aperture
• It is an indicator of laser optical alignment.
Must be frequently checked!
Confocal hole
Focal plane

14th June, 2012 Raman spectroscopy applied to Earth sciences and cultural heritage – M.C. Caumon 23/27
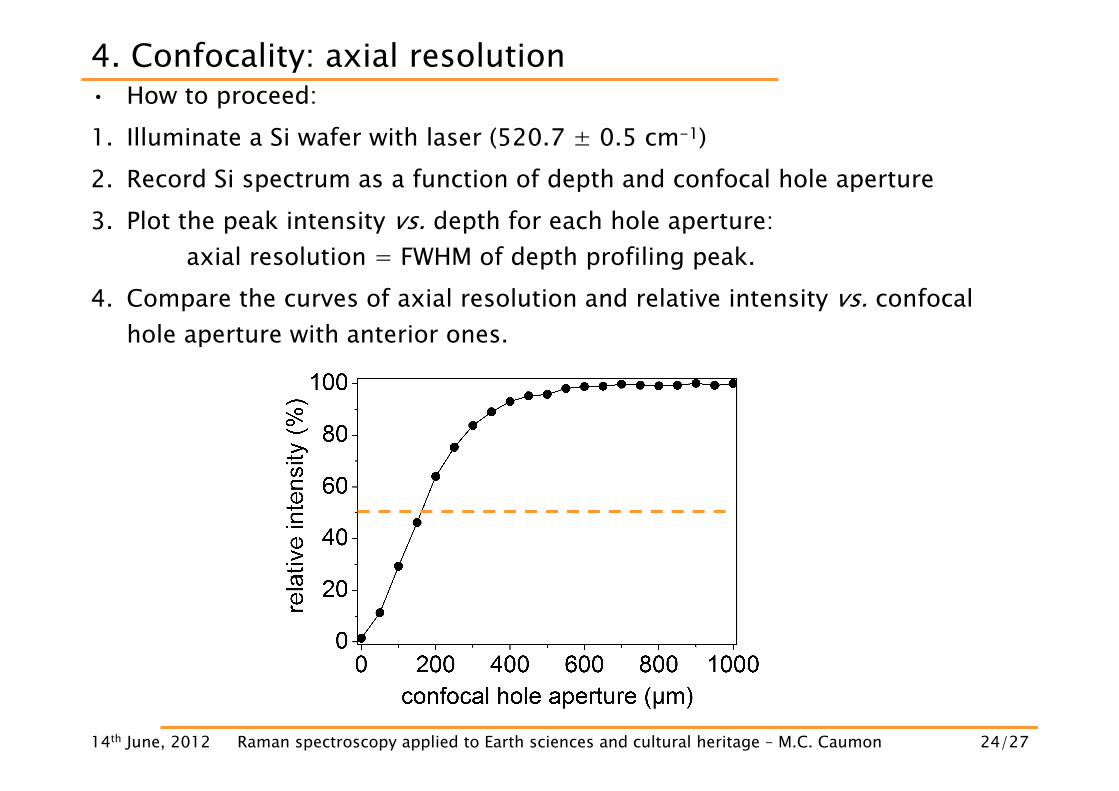
4. Confocality: axial resolution• How to proceed:
1. Illuminate a Si wafer with laser (520.7 ± 0.5 cm-1)
2. Record Si spectrum as a function of depth and confocal hole aperture
3. Plot the peak intensity vs. depth for each hole aperture:
axial resolution = FWHM of depth profiling peak.
4. Compare the curves of axial resolution and relative intensity vs. confocal
hole aperture with anterior ones.
Varying confocalhole aperture
14th June, 2012 Raman spectroscopy applied to Earth sciences and cultural heritage – M.C. Caumon 24/27
4. Confocality: axial resolution• How to proceed:
1. Illuminate a Si wafer with laser (520.7 ± 0.5 cm-1)
2. Record Si spectrum as a function of depth and confocal hole aperture
3. Plot the peak intensity vs. depth for each hole aperture:
axial resolution = FWHM of depth profiling peak.
4. Compare the curves of axial resolution and relative intensity vs. confocal
hole aperture with anterior ones.

14th June, 2012 Raman spectroscopy applied to Earth sciences and cultural heritage – M.C. Caumon 25/27
Outline
1. Raman shift wavenumber calibration:
• Detector
• Laser
2. Raman intensity calibration:
• spectrometer response
• cross section
3. Spectral resolution
4. Confocality: axial resolution
5. Spatial resolution : lateral resolution

14th June, 2012 Raman spectroscopy applied to Earth sciences and cultural heritage – M.C. Caumon 26/27
5. Spatial resolution: lateral resolution
• Indicates the minimum surface size that can be individually analyzed.
• Limited by light diffraction (resolving power of a confocal microscope):
δxy = 0.46λ/N.A.
=> Depends on wavelength and N.A. of objectives.

14th June, 2012 Raman spectroscopy applied to Earth sciences and cultural heritage – M.C. Caumon 27/27
Summary
1. Raman shift wavenumber calibration
2. Raman intensity calibration
3. Spectral resolution
4. Confocality
5. Spatial resolution
• Useful standards:
– Atomic emission lamps (Ne, Ar, etc.)
– Si wafer
– Organic compounds (cyclohexane, polystyrene, etc.)