instrumentation italy 2006 - siiv.net · preparation for field instrumentation instrument...
TRANSCRIPT

1
Pavement Instrumentation
Imad L. Al-QadiFounder Professor of Engineering
Pavement Optimum Investment
RELIABILITY(pavement condition)
PRES
ENT
WO
RTH
OPTIMUM
100 %50 %
TOTAL COST
Future Investment Maint., Rehab., User, etc.
INITIAL COST
FAILURE CRITERIA IN PAVEMENTS
RUTTINGFATIGUELOW TEMPERATURE CRACKINGCONTAMINATIONDRAINAGE/ MOISTURE

2
RUTTING IN SUBGRADE OR BASE
originalprofile
weak subgrade or underlying layer
asphalt layer
subgradedeformation
RUTTING IN HMA
weak asphalt layer
shear plane
originalprofile
FATIGUE CRACKING

3
REFLECTION CRACKING
LOW TEMPERATURE CRACKING
Loaded Flexible Pavement
Aggregate Base Deflection
Free Water Wedge
Hydrostatic Pressure
Subgrade Deflection
Direction of Travel
BaseBase
Subgrade
HMA

4
Moisture Damage
Subgrade Subgrade
Soil Migration
Aggregate Penetration
PCC/ HMABase
Subgrade

5
Benefits of Instrumentation• Measurement of response• Prediction of performance/ failure• Life estimation• Pavement configuration comparisons• Modification of designs • Construction/ maintenance evaluation
HVS FL - 2001
ATLAS @ UIUC - 2002
MnRoad - 1993
WesTrack - 1995Carson City, Nevada
NCAT Track 2000

6
• Adaptable Facility for Transportation Research and Evaluation
• 2.5km Long: 12 Flexible Pavement Sections and One CRCP
• Instrumentation during Construction• Rain and Snow Towers
Virginia Smart Road
Pavement Instrumentation
• Selection• Calibration• Installation• Protection• Data Collection• Data Analysis

7
Instrument Selection
Subgrade
21B Aggregate Subbase21A Stabilized Subbase
Open Graded Drainage LayerSM 9.5-A (in 3 Sections)
BM 25.0W. Surface
Pressure Cell (Two Sizes)Aggregate Strain Gage
Vibrating Wire Strain Gage
H-Type Strain Gage (Asphalt)
Time Domain Reflectomer (Two Types)Thermocouple Resistivity Probe
Underground Bunker Houses Data Acquisition System
Instrumentation
Pressure Cell
Aggregate Strain GageVibrating Wire Strain
Gage
H-Type Strain Gage

8
Thermocouple
TDR (CS610) TDR (CS615)
Resistivity Probe
LVDT
Piezometer
Instrument Types
KyowaLiquid Level
Multi-Depth Deflectometer

9
Static Strain Gauge
Thermocouple
Dynamic Strain Gauge
Steel Strain Gauge
Instrumentation Planning
Smart Road Pavement Design
A B C D E F G H I J K LOGFC (19mm)SM-9.5D (19mm)
SM-9.5A (50mm)
SM-9.5A (50mm)
SM-9.5A (50mm)
BM-25.0 (225mm)
21B (75mm)
21B (75mm)
21B (75mm)
21A Cement
Stabilized (150mm)
Cement OGDL
(75mm)
21A Cement
Stabilized (150mm)
21A Cement
Stabilized (150mm)
OGDL (75mm)
OGDL (75mm)
21B (150mm)
21A Cement
Stabilized (150mm)
21B (175mm)
Cement OGDL
(75mm)
OGDL (75mm)
OGDL (75mm)
OGDL (75mm)
OGDL (75mm)
21B (175mm)
21B (175mm)
21B (175mm)
SM-12.5D (38mm)
SM-9.5D (38mm)
SM-9.5E (38mm)
SM-9.5A (38mm)
SM-9.5D (38mm)
SM-9.5D (38mm)
SM-9.5D (38mm)
SM-9.5D (38mm)
BM-25.0 (100mm)
SM-9.5A* (38mm)
SM-9.5D (38mm)
SMA-12.5 (38mm)
BM-25.0 (150mm)
BM-25.0 (100mm)
BM-25.0 (225mm)
21B (150mm)
BM-25.0 (100mm)BM-25.0
(150mm)BM-25.0 (150mm)
BM-25.0 (150mm)
BM-25.0 (150mm) BM-25.0
(225mm)
21A Cement
Stabilized (150mm)
21A Cement
Stabilized (150mm)
BM-25.0 (150mm)
21B (75mm)
21A Cement Stabilized (150mm)
21B (150mm)
21A Cement
Stabilized (150mm)
21A Cement
Stabilized (150mm)
21A Cement
Stabilized (150mm)
21B (75mm)
21A Cement
Stabilized (150mm)
CRCP
Concrete (250mm)
Cement OGDL
(75mm)
OGDL (75mm)
21B (150mm)
OGDL (75mm)
Geocomposite Membrane
Reinforcing Mesh
Woven Geotextile
Copper Plate

10
Smart Road Infrastructure
8
DaqBook 200
DBK cards
WaveBook 512
WBK10
WBK16

11
Data Logger & Multiplexers
Weather Station
Campbell Scientific
INSTRUMENT LOCATION AND DRIVING PATHS

12
Instrument Location
Preparation for Field Instrumentation
Instrument Preparation

13
Digging Trenches
Digging Trenches

14
Thermocouples and TDRs
Instrument Modification and Calibration
LVDT

15
LVDT Construction
TDR Calibration
TDR Calibration

16
Pressure Cell
Benddedrod
Instrument Installation
Pressure Cell Installation

17
PLACING HMA OVER INSTRUMENTS
INSTRUMENT INSTALLATION
COMPACTING ASPHALT OVER INSTRUMENTS

18
SPECIAL INSTRUMENTATION
Section K Section J
Section I Section L
Environment Instrumentation
LVDT Installation

19
Instrument Protection
Pressure Cells
Pressure Cells

20
Pressure Cells
Wrong
Instrument Protection
HMA Strain Gauges

21
Strain Gauge
Wiring
Wire Protection

22
WIRE TRENCHES
Laying Out Wires
WIRE SPLICING

23
Paving Process
Instrument In-situ Response
FWD Testing

24
FWD
FWD Testing Procedures (2)
Weight
Loading plate
Def
lect
ion
Distance
Typical deflection basins
B. B. Guzina and R. H. Osburn (2002)
A-B: LiftB-C: Drop
Geophones
-50
0
50
100
150
200
0 0.5 1 1.5 2Pulse Duration (secs)
Stre
ss R
espo
nse
(kPa
) 0
10
20
30
40
50
60
70
80
-1.5 -1 -0.5 0 0.5 1 1.5 2DISTANCE (ft)
Pres
sure
(psi
)
5000 lbs7000 lbs9000 lbs11000 lbs 13000 lbs
Instrument Response under
FWD Loading

25
FWD on Low Modulus Material
0300600900
120015001800
0 0.2 0.4 0.6 0.8 1Time (sec)
Stra
in ( μ
m/m
)
0300600900
120015001800
0 0.2 0.4 0.6 0.8 1Time (sec)
Stra
in ( μ
m/m
)
Vibrations: 40 Hz (2400 VPM)
Horizontal Transverse Strain under HMA
No Vibrations
-2500
-500
1500
3500
5500
7500
0 0.2 0.4 0.6 0.8 1Time (sec)
Stra
in ( μ
m/m
)
-2500
-500
1500
3500
5500
7500
0 0.2 0.4 0.6 0.8 1Time (sec)
Stra
in ( μ
m/m
)
Longitudinal Strain under HMA
Vibrations: 40 Hz (2400 VPM)
No Vibrations
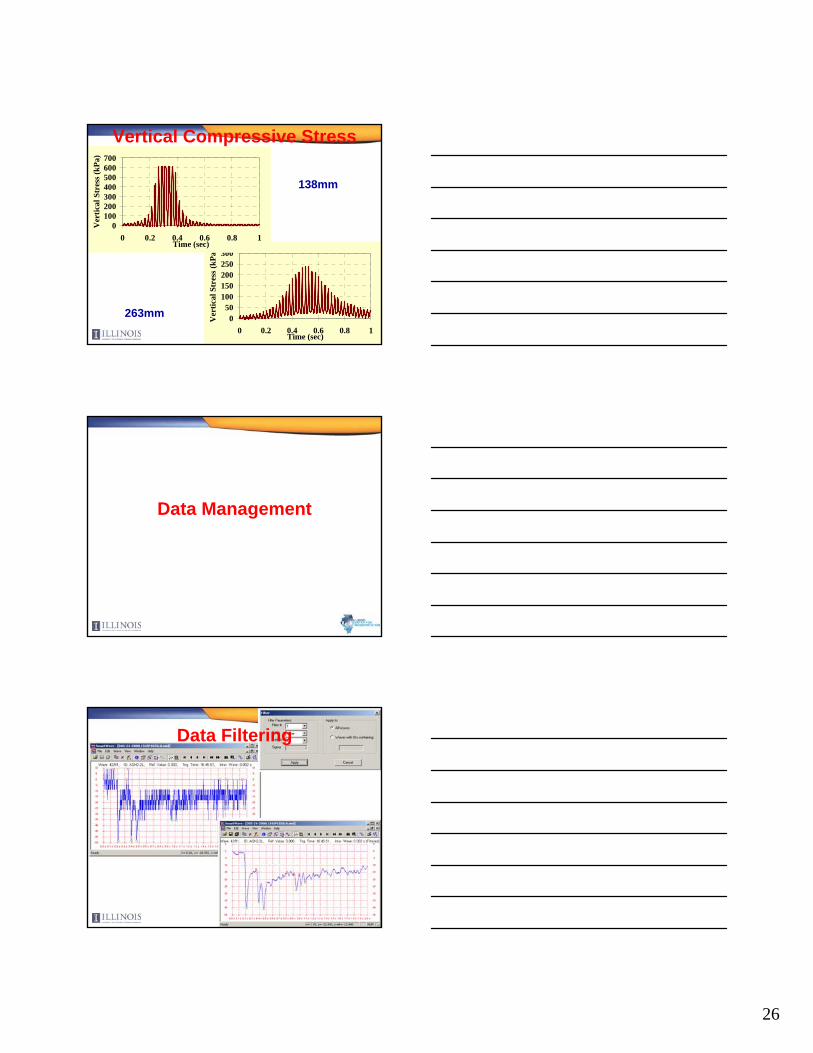
26
050
100150200250300
0 0.2 0.4 0.6 0.8 1Time (sec)
Ver
tical
Str
ess (
kPa)
0100200300400500600700
0 0.2 0.4 0.6 0.8 1Time (sec)
Ver
tical
Str
ess (
kPa)
Vertical Compressive Stress
138mm
263mm
Data Management
Data Filtering

27
Data Collection and Management
• Several Visual C++ Software– SmartAcq: Configure Instruments and Acquire
Data – SmartOrganizer: Create Files per Section, Data
Type, and Date from Raw Files – SmartWave: Display and Analyze Dynamic Data
• Databases: Access with C++ Visual Interface– Temperature and Moisture – Stresses and Strains
Dynamic Data(Truck Loading)Dynamic Data
(Truck Loading)
Static Data(Environmental)
Static Data(Environmental)
Temperature(15 minutes)
Temperature(15 minutes)
Moisture(1 hour)
Moisture(1 hour)
Frost depth(6 hours)
Frost depth(6 hours)
Stress(2-second wave)
Stress(2-second wave)
Strain(2-second wave)
Strain(2-second wave)
TYPES OF DATA
Instrument Triggering and Data Saving

28
Data Management
Data Collection and Management• Static Data: One File Per Bunker Created
Every Day at Midnight (Tab-Delimited Text File)– Date, Section #, Type
• Dynamic Waves: One File Per Bunker with All Triggered Instruments Created Only during Truck Testing (Binary File) – Date, Load, Speed, Pressure, Section #
TDR and Vibrating Wire Configuration Window

29
Thermocouple and Frost Probe Configuration Window
Pressure Cells & Strain Gauges
DATA MANAGEMENT

30
Sample Pressure Cell Data
TYPICAL COLLECTED DATA (STRAIN)
DATA ANALYSIS
D05-24-2000L1S5P105ScB

31
DATA ANALYSIS
DATA ANALYSIS
DOWNLOAD DATA

32
Pavement Response
• 3 Load Levels (L1, L2, L3)
• 3 Tire Inflation Pressures (80, 95, 105 psi) (550, 655, 725 kPa)
• 4 Speeds (5, 15, 25, 45 mph) (8, 25, 40, 72 km/h)
Truck Loading

33
Time Domain Reflectometry
0
5
10
15
20
3/3/00 3/17/00 3/31/00 4/14/00 4/28/00 5/12/00 5/26/00
Date
Moi
stur
e C
onte
nt (%
)
0
5
10
15
20
25
30
35
40
45
50
Prec
ipita
tion
(mm
)
Precipitation
Moisture Content
0
5
10
15
20
3/14/00 3/28/00 4/11/00 4/25/00 5/9/00 5/23/00
Date
Moi
stur
e C
onte
nt (%
)
0
5
10
15
20
25
30
35
40
45
50
Pre
cipi
tatio
n (m
m)
Precipitation
Moisture Content
6
8
10
12
14
16
18
20
3/30/00 4/9/00 4/19/00 4/29/00 5/9/00 5/19/00 5/29/00 6/8/00date
volu
met
ric m
oist
ure
cont
ent (
%)
0
5
10
15
20
25
30
35
40
45
50
prec
ipita
tion
(mm
)
BM6-1MBM6-2Mprecipitation
6
8
10
12
14
16
18
20
3/30/00 4/9/00 4/19/00 4/29/00 5/9/00 5/19/00 5/29/00 6/8/00date
volu
met
ric m
oist
ure
cont
ent (
%)
0
5
10
15
20
25
30
35
40
45
50
prec
ipita
iton
(mm
)
EM6-1MEM6-2Mprecipitation
6
8
10
12
14
16
18
20
3/30/00 4/9/00 4/19/00 4/29/00 5/9/00 5/19/00 5/29/00 6/8/00date
volu
met
ric m
oist
ure
cont
ent (
%)
0
5
10
15
20
25
30
35
40
45
50
prec
ipita
tion
(mm
)
KM6-1MKM6-2Mprecipitation
05
101520253035404550
6/1 6/2 6/3 6/4 6/5 6/6 6/7 6/8
Date
Under WS
AmbientUnder 21B
TEMPERATURE DATA

34
TEMPERATURE EFFECT
0300600900
1200
10 12 14 16 18 20 22 24 26 28 30Temperature (°C)
5/24/009:00 AM10/19/008:50 AM
020406080
100120
-0.4 -0.2 0 0.2 0.4Time (s)
5/24/009:00 AM10/19/008:50 AM
8 km/h, 190mm
0
0.25
0.5
0.75
1
-0.4 -0.2 0 0.2 0.4Time (sec)
Nor
. Ver
t. C
omp.
St
ress
40mm 190mm 267mm419mm 597mm
0
0.25
0.5
0.75
1
-0.1 -0.05 0 0.05 0.1Time (sec)
Nor
m. V
ert.
Com
p.
Stre
ss
40mm 190mm 267mm419mm 597mm
72km/h
8km/h
)dt*
2(siny(t) 2 π+π
=
00.20.40.60.8
1
-0.1 -0.05 0 0.05 0.1
MeasuredHaversine
00.20.40.60.8
1
-0.01 -0.005 0 0.005 0.01
MeasuredHaversine
8km/h, 40mm, d=0.15s
72km/h, 40mm, d=0.02s

35
0.01
0.1
1
10
0 20 40 60 80Speed (km/h)
Hav
ersi
ne T
ime
(sec
)
597mm 419mm 267mm190mm 40mm
Haversine Duration vs. Depth and Speed
y = 45.852e0.0399x
R2 = 0.88
0
50
100
150
200
250
300
0 5 10 15 20 25 30 35 40 45Temperature (°C)
Vert
ical
Str
ess
(kPa
)
724kPa655kPa552kPaTrendline (all)
Effect of Tire Inflation Pressure on Measured Vertical Compressive Stress under HMA
EFFECT OF LOAD ON MEASURED VERTICAL STRESS UNDER HMA
y = 1.97e0.054x
R2 = 0.92
y = 2.55e0.0602x
R2 = 0.95
y = 5.26e0.0422x
R2 = 0.95
020406080
100120140160180
0 5 10 15 20 25 30 35Temperature (°C)
41.5kN30.1kN19.8kN

36
σ = 28.3e0.0565T
R2 = 0.920
50
100
150
200
0 10 20 30 40Temperature (C)
Ver
tical
Str
ess (
kPa) 8km/h 24km/h
40km/h 72km/h
Vertical Stress vs. Speed
0
50
100
150
200
10 15 20 25 30 35 40Temperature (°C)
Stra
in ( μ
m/m
)
8km/h 24km/h40km/h 72km/h
Transverse Strain vs. Speed
EFFECT OF TIRE INFLATION PRESSURE ON MEASURED HORIZONTAL TRANSVERSE STRAIN
UNDER HMA
8km/h
μstrain = 8.48e0.086T
R2 = 0.930
20406080
100120140160180
10 15 20 25 30 35 40Temperature (°C)
μ
551.6kPa655kPa724kPaTrendline (all)

37
Effect of Speed on Measured Horizontal Transverse Strain under HMA @ 25°C
y = 75.2e-0.0183x
R2 = 0.96
0
10
20
30
40
50
60
70
0 10 20 30 40 50 60 70 80Speed (km/h)
μstr
ain