instrumentation to characterize needle insertion into
TRANSCRIPT

Instrumentation to Characterize Needle Insertion intoBiological Tissue
by
Wilson Chan
B.S., Mechanical EngineeringUniversity of Illinois at Urbana-Champaign, 2000
Submitted to the Department of Mechanical Engineeringin Partial Fulfillment of the Requirements for the Degree of
Master of Science in Mechanical Engineering
at the
Massachusetts Institute of Technology
June 2002
© 2002 Massachusetts Institute of TechnologyAll rights reserved
Signature of Author............ ......................................Department of Mechanical Engineering
May 21, 2002
Certified by........................................................Ian W. Hunter
Hatsopoulos Professor of Mechanical Engineering and Professor of BioEngineering_ f Thesis Supervisor
Accepted by................................................................Ain A. Sonin
Chairman, Department Committee on Graduate Students
RA RKERMASSACHUSETTS INSTITUTE
OF TECHNOLOGY
OCT 2 5 2002
LIBRARIES

Instrumentation to Characterize Needle Insertion intoBiological Tissue
by
Wilson Chan
Submitted to the Department of Mechanical Engineeringon May 21, 2002 in Partial Fulfillment of the Requirements for the
Degree of Master of Science in Mechanical Engineering
Abstract
The Transdermal Drug Delivery Project in the BioInstrumentation Laboratoryinvolves the design of a device to deliver drugs through the human skin using microneedles. It is crucial to characterize the insertion of micro needles into biological tissues.Hence, instrumentation will be designed and fabricated for the characterization of microneedle insertion. This thesis focuses on the design and fabrication of suchinstrumentation. The instrument is multi-modal, multi-axis, mobile and compact. It is
capable of precise insertion positioning and acquiring accurate insertion force data.Characterization of micro needle insertion into biological tissues is done successfullyusing the data acquired by this instrument and an existing physical force model.
Thesis Supervisor: Ian W. Hunter
Title: Hatsopoulos Professor of Mechanical Engineering and Professor of BioEngineering
2

Acknowledgements
This thesis never would have been possible without the help of my advisor,
Professor Ian Hunter. I thank him for the opportunity to work in his amazing laboratory
and for his never ending enthusiasm and support. I also thank the other members of the
BioInstrumentation Laboratory. Dr. John Madden, Dr. Sylvain Martel, Peter Madden,
Patrick Anquetil, James Tangorra, Bryan Crane, Robert David, Aimee Angel, Rachel
Peters, Laura Proctor, Tim Fofonoff, Bobby Dyer, Johann Burgert, Jan Malasek and
Chris Scarpino; all made my stay in the lab an enriching one.
I thank our softball team captain, James Celestino, from the Newman Laboratory
for his help in troubleshooting and problem solving and his moral support when we
struggled through late nights in the lab.
I specially thank my roommate, Gene Yeo, for his wonderful friendship and
advice. I also thank all the friends I have known outside the lab. They have been kind and
helpful in providing other sources of entertainment outside MIT. Finally, I thank my
family for their constant support and understanding.
3

Table of Contents
Abstract.............................................................................................2
Acknowledgements...............................................................................3
Chapter 1. Introduction and Background...................................................6
1.1 Introduction...................................................................... 61.2 B ackground...................................................................... 7
1.2.1 Anatomy of Human Skin..............................................71.2.2 Existing Instrumentation..............................................9
Chapter 2. Design and Fabrication of Instrumentation....................................12
2.1 Precision Motion System..................................................... 132.1.1 Micro Stepping Linear Stages, Micro Stepping Motors and
C ontrollers.................................................................132.1.2 Encoders and Limit Switches.........................................162.1.3 Computer Controlled Motion System...............................18
2.2 Data Acquisition and Measurement System...................................192.2.1 Force Transducers.....................................................192.2.2 Voice-Coil Actuator...................................................202.2.3 Displacement Transducer................................................212.2.4 Data Acquisition.......................................................222.2.5 Integration of Data Acquisition System with Precision Motion
System ..................................................................... 252.2.6 Simple Experiments to Test Instrumentation......................25
2.3 Optical System.................................................................282.3.1 Integration of Optical System.......................................28
Chapter 3. Experimental Procedure...........................................................32
3.1 Specim en........................................................................ 323.2 Experiment to Characterize Micro Needle Insertions......................323.3 Experimental Procedure..........................................................34
Chapter 4. Results and Discussion..........................................................38
4.1 Results and Discussion........................................................384.2 Characterization of Micro Needle Insertion into Skin.....................41
4.2.1 Data Analysis..........................................................414.2.2 Physical Model........................................................44
4.3 Lim itations...................................................................... 48
4
Chapter 5. Conclusion..........................................................................49
5.1 Summary........................................................................495.2 Future Work.....................................................................49
5.2.1 Temperature and Humidity Control Chamber.....................495.2.2 Rotational Insertion Module.........................................505.2.3 X-ray Imaging System................................................505.2.4 Synthetic Skin Specimen................................................51
References.......................................................................................52
Appendix.........................................................................................54
5

Chapter 1Introduction and Background
1.1 Introduction
The objective of the Transdermal Drug Delivery Project in the BioInstrumentation
Laboratory is to build a device that will delivery drugs through the human skin using
micro needles [11]. These stainless steel needles are approximately 100 pm in outer
diameter and approximately 60 gm in inner diameter. It is crucial to know the
characteristics of micro-needle insertion into skin. It is also important to measure the
maximum insertion force required for a micro-needle to puncture the skin. With the
knowledge of a micro-needle's penetration force and behavior during an insertion, an
appropriate injecting device can then be designed.
In view of this, instrumentation needs to be designed and fabricated so that micro-
needle insertion into biological tissues can be characterized. The design and fabrication
of the appropriate instrumentation will be described and discussed in Chapter 2 of this
thesis.
There is also a need to investigate whether or not different insertion angles and
velocities affect the required penetration force into skin. The experimental procedure will
be described in Chapter 3. Results and discussion will be in Chapter 4. Lastly, conclusion
and future work will be in Chapter 5.
6

Stratumcorneum
Stratumlucidum
Stratumgranulos
Stratumspiriosu
Stratumbasale
Papillary
Reticular
um -Epidermle9un
layer Dermis
layerj
Hair shaft
Dermal papillae
Free nerveending
Sebaceous(oil) gland
Sensorynerve Uober
Arrectorpiu muscle
Hair follicle
Hair root
Artery
Vein
Figure 1-1. Structure of human skin (image taken from [6]).
It is important to understand the structure of the human skin prior to
characterizing micro needle insertion into skin. Figure 1-1 shows the structure of the
human skin.
The skin is made up of 2 main parts. The epidermis is the outer, thinner portion of
the skin. The epidermis is connected to the inner, thicker part called the dermis [20]. The
7
1.2
1.2.1
Background
Anatomy of Human Skin
Hypodermis(superficial fascia)
Eccrine sweet gland
Adipose tissue
thickness of epidermis varies from about 0.06 mm to 0.09 mm in the eyelid to about 0.5
mm to 0.8 mm, in the palm and sole [10].
The epidermis consists of 5 layers. From the deepest to the outer most layer, they
are the stratum basale, stratum spinosum, stratum granulosum, stratum lucidum and
stratum corneum. It is useful to know that the stratum corneum is a layer of about 30
rows of flat, dead cells. The stratum corneum of the skin of the forehead and cheeks
averages about 0.02 to 0.04 mm in thickness, whereas on the palm and sole it is about 0.4
to 0.7 mm [10].
The dermis is made up of connective tissue containing collagen and elastic fibers.
The combination of collagen and elastic fibers gives the skin its strength, extensibility
(ability to stretch), and elasticity (the ability to return to original form after deformation)
[20]. This knowledge is useful for characterizing the behavior of skin during a needle
insertion.
8

1.2.2 Existing Instrumentation
858 Mini Bionix H testing system
The 858 Mini Bionix® II testing system (MTS Corporation, Eden Prarie, MN) is
being used commercially to conduct biomechanical testing (Figure 1-2) such as needle
insertion tests [9].
Figure 1-2. 858 Mini Bionix* II testing system (image taken from [9]).
The apparatus has force transducers of 15 kN and 25 kN capacity. The force range
is too large for the kind of expected insertion force for the micro needles used in this
project (50-300 mN). The device functions only on a single axis in the z-direction and
therefore is limited in terms of degrees of freedom. The instrumentation is bulky, takes up
a lot of space and is very costly. However, its flexibility and versatility make it easy to be
modified to conduct different kinds of tests such as soft tissue strain measurement and
spine loading experiments.
9

JHU Steady Hand Robot
The Steady Hand Robot designed in John Hopkins University (JHU) is used for
microsurgical tasks such as needle insertions into organs [17].
Figure 1-3. Steady hand robot from JHU (image taken from [17]).
This robot is designed for "steady hand" microsurgery so as to extend human
ability to perform micromanipulation. It is being used in the Department of Mechanical
Engineering at JHU to conduct needle insertion into organs for haptic modeling [19]. It is
integrated with a needle holder and load cell to carry out needle insertion experiments.
The load cell has a range of 10 N so it is appropriate for accurately measuring micro
needle insertion force. The robot has 7 degrees-of-freedom, capable of performing needle
insertion in various axes and directions. The disadvantage of this robot is that there is
10

human intervention during needle insertion experiments and hence velocity control is
very limited.
Summary
In view of existing instrumentation, there is a need to design and build a highly
versatile, and compact apparatus that is capable of performing precision micro needle
insertion experiments, acquiring accurate results, having multi degrees of freedom,
desired velocities control and having no human manipulation of the needle during
insertion.
11

Chapter 2Design and Fabrication of Instrumentation
To characterize needle insertion into biological tissue, such as skin,
instrumentation with a high degree of precision and accuracy is needed. In this chapter,
the design and fabrication of such a measurement system is discussed in detail. The
design of this single semi-automated multi-modal instrument is divided into three main
systems, namely the precision motion system, data acquisition and measurement system
and the optical system. Figure 2-1 shows the assembled version of the multi-modal
apparatus.
Figure 2-1. Multi-modal instrument.
12
2.1 Precision Motion System
In this section, details of the precision motion system of the instrumentation are
discussed. The precision motion system consists of micro stepping linear stages,
controllers, and stepper motors. The use of computer control for this system is presented
as well.
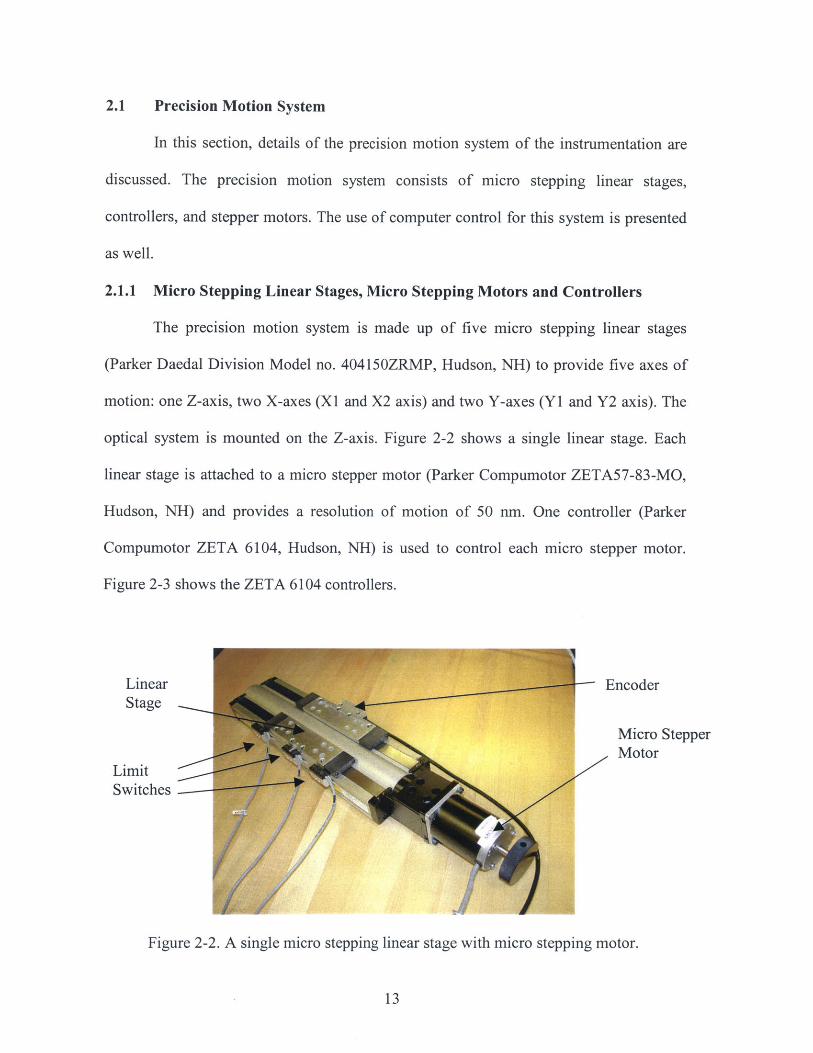
2.1.1 Micro Stepping Linear Stages, Micro Stepping Motors and Controllers
The precision motion system is made up of five micro stepping linear stages
(Parker Daedal Division Model no. 404150ZRMP, Hudson, NH) to provide five axes of
motion: one Z-axis, two X-axes (XI and X2 axis) and two Y-axes (Y1 and Y2 axis). The
optical system is mounted on the Z-axis. Figure 2-2 shows a single linear stage. Each
linear stage is attached to a micro stepper motor (Parker Compumotor ZETA57-83-MO,
Hudson, NH) and provides a resolution of motion of 50 nm. One controller (Parker
Compumotor ZETA 6104, Hudson, NH) is used to control each micro stepper motor.
Figure 2-3 shows the ZETA 6104 controllers.
Encoder
Micro StepperMotor
Figure 2-2. A single micro stepping linear stage with micro stepping motor.
13
LinearStage
LimitSwitches
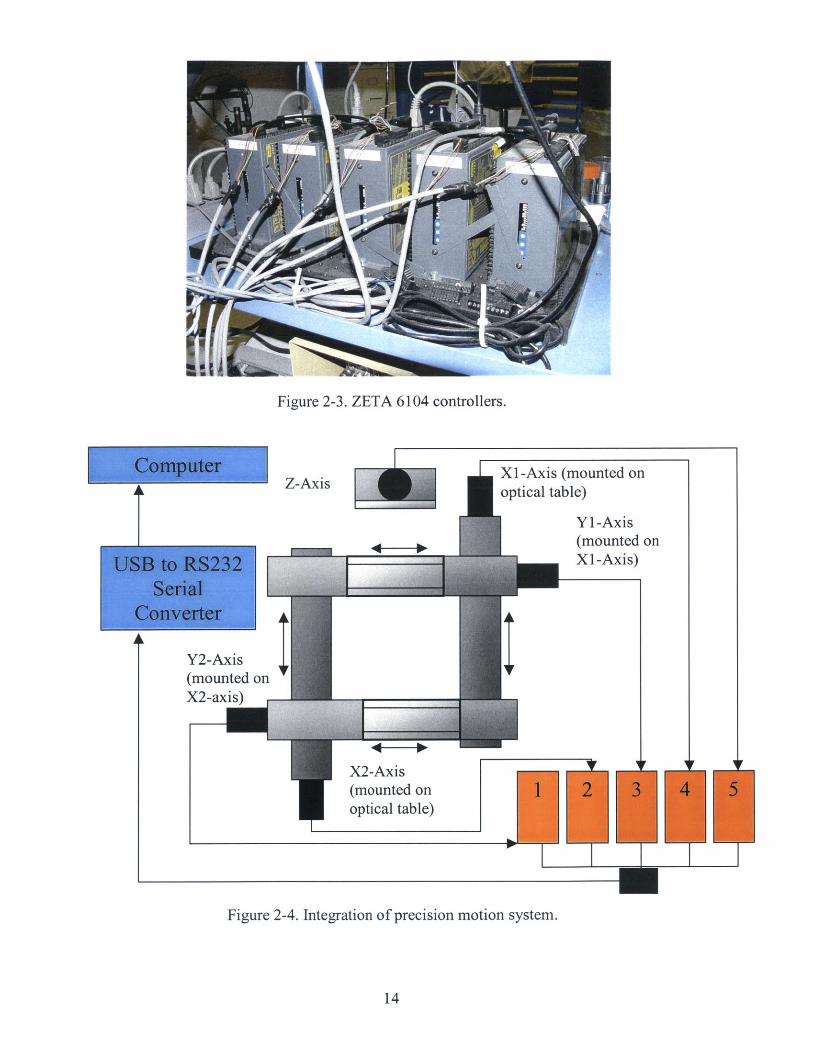
Figure 2-3. ZETA 6104 controllers.
Z-Axis
k
Y2-Axis(mounted onX2-axis)
X2-Axis(mounted onoptical table)
X1-Axis (mounted onoptical table)
Y1-Axis(mounted onX1-Axis)
t
EnV
Figure 2-4. Integration of precision motion system.
14
F

Figure 2-5. Actual precision motion system mounted on optical table.
Figure 2-4 shows the schematic layout of how the linear stages, micro stepper
motors, controllers, and the computer are integrated. The computer communicates with
the controllers via RS232 serial port connections. The actual precision motion system set
up is shown in Figure 2-5. Each controller is connected to a single RS232 cable, which is
in turn connected to an RS232-to-USB (Universal Serial Bus) connector (Edgeport,
Austin, Texas) linked to the computer via USB [8].
The five controllers can communicate in another way with the computer by
connecting a single RS232 cable to the first controller and linking the rest of the
controllers using a Daisy-chain technique. Figure 2-6 shows the schematic of the Daisy-
chain connections among the five controllers.
15
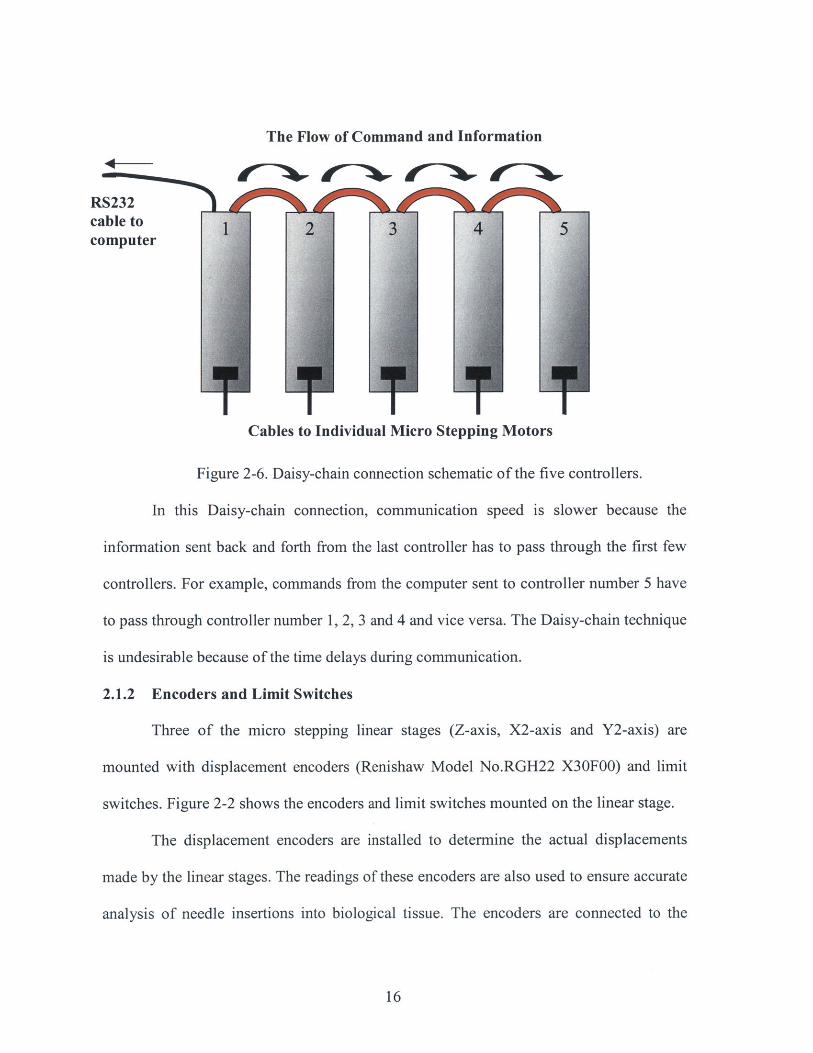
The Flow of Command and Information
RS232cable to 2345computer
Cables to Individual Micro Stepping Motors
Figure 2-6. Daisy-chain connection schematic of the five controllers.
In this Daisy-chain connection, communication speed is slower because the
information sent back and forth from the last controller has to pass through the first few
controllers. For example, commands from the computer sent to controller number 5 have
to pass through controller number 1, 2, 3 and 4 and vice versa. The Daisy-chain technique
is undesirable because of the time delays during communication.
2.1.2 Encoders and Limit Switches
Three of the micro stepping linear stages (Z-axis, X2-axis and Y2-axis) are
mounted with displacement encoders (Renishaw Model No.RGH22 X30FOO) and limit
switches. Figure 2-2 shows the encoders and limit switches mounted on the linear stage.
The displacement encoders are installed to determine the actual displacements
made by the linear stages. The readings of these encoders are also used to ensure accurate
analysis of needle insertions into biological tissue. The encoders are connected to the
16

same controllers used to control the micro stepping motors and the readings can be
retrieved from the controllers. 1 mm of travel corresponds to 250 counts on the encoder
reading:
xDisplacement = mm, (2.1)
250
where x is number of counts from the start point.
The limit switches are used to ensure the lead screws in the micro stepping motors
are not damaged by jamming at the end of travel. The limit switches consist of: forward
limit switch, home limit switch and backward limit switch. The limit switches are also
connected to the controllers. Both the forward and backward switches (end-of-travel limit
switches) are activated when a metal probe from the linear stage moves over the
proximity sensors on the switches. Figure 2-7 shows the metal probe and a limit switch.
Once the end-of -travel limit switches are activated, the controller will stop the linear
stage from moving in the intended direction. However, the opposite direction of travel is
valid. In this way, the lead screws in the micro stepping motors will not be damaged.
Limit switch
Metal probe
Sensor
Figure 2-7. Limit switch and metal probe.
17

2.1.3 Computer Controlled Motion System
The precision motion system is computer controlled using the Visual Basic
Program. Figure 2-8 shows the Graphics User Interface (GUI) of the program to control
the linear stages. The same GUI is also used for the data acquisition and measurement
system. The Microsoft Visual Basic 6.0 [13] code for the GUI is shown in the Appendix.
Precision Motion Control and Data Acquisition Interface By Wilson Chan
Enter Step Size (mm) Sprin-
AufntAic-X1I -Axis__
Backward
Y1 -Axis---
Go Backwardl
Z -Axis
Go Backward
X2 -Axis--
Go Backward
Y2 -Axis---
Go Backward
Go Forward
Go Forward
Go Forward
Go Forward
Go Forward
---
Figure 2-8. Graphics user interface used in precision motion control and data acquisition.
18
Measurement
rBlocks--
AutomaticMeasurement
Micro Needle Insertion Experiment -----
Insert Needle
Force Sample Time (s) 0.1Travel Distance (mm) 2.5Velocity (mm/s) 0.1
File: Ilinear

2.2 Data Acquisition and Measurement System
In this section, the details of the data acquisition and measurement are discussed.
The integration of the data acquisition and measurement system with the precision
motion system is also shown. The data acquisition and measurement system consists of
force transducers, a displacement transducer, a voice-coil actuator, data acquisition unit,
signal conditioning amplifier, power amplifier, function generator, low pass filters, and
power supply.
2.2.1 Force Transducers
In this experiment, two types of force transducers, Entran and Omega load cells,
are used to make needle insertion forces measurements. The Entran load cell (ELFS-
T3M-10N) is shown in Figure 2-9. It can measure both tensile and compressive forces
within the full-scale of 10 N (between -5 N and +5 N). It activates at an excitation
voltage of 15 V DC and operates well at temperatures between -40 'C and 120 'C. It also
has M5 thread shafts from both sides for easy mounting. It has been calibrated to 1 N/V.
Figure 2-9. Entran ELFS-T3M-1ON load cell.
19

The Omega load cell (Model LCCA-200) is shown in Figure 2-10. This is a more
robust force transducer and has a full-scale range of 900 N (between -450 N to +450 N).
Although the range is high, the Omega load cell is capable of accurately detecting very
small forces (resolution of 0.1 mN) such as needle insertion forces. The excitation
voltage is 15 V DC and operates well at a temperature between 0 *C to 53 *C. The
Omega load cell is calibrated to 10 N/V.
Angle- Omegavarying Load Cell
Platformfor skinspecimens
Figure 2-10. Omega model LCCA-200 load cell.
2.2.2 Voice-Coil Actuator
The Voice-Coil Actuator is also known as the Type 4810 mini-shaker from Brael
& Kjaer [2]. Figure 2-11 shows the mini-shaker. The mini-shaker is used for the dynamic
excitation of lighter objects. It is of the electrodynamic type with a permanent field
magnet. A coil, which is an integral part of the table structure, is flexibly suspended in
one plane in the field of the permanent magnet. A sinusoidal current signal, provided by
an external oscillator such as a function generator, is passed through the coil to produce a
20

vibratory motion at the table. This will be used to vibrate the needle in the axis of
insertion for one of the experiments.
An object to be vibrated can be attached to the mini-shaker's table by means of a
10-32 UNF screw. The frequency range is DC to 18 kHz and maximum peak-to-peak
displacement of table is 6 mm. The dynamic stiffness of flexures holding the table is 2
kN/m.
- Table
ElectricalInput
Figure 2-11. BrUel & Kjaer Type 4810 mini-shaker.
2.2.3 Displacement Transducer
The Fastar LD100-20 displacement transducer (from Omega) is shown in Figure
2-12. It is mounted on the table of the mini-shaker to determine the distance of the
flexures being pushed back when a force is exerted during needle insertion. It is crucial to
know this distance because the actual displacement reading from the encoder of the micro
21

stepping linear stage needs to be compensated with the distance recorded by the Fastar
displacement transducer.
The Fastar displacement transducer operates and measures displacement with an
aluminum core moving inside a polyimide encased coil. It is ideal for measuring
oscillating linear displacement with frequencies as high as 15 kHz. It measures
displacement up to 19 mm and has a resolution of 0.19 tm. It operates well at
temperatures ranging from -50 0C to 125 0C.
The output of the displacement transducer is recorded in the high-speed signal
conditioner (Fastar SP200A from Omega) shown in Figure 2-12.
Mini-shaker
Fastardisplacementtransducer
Figure 2-12. Fastar displacement transducer mounted on mini-shaker.
2.2.4 Data Acquisition
Outputs from the Entran and Omega load cells are fed into signal conditioning
amplifiers (2300 System from Measurements Group, Inc.) [1]. These signal conditioning
22
amplifiers help calibrate the load cells to a desirable value. The Entran load cell is
calibrated to 1 N/V while the Omega load cell is calibrated to 10 N/V.
The outputs of these signal conditioning amplifiers are in turn fed into the data
acquisition unit (Agilent 34970A, Hewlett-Packard Company) through a 1 kHz first-order
low pass filter to minimize noise. The readings from the Fastar displacement transducer
are fed directly into the data acquisition unit. The data acquisition unit is set to scan and
sample readings from these transducers during experiments. Readings from the output
buffer will be retrieved using a Visual Basic program.
A function generator (HP 3314A, Hewlett-Packard Company) is used to supply a
sinusoidal current signal into the mini-shaker to create oscillatory motion. A power
supply (HP E3631A, Hewlett-Packard Company) and a power amplifier are used to
power up the mini-shaker and the low pass filter.
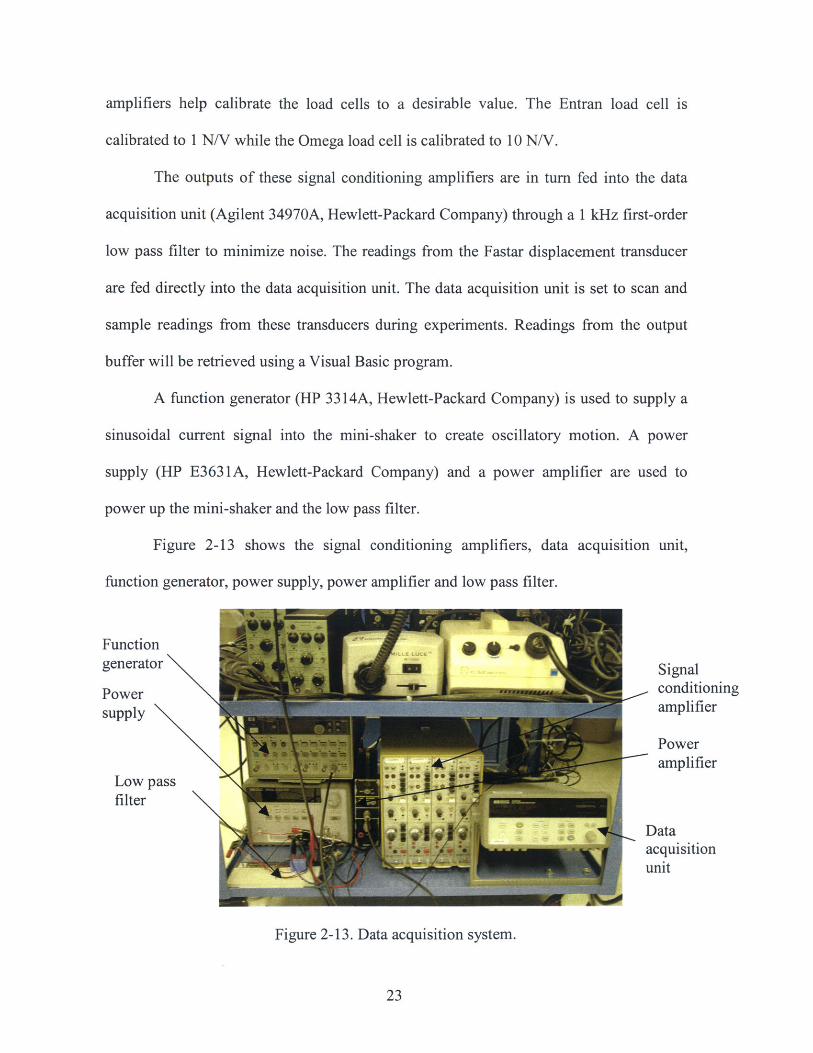
Figure 2-13 shows the signal conditioning amplifiers, data acquisition unit,
function generator, power supply, power amplifier and low pass filter.
Functiongenerator Signal
Power conditioning
supply amplifier
Poweripjy amplifier
Low passIfilter
Dataacquisitionunit
Figure 2-13. Data acquisition system.
23
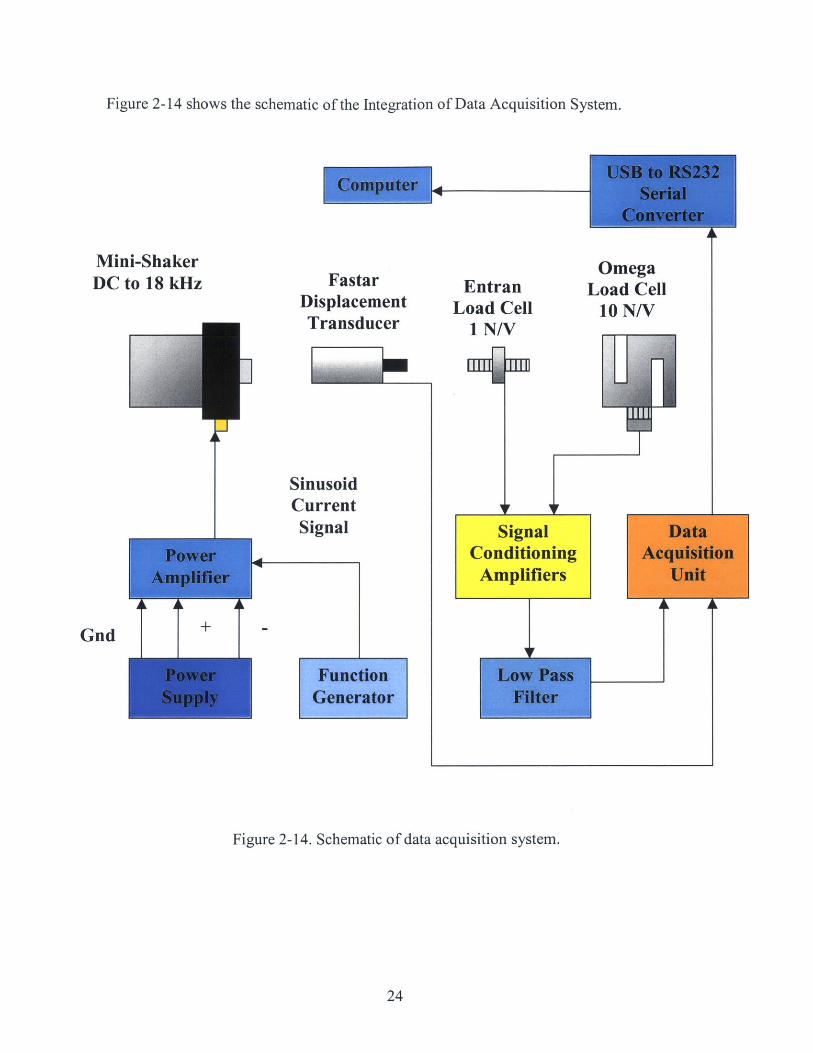
Figure 2-14 shows the schematic of the Integration of Data Acquisition System.
Mini-ShakerDC to 18 kHz Fastar
DisplacementTransducer
SinusoidCurrentSignal
~
EntranLoad Cell
1 N/V
OmegaLoad Cell
10 N/V
Figure 2-14. Schematic of data acquisition system.
24
Gnd
4 vSignal
ConditioningAmplifiers

2.2.5 Integration of Data Acquisition System with Precision Motion System
The micro testing instrumentation is a multi-modal one. It can be readily modified
to conduct different experiments on needle insertions. Figure 2-15 shows how the mini-
shaker, Fastar displacement transducer and the Entran load cell are integrated with the
precision linear stages.
Figure 2-15. Integration of voice-coil, displacement transducer and load cell with linearstages.
The above module was used to conduct experiments on both the linear needle
insertions and linear needle insertions with vibratory motion in the axis of insertion.
2.2.6 Simple Experiments to Test Instrumentation
Two simple experiments were conducted to test the capabilities of the multi-
modal instrumentation before performing any needle insertion experiments. The first
experiment involved compressing rubber blocks of different stiffness as shown in Figure
2-16 and obtaining the force versus deformation curves using the data acquisition system.
25
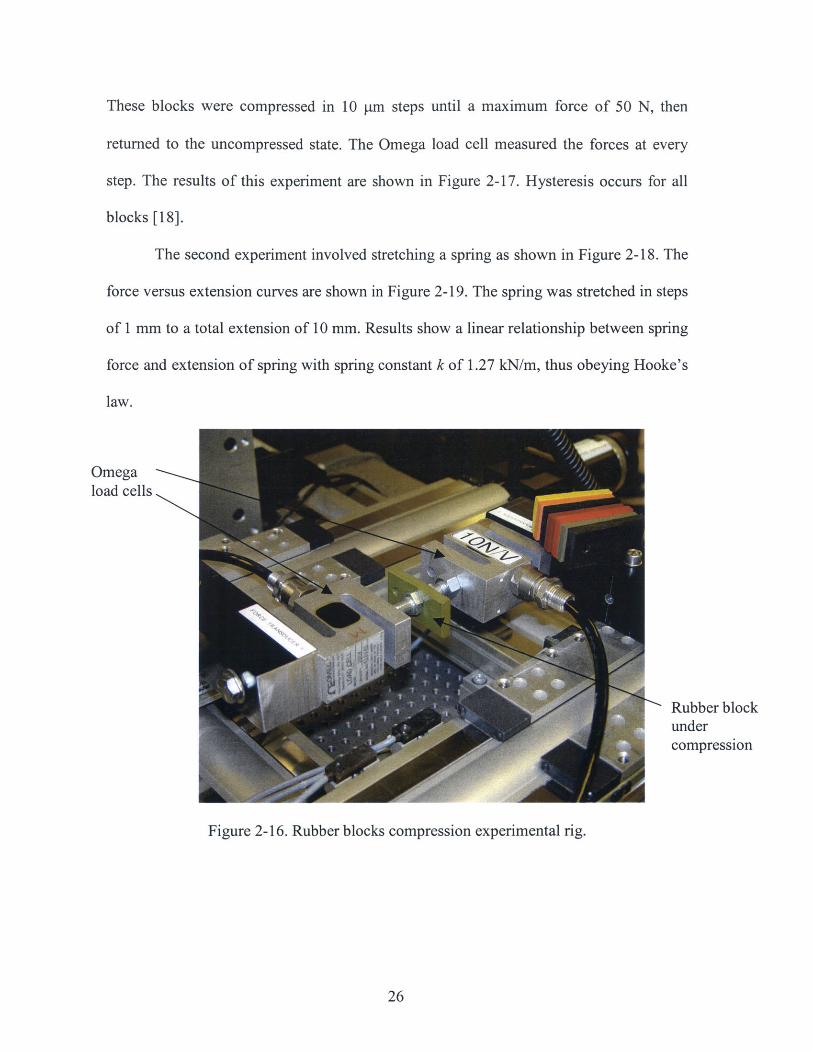
These blocks were compressed in 10 pm steps until a maximum force of 50 N, then
returned to the uncompressed state. The Omega load cell measured the forces at every
step. The results of this experiment are shown in Figure 2-17. Hysteresis occurs for all
blocks [18].
The second experiment involved stretching a spring as shown in Figure 2-18. The
force versus extension curves are shown in Figure 2-19. The spring was stretched in steps
of 1 mm to a total extension of 10 mm. Results show a linear relationship between spring
force and extension of spring with spring constant k of 1.27 kN/m, thus obeying Hooke's
law.
Omegaload cells
Rubber blockundercompression
Figure 2-16. Rubber blocks compression experimental rig.
26

40--
Max Force-- ---5 -
Block 90 Block 80 Block 70Block 95
Block 60Block 7033
Block 40
i0o 300 400 500 600 700 81
-40-
Displacement [um]
Figure 2-17. Force versus deformation results for rubber blocks (increasing numberscorresponds to increasing stiffhess).
Spring
Figure 2-18. Spring extension experimental rig.
27
260
4)0
L-
Block 50
160 3UU 40 560 660 760 81

14 -
12 -Omega load cell 2
10
Omega load cell 1
2
0-0 2 4 6 8 10 12
Extension [mm]
Figure 2-19. Force versus extension results for a spring (k = 1.27 kN/m).
2.3 Optical System
Part of the instrumentation includes an optical system. The optical system was
integrated to image needle insertions into biological tissue. In this section, the details of
the optical system are discussed. The optical system includes a CCD camera, microscope
objectives, beam splitter, light sources, and imaging software.
2.3.1 Integration of the Optical System
The schematic of the optical system is shown in Figure 2-20. A CCD camera
(1280 x 960 resolution Sony DFW-SX900) was used to capture images of needle
insertions, using an IEEE 1394 Digital Interface [7] at a frame rate of 7.5 frames/s.
Mitutoyo [4] infinity-corrected microscope objectives (M Plan Apo series with
magnification of 2X, 5X and 20X) were used to magnify the images of needle insertion.
28
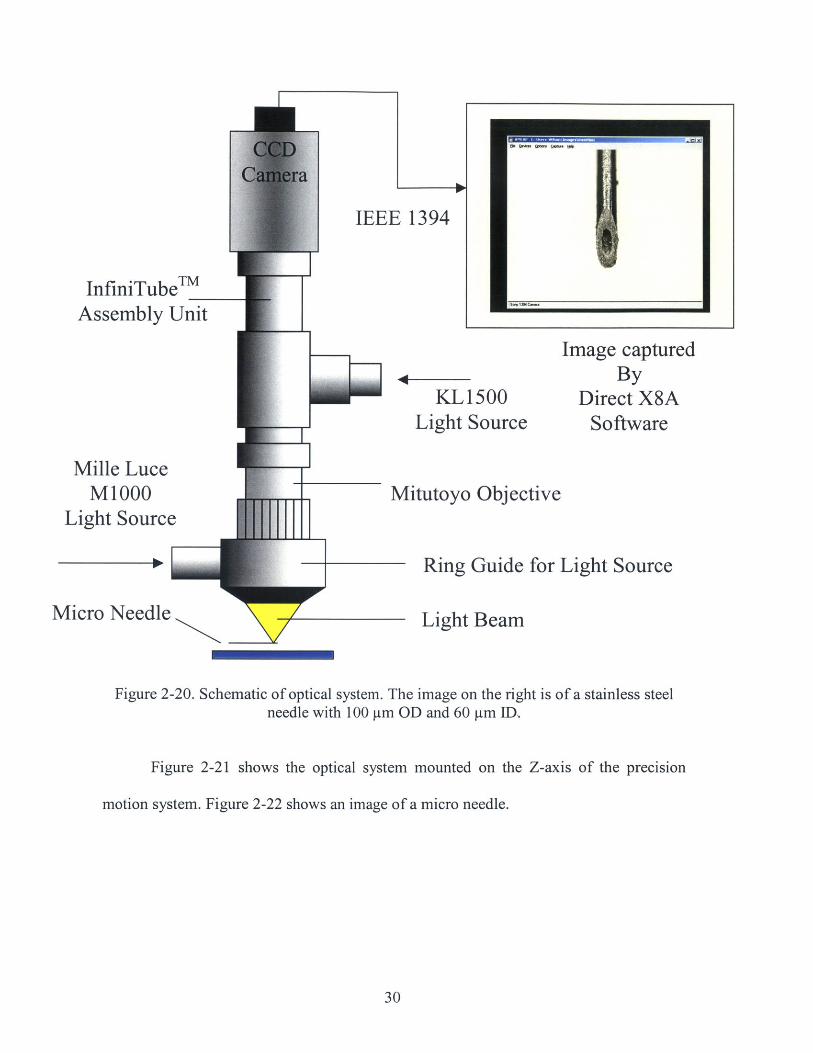
The InfiniTubeTM in-line assembly unit [3] allowed the Mitutoyo objectives to be
coupled with the Sony CCD camera. It had an effective secondary lens system of focal
length of 200 mm, providing IX magnification onto the CCD image plane for the
Mitutoyo objectives. It utilized an in-path beam splitter and a side port illumination tube
to allow light from light sources to be directed to the Mitutoyo objectives and the Sony
CCD camera.
Two light sources were used in the optical system. The Zeiss KL1500 electronic
light source is used to provide illumination in the InfiniTubeTM in-line assembly unit. The
Mille Luce fiber optic illuminator M1000 light source is used to provide illumination for
the ring guide around the Mitutoyo objectives. The ring guide supplied a radial
illumination on the objects to be imaged and created 'shadow' effects to produce distinct
features.
Microsoft Direct X8A [5] provided a video capturing and imaging software to
record needle insertion videos and images captured by the Sony CCD camera.
29
F
IEEE 1394
InfiniTube T M
Assembly Unit
Mille LuceM1000
Light Source
Micro Needle
-V
KL1500Light Source
Image capturedBy
Direct X8ASoftware
itutoyo Objective
Ring Guide for Light Source
Light Beam
Figure 2-20. Schematic of optical system. The image on the right is of a stainless steelneedle with 100 pm OD and 60 pm ID.
Figure 2-21 shows the optical system mounted on the Z-axis of the precision
motion system. Figure 2-22 shows an image of a micro needle.
30
],,,

Figure 2-21. Optical system mounted on Z-axis of precision motion system.
100 pm
Figure 2-22. Image of micro needle taken by optical system.
31

Chapter 3Experimental Procedure
The objective of the instrumentation was to characterize micro needle insertions
into biological tissue. The relationship of insertion forces and insertion displacements of
micro needles will be investigated. In this chapter, the procedure for this experiment is
described.
3.1 Specimen
The biological tissue used for the needle insertion experiment is skin from the
shoulder of a pig. It is selected based on its similar characteristics to human skin and is
readily available in supermarkets.
3.2 Experiment to Characterize Micro Needle Insertions
In this experiment, there were 2 methods of insertion: 1) the linear insertion and
2) the linear insertion with oscillatory motion (frequency of 5 kHz and amplitude of 20
mV) in the axis of insertion. This was done to investigate whether the oscillatory motion
has a significant effect on lowering insertion forces or ease of puncture into skin.
Illustrations of methods of insertion are shown in Figure 3-1 and Figure 3-2.
Intuitively, higher insertion speeds should generate higher insertion forces.
Therefore, in this experiment, two different speeds of linear insertion: 1) 0.1 mm/s and 2)
1 mm/s were used to investigate the effect of insertion velocity on insertion force.
Investigation of whether a smaller angle of insertion would generate a lower
insertion force was also done. There were two different angles of insertion into the skin:
1) 90* and 2) 15* in this experiment (angles measured from the surface of the skin to the
shaft of the needle).
32

Similar experiments were conducted on a 24-Gauge (OD = 570 ptm) surgical
needle to compare results with the micro needle.
Direction of insertion
To Loadcell /7
Micro needle150
in
Angle-varying
platform
Epoxy
Figure 3-1. Linear insertion method with insertion angle of 15'.
Direction of insertion
Oscillatory motion produced bymini-shaker (5 kHz, 20 mV)
To Loadcell
Micro needle
Pig skin
Angle-varyingplatform
Epoxy
Figure 3-2. Linear insertion with oscillatory motion with insertion angle of 900.
33
Pig sk

3.3 Experimental Procedure
A piece of 40 mm x 40 mm pig skin was cut using a surgical scalpel. The skin was
attached with epoxy onto a platform mounted on the instrumentation, which allows the
user to vary the angle of insertion.
The micro needle was soldered onto a M5 stainless steel nut. The nut was then
screwed directly onto the Entran load cell so that the micro needle is parallel to the axis
of insertion. The 24-Gauge needle was threaded with M5 threads, and was screwed
directly onto the Entran load cell.
At the beginning of each test, each needle was located approximately 0.5 mm
away from the skin. During each experiment, each needle was advanced to a total
displacement of 2.5 mm, penetrating the skin to an approximate depth of 2.0 mm. The
needle was held in the punctured skin for about 5 seconds, and then pulled out from the
skin to its original position. Insertion force readings were registered by the load cell
during each test and recorded by the computer via the data acquisition unit. Insertion
force data were collected corresponding the displacement readings from the encoders
from the linear stages. A plot of insertion force against displacement could be obtained
for each needle insertion test.
Figure 3-3 and Figure 3-4 show the micro needle inserting into pig skin at angles
of 90* and 15*, respectively. Figure 3-5 and Figure 3-6 show the 24-Gauge surgical
needle inserting into pig skin at angles of 90* and 15', respectively.
34
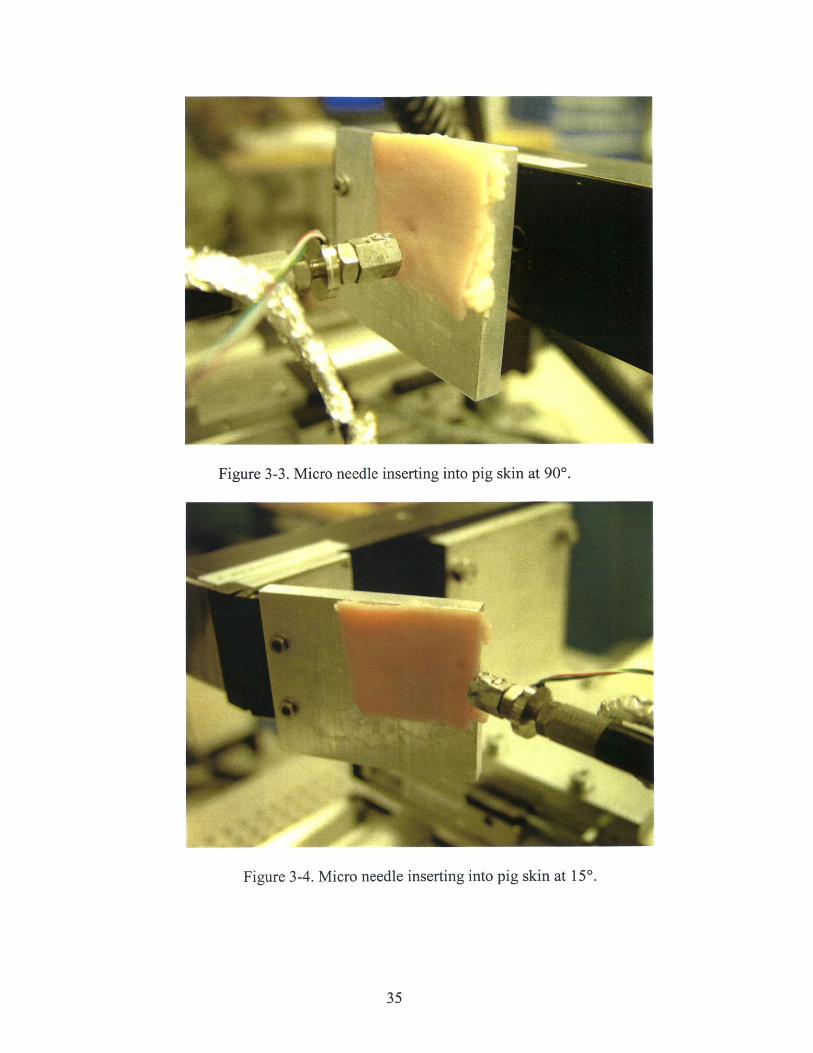
Figure 3-3. Micro needle inserting into pig skin at 90*.
Figure 3-4. Micro needle inserting into pig skin at 150*.
35

Figure 3-5. 24-Gauge surgical needle inserting into pig skin at 900.
Figure 3-6. 24-Gauge surgical needle inserting into pig skin at 15'.
36
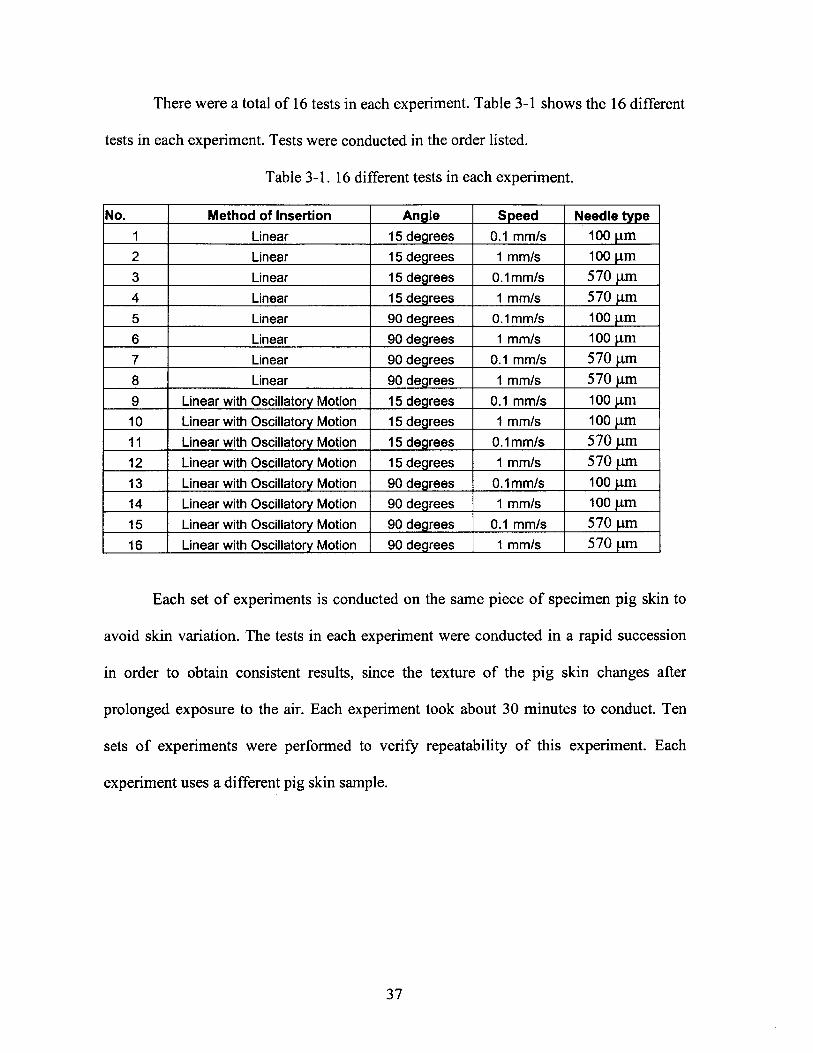
There were a total of 16 tests in each experiment. Table 3-1 shows the 16 different
tests in each experiment. Tests were conducted in the order listed.
Table 3-1. 16 different tests in each experiment.
No. Method of Insertion Angle Speed Needle type1 Linear 15 degrees 0.1 mm/s 100 pm2 Linear 15 degrees 1 mm/s 100 pm3 Linear 15 degrees 0.1mm/s 570 pm4 Linear 15 degrees 1 mm/s 570 pm5 Linear 90 degrees 0.1mm/s 100 ptm6 Linear 90 degrees 1 mm/s 100 ptm7 Linear 90 degrees 0.1 mm/s 570 pm
8 Linear 90 degrees 1 mm/s 570 pm
9 Linear with Oscillatory Motion 15 degrees 0.1 mm/s 100 pm10 Linear with Oscillatory Motion 15 degrees 1 mm/s 100 pm11 Linear with Oscillatory Motion 15 degrees 0.1mm/s 570 pm12 Linear with Oscillatory Motion 15 degrees 1 mm/s 570 pm13 Linear with Oscillatory Motion 90 degrees 0.1mm/s 100 pm14 Linear with Oscillatory Motion 90 degrees 1 mm/s 100 pm15 Linear with Oscillatory Motion 90 degrees 0.1 mm/s 570 pm16 Linear with Oscillatory Motion 90 degrees I mm/s 570 pm
Each set of experiments is conducted on the same piece of specimen pig skin to
avoid skin variation. The tests in each experiment were conducted in a rapid succession
in order to obtain consistent results, since the texture of the pig skin changes after
prolonged exposure to the air. Each experiment took about 30 minutes to conduct. Ten
sets of experiments were performed to verify repeatability of this experiment. Each
experiment uses a different pig skin sample.
37

Chapter 4Results and Discussion
In this chapter, the various needle insertion force results are presented and
discussed. The micro needle insertion is also characterized using existing models.
4.1 Results and Discussion
Ten experiments were conducted and data were collected. A typical set of needle
insertion force results are shown in Figure 4-1 and Figure 4-2. All experiments
demonstrate a general trend and therefore verify the repeatability of the experiments.
The results show that the micro needle requires lower insertion force (peak force
from plots) than the 24-Gauge (570 pm) surgical needle. Since the 24-Gauge needle is
larger in diameter, it makes sense that more force would be required to push the larger
needle into skin.
Results also show that the insertion force of a micro needle into skin at 150 angle
of insertion is lower than that of a 90* one.
A higher speed of needle insertion does not appear to have a significant effect on
insertion force. There is no significant difference in the shape of the plots. The
mechanical behavior of the skin is not affected by higher insertion speed.
The results also show that the method of linear insertion with oscillatory motion
(frequency of 5 kHz and amplitude of 20 mV) has no significant effect on lowering
insertion forces into skin.
The following pages show the plots and an analysis of the results follows.
38

0.7
0.8
0.7
0.1
M
0.1
0.3
0.2
0.1
0
-0.1
150, 0.1 mm/s
0 1 2
150, 0.1 mm/s
4-
InsertionForce [N] of100 pmneedle
InsertionForce [N] of24-Gauge(570 pm)needle
150, 1 mm/s
0.9 -
0.8 -
0.7 -
0.6 -
0.5
0.4 -
0.3
0.2 -
0.1 -
0
-0.113 0 1 2 3
15', 1 nm/s
0.9-
0.8-
0.7-
0.6-
0.5-
0.4-
0.3-
0.2-
0.1 -
0
-0.10 1 2 3
Distance [mm]
900, 0.1 mm/s
0.9-
0.8-
0.7-
0.6-
0.5-
0.4-
0.3-
0.2-
0.1
0
-0.110 1 2 3
90, 0.1 mm/s
0.9 -
0.8
0.7
0.6
0.5
0.4
0.3-
0.2-
0.1
0
-0.10 1 2
Distance [mm]3
900, 1 mm/s
0.9-
0.8
0.7
0.6
0.5
0.4
0.3
0.2-
0.1
0-
-0.1 '0 1 2 3
900, 1 mm/s
0.9-
0.8-
0.7
0.6
0.5
0.4-
0.3
0.2
0.1
0
-0.10 1 2 3
Distance [mm]
Figure 4-1. Insertion force versus displacement results using linear insertion method.
39
0.7- -
0.6 -
0.5
0.4 -
0.3
0.2-
0.1
0
-0.10 1 2 3
Distance [mm]
0.9
n

InsertionForce [N] of100 pmneedle
InsertionForce [N] of24-Gauge(570 pm)needle
150, 0.1 mm/s
0.9-
0.8-
0.7-
0.6-
0.5-
0.4-
0.3-
0.2-
0.1 -
-0.10 1 2 3
150, 0.1 mm/s
0.9-
0.8-
0.7-
0.6-
0.5-
0.4-
0.3-
0.2-
0.1 -
0 -
-0.10 1 2 3
Distance [mm]
150, 1 mm/s
0.9-
0.8-
0.7-
0.6-
0.5-
0.4-
0.3-
0.2-
0.1 -
0
-0.1 '0 1 2 3
150, 1 nrM/s
0.9-
0.8-
0.7-
0.6-
0.5-
0.4-
0.3-
0.2-
0.1 -
0
-0.10 1 2 3
Distance [mm]
90', 0.1 mm/s
0.9-
0.8-
0.7-
0.6-
0.5-
0.4-
0.3-
0.2
0.1
0--
-0.110 1 2 3
90', 0. 1 mm/s
0.9-
0.8-
0.7-
0.6-
0.5-
0.4-
0.3
0.2-
0.1
0
-0.10 1 2 3
Distance [mm]
0.9
0.8
0.7
0.6
0.5
0.4
0.3
0.2
0.1
0
-0.1
0.9
0.8
0.7
0.6
0.5
0.4
0.3
0.2
0.1
0
-0.1
900, 1 mm/s
0 1 2 3
900, 1 mm/s
0 1 2Distance [mm]
3
Figure 4-2. Insertion force versus displacement results using linear insertion with
oscillatory motion method.
40
4.2 Characterization of Micro Needle Insertion into Skin
In this section, a detailed data analysis of one of the needle insertion tests is made.
Data are also fitted to an existing physical model.
4.2.1 Data Analysis
0.2,
First point ofpuncture (peakforce = 164 mN)
Needledeformingskin
Needle slipsskin
Needledeformingsecond layer
Skin deformingas needle ispulling out
Second pointof puncture
Nesli
edleps again
Skinslidingup theshaftofneedle
Needle pulling out
I I I0.5 1 1.5 2 2.5 3
Displacement [mm]
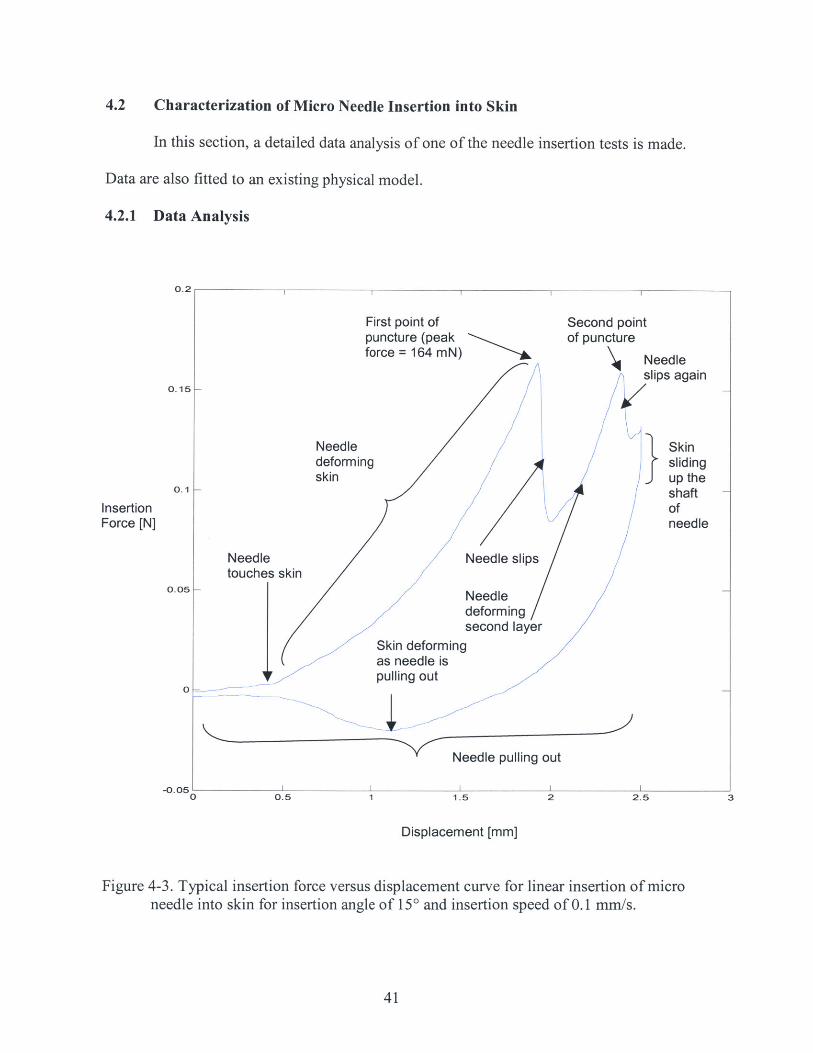
Figure 4-3. Typical insertion force versus displacement curve for linear insertion of microneedle into skin for insertion angle of 150 and insertion speed of 0.1 mm/s.
41
0.151-
0.1 H
InsertionForce [N]
Needletouches
0.05 H
0
-0.05'0

A typical insertion versus displacement plot is shown in Figure 4-3. Figure 4-4
illustrates how the skin behaves when a micro needle penetrates it. As the micro needle
approaches the skin, it touches the tissue and deforms the elastic portion (due to collagen
and elastic fibers of dermis) of the skin (see Figure 4-4(A)). The initial nonlinear portion
of Figure 4-3 shows the deformation of skin. The skin deforms until a point where the
needle first punctures the skin. This is shown at the first peak (point of puncture) in the
Figure 4-3. After the needle punctures the first layer (epidermis), it slips, and this is
evident in the sudden drop in insertion force after the first peak. As the needle slips, it
comes in contact with an internal layer (possibly the dermis) and continues to deform the
internal layer (see Figure 4-4(B)). The deformation continues until the needle punctures
the internal layer of skin. This is shown in the sudden drop of insertion force after the
second point of puncture.
42
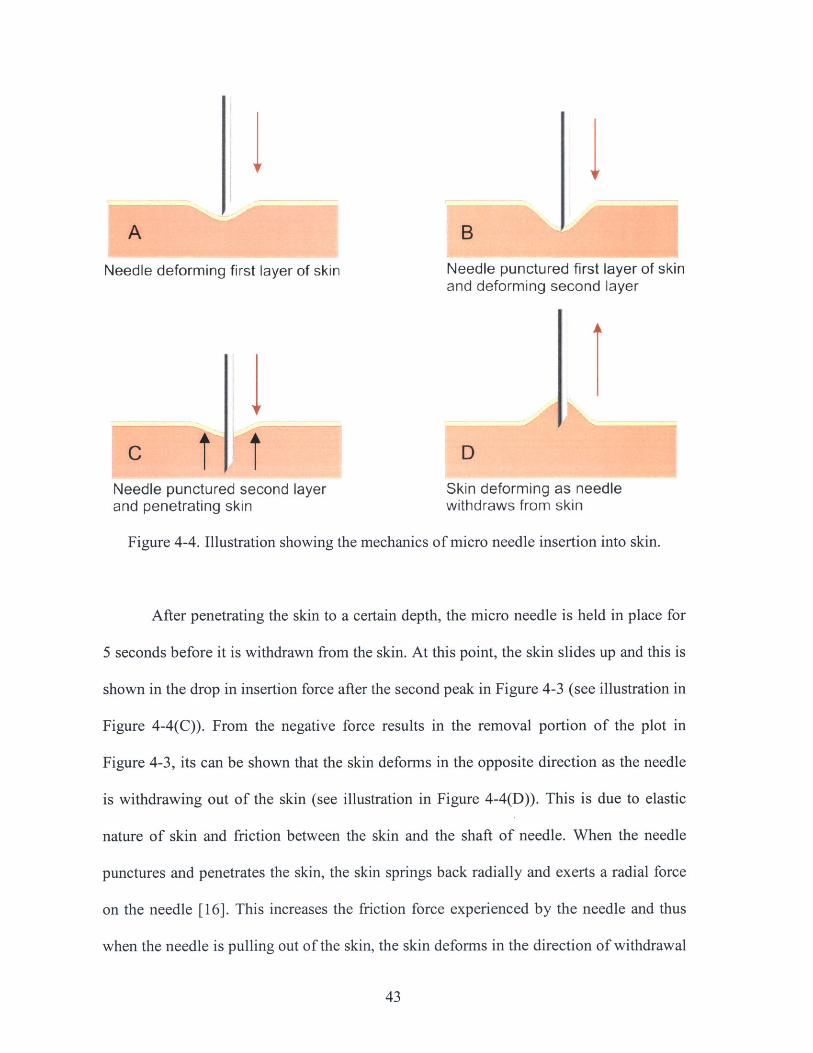
Needle deforming first layer of skin Needle punctured first layer of skinand deforming second layer
C D
Needle punctured second layer Skin deforming as needleand penetrating skin withdraws from skin
Figure 4-4. Illustration showing the mechanics of micro needle insertion into skin.
After penetrating the skin to a certain depth, the micro needle is held in place for
5 seconds before it is withdrawn from the skin. At this point, the skin slides up and this is
shown in the drop in insertion force after the second peak in Figure 4-3 (see illustration in
Figure 4-4(C)). From the negative force results in the removal portion of the plot in
Figure 4-3, its can be shown that the skin deforms in the opposite direction as the needle
is withdrawing out of the skin (see illustration in Figure 4-4(D)). This is due to elastic
nature of skin and friction between the skin and the shaft of needle. When the needle
punctures and penetrates the skin, the skin springs back radially and exerts a radial force
on the needle [16]. This increases the friction force experienced by the needle and thus
when the needle is pulling out of the skin, the skin deforms in the direction of withdrawal
43

until the friction force acting on the walls of the needle is insufficient to stretch and hold
the skin any longer. At this point, the skin slips from the needle and returns to the
unstretched position. The analysis of the skin mechanics during needle insertions is based
on results and verified by physical observations of behavior of the skin.
4.2.2 Physical Model
From Figure 4-3, it can be shown that force data collected is a summation of
stiffness, friction, and cutting forces, as shown in Equation 4.1 [19]. The stiffness force is
pre-puncture, and the friction and cutting forces (penetration force) are post-puncture.
fneedle ( = fstfness (X ) + ffrictio X2 ) + feutting (X2 ) , (4.1)
where x is the displacement of needle, x, is the pre-puncture displacement of needle and
X2 is the post-puncture displacement of needle.
The stiffness force is due to the elastic properties of the skin. The elasticity of the
skin can be identified from the pre-puncture force data in Figure 4-3. Biological tissue is
linearly elastic for small deformations [14]. However, it is clear from Figure 4-3 that the
deformation is significant, so the force must be modeled by a nonlinear method.
Assuming a quasi-static stiffness response, a nonlinear spring model demonstrated by
d'Aulignac in modeling deformation of a human thigh is used [12]. The graphical
representation of this nonlinear model is shown in Figure 4-5.
44

Linear Spring
Nonlinear Spring
Figure 4-5. Nonlinear model of human thigh.
The nonlinear force model is given by
fsness (x) = , (4.2)ax + b
where x is the difference in the length of the nonlinear springs with respect to their
original, resting length. The nonlinear stiffness parameters a and b are fitted to match the
deformation measured on skin.
Based on deformation of skin from five tests on the linear insertion of micro
needles into skin at an angle of 90' and a speed of 0.1 min/s, the average values of
stiffness parameters a and b were found and are shown in Table 4-1.
45
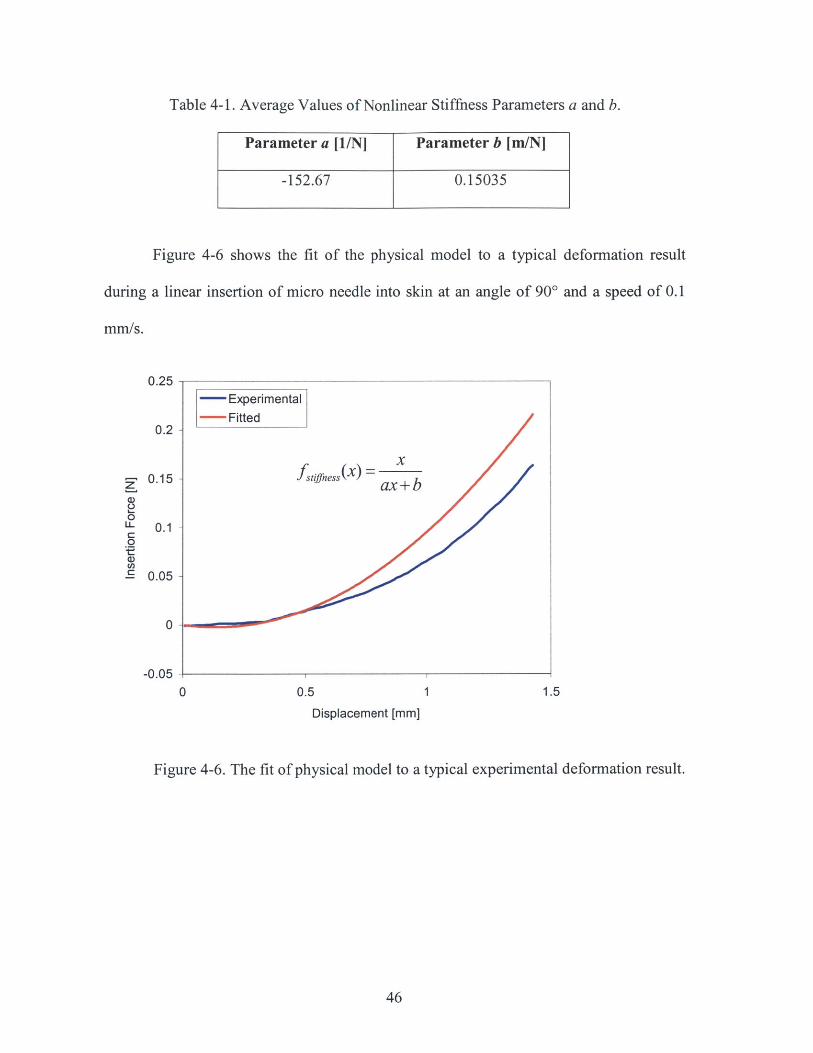
Average Values of Nonlinear Stiffhess Parameters
Parameter a [1/NJ Parameter b [m/N]
-152.67 0.15035
Figure 4-6 shows the fit of the physical model to a typical deformation result
during a linear insertion of micro needle into skin at an angle of 90' and a speed of 0.1
mm/s.
0.25 -
0.2 -
0.15 -
0.1 -
0.05 -
0
-0.050 0.5 1.5
Displacement [mm]
Figure 4-6. The fit of physical model to a typical experimental deformation result.
46
- Experimental- Fitted
xfstiffness ax+b
0ILC0
Table 4-1. a and b.
1

The penetration force is made up of the friction and cutting forces. The friction
force occurs along the length of the needle, and is due to tissue adhesion and damping.
The friction force can be modeled as
friction = bpvneedle, (4.3)
where bp is the damping coefficient per unit length, 1 is the length of needle in the skin
and vneedle is the velocity of the needle tip.
Within the limits of this experiment, only vneedle can be determined accurately. The
damping coefficient per unit length, bp, is not known accurately, and varies from
specimen to specimen. This is especially true when the properties of skin specimen
change over time due to exposure to the atmosphere. The length of needle in skin, 1, also
cannot be accurately determined within the limits of this experiment because the position
of the skin surface is not measured. Hence, the friction force cannot be accurately
modeled.
The cutting force is that which is necessary to slice through the skin. This force
exists as a combination of cutting forces and tissue stiffness at the tip of the needle, since
the needle encounters stiffness as it cuts through new tissue. The cutting force can be
calculated by subtracting the friction force from the total penetration force. However, in
this experiment, the friction force cannot be accurately modeled. Thus, it is difficult to
model cutting force of a needle through a skin, although ideally, cutting forces will be
constant and unrelated to the needle depth.
4.3 Limitations
One of the limitations of this experiment is the instrumentation's inability to
detect the actual length of needle into skin during an insertion. This limits the ability to
47

model the friction force and cutting force in skin. Another limitation is that the properties
of skin specimen change over time after it is exposed to the atmosphere, probably due to
the loss of moisture. There was no test chamber where humidity could be controlled and
thus the change in properties may have affected the insertion force results. It is also
difficult to compare results from one insertion to another because skin properties are
different at different spots of insertions.
48

Chapter 5Conclusion
5.1 Summary
Instrumentation was designed and fabricated to characterize micro needle
insertion into biological tissues. Maximum force of micro needles puncturing skin at
various insertion angles and velocities were also measured and quantified. Higher
insertion speed does not have a significant effect insertion force. A smaller angle of
insertion requires less force for the micro needle to puncture skin. The micro needle (100
ptm OD) requires less insertion force than a 24-Gauge (570 Im OD) surgical needle. The
linear insertion method with an oscillatory motion, when compared to a regular linear
insertion method, does not have a significant effect on lowering insertion force. The
lowest force required to puncture skin is when insertion angle is 150 and insertion speed
is 0.1 mm/s. This force ranges from 120 to 200 mN. For physical model representation,
only the stiffness force can be modeled accurately. The friction and cutting force of micro
needle cannot be modeled due to the limitation of the instrumentation. All these pieces of
information are crucial for a micro needle injection transdermal drug delivery project.
5.2 Future Work
Although the instrumentation is able to measure and quantify micro needle
insertion forces successfully, there are certain aspects of it that need improvement.
5.2.1 Temperature and Humidity Control Chamber
One of problems faced when conducting the experiment was that the properties of
the skin specimen changed over time during exposure to the atmosphere. If the test is
49

conducted in an enclosed chamber where temperature and humidity can be controlled, the
skin specimen properties may be maintained for a longer time.
5.2.2 Rotational Insertion Module
A linear insertion with rotational motion about the axis of insertion method may
reduce micro needle insertion force [15]. A module may be included in the
instrumentation to performed rotational needle insertion into skin.
Direction of insertion
Rotation aboutinsertion axis 1800back and forth
To LoadcellAngle- cell varying
platform
Micro needle
Pig skinEpoxy
Figure 5-1. Rotational insertion method.
Similar analysis can be made with this new method of insertion, and then
compared with the experiments presented here.
5.2.3 X-ray Imaging System
Because the exact penetration length of micro needle in the skin is not known
during insertion, an x-ray imaging system may be integrated with the present
50

instrumentation to generate radiographs to reveal actual length of needles in skin. With
the x-ray imaging, deflection of needles in skin can also be studied [15].
5.2.4 Synthetic Skin Specimen
Synthetic "skin" specimen of known stiffness and damping properties can be used
to replace real skin samples. The problem of skin variation will be reduced if the needle
insertions are made on synthetic "skin" specimens. In this way, it can be known for sure
whether or not the variations in insertion forces are due to different methods, angles, and
velocities of needle insertions.
51

References
1. Signal Conditioning Amplifier 2311 Instruction Manual. Instruments Division,
Measurement Group, Inc, 1993.
2. Mini-Shaker Type 4810 Instruction Manual. Brtiel and Kjaer, 1979.
3. Optics and Optical Instruments Catalog. Edmund Industrial Optics, 2002, pp 184.
4. Mitutoyo Objectives [Web Page]. http://www.mitutoyo.com.
5. Microsoft Direct X8A Software [Web Page]. http://www.microsoft.com.
6. Structure of Human Skin [Web Page].
http://www.cosmetique.ch/forever-young-how-it-works-diagram.html.
7. IEEE 1394 Digital Interface [Web Page]. http://www.1394ta.org.
8. Universal Serial Bus [Web Page]. http://www.usb.org.
9. The 858 Mini Bionix II Test System [Web Page].
http://www.mts.com/menusystem.asp?DataSource=0&NodeID=1 86.
10. Allen, A. The Skin. 2"d ed., New York: Grune and Stratton, 1967, pp. 2-18.
11. Angel, A. A Controllable, Nano-Volumetric, Transdermal Drug Delivery Device
[Master of Science Thesis]. Cambridge MA: MIT; 2002 Jun.
12. d'Aulignac, D., Balaniuk, R. and Laugier, C. A haptic interface for a virtual exam
of the human thigh. Proceedings of the 2000 IEEE International Conference on
Robotics & Automation, pp. 2452-2456.
13. Deitel, H.M. Visual Basic.Net: How to Program. 2nd ed., New Jersey: Prentice
Hall, 2002.
14. Fung, Y.C. Biomechanics: Mechanical Properties of Living Tissues. 2 "d ed., New
York: Springer-Verlag, 1993, pp. 277.
52

15. Hochman, M. N. and Friedman, M. J. In vitro study of needle deflection: A linear
insertion technique versus a bidirectional rotation insertion technique.
Quintessence International, Vol. 31, No. 1, 2000, pp. 33-38.
16. Kataoka, H., Washio, T., Chinzei, K., Mizuhara, K., Simone, C. and Okamura, A.
Measurement of tip and friction force acting on a needle during penetration, Fifth
International Conference on Medical Image Computing and Computer Assisted
Intervention, 2002.
17. Kumar, R. The Steady Hand Robot. http://www.cs.jhu.edu/-rajesh/robot/.
18. Marks, R. and Plewig, G. Skin Models. New York: Springer-Verlag, 1986, pp.
412-418.
19. Simone, C. and Okamura, A.M. Haptic modeling needle insertion for robot-
assisted percutaneous therapy, ICRA 2002.
20. Tortora, G. J. Introduction to the Human Body: The Essentials of Anatomy and
Physiology. 4 th ed., New York: John Wiley and Sons, 1997, pp. 85-86.
53

AppendixVisual Basic 6.0 Code for Precision Motion Control and DataAcquisition
Option Explicit
'Precision Motion Control and Data Acquisition Interface by Wilson Chan
Dim i As Double 'Loop IterationDim data 1 As String 'Voltage Text from Channel 1Dim data2 As String 'Voltage Text from Channel 2Dim data3 As String 'Voltage Text from Channel 3Dim data4 As String 'Voltage Text from Channel 4Dim Vdatal As Double 'Voltage data in numeric form from Channel 1Dim Vdata2 As Double 'Voltage data in numeric form from Channel 2Dim Vdata3 As Double 'Voltage data in numeric form from Channel 3Dim Vdata4 As Double 'Voltage data in numeric form from Channel 4Dim ml As New sleepDim MotorSteps As Long 'steps made by stageDim MotorSteps 1 As Long 'steps made by rotation stageDim Distance As Double 'distance in mmDim velocityl As Double 'velocity in rev/sDim Speed As Double 'velocity in mm/sDim angle 1 As Double 'angle in degreesDim Forward2 As Boolean 'Represent Postive Direction if TrueDim StepsPerRev As Long 'Steps Per RevolutionDim DistPerTurn As Double ' Distance in mm per Revolution
Private Sub FormLoad()
'Initial Values
StepsPerRev = 25000DistPerTurn =5Speed = 1Distance = 0.001Forward2 = True
'Initialize RS-232 Serial Ports when Form Loads
PortA.PortOpen = TruePortB.PortOpen = TruePortC.PortOpen = TruePortD.PortOpen = TruePortE.PortOpen = TruePortF.PortOpen = TruePortG.PortOpen = TruePortH.PortOpen = True
'Disable travel limitsPortH.Output = "l1LHO" + vbCr
'Turn the timer offTimerl.Enabled = False
54

End Sub
Private Sub cmddistClickoDistance = CDbl(txtDist.Text)
End Sub
Private Sub velocityClick()Speed = CDbl(txtvel.Text)
End Sub
Private Sub GOForwardX _Click() 'Move Stage in the Positive XI Direction
velocityl = Round(Speed / DistPerTurn, 5)PortA.Output = "1 V" + CStr(velocityl) + vbCrMotorSteps = Round(Distance * StepsPerRev / DistPerTurn, 0)PortA.Output = "1 D" + CStr(MotorSteps) + vbCrPortA.Output = "i GO" + vbCr
End Sub
Private Sub GOBackwardX IClick() 'Move Stage in the Negative XI Direction
velocityl = Round(Speed / DistPerTurn, 5)PortA.Output = "1 V" + CStr(velocityl) + vbCrMotorSteps = Round(Distance * StepsPerRev / DistPerTurn, 0)
Forward2 = FalseIf Forward2 = False Then
MotorSteps = -1 * MotorStepsEnd If
PortA.Output = "ID" + CStr(MotorSteps) + vbCrPortA.Output = "1_GO" + vbCr
End Sub
Private Sub GOForwardYl Click() 'Move Stage in the Positive Y1 Direction
velocityl = Round(Speed / DistPerTurn, 5)PortB.Output = "2_V" + CStr(velocityl) + vbCrMotorSteps = Round(Distance * StepsPerRev / DistPerTurn, 0)PortB.Output = "2_D" + CStr(MotorSteps) + vbCrPortB.Output = "2_GO" + vbCr
End Sub
Private Sub GOBackwardYl Clicko 'Move Stage in the Negative Y1 Direction
velocityI = Round(Speed / DistPerTurn, 5)PortB.Output = "2 V" + CStr(velocityl) + vbCrMotorSteps = Round(Distance * StepsPerRev / DistPerTurn, 0)
Forward2 = FalseIf Forward2 = False Then
55

MotorSteps = -1 * MotorStepsEnd If
PortB.Output = "2_D" + CStr(MotorSteps) + vbCrPortB.Output = "2_GO" + vbCr
End Sub
Private Sub GOForwardZClickO 'Move Stage in the Positive Z Direction
velocityI = Round(Speed / DistPerTurn, 5)PortC.Output = "3_V" + CStr(velocityl) + vbCrMotorSteps = Round(Distance * StepsPerRev / DistPerTurn, 0)PortC.Output = "3_D" + CStr(MotorSteps) + vbCrPortC.Output = "3_GO" + vbCr
End Sub
Private Sub GOBackwardZClicko 'Move Stage in the Negative Z Direction
velocityl = Round(Speed / DistPerTurn, 5)PortC.Output = "3 V" + CStr(velocityl) + vbCrMotorSteps = Round(Distance * StepsPerRev / DistPerTum, 0)
Forward2 = FalseIf Forward2 = False Then
MotorSteps = -1 * MotorStepsEnd If
PortC.Output = "3 D" + CStr(MotorSteps) + vbCrPortC.Output = "3_GO" + vbCr
End Sub
Private Sub GOForwardX2_Click() 'Move Stage in the Positive X2 Direction
velocityI = Round(Speed / DistPerTurn, 5)PortD.Output = "4 V" + CStr(velocityl) + vbCrMotorSteps = Round(Distance * StepsPerRev / DistPerTurn, 0)PortD.Output = "4 D" + CStr(MotorSteps) + vbCrPortD.Output = "4_GO" + vbCr
End Sub
Private Sub GOBackwardX2_ClickO 'Move Stage in the Negative X2 Direction
velocityI = Round(Speed / DistPerTurn, 5)PortD.Output = "4_ V" + CStr(velocityl) + vbCrMotorSteps = Round(Distance * StepsPerRev / DistPerTurn, 0)
Forward2 = FalseIf Forward2 = False Then
MotorSteps = -1 * MotorStepsEnd If
PortD.Output = "4D" + CStr(MotorSteps) + vbCr
56

PortD.Output = "4_GO" + vbCr
End Sub
Private Sub GOForwardY2_Click() 'Move Stage in the Positive Y2 Direction
velocityI = Round(Speed / DistPerTurn, 5)PortE.Output = "5 V" + CStr(velocityl) + vbCrMotorSteps = Round(Distance * StepsPerRev / DistPerTurn, 0)PortE.Output = "5_D" + CStr(MotorSteps) + vbCrPortE.Output = "5_GO" + vbCr
End Sub
Private Sub GOBackwardY2_Click() "Move Stage in the Negative Y2 Direction
velocityl = Round(Speed / DistPerTurn, 5)PortE.Output = "5_V" + CStr(velocityl) + vbCrMotorSteps = Round(Distance * StepsPerRev / DistPerTurn, 0)
Forward2 = FalseIf Forward2 = False Then
MotorSteps = -1 * MotorStepsEnd If
PortE.Output = "5 D" + CStr(MotorSteps) + vbCrPortE.Output = "5_GO" + vbCr
End Sub
Private Sub insertI05_Click()
'Micro Needle Insertion Experiment
'channel 105 scan for Entran Force Transducer
Dim aStr As StringDim cnt As LongDim TotalScans As LongDim TimerIntSeconds As DoubleDim Nstored As LongDim firstcomma As IntegerDim secondcomma As Integer
Const Chan = 105Dim aStr2 As String
Dim vel As Double 'velocity in rev/secondDim SpeedLocal As Double 'speed in mm/sDim DistanceLocal As Double 'total travel distance in mm
Dim Data() As Double 'col 1: time, col 2:chan 105
57

'Variables for the needle insertion:
TimerIntSeconds = CDbl(txttime.Text) 'secondsDistanceLocal = CDbl(txtdisp.Text) 'mmSpeedLocal = CDbl(txtspeed.Text) 'mm/s
'Stage moves by a total of 2.5 mm'
Open "c:\Users\Wilson\data\pigshoulder2\sine\ch" & CStr(Chan) & "_" & txtfile.Text & ".txt" ForOutput As #1
TotalScans = (DistanceLocal / SpeedLocal) / TimerIntSeconds 'Number of data points taken perdirection
ReDim Data(1 To TotalScans, 1 To 2) As Double
'Open file for data storage:
'Insertion
vel = Round(SpeedLocal / DistPerTurn, 5) 'Convert to rev/secondPortB.Output = "2 V" + CStr(vel) + vbCrMotorSteps = Round(DistanceLocal * StepsPerRev / DistPerTurn, 0)Forward2 = FalseIf Forward2 = False ThenMotorSteps = -1 * MotorStepsEnd IfPortB.Output = "2_D" + CStr(MotorSteps) + vbCr 'Do not start stepper motors yet.
'Before starting motion, we need to initialize the force measurement.
PortF.Output = "*RST" + vbCrLfCall ml.SleepMS(100)
PortF.Output = "CONF:VOLT:DC 10,0.00003,(@105)" + vbCrLfCall ml.SleepMS(100)PortF.Output = "ROUT:CHAN:DELAY " & CStr(TimerIntSeconds) & ",(@105)" & vbCrLfCall ml.SleepMS(100)
PortF.Output = "ROUT:SCAN (@" & CStr(Chan) & ")" + vbCrLfCall ml.SleepMS(100)
PortF.Output = "TRIG:COUN " & CStr(TotalScans) + vbCrLfAcquisition scanning
Call ml.SleepMS(100)
PortB.Output = "2_GO" + vbCr
'Number of scans for the Data
'Start the motors
58

PortF.Output = "INIT" + vbCrLf 'Start ScanCall ml.SleepMS(100)
Call ml.SleepMS(CLng(TimerlntSeconds * TotalScans * 1000 + 1000))
'Retrieve dataPortF.Output = "FORM:READ:ALAR OFF" + vbCrLfCall ml.SleepMS(50)PortF.Output = "FORM:READ:CHAN ON" + vbCrLfCall ml.SleepMS(50)PortF.Output = "FORM:READ:TIME ON" + vbCrLfCall ml.SleepMS(50)PortF.Output = "FORM:READ:UNIT OFF"Call ml.SleepMS(50)
'Output Alarm Status Off
'Output Channel Number On
'Output Time On
'Output Units Off
Nstored = TotalScans 'Number of data points that should have been taken
For i = 1 To NstoredPortF.Output = "R? 1" + vbCrLfCall ml.SleepMS(100)aStr = PortF.Input 'Read Ocnt = 0Do While cnt < 100 And Left(aStr, 1) <> "#"
cnt = cnt + 1PortF.Output = "R? 1" + vbCrLfCall ml.SleepMS(100)aStr = PortF.Input 'Read O
Loop
itput Buffer as data
itput Buffer as data
aStr = Right(aStr, Len(aStr) - 4)firstcomma = InStr(1, aStr, ",")secondcomma = InStr(firstcomma + 1, aStr, ",")
aStr2 = Left(aStr, firstcomma - 1)Data(i, 2) = CDbl(aStr2)aStr2 = Mid(aStr, firstcomma + 1,Data(i, 1) = CDbl(aStr2)
Next i
'Read channelsecondconima - firstcomma - 1)
'time data
Print #1, "Channel 105"Print #1, "Force Sample Time "+ CStr(TimerlntSeconds)Print #1, "TravelDistance " + CStr(DistanceLocal)Print #1, "Velocity " + CStr(SpeedLocal)
Print #1, "Time(s)" + " " + "Force(N)"
For i = 1 To NstoredPrint #1, CStr(Data(i, 1)) +"
Next i" + CStr(Data(i, 2))
Call ml.SleepMS(5000)
59

'Removal
vel = Round(SpeedLocal / DistPerTurn, 5)PortB.Output = "2_V" + CStr(vel) + vbCrMotorSteps = Round(DistanceLocal * StepsPerRev / DistPerTurn, 0)
PortB.Output = "2_D" + CStr(MotorSteps) + vbCr 'Don't start yet.
'Before starting motion, we need to initialize the force measurement.
PortF.Output = "*RST" + vbCrLfCall ml.SleepMS(1000)
PortF.Output = "CONF:VOLT:DC 10,0.00003,(@105)" + vbCrLfCall ml.SleepMS(100)PortF.Output = "ROUT:CHAN:DELAY " & CStr(TimerlntSeconds)Call ml.SleepMS(100)
PortF.Output = "ROUT:SCAN (@" & CStr(Chan) & ")" + vbCrLf
PortF.Output = "TRIG:TIM " & CStr(TimerlntSeconds) + vbCrLfscans
Call ml.SleepMS(100)
PortF.Output = "TRIG:COUN " & CStr(TotalScans) + vbCrLfAcquisition scanning
Call ml.SleepMS(100)
PortB.Output = "2_GO" + vbCrPortF.Output = "INIT" + vbCrLf
& ",(@105)" & vbCrLf
'Use the internal timer to trigger
'Number of scans for the Data
'Start the motors'Start the Scan
Call ml.SleepMS(CLng(TimerlntSeconds * TotalScans * 1000 + 1000))
Nstored = TotalScans
'Retrieve DataPortF.Output = "FORM:READ:ALAR OFF" + vbCrLfCall ml.SleepMS(50)PortF.Output = "FORM:READ:CHAN ON" + vbCrLfCall ml.SleepMS(50)PortF.Output = "FORM:READ:TIME ON" + vbCrLfCall ml.SleepMS(50)PortF.Output = "FORM:READ:UNIT OFF"Call ml.SleepMS(50)
For i = 1 To NstoredPortF.Output = "R? 1" + vbCrLfCall ml.SleepMS(75)aStr = PortF.Input 'Read Output Buffer as data
'Output alarm status Off
'Output channel number On
'Output time On
'Units output Off
60

cnt = 0 'if read is wrong, try again...Do While cnt < 100 And Left(aStr, 1) <> "#"
cnt = dnt + 1PortF.Output = "R? 1" + vbCrLfCall ml.SleepMS(100)aStr = PortF.Input 'Read Output Buffer as data
Loop
aStr = Right(aStr, Len(aStr) - 4)firstcomma = InStr(l, aStr, ",")secondcomma = InStr(firstcomma + 1, aStr, ",")
aStr2 = Left(aStr, firstcomma - 1)Data(i, 2) = CDbl(aStr2) 'channelData(i, 1) = CDbl(Mid(aStr, firstcomma + 1, secondcomma - firstcomma + 1)) 'time data
Next i
'Save the removal data:For i = 1 To Nstored
Print #1, CStr(Data(i, 1)) +"Next i
Close #1
End Sub
Private Sub measureClick()
" + CStr(Data(i, 2))
Open "c:\Users\Wilson\data\spring.txt" For Output As #1
Print #1, "Displacement (mm)" + " "+ "Force 1 (N)" + " " + "Force 2 (N)"
For i= 1 To 10
'Moves Stage by 1 Step for each loop
velocityl = Round(Speed / DistPerTurn, 5)PortB.Output = "2_V" + CStr(velocityl) + vbCrMotorSteps = Round(Distance * StepsPerRev / DistPerTurn, 0)PortB.Output = "2_D" + CStr(MotorSteps) + vbCrPortB.Output = "2_GO" + vbCr
'Measure Output Voltage from HP 34970A Data Acquisition Unit Channel 1
PortF.Output = "CONF:VOLT:DCCall ml.SleepMS(100)PortF.Output = "INIT" + vbCrLfCall ml.SleepMS(100)PortF.Output = "FETC?" + vbCrLfCall ml.SleepMS(50)
10,0.00003,(@101)" + vbCrLf
datal = PortF.Input 'Read Output Buffer as data
61
Vdatal = CDbl(datal) 'Change data from string to doubleVdatal = Vdatal * 10 'Converts voltage value to Force Using ION/V Calibration
'Measure Output Voltage from HP 34970A Data Acquisition Unit Channel 2
PortF.Output = "CONF:VOLT:DC 10,0.00003,(@102)" + vbCrLfCall ml.SleepMS(100)PortF.Output = "INIT" + vbCrLfCall ml.SleepMS(100)PortF.Output = "FETC?" + vbCrLfCall ml.SleepMS(50)
data2 = PortF.Input 'Read Output Buffer as dataVdata2 = CDbl(data2) 'Change data from string to doubleVdata2 = Vdata2 * 10 'Converts voltage value to Force Using ION/V Calibration
Print #1, CStr(i) + " " + CStr(Vdatal) +" "+ CStr(Vdata2)
Call ml.SleepMS(100)
Next i
End Sub
Private Sub measureblockClickO
'Compression
Open "c:\Users\Wilson\data\block80a.txt" For Output As #1
Print #1, "Displacement (um)" + " "+ "Force 1 (N)" +" " + "Force 2 (N)"
Distance = 0.01 'Stage moves by 10 um'i= 0
Do'For i = 1 To 100
'Moves Stage by 1 Step for each loop
i=i+ 1
velocityl = Round(Speed / DistPerTurn, 5)PortB.Output = "2_V" + CStr(velocityl) + vbCrMotorSteps = Round(Distance * StepsPerRev / DistPerTurn, 0)
Forward2 = FalseIf Forward2 = False ThenMotorSteps = -1 * MotorStepsEnd If
PortB.Output = "2_D" + CStr(MotorSteps) + vbCrPortB.Output = "2_GO" + vbCr
'Measure Output Voltage from HP 34970A Data Acquisition Unit Channel 1
62

PortF.Output = "CONF:VOLT:DC 10,0.00003,(@101)" + vbCrLfCall ml.SleepMS(100)PortF.Output = "INIT" + vbCrLfCall ml.SleepMS(100)PortF.Output = "FETC?" + vbCrLfCall ml.SleepMS(50)
data 1 = PortF.Input 'Read Output Buffer as dataVdatal = CDbl(datal) 'Change data from string to doubleVdatal = Vdatal * 10 'Converts voltage value to Force Using ION/V Calibration
'Measure Output Voltage from HP 34970A Data Acquisition Unit Channel 2
PortF.Output = "CONF:VOLT:DC 10,0.00003,(@102)" + vbCrLfCall ml.SleepMS(100)PortF.Output = "INIT" + vbCrLfCall ml.SleepMS(100)PortF.Output = "FETC?" + vbCrLfCall ml.SleepMS(50)
data2 = PortF.Input 'Read Output Buffer as dataVdata2 = CDbl(data2) 'Change data from string to doubleVdata2 = Vdata2 * 10 'Converts voltage value to Force Using ION/V Calibration
Print #1, CStr(i * 10) +" "+ CStr(Vdatal) +" "+ CStr(Vdata2)
Call ml.SleepMS(50)
Loop Until Vdatal >= 50 And Vdata2 >= 50 'Loop stops when Max force of 50 N is reached
'Extension
Do'Moves Stage by 1 Step for each loop
i=i- 1
velocityI = Round(Speed / DistPerTurn, 5)PortB.Output = "2_V" + CStr(velocityl) + vbCrMotorSteps = Round(Distance * StepsPerRev / DistPerTurn, 0)PortB.Output = "2_D" + CStr(MotorSteps) + vbCrPortB.Output = "2_GO" + vbCr
'Measure Output Voltage from HP 34970A Data Acquisition Unit Channel 1
PortF.Output = "CONF:VOLT:DC 10,0.00003,(@101)" + vbCrLfCall ml.SleepMS(100)PortF.Output = "INIT" + vbCrLfCall ml.SleepMS(100)PortF.Output = "FETC?" + vbCrLfCall ml.SleepMS(50)
datal = PortF.Input 'Read Output Buffer as dataVdatal = CDbl(datal) 'Change data from string to doubleVdatal = Vdatal * 10 'Converts voltage value to Force Using ION/V Calibration
63

'Measure Output Voltage from HP 34970A Data Acquisition Unit Channel 2
PortF.Output = "CONF:VOLT:DC 10,0.00003,(@102)" + vbCrLfCall ml.SleepMS(100)PortF.Output = "INIT" + vbCrLfCall ml.SleepMS(100)PortF.Output = "FETC?" + vbCrLfCall ml.SleepMS(50)
data2 = PortF.Input 'Read Output Buffer as dataVdata2 = CDbl(data2) 'Change data from string to doubleVdata2 = Vdata2 * 10 'Converts voltage value to Force Using 1 ON/V Calibration
Print #1, CStr(i * 10)+" " + CStr(Vdatal) +" "+ CStr(Vdata2)
Call ml.SleepMS(50)
Loop Until i = 0
End Sub
64