insulation condition assessment of power transformers
TRANSCRIPT
8/22/2019 Insulation Condition Assessment of Power Transformers
http://slidepdf.com/reader/full/insulation-condition-assessment-of-power-transformers 1/16
Turk J Elec Eng & Comp Sci,Vol.17, No.1, 2009, c TUBITAKdoi:10.3906/elk-0802-5
Insulation Condition Assessment of Power Transformers
Using Accelerated Ageing Tests
Mohammad MIRZAIE1, Ahmad GHOLAMI2, Hamid Reza TAYEBI3
1Department of Electrical Engineering, Babol Noshirvani University of Technology,
Babol-IRAN
e-mail: [email protected] 2Department of Electrical Engineering, Iran University of Science and Technology
Tehran-IRAN
e-mail: [email protected] 3Jahad Daneshgahi Elm va Sanat, Tehran-IRAN
e-mail: [email protected]
Abstract
Thermal stress due to losses and environment temperature causes degradation to paper/oil insulation
systems in transformers, even at operating temperature. Experience indicates that thermal ageing of oil and
paper in power transformers leads to the change of some insulation characteristics.
In this paper, insulating papers immersed in oil have been acceleratory aged at 140, 150, and 160 ◦C under
laboratory conditions. Some of the oil properties, such as water content, breakdown voltage, acidity, together with the aged insulating paper properties such as electric strength, dielectric dissipation factor and tensile
strength were measured and analyzed. Also, insulation system conditions under thermal stress have been
evaluated by electrical/distinctive techniques like recovery voltage, polarization and depolarization currents.
Correlations between these parameters have been investigated. Finally, paper tensile strength has been used
as a criterion to estimation of insulating paper life time.
Key Words: Transformer, insulation assessment, monitoring, polarization, recovery voltage.
1. Introduction
Transformers are one of the most expensive and strategically important components of any power system, so that
their proper and continuous function is important to system reliability. Ageing of the oil/paper insulation system
of power transformers is influenced by thermal, electromechanical and chemical stresses. Thermal stress leads
to major degradation process for both oil and cellulose paper. Under all these stresses, the paper ultimately
becomes brittle and the durability against mechanical stress is strongly reduced. As a result, reduction in
expected life of transformer will occur [1–3].
One of the needs in power transformer lifetime management is insulation condition assessment. A variety
of electrical, mechanical and chemical techniques are currently available for insulation testing of power trans-
39
8/22/2019 Insulation Condition Assessment of Power Transformers
http://slidepdf.com/reader/full/insulation-condition-assessment-of-power-transformers 2/16
Turk J Elec Eng & Comp Sci, Vol.17, No.1, 2009
formers. Ageing of oil is monitored by measuring properties of oil such as permittivity, dielectric dissipation
factor, breakdown strength, acidity, water content, flash point, interfacial tension, etc. The analysis of gases
dissolved in the oil has been used as a diagnostic tool for many years to determine the transformer condition.
Criteria are based on experience from failed transformers, transformers with incipient faults, laboratory simula-tion and statistical studies. The ageing process of paper can be monitored by measuring many properties such
as mechanical properties (tensile strength), degree of polymerization (DP), furan content in oil, etc. Degree of
polymerization has been related to the paper tensile strength. A new insulating paper has DP value of about
1000–1200, but falls to about 250 when the tensile strength reaches about half its original strength [4]. Therefore
determining transformer’s insulation condition would be of tremendous important.
Modern electrical testing techniques include frequency domain measurements of dissipation factor, com-
plex capacitance and permittivity of the transformer insulation. In addition, time domain dielectric response
measurement technique like return voltage measurement (RVM) and the polarization and depolarization current
(PDC) measurements have gained immense popularity as supplements to existing insulation assessment tech-
niques. These dielectric response measurement techniques, in addition to being simple to perform, can provideadequate relevant information about the condition of oil/paper insulation in a transformer [5, 6].
Past investigations have shown transformer life is actually the life of the insulating paper. The authors
of [7] carried out long-duration ageing experiments, measuring different parameters such as dissolved gas and
furfural content in oil and the degree to which the paper underwent polymerization (DP). They showed that
only a few parameters have a good correlation with DP. They also assessed the elapsed life of insulation paper,
studying it under accelerated thermal stress. A similar investigation is reported in [8]. In [1, 9], several
electrical and chemical properties of paper immersed in oil (such as gel permeation chromatography, dielectric
dissipation factor, voltage strength, lightning voltage strength, etc. for aged paper) were studied using short
time accelerated thermal ageing experiments from which possible correlations were investigated among measured
parameters. In [2], the influences of air and oil type on aging of pressboard have been studied under theinfluence of a considerable amount of moisture. Also investigated was the DP rate, the development of furanic
compounds, as well as gas-in-oil analysis in comparison with the aging of the pure oil under identical conditions.
In [10], mathematical models have been presented for formed and dissolved water estimation in oil by using
of transmitted water between oil and paper in power transformers. Polarization and depolarization currents
on transformers have been measured in [11]. It shows that the peak of recovery voltage changes with charging
voltage but does not effect time-to-peak. Also the curve has been extrapolated with the function of polarization
and depolarization currents variations.
In [12], a circuit model is described which describes and parameterizes the dielectric behaviour of the
transformer’s main insulation system. There, the model parameters had been identified from the dielectric
measurements before and after treatment. In addition, a correlation has been developed between the physicalcondition of the insulation and the equivalent model parameters.
In [13], the polarization process has been described with appropriate dielectric response theories; and
commonly used polarization methods have been explained with emphasis on return voltage measurements. It
showed that increasing in polarization current is related to increase in paper water content. Maximum recovery
voltage, in terms of charging time and current slope on power transformers, has been demonstrated in [5].
In this work, we present results of an investigation into the thermal degradation of oil/paper insulation
system in copper via a series of accelerated ageing experiments carried out over the temperature range 140–
40
8/22/2019 Insulation Condition Assessment of Power Transformers
http://slidepdf.com/reader/full/insulation-condition-assessment-of-power-transformers 3/16
MIRZAIE, GHOLAMI, TAYEBI: Insulation Condition Assessment of Power...,
160 ◦C. Recovery voltage, polarization and depolarization currents tests are carried out on aged insulation
systems at regular periods. Insulating paper properties such as dielectric dissipation factor, voltage strength
and tensile strength as well as water content, breakdown voltage and acidity of the insulating oil are measured
and the results are discussed and analyzed. Possible relations between observations have been studied.
2. Polarization and Recovery Voltage
Application of DC voltage is to pass a polarized current, which can be used to polarize an insulation system. On
short-circuiting the voltage source, the resulting current becomes the depolarization current , and the insulation
returns to the original, neutral condition. However, a residual polarization may remain when the short circuit
is removed and depends on factors such as charging time, short circuit time, charging voltage level, insulation
temperature, and design of the test object. The residual polarization results in a voltage, referred to as recovery
voltage or return voltage . Hence the application of a DC charge can be used to characterize the influence
of material properties, such as conductivity, on the dielectric response. This method is used to evaluate the
moisture content of cellulose in power transformers.
2.1. Polarisation and Depolarization Currents
Assuming a homogeneous electric field E (t) is applied to the dielectric material, the current density through
the surface of the material can be written as
J (t) = σ ·E (t) +d
dtD(t). (1)
The current density J (t) is the sum of the conduction and displacement currents; σ is the dc conductivity; and
D(t) is the electric displacement:
D(t) = εrε◦E (t) + P (t). (2)
Substitution of equation 1 into equation 2 brings
J (t) = σ · E (t) + εrε◦∂E (t)
∂t+
∂P (t)
∂t. (3)
In above relations, ε◦ is vacuum permittivity and εr is the relative permittivity of the insulation at power
frequency (typically, εr= 4.5 for cellulose paper/pressboard, and εr = 2.2 for transformer oil). P (t) is the
dielectric polarization and is related to the response function f (t) of the material by the relation
P (t) = ε◦ ∞
0
f (t − τ )E (τ )dτ. (4)
The response function f (t) describes the fundamental memory property of the dielectric system and can provide
significant information about the insulating material. The function f (t) can be determined experimentally as
the response of the dielectric to a step-function charging field [6].
Now, polarization and depolarization currents are measured for investigation of the polarization process
in the time domain. Combining above equations can be rewritten as
J (t) = σ · E (t) + εrε◦dE (t)
dt+ ε◦ ·
d
dt
t0
f (t − τ )E (τ )dτ. (5)
41
8/22/2019 Insulation Condition Assessment of Power Transformers
http://slidepdf.com/reader/full/insulation-condition-assessment-of-power-transformers 4/16
Turk J Elec Eng & Comp Sci, Vol.17, No.1, 2009
For a homogeneous material the field strength E (t) can be considered as generated by an external voltage V (t).
Thus the current through a test object with geometric capacitance C ◦(measured capacitance at or near power
frequency, divided byεr) can be written as
i(t) = C ◦
σ
ε◦V (t) + εr
dV (t)
dt+
d
dt
t0
f (t − τ )V (τ )dτ
. (6)
The test object can be materials of a single dielectric or an arrangement of several dielectric materials in series
or in parallel. Now, assume that the test object is totally discharged and that a step voltage is applied with the
following characteristics:
V (t) =
⎧⎨⎩
0 t < 0V 0 ≤ t ≤ tc0 t < tc.
(7)
This will give zero current for times before t = 0 and DC-polarized current for times 0 ≤ t ≤ tc . The
polarization current is built up in two parts. One part is related to the conductivity of the test object and the
other is related to the activation of the different polarization processes within the test object.
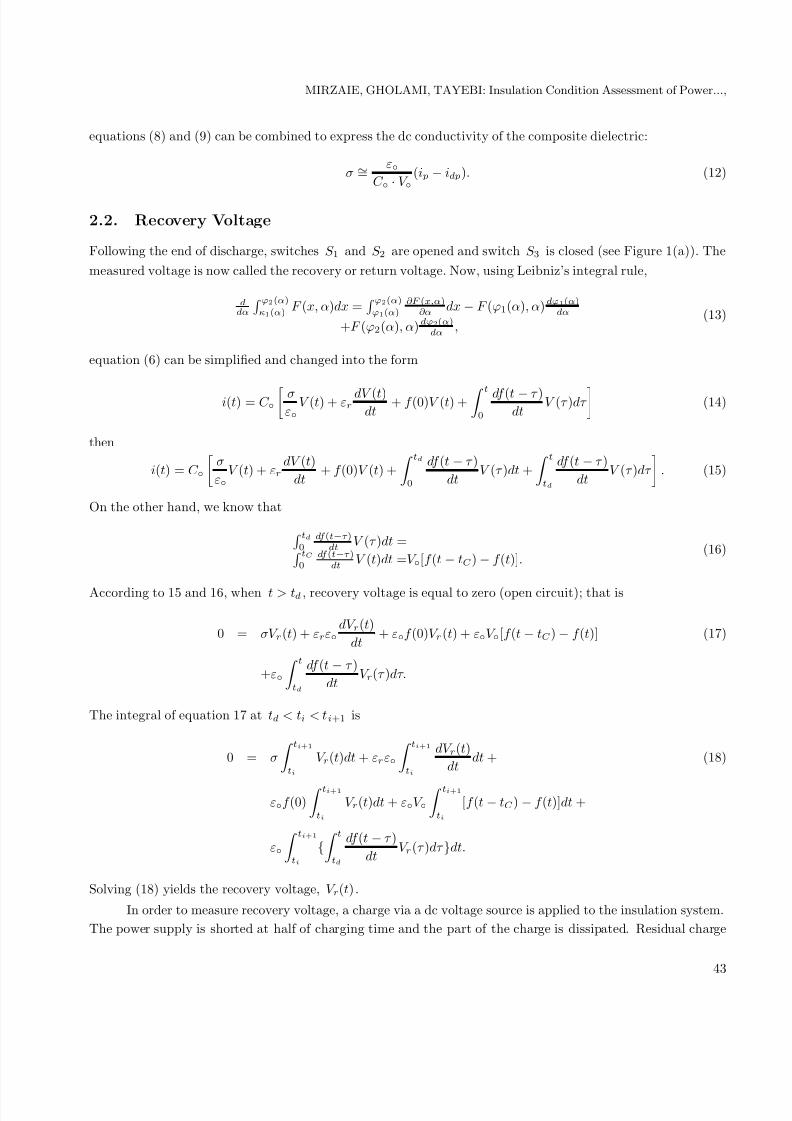
As illustrated in Figure 1(a), polarization current has been measured by ammeter when switch S 1 is
closed and switches S 2 and S 3 are opened. The polarization current through the object can be expressed as
i p = C ◦V ◦
σ
ε◦+ f (t)
. (8)
For times t > tc , the step voltage is replaced by a short circuit ( S 1 and S 3 are opened, S 2 is closed), a
depolarization current is built up. The magnitude of the depolarization current is
idp = C ◦V ◦[f (t) − f (t + tc)]. (9)
References [6, 14] have shown that, for oil/cellulose insulation systems, the general response function can be
expressed in parametric form:
f (t) =A
tt◦
n+
tt◦
m , (10)
where t◦ > 0, A > 0 , m > n > 0 and m > 1.
In order to estimate the dielectric response function f (t) from a depolarization current measurement
it is assumed that the dielectric response function is a continuously decreasing function in time; then if the
polarization period is sufficiently long, so that f (t + tc) ∼= 0 , the dielectric response function f (t) is proportionalto the depolarization current. Thus one can rewrite equation (9) as
f (t) ∼=idp(t)
C ◦ · V ◦. (11)
The parameters of f (t) are obtained from a non-linear least-squares fit of the right-hand side of equation 11.
From the measurements of polarization and depolarization currents, it is possible to estimate the dc
conductivity σ of the test object. If the test object is charged for a sufficiently long time so that f (t + tc) ∼= 0 ,
42
8/22/2019 Insulation Condition Assessment of Power Transformers
http://slidepdf.com/reader/full/insulation-condition-assessment-of-power-transformers 5/16
MIRZAIE, GHOLAMI, TAYEBI: Insulation Condition Assessment of Power...,
equations (8) and (9) can be combined to express the dc conductivity of the composite dielectric:
σ ∼=ε◦
C ◦ · V ◦(i p − idp). (12)
2.2. Recovery Voltage
Following the end of discharge, switches S 1 and S 2 are opened and switch S 3 is closed (see Figure 1(a)). The
measured voltage is now called the recovery or return voltage. Now, using Leibniz’s integral rule,
ddα
ϕ2(α)κ1(α)
F (x, α)dx = ϕ2(α)ϕ1(α)
∂F (x,α)∂α
dx − F (ϕ1(α), α)dϕ1(α)dα
+F (ϕ2(α), α)dϕ2(α)dα
,(13)
equation (6) can be simplified and changed into the form
i(t) = C ◦
σε◦
V (t) + εr dV (t)dt
+ f (0)V (t) +
t
0
df (t − τ )dt
V (τ )dτ
(14)
then
i(t) = C ◦
σ
ε◦V (t) + εr
dV (t)
dt+ f (0)V (t) +
td0
df (t − τ )
dtV (τ )dt +
ttd
df (t − τ )
dtV (τ )dτ
. (15)
On the other hand, we know that
td0
df (t−τ )dt
V (τ )dt = tC0
df (t−τ )dt
V (t)dt =V ◦[f (t − tC )− f (t)].(16)
According to 15 and 16, when t > td , recovery voltage is equal to zero (open circuit); that is
0 = σV r(t) + εrε◦dV r(t)
dt+ ε◦f (0)V r(t) + ε◦V ◦[f (t − tC )− f (t)] (17)
+ε◦
ttd
df (t − τ )
dtV r(τ )dτ.
The integral of equation 17 at td < ti < ti+1 is
0 = σ
ti+1ti
V r(t)dt + εrε◦
ti+1ti
dV r(t)
dtdt + (18)
ε◦f (0)
ti+1ti
V r(t)dt + ε◦V ◦
ti+1ti
[f (t − tC ) − f (t)]dt +
ε◦
ti+1ti
{
ttd
df (t − τ )
dtV r(τ )dτ }dt.
Solving (18) yields the recovery voltage, V r(t).
In order to measure recovery voltage, a charge via a dc voltage source is applied to the insulation system.
The power supply is shorted at half of charging time and the part of the charge is dissipated. Residual charge
43
8/22/2019 Insulation Condition Assessment of Power Transformers
http://slidepdf.com/reader/full/insulation-condition-assessment-of-power-transformers 6/16
Turk J Elec Eng & Comp Sci, Vol.17, No.1, 2009
then produces a voltage on the insulation system when the insulation is removed from the circuit after discharge.
The maximum of recovery voltage directly depends on polarization ability of insulation and its primitive slope
to insulation polarization conduction. Waveform of the mentioned cases is shown in Figure 1(b).
S1
Vc
+
-
S2
S3
A
V
Insulation
V i
Vc
iP
tc
0
td
idp
Central Time Constant
Vr(t)
Max. Vr
Initial Slope
t
(a) (b)
Figure 1. (a) Circuit for polarization current, depolarization current and recovery voltage measurement. (b) Wave form
of polarization current, depolarization current and recovery voltage.
3. Accelerated Ageing Tests
To study the influence of thermal stress on oil/cellulose insulation systems in transformers, copper conductors
wrapped in paper of 48 μm thicknesses were placed in Pyrex glass dishes in a basket. Insulating paper was
stacked between the copper electrodes. Each basket contains two glasses of different length, and a pipe connects
the two glasses together. The samples were dried at 1 mbar at 120 ◦C in oven for 24 hours. Dried and
degassed transformer oil (Nynas, class II) was then added to upper glasses placed in every collection so that
the conductors in the lower glasses were completely immersed in the oil. In order to extract as much gas andnucleated bubbles from the oil, dry nitrogen was passed through the glasses; following which the glasses were
sealed. All baskets containing oil/paper glasses were seated in the oven and were connected to the silica gel
container that remained outside the oven. The accelerated ageing experiments were performed at three different
temperatures, 140, 150 and 160 ◦C, in oven for various periods of time. Oven temperatures were maintained
within ±2 ◦C of the desired value. Aging times are listed in Table 1. After treatment in oven, glass dishes
were allowed to cool to room temperature before examination.
4. Results and Discussions
Ageing experiments were conducted on aged oil/paper insulation systems. Length of ageing varied between 72
and 576 hours (3 to 24 days), and by temperature. Temperatures and corresponding ageing times are shown in
Table 1.
Table 1. Temperature and length of ageing.
Ageing temperature (◦C) Ageing time (hours)
140 192, 384 and 576150 120, 240 and 360160 72, 144 and 216
44
8/22/2019 Insulation Condition Assessment of Power Transformers
http://slidepdf.com/reader/full/insulation-condition-assessment-of-power-transformers 7/16
MIRZAIE, GHOLAMI, TAYEBI: Insulation Condition Assessment of Power...,
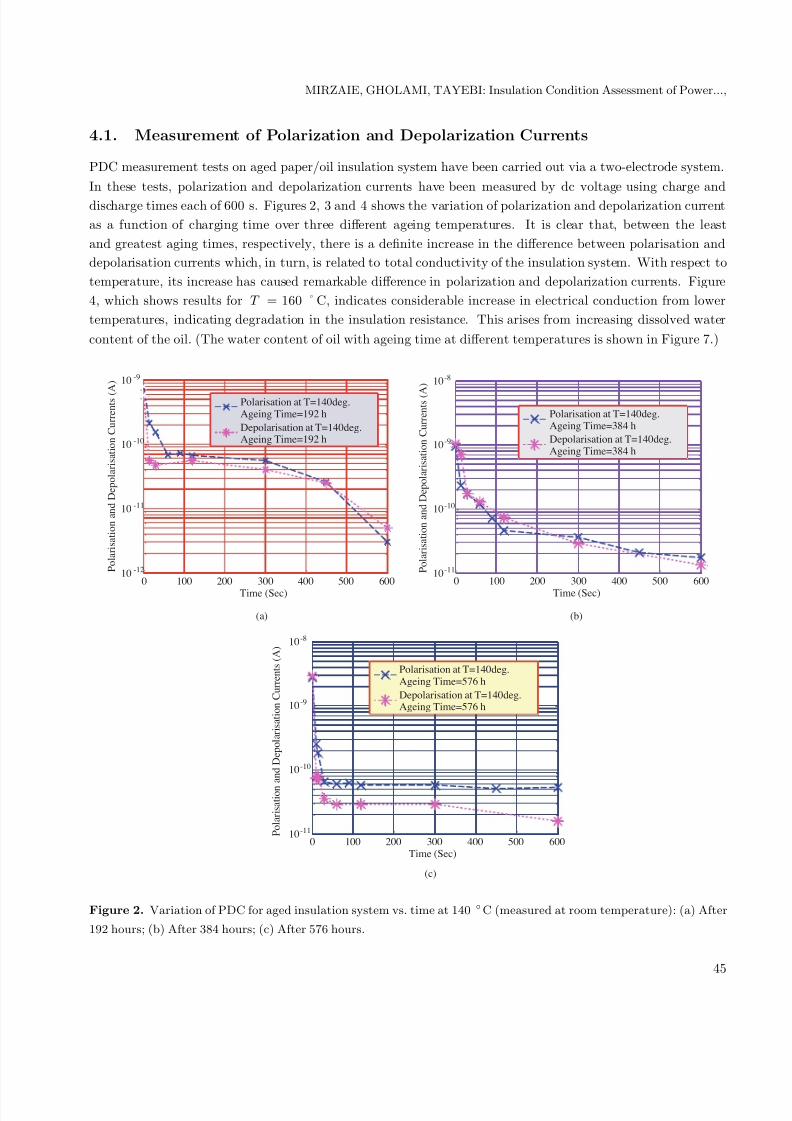
4.1. Measurement of Polarization and Depolarization Currents
PDC measurement tests on aged paper/oil insulation system have been carried out via a two-electrode system.
In these tests, polarization and depolarization currents have been measured by dc voltage using charge and
discharge times each of 600 s. Figures 2, 3 and 4 shows the variation of polarization and depolarization current
as a function of charging time over three different ageing temperatures. It is clear that, between the least
and greatest aging times, respectively, there is a definite increase in the difference between polarisation and
depolarisation currents which, in turn, is related to total conductivity of the insulation system. With respect to
temperature, its increase has caused remarkable difference in polarization and depolarization currents. Figure
4, which shows results for T = 160 ˚C, indicates considerable increase in electrical conduction from lower
temperatures, indicating degradation in the insulation resistance. This arises from increasing dissolved water
content of the oil. (The water content of oil with ageing time at different temperatures is shown in Figure 7.)
0 100 200 300 400 500 60010 -12
10 -11
10 -10
10 -9
Time (Sec)
P o l a r i s a t i o n a n d D e p o l a r i s a t i o n C u r r e n t s ( A )
Polarisation at T=140deg.Ageing Time=192 h
Depolarisation at T=140deg.Ageing Time=192 h
0 100 200 300 400 500 60010-11
10-10
10-9
10-8
Time (Sec)
P o l a r i s a t i o n a n d D e p o l a r i s a t i o n C u r r e n t s ( A
)
Polarisation at T=140deg.Ageing Time=384 h
Depolarisation at T=140deg.Ageing Time=384 h
(a) (b)
0 100 200 300 400 500 60010-11
10-10
10-9
10-8
Time (Sec)
P o l a r i s a t i o n
a n d D e p o l a r i s a t i o n C u r r e n t s ( A )
Polarisation at T=140deg.Ageing Time=576 h
Depolarisation at T=140deg.Ageing Time=576 h
(c)
Figure 2. Variation of PDC for aged insulation system vs. time at 140 ◦C (measured at room temperature): (a) After
192 hours; (b) After 384 hours; (c) After 576 hours.
45
8/22/2019 Insulation Condition Assessment of Power Transformers
http://slidepdf.com/reader/full/insulation-condition-assessment-of-power-transformers 8/16
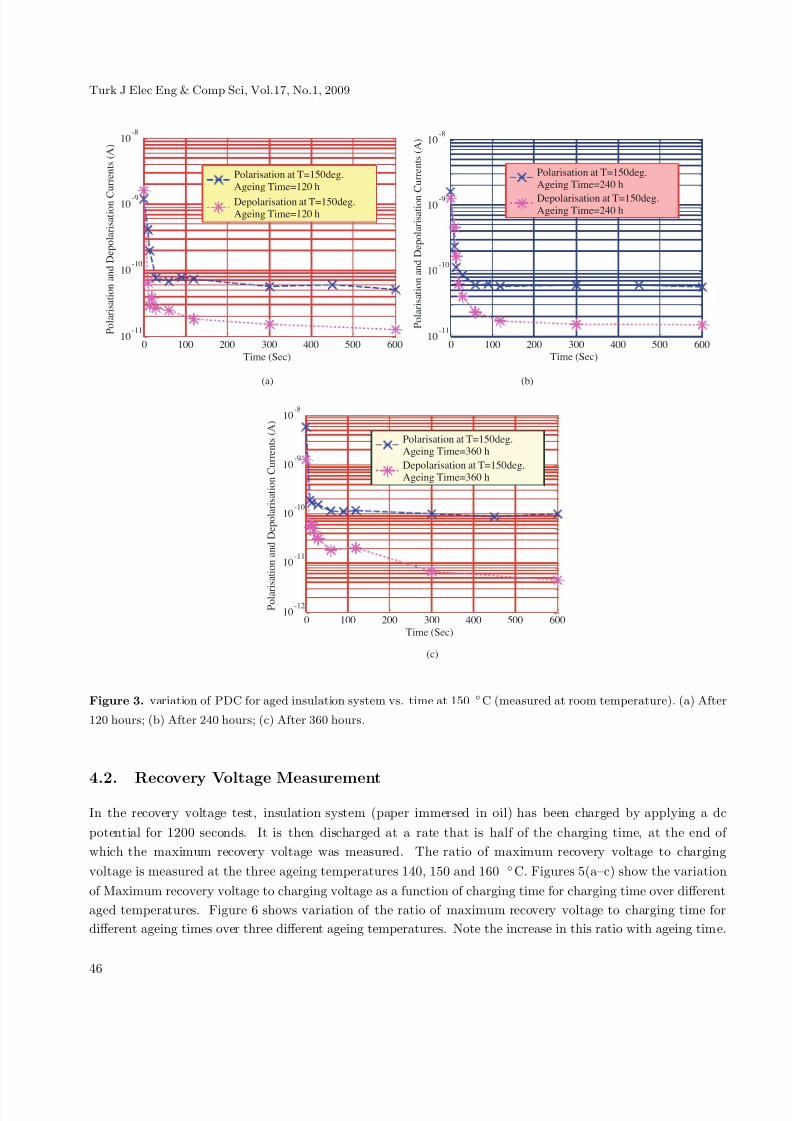
Turk J Elec Eng & Comp Sci, Vol.17, No.1, 2009
0 100 200 300 400 500 60010
-11
10-10
10-9
10-8
Time (Sec)
P o l a r i s a t i o n a n d D e p o l a r i s a t i o n C
u r r e n t s ( A )
Polarisation at T=150deg.
Ageing Time=120 h
Depolarisation at T=150deg.Ageing Time=120 h
0 100 200 300 400 500 60010
-11
10-10
10-9
10-8
Time (Sec)
P o l a r i s a t i o n a n d D e p o l a r i s a t i o n
C u r r e n t s ( A )
Polarisation at T=150deg.Ageing Time=240 h
Depolarisation at T=150deg.Ageing Time=240 h
(a) (b)
0 100 200 300 400 500 60010
-12
10-11
10-10
10-9
10-8
Time (Sec)
P o l a r i s a t i o n a n d D e p o l a r i s a t i o n C u r r e n t s ( A )
Polarisation at T=150deg.Ageing Time=360 h
Depolarisation at T=150deg.Ageing Time=360 h
(c)
Figure 3. variation of PDC for aged insulation system vs. time at 150 ◦C (measured at room temperature). (a) After
120 hours; (b) After 240 hours; (c) After 360 hours.
4.2. Recovery Voltage MeasurementIn the recovery voltage test, insulation system (paper immersed in oil) has been charged by applying a dc
potential for 1200 seconds. It is then discharged at a rate that is half of the charging time, at the end of
which the maximum recovery voltage was measured. The ratio of maximum recovery voltage to charging
voltage is measured at the three ageing temperatures 140, 150 and 160 ◦C. Figures 5(a–c) show the variation
of Maximum recovery voltage to charging voltage as a function of charging time for charging time over different
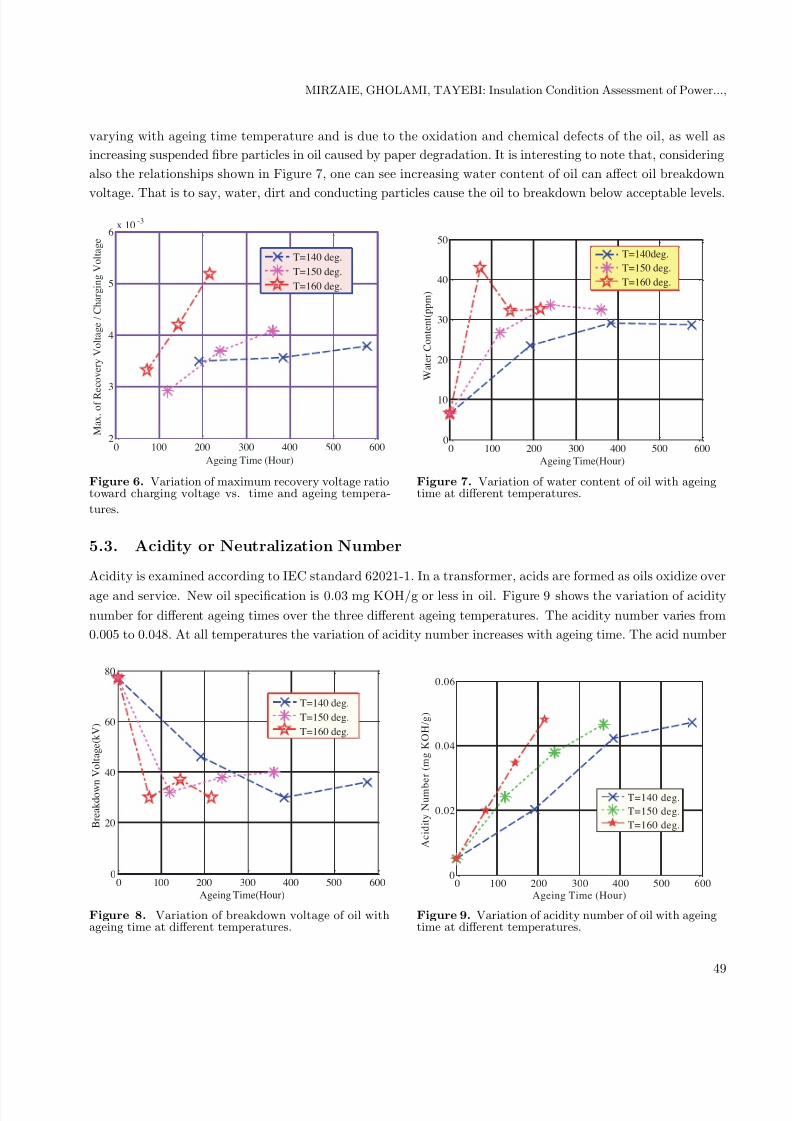
aged temperatures. Figure 6 shows variation of the ratio of maximum recovery voltage to charging time for
different ageing times over three different ageing temperatures. Note the increase in this ratio with ageing time.
46

8/22/2019 Insulation Condition Assessment of Power Transformers
http://slidepdf.com/reader/full/insulation-condition-assessment-of-power-transformers 9/16
MIRZAIE, GHOLAMI, TAYEBI: Insulation Condition Assessment of Power...,
0 100 200 300 400 500 60010
-11
10-10
10-9
10-8
Time (Sec)
P o l a r i s a t i o n a n d D e p o l a r i s a t i o n C
u r r e n t s ( A )
Polarisation at T=160deg.
Ageing Time=72 h
Depolarisation at T=160deg.
Ageing Time=72 h
0 100 200 300 400 500 60010
-11
10-10
10-9
10-8
10-7
Time (Sec)
P o l a r i s a t i o n a n d D e p o l a r i s a t i o n C u r r e n t s ( A )
Polarisation at T=160deg.
Ageing Time=144 h
Depolarisatio at T=160deg.
Ageing Time=144 h
(a) (b)
0 100 200 300 400 500 60010
-12
10-11
10-10
10-9
10-8
10-7
Time (Sec)
P o l a r i s
a t i o n a n d D e p o l a r i s a t i o n C u r r e n t s ( A )
Polarisation at T=160deg.
Ageing Time=216 h
Depolarisation at T=160deg.
Ageing Time=216 h
(c)
Figure 4. Variation of PDC for aged insulation system vs. time at 160 ◦ C (measured at room temperature). (A) After
72 hours; (B) After 144 hours; (C) After 216 hours.
5. Paper/Oil Insulation Tests
In addition to the above tests, we have also examined the insulation system for water content in oil, oil breakdown
voltage, acidity or neutralization number, paper electrical strength, paper dissipation factor, paper tensile
strength. Results are detailed in the following sections.
5.1. Water Content in Oil
As the exposure of humidity to oil favours the formation of acids and sludge, water content in oil has been
tested via IEC standard 60814. IEC standard limits water content in transformer oil to less 30 ppm. Figure 7
47

8/22/2019 Insulation Condition Assessment of Power Transformers
http://slidepdf.com/reader/full/insulation-condition-assessment-of-power-transformers 10/16
Turk J Elec Eng & Comp Sci, Vol.17, No.1, 2009
shows the variation of water content as measured in our test systems. In most cases, the water content increased
with ageing time. Comparing across the three ageing temperatures, for applicable ageing times, water content
was highest in oil aged at 160 ◦C, and may be due to oil oxidization and rapid thermal degradation of the oil
immersed paper system.
102
103
10-4
10 -3
10 -2
Charging Time (Sec)
M a x . o f R e c o v e r y V o l t a g e / C h a r g i n g V o l t a g e
Ageing Time=192h
Ageing Time=384 h
Ageing Time=576 h
102
103
10 -4
10 -3
10 -2
Charging Ti me(Sec)
M a x . o f
R e c o v e r y V o l t a g e / C h a r g i n g V o l t a g e
Ageing Time=120 h
Ageing Time=240 h
Ageing Time=360 h
(a) (b)
102
103
10-4
10-3
10-2
Charging Time(Sec)
M a x . o f R e c o v e r y V o l t a g e
/ C h a r g i n g V o l a t g e
Ageing Time=72 h
Ageing Time=144 h
Ageing Time=216 h
(c)
Figure 5. Variation of maximum recovery voltage ratio toward charging voltage vs. charging time: (a) at 140◦
C; (b)at 150 ◦ C; and (c) at 160 ◦C.
5.2. Oil Breakdown Voltage
The breakdown voltage of each aged oil sample has been tested using the IEC60156 standard. Figure 8 shows
the variation of oil breakdown voltage for different ageing times over three different temperatures. From this
figure it can be seen that the breakdown voltage of aged oil starts with a high value, then decreases with time.
Increasing temperature also reduces breakdown voltage. Breakdown voltage drops from 77 kV to 45–30 kV,
48
8/22/2019 Insulation Condition Assessment of Power Transformers
http://slidepdf.com/reader/full/insulation-condition-assessment-of-power-transformers 11/16
MIRZAIE, GHOLAMI, TAYEBI: Insulation Condition Assessment of Power...,
varying with ageing time temperature and is due to the oxidation and chemical defects of the oil, as well as
increasing suspended fibre particles in oil caused by paper degradation. It is interesting to note that, considering
also the relationships shown in Figure 7, one can see increasing water content of oil can affect oil breakdown
voltage. That is to say, water, dirt and conducting particles cause the oil to breakdown below acceptable levels.
0 100 200 300 400 500 6002
3
4
5
6x 10
-3
Ageing Time (Hour)
M a x . o f R e c o v e r y V o l t a g e / C h a r g i n g V o l t a g e
T=140 deg.
T=150 deg.
T=160 deg.
0 100 200 300 400 500 6000
10
20
30
40
50
Ageing Time(Hour)
W a t e r C o n t e n t ( p p m )
T=140deg.
T=150 deg.
T=160 deg.
Figure 6. Variation of maximum recovery voltage ratiotoward charging voltage vs. time and ageing tempera-
tures.
Figure 7. Variation of water content of oil with ageingtime at different temperatures.
5.3. Acidity or Neutralization Number
Acidity is examined according to IEC standard 62021-1. In a transformer, acids are formed as oils oxidize over
age and service. New oil specification is 0.03 mg KOH/g or less in oil. Figure 9 shows the variation of acidity
number for different ageing times over the three different ageing temperatures. The acidity number varies from
0.005 to 0.048. At all temperatures the variation of acidity number increases with ageing time. The acid number
0 100 200 300 400 500 6000
20
40
60
80
Ageing Time(Hour)
B r e a k d o w n V o l t a g e ( k V )
T=140 deg.
T=150 deg.
T=160 deg.
0 100 200 300 400 500 6000
0.02
0.04
0.06
Ageing Time (Hour)
A c i d i t y N u m b
e r ( m g K O H / g )
T=140 deg.
T=150 deg.
T=160 deg.
Figure 8. Variation of breakdown voltage of oil withageing time at different temperatures.
Figure 9. Variation of acidity number of oil with ageingtime at different temperatures.
49
8/22/2019 Insulation Condition Assessment of Power Transformers
http://slidepdf.com/reader/full/insulation-condition-assessment-of-power-transformers 12/16
Turk J Elec Eng & Comp Sci, Vol.17, No.1, 2009
of an oil sample is indicative of age, deterioration and oxidation of the oil and can be used to determine when
the oil must be changed.
5.4. Paper Electrical Strength
Electrical strength of aged paper has been measured (via the IEC-60554 standard) at 50 Hz and voltage slew
rate of 100 v/s. Figure 10 shows the variation of aged paper electrical strength at 50 Hz for different ageing
times over three different temperatures. According to this figure, paper strength voltage has alternated from
10 to 11.8 kV/mm.
5.5. Paper Dissipation Factor
Dissipation factor of each aged paper sample has been tested via the IEC-60554 standard. In this test, the
pressure and applied voltage between two electrodes is 2×10⁴ Pa and 25 V, respectively. Figure 11 shows the
variation of dissipation factor for different ageing times over the three different ageing temperatures. The result
shows that thermal stress does not cause increase in paper dielectric dissipation factor.
0 100 200 300 400 500 6006
7.5
9
10.5
12
13.5
15
Ageing Time (Hour)
B r e a k d o w n V
o l t a g e ( k V / m m )
T=140 deg.
T=150 deg.
T=160 deg.
0 100 200 300 400 500 6000
3
6
9x 10
-3
Ageing Time (Hour)
D i s s i p a t i o n F a c t o r
T=140 deg.
T=150 deg.
T=160 deg.
Figure 10. Variation of electrical strength of paperinsulation with ageing time at different temperatures.
Figure 11. Variation of dielectric dissipation factor of paper insulation with ageing time at different tempera-
tures.
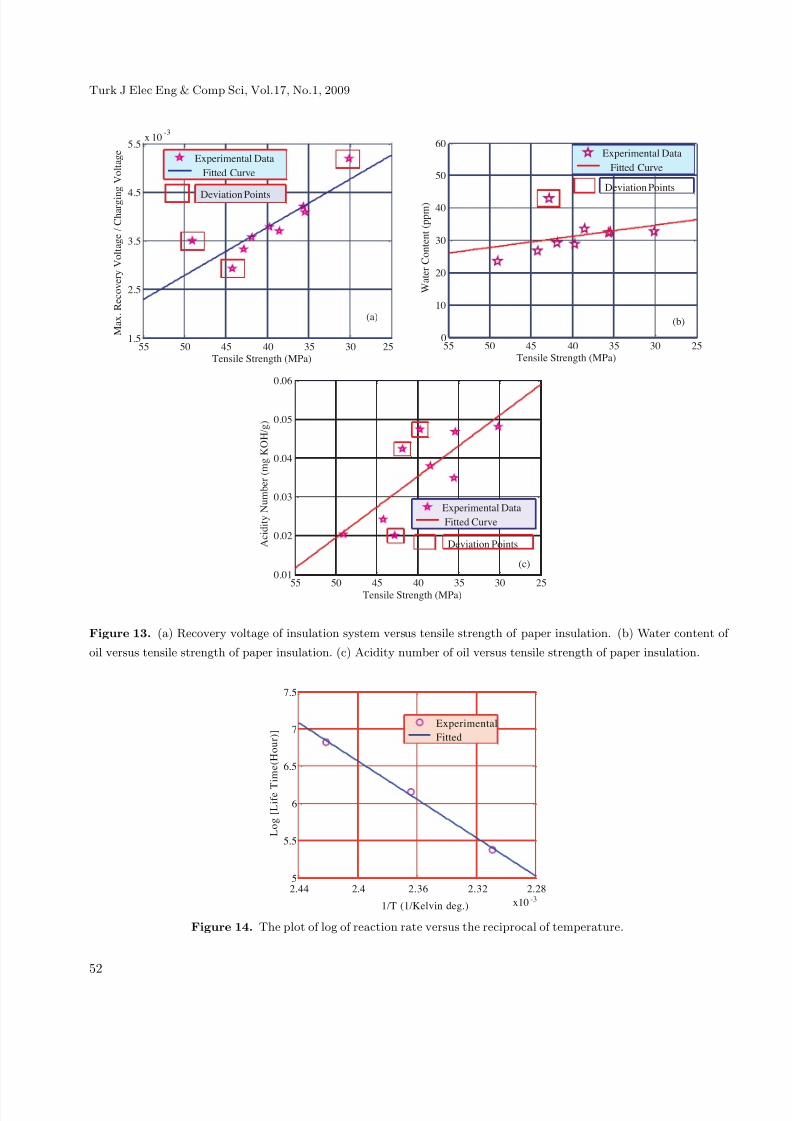
5.6. Paper Tensile StrengthThe tensile strength of paper insulation is measured according to the standard IEC-60544. In this test, aged
paper is cut in size to dimensions 15×250 mm and tested at deformation rate 60 mm/min. Figure 12 shows
that mechanical strength decreases directly with increasing ageing time. Our tests show that decrease in the
mechanical strength of the insulation paper causes the increase in the maximum recovery voltage which, in turn,
is related to increase in the water content of the oil. The correlations of recovery voltage, water content and
acidity number with tensile strength of paper insulation is shown in Figures 13(a–c) and are very significant.
These results are consistent with that obtained from aged power transformer samples.
50

8/22/2019 Insulation Condition Assessment of Power Transformers
http://slidepdf.com/reader/full/insulation-condition-assessment-of-power-transformers 13/16
MIRZAIE, GHOLAMI, TAYEBI: Insulation Condition Assessment of Power...,
0 100 200 300 400 500 60025
35
45
55
65
Ageing Time(Hour)
T e n s i l e S t r e n g t h ( M P a )
T=140 deg.
T=150 deg.
T=160 deg.
Figure 12. Variation of tensile strength of paper insulation with ageing time at different temperatures.
6. Prediction of Paper Insulation Life Time
Thus the above tests on insulation paper show tensile strength depend not only on ageing time of oil but also
on ageing temperatures. With these and those results for tensile strength we now form a model to predict how
the insulating paper degrades with time at normal operating temperatures of transformers.
In this paper, tensile strength has been used as the index for degradation of paper. Hence, we index
lifetime for the various ageing temperatures to the point at which tensile strength reaches half its initial strength
[15].When temperature is used as the single stress covariate, the Arrhenius model can be an appropriate
model. The Arrhenius reaction rate equation is given by
r = A · exp
−E a
kBT
. (19)
Now assuming that the life of a product is proportional to the inverse of the rate of reaction, the Arrhenius life
relation is given by
L(T ) = B · exp
E a
kBT
(20)
In relations (19) and (20), E a , kB , and T are activation energy, Boltzmann’s constant and absolute temperature.
Also, A and B are constant factors.
The variation in logarithm of lifetime with the reciprocal temperature is shown in Figure 14, from which
the activation energy for thermal degradation of the paper calculated from this Arrhenius analysis found to be
1.1096 eV.
51
8/22/2019 Insulation Condition Assessment of Power Transformers
http://slidepdf.com/reader/full/insulation-condition-assessment-of-power-transformers 14/16
Turk J Elec Eng & Comp Sci, Vol.17, No.1, 2009
3035404550551.5
2.5
3.5
4.5
5.5x 10
-3
Tensile Strength (MPa)
M a x .
R e c o v e r y V o l t a g e / C h a r g i n
g V o l t a g e
Experimental Data
Fitted Curve
Deviation Points
(a)
25 253035404550550
10
20
30
40
50
60
Tensile Strength (MPa)
W a t e r C o n t e n t ( p p m )
Experimental Data
Fitted Curve
Deviation Points
(b)
253035404550550.01
0.02
0.03
0.04
0.05
0.06
Tensile Strength (MPa)
A c i d i t y N u m b e r ( m g K O H / g )
Experimental Data
Fitted Curve
Deviation Points
(c)
Figure 13. (a) Recovery voltage of insulation system versus tensile strength of paper insulation. (b) Water content of
oil versus tensile strength of paper insulation. (c) Acidity number of oil versus tensile strength of paper insulation.
2.28
x10
2.322.362.42.44-3
5
5.5
6
6.5
7
7.5
1/T (1/Kelvin deg.)
L o g [ L i f e T
i m e ( H o u r ) ]
Experimental
Fitted
Figure 14. The plot of log of reaction rate versus the reciprocal of temperature.
52

8/22/2019 Insulation Condition Assessment of Power Transformers
http://slidepdf.com/reader/full/insulation-condition-assessment-of-power-transformers 15/16
MIRZAIE, GHOLAMI, TAYEBI: Insulation Condition Assessment of Power...,
7. Conclusions
A series of accelerated ageing experiments has been investigated for oil/paper cellulose insulation system used
in transformers. Polarization and depolarization currents and recovery voltage of aged cellulose immersed in
oil were measured. The aim of tests was condition assessment of insulation system. The main properties of oil
and paper were studied. Electrical measurements show that both polarization and depolarization currents are
strongly influenced by ageing time and water content of oil and paper. The results have shown that maximum
recovery voltage of oil/paper insulation system and tensile strength of paper insulation in power transformers
vary significantly and consistently with respect to ageing time and ageing temperatures.
Good correlations have been obtained between the tensile strength of insulating paper with recovery
voltage of insulation system, total acid number (TAN), and water content in oil. The tensile strength results
have been used to predict how lifetime of insulating paper changes with temperature and time. Therefore
lifetime of paper has been estimated by using Arrhenius model. It can predict the life of paper for power
transformers at various operational temperatures.
References
[1] T.K. Saha, M. Darveniza, D.J.T. Hill, T.T. Le, “Electrical and Chemical Diagnostics of Transformer Insulation-part
B: Accelerated Aged Insulation Samples” , IEEE Transactions on Power Delivery, Vol. 12, No. 4, October 1997, pp.
1555–1561.
[2] A.J. Kachler, I. Hohlein, “Ageing of Cellulose at Transformer Service Temperatures. Part 1: Influence of Type of
Oil and Air on the Degree of Polymerization of Pressboard, Dissolved Gases, and Furanic Compounds in Air” ,
IEEE Electrical Insulation Magazine, Vol. 21, No. 2, March / April 2005, pp. 15–21.
[3] M.C. Lessard, L. Van Nifterik, J.F. Penneau and Robert Grob, “Thermal Ageing Study of Insulating Papers Used
in Power Transformers” , Conference on Electrical Insulation and Dielectric Phenomena, San Francisco, October
20–23, 1996, pp. 854–859.
[4] M. Darveniza, D. Hill, Tri Le. T.K. Saha, “Studies of the Condition of Insulation in Aged Power Transformers Part 2:
Fundamental Electrical and Chemical Consideration”, 3rd International Conference on Properties and Applications
of Dielectric Materials, July 8–12, 1991, Tokyo-Japan, pp. 1120–1123.
[5] J.P. Van Bolhuis, E. Gulski, J.J. Smit, “Interpretation of RVM Measurements, Beyond the Polarization Spectrum”,
Conference Record of the 2002 IEEE International Symposium on Electrical Insulation, Boston, USA, April 7–10,
2002, pp. 179–182.
[6] T.K. Saha, P. Purkait, “Investigation of Polarization and Depolarization Current Measurements for the Assessment
of Oil-Paper Insulation of Aged Transformers”, IEEE Transactions on Dielectrics and Electrical Insulation, Vol. 11,
No. 1, February 2004, pp. 144–154.
[7] M.K. Pradhan, T.S. Ramu, “On the Estimation of Elapsed Life of Oil-Immersed Power Transformers”,IEEE
Transactions on Power Delivery, Vol. 20, No. 3, July 2005, pp. 1962–1969.
[8] L.E. Lundgaard, W. Hansen, D. Linhjell, T.J. Painter, “Ageing of Oil-Impregnated Paper in Power Transformers”,
IEEE Transactions on Power Delivery, Vol. 19, No. 1, January 2004, pp. 230–239.
53
8/22/2019 Insulation Condition Assessment of Power Transformers
http://slidepdf.com/reader/full/insulation-condition-assessment-of-power-transformers 16/16
Turk J Elec Eng & Comp Sci, Vol.17, No.1, 2009
[9] M. Darveniza, D.J.T. Hill, T.T. Le, T.K . Saha, B. Williams, “Chemical Degradation of Cellulosic Insulation
Paper for Power Transformers”, Proceedings of the 4th International Conference on Properties and Applications of
Dielectric Materials, July 3–8, 1994, Brisbane Australia, pp. 780–783.
[10] B. Garcia, J.C. Carlos Burgos, A.M. Alonso, J. Sanz, “A Moisture-in-Oil Model For Power Transformer Monitoring-
Part I: Theoretical Foundation”, IEEE Transactions on Power Delivery, Vol.20, No. 2, April 2005, pp. 1417–1422.
[11] S. Birlasekaran, Yu Xingzhou, “Relaxation Studies on Power Equipment”, IEEE Transactions on Dielectrics and
Electrical Insulation, Vol. 10, No. 6, December 2003, pp. 1061–1077.
[12] T.K. Saha, P. Purkait, F. Muller, “Deriving and Equivalent Circuit of Transformers Insulation for Understanding the
Dielectric Response Measurements”, IEEE Transactions on Power Delivery, Vol. 20, No.1, Junuary 2005, pp.149–
157.
[13] T.K. Saha, “Review of Time-Domain Polarization Measurements For Assessing Insulation Condition In Aged
Transformers”, IEEE Transactions on Power Delivery, Vol. 18, No. 4, October 2003, pp. 1293–1301.
[14] U. Gafvert, L. Adeen, M. Tapper, P. Ghasemi, B. Jonsson, “Dielectric Spectroscopy in Time and Frequency Domain
Applied to Diagnostics of Power Transformers”, IEEE 6the International Conference on Properties and Applications
of Dialectic Materials,China, Vol. 2, pp. 825–830, 2000.
[15] ANSI/IEEE C57.92-1981, “IEEE Guide for Loading Mineral-Oil-Immersed Power Transformers Up to and Including
100 MVA With 65 ◦C or 55 ◦C Average winding Rise.”
54