insulin-like growth factor-i in growing horses and rna
TRANSCRIPT
Insulin-like growth factor-I in growing horses and RNA isolation from
small articular cartilage samples
Rebekah S. Cosden
Thesis submitted to the faculty of the Virginia Polytechnic Institute and State
University
in partial fulfillment of the requirements for the degree of
Master of Science
In
Animal and Poultry Sciences
W. Burt Staniar, Chair
Mark Crisman
Ray J. Geor
Ed Smith
Jolynne Tschetter
August 10th 2007
Blacksburg, VA
Keywords: IGF-I, synovial fluid, plasma, skeletal development, equine growth, RNA
isolation, articular cartilage
Copyright 2007
Rebekah S. Cosden
Insulin-like growth factor-I in growing horses and RNA isolation from
small articular cartilage samples
Rebekah S. Cosden
ABSTRACT
A longitudinal study was designed to characterize developmental patterns of
plasma (PL) and synovial fluid (SF) total insulin-like growth factor –I (IGF-I)
concentrations, as well as their association with measurements of skeletal growth in
Thoroughbred horses. Horses were randomly assigned to one of two dietary treatment
groups and fed diets with either a high or low starch content to examine the effects of
dietary energy source on PL and SF IGF-I. At 3, 6, 9, 12 and 15 mo of age, PL and
carpal SF samples were collected for analysis of total IGF-I. Body weight gain, wither
height gain and forearm length gain were calculated for the 90 day periods between SF
and PL sampling. No influence of diet on PL or SF IGF-I was detected (P > 0.05).
Average SF IGF-I concentrations were 30.1 ± 1.8% of that found in PL, and PL and SF
IGF-I were positively correlated (r = 0.48, P = 0.0003) There was an effect of month of
age on both PL and SF IGF-I concentrations (P < 0.05). There was a positive correlation
between all measures of gain except forearm length gain with PL and SF IGF-I (r = 0.41
to 0.55, P < 0.05). In our second study, we evaluated the use of a liquid-nitrogen cooled
mortar and pestle, motorized freezer mill and rotor-stator homogenizer for
homogenization of small (<50mg) articular cartilage samples. The rotor-stator
homogenizer produced quanitfiable RNA yields, and was used to evaluate three different
RNA isolation protocols. Two of the protocols were commercially available RNA
extraction kits, with the third a modified guanidinium isothiocyanate/acid-phenol
extraction procedure. The combined average yield for all protocols was 91.9 ng RNA/mg
of cartilage. All protocols yielded a sufficient quantity of quality RNA suitable for gene
expression analysis.
iii
ACKNOWLEDGEMENTS
The completion of this thesis would not have been possible without the help of the
many faculty, students, staff, family members, and friends that have supported me
through my graduate coursework and research. First, I would like to thank the members
of my committee. I am grateful that they have allowed me to complete this thesis, and for
their support and encouragement throughout the process. Special thanks to my advisor,
Dr. Burt Staniar for accepting me into this program and encouraging my growth as a
scientist over the past two years. His genuine concern for the well-being of his students
and ability to challenge my way of thinking have made these past two years an
experience I will never forget. Thanks to Dr. Tschetter for putting up with me in the lab,
and for all of the help with my revisions.
The moral support I have received from the graduate students has been
invaluable. Tania Cubitt, Lindsey George, Bridgett Macintosh and Kibby Trieber helped
to show me the ropes and encourage my research. Becky Carter was also largely
responsible for collecting the growth data that was vital for this project, and for that I am
truly grateful. In Blacksburg, Sarah Denham has been there to help study for classes,
share ideas and help me figure out what I really am doing here in the first place. Thank
you to Tracy Smith, quite possibly the greatest lab tech in the world. Without her I may
not have even been able to locate all of the samples, but she kept everything organized
and even stayed late to help me run ELISA’s in the lab.
I would like to also extend my gratitude to the students and staff of the
MacLeod Laboratory at the University of Kentucky. Jamie MacLeod and Mike
Mienaltowski were extremely helpful in helping me to perfect the RNA isolation

iv
protocol. I am looking forward to working with them in the future, even if it means
playing lucky Christmas music all year long.
Last but not least, I would like to thank my family for their support and
understanding throughout all of my endeavors. With high expectations they have
encouraged me to pursue my dreams, and I know that they will stand behind me no
matter what I do.
v
TABLE OF CONTENTS
ACKNOWLEDGEMENTS ........................................................................................................ iii
TABLE OF CONTENTS ............................................................................................................. v
LIST OF TABLES ..................................................................................................................... viii
LIST OF FIGURES ...................................................................................................................... x
CHAPTER I .................................................................................................................................. 1
Introduction ................................................................................................................................. 1
Objectives ................................................................................................................................... 4
Hypothesis................................................................................................................................... 5
Literature Review........................................................................................................................ 6
IGF-I Physiology .................................................................................................................... 6
Synthesis ............................................................................................................................. 6
Transport. ............................................................................................................................ 6
Factors influencing IGF-I Secretion ....................................................................................... 7
Gender and Age .................................................................................................................. 7
Seasonal Effects. ................................................................................................................. 8
Nutrition .............................................................................................................................. 8
Cartilage Physiology ............................................................................................................ 11
Growth plate cartilage ....................................................................................................... 11
Articular Cartilage ............................................................................................................ 13
Chondrocyte RNA Isolation .................................................................................................. 15
Challenges. ........................................................................................................................ 15
vi
Tissue disruption and homogenization ............................................................................. 17
Cell lysis and RNA purification. ....................................................................................... 17
RNA quality assessment. .................................................................................................. 18
CHAPTER II
Synovial fluid and plasma insulin-like growth factor I in growing Thoroughbred horses ........... 21
ABSTRACT .............................................................................................................................. 21
INTRODUCTION .................................................................................................................... 23
MATERIALS AND METHODS .............................................................................................. 24
RESULTS ................................................................................................................................. 27
DISCUSSION ........................................................................................................................... 28
CHAPTER III
Evaluation of methods for isolation of high-quality total RNA from small articular cartilage
samples....................................................................................................................................... 45
ABSTRACT .............................................................................................................................. 45
INTRODUCTION .................................................................................................................... 46
MATERIALS AND METHODS .............................................................................................. 48
RESULTS AND DISCUSSION ............................................................................................... 51
CHAPTER IV
CONCLUSIONS....................................................................................................................... 56
LITERATURE CITED .............................................................................................................. 58
vii
APPENDIX I
Validation of a commercial human total IGF-I ELISA for use with equine plasma .................... 73
INTRODUCTION .................................................................................................................... 73
MATERIALS AND METHODS .............................................................................................. 74
RESULTS ................................................................................................................................. 76
CONCLUSIONS....................................................................................................................... 78
APPENDIX II
RNA ISOLATION PROTOCOLS ............................................................................................... 86
VITA........................................................................................................................................... 100
viii
LIST OF TABLES
CHAPTER II ............................................................................................................................... 21
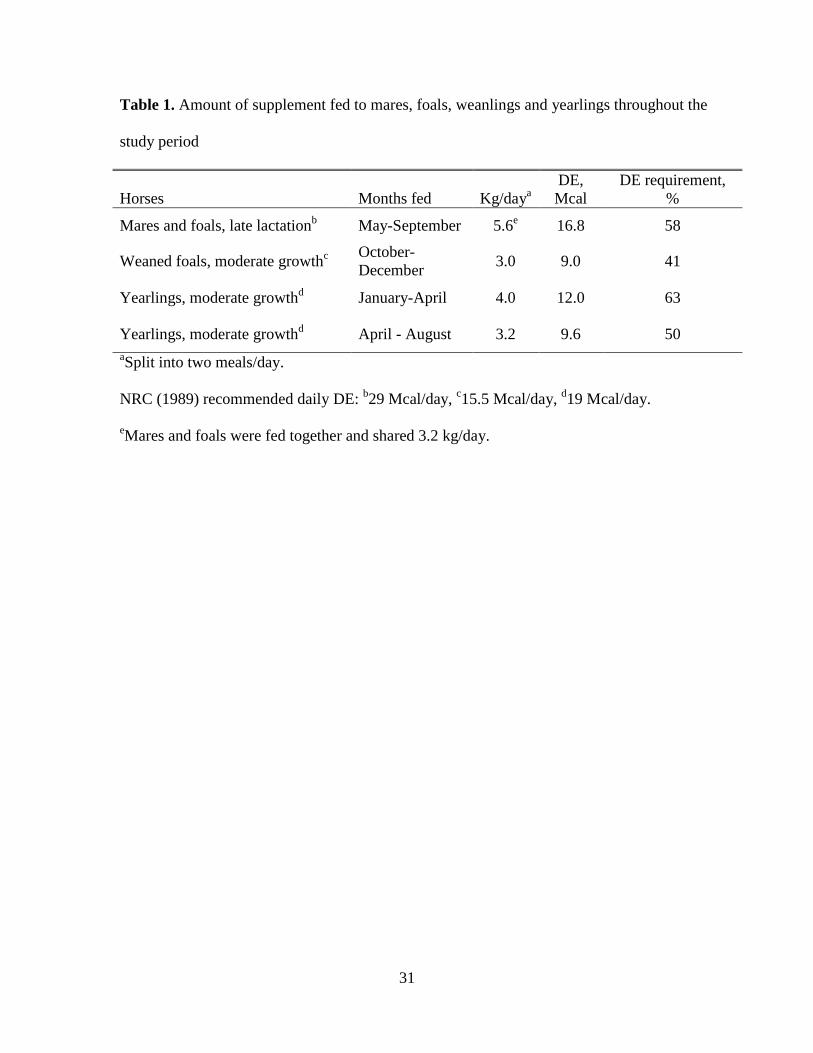
Table 1. Amount of supplement fed to mares, foals, weanlings and yearlings throughout the
study period ............................................................................................................................... 31
Table 2. Nutrient composition on a dry matter (DM) basis of the high starch (HS), and low
starch (LS) supplements fed to Thoroughbred broodmares and their offspring through 15 mo
of age ......................................................................................................................................... 32
Table 3. Total IGF-I concentrations in synovial fluid (SF) and plasma (PL) of growing
Thoroughbred fillies and colts (mean ± SE). No effect of gender on PL or SF IGF-I
concentrations was detected at any time point (P <0.05).......................................................... 33
Table 4. Total IGF-I concentrations in synovial fluid (SF) and plasma (PL) of growing
Thoroughbreds fed either high starch (HS) or low starch (LS) diets. No effect of diet on PL or
SF IGF-I concentrations was detected at any time point (P < 0.05). ........................................ 34
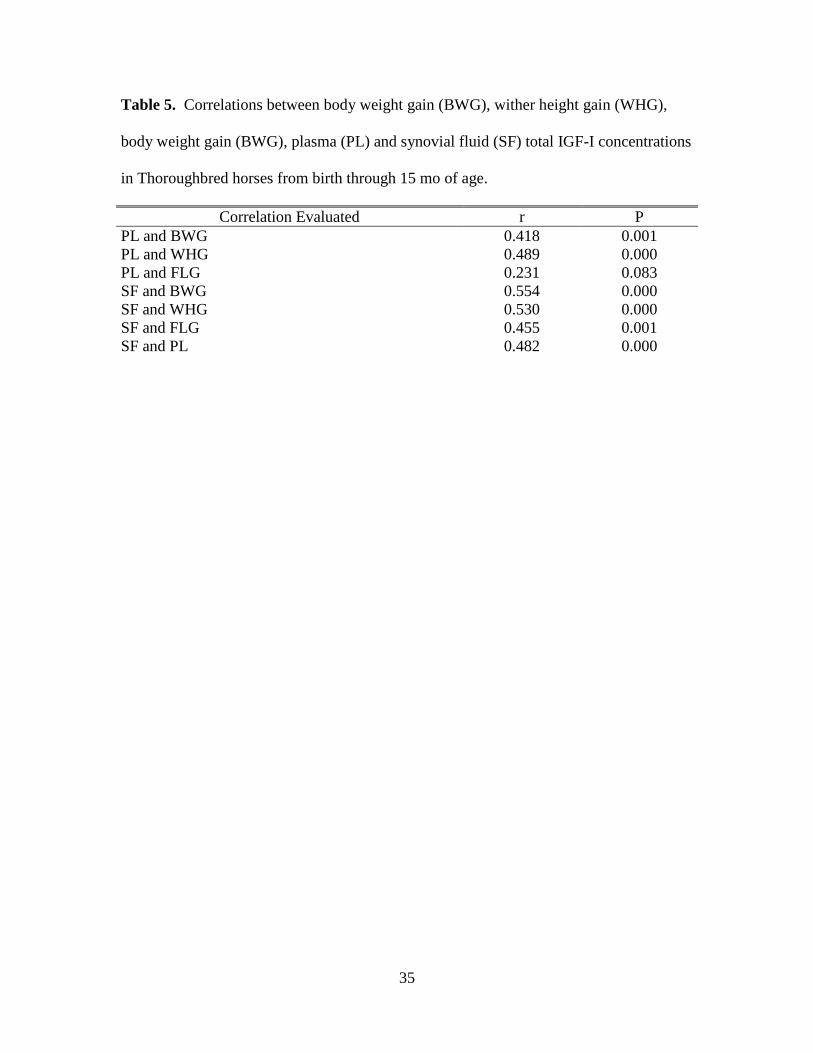
Table 5. Correlations between body weight gain (BWG), wither height gain (WHG), body
weight gain (BWG), plasma (PL) and synovial fluid (SF) total IGF-I concentrations in
Thoroughbred horses from birth through 15 mo of age. ........................................................... 35
CHAPTER III ............................................................................................................................. 45
Table 6. Comparison of homogenization methods used with articular cartilage samples in
combination with the RNeasy® Mini kit (Qiagen Inc, U.S.A.) .............................................. 54
Table 7. Total RNA quantity and quality obtained from 50 mg articular cartilage samples as
measured by the A260:A280 and A260:A230 optical density ratios and RNA integrity number
(RIN) calculated by the Agilent Bioanalyzer. ........................................................................... 55
APPENDIX I ............................................................................................................................... 73
ix
Table 8. Recoveries (%) for ELISA after addition of high concentration plasma samples to
low concentration plasma samples............................................................................................ 84
Table 9. Coefficients of variation (CV, %) for total IGF-I measured by ELISA .................... 85
x
LIST OF FIGURES
CHAPTER I .................................................................................................................................. 1
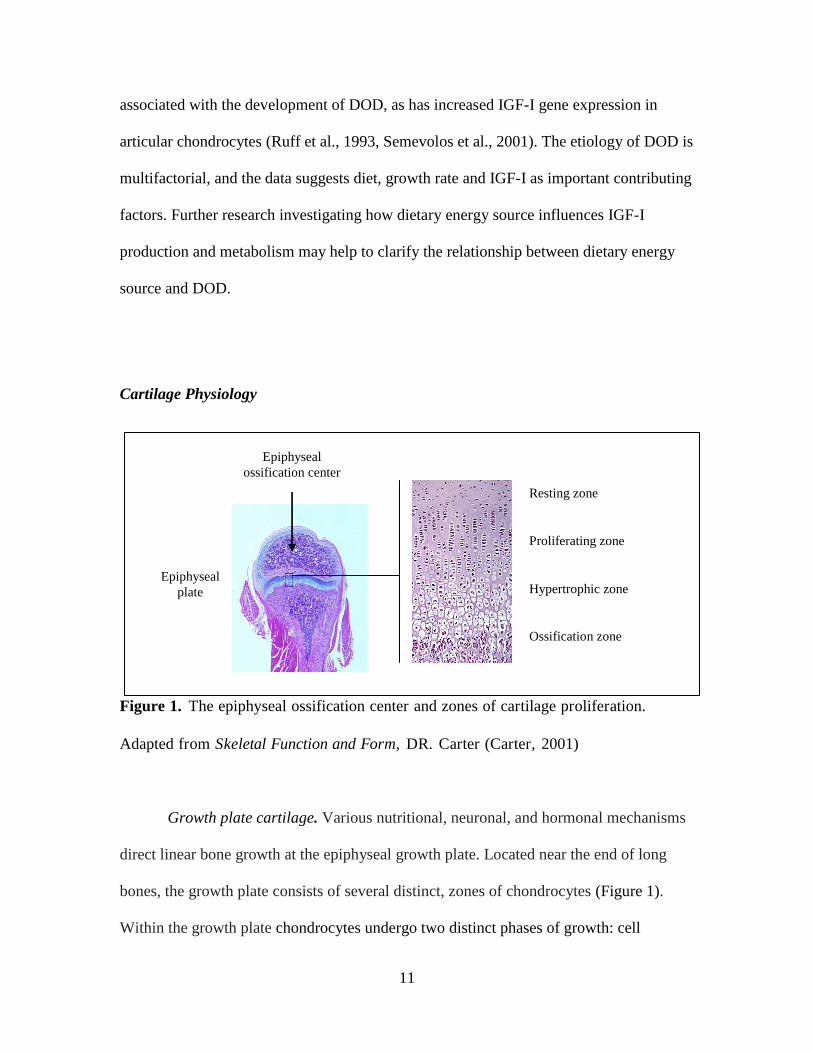
Figure 1. The epiphyseal ossification center and zones of cartilage proliferation. Adapted
from Skeletal Function and Form, DR. Carter (Carter, 2001) .............................................. 11
Figure 2. Electropherogram created by the Bioanalyzer (Agilent Technologies, USA)
detailing the regions that are indicative of RNA quality. These regions are used for the
calculation of an RNA integrity number (RIN), which indicates the quality of purified RNA
within a sample. ........................................................................................................................ 19
CHAPTER II ............................................................................................................................... 21
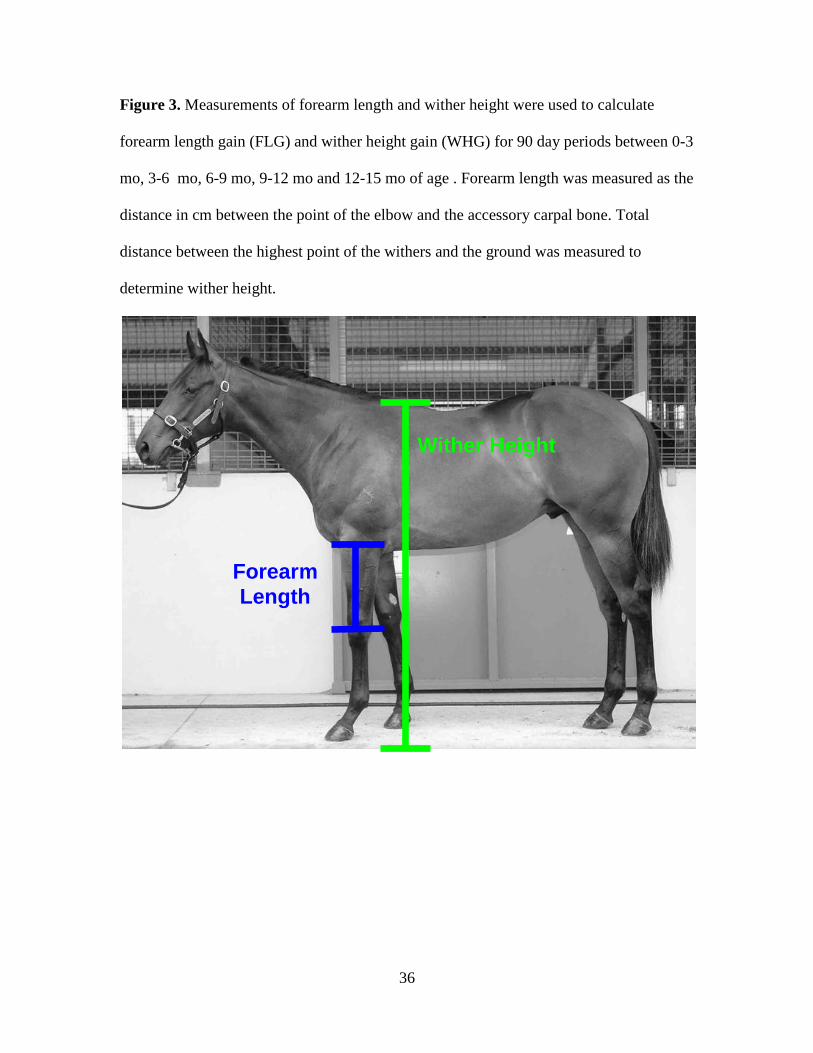
Figure 3. Measurements of forearm length and wither height were used to calculate forearm
length gain (FLG) and wither height gain (WHG) for 90 day periods between 0-3 mo, 3-6 mo,
6-9 mo, 9-12 mo and 12-15 mo of age . Forearm length was measured as the distance in cm
between the point of the elbow and the accessory carpal bone. Total distance between the
highest point of the withers and the ground was measured to determine wither height. .......... 36
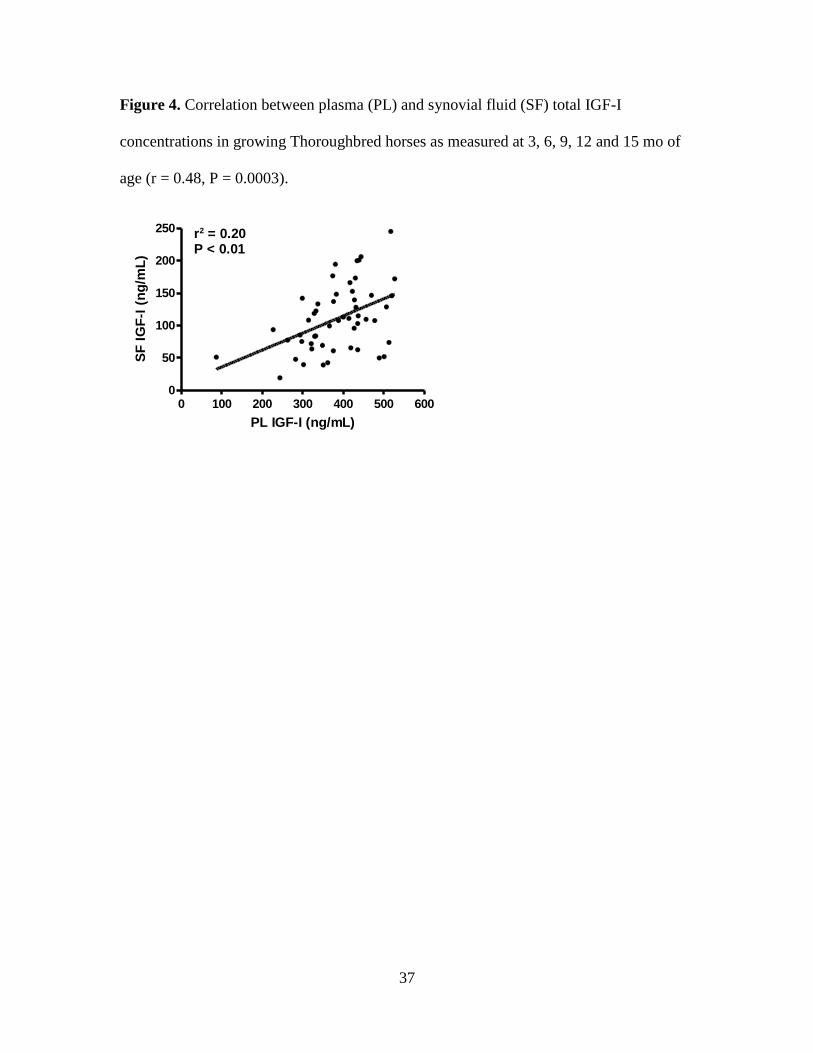
Figure 4. Correlation between plasma (PL) and synovial fluid (SF) total IGF-I concentrations
in growing Thoroughbred horses as measured at 3, 6, 9, 12 and 15 mo of age (r = 0.48, P =
0.0003). ..................................................................................................................................... 37
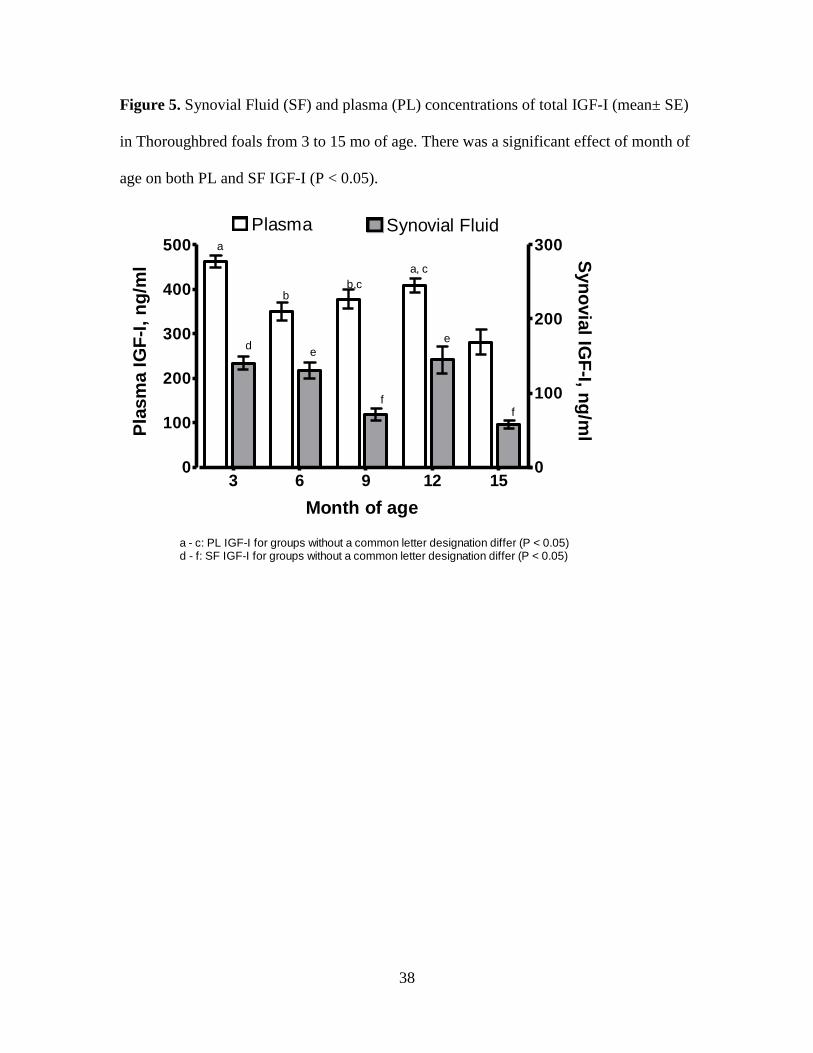
Figure 5. Synovial Fluid (SF) and plasma (PL) concentrations of total IGF-I (mean± SE) in
Thoroughbred foals from 3 to 15 mo of age. There was a significant effect of month of age on
both PL and SF IGF-I (P < 0.05). ............................................................................................. 38
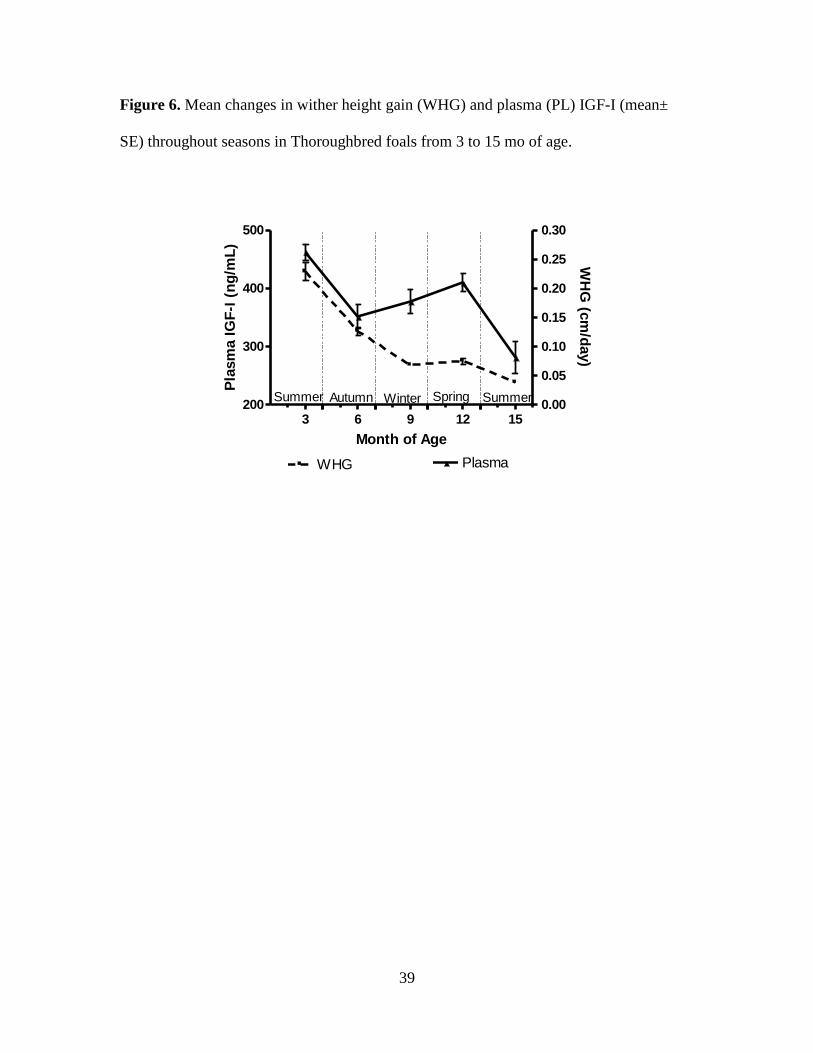
Figure 6. Mean changes in wither height gain (WHG) and plasma (PL) IGF-I (mean± SE)
throughout seasons in Thoroughbred foals from 3 to 15 mo of age. ........................................ 39

xi
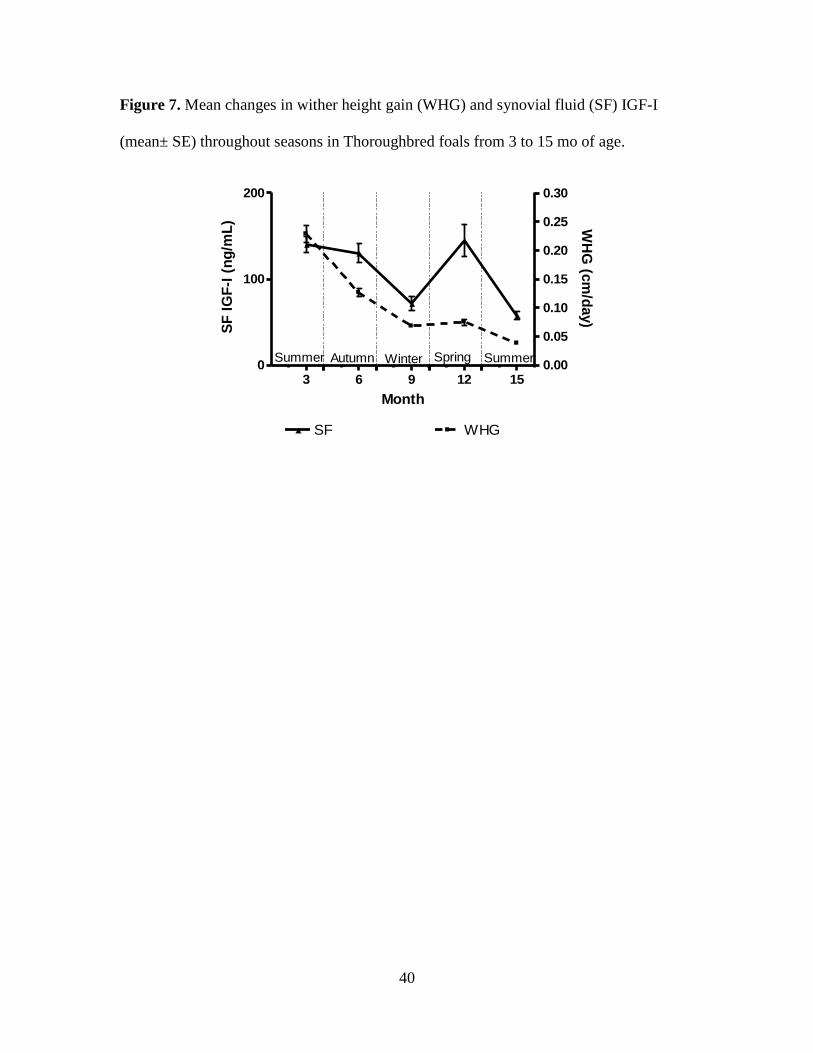
Figure 7. Mean changes in wither height gain (WHG) and synovial fluid (SF) IGF-I (mean±
SE) throughout seasons in Thoroughbred foals from 3 to 15 mo of age .................................. 40
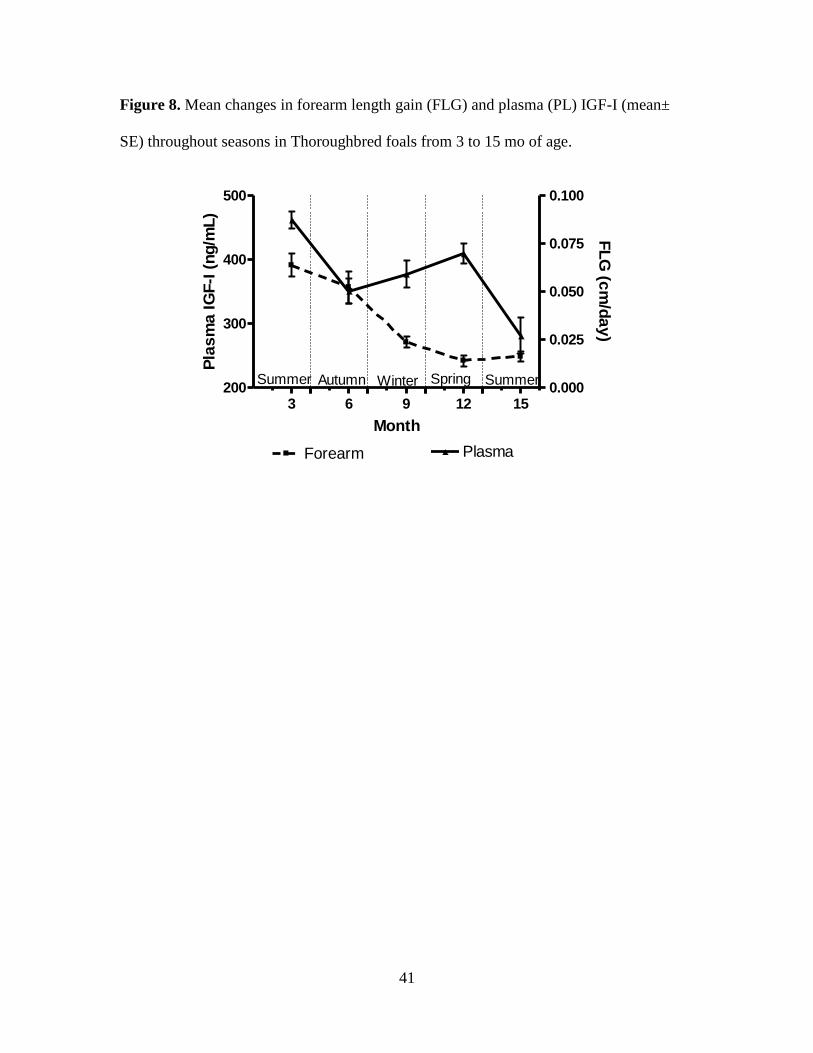
Figure 8. Mean changes in forearm length gain (FLG) and plasma (PL) IGF-I (mean± SE)
throughout seasons in Thoroughbred foals from 3 to 15 mo of age. ........................................ 41
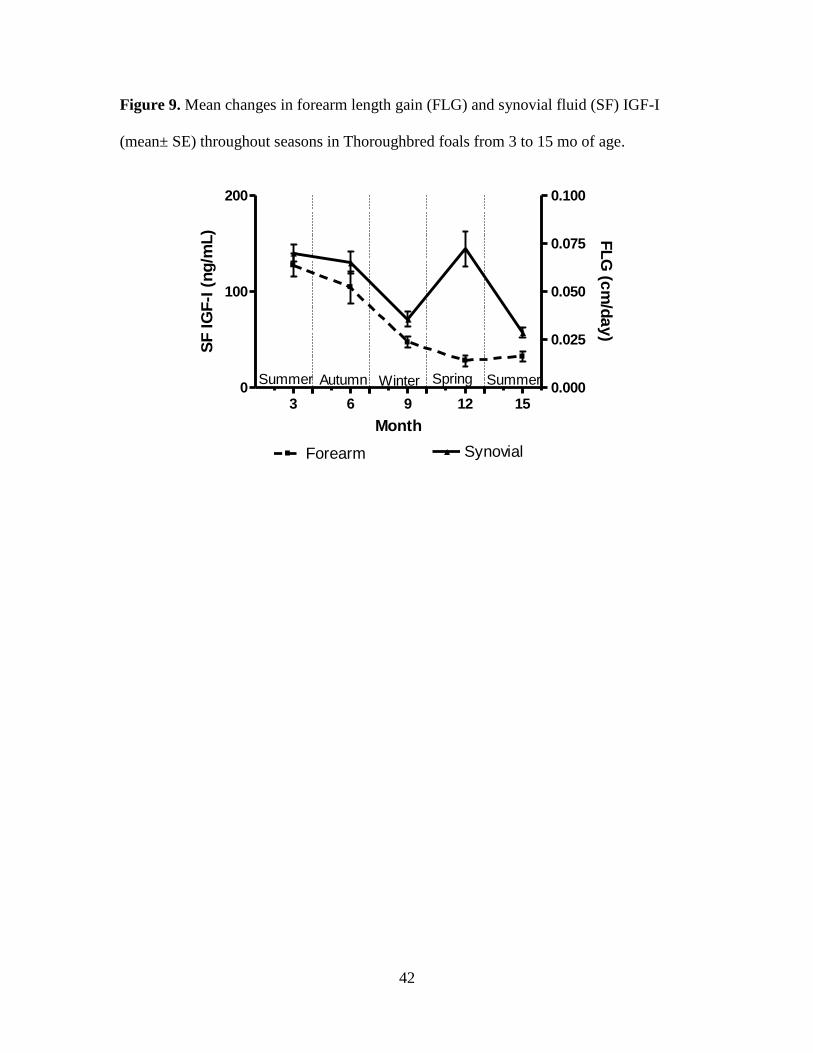
Figure 9. Mean changes in forearm length gain (FLG) and synovial fluid (SF) IGF-I (mean±
SE) throughout seasons in Thoroughbred foals from 3 to 15 mo of age. ................................. 42
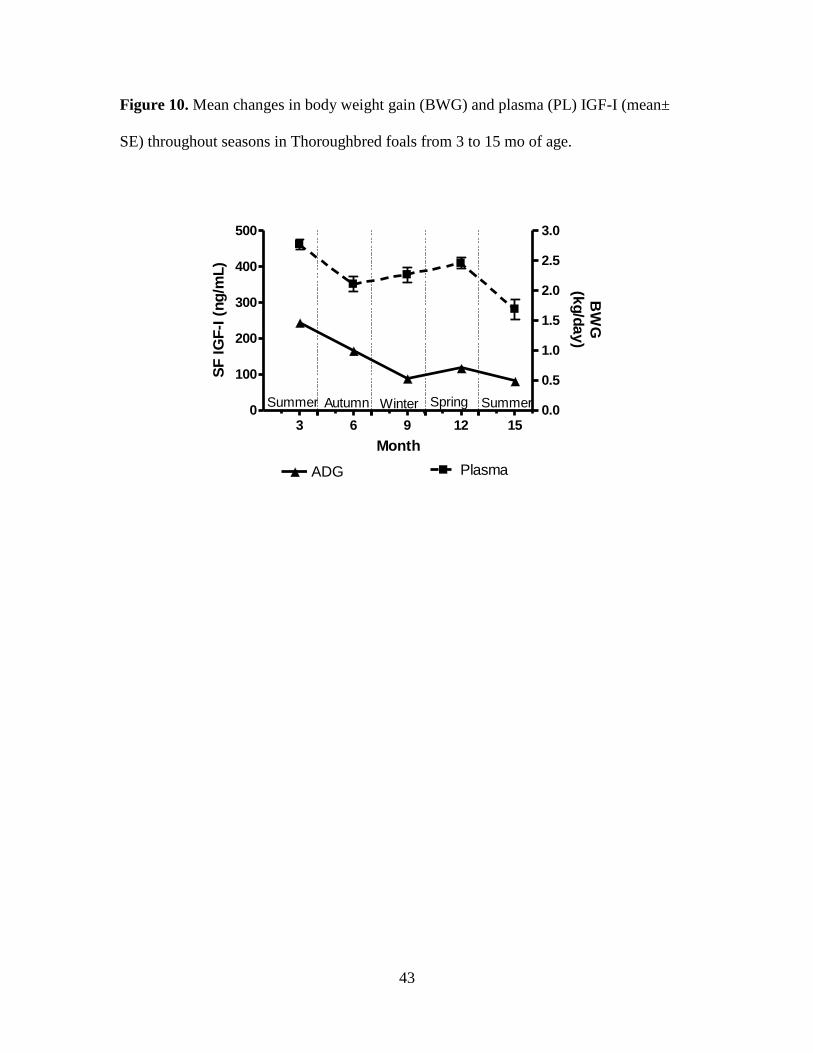
Figure 10. Mean changes in body weight gain (BWG) and plasma (PL) IGF-I (mean± SE)
throughout seasons in Thoroughbred foals from 3 to 15 mo of age. ........................................ 43
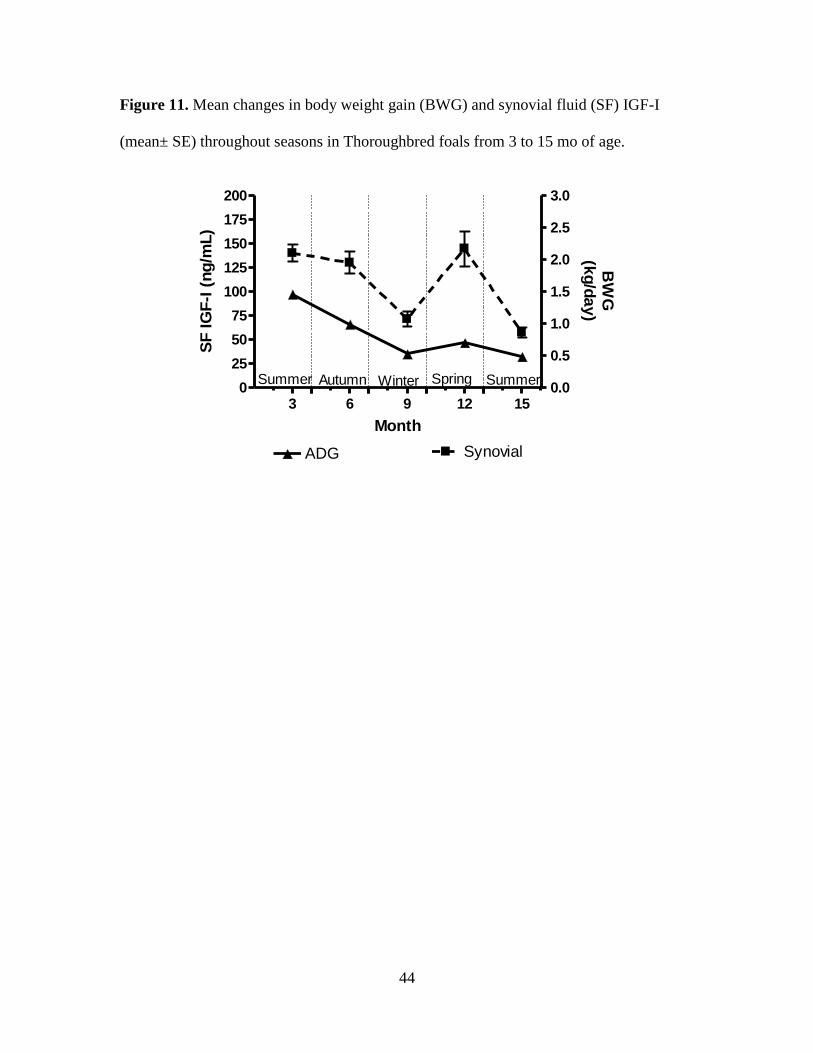
Figure 11. Mean changes in body weight gain (BWG) and synovial fluid (SF) IGF-I (mean±
SE) throughout seasons in Thoroughbred foals from 3 to 15 mo of age. ................................. 44
APPENDIX I ............................................................................................................................... 73
Figure 12. Total IGF-I as measured by ELISA (■) and RIA (●) in response to daily eST
administration (25ug/kg BW/day) to mature Thoroughbred mares. ......................................... 80
Figure 13. Parallelism between IGF-I concentration calculations created using a standard
curve prepared from serial dilutions of IGF-I kit standard (slope = 0.016) and serially diluted
high (slope = 0.012), medium (slope = 0.011) and low (slope = 0.010) concentration plasma
samples. An F test performed on the slopes indicated that the slopes were not different
(F=0.92, P=0.44. ....................................................................................................................... 81
Figure 14. Comparison of total IGF-I values obtained from aliquots of basal plasma samples
with RIA and ELISA. R2 = 0.96. .............................................................................................. 82
Figure 15. Bland-Altman plots of the difference in ELISA and RIA measurements against
mean measurement for total IGF-I. The solid line represents the mean difference in the two
xii
methods (bias line), the broken lines represent two standard deviations above or below the
mean difference (95% limits of agreement). ........................................................................... 83

1
CHAPTER I
Introduction
Healthy skeletal growth and development is vital to the future performance of the
equine athlete. Abnormalities in skeletal development leading to the occurrence of
developmental orthopedic diseases (DOD) contribute to significant economic losses in
the equine industry (Jeffcott, 1996). In order to develop management strategies designed
to avoid DOD, it is first important to gain an understanding of the chemical
communication network regulating skeletal development. Components of the
somatotropic axis such as growth hormone (GH) and insulin-like growth factor-I (IGF-I)
help direct growth in the young animal. IGF-I is particularly important in skeletal
development, acting as a regulatory factor which directs chondrocyte proliferation
(Lindahl et al., 1987).
Many factors including age, season and nutrition may influence changes in the
somatotropic axis. Possible links between diet and the occurrence of DOD continue to be
investigated. Specifically, it has been suggested that diet induced changes in circulating
IGF-I may play a role in the etiology of DOD (Henson et al., 1997b, Ralston, 1996). A
more clear understanding how diet influences circulating IGF-I may be useful in creating
dietary management strategies designed to avoid DOD. Of particular interest is the
relationship between dietary energy source and circulating concentrations of IGF-I (Ropp
et al., 2003, Staniar et al., 2007, Treiber, 2005). We designed a longitudinal study in
young Thoroughbred horses fed either high or low starch diets in an effort to further
characterize this relationship. Examining total circulating IGF-I in these horses is a
2
necessary step in investigating the potential influence of diet on endocrine actions of
IGF-I. However, circulating IGF-I provides little insight into the chemical
communication network to which chondrocytes are exposed. Articular cartilage is an
avascular tissue, and therefore chondrocytes are reliant upon surrounding synovial fluid
for provision of hormones and nutrients. Thus, one of the objectives of our study was to
investigate synovial fluid IGF-I concentrations in addition to circulating IGF-I.
Circulating IGF-I is an important, although broadly acting regulatory factor in
skeletal development (Yakar et al., 2002). Chondrocyte response to IGF-I has been
studied in vitro, but information defining the relationship between circulating and
synovial fluid IGF-I and skeletal growth in horses is lacking. Circulating IGF-I has been
positively correlated with measurements of growth such as average daily gain in
bodyweight, cartilage maturation and curves of body growth (Davicco et al., 1994,
Fortier et al., 2005, Staniar et al., 2007). In this study, we hoped to further define the link
between growth and circulating IGF-I by examining the relationship between direct
measurements of skeletal growth, synovial fluid and plasma IGF-I concentrations.
Information regarding molecular mechanisms which direct equine chondrocyte
metabolism has been primarily obtained from isolated chondrocytes in vitro.
Chondrocyte behavior in vitro may differ greatly from that within articular cartilage
(Cancedda et al., 1995). Collection of articular cartilage samples from horses exposed to
different dietary treatments would provide the most accurate assessment of chondrocyte
metabolism. However, the acellular nature of articular cartilage makes it difficult to
collect sufficient amounts of RNA for gene expression analysis (McKenna et al., 2000).
More robust RNA isolation techniques are needed before in vivo chondrocyte metabolism
3
may be accurately assessed. In order to investigate optimal RNA isolation procedures,
several tissue homogenization methods were evaluated. Next, three RNA extraction
protocols were evaluated for use with small (≤50 mg) articular cartilage samples.
4
Objectives
1. Determine relationship between circulating and synovial fluid concentrations of
total IGF-I in growing Thoroughbreds.
2. Investigate influence of dietary energy source on circulating and synovial fluid
concentrations of total IGF-I.
3. Determine relationship between measurements of skeletal growth, circulating and
synovial fluid concentrations of total IGF-I.
4. Develop a robust method for isolation of high quality total RNA from small
(<50mg) equine cartilage samples for use in transcriptional profiling experiments.

5
Hypothesis
1. Total IGF-I concentrations in synovial fluid will be lower than that in circulation,
but changes in concentration will follow a similar pattern throughout growth.
2. Horses fed a high starch diet will display higher circulating and synovial fluid
concentrations of total IGF-I than horses fed diets low in starch.
3. The correlation between concentrations of total IGF-I in synovial fluid will be at
least as strong, if not stronger than the correlation between circulating IGF-I and
measurements of skeletal growth.
4. Modifications to commercial RNA extraction protocols will increase total RNA
yield and quality obtained from small (<50mg) equine cartilage samples in order
for use in transcriptional profiling experiments.
6
Literature Review
IGF-I Physiology
Originally known as somatomedin C, IGF-I is a 76 kDa single chain peptide
hormone that shares structural homology with pro-insulin. Biological actions of IGF-I are
mediated by the IGF-I receptor (IGF-IR). The IGF-IR is comprised of hormone binding
sites on two extra-cellular alpha-subunits and two membrane-spanning beta-subunits
which include a tyrosine kinase domain within the intracellular segment. Binding of IGF-
I to the receptor activates the receptor tyrosine kinase domain which results in receptor
autophosphorylation and tyrosine phosphorylation of multiple substrates (LeRoith et al.,
1995). These initial tyrosine phosphorylation reactions are transduced through a network
of serine/threonine kinases that are ultimately responsible for cell proliferation,
modulation of tissue differentiation, and protection from apoptosis (Laviola et al., 2007).
Synthesis. Up to 75% of circulating IGF-I is of hepatic origin, with many other
tissues also contributing to total circulating IGF-I concentrations (D'Ercole et al., 1984,
Yakar et al., 2002). Both endogenous and recombinant GH (Mathews et al., 1988, Ropp
et al., 2003) as well as insulin (Russell-Jones et al., 1992) increase hepatic IGF-I
production. Increased circulating IGF-I provides negative feedback for GH stimulation of
hepatic IGF-I synthesis (Wallenius et al., 2001).
Transport. Less than 1% of total IGF-I circulates in free form, with the remaining
percentage bound to 1 of at least 6 known structurally related IGF-I binding proteins
(IGFBP). The IGFBP may sequester IGF-I receptor binding activity or enhance IGF-I
activity at the cellular level. The majority of IGF-I present in circulation (70-80%) is
found in ternary complex with IGFBP-3 and the acid-labile subunit, a glycoprotein
7
produced in the liver (Yakar et al., 2002). IGF-I has a greater binding affinity for this
complex than the IGF-IR. Therefore, the IGFBP play a primary role in regulating the
bioavailabilty of IGF-I. Specific proteases may decrease the affinity of IGFBP-3 with the
IGF-I/IGFBP-3/acid-labile subunit complex. This protease activity results in increased
binding of IGF-I to the IGF-IR (Clemmons et al., 1983, Flanagan et al., 2000, Frystyk et
al., 1997, Holt et al., 2003). Activity of IGFBP may also change in response to diet,
having an inverse relationship with insulin secretion (Holt et al., 2003). Binding activity
of IGFBP also likely follows circadian variation (Holly et al., 1988). Frystyk and
colleagues (2003) suggested that increased nocturnal IGFBP activity and resulting
decreases in free IGF-I may serve to reduce the overall insulin-like activity at a time
when there is no nutritional intake.
Factors influencing IGF-I Secretion
Gender and Age. In horses, circulating concentrations of IGF-I are highest in
intact males, with mares and geldings demonstrating lower but similar IGF-I
concentrations (Cymbaluk and Laarveld, 1996, Malinowski et al., 1996, Noble et al.,
2007). Mammalian species show a general decline in both GH and IGF-I synthesis with
age (Sherlock and Toogood, 2007). This was demonstrated in a study where mares and
geldings aged 1 to 18 years displayed a gradual decrease (50-70%) in serum IGF-I
concentrations with advancing age (Noble et al., 2007). Stallions in this study had higher
circulating IGF-I overall and demonstrated a less severe (20-30%) decline in serum IGF-I
with increasing age. Another study with young fillies found that plasma concentrations
of IGF-I increased from birth through 14 d, remaining relatively constant until 9 mo of
8
age. Thereafter, plasma IGF-I followed a general decline (Malinowski et al., 1996).
Others have suggested that serum IGF-I peaks at a slightly earlier age (225 d), defining
the onset of puberty (Fortier et al., 2005).
Seasonal Effects. Horses do not demonstrate a clear circadian rhythm in
circulating IGF-I, but may display changes associated with seasonal variation (Noble et
al., 2007). Factors such as day length, temperature, and pasture nutrient availability help
to define the relationship between the environment and circulating concentrations of IGF-
I. Increased average daily temperature has been positively correlated with circulating
concentrations of IGF-I in cattle (Sarko et al., 1994), sheep (Lincoln et al., 2001) and
horses (Staniar et al., 2007). Burton and colleagues (1992) attributed elevated circulating
IGF-I concentrations to increases in tissue IGF-I mRNA synthesis in response to
increased temperature (Burton et al., 1992). Longer day length has also been positively
correlated with circulating IGF-I in horses and cattle (Dahl et al., 1997, Staniar et al.,
2007). In the northern hemisphere, seasonal peaks in circulating IGF-I tend to correspond
with spring months. It is notable that this is a time of compensatory growth and
associated increases in average daily gain (ADG) in young Thoroughbreds (Staniar et al.,
2004). Significant but moderate correlations (P < 0.001, r = 0.32) between ADG and
circulating IGF-I have been described in growing horses, further supporting the link
between growth and IGF-I (Cymbaluk and Laarveld, 1996, Staniar et al., 2007).
Nutrition. Grazing animals are exposed to seasonal variations in pasture nutrient
availability. Changing nutrient composition of the diet may be yet another factor which
contributes to seasonal variation in circulating IGF-I. During the spring months in the
northern hemisphere pasture dietary energy, crude protein and non-structural
9
carbohydrate content increase by approximately 5-10% as compared to the winter months
(Cubitt, 2004). Nutrition of foals may also have a long-lasting impact on circulating IGF-
I concentrations. Foals fed commercial milk replacer displayed lower serum IGF-I
concentrations than those that suckled on their damns (Cymbaluk and Laarveld, 1996).
At weaning total IGF-I decreased in all foals. Differences in serum IGF-I between mare-
nursed and milk-replacer foals persisted to 1 yr of age despite similarities in dietary
management and body weight of the foals. The authors suggested that early exposure to
growth factors found in mare milk but absent in milk replacer are responsible for these
continuing effects.
Nutritionally induced changes in GH and insulin may lead to indirect stimulation
and/or inhibition of IGF-I. Short term (< 48h) feed restriction in adult geldings did not
cause changes in circulating concentrations of IGF-I (Christensen et al., 1997). In
contrast, long term dietary energy and/or protein restriction may lead to decreased IGF-I
production despite increased GH production (Sticker et al., 1995). These authors
concluded that localized tissue IGF-I synthesis declined drastically in response to
nutritional deficiencies, overshadowing any GH induced IGF-I production. Local
decreases in GH receptor activity may contribute to these changes (Sticker et al., 1995).
Long term (> 6 weeks) changes in dietary energy source may lead to adaptive
changes in components of the somatotropic axis (Pratt et al., 2006), but conflicting data
has been presented regarding the influence of dietary energy source on circulating IGF-I.
One longitudinal study followed Thoroughbreds fed diets high in either sugar and starch
or fat and fiber as energy sources from birth through 16 mo of age (Staniar et al., 2007).
These authors found that circulating concentrations of IGF-I were higher in horses fed

10
diets high in sugar and starch ( non-structural carbohydrates (NSC) = 53%) than those fed
a low starch diet (NSC = 24%) at approximately 360 days of age during the months of
April and May. Another study utilizing similar dietary treatments sampled Thoroughbred
weanlings which were approximately 230 days old and again found higher circulating
IGF-I in those fed the diet high in sugar and starch (NSC = 49%) as compared to a diet
high in fat and fiber (NSC = 12%) (Treiber et al., 2005). In contrast, a study with
weanling Quarter Horses between 151 to 226 d of age found no differences between
serum IGF-I in those fed starch-based concentrate (NSC = 34%) or those receiving a fat
supplemented diet (NSC = 24%) (Ropp et al. , 2003). It should be noted that dietary
treatments administered to the Thoroughbred foals were the same as those fed to their
dams throughout gestation and lactation. However, Quarter Horse foals were not
acclimated to their respective treatment diets until after weaning. As discussed
previously, early nutrition of foals may have lasting effects on circulating IGF-I
(Cymbaluk and Laarveld, 1996).
The effects of dietary energy source are of particular interest in relation to the
etiology of DOD. Previous studies have found a correlation between meals which create
high glycemic and insulinemic responses meals and the development of DOD (r = 0.74)
(Pagan et al., 2001). One in vitro study demonstrated that increased exposure to insulin
suppressed chondrocyte differentiation and apoptosis in foal neonatal chondrocytes
(Henson et al., 1997a). These authors hypothesized that relative hyperinsulinaemia may
therefore be a contributory factor to DOD. Staniar and colleagues (2007) found that
horses adapted to high glycemic meals displayed higher circulating IGF-I concentrations
during a period of rapid growth in the spring months. Rapid growth has previously been
11
associated with the development of DOD, as has increased IGF-I gene expression in
articular chondrocytes (Ruff et al., 1993, Semevolos et al., 2001). The etiology of DOD is
multifactorial, and the data suggests diet, growth rate and IGF-I as important contributing
factors. Further research investigating how dietary energy source influences IGF-I
production and metabolism may help to clarify the relationship between dietary energy
source and DOD.
Cartilage Physiology
Figure 1. The epiphyseal ossification center and zones of cartilage proliferation.
Adapted from Skeletal Function and Form, DR. Carter (Carter, 2001)
Growth plate cartilage. Various nutritional, neuronal, and hormonal mechanisms
direct linear bone growth at the epiphyseal growth plate. Located near the end of long
bones, the growth plate consists of several distinct, zones of chondrocytes (Figure 1).
Within the growth plate chondrocytes undergo two distinct phases of growth: cell
Ossification zone
zone
Hypertrophic zone
Proliferating zone
Resting zone
Epiphyseal
plate
Epiphyseal
ossification center

12
division, which takes place in the proliferating zone, and cell differentiation, which
occurs in the hypertrophic zone (Yakar et al., 2002b). Terminal differentiation of
chondrocytes occurs through a process leading to endochondral ossification.
Early in vitro research demonstrated that IGF-I increased growth plate
chondrocyte DNA (Smith et al., 1989). This led to further work clarifying the role of
IGF-I in directing both chondrocyte proliferation and differentiation (Smith et al., 1989,
Lupu et al., 2001). IGF-I exerts differential effects on chondrocyte proliferation and
differentiation through multiple, partially interacting intracellular signaling pathways
(Ciarmatori et al., 2007). Ciarmatori and colleagues (2007) found that suppression of
mitogentogen-activated protein kinase/extracellular signal-regulated kinase
(MAPK/ERK), protein kinase A (PKA) pathway by H-89 or KT5720, and the PKC
pathway by bisindolylmaleimide suppressed IGF-I-stimulated cell proliferation. In
contrast, IGF-I enhanced early cell differentiation was not affected by inhibition of the
MAPK/ERK1/2 pathway. Inhibition of the PI-3 kinase, the PKC and the PKA pathways
diminished IGF-I enhanced cell differentiation. These authors proposed that chondrocytes
progressively inactivate IGF-I signaling pathways as they progress from proliferating
cells to early and terminal differentiating cells.
While GH helps to direct these processes, the exact relationship between GH,
IGF-I and chondrocyte proliferation has long been debated. The traditional
“somatomedin hypothesis” suggests that the major role of GH in bone growth is through
regulation of hepatic IGF-I production (Le Roith et al., 2001). This idea was supported by
data suggesting the absence of IGF-I mRNA in growth plate chondrocytes (Shinar et al.,
1993, Wang et al., 1995). More recent research using a liver IGF-1-deficient knockout
13
mouse model has suggested that a threshold concentration of circulating IGF-I is likely
necessary for normal skeletal growth (Yakar et al., 2002a). The influence of hepatic IGF-
I production in response to GH has also been implicated by data demonstrating that GH
does not specifically bind to juvenile chondrocytes or increase IGF-I mRNA levels
(Hutchison et al., 2007). Other researchers believe that IGF-I is produced locally by
chondrocytes under the influence of GH (Reinecke M 2000, Isaksson OG 1987, Isgaard
1988). As evidence has been provided for both the somatomedin hypothesis and local
production of IGF-I by chondrocytes, it is likely that IGF-I may mediate chondrocyte
development and thus longitudinal bone growth in an endocrine as well as
autocrine/paracrine manner.
Articular Cartilage. Located at the ends of long bones, articular cartilage creates a
low friction surface that enables joints to withstand weight bearing through their range of
motion. The cellular portion of articular cartilage is composed of chondrocytes which
produce and maintain components of the extracellular matrix. Collagen within the
extracellular matrix provides its tensile strength, while proteoglycans are responsible for
its compressive resistance. As in growth plate cartilage, IGF-I increases articular cartilage
chondrocyte metabolism (Trippel et al., 1989). Cultured chondrocytes exposed to IGF-I
demonstrate increased collagen and proteoglycan synthesis and deposition. (Jenniskens et
al., 2006, Smith et al., 1989). IGF-I may also influence nutrient transport into
chondrocytes through upregulation of glucose transporters (Phillips et al., 2005).
An increasing amount of attention has been focused on the role of IGF-I in adult
articular cartilage maintenance and repair. Processes which inhibit normal physiological
and anabolic actions of IGF-I have been implicated in the etiology of degenerative
14
diseases such as osteoarthritis (Mobasheri et al., 2002). Although less widely studied,
limited research had demonstrated that altered IGF-I metabolism may be a contributing
factor to several forms of DOD. Young, growing horses affected by Juvenile Digital
Degenerative Osteoarthropathy display lower circulating concentrations of IGF-I than
clinically normal horses (Lejeune et al., 2007). Foals with osteochondrosis also showed
significantly lower serum IGF-I activity than osteochondrosis-negative foals (Sloet van et
al., 1999). Further research is needed to examine the specific molecular mechanisms that
may lead to these abnormalities.
Chondrocytes are exposed to a limited blood supply for provision of hormones
and nutrients during early stages of growth. Articular cartilage becomes increasingly
avascular until approximately 6 months of age, when cartilage canals disappear (Fortier
et al., 2005, Shingleton et al., 1997). At this time chondrocyte exposure to circulating
concentrations of hormones and nutrients becomes contingent upon their diffusion
through the synovial membrane (Stockwell, 1979). Single chondrocytes are surrounded
by vast areas of matrix through which IGF-I must be transported to reach a responsive
cell. This transport is hindered in areas of greater cartilage thickness but facilitated by
joint advection in response to loading (Mauck et al., 2000, Stockwell, 1979). To further
investigate the effects of joint loading on synovial fluid and chondrocyte metabolism,
researchers incubated normal chondrocytes in synovial fluid collected from either
exercised or rested horses. Chondrocytes incubated in the synovial fluid from exercised
horses demonstrated elevated metabolism as evidenced by increased turnover of the
extracellular matrix. These authors concluded increased chondrocyte metabolism could
15
be attributed to higher concentrations of IGF-I found in the synovial fluid of exercised
horses (van de Lest et al., 2000).
In human subjects the concentration of total IGF-I in synovial fluid is an order of
magnitude lower than that in serum, while concentrations of free IGF-I are similar in both
fluids. (Schneiderman et al., 1995). This difference may be partially explained by the
limited permeability of the synovium (Schneiderman et al., 1995). Bioactivity of IGF-I is
regulated through a balance of IGF-I, IGFBP, and protease activity (Bhakta et al., 2000,
Matsumoto et al., 1996, Zhang et al., 2007). It is likely that the 150 kDa IGF-I/IGFBP-
3/ALS ternary complex is too large to pass through the synovial membrane. It has
previously been shown that complexes of smaller size than the ternary complex such as
67 kDa IgG are partially excluded from the synovial space (Levick, 1991). The majority
of total IGF-I in circulation is found in a “large” IGFBP complex as compared to small
complex (82 and 17%, respectively). IGF-I in synovial fluid is bound in nearly equal
proportions to large and small IGFBP complexes (47 and 52%, respectively)
(Schneiderman et al., 1995). Concentrations of IGF-I in SF may also reflect local
production of IGF-I by chondrocytes, which varies in response to ageing as well as
nutrient availability (Martin et al., 1997, Richardson et al., 2003). Previous research in
this area has been obtained from humans and it is not known if similar relationships
between circulating and synovial fluid concentrations exist in horses.
Chondrocyte RNA Isolation
Challenges. Chondrocyte phenotypes in vitro differ greatly from that found in
vivo (Cancedda et al., 1995). Thus, information about chondrocyte metabolism obtained

16
from in vitro research may not provide an accurate assessment of chondrocyte behavior
within articular cartilage. There are a number of obstacles to obtaining data from articular
cartilage samples including restricted sample size, the acellular nature of the tissue and
high levels of proteoglycans within the tissue. Removal of small biopsies allows for
subsequent sampling from the same individual, but creates limitations due to small
sample size. Another concern is the capacity of articular cartilage to repair itself at the
site of harvest. This is particularly an issue in older individuals due to low mitotic
activity, the absence of vessel and nerve supply, and the immobility of chondrocytes
within articular cartilage (Mandelbaum et al., 1998). Biopsy size that may be harvested
without producing significant joint damage has not been established in horses. A study
utilizing a canine model found that harvest of samples as small as 250mg from the stifle
joint negatively affected cartilage strength and integrity at other sites within the joint (Lee
et al., 2000). Yields from current RNA isolation protocols may be as low as 0.001-0.018
μg/mg of tissue (McKenna et al., 2000). This suggests that sample size must be greater
than 100mg in order to obtain several micrograms of RNA for gene expression analysis.
Protocols that are commonly used to isolate RNA from animal tissues are often
unsuccessful with articular cartilage samples. Traditional extraction methods are designed
to be used with highly cellular tissues and not those of an acellular nature such as
articular cartilage. The actual composition of cartilage also presents obstacles for the
isolation of pure RNA. The extracellular matrix is composed of a high proportion of
large, negatively charged proteoglycans which tend to co-purify with RNA (Carney and
Muir, 1988).

17
Tissue disruption and homogenization. The first and one of the most critical steps
in isolating RNA from tissues is to ensure complete tissue disruption and
homogenization. Various methods have been developed for this purpose. It is important
to avoid RNA degradation by maintaining samples at a very low temperature. Snap
freezing of samples in liquid nitrogen is frequently performed for this reason. Many
homogenization methods also incorporate the use of liquid nitrogen to maintain sample
temperature. Use of a liquid nitrogen-cooled mortar and pestle is often successful but
inappropriate for use with small samples due to inherent sample loss during the
homogenization process (Fehr et al., 2000). A motorized freezer mill is also effective for
homogenization of larger samples but inherit sample loss is problematic for smaller
samples (McKenna et al., 2000). The ability of rotor-stator homomogenizers to handle
small samples has led to their increased use with cartilage samples (Baelde et al., 2001,
Smith et al., 2006).
Cell lysis and RNA purification. Inhibition of RNase activity remains a concern
throughout tissue disruption and homogenization. In addition to the use of liquid nitrogen
to maintain temperature, many lysis buffers contain RNase inhibitors such as beta-
mercaptoethanol (Louveau et al., 1991). Placing samples in such lysis buffers and
maintaining a low temperature throughout the homogenization process effectively
minimizes RNA degradation. Lysis of chondrocytes may be facilitated through the use of
mono-phasic solutions of phenol and guanidine isothiocyanate. Several commercial
solutions have been formulated for this purpose based upon an acid guanidinium
thiocyanate-phenol-chloroform mixture proposed by Chomczynski and Sacchi
(Chomczynski and Sacchi, 1987). Addition of chloroform and subsequent centrifugation
18
separates the extraction solution into aqueous and organic phases (Louveau et al., 1991).
Disturbance of the interphase and lower organic phase creates a risk for proteoglycan
contamination of RNA within the aqueous phase. Some isolation protocols used for
cartilage suggest isopropranol precipitation of RNA (Flannery et al., 1999, McKenna et
al., 2000). Others have found no difference in final RNA quality with the omission of this
step (Clements et al., 2006). Silica membrane columns are frequently used for further
purification and isolation of chondrocyte RNA (Fehr et al., 2000).
RNA quality assessment. Many methods may be used to assess the quality of
isolated RNA. Optical density measured by UV Spectroscopy at 260nm and 280nm can
provide insight into RNA purity. A 260nm/280nm ratio greater than 1.8 is indicative of
pure RNA (Glasel, 1995). Residual organic contaminants such as proteoglycans may be
detected by the presence of a peak at 230 nm (Manchester, 1996). Further evaluation may
involve electrophoresis analysis utilizing agarose gel. The proportion of the ribosomal
bands (28S:18S) has conventionally been viewed as the primary indicator of RNA
integrity, with a ratio of 2.0 considered to be typical of high quality intact RNA
(Sambrook, 1989).
Although the above methods are frequently used for tissue RNA analysis they
may not be practical for use with cartilage samples. The quantity of RNA required for
these methods creates a challenge when small cartilage samples are used. In recent years
RNA quality assessment using microfluidic capillary electrophoresis with the Agilent
2100 Bioanalyzer (Agilent Technologies, USA) has become popular (Schroeder et al.,
2006a). The electrophoresis trace created by the Bioanalyzer (Figure 2) may be used to
assign a RNA integrity number (RIN) to each sample (Mueller et al., 2006). The RIN is

19
calculated using an algorithm which considers features such as the height of the 18S
peak; the ratio of the area of the ribosomal bands compared with the total area of the
electropherogram; and the ratio of the fast area of the electropherogram to the total area
of the electropherogram. The number assigned by the RIN software ranges from 1-10,
with 1 being the most degraded profile and 10 being the most intact. The RIN has been
positively correlated with success of downstream reactions (Schroeder et al., 2006b).
Samples with an RIN ≥ 7 are generally considered ideal for downstream reactions,
although quality standards may vary between individual laboratories.
Figure 2. Electropherogram created by the Bioanalyzer (Agilent Technologies, USA)
detailing the regions that are indicative of RNA quality. These regions are used for the
calculation of an RNA integrity number (RIN), which indicates the quality of purified
RNA within a sample.
Calculation of the RIN has proven more reliable than methods previously used to
assess RNA integrity (Imbeaud et al., 2005). A study comparing several methods found
20
that the RIN was more sensitive and specific for determining RNA quality than UV
spectrometry (Clements et al., 2006). This technology has the additional benefit of
requiring only a small amount (as low as 200 pg) of sample for comprehensive quality
analysis.
In summary, the nature of articular cartilage presents many challenges for
isolating RNA from small samples. While UV spectroscopy is useful for assessing RNA
purity and more specifically proteoglycan contamination, the Bioanalyzer provides an
accurate assessment of RNA integrity using a small amount of sample (Clements et al.,
2006).
21
CHAPTER II
Synovial fluid and plasma insulin-like growth factor I in growing
Thoroughbred horses
R. S. Cosden1,2
, W. B. Staniar1,2
, J. A. Brown3 and P.A. Harris
4.
1Department of Animal and Poultry Sciences, Virginia Tech, Blacksburg, VA.
2Middleburg Agricultural Research and Extension Center, Middleburg, VA.
2Marion
DuPont Scott Equine Medical Center, Virginia-Maryland Regional College of Veterinary
Medicine, Leesburg, VA. 3Equine Studies Group, WALTHAM Centre for Pet Nutrition,
Melton Mowbray, U.K.
ABSTRACT
The objective of this longitudinal study was to characterize developmental
patterns of plasma (PL) and synovial fluid (SF) total IGF-I concentrations, as well as
their association with measurements of skeletal growth in Thoroughbred horses. In
addition, the influence of dietary energy source on PL and SF IGF-I was examined.
Broodmares were randomly assigned to one of two dietary treatment groups and fed
isocaloric and isonitrogenous (DE = 3.0 ± 0.02 Mcal/kg, CP = 14.8 ± 0.01 %) rations
with either a high starch (HS, starch = 39 ± 2%, ether extract = 3.8 ± 0.3%, n = 6) or low
starch content (LS, starch = 4.8 ± 0.7%, ether extract = 13.8 ± 0.4%, n = 6) throughout
gestation and lactation. Foals remained on these diets after weaning through 15 mo of
age, and at 3, 6, 9, 12 and 15 mo of age, PL and carpal SF samples were collected for
analysis of total IGF-I. Monthly measurements of growth were recorded for calculation
22
of body weight gain, wither height gain and forearm length gain for 90 day periods
between 0-3mo, 3-6 mo, 6-9 mo, 9-12 mo and 12-15 mo of age. No difference was
detected between total plasma IGF-I concentrations in fillies (n = 5) and colts (n = 7) (P >
0.05). No influence of diet on PL or SF IGF-I was detected (P > 0.05). Average SF IGF-I
concentrations were 30.1 ± 1.8% of that found in PL, and PL and SF IGF-I were
positively correlated (r = 0.48, P = 0.0003). There was an effect of month of age on both
PL and SF IGF-I concentrations (P < 0.05), with peak values obtained at 3 mo of age
(462.0 ± 13.7, and 140.3 ± 8.9; respectively). A secondary peak in PL, SF (409.6 ± 15.7,
and 144.9 ± 18.1; respectively), and rates of gain occurred at 12 mo of age,
corresponding with spring months. There was a positive correlation between all measures
of gain except forearm length gain with PL and SF IGF-I (r = 0.41 to 0.55, P < 0.05).
Key Words: Synovial Fluid, IGF-I, Skeletal Growth, Dietary Energy
23
INTRODUCTION
Healthy skeletal growth and development is essential for horses to achieve their
full athletic potential. A combination of genetic and management factors may lead to the
occurrence of bone disorders such as developmental orthopedic disease (DOD), which
contributes to considerable economic losses in the equine industry (Jeffcott, 1996). In
order to develop management strategies designed to avoid DOD, it is important to better
understand the chemical communication network regulating skeletal development. The
somatotropic axis, with principle hormones such as growth hormone (GH) and insulin-
like growth factor-I (IGF-I) is at the heart of this chemical communication network. A
principal component of the somatotropic axis, IGF-I promotes chondrocyte proliferation
and differentiation resulting in longitudinal bone growth and articular cartilage
development (Lupu et al., 2001). Multiple factors including age, environment and
nutrition may influence circulating concentrations of total IGF-I in horses. We
hypothesize that these components will influence similar changes in PL and SF IGF-I
throughout growth.
In young horses, circulating IGF-I concentrations have been correlated with
measurements of growth and skeletal development such as average daily gain in
bodyweight, cartilage maturation, and curves of body growth (Davicco et al., 1994,
Fortier et al., 2005, Staniar et al., 2007). However, data examining the relationship
between circulating IGF-I and chondrocyte metabolism is lacking. Articular cartilage is
an avascular tissue, reliant upon surrounding synovial fluid (SF) as a source of the
hormones and nutrients that regulate and support its growth. It is our hypothesis that SF
24
IGF-I concentrations will be more strongly correlated with measurements of skeletal
growth than PL IGF-I.
Conflicting data has been presented regarding the influence of dietary energy
source on circulating IGF-I. Growing Thoroughbreds fed diets high in sugar and starch
demonstrated increased circulating IGF-I as compared to those fed diets high in fiber and
fat (Staniar et al., 2007, Treiber et al., 2005). In young Quarter Horses fed diets high in
fat or high in starch, no differences in circulating IGF-I concentrations were detected
(Ropp et al., 2003). In this study, we further examine this relationship with dietary energy
source.
Our objectives were to conduct a longitudinal study in growing Thoroughbreds in
order to characterize the developmental changes in PL and SF total IGF-I between 3 and
15 mo of age, to investigate the relationship between PL IGF-I and SF IGF-I with
quantitative measurements of skeletal growth, and to investigate the influence of dietary
energy source on PL and SF IGF-I.
MATERIALS AND METHODS
Animals and Management
Twelve Thoroughbred foals born at the Middleburg Agricultural Research and
Extension Center (MAREC) in Northern Virginia were studied from birth through 15 mo
of age. Broodmares were paired by weight, expected foaling date and sire, and then
randomly assigned to one of two dietary treatment groups. Broodmares were fed their
assigned diets throughout gestation and lactation. Prior to weaning foals shared meals
with their dams, and were continued on the feeds from weaning through 16 mo of age.
25
All horses were collectively fed at 07:00 and 14:00 in a 30-m circle of feed pans
containing individual portions. Feed was adjusted to maintain a body condition score
(BCS) of 4.5–5.5 on a 9 point scale (Henneke et al., 1983) in both mares and foals
throughout growth (Table 1). Horses were rotated monthly between two matched 30-acre
mixed grass and ladino clover pastures. Water was available ad libitum. Colts were
gelded at 3-4 wk of age and all foals were weaned between 6 and 9 mo of age.
Feeds
A high starch (HS, starch = 39 ± 2%, ether extract = 3.8 ± 0.3%, n = 6,) and low
starch (LS, starch = 4.8 ± 0.7%, ether extract = 13.8 ± 0.4%, n = 6) feed were formulated
for this study (Table 2). Feeds were formulated to be isocaloric and isonitrogenous as
described previously (Williams et al., 2001). Mineral and vitamin contents of the feeds
(DSM Nutritional Products, Inc., Parsippany, NJ, USA) were balanced to complement the
pastures in central and north-central Virginia and to meet or exceed current
recommendations (Greiwe-Crandell et al., 1995, Hoffman et al., 1999, NRC, 2007).
Starch content was determined using a glucoamylase enzyme and measuring dextrose in
an automated biochemical analyzer (YSI 2700 SELECT Biochemistry Analyzer, YSI
Incorporated, Yellow Springs, Ohio, USA, Application Note Number 319).
Collection of Blood and SF
At 3, 6, 9, 12 and 15 months of age, horses were transported 32 km to an equine
hospital for sample collection. Prior to sample collection, horses were sedated with a
mixture of xylazine (1mg/kg BW) and butorphanol (0.01 mg/kg BW). Following aseptic
26
preparation, 2-4 mL carpal SF samples were collected and stored at -20° C in 2mL
polypropylene tubes. Blood was collected via jugular venipuncture into heparinized tubes
(Becton Dickinson and Company, Franklin Lakes, NJ). Within one hour of collection, PL
was separated via centrifugation at 3,000 x g and stored at -20° C for further analysis.
Total IGF-I was measured in SF and PL using an enzyme-linked immunosorbent assay
(ELISA) including an initial acid ethanol extraction for separation of binding proteins
(DSL 10-5600, Webster, TX). The inter-assay coefficient of variation (CV) for the ELISA
was calculated using total IGF-I concentrations for SF (n= 58) and PL (n = 58) samples run
in duplicate on two separate assays. The intra-assay CV was calculated using total IGF-I
concentrations for separate SF (n= 11) and PL (n = 6) samples run in duplicate ≥ 2 times
within the same assay. The total IGF-I ELISA demonstrated an inter and intra-assay CV for
PL and SF of 13%, 5.6% and 22%, 5.5% respectively (Appendix I).
Morphometric Measurements
From birth through 16 mo of age, monthly measurements of total body weight,
wither height and forearm length were recorded to assess growth (Figure 3). Body
weights were measured using a calibrated electronic walk on scale (Tyrel platform, TC-
105, Alweights Hamilton Scale Corp., Richmond, VA). Average daily body weight gain
(BWG), wither height gain (WHG) and forearm length gain (FLG) were calculated for
90 day periods between 0-3 mo, 3-6 mo, 6-9 mo, 9-12 mo and 12-15 mo of age.
27
Statistical Analysis
Associations between measures of gain, PL and SF IGF-I concentrations were
analyzed with Spearman correlations. A repeated measures analysis of variance was used
to examine the effects of time, gender, and feed treatment on PL and SF IGF-I. All
analyses were performed using statistical software (Intercooled Stata, StataCorp LP,
College Station, Texas). Differences were considered significant at P< 0.05. Data are
presented as means ± SE.
RESULTS
Total IGF-I concentrations were not found to be different between fillies and colts
(P > 0.05) (Table 3). No influence of diet on PL or SF IGF-I was detected (P > 0.05)
(Table 4). Therefore, data for all horses were pooled for further analysis. With the
exception of the samples from 9 mo of age, SF concentrations of IGF-I were consistently
lower (30.1 ± 1.8% of PL IGF-I) and positively correlated with PL IGF-I (r = 0.48, P =
0.0003) (Figure 4). Both PL and SF IGF-I followed a similar pattern of change
throughout growth (Figure 5). There was an effect of age on both PL and SF IGF-I
concentrations (P < 0.05). The highest values for PL and SF were detected at 3 (462.0 ±
13.7, and 140.3 ± 8.9; respectively) and 12 mo of age (409.6 ± 15.7, and 144.9 ± 18.1;
respectively). Highest rates of gain occurred at 3 and 12 mo of age, corresponding with
spring months (Figures 6-11). Both PL and SF IGF-I were lowest at 15 mo of age (281 ±
28, 57 ± 5 ng/ml; respectively). There was a positive correlation between all measures of
gain except FLG with PL and SF IGF-I (r = 0.41 to 0.55, P < 0.05 Table 5).
28
DISCUSSION
This is the first longitudinal study to examine the correlation between SF and PL
IGF-I concentrations as well as their relationship to skeletal development in
Thoroughbreds. The results of this study suggest a moderately strong association between
PL and SF IGF-I (r = 0.48, P = 0.0003). A similar association between SF and PL total
IGF-I concentrations has previously been found in human subjects (Schneiderman et al.,
1995). The difference in PL and SF total IGF-I concentrations may be partially explained
by the limited permeability of the synovium (Schneiderman et al., 1995). Less than 1% of
total IGF-I circulates in free form, with the remaining percentage bound to 1 of multiple
structurally related IGF-I binding proteins (IGFBP).
The majority of IGF-I present in circulation (70-80%) is found in a 150 kDa
ternary complex with IGFBP-3 and acid-labile subunit (Yakar et al., 2002). It is likely
that the ternary complex is too large to pass through the synovial membrane. It has
previously been shown that complexes of smaller size than the ternary complex such as
IgG (67kDa) are partially excluded from the synovial space (Levick, 1991). The majority
of bound IGF-I in SF is bound in small complexes (Schneiderman et al., 1995).
Concentrations of IGF-I in SF may also reflect local production of IGF-I by
chondrocytes, which varies in response to ageing as well as nutrient availability (Martin
et al., 1997, Richardson et al., 2003). Exposure to increasing concentrations of IGF-I in
vitro promotes increased chondrocyte metabolism (Trippel et al., 1989). Resulting
increases in nutrient transport as well as collagen and proteoglycan synthesis and
deposition contribute to longitudinal bone growth (Jenniskens et al., 2006, Phillips et al.,

29
2005, Smith et al., 1989). This was reflected in this study by the increase in PL and SF
IGF-I detected during periods of compensatory growth in the spring months.
In this study SF IGF-I concentrations were similarly or more closely correlated
with measures of skeletal growth than PL IGF-I. Synovial fluid is likely to have a greater
influence on chondrocyte metabolism than PL, particularly in articular cartilage due to its
proximity to the articular cartilage itself. This highlights the importance of collecting SF
as well as PL in order to provide an accurate assessment of how dietary treatments may
affect cartilage metabolism.
As found in previous studies, IGF-I concentrations were highest in the younger
more rapidly growing animals and followed a general decline with age (Cymbaluk and
Laarveld, 1996, Staniar et al., 2007). Our results also characterize a secondary peak in
both PL and SF IGF-I at 12 mo of age. It is notable that the timing of this peak
corresponds with a compensatory growth period in the foals, as well as the improved
nutrient availability associated with spring pasture (Staniar et al., 2004). During the
spring months (April and May in northern Virginia) pasture DE, crude protein and non-
structural carbohydrate content increases approximately 5-10% compared to the winter
months (January and February) (Cubitt, 2004). Season-related changes in circulating
IGF-I follow similar patterns to those found in previous research (Staniar et al., 2007). In
addition to pasture nutrient availability, this may be partially attributed to changes in day
length and temperature. Increased photoperiod and temperature have been positively
correlated with circulating IGF-I in horses and other species (Dahl et al., 1997, Sarko et
al., 1994, Staniar et al., 2001).
30
In contrast with earlier findings from our group, we did not detect an influence of
dietary energy source on either PL or SF IGF-I concentrations (Staniar et al., 2007,
Treiber et al., 2005). A previous study utilizing similar diets detected differences in PL
IGF-I only in the months of April and May and corresponding with periods of rapid
growth (Staniar et al., 2007). Another study found higher basal IGF-I concentrations in
weanlings adapted to a high starch diet approximately 30d after weaning in the fall
(Treiber et al., 2005). The infrequent sampling protocol utilized in the current study did
not allow for full evaluation of these time periods. Our results are consistent with a study
conducted in weanling Quarter horses between 5 and 8 months of age, where no
differences were detected in serum IGF-I between those fed a soluble carbohydrate-based
concentrate (DE 2.9 Mcal/kg, NSC = 33.9%) or those receiving a 10% fat supplemented,
soluble carbohydrate-based concentrate( DE = 3.0 Mcal/kg, NSC =24% ) (Ropp et al. ,
2003). Again, this particular sampling protocol did not include time periods where
differences in circulating IGF-I have previously been found. A frequent sampling
protocol over a period of time may be necessary to detect adaptive changes to dietary
energy source as demonstrated by changes in circulating IGF-I concentrations.
The results from this study may help to define how SF concentrations of IGF-I
change in relation to age and skeletal growth. Future research should aim to further
define these relationships, examining how the influence of dietary energy source on
cartilage metabolism may change in relation to age, growth rate and time of year. The
information obtained in this study highlights the need to examine SF concentration of
IGF-I in addition to PL IGF-I when examining the influence of dietary treatments.
31
Table 1. Amount of supplement fed to mares, foals, weanlings and yearlings throughout the
study period
Horses Months fed Kg/daya
DE,
Mcal
DE requirement,
%
Mares and foals, late lactationb May-September 5.6
e 16.8 58
Weaned foals, moderate growthc
October-
December 3.0 9.0 41
Yearlings, moderate growthd January-April 4.0 12.0 63
Yearlings, moderate growthd April - August 3.2 9.6 50
aSplit into two meals/day.
NRC (1989) recommended daily DE: b29 Mcal/day,
c15.5 Mcal/day,
d19 Mcal/day.
eMares and foals were fed together and shared 3.2 kg/day.
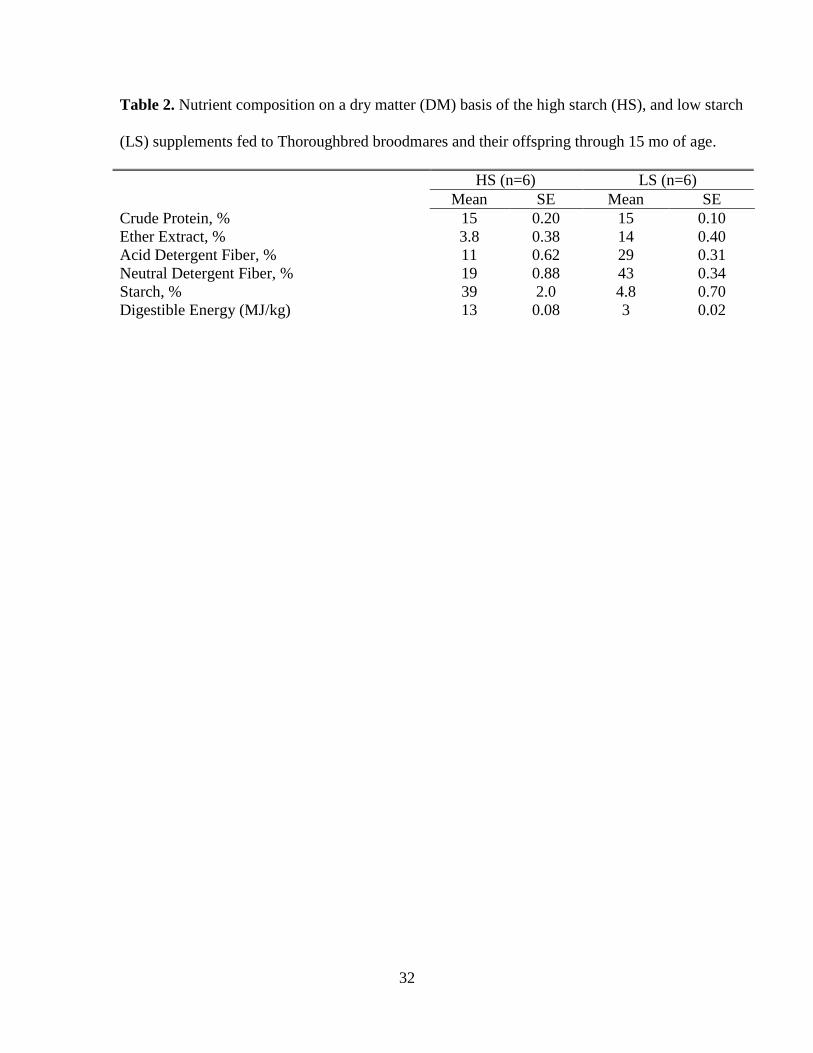
32
Table 2. Nutrient composition on a dry matter (DM) basis of the high starch (HS), and low starch
(LS) supplements fed to Thoroughbred broodmares and their offspring through 15 mo of age.
HS (n=6) LS (n=6)
Mean SE Mean SE
Crude Protein, % 15 0.20 15 0.10
Ether Extract, % 3.8 0.38 14 0.40
Acid Detergent Fiber, % 11 0.62 29 0.31
Neutral Detergent Fiber, % 19 0.88 43 0.34
Starch, % 39 2.0 4.8 0.70
Digestible Energy (MJ/kg) 13 0.08 3 0.02
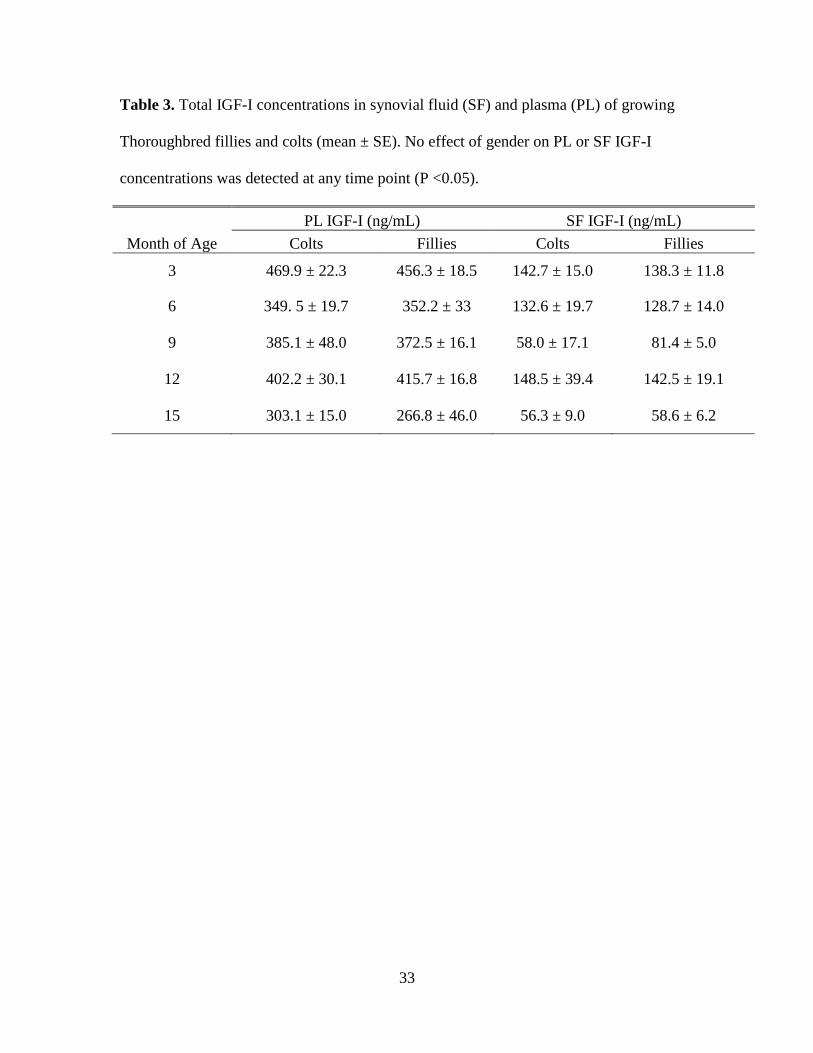
33
Table 3. Total IGF-I concentrations in synovial fluid (SF) and plasma (PL) of growing
Thoroughbred fillies and colts (mean ± SE). No effect of gender on PL or SF IGF-I
concentrations was detected at any time point (P <0.05).
PL IGF-I (ng/mL) SF IGF-I (ng/mL)
Month of Age Colts Fillies Colts Fillies
3 469.9 ± 22.3 456.3 ± 18.5 142.7 ± 15.0 138.3 ± 11.8
6 349. 5 ± 19.7 352.2 ± 33 132.6 ± 19.7 128.7 ± 14.0
9 385.1 ± 48.0 372.5 ± 16.1 58.0 ± 17.1 81.4 ± 5.0
12 402.2 ± 30.1 415.7 ± 16.8 148.5 ± 39.4 142.5 ± 19.1
15 303.1 ± 15.0 266.8 ± 46.0 56.3 ± 9.0 58.6 ± 6.2
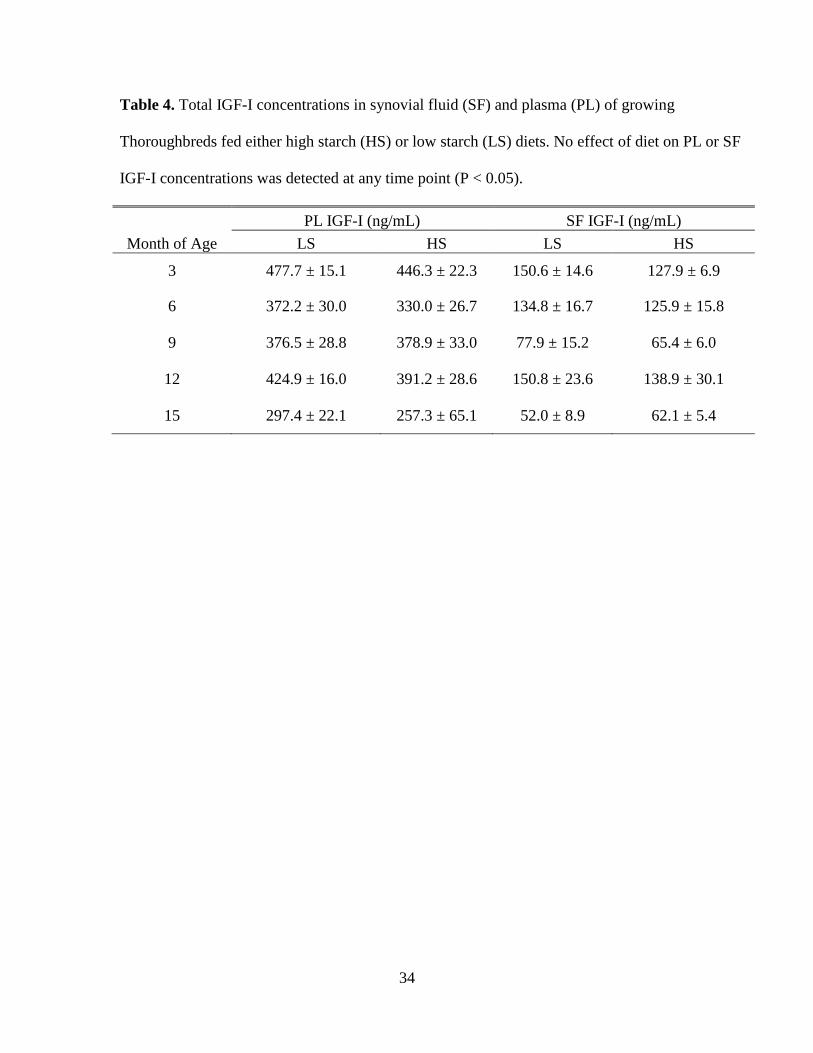
34
Table 4. Total IGF-I concentrations in synovial fluid (SF) and plasma (PL) of growing
Thoroughbreds fed either high starch (HS) or low starch (LS) diets. No effect of diet on PL or SF
IGF-I concentrations was detected at any time point (P < 0.05).
PL IGF-I (ng/mL) SF IGF-I (ng/mL)
Month of Age LS HS LS HS
3 477.7 ± 15.1 446.3 ± 22.3 150.6 ± 14.6 127.9 ± 6.9
6 372.2 ± 30.0 330.0 ± 26.7 134.8 ± 16.7 125.9 ± 15.8
9 376.5 ± 28.8 378.9 ± 33.0 77.9 ± 15.2 65.4 ± 6.0
12 424.9 ± 16.0 391.2 ± 28.6 150.8 ± 23.6 138.9 ± 30.1
15 297.4 ± 22.1 257.3 ± 65.1 52.0 ± 8.9 62.1 ± 5.4
35
Table 5. Correlations between body weight gain (BWG), wither height gain (WHG),
body weight gain (BWG), plasma (PL) and synovial fluid (SF) total IGF-I concentrations
in Thoroughbred horses from birth through 15 mo of age.
Correlation Evaluated r P
PL and BWG 0.418 0.001
PL and WHG 0.489 0.000
PL and FLG 0.231 0.083
SF and BWG 0.554 0.000
SF and WHG 0.530 0.000
SF and FLG 0.455 0.001
SF and PL 0.482 0.000
36
Figure 3. Measurements of forearm length and wither height were used to calculate
forearm length gain (FLG) and wither height gain (WHG) for 90 day periods between 0-3
mo, 3-6 mo, 6-9 mo, 9-12 mo and 12-15 mo of age . Forearm length was measured as the
distance in cm between the point of the elbow and the accessory carpal bone. Total
distance between the highest point of the withers and the ground was measured to
determine wither height.
Forearm
Length
Wither Height
37
Figure 4. Correlation between plasma (PL) and synovial fluid (SF) total IGF-I
concentrations in growing Thoroughbred horses as measured at 3, 6, 9, 12 and 15 mo of
age (r = 0.48, P = 0.0003).
0 100 200 300 400 500 6000
50
100
150
200
250 r2 = 0.20P < 0.01
PL IGF-I (ng/mL)
SF
IG
F-I
(n
g/m
L)
38
Figure 5. Synovial Fluid (SF) and plasma (PL) concentrations of total IGF-I (mean± SE)
in Thoroughbred foals from 3 to 15 mo of age. There was a significant effect of month of
age on both PL and SF IGF-I (P < 0.05).
3 6 9 12 150
100
200
300
400
500
Plasma Synovial Fluid
0
100
200
300 a
d
b
e
b,c
f
a, c
e
f
a - c: PL IGF-I for groups without a common letter designation differ (P < 0.05)d - f: SF IGF-I for groups without a common letter designation differ (P < 0.05)
Month of age
Pla
sm
a I
GF
-I,
ng
/ml
Syn
ovia
l IGF
-I, ng
/ml
39
Figure 6. Mean changes in wither height gain (WHG) and plasma (PL) IGF-I (mean±
SE) throughout seasons in Thoroughbred foals from 3 to 15 mo of age.
3 6 9 12 15200
300
400
500
WHG Plasma
0.00
0.05
0.10
0.15
0.20
0.25
0.30
Summer SummerAutumn Winter Spring
Month of Age
Pla
sm
a I
GF
-I (
ng
/mL
)W
HG
(cm
/day)
40
Figure 7. Mean changes in wither height gain (WHG) and synovial fluid (SF) IGF-I
(mean± SE) throughout seasons in Thoroughbred foals from 3 to 15 mo of age.
3 6 9 12 150
100
200
0.00
0.05
0.10
0.15
0.20
0.25
0.30
Summer SummerAutumn Winter Spring
WHGSF
Month
SF
IG
F-I
(n
g/m
L) W
HG
(cm
/day)
41
Figure 8. Mean changes in forearm length gain (FLG) and plasma (PL) IGF-I (mean±
SE) throughout seasons in Thoroughbred foals from 3 to 15 mo of age.
3 6 9 12 15200
300
400
500
Plasma
0.000
0.025
0.050
0.075
0.100
Summer SummerAutumn Winter Spring
Forearm
Month
Pla
sm
a I
GF
-I (
ng
/mL
)F
LG
(cm
/da
y)
42
Figure 9. Mean changes in forearm length gain (FLG) and synovial fluid (SF) IGF-I
(mean± SE) throughout seasons in Thoroughbred foals from 3 to 15 mo of age.
3 6 9 12 150
100
200
0.000
0.025
0.050
0.075
0.100
Summer SummerAutumn Winter Spring
Forearm Synovial
Month
SF
IG
F-I
(n
g/m
L) F
LG
(cm
/da
y)
43
Figure 10. Mean changes in body weight gain (BWG) and plasma (PL) IGF-I (mean±
SE) throughout seasons in Thoroughbred foals from 3 to 15 mo of age.
3 6 9 12 150
100
200
300
400
500
0.0
0.5
1.0
1.5
2.0
2.5
3.0
Summer SummerAutumn Winter Spring
ADG Plasma
Month
SF
IG
F-I
(n
g/m
L)
BW
G(k
g/d
ay
)
44
Figure 11. Mean changes in body weight gain (BWG) and synovial fluid (SF) IGF-I
(mean± SE) throughout seasons in Thoroughbred foals from 3 to 15 mo of age.
3 6 9 12 150
25
50
75
100
125
150
175
200
0.0
0.5
1.0
1.5
2.0
2.5
3.0
Summer SummerAutumn Winter Spring
ADG Synovial
Month
SF
IG
F-I
(n
g/m
L)
BW
G(k
g/d
ay
)
45
CHAPTER III
Evaluation of methods for isolation of high-quality total RNA from
small articular cartilage samples
Rebekah Cosden1,2
, Jolynne Tschetter3, Mark Crisman
3 and W. Burton Staniar
1,2
1Department of Animal and Poultry Sciences, Virginia Tech, Blacksburg, VA.
2Middleburg Agricultural Research and Extension Center, Middleburg, VA.
3Virginia-
Maryland Regional College of Veterinary Medicine, Blacksburg, VA.
ABSTRACT
Obtaining chondrocyte RNA from articular cartilage that is of sufficient quality
and quantity for gene expression analysis has proven challenging due to the acellular
nature of tissue. We evaluated the use of a liquid-nitrogen cooled mortar and pestle,
motorized freezer mill and rotor-stator homogenizer for homogenization of small
(<50mg) articular cartilage samples. A rotor-stator homogenizer consistently produced
quantifiable RNA yields, and was used to evaluate three different RNA isolation
protocols. The first protocol included modifications of guanidinium isothiocyanate/acid-
phenol extraction and cesium trifluoroacetate centrifugation procedures in combination
with a commercial silica gel-based spin column protocol. The other protocols evaluated
are commercially available and were modified to minimize proteoglycan contamination
(Lipid RNeasy® Mini, Qiagen Inc U.S.A, Valencia, CA, Versagene® RNA Purification
Kit, Gentra Systems, Minneapolis). All protocols yielded a sufficient quantity of quality
RNA suitable for gene expression analysis. The combined average yield for all protocols

46
was 91.9 ng RNA/mg of cartilage. Here, modifications to RNA isolation procedures have
been described that will permit and facilitate transcriptional profiling of chondrocytes
INTRODUCTION
Isolation of quality RNA from articular cartilage samples has proven challenging
for researchers interested in studying gene expression. Articular cartilage is an acelluar
tissue with the limited number chondrocytes protected by the surrounding extracellular
matrix. The extracellular matrix is composed of a high proportion of large, negatively
charged proteoglycans which tend to co-purify with RNA (Carney and Muir, 1988).
These obstacles create challenges when isolating RNA from small (< 100mg) sample
sizes cartilage samples. Serial sampling of a single individual provides great insight into
chondrocyte metabolism in response to experimental treatments. However, the limited
size of cartilage biopsies that may be harvested without producing significant joint
damage (<<250 mg) creates further challenges for researchers (Lee et al., 2000). A study
utilizing a canine model found that harvest of samples as small as 250mg from the knee
joint negatively affected cartilage strength and integrity at other sites within the joint (Lee
et al., 2000). Yields from current RNA isolation protocols may be as low as 0.001-0.018
μg/mg of tissue (McKenna et al., 2000). Thus, more efficient RNA isolation protocols are
needed in order to effectively evaluate chondrocyte gene expression.
The first and one of the most critical steps in isolating RNA from tissues is to
ensure complete tissue disruption and homogenization. Use of a liquid nitrogen-cooled
mortar and pestle is often successful but inappropriate for use with small samples (Fehr et
al., 2000). A motorized freezer mill is also effective for homogenization of larger
samples but inherit sample loss is problematic for smaller samples (McKenna et al.,
47
2000). The ability of rotor-stator homomogenizers to handle small samples has led to
their increased use with cartilage samples (Baelde et al., 2001, Smith et al., 2006). Our
first objective was to evaluate the use of these three homogenization techniques with
small (< 50mg) articular cartilage samples.
Techniques developed for isolation of RNA from articular cartilage are often
designed for use with large samples (~ 2.5 g, McKenna et al., 2000). The multiple step
protocols and homogenization methods result in excessive sample loss when used with
small samples. The second objective was to evaluate the use of three separate protocols
designed for use with small tissue samples. The first method has been used successfully
with large (500mg) cartilage samples (MacLeod et al., 1996). This protocol includes
modifications of guanidinium isothiocyanate/acid-phenol extraction and cesium
trifluoroacetate centrifugation procedures (Adams et al., 1992) in combination with a
commercial silica gel-based spin column protocol (RNeasy®, QIAGEN Inc., Chatsworth,
CA). This protocol also includes precipitation of RNA using isopropanol and a high-salt
solution after chloroform extraction.
The second method evaluated is a commercially available extraction protocol
designed for use with lipid tissues (Lipid RNeasy Mini®, Qiagen Inc U.S.A, Valencia,
CA). This method is unique in that it inherently incorporates phenol/chloroform
extraction procedures with silica gel-based spin column procedure, eliminating the need
to purchase separate reagents and supplies. Lastly, a commercial kit designed for use with
fibrous tissue was evaluated (Versagene® RNA Purification Kit, Gentra Systems,
Minneapolis). This particular protocol uses a unique Proteinase K solution for digestion
of proteins in the extracellular matrix. A search of published data did not reveal
48
information regarding the use of these commercially available methods with articular
cartilage samples. This study was aimed at developing a robust technique for isolating
RNA from small articular cartilage samples. Our goal was to produce RNA of sufficient
quantity and quality for microarray analysis and real time PCR.
MATERIALS AND METHODS
Tissue Homogenization
Three methods of tissue homogenization were evaluated in combination with a
commercially available RNA isolation kit (RNeasy® Mini, Qiagen Inc U.S.A, Valencia,
CA). Articular cartilage samples (39.1 ± 1.5 mg) were previously harvested immediately
postmortem from a yearling. Samples were frozen in liquid nitrogen and stored at -80° C.
First, a liquid nitrogen-cooled mortar and pestle was evaluated (Bel-Art Products,
Pequannock, NJ). Further tissue disruption was performed using lysis buffer RLT
(containing 10 ml/ml 2-β-mercaptoethanol (Qiagen Inc U.S.A.)) and needle and syringe
homogenization. Sample lysate was then passed through a 20-gauge needle attached to an
RNAse free syringe a minimum of 5 times. Ethanol precipitation and silica membrane
purification were completed according to manufacturer’s protocol (RNeasy® Mini,
Qiagen Inc U.S.A, Valencia, CA).
To evaluate the use of a motorized freezer mill, the vial and impactor portions of a
commercially available freezer mill were pre-cooled in liquid nitrogen (6750 SPEX
CertiPrep Freezer/Mill, Metuchen, NJ). The entire mill unit was also pre-cooled for 15
minutes prior to use. Samples were ground for 3 cycles of 2 min grinding and 2 min cool
down with an impact frequency of 15 hits per s. Ethanol precipitation and silica

49
membrane purification were then completed according to manufacturer’s protocol
(RNeasy® Mini, Qiagen Inc U.S.A, Valencia, CA). Lastly, we evaluated the use of a
rotor-stator homogenizer (Fisher Powergen 125, Thermo Fisher Scientific Inc.Waltham,
MA). Frozen samples were placed in lysis buffer (Trizol® reagent, Invitrogen Carlsbad,
California) and maintained on ice. Homogenization was completed at maximum speed
for 30 sec followed by a 1 min cool down period. Homogenization intervals were
continued until pieces of cartilage were no longer visible ( ≥ 3 cycles).
Total RNA was quantified using a RiboGreen® RNA Quantification kit (cat. # R-
11490, Molecular Probes, Eugene, Oregon) according to manufacturers instructions.
RiboGreen® dye Flourescence was measured using a fluorescence plate reader set at
485nm excitation and 535nm emission wavelength (Tecan GENios™, TECAN, North
Carolina).
Isolation of total RNA
Cartilage Samples. Articular cartilage samples were collected from a 3 d old foal
within 30 min of euthanasia. All samples were harvested by sharp dissection from the
lateral trochlear ridge of the femur. Samples were immediately frozen using liquid
nitrogen and stored at -80°C until further analysis. For all experiments, 50mg of sample
was weighed out and placed in lysis buffer for homogenization using a rotor-stator
homogenizer (Fisher Powergen 125, Thermo Fisher Scientific Inc.Waltham, MA).
Protocol Evaluation. A protocol utilizing high salt precipitation of RNA in
combination with silica gel-based spin columns was evaluated (MacLeod et al., 1996).
Tissue homogenization was completed with a rotor stator homogenizer rather than a
50
freezer mill due to small sample size. All other methods were followed as described
previously (Appendix II).
A commercially available kit utilizing monophasic phenol and guanidine
isothiocyanate solution to facilitate tissue lysis was also evaluated (RNeasy® Lipid
Tissue Mini, Qiagen Inc U.S.A, Valencia, CA). Several modifications were made to the
manufacture’s protocol, including steps to avoid proteoglycan contamination and
maximize RNA yield. Samples were homogenized, subjected to chloroform extraction
and centrifugation. These steps serve to separate the extraction solution into aqueous and
organic phases with proteoglycans and other contaminants found in the organic and
interphase, while RNA is present within the aqueous phase. Thus, care was taken to avoid
disturbance of the interphase and organic phase. An additional wash step wash included
to further degrease proteoglycan contamination of the RNA. Prior to final elution, the
silica-membrane spin column was washed with buffer RPE a total of 3 times. RNA was
eluted from the column using two 20 μl aliquots of RNAse free water heated to 65°.
Centrifugation at 8000 x g for 1 min was performed after each elution. Total elution
volume was 40 μl (Appendix II).
Lastly, we evaluated the use of an RNA purification kit designed for use with
fibrous tissue (Versagene® RNA Purification Kit, Gentra Systems, Minneapolis
MN). This kit incorporates the use of Proteinase K solution (Cat #V- 0550) for digestion
of proteins in the extracellular matrix. RNA isolation was then performed according to
manufacturer’s instructions (Appendix II).
51
RNA quantification and quality analysis
Total RNA was quantified at 260 nm using a spectrophotometer (ND-1000 UV-
Vis Spectrophotometer NanoDrop Technologies, Wilmington, DE). Absorbance at 230
280nm was also measured for calculation of A260:A280 and A260:A230 ratios.
Microfluidic capillary electrophoresis was completed with an Agilent 2100 Bioanalyzer
(Agilent Technologies, USA). Available software was used for calculation of an RNA
integrity number (RIN) as described previously (Mueller et al., 2006).
RESULTS AND DISCUSSION
Results obtained from each homogenization method are summarized in Table 6.
The use of a liquid nitrogen-cooled mortar and pestle resulted in low, inconsistent yields
as found previously (Fehr et al., 2000). Substantial sample loss was visible when a
freezer mill was used to homogenize samples. The rotor-stator homogenizer produced
consistent yields (7.72 ± 0.17ng/mg) from articular cartilage samples. Another
consideration for selection of homogenization tools is their initial purchase cost. The
liquid nitrogen-cooled mortar and pestle ($200) was the most economical, while the
significantly higher cost of the rotor-stator homogenizer ($1400) and the freezer mill
($4500) should be noted. The quantity of RNA obtained by all homogenization methods
was still lower than previously reported, highlighting the need to evaluate different
protocols (McKenna et al., 2000). The rotor-stator homogenizer was used for evaluation
of all RNA isolation protocols.
The average total RNA yield for all methods evaluated is greater than 10 fold of that
previously reported (91.9 vs. 8.39 ng of total RNA/mg of cartilage, respectively)
52
(McKenna et al. , 2000). RNA quality as determined by the RIN, A260:A280 and
A260:A230 ratios indicate that RNA obtained by all methods was of sufficient quality
for gene expression analysis (Imbeaud et al. , 2005) (Table 7). The RIN is considered a
reliable method for RNA quality assessment, and considers multiple factors such as
28S:18S ribosomal band ratio and RNA integrity (Schroeder et al. , 2006b). An RIN ≥
7 is indicative of sufficient RNA quality for analysis of gene expression within articular
cartilage (Clements et al. , 2006). All methods evaluated in this experiment yielded total
RNA which met this criterion (Table 7).
Proteoglycan contamination is a concern when isolating RNA from articular
cartilage samples. Proteoglycan and organic compound contamination was considered
through calculation of the A260:A230 ratio. High quality RNA from articular cartilage
should have A260:A230 of >0.7 (Clemments et al, 2006). Our data show that all methods
produced RNA without proteoglycan contamination. The high A260:A280 ratios are
indicative of limited protein contamination, whereas high A260:A230 ratios are
indicative of an absence of residual contamination by organic compounds such as
phenol or alcohol.
Purification of RNA was facilitated through the use of silica-membrane spin
columns. It is notable that additional wash steps added to the RNeasy® Lipid Kit
protocol resulted in the highest A260/A230 ratio of all methods. Care to avoid
disturbance of the organic and interphases in all methods also minimized proteoglycan
content.
Phenol-chloroform extraction successfully precipitates RNA from tissue lysate.
However, multiple phenol-chloroform extractions likely result in sample loss

53
(Chomczynski and Sacchi 1987). The high-salt precipitation protocol we evaluated
incorporated multiple extractions, resulting in a lower average RNA yield than the
RNeasy® Lipid Kit protocol. It should be noted that desirable yields were also obtained
from the Versagene® protocol. This protocol does not incorporate a phenol-chloroform
extraction. Exclusion of these hazardous materials may make this protocol desirable to
some laboratories.
Another consideration for the use of these isolation protocols is their time
requirement. Both the Versagene® and RNeasy® protocols may be completed in less
than two hours, suggesting their suitability for high throughput sample handling.
In summary, we have evaluated the use of 3 protocols for the isolation of high-
quality RNA from articular cartilage samples. All of these protocols produced a sufficient
quantity and quality of RNA to be used with gene expression techniques. It should be
noted that of all methods evaluated, the RNeasy® Lipid tissue kit produced the highest
yields and quality as determined by all quality analysis measures.
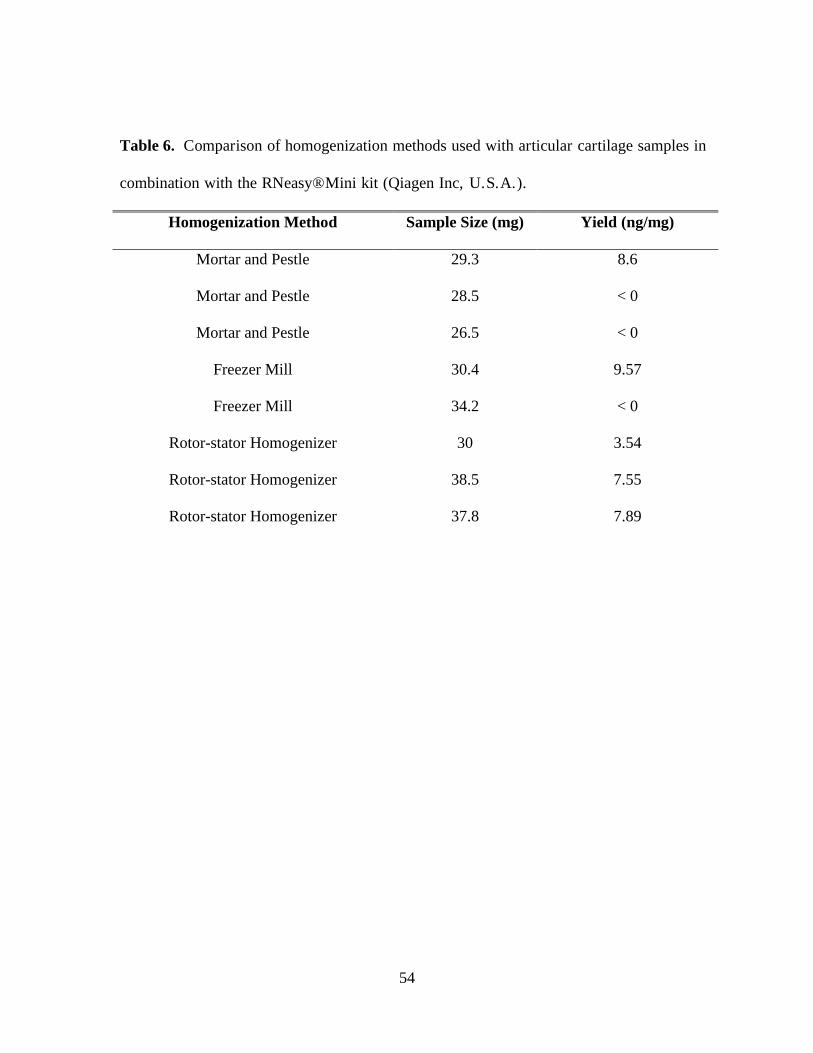
54
Table 6. Comparison of homogenization methods used with articular cartilage samples in
combination with the RNeasy® Mini kit (Qiagen Inc, U.S.A.).
Homogenization Method Sample Size (mg) Yield (ng/mg)
Mortar and Pestle 29.3 8.6
Mortar and Pestle 28.5 < 0
Mortar and Pestle 26.5 < 0
Freezer Mill 30.4 9.57
Freezer Mill 34.2 < 0
Rotor-stator Homogenizer 30 3.54
Rotor-stator Homogenizer 38.5 7.55
Rotor-stator Homogenizer 37.8 7.89
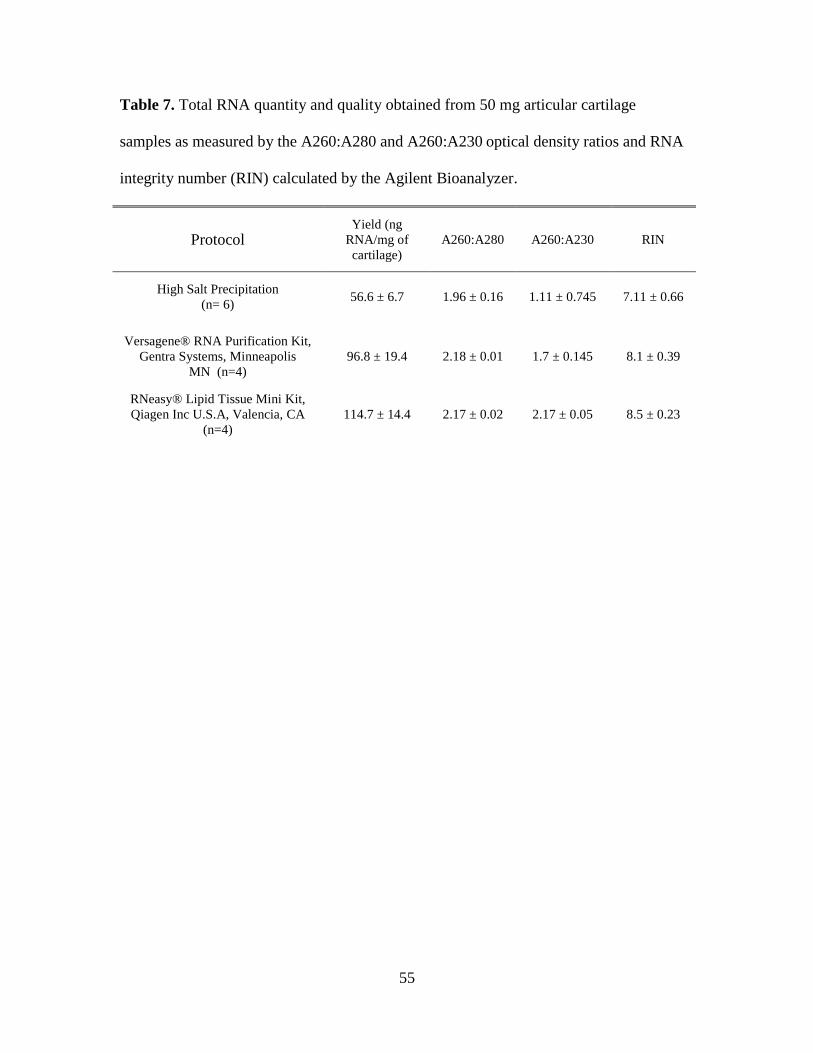
55
Table 7. Total RNA quantity and quality obtained from 50 mg articular cartilage
samples as measured by the A260:A280 and A260:A230 optical density ratios and RNA
integrity number (RIN) calculated by the Agilent Bioanalyzer.
Protocol Yield (ng
RNA/mg of
cartilage)
A260:A280 A260:A230 RIN
High Salt Precipitation
(n= 6) 56.6 ± 6.7 1.96 ± 0.16 1.11 ± 0.745 7.11 ± 0.66
Versagene® RNA Purification Kit,
Gentra Systems, Minneapolis
MN (n=4)
96.8 ± 19.4 2.18 ± 0.01 1.7 ± 0.145 8.1 ± 0.39
RNeasy® Lipid Tissue Mini Kit,
Qiagen Inc U.S.A, Valencia, CA
(n=4)
114.7 ± 14.4 2.17 ± 0.02 2.17 ± 0.05 8.5 ± 0.23
56
CHAPTER IV
CONCLUSIONS
The objectives of these studies were to determine the relationship between
circulating and synovial fluid concentrations of total IGF-I, dietary energy source and
measurements of skeletal growth. In addition, we aimed to develop a robust method for
isolation of high quality total RNA from small (<50mg) equine cartilage samples for use
in transcriptional profiling experiments.
The results from the first study suggest a significant but moderate correlation
between circulating concentrations of IGF-I and concentrations of IGF-I in SF. The
moderate strength of this relationship suggests investigation of circulating IGF-I provides
little insight into IGF-I concentrations present at the level of articular cartilage. Thus, it is
likely necessary to compliment PL IGF-I sampling with SF IGF-I sampling when
investigating possible dietary treatment effects on cartilage metabolism.
The first study also helped to further characterize the link between skeletal
development, circulating and SF IGF-I. With the exception of forearm length gain, all
morphometric measurements obtained in this study were significantly correlated with
both PL and SF IGF-I. Highest rates of growth and IGF-I concentrations were obtained at
3 mo of age. It is notable that a secondary peak in both rates of gain, PL and SF IGF-I
occurred during the spring months of the horses’ second year. This time point
corresponds with a previously characterized period of compensatory growth in young
Thoroughbreds, and provides additional support for the link between circulating and PL
IGF-I concentrations and skeletal development.

57
In contrast with previous findings, this research did not detect an influence of
dietary energy source on circulating concentrations of IGF-I. Future research designed to
include a larger number of subjects and frequent sampling protocol would allow for a
more powerful investigation of this p relationship.
The results from the second study will be useful for studying the molecular
mechanisms directing cartilage development in vivo. Efficient RNA isolation is an
important first step in studying chondrocyte gene expression analysis. All RNA isolation
protocols examined in the second study yielded RNA of a sufficient quantity and quality
for transcriptional profiling experiments. Modifications to the RNeasy Lipid Kit protocol
helped to minimize proteoglycan contamination, as well as produce higher yields than the
other protocols evaluated. These techniques will be useful in conducting further research
investigating chondrocyte behavior in response to dietary treatments.

58
LITERATURE CITED
Adams, M. E., D. Q. Huang, L. Y. Yao, and L. J. Sandell. 1992. Extraction and isolation
of mRNA from adult articular cartilage. Anal. Biochem. 202(1):89-95.
Baelde, H. J., A. M. Cleton-Jansen, H. van Beerendonk, M. Namba, J. V. Bovee, and P.
C. Hogendoorn. 2001. High quality RNA isolation from tumours with low
cellularity and high extracellular matrix component for cDNA microarrays:
application to chondrosarcoma. J Clin. Pathol. 54(10):778-782.
Berrigan, D., N. Potischman, K. W. Dodd, M. Nicar, G. McQuillan, J. A. Lavigne, J. C.
Barrett, and R. Ballard-Barbash. 2007. Serum levels of insulin-like growth factor-
I and insulin-like growth factor-I binding protein-3: quality control for studies of
stored serum. Cancer Epidemiol. Biom. Prev. 16(5):1017-1022.
Berry, S. D., T. B. McFadden, R. E. Pearson, and R. M. Akers. 2001. A local increase in
the mammary IGF-1: IGFBP-3 ratio mediates the mammogenic effects of
estrogen and growth hormone. Domest. Anim. Endocrinol. 21(1):39-53.
Bhakta, N. R., A. M. Garcia, E. H. Frank, A. J. Grodzinsky, and T. I. Morales. 2000. The
insulin-like growth factors (IGFs) I and II bind to articular cartilage via the IGF-
binding proteins. J. Biol. Chem. 275(8):5860-5866.
Bland, J. M., and D. G. Altman. 1999. Measuring agreement in method comparison
studies. Stat. Meth. Med. Res. 8:135-160.
Burton, L., J. C. Saunders, and M. J. Dauncey. 1992. Thermal and nutritional influences
on tissue levels of insulin-like growth factor-I mRNA and peptide. J.Therm. Bio.
17(2):89-95.
59
Cancedda, R., F. Descalzi Cancedda, and P. Castagnola. 1995. Chondrocyte
differentiation. Inte. Rev.Cytology. 159:265-358.
Carney, S. L. and H. Muir. 1988. The structure and function of cartilage proteoglycans.
Physiol. Rev. 68(3):858-910.
Carter, D. R. 2001. Skeletal function and form. Vol. 12, p. 318. Cambridge University
Press, Cambridge, UK ; New York, NY :.
Chomczynski, P. and N. Sacchi. 1987. Single-step method of RNA isolation by acid
guanidinium thiocyanate-phenol-chloroform extraction. Anal.
Biochem.162(1):156-159.
Christensen, R. A., K. Malinowski, A. M. Massenzio, H. D. Hafs, and C. G. Scanes.
1997. Acute effects of short-term feed deprivation and refeeding on circulating
concentrations of metabolites, insulin-like growth factor I, insulin-like growth
factor binding proteins, somatotropin, and thyroid hormones in adult geldings. J.
Anim. Sci.. 75(5):1351-1358.
Ciarmatori, S., D. Kiepe, A. Haarmann, U. Huegel, and B. Tonshoff. 2007. Signaling
mechanisms leading to regulation of proliferation and differentiation of the
mesenchymal chondrogenic cell line RCJ3.1C5.18 in response to IGF-I. J Mol.
Endocrinol. 38(4):493-508.
Clements, D. N., A. Vaughan-Thomas, S. Peansukmanee, S. D. Carter, J. F. Innes, W. E.
Ollier, and P. D. Clegg. 2006. Assessment of the use of RNA quality metrics for
the screening of articular cartilage specimens from clinically normal dogs and
dogs with osteoarthritis. Am. J. Vet. Res. 67(8):1438-1444.
60
Clemmons, D. R. 2001. Commercial assays available for insulin-like growth factor I and
their use in diagnosing growth hormone deficiency. Horm. Res. 55 Suppl 2:73-79.
Clemmons, D. R., L. E. Underwood, P. G. Chatelain, and J. J. Van Wyk. 1983.
Liberation of immunoreactive somatomedin-C from its binding proteins by
proteolytic enzymes and heparin. J. Clin. Endocrinol. Metab. 56(2):384-389.
Cubitt, T. A. S., W. B.; Kronfeld, D. S.,. 2004. Environmental factors and nutrient
composition of pasture in northern Virginia. . J. Anim. Sci. 82(Supplement 1 ):96.
Cymbaluk, N. F. and B. Laarveld. 1996. The ontogeny of serum insulin-like growth
factor-I concentration in foals: effects of dam parity, diet, and age at weaning.
Dom. Anim. Endocrinol. 13(3):197-209.
D'Ercole, A. J., A. D. Stiles, and L. E. Underwood. 1984. Tissue concentrations of
somatomedin C: further evidence for multiple sites of synthesis and paracrine or
autocrine mechanisms of action. PNAS 81(3):935-939.
Dahl, G. E., T. H. Elsasser, A. V. Capuco, R. A. Erdman, and R. R. Peters. 1997. Effects
of a Long Daily Photoperiod on Milk Yield and Circulating Concentrations of
Insulin-Like Growth Factor-I. J. Dairy Sci. 80(11):2784-2789.
Dahlgren, L. A. and A. J. Nixon. 2005. Cloning and expression of equine insulin-like
growth factor binding proteins in normal equine tendon. Am. J. Vet. Res.
66(2):300-306.
Davicco, M. J., Y. Faulconnier, V. Coxam, H. Dubroeucq, W. Martin-Rosset, and J. P.
Barlet. 1994. Systemic bone growth factors in light breed mares and their foals.
Arch. Int. Physiol. Biochim. Biophys. 102(2):115-119.

61
De Kock, S. S., J. P. Rodgers, B. C. Swanepoel, and A. J. Guthrie. 2001. Administration
of bovine, porcine and equine growth hormone to the horse: effect on insulin-like
growth factor-I and selected IGF binding proteins. J. Endocrinol. 171(1):163-171.
Fehr, J. E., G. W. Trotter, J. T. Oxford, and D. A. Hart. 2000. Comparison of Northern
blot hybridization and a reverse transcriptase-polymerase chain reaction technique
for measurement of mRNA expression of metalloproteinases and matrix
components in articular cartilage and synovial membrane from horses with
osteoarthritis. Am. J. Vet. Res. 61(8):900-905.
Flanagan, D. E., V. M. Moore, I. F. Godsland, R. A. Cockington, J. S. Robinson, and D.
I. Phillips. 2000. Fetal growth and the physiological control of glucose tolerance
in adults: a minimal model analysis. Am. J. Physiol. 278(4):E700-706.
Flannery, C. R., C. B. Little, B. Caterson, and C. E. Hughes. 1999. Effects of culture
conditions and exposure to catabolic stimulators (IL-1 and retinoic acid) on the
expression of matrix metalloproteinases (MMPs) and disintegrin
metalloproteinases (ADAMs) by articular cartilage chondrocytes. Matrix. Biol.
18(3):225-237.
Fortier, L. A., M. A. Kornatowski, H. O. Mohammed, M. T. Jordan, L. C. O'Cain, and W.
B. Stevens. 2005. Age-related changes in serum insulin-like growth factor-I,
insulin-like growth factor-I binding protein-3 and articular cartilage structure in
Thoroughbred horses. Eq. Vet. J. 37(1):37-42.
Frystyk, J., M. Hussain, C. Skjaerbaek, O. Schmitz, J. S. Christiansen, E. R. Froesch, and
H. Orskov. 1997. Serum free IGF-I during a hyperinsulinemic clamp following 3
days of administration of IGF-I vs. saline. Am. J. Physiol. 273(3 Pt 1):E507-513.
62
Frystyk, J., B. Nyholm, C. Skjaerbaek, R. C. Baxter, O. Schmitz, and H. Orskov. 2003.
The circulating IGF system and its relationship with 24-h glucose regulation and
insulin sensitivity in healthy subjects. Clin. Endocrinol. 58(6):777-784.
Furlanetto, R. W., L. E. Underwood, J. J. Van Wyk, and A. J. D'Ercole. 1977. Estimation
of somatomedin-C levels in normals and patients with pituitary disease by
radioimmunoassay. J. Clin. Invest. 60(3):648-657.
Glasel, J. A.. Validity of nucleic acid purities monitored by 260nm/280nm abosorbancy
ratios. Biotechniques 18(1):62-63. 1995
Greiwe-Crandell, K. M., D. S. Kronfeld, L. A. Gay, and D. Sklan. 1995. Seasonal
vitamin A depletion in grazing horses is assessed better by the relative dose
response test than by serum retinol concentration. J. Nutr. 125(10):2711-2716.
Henneke, D. R., G. D. Potter, J. L. Kreider, and B. F. Yeates. 1983. Relationship between
condition score, physical measurements and body fat percentage in mares. Eq.
Vet. J. 15(4):371-372.
Henson, F. M., C. Davenport, L. Butler, I. Moran, W. D. Shingleton, L. B. Jeffcott, and
P. N. Schofield. 1997a. Effects of insulin and insulin-like growth factors I and II
on the growth of equine fetal and neonatal chondrocytes. Eq. Vet. J. 29(6):441-
447.
Henson, F. M., P. N. Schofield, and L. B. Jeffcott. 1997b. Expression of transforming
growth factor-beta 1 in normal and dyschondroplastic articular growth cartilage of
the young horse. E. Vet. J. 29(6):434-439.
Hoffman, R. M., L. A. Lawrence, D. S. Kronfeld, W. L. Cooper, D. J. Sklan, J. J.
Dascanio, and P. A. Harris. 1999. Dietary carbohydrates and fat influence
63
radiographic bone mineral content of growing foals. J. Anim. Sci. 77(12):3330-
3338.
Holly, J. M., R. A. Biddlecombe, D. B. Dunger, J. A. Edge, S. A. Amiel, R. Howell, T.
Chard, L. H. Rees, and J. A. Wass. 1988. Circadian variation of GH-independent
IGF-binding protein in diabetes mellitus and its relationship to insulin. A new role
for insulin? Clin. Endocrinol. 29(6):667-675.
Holt, R. I., H. L. Simpson, and P. H. Sonksen. 2003. The role of the growth hormone-
insulin-like growth factor axis in glucose homeostasis. Diabet. Med. 20(1):3-15.
Hutchison, M. R., M. H. Bassett, and P. C. White. 2007. Insulin-like Growth Factor-I and
Fibroblast Growth Factor, but not Growth Hormone, Affect Growth Plate
Chondrocyte Proliferation. Endocrinology.
Imbeaud, S., E. Graudens, V. Boulanger, X. Barlet, P. Zaborski, E. Eveno, O. Mueller, A.
Schroeder, and C. Auffray. 2005. Towards standardization of RNA quality
assessment using user-independent classifiers of microcapillary electrophoresis
traces. Nucl. Acids Res. 33(6):e56-.
Jeffcott, L. B. 1996. Osteochondrosis - an international problem for the horse
industry. J. Eq. Vet. Sci. (16):32-37.
Jenniskens, Y. M., W. Koevoet, A. C. de Bart, H. Weinans, H. Jahr, J. A. Verhaar, J.
DeGroot, and G. J. van Osch. 2006. Biochemical and functional modulation of the
cartilage collagen network by IGF1, TGFbeta2 and FGF2. Osteoarthritis Cartilage
14(11):1136-1146.
64
Khosravi, J., A. Diamandi, U. Bodani, N. Khaja, and R. G. Krishna. 2005. Pitfalls of
immunoassay and sample for IGF-I: Comparison of different assay methodologies
using various fresh and stored serum samples. Clin. Biochem. 38(7):659-666.
Laviola, L., A. Natalicchio, and F. Giorgino. 2007. The IGF-I signaling pathway. Cur.
pharm. Des. 13(7):663-669.
Le Roith, D., C. Bondy, S. Yakar, J.-L. Liu, and A. Butler. 2001. The Somatomedin
Hypothesis: 2001. End. Rev. 22(1):53-74.
Lee, C. R., A. J. Grodzinsky, H. P. Hsu, S. D. Martin, and M. Spector. 2000. Effects of
harvest and selected cartilage repair procedures on the physical and biochemical
properties of articular cartilage in the canine knee. J. Orthop. Res. 18(5):790-799.
Lejeune, J. P., T. Franck, M. Gangl, N. Schneider, C. Michaux, G. Deby-Dupont, and D.
Serteyn. 2007. Plasma Concentration of Insulin-like Growth Factor I (IGF-I) in
Growing Ardenner Horses Suffering from Juvenile Digital Degenerative
Osteoarthropathy. Vet. Res. Comm. 31(2):185-195.
LeRoith, D., H. Werner, D. Beitner-Johnson, and C. T. Roberts, Jr. 1995. Molecular and
cellular aspects of the insulin-like growth factor I receptor. Endo. Rev. 16(2):143-
163.
Levick, J. R. 1991. Pages 529-542 in Articular Cartilage and Osteoarthritis. K. Kuettner,
et al., ed. Raven Press.
Lincoln, G. A., S. M. Rhind, S. Pompolo, and I. J. Clarke. 2001. Hypothalamic control of
photoperiod-induced cycles in food intake, body weight, and metabolic hormones
in rams. Am. J. Phyiol. 281(1):R76-90.
65
Lindahl, A., J. Isgaard, L. Carlsson, and O. G. Isaksson. 1987. Differential effects of
growth hormone and insulin-like growth factor I on colony formation of
epiphyseal chondrocytes in suspension culture in rats of different ages.
Endocrinology 121(3):1061-1069.
Louveau, I., S. Chaudhuri, and T. D. Etherton. 1991. An improved method for isolating
RNA from porcine adipose tissue. Anal. Biochem. 196(2):308-310.
Lupu, F., J. D. Terwilliger, K. Lee, G. V. Segre, and A. Efstratiadis. 2001. Roles of
growth hormone and insulin-like growth factor 1 in mouse postnatal growth. Dev.
Biol. 229(1):141-162.
MacLeod, J. N., N. Burton-Wurster, D. N. Gu, and G. Lust. 1996. Fibronectin mRNA
splice variant in articular cartilage lacks bases encoding the V, III-15, and I-10
protein segments. J. Biol. Chem. 271(31):18954-18960.
Malinowski, K., R. A. Christensen, H. D. Hafs, and C. G. Scanes. 1996. Age and breed
differences in thyroid hormones, insulin-like growth factor (IGF)-I and IGF
binding proteins in female horses. J. Anim. Sci. 74(8):1936-1942.
Manchester, K. L. 1996. Use of UV methods for measurement of protein and nucleic acid
concentrations. Biotechniques 20(6):968-&.
Mandelbaum, B. R., J. E. Browne, F. Fu, L. Micheli, J. B. Mosely Jr, C. Erggelet, T.
Minas, and L. Peterson. 1998. Articular cartilage lesions of the knee. Am. J.
Sports. Med. 26(6):853-861.
Martin, J. A., S. M. Ellerbroek, and J. A. Buckwalter. 1997. Age-related decline in
chondrocyte response to insulin-like growth factor-I: the role of growth factor
binding proteins. J. Orthop. Res. 15(4):491-498.
66
Mathews, L. S., R. E. Hammer, R. L. Brinster, and R. D. Palmiter. 1988. Expression of
insulin-like growth factor I in transgenic mice with elevated levels of growth
hormone is correlated with growth. Endocrinology 123(1):433-437.
Matsumoto, T., S. E. Gargosky, K. Iwasaki, and R. G. Rosenfeld. 1996. Identification
and characterization of insulin-like growth factors (IGFs), IGF-binding proteins
(IGFBPs), and IGFBP proteases in human synovial fluid. J. Clin. Endocrinol.
Metab. 81(1):150-155.
Mauck, R. L., M. A. Soltz, C. C. Wang, D. D. Wong, P. H. Chao, W. B. Valhmu, C. T.
Hung, and G. A. Ateshian. 2000. Functional tissue engineering of articular
cartilage through dynamic loading of chondrocyte-seeded agarose gels. J.
Biomech. Eng. 122(3):252-260.
McKenna, L. A., A. Gehrsitz, S. Soder, W. Eger, T. Kirchner, and T. Aigner. 2000.
Effective isolation of high-quality total RNA from human adult articular cartilage.
Anal. Biochem. 286(1):80-85.
Mobasheri, A., S. J. Vannucci, C. A. Bondy, S. D. Carter, J. F. Innes, M. F. Arteaga, E.
Trujillo, I. Ferraz, M. Shakibaei, and P. Martin-Vasallo. 2002. Glucose transport
and metabolism in chondrocytes: a key to understanding chondrogenesis, skeletal
development and cartilage degradation in osteoarthritis. Histol. Histopathol.
17(4):1239-1267.
Mueller, O., S. Lightfoot, and A. Schroeder. 2006. RNA Integrity Number (RIN) –
Standardization of RNA Quality Control. in Agilent Application Note,
Publication Number-5989-1165EN.

67
Noble, G. K., E. Houghton, C. J. Roberts, J. Faustino-Kemp, S. S. de Kock, B. C.
Swanepoel, and M. N. Sillence. 2007. Effect of exercise, training, circadian
rhythm, age, and sex on insulin-like growth factor-1 in the horse. J. Anim. Sci.
85(1):163-171.
NRC. 2007. Nutrient requirements of horses. 6th Revised Edition.
Pagan, J.D., R.J. Geor, S.E. Caddel, P.B. Pryor and K.E. Hoekstra. 2001. The relationship
between glycemic response and the incidence of OCD in Thoroughbred
weanlings: A field study. Proc. Amer. Assoc. Equine Prac. 47: 322-325.
Phillips, T., I. Ferraz, S. Bell, P. D. Clegg, S. D. Carter, and A. Mobasheri. 2005.
Differential regulation of the GLUT1 and GLUT3 glucose transporters by growth
factors and pro-inflammatory cytokines in equine articular chondrocytes. Vet. J.
169(2):216-222.
Plikaytis, B. D., P. F. Holder, L. B. Pais, S. E. Maslanka, L. L. Gheesling, and G. M.
Carlone. 1994. Determination of parallelism and nonparallelism in bioassay
dilution curves. J. Clin. Microbiol. 32(10):2441-2447.
Pratt, S. E., R. J. Geor, and L. J. McCutcheon. 2006. Effects of dietary energy source and
physical conditioning on insulin sensitivity and glucose tolerance in standardbred
horses. Eq. Vet. J. Suppl (36):579-584.
Ralson, S. L. 1996. Hyperglycemia/hyperinsulimia after feeding a meal of grain to young
horses with osteochondritis dissecans (OCD) lesions. . Pferdeheilkunde 12:320-
322.
Richardson, S., G. Neama, T. Phillips, S. Bell, S. D. Carter, K. H. Moley, J. F. Moley, S.
J. Vannucci, and A. Mobasheri. 2003. Molecular characterization and partial
68
cDNA cloning of facilitative glucose transporters expressed in human articular
chondrocytes; stimulation of 2-deoxyglucose uptake by IGF-I and elevated MMP-
2 secretion by glucose deprivation. Osteoarthritis Cartilage 11(2):92-101.
Ropp, J. K., R. H. Raub, and J. E. Minton. 2003. The effect of dietary energy source on
serum concentration of insulin-like growth factor-I growth hormone, insulin,
glucose, and fat metabolites in weanling horses. J. Anim. Sci. 81(6):1581-1589.
Ruff, S. J., C. H. Wood, D. K. Aaron, and L. M. Lawrence. 1993. A comparison of
growth rates of normal Thoroughbred foals and foals diagnosed with cervical
vertebral malformation. J. Eq. Vet. Sci. 13:596-596.
Russell-Jones, D. L., M. Rattray, V. J. Wilson, R. H. Jones, P. H. Sonksen, and C. R.
Thomas. 1992. Intraperitoneal insulin is more potent than subcutaneous insulin at
restoring hepatic insulin-like growth factor-I mRNA levels in the diabetic rat: a
functional role for the portal vascular link. J. Mol. Endocrinol. 9(3):257-263.
Sambrook, J., Fritsch, E.F., Maniatis, T. . 1989. Molecular Cloning: A Laboratory
Manual. 2nd ed. Cold Spring Harbor Laboratory Press. New York.
Sarko, T. A., M. D. Bishop, and M. E. Davis. 1994. Relationship of air temperature,
relative humidity, precipitation, photoperiod, wind speed and solar radiation with
serum insulin-like growth factor I (IGF-I) concentration in Angus beef cattle.
Domest. Anim. Endocrinol. 11(3):281-290.
Schneiderman, R., N. Rosenberg, J. Hiss, P. Lee, F. Liu, R. L. Hintz, and A. Maroudas.
1995. Concentration and size distribution of insulin-like growth factor-I in human
normal and osteoarthritic synovial fluid and cartilage. Arch. Biochem. Biophys.
324(1):173-188.
69
Schroeder, A., O. Mueller, S. Stocker, R. Salowsky, M. Leiber, M. Gassmann, S.
Lightfoot, W. Menzel, M. Granzow, and T. Ragg. 2006a. The RIN: an RNA
integrity number for assigning integrity values to RNA measurements. BMC Mol.
Biol. 7(1):3.
Semevolos, S. A., A. J. Nixon, and B. D. Brower-Toland. 2001. Changes in molecular
expression of aggrecan and collagen types I, II, and X, insulin-like growth factor-
I, and transforming growth factor-beta1 in articular cartilage obtained from horses
with naturally acquired osteochondrosis. Am. J. Vet. Res. 62(7):1088-1094.
Sherlock, M. and A. A. Toogood. 2007. Aging and the growth hormone/insulin like
growth factor-I axis. Pituitary.
Shinar, D. M., N. Endo, D. Halperin, G. A. Rodan, and M. Weinreb. 1993. Differential
expression of insulin-like growth factor-I (IGF-I) and IGF-II messenger
ribonucleic acid in growing rat bone. Endocrinology 132(3):1158-1167.
Shingleton, W. D., E. J. Mackie, T. E. Cawston, and L. B. Jeffcott. 1997. Cartilage canals
in equine articular/epiphyseal growth cartilage and a possible association with
dyschondroplasia. Eq. Vet. J. 29(5):360-364.
Sloet van, O.-O., J. A. Mol, and A. Barneveld. 1999. Hormones, growth factors and other
plasma variables in relation to osteochondrosis. Eq. Vet. J. Suppl (31):45-54.
Smith, K. J., A. L. Bertone, S. E. Weisbrode, and M. Radmacher. 2006. Gross, histologic,
and gene expression characteristics of osteoarthritic articular cartilage of the
metacarpal condyle of horses. Am. J. Vet. Res. 67(8):1299-1306.
70
Smith, R. L., M. V. Palathumpat, C. W. Ku, and R. L. Hintz. 1989. Growth hormone
stimulates insulin-like growth factor I actions on adult articular chondrocytes. J
Orthop. Res. 7(2):198-207.
Staniar, W. B. 2001. Growth and the Somatotropic Axis in Young Thoroughbreds. in
Animal and Poultry Science. Vol. PhD. Virginia Polytechnic Institute and State
University, Blacksburg.
Staniar, W. B., D. S. Kronfeld, R. M. Akers, and P. A. Harris. 2007. Insulin-like growth
factor I in growing thoroughbreds. J. Anim. Physiol. Anim. Nutr. In Press.
Staniar, W. B., D. S. Kronfeld, K. H. Treiber, R. K. Splan, and P. A. Harris. 2004.
Growth rate consists of baseline and systematic deviation components in
Thoroughbreds. J. Anim. Sci. 82(4):1007-1015.
Staniar, W. B., D. S. Kronfeld, J. A. Wilson, L. A. Lawrence, W. L. Cooper, and P. A.
Harris. 2001. Growth of thoroughbreds fed a low-protein supplement fortified
with lysine and threonine. J. Anim. Sci. 79(8):2143-2151.
Sticker, L. S., D. L. Thompson, Jr., J. M. Fernandez, L. D. Bunting, and C. L. DePew.
1995. Dietary protein and(or) energy restriction in mares: plasma growth
hormone, IGF-I, prolactin, cortisol, and thyroid hormone responses to feeding,
glucose, and epinephrine. J. Anim. Sci. 73(5):1424-1432.
Stockwell, R. A. 1979. Biology of cartilage cells. Vol. viii, 329 p. :. No. QP88.23 .S84.
Cambridge University Press, Cambridge ; New York :.
Treiber, K. H., R. C. Boston, D. S. Kronfeld, W. B. Staniar, and P. A. Harris. 2005.
Insulin resistance and compensation in Thoroughbred weanlings adapted to high-
glycemic meals. J. Anim. Sci. 83(10):2357-2364.

71
Treiber, K. H., Kronfeld, D.S., Staniar, W.B., Boston, R.C., Harris, P.A. 2005. Growth
hormone and IGF-I in Thoroughbred weanlings are affected by diet. . Proceedings
of the Meeting on Milk-fed Farm and Companion Animals: Basic Aspects and
Practice for the Future, Bern, Switzerland:p. 39.
Trippel, S. B., M. T. Corvol, M. F. Dumontier, R. Rappaport, H. H. Hung, and H. J.
Mankin. 1989. Effect of somatomedin-C/insulin-like growth factor I and growth
hormone on cultured growth plate and articular chondrocytes. Ped. Res. 25(1):76-
82.
van de Lest, C. H., B. M. van den Hoogen, and P. R. van Weeren. 2000. Loading-induced
changes in synovial fluid affect cartilage metabolism. Biorheology 37(1-2):45-55.
Wallenius, K., K. Sjogren, X.-D. Peng, S. Park, V. Wallenius, J.-L. Liu, M. Umaerus, H.
Wennbo, O. Isaksson, L. Frohman, R. Kineman, C. Ohlsson, and J.-O. Jansson.
2001. Liver-Derived IGF-I Regulates GH Secretion at the Pituitary Level in Mice.
Endocrinology 142(11):4762-4770.
Wang, E., J. Wang, E. Chin, J. Zhou, and C. A. Bondy. 1995. Cellular patterns of insulin-
like growth factor system gene expression in murine chondrogenesis and
osteogenesis. Endocrinology 136(6):2741-2751.
Williams, C. A., D. S. Kronfeld, W. B. Staniar, and P. A. Harris. 2001. Plasma glucose
and insulin responses of Thoroughbred mares fed a meal high in starch and sugar
or fat and fiber. J. Anim. Sci. 79(8):2196-2201.
Yakar, S., J. L. Liu, B. Stannard, A. Butler, D. Accili, B. Sauer, and D. LeRoith. 1999.
Normal growth and development in the absence of hepatic insulin-like growth
factor I. PNAS. 96(13):7324-7329.
72
Yakar, S., C. J. Rosen, W. G. Beamer, C. L. Ackert-Bicknell, Y. Wu, J. L. Liu, G. T. Ooi,
J. Setser, J. Frystyk, Y. R. Boisclair, and D. LeRoith. 2002a. Circulating levels of
IGF-1 directly regulate bone growth and density. J Clin Invest 110(6):771-781.
Yakar, S., Y. Wu, J. Setser, and C. J. Rosen. 2002b. The role of circulating IGF-I: lessons
from human and animal models. Endocrine 19(3):239-248.
Zhang, L., B. S. Gardiner, D. W. Smith, P. Pivonka, and A. Grodzinsky. 2007. The effect
of cyclic deformation and solute binding on solute transport in cartilage. Arch.
Biochem. Biophys. 457(1):47-56.
73
APPENDIX I
Validation of a commercial human total IGF-I ELISA for use with equine plasma
INTRODUCTION
Several methods are available for evaluating concentrations of total IGF-I in
biological samples. Early techniques utilized a radioimmunoassay (RIA) procedure, and
more recently steps for the removal of IGFBP have been incorporated to improve the
accuracy of RIA protocols (Clemmons, 2001, Furlanetto et al., 1977). Commercial
immunoradiometric (IRMA) sandwich assays using antibodies specific to IGF-I are also
available for use (Clemmons, 2001). These techniques are both sensitive and specific for
measurement of total IGF-I, but may be time consuming and require special precautions
as radioactive isotopes are used. Enzyme-linked immunosorbent assays (ELISA) have
gained increasing popularity due to their ease of use. Several types of RIA and IRMA have
been validated for use with equine samples (De Kock et al., 2001, Staniar, 2001), but the
use of a commercial ELISA has not yet been evaluated. Although IGF-I is 100%
homologous between human and equine, equine IGFBP share a lower degree of
homology (75 to 95%) with human IGFBP (Dahlgren and Nixon, 2005). Differences in
human and equine binding protein structure may alter the position of the binding proteins
relative to IGF-I between these species and therefore interfere with antibody binding,
necessitating validation of assays used for both species. The objective of this experiment
was to evaluate the specificity, accuracy and precision of a commercially available
human total IGF-I ELISA (DSL 10-5600, Webster, TX) for use with equine plasma.
74
MATERIALS AND METHODS
ELISA validation
Specificity. Biological specificity was determined qualitatively by measuring the
biological change in IGF-I concentrations after Equine somatotropin (eST) administration
to mature Thoroughbred mares. Intramuscular eST injections (EquiGen, BresaGen
Limited, Australia) were administered daily to non-pregnant mares (25ug/kg BW) for a
period of 5 days (n = 3). Sterile saline was injected into a group of control mares to serve
as a control (n = 3). Venous blood samples were taken each day prior to the
administration of eST, and plasma was separated via centrifugation and stored at -20°C
until further analysis. Aliquots of each daily sample were used for ELISA and RIA
analysis. Radioimmunoassay procedure for total IGF-I (Berry et al., 2001) was modified
for use with equine plasma and results for RIA analysis were reported previously
(Staniar, 2001). Dilutional parallelism was determined by comparison of serial dilutions
of kit standards with serial dilutions of plasma samples (1:2, 1:3, 1:5, 1:9 and 1:17) as
described previously (Plikaytis et al., 1994).
Accuracy. Accuracy is the extent to which the measurement of the hormone in a
sample agrees with the exact amount that is present (Reimers et al., 1981). The accuracy
of the IGF-I ELISA was evaluated by comparing results obtained with the ELISA to
those obtained with a previously validated RIA (Staniar, 2001). This comparison was
made by determining linear regression of concentrations for 5 basal plasma samples each
measured by ELISA and RIA. Accuracy may also be evaluated by measuring the
recovery after the addition of known amount of hormone. This was determined by

75
adding a high concentration plasma sample to a low concentration plasma sample and
calculating total recovery.
Precision. Precision was determined by evaluating inter- and intra-assay
variability. Inter-assay variability was evaluated by measuring 18 high (494.1±15.0
ng/mL), 18 medium (379.5.1±6.0 ng/mL), and 18 low (290.8±5.1 ng/mL) concentration
plasma samples run in duplicate on two separate days and averaging inter-assay
coefficients of variation (CV). Intra-assay variability was evaluated using 4 replicate
measurements of low, medium, and high concentration samples run in within assay run.
Statistical analysis
Recoveries for dilutions and additions were calculated as (observed concentration
÷ expected concentration) * 100%. Average recovery values are presented as mean ± SE.
Comparison of RIA and ELISA was also made by robust linear regression as well as
calculation of the coefficient of determination (r2) and the P-value for the null hypothesis
that the slope of the best fit line equals one (Intercooled Stata 9.0; StataCorp LP, College
Station, TX). Non-linear regression lines for serial dilutions of kit standards and plasma
samples were calculated using a polynomial straight line equation. An F Test was used to
examine differences between the slope of these lines, with the null hypothesis that the
slope was not different for each line. (Graphpad Prism 4.0; Graphpad Software Inc, San
Diego, CA). Comparisons of ELISA and RIA measurements were also analyzed by
Bland-Altman plots of the difference in ELISA and RIA values (ELISA – RIA) plotted
against the mean value ([ELISA + RIA] ÷ 2) (Bland & Altman, 1999).Values P < 0.05
were considered significant.

76
RESULTS
Specificity. Daily administration of eST increased concentrations of IGF-1 in the
plasma over time as detected by both RIA and ELISA (Figure 12). Plasma levels of IGF-
1 increased from 140 ng/mL at Day 1 to 523 ng/mL as determined by ELISA. Plasma
IGF-1 levels detected by RIA also increased from 103 to 355 ng/mL over the five day
study. Values obtained by RIA tended to be lower than values obtained with ELISA, with
an average difference between values of 112 ± 23 ng/ml. Results from both assays show a
similar pattern to those from a study conducted in Thoroughbred geldings, where daily
eST administration (25ug/kg BW) increased serum total IGF-I from 281 ng/ml to >530
ng/ml as measured by IRMA (De Kock et al., 2001). These results indicate that each of
these methods demonstrate appropriate biological specificity, as they are able to detect
increased systemic IGF-I production in response to GH stimulation.
When lines defining serial dilutions of high, medium and low concentration
plasma samples and kit standards were analyzed, an F Test showed that the lines were not
different (F=0.92, P=0.44, Figure 13). This indicates parallelism between serial dilutions
of kit standards and plasma samples, suggesting that sufficient similarities exist between
antibody binding to human and equine samples for appropriate estimation of IGF-I levels
in diluted plasma samples (Plikaytis et al., 1994).
Accuracy. When linear regression was used to compare basal plasma samples measured
by RIA and ELISA, results demonstrated that concentrations determined by each method
were systematically different (P =0.001), but correlated (r2 = 0.96) (Figure 14). Bland-
Altman plots of the data suggest a positive bias in the EIA measurements because the
bias line, the mean difference in measurements (ELISA – RIA), is much greater than
77
zero (Figure 14). Both boundaries of the 95% limits of agreement, 2 SD above or
below the bias line are also positive. This indicates that well over 95% of ELISA
measurements would be greater than RIA measurements. Data points on the Bland-
Altman plots reveal a positive slope to the data resulting from proportional error. There
is a greater difference between the two methods at higher concentrations; indicating
that accuracy as determined by RIA values is lower at higher concentrations.
While RIAs are often considered to be more sensitive than ELISAs, this is
dependent on several factors including the location of antibody binding sites, antibody
avidity, the enzymatic substrate of the ELISA and the ELISA amplification method used.
This RIA utilizes mouse anti-human IGF-1 antibody and goat anti-mouse antiserum
(Berry et al., 2001) while antibodies in the ELISA are proprietary mouse multiclonal
antibodies (DSL Laboratories, personal communication). Differences in antibodies and
binding properties likely contributed to differences in values obtained from the two
assays. Although RIA may be considered a “gold standard” for measurements of
hormone concentrations, the ability of this RIA to measure true total IGF-I concentrations
is unknown. It is also important to note that this RIA was initially developed for use with
cattle (Berry et al., 2001), whose IGFBP structure and therefore IGF-I binding properties
may differ from equine.
When a low concentration of IGF-I was spiked with a higher concentration of
IGF-I, recovery ranged from 94% to 104% (Table 8). These consistently high recovery
values indicate that the ELISA has a high degree of accuracy for determining total IGF-I
in equine plasma samples (De Kock et al., 2001).
78
Precision. For low, medium and high concentration samples run repeatedly in a
single assay, the inter-assay CV was calculated as 2.1%, 1.04% and 4.11% respectively.
For low, medium and high concentration samples run in duplicate using different assays,
the intra-assay CV was 19.5%, 10.1%, 10.6% respectively (Table 9). The high intra-assay
CV may be partially explained by the fact that samples were run a limited number of
times between assays (n=2), decreasing the power of these CV calculations. Others that
have used this assay (DSL 10-5600) have also found a high inter-assay CV (12.3-17.6%)
for human serum (Berrigan et al., 2007). Variance was attributed to several factors,
including plate, day, and week that the assay was run. For our experiment, the first assay
used to calculate inter-assay CV was completed several months prior to the second assay.
Storage length and temperature have been shown to adversely affect IGF-I
measurements in biological samples. Plasma samples used in this experiment were stored
at -20°C immediately after collection and separation. While the IGF-I peptide is stable in
plasma at -80°C, a study investigating IGF samples stored at -20°C found up to a 20%
decrease in IGF-I concentrations over time due to proteolysis (Khosravi et al., 2005).
Future sample collection procedure should be changed to include storage at -80°C to
avoid possible proteolysis that may occur at - 20°C.
CONCLUSIONS
The commercial ELISA utilized for this experiment (ELISA, DSL 10-5600,
Webster, TX) demonstrated acceptable specificity and accuracy for use with equine plasma
samples. Low inter-assay precision should be noted, as well as differences in values
previously obtained by the RIA and those obtained with this ELISA. The RIA used for this
79
experiment may be useful for comparison with the ELISA to determine biological
specificity as evidenced by responses to eST.
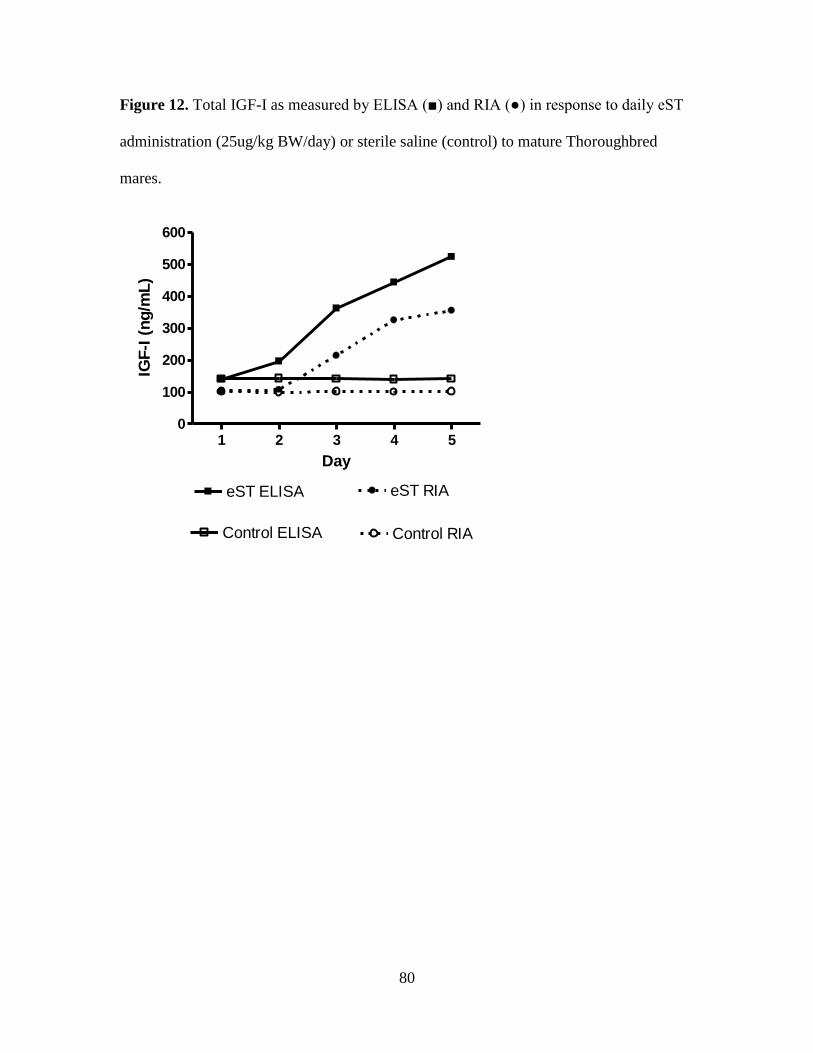
80
Figure 12. Total IGF-I as measured by ELISA (■) and RIA (●) in response to daily eST
administration (25ug/kg BW/day) or sterile saline (control) to mature Thoroughbred
mares.
1 2 3 4 50
100
200
300
400
500
600
eST ELISA eST RIA
Control ELISA Control RIA
Day
IGF
-I (
ng
/mL
)
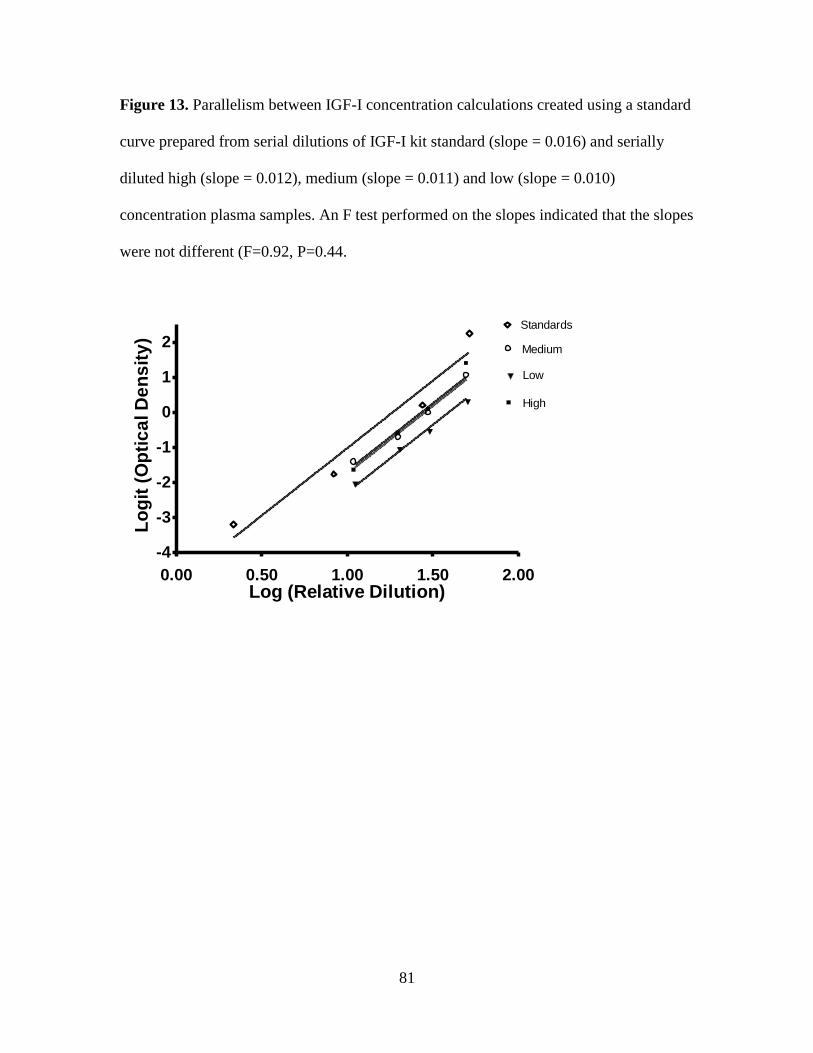
81
Figure 13. Parallelism between IGF-I concentration calculations created using a standard
curve prepared from serial dilutions of IGF-I kit standard (slope = 0.016) and serially
diluted high (slope = 0.012), medium (slope = 0.011) and low (slope = 0.010)
concentration plasma samples. An F test performed on the slopes indicated that the slopes
were not different (F=0.92, P=0.44.
0.00 0.50 1.00 1.50 2.00
-4
-3
-2
-1
0
1
2Standards
High
Medium
Low
Log (Relative Dilution)
Lo
git
(O
pti
ca
l D
en
sit
y)
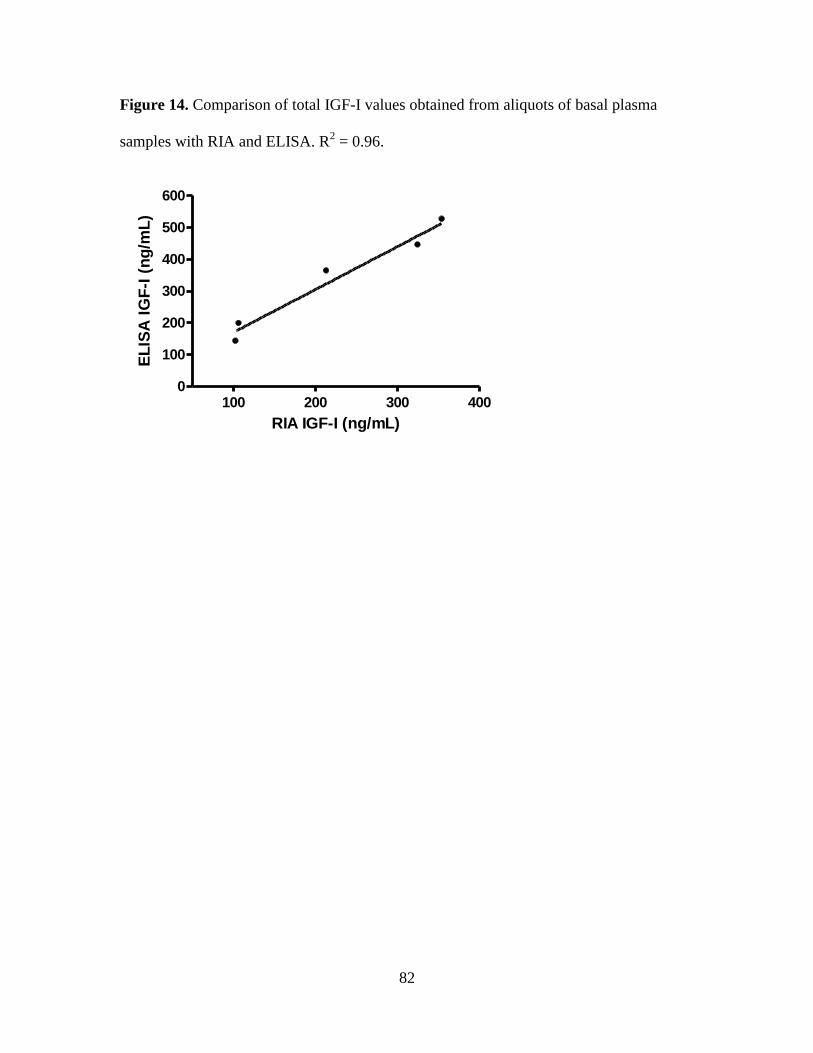
82
Figure 14. Comparison of total IGF-I values obtained from aliquots of basal plasma
samples with RIA and ELISA. R2 = 0.96.
100 200 300 4000
100
200
300
400
500
600
RIA IGF-I (ng/mL)
EL
ISA
IG
F-I
(n
g/m
L)
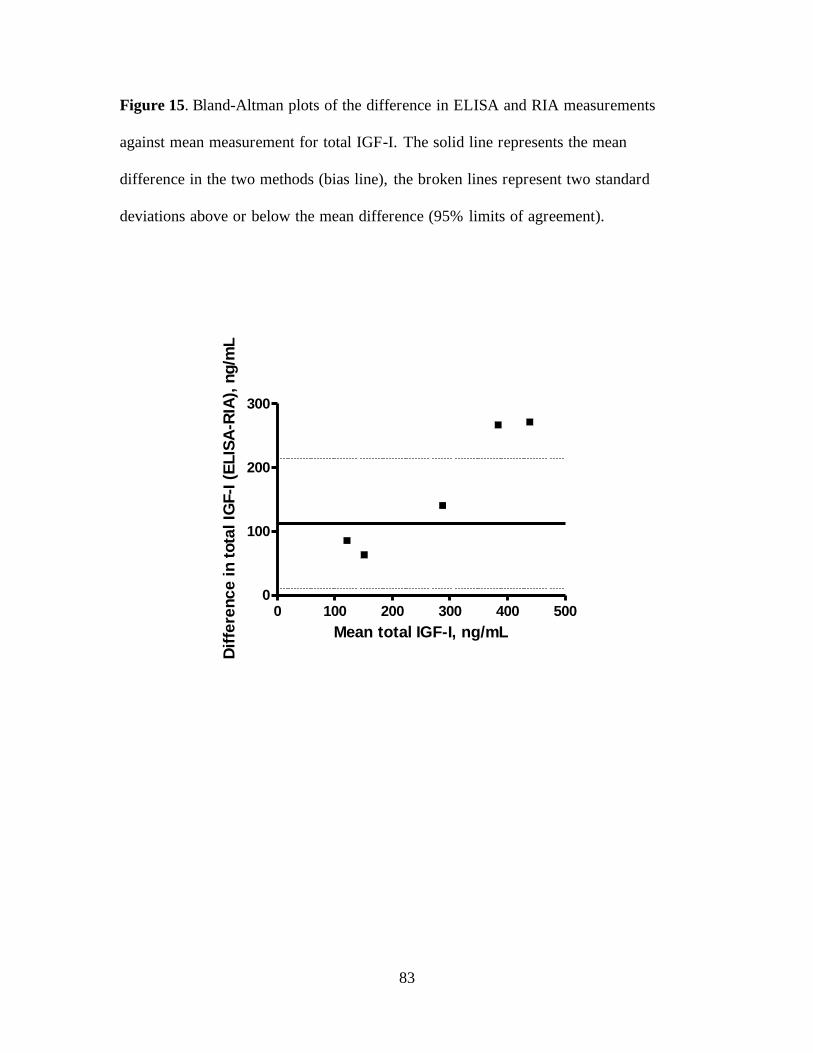
83
Figure 15. Bland-Altman plots of the difference in ELISA and RIA measurements
against mean measurement for total IGF-I. The solid line represents the mean
difference in the two methods (bias line), the broken lines represent two standard
deviations above or below the mean difference (95% limits of agreement).
0 100 200 300 400 5000
100
200
300
Mean total IGF-I, ng/mL
Dif
fere
nc
e i
n t
ota
l IG
F-I
(E
LIS
A-R
IA),
ng
/mL
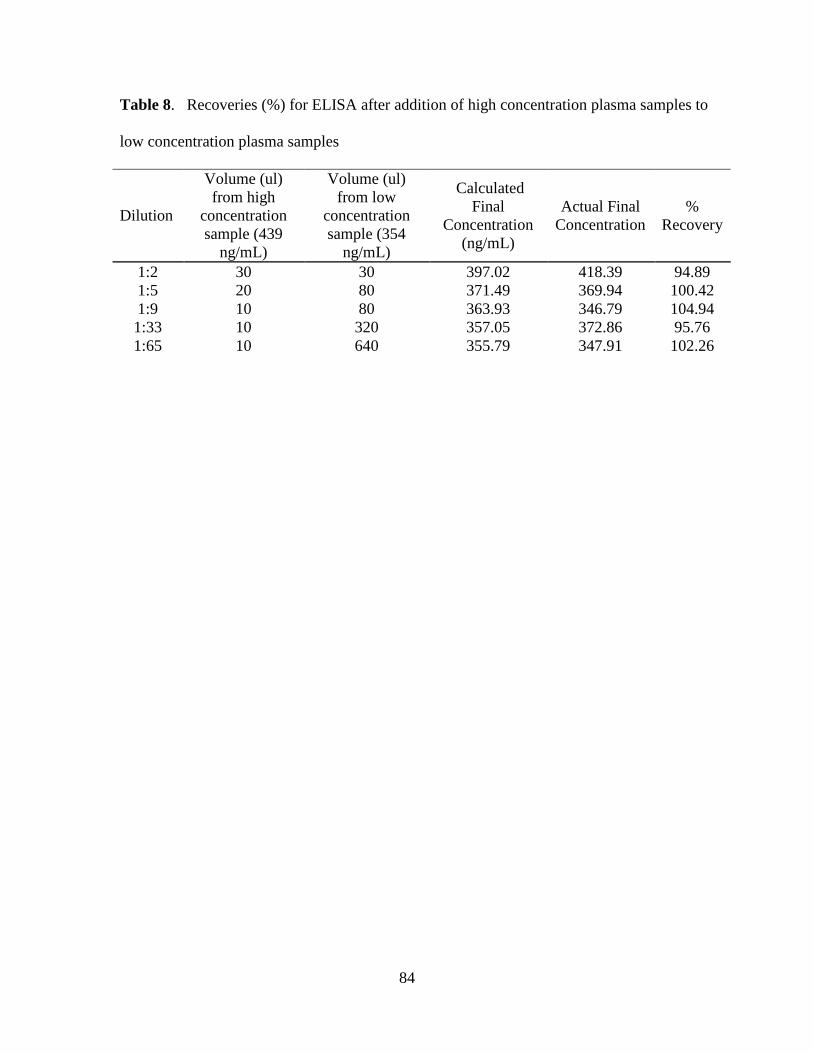
84
Table 8. Recoveries (%) for ELISA after addition of high concentration plasma samples to
low concentration plasma samples
Dilution
Volume (ul)
from high
concentration
sample (439
ng/mL)
Volume (ul)
from low
concentration
sample (354
ng/mL)
Calculated
Final
Concentration
(ng/mL)
Actual Final
Concentration
%
Recovery
1:2 30 30 397.02 418.39 94.89
1:5 20 80 371.49 369.94 100.42
1:9 10 80 363.93 346.79 104.94
1:33 10 320 357.05 372.86 95.76
1:65 10 640 355.79 347.91 102.26
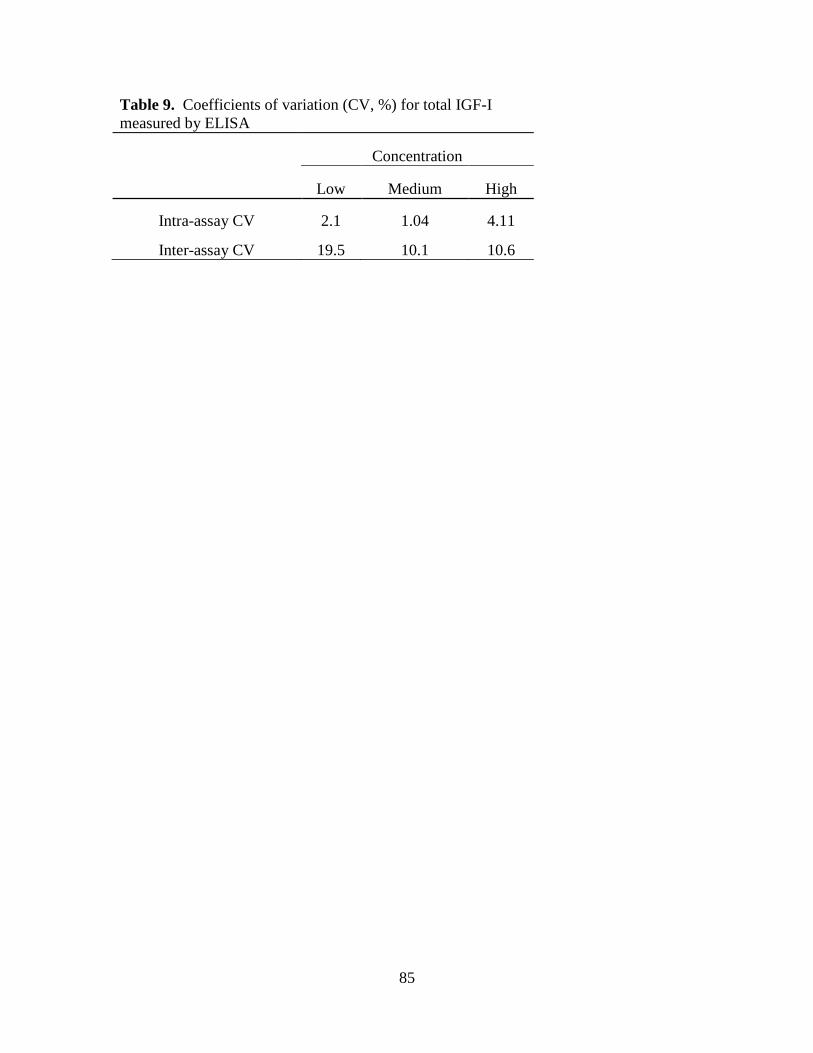
85
Table 9. Coefficients of variation (CV, %) for total IGF-I
measured by ELISA
Concentration
Low Medium High
Intra-assay CV 2.1 1.04 4.11
Inter-assay CV 19.5 10.1 10.6
86
APPENDIX II
RNA ISOLATION PROTOCOLS
1.) High Salt Precipitation Protocol
I. References
Adams ME, Huang DQ, Yao LY, Sandell LJ. (1992) Extraction and isolation of
mRNA from adult articular cartilage. Anal. Biochem. 202:89-95.
Chomczynski P and Mackey K. (1995) Modification of the TRI ReagentTM
procedure for isolation of RNA from polysaccharide- and proteoglycan-rich
sources. BioTechniques, 19:942-945.
MacLeod, JN, Burton-Wurster N , Gu DN, Lust G. (1996) Fibronectin mRNA
splice variant in articular cartilage lacks bases encoding the V, III-15, and I-10
proteins segments. J Biol Chem, 271:18954-18960.
Protocol RNA Cleanup, p79. RNeasy ®Mini Handbook. QIAGEN. June 2001.
II. Chemical Reagents
A. Guanidinium Stock Solution
250 g Guanidinium thiocyanate (USB, 75818, FW 118.16), final
concentration 4 M
293 ml de-ionized and sterile distilled water
17.6 ml 0.75 M sodium citrate, pH 7.0, final concentration 25 mM
26.4 ml 10% (w/v) Sarkosyl (FW 293.39), final concentration 0.5%
87
Note: If possible, mix components in the same container that the guanidinium
thiocyanate is purchased in. Do not use a stir bar. It may require 24 hours
for everything to go into solution. Heating to 65 C will accelerate everything
going into solution. Store at room temperature for up to 3 months.
B. 0.75 M Sodium Citrate, pH 7
22.05 g Sodium Citrate (FW 294.1) dissolved in 100 ml de-ionized and sterile
distilled water
Adjust pH to 7.0
Filter sterilize
C. Guanidinium Working Solution (Solution D)
Guanidinium stock solution (above)
0.1 M 2-mercaptoethanol (FW 78.13)
Note: Prepare fresh on the day of use. Add 0.36 ml 2-mercaptoethanol per 50
ml of guanidinium stock solution on the day of use. Add the 2-mercaptoethanol
in a chemical fume hood.
D. 2 M Sodium Acetate, pH 4.0
136.1 g Sodium acetate, trihydrate (FW 136.08) dissolved in 350 ml de-
ionized and sterile distilled water
Adjust pH to 4.0 with glacial acetic acid
Normalize volume to 500 ml with de-ionized and sterile distilled water
Filter sterilize
88
E. Phenol (acidic), DEPC-water saturated Phenol or Tris-saturated lower pH
Phenol, (Fisher, BP1751I-400)
Saturated with DEPC-water (do not neutralize pH).
Store at 4° C.
F. Chloroform/Isoamyl Alcohol (24/1, v/v), (Chloroform, Fisher, C574-4, Isoamyl
Alcohol, Fisher, BP1150-500)
Store at 4° C.
G. Chloroform/Isoamyl Alcohol (49/1, v/v)
Store at 4° C.
H. High Salt Solution (0.8 M sodium citrate and 2 M NaCl in double-autoclaved
water)
I. DEPC-treated water
Note: add 1 ml Diethyl Pyrocarbonate (DEPC) to 1000 ml distilled water and
shake well, incubate at room temperature overnight in a fume hood, and autoclave
twice.
Note: sterile/distilled water without DEPC treatment is also fine, provided you
take all precautions to avoid Rnase contamination.
J. Isopropyl Alcohol (Fisher, A416-500)
K. 100% Ethanol (AAPER, 200 Proof)
89
III. Protocol
A. Powder cartilage tissue with a Spex Mill or other freeze fracturing instrument,
keeping the tissue frozen by using liquid nitrogen.
B. Starting with 0.5 g to 1 g of powdered tissue, add 10 ml Solution D.
Homogenize within a 50 ml disposable polypropylene tube at room temperature
for 30 seconds three times.
Note: To minimize the potential for RNA degradation, do not allow the tissue to
thaw. Homogenize the cartilage powder immediately in the Solution D.
Homogenize on ice.
C. After homogenizing the tissue, spin the homogenate using a Sorvall SH-3000
rotor or equivalent at 2700 rpm (1506 g) for 2 minutes at 4 C to reduce the
foam in the tub produced by the homogenization process.
D. Transfer homogenate to 15ml disposable polypropylene tube. Spin the
homogenate again using a Sorvall SH-3000 rotor or equivalent at 2700 rpm
(1506 g), this time for 10 minutes at 4° C, transfer the supernatant to a 28 ml
Oak Ridge tube and store on ice.
E. Add sequentially:
1 ml (0.1 volumes) 2M Na Acetate (pH 4)
10 ml (1.0 volumes) Phenol (acidic)
2 ml (0.2 volumes) Chloroform: isoamyl-alcohol (49/1, v/v)
Mix by shaking and vortexing vigorously for 10 seconds after each addition.

90
E. Cool in ice bath for 15 minutes and centrifuge at 14,994 g (11,200 rpm) in an
SS-34 rotor for 20 minutes at 4° C.
F. Remove (upper) aqueous phase being careful to avoid contamination with the
white interface material (denatured proteins) and the phenol/chloroform (this
should be approximately 5-6 ml). Transfer the aqueous phase to clean, double-
autoclaved microcentrifuge tubes in 1 mL aliquots. (Note – additional aqueous
sample can be recovered from the region close to the white interface by
collecting this material into a microcentrifuge tube and re-spinning, spin at max
speed for 10 minutes.)
G. To each microcentrifuge tube, add 250 uL (0.25 volumes) of High Salt Solution.
Mix well by vortexing briefly. The solution should become white with the
addition of High Salt Solution.
H. To each microcentrifuge tube, add 250 uL (0.25 volumes) of Isopropanol. Mix
well by inverting and vortexing until the solution has cleared. Allow the tubes
to sit at room temperature for 10-15minutes.
I. Centrifuge the microcentrifuge tubes at 4 C for 10 minutes at 12,000 g.
J. Remove the supernatant and wash the RNA pellet with 75% Ethanol. Add 1
mL per microcentrifuge tube and mix by pipetting carefully a few times or by
brief vortexing. Afterward, centrifuge the tubes for 10 minutes at 4 C at
14,000 rpm.
K. Repeat the 75% Ethanol wash as in Step J.
L. Fully redissolve the pellets in 20-30 l DNase/RNase-free water at 4 C; this
may take several hours and is dependent on size of the pellet. The tubes may be
91
heated at 55-65 C for 10 minutes to help pellets dissolve into solution. If done,
please briefly spin the tubes to collect all the solution at the bottom of the tube.
M. Combine those centrifuge tubes as necessary. Then quantitate the RNA by
NanoDrop and normalize the RNA concentration to 1 g/ l (or 0.5 g/ l) by
adding additional water as necessary. Also prepare an aliquot for Bioanalyzer
analysis. Remember to fully label final tubes, using a printed cryolabel that
includes sample identification, RNA concentration, date of preparation, and
your name. Store the sample in the 70 C freezer.
N. It is recommended that an RNeasy column purification step be considered as
well. RNeasy maximum capacity is up to 100 g of the RNA per single
column.
O. Add 350 l of Lysis Buffer RLT (QIAGEN, RNeasy kit) to the each 100 l of
the RNA sample and mix thoroughly. Note: Ensure that 2-ME is added to
Buffer RLT before use (10 l 2-ME per 1 ml RLT).
P. Add 250 l of 96-100% Ethanol and thoroughly mix by pipetting.
Q. Apply the mixture to an RNeasy Spin Column (in aliquots of 700 l for each
spin) and centrifuge 25 seconds at 8,000 g (corresponds to ~ 8,700 rpm for
eppendorf centrifuge). Save the flowthrough from this and later steps until you
confirm that the RNA isolation procedure has worked. Re-use the collection
tube.
R. Optional: Add 700 l Wash Buffer RW1 onto the spin column, centrifuge at
8,000 g for 25 seconds.
92
S. Place the RNeasy spin column into a new collection tube. Add 500 l Wash
Buffer RPE (make sure an ethanol is added into Buffer RPE) onto the spin
column and centrifuge at 8,000 g for 25 seconds. Re-use the collection tube.
T. Add 500 l of Wash Buffer RPE onto the spin column and centrifuge for 2
minutes at 8,000 g.
U. Optional: Place the RNeasy column in a clean autocleaved microcentrifuge
tube, and centrifuge in microcentrifuge for 1 minute at full speed (14,000 rpm in
the microcentrifuge).
Note: It is important to ensure that the RNeasy spin column matrix is dry,
because residual ethanol may interfere with subsequent experimental
applications using the RNA. This 1 minute spin assures that no residual ethanol
will be carried over during elution.
V. Transfer the spin column to a new 1.5 ml collection tube and elute the RNA
with 50 l of DEPC-treated water. Centrifuge for 1 minute at 8000 g. If the
expected total yield of RNA is above 30 g, repeat the elution step with a
second 50 l of DEPC-treated water. Pool the 2 elution fractions for
spectrophotometric analysis.
Note: Warming up the elution buffer to 65° C and set the tube on the bench for
5 minutes after adding the elution buffer may help increasing the yield.
W. Optional: Prior to spectrophotometric quantitation, remove any insoluble
particulate material from the sample by microcentrifugation. Transfer the
aqueous supernatant to a new 1.5 ml tube.
93
X. Quantitate the RNA by by NanoDrop and normalize the RNA concentration to 1
g/ l (or 0.5 g/ l) by adding additional water as necessary, if needed. Also
prepare an aliquot for Bioanalyzer analysis. Remember to fully label final tubes,
using a printed cryolabel that includes sample identification, RNA
concentration, date of preparation, and your name. Store the sample in the
70 C freezer.
IV. Notes
A. If a clear distinct pellet is not evident at the RNA precipitation step, something
is wrong. Save the supernatant and ask someone for help.
B. Always follow the necessary precautions to avoid RNAse contamination (see
Maniatis). Final analysis of RNA structural integrity should be determined by
electrophoresis on a formaldehyde agarose gel or on Bioanalyzer.

94
2. Modified RNeasy Lipid Tissue Mini Kit
(Qiagen Inc U.S.A, Valencia, CA)
Note: Perform Steps 1-9 under the hood
1.) Place cartilage in Qiazol,weigh out starting amount of cartilage, not to exceed
100mg.
2.) Use #10 scalpel blade to manually slice cartilage into pieces of suitable size for
homogenizer (Fisher Powergen 125). Do not remove samples from Qiazol
solution.
3.) Transfer cartilage and Qiazol to round bottom 5mL polypropeline tube.
Homogenize immediately using a rotor-stator homogenizer until pieces of
cartilage are no longer visible. To avoid overheating, keep tube containing
homogenate on ice and homogenize in 30s intervals with a 1 minute cool-down
period between each homogenization interval.
4.) Place the tube containing the homogenate on the benchtop for 5 min after return
to room temperature (15-25°C).
5.) Transfer homogenate to a 1.5 ml collection tube and add 200 µl chloroform. Cap
the tube containing the homogenate securely, and vortex for 15 s.
6.) Place the tube containing the homogenate on the benchtop at room temperature
for 2 - 3 min.
7.) Centrifuge at 12,000 x g for 20 min.
8.) Transfer the upper aqueous phase to a new collection tube, taking care not to
disturb the interphase and organic phase. Measure total volume of aqueous phase
removed.

95
9.) Add 1 volume (usually around 600 µl) of 70% ethanol, and mix thoroughly by
vortexing. Continue without delay with step 10.
10.) Pipet up to 700 µl of the sample, including any precipitate that may have
formed, onto an RNeasy Mini Spin Column in a 2 ml collection tube (supplied).
Close the tube gently, and centrifuge at > 8000 x g (> 10,000 rpm) for 15 s at
room temperature (15-25°C). Discard the flow-through.*Reuse collection tube in
step 11.
11.) Pipet 350 µl Buffer RW1 into the RNeasy Mini Spin Column, and
centrifuge for 15 s at ≥8000 x g (≥10,000 rpm) to wash. Discard the flow-through.
12.) Optional: DNAase Digestion
a. Mix DNAse solution from Qiagen RNase-Free DNase Set.
b. Add 10 µl DNase I stock solution (see above) to 70 µl Buffer RDD.Mix
by gently inverting the tube. Do not vortex.
c. Pipet the DNase I incubation mix (80 µl) directly onto the RNeasy silica-
gel membrane, and place on the benchtop at room temperature for 15 min.
d. Pipet 350 µl Buffer RW1 into the RNeasy Mini Spin Column, and
centrifuge for 15 s at 8000 x g. Discard the flow-through
13.) Transfer the RNeasy Spin Column into a new 2 ml collection tube and pipet 500
µl Buffer RPE onto the RNeasy Spin Column. Close the tube gently, and
centrifuge for 15 s at > 8000 x g (> 10,000 rpm) to wash the column. Discard the
flow-through.
14.) Repeat step 13 to ensure thorough washing of spin column.

96
15.) Add another 500 µl Buffer RPE to the RNeasy Spin Column. Close the
tube gently, and centrifuge for 2 min at > 8000 x g (> 10,000 rpm) to dry the
RNeasy silica-gel membrane.
16.) Place the RNeasy Spin Column into a new 2 ml collection tube (not
supplied), and discard the old collection tube with the flow-through. Centrifuge in
a microcentrifuge at full speed for 1 min.
17.) To elute, transfer the RNeasy Mini Spin Column to a new 1.5 ml
collection tube (supplied). Pipet 20 µl RNase-free water (65°C) directly onto the
RNeasy silica-gel membrane. Close the tube gently, and place on benchtop at
room temperature for 1 minute. Centrifuge for 1 min at > 8000 x g (> 10,000 rpm)
to elute.
18.) Pipet an additional 20 µl RNase-free water (65°C) directly onto the
RNeasy silica-gel membrane. Close the tube gently, and place on benchtop at
room temperature for 1 minute. Centrifuge for 1 min at > 8000 x g (> 10,000 rpm)
to elute. Final elution volume is 40ul.
19.) Store sample at -80°C for further analysis.
97
3.) Gentra Versagene™ RNA Purification Kit
Introduction
Certain types of tissues contain high levels of contractile proteins and connective tissue,
making disruption and homogenization of the tissue difficult. Incomplete disruption and
homogenization can result in degradation of the RNA and lower than expected yields. To
obtain the best yields of high quality RNA, we recommend treating fibrous tissue samples
with Gentra Proteinake K Solution (Cat.# V- 0550, 30 mg/ml in buffer) during the
Versagene RNA Isolation Process as outline in the procedure below.
Before Starting:
1. Add TCEP to the Lysis Solution (8ul TCEP per every 800 ul Lysis Solution) for all
samples that will be processed. TCEP is stable in the Lysis Solution for 30 days at
room temperature.
2. Mix Lysis Solution by shaking prior to each use.
Tissue Homogenization and Cell Lysis
Weight of
tissue
Volume of
Lysis
Solution
Volume of
TCEP (0.05
M)
Number of
Preclear
Columns
Number of
purification
columns
40-80 mg 800 ul 8 ul 2 1
1. Add 8 μl TCEP to 800μl Lysis Solution
2. Add 40-80 mg of tissue to the Lysis Solution containing TCEP and homogenize
thoroughly.
98
3. If excessive foam is present in the lysate after homogenization, centrifuge at 400 x
g for 1 minute to eliminate the foam. Gently rock solution to resuspend any pellet
formed during centrifugation.
4. Keep lysate on ice until continuing with the purification protocol.
5. Add 20μl Gentra Proteinase K Solution (20 mg/ml) per 800 μl of lysate and
vortex sample for 10 seconds to mix.
6. Keep samples on ice for a 10 minute incubation.
Precelar Colulmn
1. Pipette 400 μl of lysate onto each of 2 Preclear Columns in green tubes. This is a
total of 800 μl of lysate/80 mg tissue sample.
2. Centrifuge at 400 x g for 1 minute to obtain a clear lysate free of tissue pieces
3. Discard the baskets containing the Preclear columns.
4. Gently pipete the lysates up and down to resuspend any tissue particulates
RNA Binding Wash I
1. Pipet the lysate (~400μl) from one Preclear green tube onto a purification column
in a clear tube.
2. Change centrifuge setting to maximum speed. Centrifuge at 13,000-16,000 x g for
1 minute. The white membrane of the column may become discolored, but this
will have no effect on the purified RNA.
3. Discard waste after second centrifugation and reuse collection tube for the final
centrifugation.
4. Pipet the second ~400 μl lystate from the second Preclear column onto the
Purification column
99
5. Centrifuge at 13,000-16,000 x g for 1 minute.
6. Rotate the tubes 180 degrees and centrifuge at 13,000-16,000 x g for 1 minute.
7. Transfer basket containing Purification column to a new tube.
Wash 2
1. Add 200 μl Wash 2 solution to the Purification column.
2. Centrifuge at 13,000-16,000 x g for 1 minute.
3. Add an additional 200 μl Wash 2 solution to the Purification column
4. Centrifuge at 13,000-16,000 x g for 2 minutes.
RNA Elution
1. Carefully transfer basket containing Purification column to a new tube. Do not
allow the Purification column to come into contact with the waste tube.
2. Add 50-100 μl Elution Solution to the Purification column to elute the RNA. Be
sure that the entire surface of the Purification column is saturated with Elution
solution.
3. Centrifuge at 13,000-16,000 x g for 1 minute.
4. Discard basket containing Purification Column.
5. Place the tube containing RNA of ice. Store RNA at -70° to -80°C.
100
VITA
Rebekah Stacey Cosden graduated from Westminster High School in 2001 in
Westminster, MD. She then attended the University of Maryland at College Park where
she graduated with a B.S. in Animal Science: Equine Studies in 2005. Rebekah has
always liked working with horses and enjoys foxhunting as a hobby. After completing
her M.S. in Animal and Poultry Sciences at Virginia Tech, she plans to earn her PhD in
Veterinary Science at the University of Kentucky beginning in the fall of 2007.