insurance australia group limited half year report … · as iag benefited from its aggregate...
TRANSCRIPT

INSURANCE AUSTRALIA GROUP LIMITEDHALF YEAR REPORT FOR THE PERIOD ENDED 31 DECEMBER 2017
APPENDIX 4D (ASX Listing Rule 4.2A)
RESULTS FOR ANNOUNCEMENT TO THE MARKET
UP / DOWN % CHANGE
31 December2017
$m
31 December2016
$m
Revenue from ordinary activities Up %1.1 8,272 8,179
Net profit after tax from ordinary activities attributable toshareholders of the Parent Up %23.5 551 446
Net profit attributable to IAG shareholders Up %23.5 551 446
DIVIDENDS – ORDINARY SHARESAMOUNT
PER SECURITYFRANKED AMOUNT
PER SECURITY
Interim dividend 14.0 cents 14.0 cents
INTERIM DIVIDEND DATE
Record date 21 February 2018
Payment date 29 March 2018
The Company's Dividend Reinvestment Plan (DRP) will operate by acquiring shares on-market with no discount applied. The lastdate for the receipt of an election notice for participation in the Company's DRP is 22 February 2018. The DRP Issue Price will bebased on a volume-weighted average price for a 10-day trading window from 26 February 2018 to 9 March 2018 inclusive.
Eligible shareholders may now lodge their DRP elections electronically by logging on to IAG's share registry, Computershare, ontheir website at www.computershare.com.au.
Additional Appendix 4D disclosure requirements can be found in the half year financial report of Insurance Australia Group Limitedfor the period ended 31 December 2017 (Attachment A). This report is also to be read in conjunction with the annual report ofInsurance Australia Group Limited for the year ended 30 June 2017 and any public announcements made by Insurance AustraliaGroup Limited during the reporting period in accordance with the continuous disclosure requirements of the Corporations Act2001 and the ASX Listing Rules.
The report is based on the consolidated half year financial statements which have been reviewed by KPMG.
INSURANCE AUSTRALIA GROUP LIMITEDABN 60 090 739 923 1
For
per
sona
l use
onl
y

ATTACHMENT A
INSURANCE AUSTRALIA GROUP LIMITED AND SUBSIDIARIES
HALF YEAR REPORT FOR THE PERIOD ENDED 31 DECEMBER 2017
INSURANCE AUSTRALIA GROUP LIMITEDABN 60 090 739 923 2
For
per
sona
l use
onl
y

INSURANCE AUSTRALIA GROUPLIMITEDABN 60 090 739 923
FINANCIAL REPORTFOR THE HALF YEAR ENDED 31 DECEMBER 2017
For
per
sona
l use
onl
y

INSURANCE AUSTRALIA GROUP LIMITEDTABLE OF CONTENTS
Directors' report................................................................................................................................................................................................................................................................................................................................................................................................................................................................................................................................1
Lead auditor's independence declaration................................................................................................................................................................................................................................................................................................................................................................................................................................................................................................................................12
Consolidated financial statements................................................................................................................................................................................................................................................................................................................................................................................................................................................................................................................................13
Directors' declaration................................................................................................................................................................................................................................................................................................................................................................................................................................................................................................................................25
Independent auditor's review report................................................................................................................................................................................................................................................................................................................................................................................................................................................................................................................................26
For
per
sona
l use
onl
y
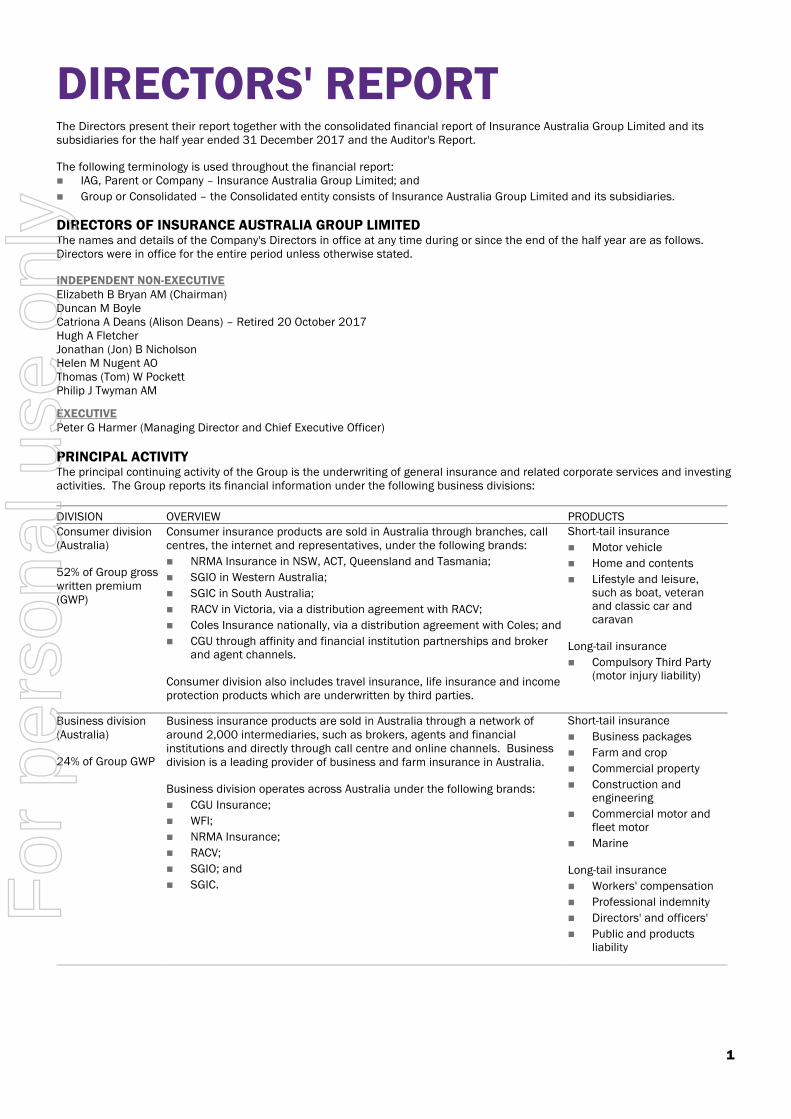
DIRECTORS' REPORTThe Directors present their report together with the consolidated financial report of Insurance Australia Group Limited and itssubsidiaries for the half year ended 31 December 2017 and the Auditor's Report.
The following terminology is used throughout the financial report: IAG, Parent or Company – Insurance Australia Group Limited; and
Group or Consolidated – the Consolidated entity consists of Insurance Australia Group Limited and its subsidiaries.
DIRECTORS OF INSURANCE AUSTRALIA GROUP LIMITEDThe names and details of the Company's Directors in office at any time during or since the end of the half year are as follows.Directors were in office for the entire period unless otherwise stated.
INDEPENDENT NON-EXECUTIVEElizabeth B Bryan AM (Chairman)Duncan M BoyleCatriona A Deans (Alison Deans) – Retired 20 October 2017Hugh A FletcherJonathan (Jon) B Nicholson Helen M Nugent AOThomas (Tom) W PockettPhilip J Twyman AM
EXECUTIVEPeter G Harmer (Managing Director and Chief Executive Officer)
PRINCIPAL ACTIVITYThe principal continuing activity of the Group is the underwriting of general insurance and related corporate services and investingactivities. The Group reports its financial information under the following business divisions:
DIVISION OVERVIEW PRODUCTSConsumer division(Australia)
52% of Group grosswritten premium(GWP)
Consumer insurance products are sold in Australia through branches, callcentres, the internet and representatives, under the following brands:
NRMA Insurance in NSW, ACT, Queensland and Tasmania;
SGIO in Western Australia;
SGIC in South Australia;
RACV in Victoria, via a distribution agreement with RACV;
Coles Insurance nationally, via a distribution agreement with Coles; and
CGU through affinity and financial institution partnerships and brokerand agent channels.
Consumer division also includes travel insurance, life insurance and incomeprotection products which are underwritten by third parties.
Short-tail insurance
Motor vehicle
Home and contents
Lifestyle and leisure,such as boat, veteranand classic car andcaravan
Long-tail insurance
Compulsory Third Party(motor injury liability)
Business division(Australia)
24% of Group GWP
Business insurance products are sold in Australia through a network ofaround 2,000 intermediaries, such as brokers, agents and financialinstitutions and directly through call centre and online channels. Businessdivision is a leading provider of business and farm insurance in Australia.
Business division operates across Australia under the following brands:
CGU Insurance;
WFI;
NRMA Insurance;
RACV;
SGIO; and
SGIC.
Short-tail insurance
Business packages
Farm and crop
Commercial property
Construction andengineering
Commercial motor andfleet motor
Marine
Long-tail insurance
Workers' compensation
Professional indemnity
Directors' and officers'
Public and productsliability
1
For
per
sona
l use
onl
y

DIVISION OVERVIEW PRODUCTSNew Zealand
21% of Group GWP
The New Zealand business is the leading general insurance provider in thecountry in both the direct and broker/agent channels. Insurance productsare provided directly to customers primarily under the State and AMI brands,and indirectly through insurance brokers and agents, under the NZI andLumley Insurance brands. Personal products and simplified commercialproducts are also distributed through agents and under third party brands bycorporate partners, which include large financial institutions.
Short-tail insurance
Motor vehicle
Home and contents
Commercial property,motor and fleet motor
Construction andengineering
Niche, such as pleasurecraft, boat, caravan andtravel
Rural and horticultural
Marine
Long-tail insurance
Personal liability
Commercial liability
Asia
3% of Group GWP
The Group has interests in five general insurance businesses in Asia,comprising the direct and intermediated insurance business underwrittenthrough subsidiaries in Thailand, Vietnam and Indonesia and the share ofthe operating result from the investment in associates in Malaysia and India.The businesses offer personal and commercial insurance products throughlocal brands.
Corporate and other Corporate and other comprises other activities, including corporate services,capital management activity, shareholders' funds investment activities andinward reinsurance from associates.
OPERATING AND FINANCIAL REVIEWOPERATING RESULT FOR THE HALF YEARIAG reported a headline insurance margin of 17.3% for the half year ended 31 December 2017 and an improved underlyingperformance consistent with the expectations held and guidance provided at the outset of the year. Underlying margin improved to12.6% compared to 11.2% in the second half of the prior year. This reflected the earn-through of past and ongoing rate increases,as well as a return to more normal large loss experience in Australian commercial property and maintenance of improved NSWCompulsory Third Party (CTP) profitability post initial reform measures.
Reported GWP growth was 0.6%, after absorbing the effects of discontinued business, changes to the Emergency Services Levy(ESL) in NSW, lower GWP from NSW CTP owing to scheme reform measures and an adverse foreign exchange translation effect.Like-for-like GWP growth was approximately 4% as commercial pricing continued to improve in Australia and New Zealand and rateincreases in short-tail personal lines countered claim inflation pressures.
Across Australia and New Zealand, short-tail personal lines’ GWP growth was largely rate-driven, supplemented by modest volumegrowth in motor. Positive rate momentum in short-tail commercial lines continued, partially offset by reduced volumes asremediation actions and maintained underwriting discipline tempered GWP growth.
IAG’s reported insurance margin of 17.3% (31 December 2016: 13.5%) was significantly higher than the corresponding half yearowing to a favourable net natural peril claims experience against allowance, which accounted for 370 basis points (bps) ofimprovement. A higher favourable credit spread outcome also contributed, while net prior period reserve releases were lower thanthe corresponding half year, but exceeded expectations.
Asia reported an improvement in its divisional result to $15 million (31 December 2016: $2 million). IAG has announced it isconducting a strategic review to assess the options available for its Asian businesses. Separately, a $50 million write-down to thecollective carrying value has also been recognised.
In the current half year, IAG announced further quota share agreements with three reinsurers covering 12.5% of IAG’s consolidatedbusiness. The quota shares commenced on 1 January 2018 and have an average initial term in excess of five years. They improveIAG’s capital mix through greater use of more efficient reinsurance capital, serving to reduce earnings volatility, lower exposure tocatastrophe reinsurance rates and reduce regulatory capital requirements. The new quota share arrangements have not impactedthe Group’s reported earnings for the current reporting period, but balance sheet effects have been recognised to reflect theportion of the unearned premium reserve, and related balances, that will inure to the benefit of the new reinsurancecounterparties. This has resulted in the recognition of deferred outwards reinsurance expense, partly offset by related expenserecoveries (‘Other liabilities’), with the net reinsurance premium payable presented within 'Trade and other payables'.
IAG is on track to achieve its ‘low single digit’ GWP growth guidance for the year ended 30 June 2018 and has increased itsreported margin guidance, relative to the updated position provided in December 2017 after announcement of the new quota shareagreements, to 15.5-17.5%. This reflects a higher prior period reserve release assumption of around 3% of Net Earned Premium(NEP) and the favourable credit spread effect recorded in the half year ended 31 December 2017.
2 INSURANCE AUSTRALIA GROUP LIMITED
For
per
sona
l use
onl
y

Net profit after taxThe Group's profit after tax for the half year was $569 million (31 December 2016: $491 million). After adjusting for non-controllinginterests in the Group result, net profit attributable to the shareholders of the Company was $551 million (31 December 2016:$446 million) and was over 23% higher than the corresponding half year. In addition to the significant increase in insurance profit,this outcome included the net effect of: a higher contribution from investment income on shareholders’ funds, incorporating strong equity market returns;
a higher effective tax rate of 27.2%, owing to the absence of the favourable tax effect on 2011 Canterbury earthquakereinsurance recoveries by an offshore captive vehicle which reduced the 31 December 2016 effective tax rate to 18.2%; and
a $50 million increase in 'Fee-based, corporate and other expenses', representing the write-down of Asian asset carryingvalues.
Gross written premiumTotal GWP of $5,834 million represented a 0.6% increase compared to the corresponding half year. This translates to like-for-likegrowth of approximately 4%. This increase was primarily driven in both Australia and New Zealand by: further rate response to claim cost pressures in short-tail personal lines;
ongoing favourable momentum in average commercial rates, with advances of approximately 5% in Australia and over 10% inNew Zealand; and
modest volume effects, with growth in personal motor and CTP countered by slightly lower home and commercial levels ofbusiness.
Insurance marginIAG’s current half year reported insurance profit of $743 million (31 December 2016: $571 million) was over 30% higher than thecorresponding half year. The reported insurance margin of 17.3% (31 December 2016: 13.5%) included: net natural peril claim costs of $262 million (31 December 2016: $420 million), which were $78 million lower than allowance,
as IAG benefited from its aggregate reinsurance cover which, in particular, limited the impact of the major Melbourne hailstormevent in December 2017 to $20 million;
higher than expected net prior period reserve releases of $121 million, equivalent to 2.8% of NEP, down from $155 million(3.7% of NEP) in the corresponding half year. These were derived from Australian long-tail classes, principally CTP, partiallyoffset by over $50 million of strengthening in New Zealand; and
a more favourable credit spread impact of $47 million, compared to $5 million in the corresponding half year.
Underlying marginIAG’s underlying margin of 12.6% (31 December 2016: 12.6%), while similar to the corresponding half year, was a markedimprovement on the second half of the prior year. This favourable reversal in trend included: the earned-through effect of past and ongoing rate increases in both personal and commercial short-tail lines;
associated reduction of claim cost pressures in short-tail motor, as rate increases at least matched increases in average claimcosts;
more normal large loss experience in Australian commercial property, after the adverse severity experienced in the second halfof the prior year; and
maintenance of the improved CTP profitability seen in the second half of the prior financial year, as initial reform measures inNSW result in lower small claims frequency.
IAG defines its underlying margin as the reported insurance margin adjusted for: net natural peril claim costs less the related allowance for the period;
reserve releases in excess of 1% of NEP; and
credit spread movements.
31 December2017
31 December2016
INSURANCE MARGIN $m % $m %
Reported insurance margin* 743 17.3 571 13.5
Net natural peril claim costs less allowance (78) (1.8) 80 1.9
Reserve releases in excess of 1% of NEP (78) (1.8) (113) (2.7)
Credit spread movements (47) (1.1) (5) (0.1)
Underlying insurance margin 540 12.6 533 12.6
* Reported insurance margin is the insurance profit as a percentage of NEP as disclosed in the Statement of Comprehensive Income.
Tax expenseIAG reported a tax expense of $213 million in the current half year compared to $109 million in the corresponding half year,representing an effective tax rate of 27.2% (31 December 2016: 18.2%).
This outcome was significantly closer to the prevailing Australian corporate rate of 30% and reflects the absence of favourablereinsurance recovery-related effects which were applicable to IAG’s captive vehicle in Singapore in the corresponding half year.
Contributory elements reconciling the current half year’s effective tax rate to the Australian corporate rate are: Differences in tax rates applicable to IAG’s foreign operations, principally in New Zealand, Singapore and Malaysia; and
Franking credits generated from IAG’s investment portfolio.
3
For
per
sona
l use
onl
y

Investment income on shareholders’ fundsNet investment income on shareholders’ funds was a profit of $138 million, a greater than 30% increase on the profit of $105million in the corresponding half year. This was supported by the strong equity markets, both domestic and offshore. The broaderAustralian index (S&P ASX200 Accumulation) delivered a return of 8.4% (31 December 2016: 10.6%), while the MSCI World TotalReturn Index (AUD Hedged) registered a gain of 10.0% (31 December 2016: 10.6%).
At 31 December 2017, the weighting to growth assets (equities and alternatives) within shareholders’ funds stood at approximately53% (31 December 2016: 48%).
A. AUSTRALIAAustralia accounted for 76% of Group GWP and continued to deliver a strong, but slightly lower, underlying margin of 11.4% (31December 2016: 12.2%) and an improved reported insurance margin of 18.8% (31 December 2016: 16.5%).
I. PremiumsAustralia reported marginally lower GWP of $4,453 million in the first half of the current year (31 December 2016: $4,483 million),however like-for-like growth was nearly 3% after allowance for impacts from discontinued business, ESL collection changes and theinfluence of NSW CTP reform. This outcome includes: solid rate-driven growth of 4.9% in short-tail motor, largely in response to claims inflation pressures;
ongoing average rate momentum of approximately 5% in commercial lines, as targeted increases were applied in most classes;
a $23 million reduction in GWP from exiting motor vehicle and motorcycle dealership activities;
significantly lower NSW CTP GWP, with the combination of rate reductions and premium refunds accounting for nearly $80million, in response to scheme reform; and
lower ESL-related GWP of nearly $50 million following its reintroduction in NSW.
Consumer division IAG is the largest personal lines insurer in Australia, offering short-tail motor and home products across the country under a rangeof brands, supplemented by long-tail CTP offerings in NSW, ACT and South Australia. The Australian Consumer division accountedfor 52% of Group GWP and produced a strong, but slightly lower, underlying margin of 13.9% (31 December 2016: 14.1%).
Consumer GWP in the current half year amounted to $3,052 million (31 December 2016: $3,060 million) which was flat comparedto the corresponding half year. Excluding the effects of ESL and NSW CTP related changes, like-for-like Consumer GWP growth wasover 3%.
Short-tail personal lines GWP represented over 86% of Consumer GWP, with nearly 97% of this derived from motor and homeclasses. Compared to the corresponding half year, overall short-tail GWP growth of 2.3% was predominantly rate-driven, andincluded an approximately $30 million impact from lower ESL-related GWP.
Long-tail (CTP) GWP decreased by over 14%, compared to the corresponding half year, largely owing to rate reductions and refundsassociated with NSW scheme reform. Broader reforms to the NSW scheme took effect from 1 December 2017. Changes in schemedesign, including defined benefits for low severity injuries and access to common law for the most seriously injured, are expected toreduce future claim costs. In response, IAG reduced its average NSW CTP premiums by an additional 22% from 1 December 2017.
Business division IAG sells a range of commercial insurance products across Australia. The Australian Business division accounted for 24% of GroupGWP and produced a lower underlying margin of 6.5% (31 December 2016: 8.8%).
GWP declined slightly in the current half year to $1,401 million (31 December 2016: $1,423 million) compared to thecorresponding half year. Like-for-like Business GWP growth was of the order of 1.4%, after allowance for discontinued SwannInsurance activities and an adverse ESL-related effect. The outcome comprised: a continuation of targeted rate increases across most business classes, and notably in commercial motor and packaged
product portfolios;
underwriting agency-derived growth, primarily from NTI;
retention levels slightly lower than the same period last year, however higher than expected;
slightly lower new business volumes;
an approximately $23 million reduction from Swann Insurance; and
an $18 million reduction in ESL-related GWP, following its reintroduction in the current half year.
II. Insurance profitAustralia reported an insurance profit of $625 million, compared to $542 million in the corresponding half year. This equates to ahigher reported insurance margin of 18.8% (31 December 2016: 16.5%) compared to the corresponding half year and includes thenet effect of: higher prior period reserve releases;
lower net natural peril claim costs; and
a higher favourable credit spread impact.
4 INSURANCE AUSTRALIA GROUP LIMITED
For
per
sona
l use
onl
y

III. Underlying marginAustralia’s underlying performance was sound, with an underlying margin of 11.4% representing an improvement on the secondhalf of the prior year (10.8%), and a slightly lower outcome against the corresponding half year (12.2%). Contributory factors to theimprovement seen relative to the second half of the prior year were: reduced pressure on motor profitability from higher claim costs, as increased premium rates earned through;
increased flow-through impact of average rate increases across commercial portfolios;
a more normal large loss experience in commercial property classes, down from the elevated level seen in the prior year;
maintenance of the improved current year profitability in NSW CTP seen in the second half of the prior financial year, reflectinglower small claim frequency; and
some offset from increased expenses.
IV. Fee-based businessThe principal source of fee income for the Business division is its role as agent under both the NSW and Victorian workers’compensation schemes, which are underwritten by the respective state governments. In March 2017, IAG decided to withdrawfrom the NSW scheme by 31 December 2017 after assessment of associated risks and returns. As part of the withdrawal,anticipated redundancy costs associated with the exit were fully provided for in the prior year ended 30 June 2017.
In the current half year, net income from fee-based operations was $5 million, compared to $2 million in the corresponding halfyear. The current half year result contained $10 million of prior period fee income for the Victorian scheme, which was $5 millionhigher than the corresponding half year. This related to a new incentive fee, and the scheme is on track for improved performance.This is the second year of a five-year contract in the Victorian scheme. A secondary source of fee income is Business division’sinterest in authorised representative brokers.
B. NEW ZEALANDNew Zealand accounted for 21% of Group GWP and continued to deliver a strong underlying performance, with a higher underlyingmargin of 17.4% (31 December 2016: 15.3%) and a higher reported margin of 14.2% (31 December 2016: 4.3%).
I. PremiumsNew Zealand’s reported current half year GWP rose by 5.5% to $1,190 million, compared to the corresponding half year GWP of$1,128 million. This increase comprises an adverse foreign exchange translation effect, with local currency GWP increasing by9.5%, to NZ$1,299 million (31 December 2016: NZ$1,186 million). This outcome was the result of: strong GWP growth in the Business division, as rate increases were achieved, particularly in commercial lines, with some offset
from lower new business volumes as IAG adhered to its strong underwriting disciplines; and
ongoing GWP growth in the Consumer division, led by the private motor vehicle portfolio which achieved volume growth andhigher rates.
II. Insurance profitThe New Zealand business produced a substantially higher insurance profit of $119 million in the current half year, compared to$36 million in the corresponding half year, translating to a reported insurance margin of 14.2% (31 December 2016: 4.3%) whichreflects the net effect of: a positive movement in gross earned premium, reflecting sound growth in the Consumer division (led by the AMI private motor
portfolio) and rate-driven benefits in the Business division;
subdued net natural peril claim costs and the absence of any earthquake events in the current half year;
working claims in line with expectations as initiatives to remediate claims performance begin to deliver;
continued focus on disciplined expense management; and
some offset from prior period reserve strengthening.
Net prior period reserve strengthening of $53 million was recognised in the current half year. This primarily relates to: potential claims under architect/engineer professional indemnity policies relating to residual risk (e.g. negligence) from post-
earthquake building damage and rebuild activity; and
adverse development in prior year storm events.
III. Canterbury rebuildThe settlement of claims associated with the financial year 2011 Canterbury earthquake events continues to make sound progress.At 31 December 2017: over NZ$6.5 billion of claim settlements had been completed;
98% of all claims by number had been fully settled;
over 98% of commercial claims had been fully settled; and
over 97% of residential claims had been settled, with the balance either in construction or negotiation for cash settlement.
During the current half year, IAG continued to receive new claims from the Earthquake Commission (EQC) as they tipped over theEQC cap of NZ$100,000 plus Goods and Services Tax (GST). At 31 December 2017, IAG’s reserving position allows for furtherclaims exceeding the EQC’s cap.
IAG has increased its gross reserved position on the three major earthquakes in financial year 2011. This falls to the account ofIAG’s reinsurers, with no earnings impact to IAG. Following this increase in earthquake reserves, IAG has utilised approximately10% of the NZ$600 million adverse development cover in excess of NZ$4.4 billion on the February 2011 event.
5
For
per
sona
l use
onl
y

C. ASIAIAG has a presence in five Asian markets: consolidated businesses in Thailand, Vietnam and Indonesia and investment inassociates in Malaysia and India.
I. Divisional resultThe division contributed a total profit of $15 million, including shares of associates and allocated costs compared to thecorresponding half year profit of $2 million. The improved result reflects the combination of: the absence of large commercial losses in Thailand following reduced exposure to selected segments of this book;
the favourable impact of effective portfolio management in Malaysia, along with higher prior period reserve releases;
improved profits in India owing to better risk selection following portfolio remediation, a favourable one-off reinsurance effectand the influence of a relatively benign monsoon season; and
lower regional support and development costs.
As part of its overall Asia strategy, IAG has expressed a strong interest in growth via market consolidation and increased ownership.IAG’s current assessment is that such opportunities are limited, resulting in the decision to conduct a strategic review of theoptions available for its Asian businesses (refer to Note 2.9). This review is expected to be concluded by the end of calendar 2018.
II. Controlled entitiesGWP from the Group's controlled entities was $185 million, which was an increase of 2% on the corresponding half year GWP of$182 million, within this: the Thai business (Safety Insurance) reported a GWP increase of 2.3% to $177 million in the current half year compared to
$173 million in the corresponding half year. The increase was mainly driven by a strong recovery in motor, as pricecompetition subsided and market conditions improved, resulting in local currency GWP growth of over 6%, and lowercommercial volumes following a planned reduction in exposure to selected segments;
AAA Assurance in Vietnam recorded GWP equivalent to $7 million (31 December 2016: $8 million); and
Parolamas in Indonesia, recorded GWP of less than $1 million (31 December 2016: $1 million).
During the current half year, the controlled entities reported an insurance profit of $1 million (31 December 2016: loss of $2million) excluding allocated regional development costs. Within this: the Thai business reported an improved insurance profit of $5 million compared to breakeven result at the insurance profit line
in the corresponding half year, derived from a relative absence of large losses and prior period reserve strengthening followingremediation actions undertaken in the commercial book, partially offset by higher flood claims from a prolonged rainy seasonand a further regulatory-led increase in compulsory motor claim limits, with no commensurate premium increase;
AAA Assurance reported an insurance loss of $1 million compared to a breakeven result at the insurance profit line in thecorresponding half year; and
Parolamas in Indonesia contributed an insurance loss of $3 million compared to a loss of $2 million in the corresponding halfyear.
III. Share of net profit/(loss) of associatesThe Group's share of net profit of associates was a profit of $24 million (31 December 2016: $16 million), excluding allocatedregional development costs and before amortisation. This result includes AmGeneral Holdings Berhad (AmGeneral) in Malaysia andSBI General Insurance Company Limited (SBI General) in India.
IAG’s share of AmGeneral's profit for the current half year increased to $13 million (31 December 2016: $10 million). The positiveoutcome comprised the net effect of: effective pricing actions and portfolio management, supplemented by higher prior period reserve releases; partially offset by
reduced net earned premium on the back of a reduction in average premiums for motor insurance and lower growth; and
additional marketing spend on detariffication-related initiatives.
IAG’s share of SBI General's profit for the half year increased to $11 million (31 December 2016: $6 million). This positive outcomecomprised the net effect of: an improved loss ratio arising from motor portfolio remediation;
a relatively benign monsoon season in the current half year;
lower investment income due to an unfavourable mark-to-market movement in the technical reserves fund; and
a positive one-off effect from the finalisation of a reinsurance treaty for the long-term home portfolio.
D. CORPORATE AND OTHERA pre-tax profit of $16 million was reported, which compares to a profit of $18 million in the corresponding half year. Furtherdetails on the operating segments are set out in Note 1.3 within the financial statements.
6 INSURANCE AUSTRALIA GROUP LIMITED
For
per
sona
l use
onl
y
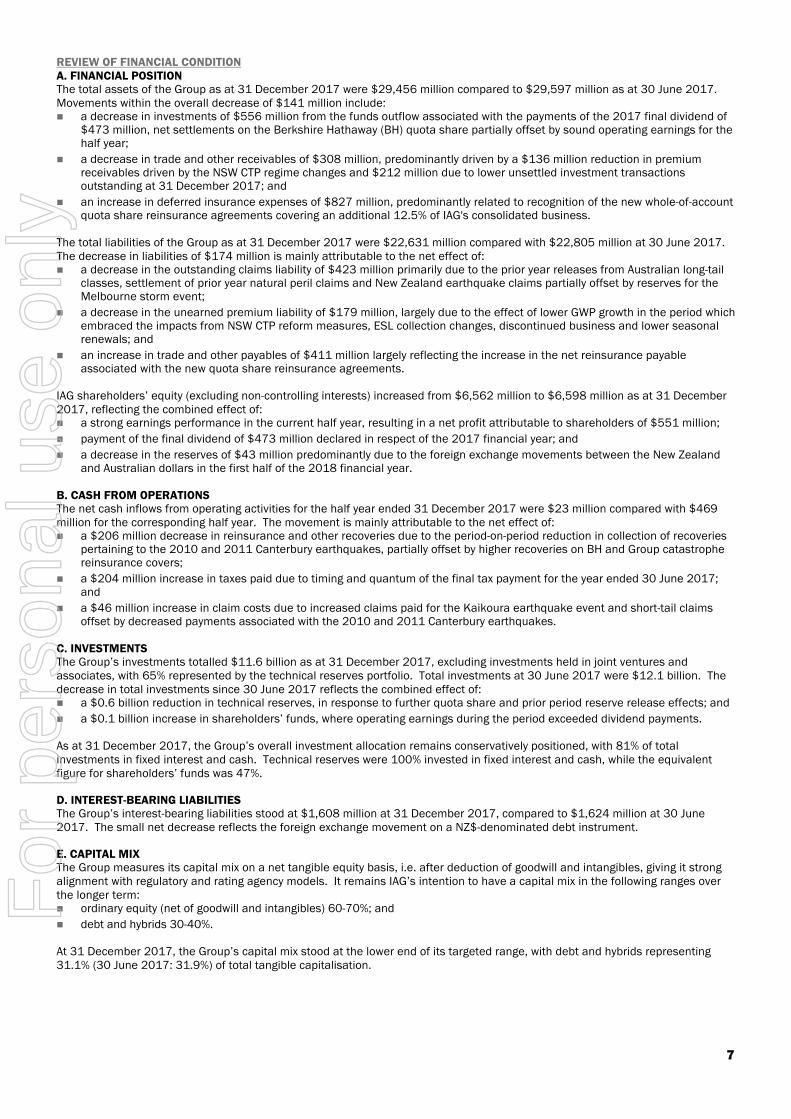
REVIEW OF FINANCIAL CONDITIONA. FINANCIAL POSITIONThe total assets of the Group as at 31 December 2017 were $29,456 million compared to $29,597 million as at 30 June 2017.Movements within the overall decrease of $141 million include: a decrease in investments of $556 million from the funds outflow associated with the payments of the 2017 final dividend of
$473 million, net settlements on the Berkshire Hathaway (BH) quota share partially offset by sound operating earnings for thehalf year;
a decrease in trade and other receivables of $308 million, predominantly driven by a $136 million reduction in premiumreceivables driven by the NSW CTP regime changes and $212 million due to lower unsettled investment transactionsoutstanding at 31 December 2017; and
an increase in deferred insurance expenses of $827 million, predominantly related to recognition of the new whole-of-accountquota share reinsurance agreements covering an additional 12.5% of IAG's consolidated business.
The total liabilities of the Group as at 31 December 2017 were $22,631 million compared with $22,805 million at 30 June 2017.The decrease in liabilities of $174 million is mainly attributable to the net effect of: a decrease in the outstanding claims liability of $423 million primarily due to the prior year releases from Australian long-tail
classes, settlement of prior year natural peril claims and New Zealand earthquake claims partially offset by reserves for theMelbourne storm event;
a decrease in the unearned premium liability of $179 million, largely due to the effect of lower GWP growth in the period whichembraced the impacts from NSW CTP reform measures, ESL collection changes, discontinued business and lower seasonalrenewals; and
an increase in trade and other payables of $411 million largely reflecting the increase in the net reinsurance payableassociated with the new quota share reinsurance agreements.
IAG shareholders’ equity (excluding non-controlling interests) increased from $6,562 million to $6,598 million as at 31 December2017, reflecting the combined effect of: a strong earnings performance in the current half year, resulting in a net profit attributable to shareholders of $551 million;
payment of the final dividend of $473 million declared in respect of the 2017 financial year; and
a decrease in the reserves of $43 million predominantly due to the foreign exchange movements between the New Zealandand Australian dollars in the first half of the 2018 financial year.
B. CASH FROM OPERATIONSThe net cash inflows from operating activities for the half year ended 31 December 2017 were $23 million compared with $469million for the corresponding half year. The movement is mainly attributable to the net effect of: a $206 million decrease in reinsurance and other recoveries due to the period-on-period reduction in collection of recoveries
pertaining to the 2010 and 2011 Canterbury earthquakes, partially offset by higher recoveries on BH and Group catastrophereinsurance covers;
a $204 million increase in taxes paid due to timing and quantum of the final tax payment for the year ended 30 June 2017;and
a $46 million increase in claim costs due to increased claims paid for the Kaikoura earthquake event and short-tail claimsoffset by decreased payments associated with the 2010 and 2011 Canterbury earthquakes.
C. INVESTMENTSThe Group’s investments totalled $11.6 billion as at 31 December 2017, excluding investments held in joint ventures andassociates, with 65% represented by the technical reserves portfolio. Total investments at 30 June 2017 were $12.1 billion. Thedecrease in total investments since 30 June 2017 reflects the combined effect of: a $0.6 billion reduction in technical reserves, in response to further quota share and prior period reserve release effects; and
a $0.1 billion increase in shareholders’ funds, where operating earnings during the period exceeded dividend payments.
As at 31 December 2017, the Group’s overall investment allocation remains conservatively positioned, with 81% of totalinvestments in fixed interest and cash. Technical reserves were 100% invested in fixed interest and cash, while the equivalentfigure for shareholders’ funds was 47%.
D. INTEREST-BEARING LIABILITIESThe Group’s interest-bearing liabilities stood at $1,608 million at 31 December 2017, compared to $1,624 million at 30 June2017. The small net decrease reflects the foreign exchange movement on a NZ$-denominated debt instrument.
E. CAPITAL MIXThe Group measures its capital mix on a net tangible equity basis, i.e. after deduction of goodwill and intangibles, giving it strongalignment with regulatory and rating agency models. It remains IAG’s intention to have a capital mix in the following ranges overthe longer term: ordinary equity (net of goodwill and intangibles) 60-70%; and
debt and hybrids 30-40%.
At 31 December 2017, the Group’s capital mix stood at the lower end of its targeted range, with debt and hybrids representing31.1% (30 June 2017: 31.9%) of total tangible capitalisation.
7
For
per
sona
l use
onl
y

F. CAPITAL MANAGEMENTThe Group remains strongly capitalised under APRA's Prudential Standards, with regulatory capital of $4,722 million at 31December 2017 (30 June 2017: $4,526 million). The Group has set the following related targeted benchmarks: a total capital position equivalent to 1.4 to 1.6 times the Prescribed Capital Amount (PCA), compared to a regulatory
requirement of 1.0 times; and
a Common Equity Tier 1 (CET1) target range of 0.9 to 1.1 times the PCA, compared to a regulatory requirement of 0.6 times.
At 31 December 2017, the Group had a PCA multiple of 1.81 (30 June 2017: 1.70) and a CET1 multiple of 1.19 (30 June 2017:1.09).
STRATEGY AND RISK MANAGEMENTA. STRATEGY
At IAG, our purpose is to make your world a safer place: IAG’s purpose means that whether you are a customer, partner, employee,shareholder or part of the communities IAG serves across Australia, New Zealand or Asia, IAG exists to ‘make your world a saferplace’. IAG believes its purpose will enable it to become a more sustainable business over the long term, and deliver stronger andmore consistent returns for its shareholders.
The IAG strategy is to optimise our core insurance business while creating future growth options.
Financial targetsIAG is focused on delivering through-the-cycle targets of: cash return on equity (ROE) 1.5x weighted average cost of capital (WACC); a dividend payout of 60-80% of cash earnings; top quartile total shareholder return (TSR); and approximately 10% compound earnings per share (EPS) growth.
8 INSURANCE AUSTRALIA GROUP LIMITED
For
per
sona
l use
onl
y

Strategic prioritiesIAG has identified three key strategic priorities, supported by organisational capabilities, to deliver the strategy:
I. Customer – world leading customer experiences: Create a delivery platform that transforms customer experiences. Better connect our customers and automate processes enabling us to reach more customers in a timely manner. Develop an innovation approach which provides the ability to think differently and deliver quickly. Embed cognitive capabilities and artificial intelligence that anticipate customers’ needs. Use data to power decision making, allowing us to better understand our customers.
II. Simplification – simplified, modular and lower cost operating model: Reduce organisational complexity by consolidating technology platforms, harmonising products, simplifying processes and
systems, and executing the technology strategy. Leverage operational partners to optimise the operating model and drive scale economies across the value chain. Improve allocation and maximise utilisation of the preferred repairer network to reduce average claim size.
III. Agility – an agile organisation distinguished by innovation, speed and execution skills: Create a disciplined approach to IAG’s management and leadership, including building stronger role clarity and introducing
agile ways of working. Build a talent pipeline based on the skills required to deliver our strategy and helping our people transition to the future of
work. Be recognised as a purpose led organisation that shapes our internal and external environment.
B. BUSINESS RISK AND RISK MANAGEMENTIAG acknowledges that it has to take risk in an informed manner in pursuit of its strategic objectives and to meet industry andstakeholder expectations. This means that IAG needs to manage its baseline compliance obligations and beyond that, take risk ina manner that is aligned with customer, shareholder, industry, regulatory and other key stakeholder expectations.
IAG uses an enterprise approach to risk and its risk management framework is a core part of the governance structure, whichincludes internal policies, key management processes and culture. The Group Risk Management Strategy (RMS) is reviewedannually, or as required by the Risk Committee (RC), before being recommended for approval by the Board. IAG’s Chief Risk Officefunction provides regular reports to the RC on the operation of and any changes to IAG’s risk management framework, the status ofkey risks, risk and compliance incidents, risk trends and IAG's risk profile. IAG’s Internal Audit function provides reports to the AuditCommittee (AC) on significant audit findings and other audit related matters.
Roles and responsibilities of the Board and its standing committees, the AC, the RC, the People and Remuneration Committee(PARC) and the Nominations Committee, are set out in the Corporate Governance section of the IAG website.
The Group is exposed to multiple risks relating to the conduct of its general insurance business. The risks noted below are notmeant to represent an exhaustive list, but outline those risks faced by the Group that have been identified in IAG's RiskManagement Strategy: strategic risk – the risk of not achieving corporate or strategic goals due to poor decisions regarding future business plans and
strategies and/or a lack of responsiveness to changes in the business environment;
insurance risk – the risk that the Group is exposed to financial loss as a result of inadequate or inappropriate underwriting,inadequate or inappropriate product design and pricing, unforeseen, unknown or unintended liabilities that may eventuate,inadequate or inappropriate claims management including reserving or insurance concentration risk (i.e. by locality, segmentor distribution);
reinsurance risk – the risk of insufficient or inappropriate reinsurance coverage, inadequate underwriting and/or pricing ofreinsurance exposures retained by IAG’s reinsurance captives, inadequate or inappropriate reinsurance recovery management,reinsurance arrangements that are not legally binding, reinsurance concentration risk and credit counterparty concentrationrisk to reinsurers;
financial risk – the risk of inadequate liquidity, adverse movements in market prices (foreign exchange, equities, creditspreads, interest rates, etc) within the investment funds and a counterparty failing to meet its obligations (credit risk);
operational risk – the risk of loss resulting from inadequate or failed internal processes, systems or from external events; and
regulatory risk and compliance – the failure or inability to comply with applicable laws, regulations or codes excluding failure ofstaff to adhere to internal policies/procedures and meeting contractual obligations.
A disciplined approach to risk management has been adopted and IAG believes this approach provides the greatest long-termlikelihood of being able to meet the objectives of all stakeholders, including policyholders, lenders, regulators and shareholders.
Detail of the Group's overall risk management framework, which is outlined in the RMS, is set out in Note 3.1 in the 30 June 2017Annual Report and in the Corporate Governance Statement, which is available at www.iag.com.au/about-us/corporate-governance.
9
For
per
sona
l use
onl
y

OUTLOOKIAG expects to report further improvement in its underlying performance in the second half of the current financial year.
IAG’s GWP guidance for the current financial year of ‘low single digit growth’ remains unchanged. In December 2017, the Groupincreased its reported margin guidance for the year ended 30 June 2018 from 12.5-14.5% to 13.75-15.75%, to reflect six months’impact of the combined 12.5% quota share agreements which commenced on 1 January 2018. Following finalisation of its currenthalf year results, IAG has further upgraded its financial year 2018 reported margin guidance to 15.5-17.5%. This incorporates anincreased prior period reserve release expectation and inclusion of the favourable credit spread impact reported in the current halfyear. Underlying assumptions behind the updated financial year 2018 margin guidance are: net losses from natural perils in line with an allowance of $627 million (2017: $680 million);
prior period reserve releases of around 3% of NEP (previously at least 2%);
no material movement in foreign exchange rates or investment markets in the second half of the current financial year; and
a neutral impact from optimisation program initiatives, as benefits are broadly matched by related implementation costs.
DIVIDENDSDetails of dividends paid or determined to be paid by the Company and the dividend policy employed by the Group are set out inNote 2.5 within the financial statements.
Cash earnings are used for the purposes of targeted ROE and dividend payout policy and are defined as: net profit after tax attributable to IAG shareholders;
plus amortisation and impairment of acquired identifiable intangibles; and
excluding any unusual items (non-recurring in nature).
31 December2017
31 December2016
CASH EARNINGS $m $m
Net profit after tax 551 446
Acquired intangible amortisation and impairment 79 29
630 475Non-recurring items:
Corporate expenses - 4
Tax effect on corporate expenses - -
Cash earnings* 630 479
Interim dividend 331 308
Cash payout ratio* 52.5% 64.3%
* Cash earnings and cash payout ratio represent non-IFRS financial information.
IAG's full year dividend payout policy is to pay dividends equivalent to approximately 60-80% (31 December 2016: 60-80%) ofreported full year cash earnings in respect of any given financial year.
The Board has determined to pay a fully franked interim dividend of 14.0 cents per ordinary share (cps) (31 December 2016: 13.0cps). The interim dividend is payable on 29 March 2018 to shareholders registered as at 5pm on 21 February 2018.
The Company's Dividend Reinvestment Plan (DRP) will operate for the interim dividend by acquiring shares on market with nodiscount applied. The DRP Issue Price will be based on a volume-weighted average share price as defined in the DRP terms. Thelast date for receipt of an election notice for participation in the Company's DRP is 22 February 2018. Information about IAG’s DRPis available at www.iag.com.au/shareholder centre/dividends/reinvestment.
SIGNIFICANT CHANGES IN STATE OF AFFAIRSDuring the half year, the following changes became effective: Effective 19 July 2017, IAG announced the creation of a single Australian division to be led by Mark Milliner as CEO Australia.
The Australian division simplifies IAG’s operating model by bringing together the former Australian Consumer, AustralianBusiness, Operations and Satellite divisions. There has been no change to the reportable segments in the current reportingperiod as financial information was prepared and reviewed by the chief operating decision maker based on the pre-existingsegment structure for Australia.
On 1 August 2017, IAG consolidated its nine Australian Insurance licences into two licences following Federal Court approvalreceived in July 2017. The consolidation transferred the insurance assets and liabilities of seven entities into a related entity,Insurance Australia Limited, with no impact to the Group’s consolidated financial performance or position. Following thetransfer, IAG retains two authorised insurers in Australia being Insurance Australia Limited and Insurance Manufacturers ofAustralia Pty Limited. The transfer is part of IAG’s focus on becoming a simpler, more efficient and agile business.
On 8 December 2017, IAG announced it had entered into three agreements to quota share a combined 12.5% of itsconsolidated business from 1 January 2018. The agreements, with Munich Re, Swiss Re and Hannover Re, are on a whole-of-account basis, covering IAG’s consolidated business in Australia, New Zealand and Thailand and have an initial average periodof more than five years. Expected benefits include reduced earnings volatility, reduced reliance on catastrophe reinsurancecover and exposure to future volatility in reinsurance rates, and reduced regulatory capital requirements.
10 INSURANCE AUSTRALIA GROUP LIMITED
For
per
sona
l use
onl
y

EVENTS SUBSEQUENT TO REPORTING DATEDetail of matters subsequent to the end of the half year are set out below and in Note 2.9 within the financial statements. Theseinclude announcements made on 14 February 2018 that: The Board determined to pay an interim dividend of 14.0 cents per share, 100% franked. The dividend will be paid on 29
March 2018. The dividend reinvestment plan will operate by acquiring shares on market for participants with no discountapplied.
The Group will conduct a strategic review of the options available for its Asian businesses. This review is expected to beconcluded by the end of calendar 2018.
LEAD AUDITOR'S INDEPENDENCE DECLARATION UNDER SECTION 307C OF THE CORPORATIONS ACT2001The lead auditor's independence declaration is set out on page 12 and forms part of the Directors' Report for the half year ended31 December 2017.
Signed at Sydney this 14th day of February 2018 in accordance with a resolution of the Directors.
Peter HarmerDirector
11
For
per
sona
l use
onl
y

LEAD AUDITOR'SINDEPENDENCE DECLARATIONUNDER SECTION 307C OF THE CORPORATIONS ACT 2001
TO THE DIRECTORS OF INSURANCE AUSTRALIA GROUP LIMITED
I declare that, to the best of my knowledge and belief, in relation to the review of Insurance Australia Group Limited for the half yearended 31 December 2017 there have been: no contraventions of the auditor independence requirements as set out in the Corporations Act 2001 in relation to the review;
and
no contraventions of any applicable code of professional conduct in relation to the review.
KPMG
Andrew YatesPartner
Sydney14 February 2018
12 INSURANCE AUSTRALIA GROUP LIMITEDKPMG, an Australian partnership and a member firm of the KPMG network of independent member firms affiliated with KPMG International Cooperative ("KPMGInternational"), a Swiss entity. Liability limited by a scheme approved under Professional Standards Legislation.
For
per
sona
l use
onl
y

CONSOLIDATED FINANCIALSTATEMENTSCONTENTS PAGE
Consolidated statement of comprehensive income 14
Consolidated balance sheet 15
Consolidated statement of changes in equity 16
Consolidated cash flow statement 17NOTES TO THE FINANCIAL STATEMENTS
1 OVERVIEW
1.1 Introduction 18
1.2 About this report 18
1.3 Segment reporting 19
2 INTERIM DISCLOSURES
2.1 Investments 21
2.2 Interest-bearing liabilities 21
2.3 Notes to the statement of changes in equity 22
2.4 Earnings per share 22
2.5 Dividends 23
2.6 Derivatives 23
2.7 Investment in joint venture and associates 24
2.8 Contingencies 24
2.9 Events subsequent to reporting date 24
2.10 Net tangible assets 24
13
For
per
sona
l use
onl
y
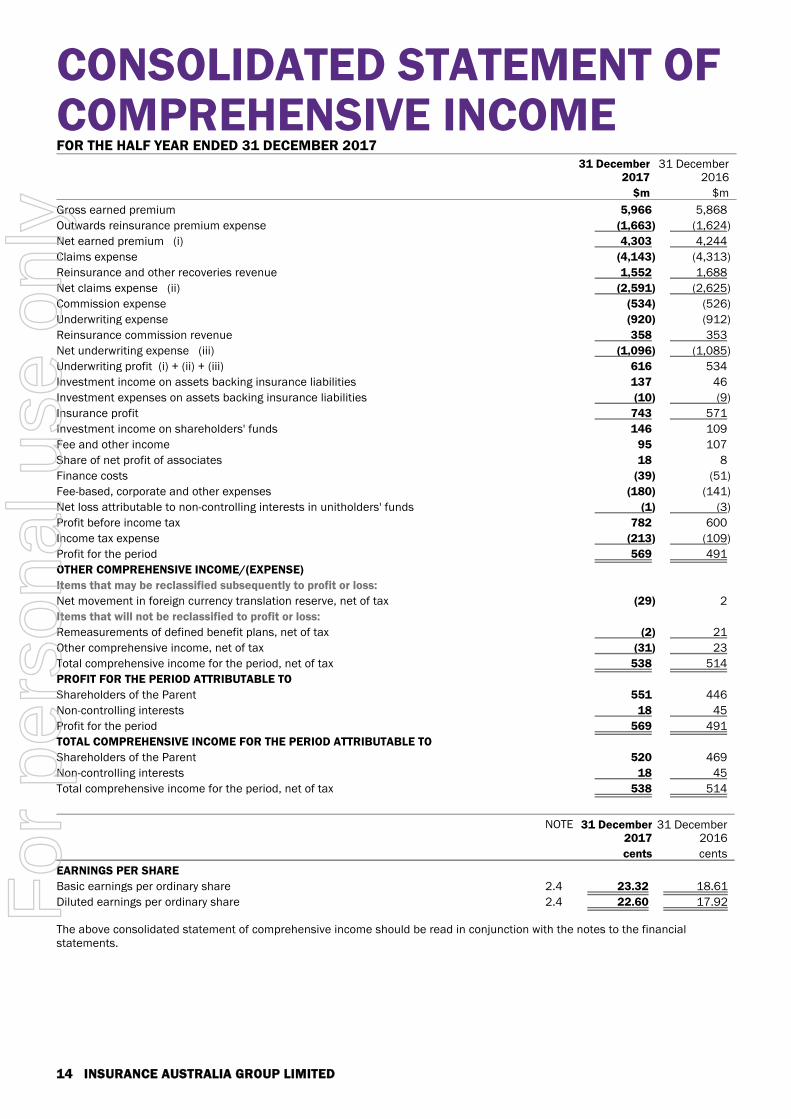
CONSOLIDATED STATEMENT OFCOMPREHENSIVE INCOMEFOR THE HALF YEAR ENDED 31 DECEMBER 2017
31 December2017
31 December2016
$m $m
Gross earned premium 5,966 5,868
Outwards reinsurance premium expense (1,663) (1,624)
Net earned premium (i) 4,303 4,244
Claims expense (4,143) (4,313)
Reinsurance and other recoveries revenue 1,552 1,688
Net claims expense (ii) (2,591) (2,625)
Commission expense (534) (526)
Underwriting expense (920) (912)
Reinsurance commission revenue 358 353
Net underwriting expense (iii) (1,096) (1,085)
Underwriting profit (i) + (ii) + (iii) 616 534
Investment income on assets backing insurance liabilities 137 46
Investment expenses on assets backing insurance liabilities (10) (9)
Insurance profit 743 571
Investment income on shareholders' funds 146 109
Fee and other income 95 107
Share of net profit of associates 18 8
Finance costs (39) (51)
Fee-based, corporate and other expenses (180) (141)
Net loss attributable to non-controlling interests in unitholders' funds (1) (3)
Profit before income tax 782 600
Income tax expense (213) (109)
Profit for the period 569 491
OTHER COMPREHENSIVE INCOME/(EXPENSE)
Items that may be reclassified subsequently to profit or loss:
Net movement in foreign currency translation reserve, net of tax (29) 2
Items that will not be reclassified to profit or loss:
Remeasurements of defined benefit plans, net of tax (2) 21
Other comprehensive income, net of tax (31) 23
Total comprehensive income for the period, net of tax 538 514
PROFIT FOR THE PERIOD ATTRIBUTABLE TO
Shareholders of the Parent 551 446
Non-controlling interests 18 45
Profit for the period 569 491
TOTAL COMPREHENSIVE INCOME FOR THE PERIOD ATTRIBUTABLE TO
Shareholders of the Parent 520 469
Non-controlling interests 18 45
Total comprehensive income for the period, net of tax 538 514
NOTE 31 December2017
31 December2016
cents cents
EARNINGS PER SHARE
Basic earnings per ordinary share 2.4 23.32 18.61
Diluted earnings per ordinary share 2.4 22.60 17.92
The above consolidated statement of comprehensive income should be read in conjunction with the notes to the financialstatements.
14 INSURANCE AUSTRALIA GROUP LIMITED
For
per
sona
l use
onl
y

CONSOLIDATED BALANCESHEETAS AT 31 DECEMBER 2017
NOTE 31 December2017
30 June2017
$m $m
ASSETS
Cash held for operational purposes 436 424
Investments 2.1 11,580 12,136
Trade and other receivables 3,845 4,153
Current tax assets 102 66
Reinsurance and other recoveries on outstanding claims 5,235 5,258
Deferred insurance expenses 3,597 2,770
Deferred levies and charges 95 105
Deferred tax assets 509 545
Property and equipment 177 182
Other assets 107 121
Investment in joint venture and associates 2.7 510 505
Goodwill and intangible assets 3,263 3,332
Total assets 29,456 29,597
LIABILITIES
Trade and other payables 2,845 2,434
Current tax liabilities 84 169
Unearned premium liability 6,152 6,331
Outstanding claims liability 10,948 11,371
Non-controlling interests in unitholders' funds 229 219
Provisions 292 329
Other liabilities 473 328
Interest-bearing liabilities 2.2 1,608 1,624
Total liabilities 22,631 22,805
Net assets 6,825 6,792
EQUITY
Share capital 2.3 7,082 7,082
Treasury shares held in trust (30) (38)
Reserves (26) 17
Retained earnings (428) (499)
Parent interest 6,598 6,562
Non-controlling interests 227 230
Total equity 6,825 6,792
The above consolidated balance sheet should be read in conjunction with the notes to the financial statements.
15
For
per
sona
l use
onl
y

CONSOLIDATED STATEMENT OFCHANGES IN EQUITYFOR THE HALF YEAR ENDED 31 DECEMBER 2017
SHARECAPITAL
TREASURYSHARESHELD IN
TRUST
FOREIGNCURRENCY
TRANSLATIONRESERVE
SHARE-BASED
REMUN-ERATION
RESERVERETAINEDEARNINGS
NON-CONTROLLING
INTERESTSTOTAL
EQUITY
$m $m $m $m $m $m $m
31 December 2017
Balance at the beginning of the financialperiod 7,082 (38) (19) 36 (499) 230 6,792
Profit for the period - - - - 551 18 569
Other comprehensive income/(expense) - - (29) - (2) - (31)
Total comprehensive income/(expense)for the period - - (29) - 549 18 538Transactions with owners in theircapacity as owners
Share-based remuneration - 8 - (14) (5) - (11)
Dividends determined and paid - - - - (473) (21) (494)
Balance at the end of the financial period 7,082 (30) (48) 22 (428) 227 6,825
31 December 2016
Balance at the beginning of the financialperiod 7,275 (43) (3) 35 (701) 222 6,785
Profit for the period - - - - 446 45 491
Other comprehensive income - - 2 - 21 - 23
Total comprehensive income for theperiod - - 2 - 467 45 514Transactions with owners in theircapacity as owners
Off-market share buy-back, includingtransaction costs (193) - - - (123) - (316)
Share-based remuneration - 4 - (9) (4) - (9)
Purchase of non-controlling interests - - - - (3) - (3)
Dividends determined and paid - - - - (316) (44) (360)
Balance at the end of the financial period 7,082 (39) (1) 26 (680) 223 6,611
The above consolidated statement of changes in equity should be read in conjunction with the notes to the financial statements.
16 INSURANCE AUSTRALIA GROUP LIMITED
For
per
sona
l use
onl
y

CONSOLIDATED CASH FLOWSTATEMENTFOR THE HALF YEAR ENDED 31 DECEMBER 2017
31 December2017
31 December2016
$m $m
CASH FLOWS FROM OPERATING ACTIVITIES
Premium received 5,971 5,981
Reinsurance and other recoveries received 1,590 1,796
Claim costs paid (4,560) (4,514)
Outwards reinsurance premium expense paid (1,627) (1,672)
Dividends, interest and trust distributions received 230 238
Finance costs paid (46) (56)
Income taxes paid (291) (87)
Other operating receipts 794 747
Other operating payments (2,038) (1,964)
Net cash flows from operating activities 23 469
CASH FLOWS FROM INVESTING ACTIVITIES
Net cash flows on disposal/(acquisition) of subsidiaries and associates 2 37
Net cash flows from sale/(purchase) of investments and plant and equipment 174 570
Net cash flows from investing activities 176 607
CASH FLOWS FROM FINANCING ACTIVITIES
Outlays for repurchase of shares, including transaction costs - (316)
Proceeds from borrowings, net of transaction costs - 394
Repayment of borrowings (2) (574)
Net cash flow from issue and redemption of trust units 9 (42)
Dividends paid to IAG shareholders (473) (316)
Dividends paid to non-controlling interests (21) (44)
Net cash flows from financing activities (487) (898)
Net movement in cash held (288) 178
Effects of exchange rate changes on balances of cash held in foreign currencies (3) 2
Cash and cash equivalents at the beginning of the financial period 1,480 1,104
Cash and cash equivalents at the end of the financial period* 1,189 1,284
* Includes $436 million (31 December 2016: $378 million) of cash held for operational purposes, $753 million (31 December 2016: $906 million) of cash and short-termmoney held for investments.
The above consolidated cash flow statement should be read in conjunction with the notes to the financial statements.
17
For
per
sona
l use
onl
y

NOTES TO THEFINANCIAL STATEMENTS1. OVERVIEWNOTE 1.1 INTRODUCTIONThe financial report is structured to provide prominence to the disclosures that are considered most relevant to the users'understanding of the operations, results and financial position of the Group.
The financial report has been organised into the following sections:1. Overview – contains information that impacts the financial report as a whole, as well as segment reporting disclosures.
2. Interim disclosures – disclosures required to comply with Australian Accounting Standard AASB 134 Interim Financial Reporting.
NOTE 1.2 ABOUT THIS REPORTA. CORPORATE INFORMATIONInsurance Australia Group Limited (IAG, Parent or Company), the ultimate parent entity in the Consolidated entity, is a for-profitcompany incorporated and domiciled in Australia and limited by shares publicly traded on the Australian Securities Exchange (ASX).Its registered office and principal place of business is Level 26, 388 George Street, Sydney, NSW 2000, Australia. This financialreport covers the consolidated financial statements for the Company and its subsidiaries (Group or Consolidated entity) for the halfyear ended 31 December 2017.
This report is also to be read in conjunction with the annual report for the year ended 30 June 2017 and any public announcementsmade by Insurance Australia Group Limited during the reporting period in accordance with the continuous disclosure requirementsof the Corporations Act 2001 and the ASX Listing Rules.
A description of the nature of the Group's operations and its principal activities is included in the Directors' Report.
B. STATEMENT OF COMPLIANCEThis general purpose half year financial report was authorised by the Board of Directors for issue on 14 February 2018 andcomplies with Australian Accounting Standard AASB 134 Interim Financial Reporting and the recognition and measurementrequirements of other applicable Australian Accounting Standards adopted by the Australian Accounting Standards Board (AASB),the Corporations Act 2001 and the ASX Listing Rules.
The current IFRS standard for insurance contracts does not include a comprehensive set of recognition and measurement criteria.The IASB has issued a new standard (IFRS 17 Insurance Contracts – adopted as AASB 17 Insurance Contracts in an Australiancontext) that does include such criteria, however this standard will not come into effect until 1 January 2021. Until this standardtakes effect, the financial reports of insurers in different countries that comply with IFRS may not be comparable in terms of therecognition and measurement of insurance contracts.
C. BASIS OF PREPARATIONThe financial statements have been prepared on the basis of historical cost principles, as modified by certain exceptions, with theprincipal exceptions being the measurement of all investments and derivatives at fair value and the measurement of theoutstanding claims liability and related reinsurance and other recoveries at present value. All values are rounded to the nearestmillion dollars, unless otherwise stated, in accordance with ASIC Corporations Instrument 2016/191.
The balance sheet is prepared with the assets and liabilities presented broadly in order of liquidity.
The financial report is presented in Australian dollars, which is the functional currency of the Company.
D. SIGNIFICANT ACCOUNTING POLICIES ADOPTEDThe accounting policies adopted in the preparation of this financial report have been applied consistently by all entities in theGroup and are the same as those applied for the previous reporting year, unless otherwise stated. The financial statements ofentities operating outside Australia that maintain accounting records in accordance with overseas accounting principles areadjusted where necessary to comply with the significant accounting policies of the Consolidated entity. The significant accountingpolicies adopted in the preparation of this financial report are set out within the relevant note in the annual report for the yearended 30 June 2017.
18 INSURANCE AUSTRALIA GROUP LIMITED
For
per
sona
l use
onl
y
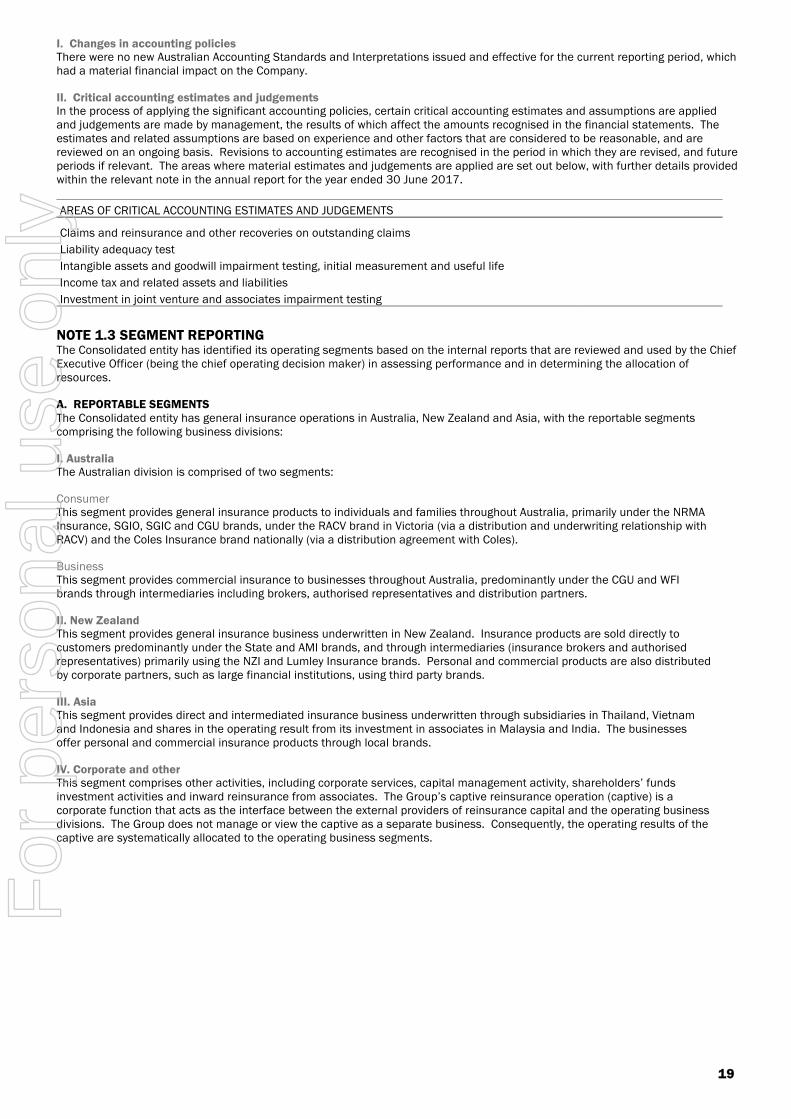
I. Changes in accounting policiesThere were no new Australian Accounting Standards and Interpretations issued and effective for the current reporting period, whichhad a material financial impact on the Company.
II. Critical accounting estimates and judgementsIn the process of applying the significant accounting policies, certain critical accounting estimates and assumptions are appliedand judgements are made by management, the results of which affect the amounts recognised in the financial statements. Theestimates and related assumptions are based on experience and other factors that are considered to be reasonable, and arereviewed on an ongoing basis. Revisions to accounting estimates are recognised in the period in which they are revised, and futureperiods if relevant. The areas where material estimates and judgements are applied are set out below, with further details providedwithin the relevant note in the annual report for the year ended 30 June 2017.
AREAS OF CRITICAL ACCOUNTING ESTIMATES AND JUDGEMENTS
Claims and reinsurance and other recoveries on outstanding claims
Liability adequacy test
Intangible assets and goodwill impairment testing, initial measurement and useful life
Income tax and related assets and liabilities
Investment in joint venture and associates impairment testing
NOTE 1.3 SEGMENT REPORTINGThe Consolidated entity has identified its operating segments based on the internal reports that are reviewed and used by the ChiefExecutive Officer (being the chief operating decision maker) in assessing performance and in determining the allocation ofresources.
A. REPORTABLE SEGMENTSThe Consolidated entity has general insurance operations in Australia, New Zealand and Asia, with the reportable segmentscomprising the following business divisions:
I. AustraliaThe Australian division is comprised of two segments:
ConsumerThis segment provides general insurance products to individuals and families throughout Australia, primarily under the NRMAInsurance, SGIO, SGIC and CGU brands, under the RACV brand in Victoria (via a distribution and underwriting relationship withRACV) and the Coles Insurance brand nationally (via a distribution agreement with Coles).
BusinessThis segment provides commercial insurance to businesses throughout Australia, predominantly under the CGU and WFIbrands through intermediaries including brokers, authorised representatives and distribution partners.
II. New ZealandThis segment provides general insurance business underwritten in New Zealand. Insurance products are sold directly tocustomers predominantly under the State and AMI brands, and through intermediaries (insurance brokers and authorisedrepresentatives) primarily using the NZI and Lumley Insurance brands. Personal and commercial products are also distributedby corporate partners, such as large financial institutions, using third party brands.
III. AsiaThis segment provides direct and intermediated insurance business underwritten through subsidiaries in Thailand, Vietnamand Indonesia and shares in the operating result from its investment in associates in Malaysia and India. The businessesoffer personal and commercial insurance products through local brands.
IV. Corporate and otherThis segment comprises other activities, including corporate services, capital management activity, shareholders’ fundsinvestment activities and inward reinsurance from associates. The Group’s captive reinsurance operation (captive) is acorporate function that acts as the interface between the external providers of reinsurance capital and the operating businessdivisions. The Group does not manage or view the captive as a separate business. Consequently, the operating results of thecaptive are systematically allocated to the operating business segments.
19
For
per
sona
l use
onl
y

B. FINANCIAL INFORMATION
AUSTRALIANEW
ZEALAND ASIA CORPORATEAND OTHER TOTAL
Consumer Business Total
$m $m $m $m $m $m $m
31 December 2017
I. Financial performance
Total external revenue(1) 4,205 2,060 6,265 1,604 240 163 8,272
Underwriting profit/(loss) 432 73 505 118 (6) (1) 616
Net investment income on technicalreserves 77 43 120 1 4 2 127
Insurance profit/(loss) 509 116 625 119 (2) 1 743
Net investment income onshareholders' funds - - - - - 138 138
Share of net profit/(loss) of associates - 2 2 - 17 (1) 18
Finance costs - - - - - (39) (39)
Other net operating result - 5 5 - - (83) (78)
Total segment result 509 123 632 119 15 16 782
Income tax expense (213)
Profit for the period 569
II. Other segment information
Capital expenditure(2) - - - - - 77 77
Depreciation and amortisation expense 27 28 55 26 2 14 97
31 December 2016
I. Financial performance
Total external revenue(1) 3,983 1,954 5,937 1,837 278 127 8,179
Underwriting profit/(loss) 447 76 523 23 (12) - 534
Net investment income on technicalreserves 14 5 19 13 5 - 37
Insurance profit/(loss) 461 81 542 36 (7) - 571
Net investment income onshareholders' funds - - - - - 105 105
Share of net profit/(loss) of associates - - - - 9 (1) 8
Finance costs - - - - - (51) (51)
Other net operating result - 2 2 - - (35) (33)
Total segment result 461 83 544 36 2 18 600
Income tax expense (109)
Profit for the period 491
II. Other segment information
Capital expenditure(2) - - - - - 46 46
Depreciation and amortisationexpense 28 28 56 25 2 - 83
(1) Total external revenue comprises premium revenue, reinsurance and other recoveries, reinsurance commission revenue, investment income on assets backinginsurance liabilities, investment income on shareholders' funds, fee and other income and share of net profit/(loss) of associates.
(2) Capital expenditure includes acquisitions of property and equipment, intangibles and other non-current segment assets.
20 INSURANCE AUSTRALIA GROUP LIMITED
For
per
sona
l use
onl
y

2. INTERIM DISCLOSURES SECTION INTRODUCTIONThis section includes information to be disclosed in accordance with the interim reporting Accounting Standard (AASB 134),Corporations Act and ASX Listing Rules, and which are relevant to understanding the changes in the Group’s financial position andperformance since the end of the last annual reporting period.
NOTE 2.1 INVESTMENTSThe inputs used to determine the fair value for securities recognised under each level of the fair value hierarchy are set out below.
I. Level 1 quoted pricesThe fair value is determined by reference to quoted prices (mid-market) in active markets for identical assets and liabilities. ForIAG, this category includes government securities and listed equities.
II. Level 2 other observable inputsThe fair value is determined by reference to quoted prices in active markets for similar assets or liabilities or by reference to othersignificant inputs that are not quoted prices but are based on observable market data, for example interest rate yield curvesobservable at commonly quoted intervals. For IAG, this category primarily includes corporate and other fixed interest securitieswhere the market is considered to be lacking sufficient depth to be considered active.
III. Level 3 unobservable inputsThe fair value is determined using valuation techniques in which a number of the significant inputs are not based on observablemarket data. Level 3 investments are primarily unlisted private equity funds where the fair value of investments is determined onthe basis of published redemption values of those funds. This category also includes IAG's unlisted equity interest in BohaiProperty Insurance Company Limited (Bohai). The fair value of Bohai is supported by comparable transaction multiples observed inthe local market.
The table below separates the total investment balance by hierarchy category:
LEVEL 1 LEVEL 2 LEVEL 3 TOTAL
$m $m $m $m
31 December 2017
Interest-bearing investments 2,058 7,528 1 9,587
Equity investments 1,164 357 254 1,775
Other investments - 217 1 218
3,222 8,102 256 11,580
30 June 2017
Interest-bearing investments 2,085 8,282 1 10,368
Equity investments 1,076 340 162 1,578
Other investments 4 185 1 190
3,165 8,807 164 12,136
NOTE 2.2 INTEREST-BEARING LIABILITIES31 December 2017 30 June 2017
CARRYINGVALUE
$mFAIR VALUE
$m
CARRYINGVALUE
$mFAIR VALUE
$m
A. COMPOSITION
I. Capital nature
a. ADDITIONAL TIER 1 REGULATORY CAPITAL(1)
Reset exchangeable securities 550 572 550 569
Capital notes 404 435 404 431
b. TIER 2 REGULATORY CAPITAL
AUD subordinated convertible term notes 350 357 350 356
NZD subordinated convertible term notes(2) 318 328 334 337
II. Operational nature
Other interest-bearing liabilities - - 2 2
Less: capitalised transaction costs (14) (16)
1,608 1,624
(1) Instruments issued prior to 1 January 2013 are eligible for inclusion in the relevant category of regulatory capital up to limits prescribed by APRA under transitionalarrangements. Any capital that is ineligible to be included in Additional Tier 1 Capital as a consequence may be included in Tier 2 capital to the extent there is residualcapacity within Tier 2 transitional limits.
(2) At the reporting date, the Company recognised accrued interest of $1 million (30 June 2017: $1 million) which is presented within trade and other payables.
21
For
per
sona
l use
onl
y

B. RECOGNITION AND MEASUREMENTInterest-bearing liabilities are initially measured at fair value (net of transaction costs) and subsequently measured at amortisedcost. Based on market conditions at any point in time, the carrying value of the liabilities may not be representative of the fairvalue of the liabilities. The fair value for all interest-bearing liabilities is calculated using their quoted market price (fair valuehierarchy level 1).
NOTE 2.3 NOTES TO THE STATEMENT OF CHANGES IN EQUITY31 December
201730 June
201731 December
201730 June
2017
Number ofshares in
millions
Number ofshares in
millions $m $m
SHARE CAPITAL
Ordinary shares
Balance at the beginning of the financial period 2,367 2,431 7,082 7,275
Off-market share buy-back, including transaction costs - (64) - (193)
Balance at the end of the financial period 2,367 2,367 7,082 7,082
All ordinary shares on issue are fully paid and have no par value. Ordinary shares entitle the holder to a vote at the generalmeeting of the Company and to participate in the dividends and the proceeds on winding up of the Company in proportion to thenumber of, and amounts paid on, the shares held. Dividends, if declared, are subject to there being distributable profits availableand not breaching APRA capital adequacy requirements.
NOTE 2.4 EARNINGS PER SHARE31 December
201731 December
2016
cents centsA. REPORTING PERIOD VALUES
Basic earnings per ordinary share(1) 23.32 18.61
Diluted earnings per ordinary share(2) 22.60 17.92
(1) The basic earnings per ordinary share is determined by dividing the profit or loss attributable to shareholders of the Parent by the weighted average number of sharesof the Parent on issue during the reporting period. The treasury shares held in trust are deducted, but earnings attributable to those shares are included.
(2) Diluted earnings per share is determined by dividing the profit or loss attributable to shareholders of the Parent, adjusted for the finance costs of dilutive convertibleinstruments, by the weighted average number of ordinary shares and dilutive potential ordinary shares, primarily as a result of debt instruments that possess aconversion feature.
31 December2017
31 December2016
$m $mB. RECONCILIATION OF EARNINGS USED IN CALCULATING EARNINGS PER SHARE
Profit attributable to shareholders of the Parent which is used in calculating basic and dilutedearnings per share 551 446
Finance costs of convertible securities, net of tax 18 18
Profit attributable to shareholders of the Parent which is used in calculating diluted earningsper share 569 464
31 December2017
31 December2016
Number ofshares in
millions
Number ofshares in
millionsC. RECONCILIATION OF WEIGHTED AVERAGE NUMBER OF ORDINARY SHARES
USED IN CALCULATING EARNINGS PER SHARE
Weighted average number of ordinary shares on issue (adjusted for treasury shares held in trust)used in the calculation of basic earnings per share 2,363 2,397
Weighted average number of dilutive potential ordinary shares relating to:
Convertible securities 150 187
Unvested share-based remuneration rights supported by treasury shares held in trust 5 5
2,518 2,589
22 INSURANCE AUSTRALIA GROUP LIMITED
For
per
sona
l use
onl
y

NOTE 2.5 DIVIDENDS31 December 2017 31 December 2016
Cents pershare $m
Cents pershare $m
A. ORDINARY SHARES
31 December 2016: dividend component of off-market share buy-backfully franked at 30% - - 192.0 123
2017 final dividend paid on 9 October 2017 (31 December 2016: 2016final dividend) fully franked at 30%(1) 20.0 473 13.0 316
473 439
(1) Of the total 2017 final dividend declared of $474 million, right and entitlement of $1 million (2016 final dividend: nil) to dividends on unallocated treasury shares waswaived during the year by the trustee of the IAG Share and Rights Plans Trust.
31 December 2017 31 December 2016
Cents pershare $m
Cents pershare $m
B. DIVIDEND NOT RECOGNISED AT REPORTING DATE2018 interim dividend (31 December 2016: 2017 interim dividend) fullyfranked at 30% to be paid on 29 March 2018(2) 14.0 331 13.0 308
(2) Of the total 2017 interim dividend declared of $308 million, right and entitlement of $1 million to dividends on unallocated treasury shares was waived during the year by the trustee of the IAG Share and Rights Plans Trust.
C. DIVIDEND REINVESTMENTA Dividend Reinvestment Plan (DRP) operates which allows eligible shareholders with ordinary shares to elect to receive theirdividend entitlement in the form of IAG shares. The price of DRP shares is the volume-weighted average share price (VWAP), less adiscount if determined by the Directors, calculated over the pricing period (which is at least five trading days) as determined by theDirectors for each dividend payment date. A copy of the terms and conditions for the DRP is available atwww.iag.com.au/shareholder-centre/dividends/reinvestment.
The DRP for the 2017 final dividend paid on 9 October 2017 was settled with the on-market purchase of 11.9 million shares pricedat $6.34 per share (based on a daily VWAP for 13 trading days from 11 September 2017 to 27 September 2017 inclusive, with nodiscount applied).
NOTE 2.6 DERIVATIVES31 December 2017 30 June 2017
Notionalcontractamount
Fair valueasset
Fair valueliability
Notionalcontractamount
Fair valueasset
Fair valueliability
$m $m $m $m $m $m
A. REPORTING DATE POSITIONS
I. Net investment hedges (hedge accounting applied)
Forward foreign exchange contracts 942 11 (7) 922 14 (3)
II. Investment-related derivatives (derivatives withouthedge accounting applied)
Bond futures 2,764 - - 2,913 - -
Share price index futures 95 - - (44) - -
Forward foreign exchange contracts 2,522 51 - 2,827 29 -
Options - - - (48) 3 (1)
III. Treasury-related derivatives (derivatives withouthedge accounting applied)
Forward foreign exchange contracts 572 3 (5) 1,160 11 (4)
Interest rate swaps 318 - (1) 334 - (5)
B. RECOGNITION AND MEASUREMENTI. Hedge accountingThe foreign currency exposures arising on translation of net investments in foreign operations are hedged (net investment hedge)using forward exchange contracts and the designation of certain foreign currency borrowings as hedging instruments. The fairvalue is determined using observable inputs (level 2 in the fair value hierarchy).
II. Derivatives without hedge accounting appliedThe fair value of the bond futures, share price index futures and options are measured using a quoted price in an active market(level 1 in the fair value hierarchy), whilst the fair value of the interest rate swaps and forward foreign exchange contracts aredetermined using observable inputs (level 2 in the fair value hierarchy).
23
For
per
sona
l use
onl
y
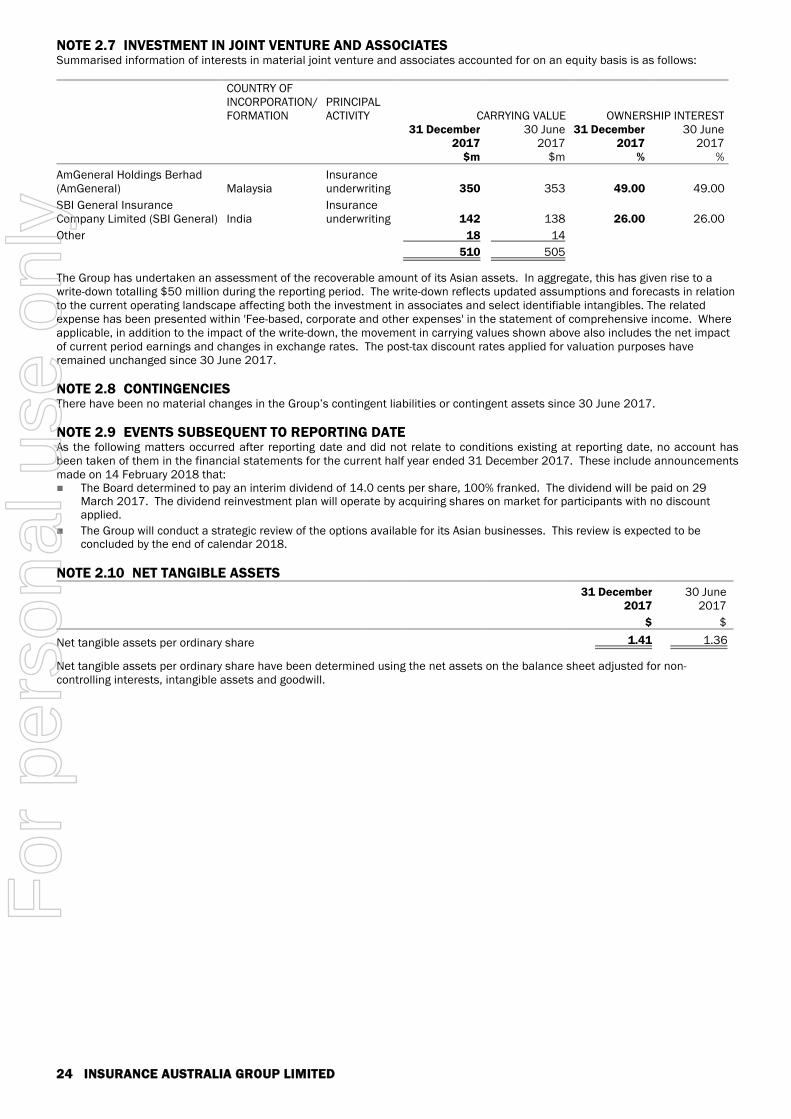
NOTE 2.7 INVESTMENT IN JOINT VENTURE AND ASSOCIATESSummarised information of interests in material joint venture and associates accounted for on an equity basis is as follows:
COUNTRY OFINCORPORATION/FORMATION
PRINCIPALACTIVITY CARRYING VALUE OWNERSHIP INTEREST
31 December2017
30 June2017
31 December2017
30 June2017
$m $m % %
AmGeneral Holdings Berhad(AmGeneral) Malaysia
Insuranceunderwriting 350 353 49.00 49.00
SBI General InsuranceCompany Limited (SBI General) India
Insuranceunderwriting 142 138 26.00 26.00
Other 18 14
510 505
The Group has undertaken an assessment of the recoverable amount of its Asian assets. In aggregate, this has given rise to awrite-down totalling $50 million during the reporting period. The write-down reflects updated assumptions and forecasts in relationto the current operating landscape affecting both the investment in associates and select identifiable intangibles. The relatedexpense has been presented within 'Fee-based, corporate and other expenses' in the statement of comprehensive income. Whereapplicable, in addition to the impact of the write-down, the movement in carrying values shown above also includes the net impactof current period earnings and changes in exchange rates. The post-tax discount rates applied for valuation purposes haveremained unchanged since 30 June 2017.
NOTE 2.8 CONTINGENCIESThere have been no material changes in the Group’s contingent liabilities or contingent assets since 30 June 2017.
NOTE 2.9 EVENTS SUBSEQUENT TO REPORTING DATEAs the following matters occurred after reporting date and did not relate to conditions existing at reporting date, no account hasbeen taken of them in the financial statements for the current half year ended 31 December 2017. These include announcementsmade on 14 February 2018 that: The Board determined to pay an interim dividend of 14.0 cents per share, 100% franked. The dividend will be paid on 29
March 2017. The dividend reinvestment plan will operate by acquiring shares on market for participants with no discountapplied.
The Group will conduct a strategic review of the options available for its Asian businesses. This review is expected to beconcluded by the end of calendar 2018.
NOTE 2.10 NET TANGIBLE ASSETS31 December
201730 June
2017
$ $
Net tangible assets per ordinary share 1.41 1.36
Net tangible assets per ordinary share have been determined using the net assets on the balance sheet adjusted for non-controlling interests, intangible assets and goodwill.
24 INSURANCE AUSTRALIA GROUP LIMITED
For
per
sona
l use
onl
y

DIRECTORS' DECLARATIONIn the opinion of the Directors of Insurance Australia Group Limited:
the financial statements and notes 1 to 2.10 are in accordance with the Corporations Act 2001 including:
giving a true and fair view of the financial position of the Consolidated entity as at 31 December 2017 and of itsperformance, as represented by the results of its operations and its cash flows, for the half year ended on that date; and
complying with Australian Accounting Standard AASB 134 Interim Financial Reporting and the Corporations Regulations 2001; and
there are reasonable grounds to believe that the Company will be able to pay its debts as and when they become due andpayable.
Signed at Sydney this 14th day of February 2018 in accordance with a resolution of the Directors.
Peter HarmerDirector
25
For
per
sona
l use
onl
y

INDEPENDENTAUDITOR'S REVIEW REPORTTO THE SHAREHOLDERS OF INSURANCE AUSTRALIA GROUP LIMITED
ConclusionWe have reviewed the accompanying half year financial reportof Insurance Australia Group Limited.
Based on our review, which is not an audit, we have notbecome aware of any matter that makes us believe that thehalf year financial report of Insurance Australia Group Limitedis not in accordance with the Corporations Act 2001, including: giving a true and fair view of the Group’s financial position
as at 31 December 2017 and of its financial performancefor the half year ended on that date; and
complying with Australian Accounting Standard AASB 134Interim Financial Reporting and the CorporationsRegulations 2001.
The half year financial report comprises: Consolidated balance sheet as at 31 December 2017;
Consolidated statement of comprehensive income,Consolidated statement of changes in equity, andConsolidated cash flow statement for the half year endedon that date;
Notes 1 to 2.10 comprising a summary of significantaccounting policies and other explanatory information;and
Directors’ declaration.
The Group comprises Insurance Australia Group Limited (theCompany) and the entities it controlled at the half year's endor from time to time during the half year.
Responsibilities of the Directors for the half year financial reportThe Directors are responsible for: the preparation of the half year financial report that gives a true and fair view in accordance with Australian Accounting
Standards and the Corporations Act 2001; and
for such internal control as the Directors determine is necessary to enable the preparation of the half year financial report thatis free from material misstatement, whether due to fraud or error.
Auditor’s responsibility for the review of the half year financial reportOur responsibility is to express a conclusion on the half year financial report based on our review. We conducted our review inaccordance with Auditing Standard on Review Engagements ASRE 2410 Review of a Financial Report Performed by theIndependent Auditor of the Entity, in order to state whether, on the basis of the procedures described, we have become aware ofany matter that makes us believe that the half year financial report is not in accordance with the Corporations Act 2001 including:giving a true and fair view of the Group’s financial position as at 31 December 2017 and its performance for the half year ended onthat date; and complying with Australian Accounting Standard AASB 134 Interim Financial Reporting and the CorporationsRegulations 2001. As auditor of Insurance Australia Group Limited, ASRE 2410 requires that we comply with the ethicalrequirements relevant to the audit of the annual financial report.
A review of a half year financial report consists of making enquiries, primarily of persons responsible for financial and accountingmatters, and applying analytical and other review procedures. A review is substantially less in scope than an audit conducted inaccordance with Australian Auditing Standards and consequently does not enable us to obtain assurance that we would becomeaware of all significant matters that might be identified in an audit. Accordingly, we do not express an audit opinion.
In conducting our review, we have complied with the independence requirements of the Corporations Act 2001.
KPMG
Andrew Yates Ian Moyser
Partner PartnerSydney14 February 2018
26 INSURANCE AUSTRALIA GROUP LIMITEDKPMG, an Australian partnership and a member firm of the KPMG network ofindependent member firms affiliated with KPMG International Cooperative (“KPMGInternational”), a Swiss entity.
Liability limited by a scheme approved under Professional Standards Legislation.
For
per
sona
l use
onl
y