insurance market research: the determinants of price sensitivity and
TRANSCRIPT

Insurance market research:
The determinants of price sensitivity and the key
role played by intermediaries
By
Sérgio Dominique Ferreira Lopes
PhD Thesis in Business and Management Studies
(Branch of Marketing and Strategy)
Supervisors:
Prof. Helder Vasconcelos
Prof. João Proença
2015
i
BIOGRAPHICAL NOTE
Sérgio Dominique was born on the 29th January 1984, in Paris, France. He is graduated
in Economic and Consumer Psychology, holds a postgraduate course in Brand
Management, and a Ph.D. in Social Psychology. He has been as Ph.D. student at the
School of Management and Economics of the University of Porto since 2011.
Currently he is Adjunct Professor at the School of Management of the Polytechnic
Institute of Cavado and Ave. Previously, he was a researcher at the PSICOM-USC
research center (Consumer Psychology Research Center of the University of Santiago
de Compostela), Department of Methodology, Faculty of Psychology of the University
of Santiago de Compostela. He was also a researcher at the Faculty of Economic and
Business Sciences (Department of Business Organization and Marketing) of the
University of Vigo.

ii
ACKNOWLEDGMENTS
I would like to thank my supervisors, Professor Helder Vasconcelos for his endless
support and encouragement and to Professor João F. Proença for his support.
I am also very grateful to the Editors (Professor Steve Baron and Professor Rebekah
Russell-Bennett), to the Associate Editor (Professor Javier Reynoso) and to three
anonymous referees of the Journal of Services Marketing for their thorough and
thoughtful reports concerning the paper Determinants of customer price sensitivity: An
empirical analysis.
Thanks to the moderators and authors’ feedback who attended my presentations: i)
Salesmen, when should they talk about price? at the 25th Portuguese-Spanish
Conference of Scientific Management, Ourense, Spain; ii) Consumer behavior in the
insurance sector: A qualitative approach at the 23th Portuguese-Spanish Conference of
Scientific Management, Malaga, Spain.
I thank all the teachers of the doctoral programme, namely, Professor Carlos Cabral
Cardoso and Professor Pedro Quelhas Brito.
Finally, I would like to thank my wife and my parents for all the support.

iii
ABSTRACT
The insurance sector plays a very important role worldwide, providing stability in
markets. Insurers, premium, intermediaries, bundling strategies, customers’ satisfaction,
customers’ price sensitivity and claims management are some of the most important
issues in the insurance sector. However, the number of insurance studies from the
perspective of customers is very little, especially in services marketing literature.
Therefore, purpose of this investigation is threefold: i) to study the importance that
insurance customers give to premium, insurers, intermediary recommendations, and
bundling strategies, as well as the relationship between attributes and consumer price
sensitivity and price elasticity of demand; ii) to identify the strategic importance of
attributes’ order presentation, identifying the right moment to present premium,
bundling strategy and intermediaries’ recommendation to insurance customers; iii) to
study the insurance supply management through customer’s satisfaction with
intermediaries and insurers, as well as the preferences of customers in the purchase
decision-making process.
In order to study the attributes’ importance, we used Conjoint Analysis with Full
Profile. A two-stage cluster analysis was performed to segment the market. Regarding
the study of the strategic importance of attributes’ order presentation, Kruskal-Wallis
test was performed. Finally, in order to study customers’ satisfaction, structural
equation modelling was performed and Multidimensional Scaling unfolding model was
applied to understand customers’ preferences in chapter 3.
Research findings indicate that price sensitivity is affected by the level of purchase
involvement, bundled discounts, and brand loyalty. Also, brand loyalty has a strong
influence on customer acceptance of bundled discounts. Price bundling increases firm's
revenues and profits. Regarding the effect of attributes’ order of presentation, primacy
and recency effects were detected, as well as a transfer effect related with the level of
importance of attributes that precede and succeed attributes. Finally, results show that
insurance customers’ satisfaction is statically related to intermediaries and not to
insurers, and that intermediaries play a central role in the management of customers
claims, as well as in premium acceptance.

iv
This investigation presents theoretical and practical contributions and managerial
suggestions regarding customers price sensitivity, bundling strategies, salesperson
approach to customers and the strategic importance of insurance intermediaries.
Key words: Insurance, Price sensitivity, Price elasticity, Price bundling, Intermediaries,
Strategic order of product attribute presentation, Customers satisfaction, Customers
preferences, Supply chain.

v
RESUMO
O setor de seguros desempenha um papel fundamental a nível internacional,
proporcionando estabilidade nos mercados financeiros. As seguradoras, os
distribuidores (mediadores), os prémios, a sensibilidade dos consumidores face ao
preço, as estratégias de bundling, a gestão de sinistros e a satisfação dos clientes são
aspetos críticos no sector segurador.
Neste contexto, o objetivo desta investigação é triplo: i) estudar a importância que os
clientes do sector segurador atribuem ao prémio, às seguradoras, às recomendações dos
distribuidores, a estratégias de bundling, bem como a relação entre atributos e
sensibilidade dos consumidores face ao preço e a elasticidade do procura face ao preço;
ii) compreender qual a importância estratégica da ordem de apresentação dos atributos
no sector segurador, identificando qual o melhor momento para apresentar cada
atributo; iii) estudar a gestão da cadeia logística através da satisfação dos clientes com
os distribuidores e com as seguradoras, bem como as suas preferências no processo de
tomada de decisão compra.
No âmbito do estudo da importância atribuída aos atributos, aplicou-se a Análise
Conjunta com Full Profile. Para segmentar o mercado, recorreu-se a uma Análise
Cluster de duas fases. Relativamente ao estudo da ordem estratégica da apresentação de
atributos, utilizou-se a estatística de Kruskal-Wallis. Finalmente, para estudar a
satisfação dos consumidores recorreu-se a modelos de equações estruturais, e a análise
das preferências dos consumidores no capítulo 3 foi obtida através da aplicação do
Escalonamento Multidimensional através do modelo unfolding.
Os resultados indicam que a sensibilidade dos consumidores face ao preço é
influenciada pelo nível de envolvimento financeiro dos consumidores na compra,
estratégias de bundling e por comportamentos de lealdade. Além disso, a lealdade
influencia fortemente a aceitação de estratégias de bundling. As estratégias de bundling
permitem aumentar as receitas e os lucros no sector segurador. No que concerne ao
efeito da ordem de apresentação dos atributos, foram detetados efeitos de recência e de
primazia, bem como um efeito de transferência ou efeito âncora. Finalmente, os
resultados mostram que os mediadores/distribuidores desempenham um papel

vi
preponderante na gestão da cadeia logística do sector segurador. Concretamente,
constata-se que a satisfação dos clientes do mercado segurador depende em maior
medida dos distribuidores do que das seguradoras. Paralelamente, os distribuidores
desempenham, também, um papel central na gestão de sinistros, bem como numa
melhor aceitação do prémio.
Esta investigação apresenta claras contribuições teóricas e práticas, bem como sugestões
para uma gestão otimizada do sector segurador.
Palavras-chave: Setor segurador, Sensibilidade ao preço, Elasticidade da procura, Price
bundling, Mediadores, Ordem estratégica da apresentação de atributos, Satisfação de
consumidores, Preferências de consumidores, Cadeia de fornecimento

vii
Next, a graphical abstract is also provided for a more intuitive understanding.
GRAPHICAL ABSTRACT

viii
TABLE OF CONTENTS
BIOGRAPHICAL NOTE ............................................................................................... i
ACKNOWLEDGMENTS .............................................................................................. ii
ABSTRACT .................................................................................................................... iii
RESUMO ......................................................................................................................... v
GRAPHICAL ABSTRACT ......................................................................................... vii
TABLES .......................................................................................................................... xi
FIGURES ...................................................................................................................... xiii
GRAPHS ....................................................................................................................... xiv
INTRODUCTION .......................................................................................................... 1Research scope ......................................................................................................................... 1Methodology ............................................................................................................................. 2Structure ................................................................................................................................... 3
CHAPTER I – DETERMINANTS OF CUSTOMER PRICE SENSITIVITY: AN
EMPIRICAL ANALYSIS .............................................................................................. 61. INTRODUCTION ............................................................................................................. 82. THEORETICAL FRAMEWORK .................................................................................. 12
2.1. Pricing and Price Sensitivity ................................................................................................. 122.2. Bundling ................................................................................................................................ 16
3. METHODOLOGY AND DATA .................................................................................... 203.1. Sample ................................................................................................................................... 203.2. Data collection ....................................................................................................................... 203.3. Attributes’ selection ............................................................................................................... 213.4. Procedure ............................................................................................................................... 213.5. Methods and results ............................................................................................................... 24
4. RESULTS ....................................................................................................................... 254.1. Results of Conjoint Analysis ................................................................................................. 254.2. Customer buying decision process ........................................................................................ 264.3. Analysis of the hypotheses .................................................................................................... 28
4.3.1. Purchase involvement .................................................................................................... 284.3.2. Customer loyalty ............................................................................................................ 304.3.3. Price bundling and price perception .............................................................................. 33

ix
4.4. The effect of price bundling on the demand function ........................................................... 355. DISCUSSION AND CONCLUSIONS ........................................................................... 37
CHAPTER II – HOW IMPORTANT IS THE STRATEGIC ORDER OF
PRODUCTS’ ATTRIBUTES PRESENTATION IN THE INSURANCE
MARKET?..................................................................................................................... 411. INTRODUCTION ........................................................................................................... 432. THEORETICAL BACKGROUND ................................................................................ 44
2.1. Effect of attributes order presentation ................................................................................... 442.2. Price perception ..................................................................................................................... 452.3. The importance of intermediaries in insurance sales ............................................................ 462.4. The importance of bundling strategies in sales ..................................................................... 47
3. METHODOLOGY .......................................................................................................... 493.1. Participants ............................................................................................................................ 493.2. Attributes’ selection ............................................................................................................... 493.3. Procedure ............................................................................................................................... 493.4. Methods and results ............................................................................................................... 51
4. RESULTS ....................................................................................................................... 514.1. Conjoint Analysis’ results ..................................................................................................... 514.2. Results by series .................................................................................................................... 52
4.2.1. Price ............................................................................................................................... 524.2.2. Insurer ............................................................................................................................ 544.2.3. Bundling strategy ........................................................................................................... 554.2.4. Intermediary’s recommendation .................................................................................... 56
4.3. Statistical differences versus simulation analysis .................................................................. 585. DICUSSION AND MANAGERIAL IMPLICATIONS ................................................. 59
CHAPTER III – THE KEY ROLE PLAYED BY INTERMEDIARIES IN THE
INSURANCE MARKET SUPPLY CHAIN: EVIDENCE FROM PORTUGUESE
INSURANCE CUSTOMERS ...................................................................................... 611. INTRODUCTION ........................................................................................................... 632. THEORETICAL FRAMEWORK .................................................................................. 65
2.1. Supply chain management ..................................................................................................... 652.2. Customers’ satisfaction ......................................................................................................... 662.3. Insurance distribution ............................................................................................................ 69
STUDY 1 ................................................................................................................................. 723. METHODOLOGY .......................................................................................................... 72
3.1. Sample ................................................................................................................................... 72

x
3.2. Data collection ....................................................................................................................... 724. RESULTS ....................................................................................................................... 73
4.1. Descriptive analysis ............................................................................................................... 734.2. Measurement model .............................................................................................................. 74
STUDY 2 ................................................................................................................................. 825. METHODOLOGY .......................................................................................................... 82
5.1. Sample ................................................................................................................................... 825.2. Attributes’ selection ............................................................................................................... 825.3. Procedure ............................................................................................................................... 82
6. RESULTS ....................................................................................................................... 837. CONCLUSIONS AND DISCUSSION ........................................................................... 85
CHAPTER IV – Conclusions, limitations and further research .............................. 88General conclusions ............................................................................................................ 89Theoretical contributions .................................................................................................... 90Managerial implications ...................................................................................................... 91Limitations and further research ......................................................................................... 91
REFERENCES .............................................................................................................. 93
REFERENCES (1) .............................................................................................................. 93REFERENCES (2) ............................................................................................................ 103REFERENCES (3) ............................................................................................................ 109
APPENDIX .................................................................................................................. 116

xi
TABLES TABLE 1 – RESUME OF THE THREE PAPERS .................................................................................................... 5TABLE 2: STRUCTURE OF INSURANCE DISTRIBUTION CHANNELS IN 2013 (PORTUGUESE ASSOCIATION OF
INSURANCE, 2014) ............................................................................................................................... 9TABLE 3: ATTRIBUTES AND CORRESPONDING LEVELS ................................................................................. 23TABLE 4: FINAL CLUSTER CENTERS ............................................................................................................ 26TABLE 5: ITERATION HISTORY ..................................................................................................................... 26TABLE 6: DISTANCES BETWEEN FINAL CLUSTER CENTERS .......................................................................... 27TABLE 7: ANOVA ....................................................................................................................................... 27TABLE 8: PART-WORTHS BASED ON FINANCIAL INVOLVEMENT ................................................................... 29TABLE 9: TESTS OF NORMALITY .................................................................................................................. 29TABLE 10: PART-WORTHS OF LOYAL VS. NONLOYAL CUSTOMERS ............................................................... 30TABLE 11: PART-WORTHS’ COMPARISON BETWEEN LOYAL AND NON-LOYAL CUSTOMERS ......................... 31TABLE 12: TESTS OF NORMALITY ................................................................................................................ 31TABLE 13: CHARACTERISTICS OF THE SIMULATED PRODUCTS ..................................................................... 33TABLE 14: TESTS OF NORMALITY ................................................................................................................ 34TABLE 15: FISHER’S EXACT TEST ................................................................................................................ 34TABLE 16: TRANSACTION COST REDUCTION FROM INTERMEDIARIES (ROSE, 1999) .................................... 47TABLE 17: ORDERS OF ATTRIBUTES’ PRESENTATION ................................................................................... 50TABLE 18: IMPORTANCE OF EACH ATTRIBUTE BY SERIES ............................................................................ 53TABLE 19: TESTS OF NORMALITY FOR PRICE ............................................................................................... 53TABLE 20: KRUSKAL-WALLIS TEST FOR PRICE ............................................................................................ 53TABLE 21: TESTS OF NORMALITY FOR INSURER ........................................................................................... 54TABLE 22: KRUSKAL-WALLIS TEST FOR INSURER ....................................................................................... 55TABLE 23: TESTS OF NORMALITY FOR BUNDLED STRATEGY ........................................................................ 56TABLE 24: KRUSKAL-WALLIS TEST FOR BUNDLING STRATEGY ................................................................... 56TABLE 25: TESTS OF NORMALITY FOR INTERMEDIARY’S RECOMMENDATIONS ............................................ 57TABLE 26: KRUSKAL-WALLIS TEST FOR INTERMEDIARY’S RECOMMENDATIONS ........................................ 57TABLE 27: SIMULATIONS ............................................................................................................................. 58TABLE 28: TRANSACTION COST REDUCTION FROM INTERMEDIARIES (ROSE, 1999) .................................... 70TABLE 29: STRUCTURE OF INSURANCE DISTRIBUTION CHANNELS IN 2013 (“ASSOCIAÇÃO PORTUGUESA DE
SEGUROS”, I.E., PORTUGUESE ASSOCIATION OF INSURANCE, 2014) .................................................. 71TABLE 30: DESCRIPTIVE ANALYSIS ............................................................................................................. 74TABLE 31: TOTAL VARIANCE EXPLAINED .................................................................................................... 75TABLE 32: KMO AND BARTLETT’S TEST .................................................................................................... 75TABLE 33: PATTERN MATRIX ...................................................................................................................... 77TABLE 34: FACTOR CORRELATION MATRIX ................................................................................................ 77TABLE 35: MEASUREMENT INFORMATION ................................................................................................... 79

xii
TABLE 36: REGRESSION WEIGHTS ............................................................................................................... 80

xiii
FIGURES FIGURE 1: DF UNDER ACTUAL CONDITIONS ................................................................................................. 36FIGURE 2: DF UNDER PRICE BUNDLING CONDITIONS ................................................................................... 36FIGURE 3: CAUSAL MODEL .......................................................................................................................... 81FIGURE 4: PERCEPTUAL MAP FROM MULTIDIMENSIONAL UNFOLDING (MDU) ........................................... 83FIGURE 5: CUSTOMERS’ PREFERENCES AND THE DYNAMICS OF THE INSURANCE MARKET .......................... 84

xiv
GRAPHS GRAPH 1: IMPORTANCE OF ATTRIBUTES ...................................................................................................... 25GRAPH 2: IMPORTANCE OF ATTRIBUTES ...................................................................................................... 51

1
INTRODUCTION
RESEARCH SCOPE
The insurance sector plays a major role in leveraging the economies of many countries,
providing stability and confidence in markets. Yet, the number of insurance studies
from the perspective of customers is very little, especially in services marketing
literature.
Premium is one of the most important elements in the insurance market (Barroso and
Picón, 2012; Rai and Medha, 2013) but literature does not identify the concrete
importance it has for customers.
Pricing strategies has been a much-discussed issue in the management, marketing and
economy literature (Goldsmith and Newell, 1997; Ramirez and Goldsmith, 2009; Li,
Green, Farazmand, and Grodzki, 2012; Roy, 2012; Brophy, 2013a). Bundling strategies
are very important in terms of business management, being price bundling strategies or
product bundling strategies (Ferrell and Hartline, 2005, p. 286; Rao and Kartono, 2009,
p. 15; Gerdeman, 2013; Brito and Vasconcelos, 2015).
Involvement is another important element for customers (Zaichkowsky, 1988; Datta,
2003; Russell-Bennett, McColl-Kennedy and Coote 2007), whether with advertisements
(Krugman, 1977), products (Hupfer and Gardner, 1971), with purchase decisions
(Clarke and Belk, 1978), or pricing decisions (Rao and Kartono, 2009, p.30).
Insurance distribution channels are quite particular in the insurance sector. Banks,
postal, brokers, intermediaries and insurers are the main distribution channels in
Portugal (Portuguese Association of Insurance, 2014). However, insurance marketing
literature does not seem very clear about how insurance salesperson should approach
customers. For example, the order in which products’ characteristics are presented to
customers play an important role in terms of sales optimization (Buda and Zhang, 2000;

2
Gatzert, Huber and Schmeiser, 2010; Horgarth and Einhorn, 1992). Also,
intermediaries’ recommendation can strongly influence customers’ behaviors
(O’Loughlin and Szmigin, 2007; Eckardt and Rathke-Doppner, 2010; Robson and
Sekhon, 2011; Brophy, 2013a). Therefore, the supply chain management plays an
important role in the insurance industry, namely, in customers’ satisfaction and
preferences. Furthermore, customers’ satisfaction is one of the most studied concepts in
management and marketing literature (Bernhardt, Donthu and Kennet, 2000;
Edvardsson, Johnson, Gustafson and Strandvik, 2000; Orsingher, Valentini and Angelis,
2010), being important to investigate the role of intermediaries in customers’
satisfaction.
METHODOLOGY
In this investigation, a mixed approach based on qualitative and quantitative
methodologies was used. In order to identify the most important characteristics of the
insurance industry, three focus groups were conducted. Two focus groups composed by
eighteen (18) auto insurance consumers of the B2C market were conducted and third
focus group composed by six insurance intermediaries (B2B) were conducted. The
quantitative approach was used for the other analyzes.
Concerning chapter 1, several quantitative methods were used. Specifically, Conjoint
Analysis was performed in order to measure the concrete importance of key attributes of
the insurance business, such as premium, brand (insurer), bundling strategy and
intermediaries’ recommendation, as well as the relationship between attributes and
consumer price sensitivity. Regarding market segmentation, a two stage post-hoc
segmentation was performed through Cluster Analysis. Finally, the traditional formula
to estimate price elasticity of demand was used.
In chapter 2, Conjoint Analysis and bivariate methods such as Shapiro-Wilk and
Kruskal-Wallis were performed in order to study the importance of the strategic order of
products’ attributes presentation in the insurance market.

3
In chapter 3, a structure equation modeling (SEM) was developed in order to understand
the specific impact of intermediaries and insurers on consumer satisfaction.
Multidimensional Unfolding was performed in order to compare the structure of
consumers’ preferences and the insurance supply chain process.
This brief methodological presentation is only a summary of the methods and
techniques employed in data analyzes. A detailed and specific description is presented
in each of the papers (chapters 1, 2 and 3) of this thesis.
STRUCTURE
Chapter 1 analyzes the determinants of price sensitivity in the insurance sector, trying to
fill this gap in the literature. This chapter also analyzes the importance that insurance
customers give to premiums, insurers, intermediary recommendations, and bundling
strategies. This study shows how it is possible to decrease price sensitivity.
Chapter 2 focuses on identifying the most strategic order of products’ attributes in the
insurance sector. Literature has highlighted the effects of using different attributes’
order of presentation. However, literature does not provide empirical results of this
issue in the insurance sector. Primacy and recency effects were detected, as well as a
transfer effect related with the level of importance of attributes that precede and succeed
attributes. But more important, it is possible to identify a specific attribute presentation
order that decreases price importance and increases the impact of bundling strategies
and intermediary’s recommendation.
Chapter 3 emphases the structure of the insurance market from the customers’
perspective, both in terms of customers’ satisfaction, as well as in the purchase
decision-making process.

4
Chapter 4 presents general conclusions, theoretical implications in terms of Marketing
and management, managerial implications concerning the insurance sector. Limitations
regarding the research are also presented, as well as some further research questions.

5
Paper 1 Paper 2 Paper 3 General implications
Purpose This paper investigates the importance that
insurance customers give to premiums, insurers,
intermediary recommendations, and bundling
strategies. The relationship between attributes and
consumer price sensitivity is also studied.
Sales management plays an important role in
firms’ profit. The main goal of this work is to
identify the right moment to present price to
insurance customers, as well as the insurer
bundling strategy and intermediary’s
recommendation.
Insurance market has enormous churn rates because customers’
purchase decision-making process and claims management relies
heavily on intermediaries. The purpose of this study is to investigate
the role played by intermediaries in customer’s satisfaction, as well as
in the preferences of customers regarding the purchase decision-
making process.
Intermediaries play a central role in
the insurance market dynamics and
insurance supply chain, as well as in
customers’ satisfaction.
For intermediaries prefer particular
insurers, they must be aware of the
suggestions and feedback from
intermediaries. This would be
especially important in terms of
claims management services.
Price bundling increases insurances
and intermediaries’ revenues and
profits. So, they should me used
more often.
In order to decrease the importance
of premium, salespeople should
present first the insurer, followed by
the bundling strategy, the
intermediary’s recommendation and,
finally, the premium.
Methodology Conjoint Analysis was performed in order to study
the importance of the attributes. Cluster analysis
was applied to segment the market.
Conjoint Analysis was applied in order to
measure attributes’ importance of each series.
Kruskal-Wallis test was performed in order to
study possible effects of order of product
attribute presentation.
Structural Equation Modeling was used in order to study the impact of
insurers and intermediaries in consumers’ satisfaction. The
Multidimensional Scaling unfolding model was used to analyze
consumer preferences.
Findings Price sensitivity is affected by the level of purchase
involvement, bundled discounts, and brand loyalty.
Also, brand loyalty has a strong influence on
customer acceptance of bundled discounts. Price
bundling increases a firm's revenues and profits.
Primacy and recency effects were detected, as
well as a transfer effect related with the level
of importance of attributes that precede and
succeed attributes.
Intermediaries play a key role in the insurance market, concretely, in
customers’ satisfaction, in the management of customers’ claims, and
in the purchasing process (premium acceptance).
Implications There is very little evidence regarding studies on
price sensitivity in the insurance sector, mostly
because, in many countries, premiums are strongly
regulated. This study shows how it is possible to
decrease price sensitivity.
Salesperson can improve their approach to
customers, decreasing the importance given to
price and increasing the positive impact of
bundling strategies and intermediary’s
recommendation in sales.
Intermediaries play a key role in the insurance market, concretely, in
customers’ satisfaction, in the management of customers’ claims, and
in the purchasing process (premium acceptance).
Originality The study contributes to the service marketing
literature and marketing of the insurance sector by
providing empirical evidence of the impact of price
bundling on insurance customer sensitivity, with the
use of a methodological and experimental approach.
It was possible to identify a specific order of
attributes presentation in the insurance sector,
considering other attributes that not only the
price.
This study analyzes the insurance supply chain management including
three different players: i) customers; ii) intermediaries; iii) insurers.
Consumers’ preferences in terms of purchasing behavior and
satisfaction rely more in intermediaries than in insurers. An original
and brief questionnaire to measure insurance customers’ satisfaction is
tested with acceptable psychometrics properties. Findings can be used
by insurers and intermediaries to improve the efficiency of the
insurance market supply chain.
TABLE 1 – RESUME OF THE THREE PAPERS

6
CHAPTER I – DETERMINANTS OF CUSTOMER PRICE
SENSITIVITY: AN EMPIRICAL ANALYSIS

7
ABSTRACT (1)
Purpose: Consumer price sensitivity has become a major issue over the past few
decades. This paper investigates the importance that insurance customers give to
premiums, insurers, intermediary recommendations, and bundling strategies. The
relationship between attributes and consumer price sensitivity is also studied.
Methodology: To calculate the importance of attributes and part-worth utilities, we
performed a Conjoint Analysis with Full Profile. To segment the market, we performed
a two-stage Cluster Analysis. The traditional formula for estimating price elasticity of
demand was also used.
Findings: Price sensitivity is affected by the level of purchase involvement, bundled
discounts, and brand loyalty. Also, brand loyalty has a strong influence on customer
acceptance of bundled discounts. Price bundling increases a firm's revenues and profits.
Theoretical implications: There is very little evidence regarding studies on price
sensitivity in the insurance sector, mostly because, in many countries, premiums are
strongly regulated. This study shows how it is possible to decrease price sensitivity.
Practical implications: Insurers and intermediaries can benefit from price bundling
strategies in order to increase sales and profit.
Originality: The study contributes to the service marketing literature and marketing of
the insurance sector by providing empirical evidence of the impact of price bundling on
insurance customer sensitivity, with the use of a methodological and experimental
approach.
Keywords: Insurance sector, Consumer preferences, Market elasticity of demand, Price
sensitivity, Bundling strategies.

8
1. INTRODUCTION
In late 2007, a subprime crisis was triggered in the United States of America, creating
one of the most severe financial crises. Globalization quickly brought the crisis to the
European economies, creating problems in financial markets and enormous mistrust due
to the uncertainty and incapacity to develop medium- to long-term action plans.
In this sense, the insurance sector plays a major role in leveraging the economies of
many countries, providing stability and confidence in markets (e.g., buying sovereign
debt). In the specific context of the industries operating within services (e.g., utilities,
healthcare, financial services, insurance, etc.), the relationship between consumers and
organizations is very dynamic (Bolton and Lemon, 1999).
Many factors influence the buying decisions of customers and price sensitivity in the
insurance industry, including premiums (Barroso and Picón, 2012; Rai and Medha,
2013), intermediary recommendations (O’Loughlin and Szmigin, 2007; Robson and
Sekhon, 2011; Brophy, 2013a), involvement (Zaichkowsky, 1988; Datta, 2003), and
pricing strategies such as price bundling (Weston, 2007, as cited in Brophy, 2014b).
Related to premiums, Barroso and Picón (2012) found that the price paid for insurance
products is very important with regard to a Spanish insurance customer’s perception of
time, money, or the effort involved in switching. Related to that, Rai and Medha (2013)
found that premiums play an important role in the loyalty of insurance customers.
Along these lines, the present article aims to measure the importance that Portuguese
insurance customers give to premiums.
Related to insurance distribution, an intermediary's recommendation plays an important
role in insurance sales (see O’Loughlin and Szmigin, 2007; Robson and Sekhon, 2011;
Brophy, 2013a). Because in Portugal insurance intermediaries are market leaders in
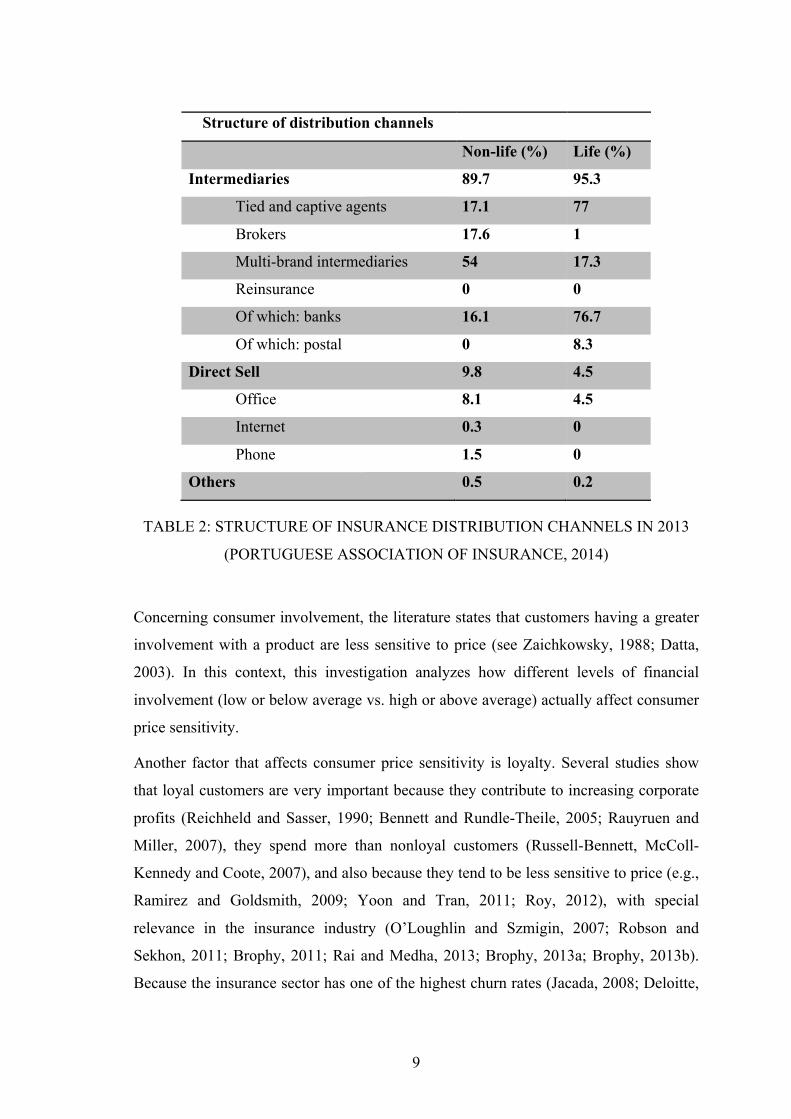
terms of sales (see Table 2), this investigation analyzes the importance of intermediary
recommendations in a customer's buying decision process.
9
Structure of distribution channels
Non-life (%) Life (%)
Intermediaries 89.7 95.3
Tied and captive agents 17.1 77
Brokers 17.6 1
Multi-brand intermediaries 54 17.3
Reinsurance 0 0
Of which: banks 16.1 76.7
Of which: postal 0 8.3
Direct Sell 9.8 4.5
Office 8.1 4.5
Internet 0.3 0
Phone 1.5 0
Others 0.5 0.2
TABLE 2: STRUCTURE OF INSURANCE DISTRIBUTION CHANNELS IN 2013
(PORTUGUESE ASSOCIATION OF INSURANCE, 2014)
Concerning consumer involvement, the literature states that customers having a greater
involvement with a product are less sensitive to price (see Zaichkowsky, 1988; Datta,
2003). In this context, this investigation analyzes how different levels of financial
involvement (low or below average vs. high or above average) actually affect consumer
price sensitivity.
Another factor that affects consumer price sensitivity is loyalty. Several studies show
that loyal customers are very important because they contribute to increasing corporate
profits (Reichheld and Sasser, 1990; Bennett and Rundle-Theile, 2005; Rauyruen and
Miller, 2007), they spend more than nonloyal customers (Russell-Bennett, McColl-
Kennedy and Coote, 2007), and also because they tend to be less sensitive to price (e.g.,
Ramirez and Goldsmith, 2009; Yoon and Tran, 2011; Roy, 2012), with special
relevance in the insurance industry (O’Loughlin and Szmigin, 2007; Robson and
Sekhon, 2011; Brophy, 2011; Rai and Medha, 2013; Brophy, 2013a; Brophy, 2013b).
Because the insurance sector has one of the highest churn rates (Jacada, 2008; Deloitte,
10
2012; Soeini and Rodpysh, 2012), the present paper also investigates and compares the
price sensitivity of loyal customers vs. nonloyal consumers.
Finally, the present paper also explores the possible benefits of implementing a price-
bundling strategy in the insurance sector; specifically, combining home insurance
(noncompulsory) with auto insurance (compulsory).
Therefore, the main contribution of this study is to bridge a gap in the service marketing
literature related to the insurance industry that is less studied, i.e., consumer price
sensitivity. For example, the role played by customer loyalty behaviors or even the role
of bundling strategies in consumer price sensitivity is a less-studied issue in the
insurance industry. One of the reasons leading to the low number of studies that focus
on this issue is the strict regulation insurance premiums (especially motor insurance) in
some countries (see Cummins and Tennyson, 1992; Tennyson, 1997; Weiss, Tennyson
and Regan, 2010; Derrig and Tennyson, 2011; Brophy, 2012).
Regulation of premiums for automobile insurance
Automobile insurance is compulsory in countries such as the United States of America,
United Kingdom, Germany, France, Spain, and Portugal. This being the case, and using
the words of Weiss, Tennyson, and Regan (2010):
Automobile insurance is a compulsory purchase for most drivers in the United States
and represents a significant expense for many. Partly because of this, many states
regulate automobile insurance prices. Although there are several stated goals of
automobile insurance regulation, the objective of much rate regulation is premium
affordability.
In this sense, regulators intend to achieve adequate automobile insurance rates, i.e.,
“that insurance is readily available in the market, but not so high that insurance is
unaffordable to drivers” (Weiss, Tennyson, and Regan, 2010). However, it is frequent
that this regulation process produces a significant adverse impact on insurance costs
(see Tennyson, Weiss, and Regan, 2002; Derrig and Tennyson, 2011). But, according to

11
Llewellyn (1999, as cited in Brophy, 2014a), the reasons for regulation of financial
services are as follows:
• To sustain systemic stability; �
• To maintain the safety and soundness of financial institutions; and �
• To protect the consumer. �
In this context, the level of auto insurance premium regulation strongly influences an
insurer's degree of freedom when determining premium levels. However, the insurance
sector in Portugal does not have such strict regulations. Only recently, the former
Portuguese Institute of Insurance changed its designation to Portuguese Insurance and
Pensions Funds Supervision Authority (Autoridade de Supervisão de Seguros e Fundos
de Pensões). This change to “supervisory authority” is being perceived by insurers and
intermediaries as an indication of the power of regulation, because of the severe
financial crisis of the last years. This supervisory authority bases its regulation on
having a minimum premium, to maintain the safety and soundness of the financial
institutions, i.e., the insurance industry as a whole.
In short, the objectives of this paper are twofold:
• To measure the importance of certain attributes on the global purchasing
behavior process of insurance customers (studied attributes are premiums,
insurers, intermediary recommendation, and price-bundling strategies). This is a
very important issue for actuaries, as they have to understand the importance or
contribution of a specific goal to the overall decision (Brockett and Xia, 1995).
• To study the effect of bundling strategies on retention of customers, on the one
hand, and on attracting new customers, on the other.

12
2. THEORETICAL FRAMEWORK
2.1. PRICING AND PRICE SENSITIVITY
Pricing has been a much-discussed subject over the past few decades for two reasons.
First, because of its direct impact on the revenues of enterprises; and second, because it
is difficult to estimate (Ferrell and Hartline, 2005). On this last issue, not every
consumer is willing to pay the same price for a given product, which increases the
difficulty of setting the “right price” (Ramirez and Goldsmith, 2009).
Consequently, it is important to understand how consumers react to different prices and
which are the relevant factors affecting those reactions. According to Ferrell and
Hartline (2005), pricing strategy involves both market acceptance and the overall profits
of companies. The more information managers have about ratings and the reactions of
consumers over the price, the higher the success in responding to the goals of corporate
profitability (Ramirez and Goldsmith, 2009). Two important concepts arise in this
context as follows:
• Price elasticity is an aggregate measure related to the market as a whole and
does not inform how individuals or specific groups (clusters) react to a certain
price. Economists consider price elasticity an essential element (Ramirez and
Goldsmith, 2009).
• Price sensitivity reflects how consumers feel about paying a certain price for a
product. In addition, individual reactions to price are very useful for marketing
purposes (Goldsmith and Newell, 1997).
Managers need detailed information about the elements that influence consumer price
sensitivity in order to understand how to increase product attractiveness without
reducing the selling price (Ramirez and Goldsmith, 2009) or to be able to compensate
for a price increase with a reinforced mix of alternative attributes valued by consumers.
Ramirez and Goldsmith (2009) propose a model to measure price sensitivity based on
four elements as follows:

13
I. The perceived similarity between brands
Perceived similarity between brands can be defined as the consumers’ global perception
that differences between products of different brands are small (Iyer and Muncy, 2005).
The more different a brand is perceived, the more consumers are willing to pay more for
a product of a certain brand (the opposite also occurs). In this context, consumers
become more sensitive to price (less willing to pay a price) when they perceive few
differences between brands (Light, 1997).
There is no literature that shows whether this element is critical in the case of the
Portuguese insurance sector. Also, because auto insurance is compulsory and there is a
standard core (after decree-law no. 72/2008, April 16th), it seems that insurer brands are
perceived with great similarity.
II. Innovative consumers
Innovative consumers always want the latest products (Goldsmith and Hofacker, 1991)
and they also use products more frequently, researching a greater amount of information
about a product category (Goldsmith, 2000; Goldsmith, 2002). Several studies show a
negative correlation between innovation and price sensitivity (Goldsmith and Newell,
1997).
In the context of this study, the level of innovation of auto insurance in Portugal is
virtually nonexistent. In this regard and in order to maximize the parsimony of the
methodology used, the authors decided not to incorporate this element in this
investigation. Also, innovation does not seem to be significant in auto insurance
because there is an automatic repurchase due to the compulsory nature of this product.

14
III. Involvement with the product
The more involved consumers are with a product, the less sensitive they are about price
(Zaichkowsky, 1988; Datta, 2003). However, involvement is a multidimensional
construct, based on cognitive and affective dimensions (Richins, Bloch, and McQuarrie,
1992). A person can present different kinds of involvement as follows:
• With advertisements (Krugman, 1977);
• With products (Hupfer and Gardner, 1971);
• With purchase decisions (Clarke and Belk, 1978).
Involvement can also be analyzed from a different level, specifically between customers
and firms (Goodman, Fichman, Lerch and Snyder, 1995). Also, highly involved
individuals invest more time and energy in their relationship with a firm. According to
Knox and Walker (2003), customer involvement affects the final decision during the
purchasing procedure, and the more involved customer tends to be more loyal.
According to Russell-Bennett, McColl-Kennedy, and Coote (2007) “the level of
involvement determines the level of decision importance in the purchasing process, and
business customers are likely to display attitudinal loyalty for high involvement
purchases”. For example, “price endings” can decrease high-price perception (see
Shoemaker, Mitra, Chen and Essegaier, 2003; Chang and Chen, 2014; Choi, Li,
Rangan, Chatterjee and Singh, 2014). According to Rao and Kartono (2009, p.30),
customer involvement is also related to the degree of customer involvement with the
pricing decision:
When firms know where their customers come from and are more confident about their
projected sales figures, they can more easily set a price that is more acceptable to
customers and at the same time minimizes risks to profitability. Accordingly, in terms of
respondent characteristics, the higher the degree of involvement of the respondent with

15
the pricing decision, the more likely it is for the firm to practice perceived value pricing,
since this method requires a more flexible approach to pricing.
In this study, authors use this measure of customer involvement, concretely, the
financial involvement of customers with pricing decisions.
Hypothesis 1: Customers with a higher financial involvement with products are
less price sensitive.
IV. Brand loyalty
Jacoby (1975) defines loyalty as a higher probability of a consumer purchasing products
from a particular brand, resulting in consistent purchase behavior over time (see also
Dick and Basu 1994; Rauyruen and Miller, 2007). This scenario affects both sales
volumes of companies as well as profits (Bennett and Rundle-Theile, 2005). Customer
retention is more positive to profits than market share or even scale economies
(Reichheld and Sasser, 1990). On the contrary, nonloyal consumers tend to switch
brands as a result of either the desire for variety or the chase for promotional incentives
(Yoon and Tran, 2011).
Several studies show that loyal customers are less sensitive to price (Brown, 1974;
Krishnamurthi and Raj, 1991; Yu and Dean, 2001; Bloemer and Odekerken-Schröder,
2002; Rowley, 2005; Ibrahim and Najjar, 2008; Gázquez-Abad and Sánchez-Pérez,
2009; Ramirez and Goldsmith, 2009; Yoon and Tran, 2011; Li, Green, Farazmand, and
Grodzki, 2012; Roy, 2012). Loyal insurance customers are also less sensitive to price
(O’Loughlin and Szmigin, 2007; Robson and Sekhon, 2011; Brophy, 2011; Rai and
Medha, 2013; Brophy, 2013a). As mentioned by Yoon and Tran (2011), loyal
consumers are insensitive to the preferred brand’s price.
According to Reichheld and Teal (1996), loyal customers are important in terms of
customer relationship activities, value creation programs, and marketing strategies.
Also, loyal customers are likely to purchase more frequently, try the firms’ other
products, and bring new customers to the firm (Li et al., 2012).

16
In this sense, the authors investigated whether loyal insurance customers really are less
sensitive to price. In this research and based on the feedback provided by insurance
professionals, customers who remained customers for three years could be considered
loyal.
Hypothesis 2: Loyal customers are less price sensitive.
In this context, this study analyzes whether a price-bundling strategy can decrease
consumer price sensitivity.
2.2. BUNDLING
There are many other elements that affect consumer price sensitivity and the market
share of brands (see Tung, Capella and Tat, 1997). So, will discounts reduce consumer
price sensitivity? From the perspective of retailers, revenues are more “closely linked to
overall category sales than to the sales of any particular brand” (Raju, 1992). According
to Schultz (1990, as cited in Raju, 1992), many of the promotional programs that lead to
brand switching are of little use to the retailer. Still, bulky categories or categories with
high competitiveness exhibit significantly lower variability in sales (Raju, 1992). This
could probably be the case in the insurance industry. However, there are different kinds
of price promotions such as:
• The magnitude of the discounts (see Golabi, 1985; Assunção, and Meyer, 1990);
and
• The frequency of the discounts (see Assunção and Meyer, 1990).
Adams and Yellen (1976) define bundling as the act of selling goods in packages. Later,
Guiltinan (1987) added to the definition of bundling the idea of selling products and
services in one package for a “special price.” The basic principle of bundling strategies
comes from pioneering works of mental accounting (see Thaler, 1985) as well as

17
framing effects (Kahneman and Tversky, 1979). According to Sheikhzadeh and Elahi
(2013), bundling strategies are mainly used in three situations:
• As a tool for price discrimination;
• As a cost-saving mechanism; and
• As a means of entry deterrence.
Many sectors are using bundling strategies, such as telecoms, machine tools, electronic
components, chemical substances, and travel companies bundling flights, rental cars,
accommodations, and events (to Johnson, Herrmann and Bauer, 1999). It is a strategy
that is increasingly utilized (Dolan and Simon, 1996; Naylor and Frank, 2001).
Stremersch and Tellis (2002) presented two different bundling strategies:
a) Product bundling – based on the principle of products that are complementary.
For example, Microsoft sells the Microsoft Office software as a bundle,
including Word, Excel, and PowerPoint (Gerdeman, 2013). In the economic
literature the terms frequently used are “tying strategy” or “tying arrangements”
(see Ferrell and Hartline, 2005, p. 286).
b) Price bundling – selling at least two products separately without integration (see
also Rao and Kartono, 2009, p. 15). As mentioned by Brito and Vasconcelos
(2015), bundled discounts provide purchasers with the opportunity to pay less
for a bundle than the sum of the prices of the bundled products when purchased
separately. Consumers are therefore faced with the choice between meeting all
their requirements by buying a package at a discounted price, or purchasing
items individually à la carte.

18
In this context, Guiltinan (1987) presents two different types of price bundling:
i. Mixed-joint bundling – there is a reduction when at least two
products are purchased simultaneously but customers do not
know to which one the reduction has been applied (see also
Avlonitis and Indounas, 2006; Gilbride, Guiltinan and Urbany,
2008).
ii. Mixed-leader bundling – there is a reduction on a leader product's
price if one customer buys another product (see also Gilbride,
Guiltinan and Urbany, 2008).
As pointed out by to Johnson, Herrmann and Bauer (1999), bundled discounts increase
consumer willingness to recommend and repurchase intention, i.e., loyalty behaviors.
According to Harris and Blair (2012), from the retailer perspective, if consumers fail to
process information about a bundle discount, optimal bundle pricing may be affected.
So, why in our study did we choose car insurance as a more relevant product over home
insurance? According to Yadav (1994), consumers evaluate bundled products based on
an anchoring and adjustment model. In practice, customers anchor their evaluations by
analyzing which product is the most important, and then they adjust their preference
considering the less important product(s). In the specific case of the Portuguese
insurance sector, car insurance is the product most relevant to customers (APS, p.4,
2013) and it is compulsory. In this context, insurers make a great effort regarding the
sale of home insurance. Similarly, Weston (2007, as cited in Brophy, 2014b) used motor
and health insurance as the anchor products, and home insurance had a significant
discount.
Therefore, the authors argue that bundling strategies could play an important role as an
integrated strategy (see O’Loughlin and Szmigin, 2005), as well as increasing sales,
especially to loyal customers. As Berry (2000, as cited in O’Loughlin and Szmigin,
2005) indicated, service companies should consciously pursue distinctiveness in
performing and communicating service, connect emotionally with customers and

19
internalize the brand for service providers in order to build retention and loyalty with
customers. Berry also states that although the study of financial services has been more
studied in the last few decades, it continues to pose challenges for marketers as an
academic area of research.
In this context, the authors argue that bundling strategies allow insurers and
intermediaries to increase customer retention (loyalty) by increasing their satisfaction.
Morwitz, Greenleaf, and Johnson (1998) analyzed the effect of prices on price
perceptions and repurchase intentions.1 For other examples in this field see Brough and
Chernev (2012). It is also interesting to note that consumers present different reactions
between partitioned and nonpartitioned or combined prices (Guiltinan, 1987;
Chakravarti, Rajan, Pallab, and Srivastava, 2002; Janiszewki and Cunha, 2004; Xia and
Monroe, 2004; Bertini and Wathieu, 2008).
This paper then also studies the following additional hypotheses:
Hypothesis 3: Loyal customers are more sensitive to price bundling strategies than
nonloyal customers.
Hypothesis 4: Partitioned prices have better acceptance than combined prices.
1 Morwitz, Greenleaf, and Johnson (1998) presented products to consumers as follows: i) combined price – telephone for $82.90, including shipping and handling; ii) partitioned price – telephone for $69.95 plus $12.95 surcharge for shipping and handling. The results showed that when using partitioned price, repurchase intentions were higher and price perceptions were lower.

20
3. METHODOLOGY AND DATA
3.1. SAMPLE
According to the Portuguese Association of Insurance (APS, 2013), in 2013, there were
79 insurance companies operating in Portugal, 11,180 employees, and 24,624 insurance
intermediaries. The top 10 most representative brands operating in Portugal are
Fidelidade-Mundial, Ocidental Vida, BES Vida, Santander Totta Seguros, BPI Vida,
Império Bonança, Allianz Portugal, Açoreana, AXA Portugal, and Tranquilidade.
Data were collected from 455 insurance customers (60.2% men; 39.8% women2), ages
between 19 and 80 years (mean=43.79; standard deviation=12.159). A simple random
sample was performed and the sample error was ±4.59% (p=q=50), with a confidence
level of 95% (k=2 sigma). Analyzing the sample by age group:
• 11.6% of the sample was between 18 and 29 years old;
• 43.7% was between 30 and 44 years old;
• 37.7% was between 45 and 64 years old;
• 5.1% was between 65 and 74 years old;
• 1.9% was 753 years old or more.
3.2. DATA COLLECTION
The procedure for collecting data for this study encompassed two important stages as
follows:
• Stage 1: The information was collected through personal interviews, using an ad
hoc questionnaire developed specifically for this research. Interviews took
approximately 20 minutes each to be completed and they were conducted during
July 2013. These data were used to test hypotheses 1, 2 and 3.
2 According to the European Commission (2004, 2011), there should be no gender discrimination in insurance pricing. 3 In Portugal, there is no age limit to buy car insurance. The unique condition is to have a driving license.

21
• Stage 2: In order to test hypothesis 4, we returned to 42 of the 455 respondents
of Stage 1, asking them if they would buy a bundled product (price bundling).
From those:
i. We presented a bundling strategy with partitioned price to 22
individuals.
ii. And a combined price to 20 other individuals.
In both stages, the authors received the support of several multibrand insurance
intermediaries as far as data collection was concerned. In addition, and in order to
prevent any bias in data, we trained all the managers responsible for collecting data,
especially concerning Conjoint Analysis. This way, (multibrand) intermediaries knew
how to correctly collect data through a simulated sale with Conjoint Analysis.
3.3. ATTRIBUTES’ SELECTION
In order to select the most relevant attributes for Portuguese insurance customers, we
performed a pilot study based on a qualitative approach (we conducted three focus
groups with both customers and intermediaries). The results obtained show that “the
intermediaries’ recommendation,” “price,4” and “insurer/brand” were the most relevant
attributes for Portuguese customers.
3.4. PROCEDURE
A Conjoint Analysis with Full Profile (FP) was performed in order to achieve the
conditions most similar to a selling environment (other investigations used the same
logic, e.g., Gareth, Levin, Chakraborty, and Levin, 1990). According to Green and
Srinivasan (1978), Conjoint Analysis is defined as “a decompositional method that
estimates the structure of a consumer’s preferences given his/her overall evaluations of
a set of alternatives that are previously specified in terms of levels of different
attributes”. Conjoint analysis is a very interesting technique for evaluating and 4Respondents were informed about covers associated with each level of the attribute premium.
22
analyzing consumer preferences regarding products or services (Varela, Picón and
Braña, 2004; Dominique-Ferreira, Rial and Varela, 2012).
Authors considered the possibility of using a choice-based conjoint. However,
intermediaries who participated in data collection indicated that the FP option would
mimic in a better way the decision-making process of customers. Also, other studies
support good performance from FP predicting consumer preferences (Molin, Oppewal,
and Timmermans 2000; Oppewal and Klabbers, 2003). In the specific case of pricing
studies, Conjoint Analysis is one of the most popular methods in marketing for
measuring willingness to purchase (Jedidi and Jaspal, 2009, p. 42).
Therefore, the subjects were asked to sort the cards based on their preferences. This
procedure is called Full Profile, with simulated stimuli and sort cards – sequence. The
selected attributes were:

23
Attribute Levels
Recommended by intermediaries • Yes
• Opinion omitted
Price (Premium)5 6 • 150€ - Standard product through regulation
(after the decree-law no. 72/2008, April 16th)
• 200€ - the same coverage as the option of
150€ and vehicle occupants insurance
• 250€ - the same coverage as the option of
200€ and auto glass insurance
• 300€ - the same coverage as the option of
250€ and theft coverage
Brand (insurer) • Brand A (Fidelidade-Mundial)
• Brand B (Açoreana)
• Brand C (Allianz)
• Brand D (Tranquilidade)
Price bundling
Home insurance with a promotional
discount (for just 30€)
• Yes
• No
TABLE 3: ATTRIBUTES AND CORRESPONDING LEVELS
To achieve the Conjoint Analysis, we selected these four attributes with different levels
for each (2×4×4×2). From the 64 possible combinations, we used an orthogonal
fractional factorial design, selecting 16 and two holdout cards, which were eventually
used in the data collection (with an Orthoplan procedure of the SPSS software). We
built 18 cards, each one representing one of the 18 combinations of attribute levels.
Because we performed a post hoc segmentation (see Green, 1977; Wind 1978; Picón,
Varela, and Real, 2005), the Clustering Algorithm was applied to the output of the
Conjoint Analysis. Therefore, we carried out a two-stage clustering, starting with a
hierarchical method (Euclidean distance) and Ward’s (1963) linkage method (the most 5 Premium includes salesperson compensation (national standard) and standard claims handling costs 6 No deductible (except for the theft coverage)

24
popular method in the social sciences; see Picón, Varela, and Real, 2005, p. 430). Then
we used the iterative k-means clustering, which is considered more reliable than the
conventional single-stage procedures (see Picón, Varela, and Real, 2005).
3.5. METHODS AND RESULTS
The study of consumer preferences was performed through Conjoint Analysis. These
results are presented in Section 4.1. Market segmentation was performed through
Cluster Analysis and analysis of variance (ANOVA), presented in Section 4.2.
Testing of Hypotheses 1, 2, and 3 was performed using the Mann-Whitney U test,
whereas testing of Hypothesis 4 was performed using Fisher’s Exact Test (due to
sample size). Consequently, consumer price sensitivity is the dependent variable.
In Section 4.3.2., the authors used the Variation Attributed to the Change (based on the
ideal product and the anti-ideal product obtained from Conjoint Analysis results) in
order to estimate the gain or loss when changing levels of attributes. This methodology
(see Rial, Dominique-Ferreira and Varela, 2011; Dominique-Ferreira, Rial and Varela,
2012) consists in: i) first, “calculating the overall utility for all profiles from the most
preferred option to the least preferred one; ii) next, “from the global utilities, it is
necessary to estimate the gain or loss when changing a particular stimulus as a
proportion of the Maximum Loss of Utility (MLU), that is, the difference between the
overall utility of the ideal stimulus (the most preferred) and the anti-ideal (least
preferred) one”.
Finally, the traditional formula to estimate price elasticity of demand was used in
Section 4.4.

25
4. RESULTS
4.1. RESULTS OF CONJOINT ANALYSIS
The model fit was very high, so we can conclude that validity of the results is high
(Pearson’s R=0.999; Kendall’s Tau=0.983). The most important attribute was the price,
with an importance of 77.901%. The second most relevant attribute was the bundled
discount with an importance of 8.496%. Recommendation had an importance of
7.523%, and brand seemed to be the least important attribute of the four (6.081%).
GRAPH 1: IMPORTANCE OF ATTRIBUTES
Concerning the levels of the price attribute, the preferred one was, as expected, 150€
(u=4.448). However, we would like to note that paying 50€ more, i.e., 200€ (u=1.560)
presents a positive part-worth. The levels 250€ and 300€ present negative part-worths
(u=−1.377 and −4.631, respectively).
Bundled discounts are important for customers (u=0.495). Regarding the
recommendation attribute, customers actually gave preference to products
recommended by intermediaries (u=0.438).
Concerning the brand attribute, Açoreana seemed to be the preferred brand (u=0.340).
Fidelidade-Mundial is the only other brand that presented a positive utility (u=0.143).
Allianz and Tranquilidade had negative part-worths (−0.113 and −0.369, respectively).
Price Bundled discount Recommendation BrandSérie1 77,901 8,496 7,523 6,081
0
20
40
60
80
100

26
4.2. CUSTOMER BUYING DECISION PROCESS
The results of a two-stage cluster analysis show the existence of four clusters regarding
the customer buying decision process. The following tables (Table 4, Table 5 ) show the
initial and final centers of clusters. It seems that there are no important variations
between both solutions.
Cluster
1 2 3 4
Brand 14,80 11,70 58,36 14,83
Price 32,64 74,93 28,15 32,69
Intermediary’s recommendation 43,01 5,81 8,05 8,53
Price bundling 9,54 7,55 5,45 43,95
TABLE 4: FINAL CLUSTER CENTERS
Iteration Change in Cluster Centers
1 2 3 4
1 4,584 ,898 2,639 5,161
2 3,907 ,476 ,755 1,054
3 ,892 0,000 1,523 1,088
4 0,000 0,000 0,000 0,000
TABLE 5: ITERATION HISTORY7
Nevertheless, clusters are clearly differentiated (see Table 6). Clusters 2 and 3 are the
most different, mainly because of the importance given to price. Clusters 1 and 4 are the
least different, mainly because they vary almost exclusively in bundling strategy.
7 Convergence achieved due to no or small change in cluster centres. The maximum absolute coordinate change for any centre is .000. The current iteration is 4. The minimum distance between initial centres is 59.351.

27
Cluster 1 2 3 4
1 56,443 56,186 48,716
2 56,443 66,143 55,920
3 56,186 66,143 58,292
4 48,716 55,920 58,292
TABLE 6: DISTANCES BETWEEN FINAL CLUSTER CENTERS
Finally, in the following table (Table 7) it is possible to see the results of the ANOVA.
Price is the attribute that most distinguishes clusters [FPrice=470.722, significance
(Sig)=0.000].
Cluster Error
Mean
Square
df Mean
Square
df F Sig.
Brand 24186,641 3 70,955 353 340,871 ,000
Price 45825,056 3 97,350 353 470,722 ,000
Intermediary’s recommendation 12443,860 3 50,484 353 246,491 ,000
Price bundling 11904,601 3 46,947 353 253,573 ,000
TABLE 7: ANOVA
• Cluster 1 – 8.4% of the sample (“Guided by intermediaries and price”) - These
customers gave great importance to the recommendation of intermediaries (43.01%)
and price (32.74%).
• Cluster 2 – 72.8% of the sample (“Shop around customers”) - Customers who gave
almost all the importance to price (74.93%).
• Cluster 3 – 10.6% of the sample (“Loyal to insurance companies”) - These
customers paid attention to the insurance company/brand (58.36%) and price
(28.15%). They seem to be loyal customers.

28
• Cluster 4 – 8.2% of the sample (“Value for the money”) - Finally, customers in
Cluster 4 gave importance to bundling strategies (43.95%) and price (32.69%).
These results are interesting because they allow us to better understand how customers
perceive insurers. Results show that 89.4% of customers support their buying decisions
on price, intermediary recommendations, and other advantages. This is very important
to insurers in terms of business negotiation strategies, e.g., because they highlight that
intermediaries play a key role in selling.
4.3. ANALYSIS OF THE HYPOTHESES
4.3.1. PURCHASE INVOLVEMENT
Hypothesis 1: Customers with greater financial involvement with products are less price
sensitive.
In order to make the analysis clearer, we decided to divide the sample into two groups:
• Group 1: Customers who pay more than the average price (higher involvement).
• Group 2: Customers who pay less than the average price (lower involvement).
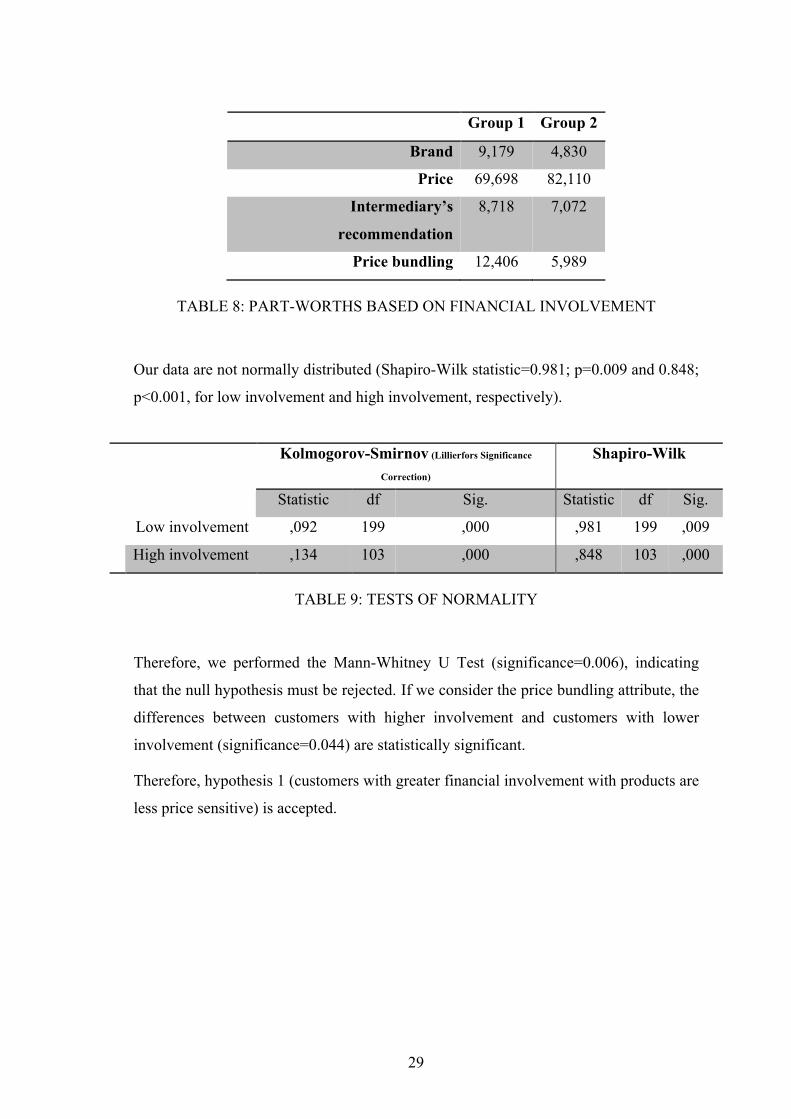
Consumers who have a higher involvement give more importance to brand, less
importance to price, and a little more importance to intermediary recommendation, and
they are much more sensitive to price bundling (see Table 8). We can assume that these
customers need to base the purchase decision on a larger number of elements in order to
mitigate its associated risk.
29
Group 1 Group 2
Brand 9,179 4,830
Price 69,698 82,110
Intermediary’s
recommendation
8,718 7,072
Price bundling 12,406 5,989
TABLE 8: PART-WORTHS BASED ON FINANCIAL INVOLVEMENT
Our data are not normally distributed (Shapiro-Wilk statistic=0.981; p=0.009 and 0.848;
p<0.001, for low involvement and high involvement, respectively).
Kolmogorov-Smirnov (Lillierfors Significance
Correction) Shapiro-Wilk
Statistic df Sig. Statistic df Sig.
Low involvement ,092 199 ,000 ,981 199 ,009
High involvement ,134 103 ,000 ,848 103 ,000
TABLE 9: TESTS OF NORMALITY
Therefore, we performed the Mann-Whitney U Test (significance=0.006), indicating
that the null hypothesis must be rejected. If we consider the price bundling attribute, the
differences between customers with higher involvement and customers with lower
involvement (significance=0.044) are statistically significant.
Therefore, hypothesis 1 (customers with greater financial involvement with products are
less price sensitive) is accepted.
30
4.3.2. CUSTOMER LOYALTY
Hypothesis 2: Loyal customers are less price sensitive.
Hypothesis 3: Loyal customers are more sensitive to price bundling strategies than
nonloyal customers.
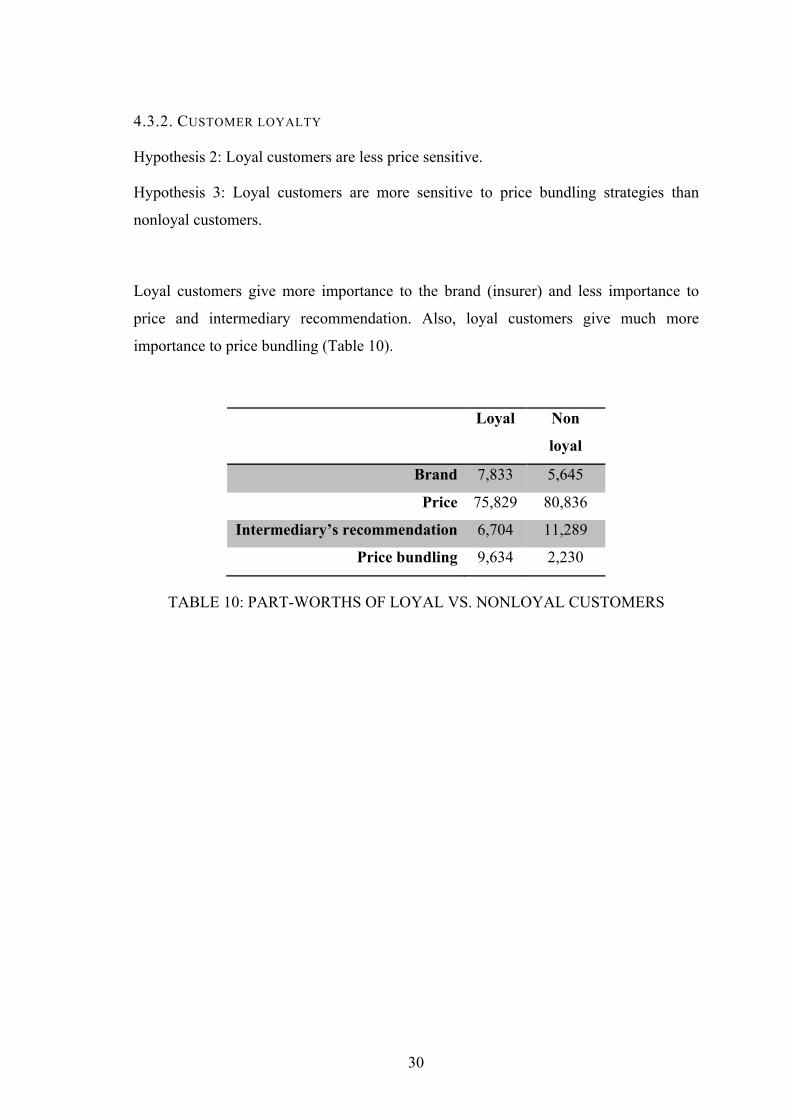
Loyal customers give more importance to the brand (insurer) and less importance to
price and intermediary recommendation. Also, loyal customers give much more
importance to price bundling (Table 10).
Loyal Non
loyal
Brand 7,833 5,645
Price 75,829 80,836
Intermediary’s recommendation 6,704 11,289
Price bundling 9,634 2,230
TABLE 10: PART-WORTHS OF LOYAL VS. NONLOYAL CUSTOMERS

31
Loyal Non-loyal
Brand Açoreana ,468 ,048
Tranquilidade -,458 ,105
Allianz -,180 -,403
Fidelidade-Mundial ,171 ,250
Price 150 4,375 4,613
200 1,550 1,661
250 -1,341 -1,532
300 -4,584 -4,742
Intermediary’s recommendation Recommended ,396 ,653
Recommendation hidden -,396 -,653
Price bundling With bundled discount ,569 ,129
Without bundled discount -,569 -,129
Constant 8,500 8,500
Ideal product 14,308 14,145
Anti-ideal product 2,493 2,573
TABLE 11: PART-WORTHS’ COMPARISON BETWEEN LOYAL AND NON-
LOYAL CUSTOMERS
Kolmogorov-Smirnov
(Lillierfors Significance
Correction)
Shapiro-Wilk
Statistic df Sig. Statistic df Sig. Non
loyal
,264 32 ,000 ,881 32 ,002 Loyal ,222 201 ,000 ,839 201 ,002
TABLE 12: TESTS OF NORMALITY
A Mann-Whitney U Test was performed, and the output indicates that the null
hypothesis must be retained (Sig=0.381). However, this result does not mean that there
are no relevant differences between Groups 1 and 2 (see Table 11). Therefore,
statistically, it is not possible to accept Hypothesis 2 (loyal customers are less price
sensitive).

32
If we consider the price bundling attribute, there are significant differences between
loyal and nonloyal customers (Sig=0.007). Loyal customers give much more
importance to price bundling than nonloyal customers. Therefore, Hypothesis 3 (loyal
customers are more sensitive to price bundling strategies than nonloyal customers) can
be accepted.
Based on partial utilities, we estimated a gain or loss when changing a particular
product. Therefore, we needed to estimate the global utility of the actual product (UA)
and the global utility of the simulated product (UB), as well as the proportion of the
Maximum Loss of Utility (MLU), that is, the difference between the global utility of the
ideal product and the anti-ideal global utility. This index is called the Variation
Attributed to Change (VAC), with a mathematical expression given by:
!"# = %" − %' x100,-%
Simulations presented in Table 13 (only for loyal customers) show some examples of
how it is possible to improve a product's preference through different situations.
Specifically:
• Example 1: If Açoreana maintains its price and intermediary
recommendation and offers the bundled product, this would represent an
increase of 9.63% in consumer preferences.
• Example 2: If Fidelidade-Mundial would like to get customers from
Açoreana, this would be possible just by offering the bundled product.
• Example 3: If Açoreana matched Tranquilidade’s simulated product and
offered the bundled product, it would be possible to increase its product
attractiveness by approximately 25%.
• Example 4: Açoreana could almost equal consumer preference for the same
product even if it charged 50€ more just by offering the bundled product.

33
Brand Price Intermediary’s
recommendation
Price
bundling
Global
Utility
VAC
Açoreana 150€ Yes No 13,169 Benchmark
1
Açoreana
Example 1
150€ Yes Yes 14.308 +9.63%
Fidelidade-Mundial
Example 2
150€ Yes Yes 14,011 +7.12%
Tranquilidade 200€ Hidden No 8,627 Benchmark
2
Açoreana
Example 3
200€ Yes Yes 8,591 +24.17%
Açoreana
Example 4
250€ Yes Yes 8,591 -0.31%
TABLE 13: CHARACTERISTICS OF THE SIMULATED PRODUCTS
We present examples of simulated products for illustrative purposes only. The most
interesting aspect of these analyses is that insurers could make some prediction of how
specific customers would react to new products based on different criteria (gender, age,
consumption patterns, loyalty behaviors, purchase involvement, etc.).
4.3.3. PRICE BUNDLING AND PRICE PERCEPTION
Hypothesis 4: Partitioned prices have better acceptance than combined prices.
To analyze the best option to present price, we used a sample of 42 customers. Our
results show that 61.9% would accept the bundle option. Regarding price perception
analysis, our results show that a partitioned price strategy has a little more acceptance
than a combined (or nonpartitioned) price: 52.4% and 47.6%, respectively. Because our
n<50, we used the Shapiro-Wilk statistic, and the P value was significant (<0.001 on

34
both), suggesting that our data are not distributed normally (see Table 14). As shown in
Table 15 – using Fisher’s Exact Test – we cannot reject the null hypothesis.
Statistically, Hypothesis 4 cannot be accepted. However, in terms of business strategy,
these differences should not be ignored, as is clear from the results in the next section.
Kolmogorov-
Smirnov8
Shapiro-Wilk
Statistic df Sig. Statistic df Sig.
Price
bundling
Partitioned
price
,383 22 ,000 ,628 22 ,000
Combined
price
,413 20 ,000 ,608 20 ,000
TABLE 14: TESTS OF NORMALITY
Chi-Square Tests
Value df Asymp. Sig.
(2-sided)
Exact Sig.
(2-sided)
Exact Sig.
(1-sided)
Pearson Chi-Square ,1559 1 ,694
Continuity Correction10 ,006 1 ,940
Likelihood Ratio ,155 1 ,693
Fisher's Exact Test ,758 ,470
Linear-by-Linear
Association
,151 1 ,697
N of Valid Cases 42
TABLE 15: FISHER’S EXACT TEST
8 Lillierfors Significance Correction 9 0 cells (0,0%) have expected count less than 5. The minimum expected count is 7.62. 10 Computed only for a 2x2 table

35
4.4. THE EFFECT OF PRICE BUNDLING ON THE DEMAND FUNCTION
In the second stage of the study, we analyzed the potential interest of a bundling
strategy in the insurance sector. The 42 customers of the second sample were divided
into two groups as follows:
1. Group 1 (n=24): we asked customers from this group how they would react to a
bundling strategy presented by their actual insurer.
2. Group 2 (n=18): these customers were asked if they would accept a bundling
strategy from another insurer.
The average price paid by these customers was €30311. The bundled strategy supposes
an increase of €30 over the base price, i.e., 333€12. From the 24 customers in Group 1,
18 would finally accept the bundled offer. This represents 75% acceptance. In this case,
price elasticity of demand13 is 4.205, i.e., customers are sensitive to this price bundling.
From the 18 customers of Group 2, eight (8) would accept the bundled offer, i.e., a
44.4% acceptance. In this case, price elasticity of demand is 4.644. In practical terms:
1. Market with the actual logic (without the price bundling): 303€×2414=7272€
2. If customers are offered a price bundling:
a. Actual customers: 333€×1815=5994€
b. Customers from other firms: 333€×816=2664€
c. And customers with previous conditions (without price bundling):
303€×617=1818€
11 Actual price – P1 12 Price under the conditions of price bundling – P2 13 Traditional formula was used: %/01%/2 % Where CQD is the percentage of change in quantity demanded and CP is the percentage of change in price 14 Actual quantity – Q1 15 Quantity accepting price bundling from one firm – Q2 16 Quantity accepting price bundling from other firms - Incorporated in Q2 17 Quantity only accepting product under actual conditions – Q3

36
Under the new conditions (price bundling), this market has a maximum potential of
€10476 (RA 5994+RB 2664+RC 1818). Comparing the actual market with the new
possible one (with price bundling), the loss is €4482 (10476-5994). Graphical
representation offers a more intuitive understanding.
FIGURE 1: DF UNDER ACTUAL CONDITIONS
FIGURE 2: DF UNDER PRICE BUNDLING CONDITIONS
37
5. DISCUSSION AND CONCLUSIONS
Consumer price sensitivity has been a much-discussed subject because it has a direct
impact on a firm's profits as well as on consumer satisfaction and loyalty behavior. Price
sensitivity is affected by many elements, such as the perceived similarity between
brands (Light, 1997; Iyer and Muncy, 2005), involvement with products, brand loyalty,
and bundling strategies.
In this study, we only considered car insurance customers. And in this sector, it is not
uncommon for Portuguese customers to forget the name of their insurer (brand).
Therefore, we can say that there is a perceived similarity between brands, and this could
explain why insurer brand is the less important attribute [Importance (IMP) =6.081%].
Further, intermediary recommendation is even more important for customers
(Imp=7.523%), making marketing management even more difficult for insurers. In this
sense, insurers should improve their support and partnership with intermediaries as
mentioned by Hawksby (2015). This would benefit both – insurers and intermediaries –
as a win-win solution, improving loyalty programs, e.g., through bundling strategies,
which turns out to be the second most important attribute for customers (Imp=8.496%).
In this study we considered a price bundling strategy, specifically, a mixed-leader
bundling (Guiltinan, 1987; Brito and Vasconcelos, 2015). Results show that 61.9%
(approximately two out of three customers) of our sample would accept the bundle
proposed, with the main product being auto insurance and home insurance being the
product that would receive the reduction.
On price presentation we did not find significant differences whether the price was
partitioned or whether it was combined (acceptance percentage of 52.4% and 47.6%,
respectively). Our results share some similarities with those obtained in other studies
(Drumwright, 1992; Mazumbar and Jun, 1993; Morwitz, Greenleaf, and Johnson,
1998).
In the Portuguese insurance sector, bundling can be considered as a tool for price
discrimination and as a cost-saving mechanism (see Sheikhzadeh and Elahi, 2013).
Price discrimination because of this kind of bundling allows a reduction in the perceived
price. It is a cost-saving mechanism because it may bring new customers and also

38
because of the indirect impact that this practice has on loyal customers. Regarding
bundling as a means of entry deterrence (Nalebuff, 2004 as cited in Sheikhzadeh and
Elahi, 2013), we also think that this strategy may be consistent with the reality of the
Portuguese insurance sector because in the last couple of months some international
players were making an effort to enter the Portuguese insurance sector. The insurance
industry is currently a difficult market, i.e., higher insurance premiums; more stringent
underwriting criteria, which means underwriting is more difficult; reduced capacity,
which means insurance carriers write less insurance policies; and less competition
among insurance carriers (PSA Insurance and Financial Services, 2013). Therefore, in
this context, bundling strategies could play an important role in product and service
differentiation instead of traditional price discounts.
As far as price sensitivity is concerned, our results suggest that loyal customers give less
importance to price when compared to nonloyal customers (Imp=75.829% and
Imp=80.836%, respectively). However, we did not achieve significant statistical
differences for this topic. Therefore, brands and intermediaries must be aware that,
although loyal customers are “tolerant” to some price oscillation, they still give great
importance to price. This may reinforce the idea that firms (insurers and intermediaries)
may be more likely to be successful in increasing their revenues through bundling
strategies than by simply increasing price. This result, together with the result of cluster
analysis (Cluster 3 “loyal to insurers”) and with the fact that the insurance sector has
one of the highest turnover rates (Jacada, 2008; Deloitte, 2012; Soeini and Rodpysh,
2012), seems to indicate that more loyalty programs could be developed. In this context,
the authors suggest an increase of contractual time for loyal customers. For example,
instead of the standard 12-month contract, it could be interesting to develop long-term
agreements with loyal customers of 3 years with some benefits, such as more coverage,
freezing the price of auto insurance during the 3 years, increase cross-selling offers
(e.g., auto insurance, home insurance, and health insurance). It could also be important
to treat those customers as a cluster with differentiated services. For example, having an
integrated advisory service based on a dedicated online Web service platform, an
account manager (as in banking), and a specialized salesperson in order to convert a
standard transactional sale to a customer relationship marketing, i.e., CRM (Sheth,
2002; Baron, Warnaby, and Hunter-Jones, 2014). Customer relationship profitability

39
arises through the acquisition and retention of high-quality customers with low
maintenance costs and high revenue (Anderson and Mittal, 2000). Therefore,
distribution channels could play an important role knowing what strategies to apply to
loyal customers (similar results were obtained by Li et al., 2012). These strategies could
also be applied to customers who have a higher financial involvement because they give
less importance to price and more importance to intermediary recommendation and they
are much more sensitive to price bundling. Nevertheless, we suggest that insurers and
intermediaries should preferably present first products with more coverage and services
associated (e.g., online Web service platform, account manager) to prevent customers
comparing products with low prices (in line with Gázquez-Abad and Sánchez-Pérez,
2009 work). Actually, “insurance companies face technological uncertainty that comes
from how big data and analytics investments will drive revenue” (Dyer, Furr, and
Lefrandt, 2014), so this online Web service platform could play an important role in
customer relationship management. Cross-selling could also be a relevant strategy for
these customers as a way of optimizing the wallet share of insurers and intermediaries.
Our sample in the experimental stage (the above-mentioned second stage) is relatively
small. In future research it would be important to have a larger sample in order to take
more general conclusions, minimizing a firm's risks before any commercial program. Or
it would be interesting to make a first selective approach to market based on each
customer’s buying profile. Intermediaries could play an important role giving
qualitative feedback on how customers react to bundling strategies and what could be
other anchor products and complementary products.
It would also be interesting to have the collaboration of an actuary in order to carry out
more precise analysis of premium estimation of bundling strategies. In particular, it
would be important to test different anchor products as well as different bundling
combinations. It would also be interesting to study the ideal number of products that
would compose the bundling strategy, for example, two anchor products and a price
discount in the third product or different percentages of price discounts in the two
associated products (e.g., home insurance and health insurance).
Moreover, it could be relevant to consider life insurance products as part of a bundling
strategy. It would also be interesting to study whether there is any benefit in applying

40
the bundle discount to the anchor product instead of applying it to the accessory
product. Finally, and depending on the characteristics of consumers in each country, it
could be important to perform a stratified random sampling.

41
CHAPTER II – HOW IMPORTANT IS THE STRATEGIC
ORDER OF PRODUCTS’ ATTRIBUTES PRESENTATION IN
THE INSURANCE MARKET?

42
ABSTRACT (2)
Objectives: Sales management plays an important role in firms’ profit. Its main goal is
to determine the best time to present insurance customers with prices, insurers, bundling
strategies and the intermediary’s recommendation.
Methods: We used a triangular approach. For attribute selection, three focus groups
were performed with insurance customers and intermediaries. Conjoint analysis was
carried out by presenting the attributes in three different orders.
Results: Primacy and recency effects were detected; a transfer or anchor effect was also
found related to the importance of the attributes preceding and succeeding a given
attribute.
Managerial implications: Salespeople can improve their approach to customers by
decreasing the importance given to price and increasing the positive impact of bundling
strategies and the intermediary’s recommendation in sales.
Originality: Although the order of attribute presentation has previously been analyzed,
this is the first study to examine this issue in non-life insurance products, providing
useful information to insurance salespeople and marketing managers for a better
understanding of insurance customers’ buying decision process.
Keywords: Effects of the order of attribute presentation, Customer services
management, Sales management, Bundling strategy, Insurance sector.
43
1. INTRODUCTION
Different elements affect the success or failure of salespeople’s approach to consumers.
In the insurance sector, these elements include, for instance, insurers, the intermediary’s
recommendation, price and discounts. However, the importance that consumers give to
each attribute varies in different conditions. For instance, the moment at which each
characteristic of the product is presented during the sale may be of particular importance
to consumers (see Buda and Zhang, 2000; Gatzert, Huber and Schmeiser, 2010; Hogarth
and Einhorn, 1992). For example, consumers often evaluate a brand’s current price
against its past prices or the prices of previously encountered brands (Monroe, 1990, as
cited in Suk, Lee and Lichtenstein, 2012). Atkinson and Shiffrin’s work (1968) is one of
the groundbreaking studies to explain primacy and recency effects. In this context,
salespeople can play an important role in firms: salespeople often use adaptive influence
tactics to engage consumers in a way that drives sales performance (Homburg, Muller
and Klarmann, 2011, as cited in Xie and Kahle, 2014).
The literature (e.g., Chrzan, 1994; DeMoranville and Bienstock, 2003; Li, 2009) shows
that customers may be affected not only by the moment and order in which price is
presented—i.e., primacy and recency effects—but also by a transfer effect, or a logic
chain order effect. Therefore, it may not be enough to say that price should be presented
at the beginning, middle or close to the end of the sale. Price may also be affected by
the attributes that precede and succeed it; i.e., there may be an anchor effect. Thus,
salespeople may reduce consumers’ responsiveness to price changes by first presenting
other attributes that consumers value highly.
Considering the timeliness of this much-discussed issue (e.g., Huber, Gatzert and
Schmeiser, 2015), the authors of this work intend to identify at which point insurance
salespeople should present the following in order to decrease the perceived importance
of the premium in sales and increase cross-selling through price bundling: (a) the
premium (and the associated covers); (b) the insurer; (c) bundling strategies; and (d) the
intermediary’s recommendation.

44
2. THEORETICAL BACKGROUND
2.1. EFFECT OF ATTRIBUTES ORDER PRESENTATION
Primacy and recency effects have been well understood for many decades (e.g., Chrzan,
1994). In the specific case of conjoint analysis with full profiles (orthogonal fractional
factorial designs), many effects related to order presentation have been identified (see
Acito, 1977; DeSarbo and Green, 1984; Johnson, 1987; Chrzan, 1994; Orme, Alpert and
Christensen, 1997; DeMoranville and Bienstock, 2003).
Order effects exist if the estimated attribute importance differs depending on the
position it occupies in each profile, keeping the research design, attributes and levels
unchanged. This issue negatively affects the predictive ability of conjoint analysis (see
DeSarbo and Green, 1984; Johnson, 1987; Orme, Alpert and Christensen, 1997).
Johnson’s (1987) study using full profiles (1987) found that the order effect was
responsible for 16% of the error variance for conjoint predictions. Other studies have
also found that the order of the attributes’ presentation has negative effects on results
(Acito, 1977; DeMoranville and Bienstock, 2003).
In addition, previous studies have found that attribute levels and the factors that
determine how much weight is assigned to each level influence evaluation and choice
(Fishbein and Ajzen, 1975; Nowlis and Simonson, 1997; Dhar, Nowlis and Sherman,
1999; Hsee and Zhang, 2004). According to Sela and Berger (2012), many firms present
their products with few attributes (e.g., the Avis website, www.avis.com). It seems that
presenting more attributes to consumers tends to benefit evaluation when the options are
perceived as being less useful (the opposite also holds true).
Other studies focus on the specific place or selling moment in which price is presented
(see DeSarbo and Green, 1984; Johnson, 1987; Orme, Alpert and Christensen, 1997). In
terms of simulation predictions, such as those based on conjoint analysis experiments,
this situation can produce biased results (Acito, 1977; Johnson, 1987; DeMoranville and
Bienstock, 2003). Primacy and recency effects have also been analyzed in the context of
a long-term memory test of Super Bowl commercials (see Li, 2009), wherein the results
show a strong primacy effect.
This paper aims to study the possible primacy and/or recency effects in the insurance
sector.

45
2.2. PRICE PERCEPTION
A wide range of literature has analyzed the factors that influence price perception.
Bagchi and Davis (2012) present three dimensions or literature streams that explain the
process of price perception:
• Computation, that is, how consumers think prices. The literature about
computation focuses on the following factors:
o Individual differences variables such as cognitive skills, analytical ability
(see Cacioppo and Petty, 1982).
o Situational factors such as information overload, time constraints and
decision context factors (Suri and Monroe, 2003).
• Numerosity and number encoding—i.e., how the size of numbers affects
perceptions. In this dimension, the authors study how loyalty programs can
increase effectiveness; e.g., points earned per dollar spent (see Bagchi and Li,
2011). With this factor, it is also possible to separate between hedonic and
utilitarian attributes; i.e., more emotional attributes versus more rational/useful
attributes, respectively. According to Sela and Berger (2012), an increase in
perceived usefulness also may help hedonic options more than utilitarian ones
because it enables consumers to balance two competing goals: obtaining
utilitarian benefits and hedonic pleasure.
• Anchoring—i.e., how individuals tend to anchor on the first part of information
for initial judgments. For example, does first presenting price and then
presenting quantity lead to the same results as first presenting quantity and then
presenting price? Bagchi and Davis (2012) analyze the difference between “$29
for 70 items” and “70 items for $29” using car insurance is used as the anchor
product (see also Yadav, 1994).
Other literature focuses on trade-in acquisitions (see Purohit, 1995; Okada, 2001; Zhu,
Chen and Dasgupta, 2008). Two of these studies (Okada, 2001; Zhu, Chen and
Dasgupta, 2008) achieve interesting results about trade-in purchases in the automobile

46
sector: customers are willing to pay more for a new car if the sellers pay more for the
used car. However, there are some controversial results concerning the specific research
topic of trade-ins. For example, Srivastava and Chakravarti (2011) obtain opposite
results. Relevant research has also been conducted concerning the specific effect of how
options are presented (see Dhar and Simonson, 1992; Diehl and Zauberman, 2005). The
general result is that when prices are presented to customers in descending order,
customers tend to choose the more expensive options; when prices are presented in
ascending order, customers tend to choose the less expensive options (see Suk, Lee and
Lichtenstein, 2012).
This paper aims to explore whether an anchor effect occurs when attributes are
presented in different orders.
2.3. THE IMPORTANCE OF INTERMEDIARIES IN INSURANCE SALES
Intermediaries assume great importance in the insurance sector. According to The
Council of Insurance Agents & Brokers (2015), insurance intermediaries facilitate the
placement and purchase of insurance, and provide services to insurance companies and
consumers that complement the insurance placement process. According to Eckardt and
Rathke-Doppner (2010):
The profound information asymmetries between consumers and insurance
companies have resulted in the evolution of institutions that mediate between
consumers and insurance companies. Insurance intermediaries such as exclusive
agents and insurance brokers hold an important position as matchmakers
between the supply and demand sides on insurance markets.
In terms of demand, consumers’ preferences in regard to insurance-related information,
other transaction services and their transaction costs influence their make-or-buy
decisions. Since many information services depend on information that is privately held

47
by consumers, intermediation service quality also depends on cooperation between
consumers and intermediaries (see Eckardt and Rathke-Doppner, 2010). On the supply
side, distribution of the relevant information and the search technology used are
important factors that affect the search costs incurred in producing information and
other services at a certain level of quality (Rose, 1999; Eckardt, 2007, as cited in
Eckardt and Rathke-Doppner, 2010). Rose (1999) presents different cost reductions
from the services of intermediaries, including search costs, information costs and
opportunity costs (for more detail, see Table 16).
Transaction
stages
Intermediary service Cost reduction
Searching and
matching
ü Direct sales of information
ü Matchmaking
ü Market-making
ü Search costs
ü Information costs
ü Opportunity costs of time
Availability or
products and
immediacy
ü Compensation of variances in demand
and supply
ü Opportunity costs of time
Negotiating
and contracting
ü Strong bargaining position
ü Exploitation of differences in contract
terms between supply and demand
market side
ü To standardize contracts
ü Negotiation costs
ü Information costs
ü Administrative costs
ü Opportunity cost of time
Monitoring and
guaranteeing
ü Expertise in determining product and
service quality
ü Cross-sectional and temporal reuse of
information
ü Guaranteeing high product quality
ü Information costs
ü Monitoring and control
costs
ü Costs resulting from
uncertainty
ü Investment in expertise
TABLE 16: TRANSACTION COST REDUCTION FROM INTERMEDIARIES
(ROSE, 1999)
2.4. THE IMPORTANCE OF BUNDLING STRATEGIES IN SALES
Adams and Yellen (1976) define bundling as the act of selling goods in packages. In
1987, Guiltinan added to this definition the concept of selling products and services in

48
one package for a “special price”. Other literature analyzes the specific effect of price
bundling presentation, for example, partitioned price and combined price (see
Chakravarti, Rajan, Pallab and Srivastava, 2002; Stremersch and Tellis, 2002; Hamilton
and Srivastava, 2008; Brito and Vasconcelos, 2015). Consistent with Sheikhzadeh and
Elahi (2013), bundling strategies are mainly used in three situations:
i. A tool for price discrimination;
ii. A cost saving mechanism;
iii. A means of entry deterrence.
In this context, there are two different types of bundling strategies: product bundling
and price bundling (see Stremersch and Tellis, 2002; Gilbride, Guiltinan and Urbany,
2008). According to Johnson, Herrmann and Bauer (1999), bundled discounts increase
consumers’ willingness to recommend and repurchase intention, i.e., loyalty behaviors.
According to Harris and Blair (2012), from the retailer perspective, if consumers fail to
process information about bundle discount, optimal bundle pricing may be affected (see
also Drumwright, 1992). Another important aspect according to Yan, Myers, Wang and
Ghose (2014), the complementarity the price discount to the identical products must be
attractive to customers and the degree of product complementarity to the
complementary products must be large enough. So, in this study we chose the car
insurance as the main product and the home insurance as the other part of the bundle
strategy because of two reasons: a) they are complementary; b) because consumers
evaluate bundled products based on an anchoring and adjustment model (see Yadav,
1994), and the car insurance is the most relevant product to the Portuguese customers
(see Associação Portuguesa de Seguros, 2013, i.e., Portuguese Association of
Insurance) and also because it is compulsory.
In this sense, this research aims also at analyzing the importance that customers give to
bundling strategies in the insurance sector.

49
3. METHODOLOGY
3.1. PARTICIPANTS
Data was gathered from 394 insurance customers (59.1% men; 40.9% women), aged
between 19 and 80 (mean=43.92; standard deviation=12.299). The sample error was ±
4.94% (p=q=50), with a confidence level of 95% (k=2 sigma).
3.2. ATTRIBUTES’ SELECTION
In order to select the most relevant attributes for Portuguese insurance customers, we
performed a pilot study based on a qualitative approach (we conducted three focus
groups with both customers and intermediaries). The results obtained show that “the
intermediaries’ recommendation,” “premium,18 ” and “insurer/brand” were the most
relevant attributes for Portuguese customers. These focus groups lasted 47-55 minutes
and were performed in 2012.
Literature revision has also proved that premium (Barroso and Picón, 2012; Rai and
Medha, 2013), intermediary recommendations (O’Loughlin and Szmigin, 2007; Robson
and Sekhon, 2011; Brophy, 2013), and pricing strategies such as price bundling
(Weston, 2007, as cited in Brophy, 2014) were very important attributes.
3.3. PROCEDURE
A Conjoint Analysis with Full Profile (FP) was performed in order to achieve the most
similar conditions as selling environment (other investigations used the same logic, e.g.,
Gareth, Levin, Chakraborty and Levin, 1990). Authors considered the possibility of
using choice-based conjoint. However, intermediaries who collected data indicated that
the full profile option would mimic in a better way the decision-making process of
customers. Also, other studies support good performance from FP predicting
consumers’ preferences (Molin, Oppewal and Timmermans 2000; Oppewal and
Klabbers, 2003). In the specific case of pricing studies, Conjoint Analysis is one of the
18 Respondents were informed about covers associated with each level of the attribute premium.

50
most popular methods in marketing for measuring willingness to purchase (Jedidi and
Jaspal, 2009, p. 42).
To perform conjoint analysis, we selected the abovementioned four attributes with
different levels for each (2x4x4x2). From the 64 possible combinations, we used an
orthogonal fractional factorial design, selecting 16 and two holdout cards, which were
eventually used in the data collection (with the “Orthoplan” procedure of SPSS v. 21).
We built 18 cards, each of which represented one of the 18 combinations of the levels of
attributes. For the specific purpose of this study, we used three orders of attribute
presentations called “series” and characterized as follows:
SERIES A SERIES B SERIES C
Insurer Bundling Insurer
Price Intermediary’s
recommendation
Bundling
Intermediary’s
recommendation
Insurer Intermediary’s
recommendation
Bundling Price Price
TABLE 17: ORDERS OF ATTRIBUTES’ PRESENTATION
Due to the high number of possible combinations, we chose three series. In series A,
price was placed at the beginning, mainly for the purpose of verifying the results of
Bagchi and Davis (2012) (that individuals tend to anchor on the first part of information
for initial judgments). In series B and series C, price was placed at the end for the same
reason. The only difference between series B and series C was the order of the
presentation of the attributes preceding price; in series B, we sorted the other attributes
based on what we believed to be the descending order of importance. In other words, we
thought that bundling would be the second most important attribute, followed by the
intermediary’s recommendation and finally the insurer. In series C, we placed what we
thought would be the least important attribute first, followed by the other attributes.

51
3.4. METHODS AND RESULTS
the study of consumer preferences was performed through conjoint analysis. In order to
analyze the possible order effect on each attribute (Section 4.2.), we performed the
Kruskal–Wallis test.
Finally, as outlined in Section 4.3.3., we used the variation attributed to the change
(based on the ideal product and the anti-ideal product obtained from the results of the
conjoint analysis) in order to estimate the gain or loss when changing the order of the
attributes’ presentation.
4. RESULTS
4.1. CONJOINT ANALYSIS’ RESULTS
Model fit is very high, so we can conclude that validity of the results is high (Pearson’s
R=0.999; Kendall’s Tau=0.983). The most important attribute is the price, with an
importance of 77.901%. The second most relevant attribute is the bundled discount with
an importance of 8.496%. The recommendation has an importance of 7.523% and the
brand seems to be the least important attribute of the four (6.081%).
GRAPH 2: IMPORTANCE OF ATTRIBUTES
Concerning levels of the price attribute, the preferred level is, as expected, €150
(u=4.448). However, it should be noted that paying €50 more, i.e., €200 (u=1.560),
presents a positive part-worth. The levels €250 and €300 present negative part-worths
Price Bundlingstrategy Recommendation InsurerSérie1 77,901 8,496 7,523 6,081
0
20
40
60
80
100

52
(u=-1.377 and -4.631, respectively). In addition, bundled discounts are a good option for
customers (u=0.495). Concerning the recommendation attribute, customers actually give
preference to products recommended by intermediaries (u=0.438). Concerning the
brand attribute, Açoreana seems to be the preferred brand (u=0.34). Fidelidade-Mundial
is the only other brand that presents a positive utility (u=0.143).
4.2. RESULTS BY SERIES
4.2.1. PRICE
Results show that price has a lower importance when presented at the end of the sale
(UPrice B=79.359; UPrice C=72.996). Consumers give more importance to price when it is
presented at the beginning (UPrice A=83.97).
The difference between the highest value (UPrice A=83.97) and the lowest one (UPrice
C=72.996) is 10.974%. This difference of importance (10.974%) is higher than the
importance of any of the other attributes. This could be an indication of a primacy effect
when price is presented at the beginning (series A).
There is also a transfer effect, i.e., when price is presented at the end and is preceded by
a relevant attribute (such as the intermediary’s recommendation), its importance is
lower (series C). When price is also presented at the end but is preceded by the least
important attribute (insurer), the transfer effect is not so strong (series B).
ATTRIBUTES SERIES
A
SERIES
B
SERIES
C
A-B A-C B-A
INSURER 3,542 5,678 8,550 2,136 5,008 2,872
PRICE 83,97 79,359 72,996 4,611 10,974 6,363
INTERMEDIARY’S 6,116 3,841 10,678 2,275 4,562 6,837

53
RECOMMENDATION
BUNDLING
STRATEGY 6,371 11,122 7,777 4,751 1,406 3,345
AVERAGE --- --- --- 3.433 5.488 4.854
TABLE 18: IMPORTANCE OF EACH ATTRIBUTE BY SERIES
In order to check normality of data, we performed the test of normality. Results show
that data are not normally distributed (p-value <0.001). So, Kruskal-Wallis test was
performed and the result show that the null hypothesis should be retained (p-value =
0.374).
Tests of Normality
Series Kolmogorov-Smirnova Shapiro-Wilk
Statistic df Sig. Statistic df Sig.
Price A ,226 103 ,000 ,838 103 ,000
B ,295 45 ,000 ,663 45 ,000
C ,186 172 ,000 ,875 172 ,000
a Lilliefors Significance Correction
TABLE 19: TESTS OF NORMALITY FOR PRICE
Null Hypothesis Test Sig. Decision
The distribution of price is the same
across of categories
Independent
Samples Kruskal-
Wallis Test
0.374 Retain the null
hypothesis
Asymptotic significances are displayed. The significance level is .05
TABLE 20: KRUSKAL-WALLIS TEST FOR PRICE

54
4.2.2. INSURER
In the case of the insurer, there is a more complex effect. When the insurer is presented
at the beginning (series A and series C), consumers give: i) little (lowest) importance in
series A (UInsurer A=3.542); but also the highest importance in series C (UInsurer
C=8.550%).
The difference between the highest and the lowest importance is 5.008%. So, it is not
possible to argument that there is a primacy effect or a recency effect (UInsurer
B=5.678%).
Perhaps, the reason is that in series A, the attribute insurer (UInsurer A=3.542) is
immediately succeeded by price (UPrice A=83.97%) which is the most important attribute.
So, this could be explained by the enormous importance of price in series A together
with the primacy effect observed in price. Again, in series B it seems that the same
situation occurs.
In series C the situation is different because the attribute that succeeds insurer is a less
important attribute (bundling strategy) compared with price. In order to check normality
of data, we performed a test of normality. Results show that data are not normally
distributed (p-value <0.001).
In this sense, Kruskal-Wallis test was performed and the result show that it is possible
to reject the null hypothesis (p-value = 0.024).
Tests of Normality
Series Kolmogorov-Smirnova Shapiro-Wilk
Statistic df Sig. Statistic df Sig.
Insurer A ,238 103 ,000 ,720 103 ,000
B ,328 45 ,000 ,561 45 ,000
C ,232 172 ,000 ,674 172 ,000
a Lilliefors Significance Correction
TABLE 21: TESTS OF NORMALITY FOR INSURER

55
Null Hypothesis Test Sig. Decision
The distribution of insurer is the
same across of categories
Independent
Samples Kruskal-
Wallis Test
0.024 Reject the
null
hypothesis
Asymptotic significances are displayed. The significance level is .05
TABLE 22: KRUSKAL-WALLIS TEST FOR INSURER
4.2.3. BUNDLING STRATEGY
Regarding the attribute bundling strategy, it seems that there is a primacy effect,
because when this attribute is presented at the beginning, it gets its highest importance
(UBundling B=11.122%). When presented in second place, it gets the second highest
importance (UBundling C=7.777%). Finally, when presented at the end, the importance of
bundling strategy is the lowest one (UBundling A=6.371%). The difference between the
highest and the lowest value is 4.751.
It seems that there is a primacy effect in series B (presented in first place) and C
(presented in second place).
In order to check normality of data, we performed the Shapiro-Wilk statistic. Results
show that data are not normally distributed (p-value < 0.001). So, Kruskal-Wallis test
was performed and the result show that the null hypothesis should be retained (p-value
= 0.794).

56
Tests of Normality
Series Kolmogorov-
Smirnova
Shapiro-
Wilk
Statistic df Sig. Statistic df Sig.
Bundled
strategy
A ,195 103 ,000 ,755 103 ,000
B ,179 45 ,001 ,721 45 ,000
C ,208 172 ,000 ,735 172 ,000
a Lilliefors Significance Correction
TABLE 23: TESTS OF NORMALITY FOR BUNDLED STRATEGY
Null Hypothesis Test Sig. Decision
The distribution of bundling
strategy is the same across of
categories
Independent
Samples Kruskal-
Wallis Test
0.794 Retain the null
hypothesis
Asymptotic significances are displayed. The significance level is .05
TABLE 24: KRUSKAL-WALLIS TEST FOR BUNDLING STRATEGY
4.2.4. INTERMEDIARY’S RECOMMENDATION
Regarding the recommendation made by the intermediary, the highest value is observed
when the attribute is presented near the end (URecommendation C=10.678%; URecommendation
A=6.116%). When presented near the beginning, it has the lowest importance
(URecommendation B=3.841%). The difference between the highest and the lowest values is
6.837%. In this case, it seems there is not a clear effect (possibly a recency effect).
In order to check normality of data, we performed the Shapiro-Wilk statistic. Results
show that data are not normally distributed (p-value < 0.001). So, Kruskal-Wallis test
was performed and the result show that the null hypothesis should be retained (p-value
= 0.747).

57
Finally, it is interesting to note that the variability of attributes’ importance is lower
when price is presented at the beginning (series A), exactly in the circumstances in
which the importance of price is the highest one. Our argument is also supported
because the highest variability of attributes’ importance is found in series C (precisely
our recommendation in terms of salespeople approach to customers).
Tests of Normality
Series Kolmogorov-
Smirnova
Shapiro-
Wilk
Statistic df Sig. Statistic df Sig.
Intermediary’s
recommendation
A ,210 103 ,000 ,759 103 ,000
B ,204 45 ,000 ,717 45 ,000
C ,239 172 ,000 ,680 172 ,000
a Lilliefors Significance Correction
TABLE 25: TESTS OF NORMALITY FOR INTERMEDIARY’S
RECOMMENDATIONS
Null Hypothesis Test Sig. Decision
The distribution of intermediary’s
recommendation is the same
across of categories
Independent
Samples Kruskal-
Wallis Test
0.747 Retain the null
hypothesis
Asymptotic significances are displayed. The significance level is .05
TABLE 26: KRUSKAL-WALLIS TEST FOR INTERMEDIARY’S
RECOMMENDATIONS

58
4.3. STATISTICAL DIFFERENCES VERSUS SIMULATION ANALYSIS
According to Bakan (1966, as cited in Cohen, 1994), “a great deal of mischief has been
associated” with the test of significance. In most cases, the practical reality is sidelined
because “if he tried to publish this result without a significance test, one or more
reviewers might complain? It could happen.” This logic seems to place the statistical
implications in contradiction with the practical implications. However, in terms of the
results obtained in this study, it is questionable as to whether the non-statistically
significant differences are relevant in real sales situations. Table 27 shows some
simulation analyses through VAC For example, “benchmark 1” shows that it is possible
to increase the attractiveness of the same product by 4.74% based on the effect of the
order of attribute presentation (from series A to series C).
Series Brand Price Intermediary’s
Recommendation
Bundling
Strategy
Global
Utility
VAC
A Açoreana 200$ Yes Yes 10.990 Benchmark 1
C Açoreana 200$ Yes Yes 11.540 + 4.74%
(Comparing
with
Benchmark 1)
TABLE 27: SIMULATIONS

59
5. DICUSSION AND MANAGERIAL IMPLICATIONS
Price is frequently the most important attribute for customers. However, it is clearly not
the only attribute that customers consider in the buying process. In order to conduct this
study, three focus groups were carried out; they showed that three other attributes are
also relevant in insurance customers’ buying process: insurer, bundling strategy and
intermediary’s recommendation.
The general results show that price is the most important attribute, as expected,
followed by bundling strategy, the intermediary’s recommendation and the insurer’s
identity. However, when customers are exposed to a different order of the presentation
of the attributes, the results are quite different. For example, the intermediary’s
recommendation can be the second most important attribute (Imp=10.678% in series C),
as well as the least important attribute (Imp=3.841% in series B). In this sense, each
attribute’s importance shows great variability depending on the specific moment/place
in which the salesperson presents each attribute. This is mainly due to primacy and
recency effects, but it is also influenced by a transfer effect; i.e., the relative importance
of the attributes preceding and succeeding a given attribute affect its importance. This
result is even more important if we consider that intermediaries play an important role
in the consumer buying decision process. Therefore, our results share some similarities
with those obtained in other studies (Chrzan, 1994; DeMoranville and Bienstock, 2003).
Concerning implementation of bundling strategies in the Portuguese insurance sector, it
seems that sales managers should pay special attention to the detection of the primacy
effect, which could be used as an anchor element in sales (Yadav, 1994).
The next issue that arises is that of how salespeople can most efficiently approach
customers. In order to decrease the importance of price, our results suggest that
salespeople should first present the insurer’s identity, followed by the bundling strategy,
the intermediary’s recommendation and, finally, the price. This approach seems to be
able to decrease the importance of price by 10.975% compared to the least effective
order of presentation. These results show some similarities with those of a study
conducted by Bagchi and Davis (2012).

60
One limitation of this study is related with the use of only three different series. It would
be interesting to use different combinations and analyze the results thereof.

61
CHAPTER III – THE KEY ROLE PLAYED BY
INTERMEDIARIES IN THE INSURANCE MARKET
SUPPLY CHAIN: EVIDENCE FROM PORTUGUESE
INSURANCE CUSTOMERS

62
ABSTRACT (3)
Purpose: The insurance market has high churn rates because customers’ purchase
decision-making process and claims management rely heavily on intermediaries. The
purpose of this study is to investigate the role played by insurers and intermediaries in
customer satisfaction, as well as in the preferences of customers regarding the purchase
decision-making process (two important elements of the insurance supply chain).
Methodology: The first step was to select the most important attributes for Portuguese
insurance customers. Three focus groups were conducted (using B2C and B2B
markets), and data from Portuguese car insurance customers were gathered through an
ad hoc questionnaire. The customers’ purchase decision-making process was studied
through the multidimensional scaling unfolding model.
Findings: Intermediaries play a key role in the insurance market by influencing
customer satisfaction, claims management and the purchasing process (premium
acceptance.
Practical implications: Because of the influence that intermediaries have on customer
satisfaction, insurers should improve their partnerships (back office support) with
intermediaries.
Originality: This study analyzes insurance supply chain management, including three
different players: i) customers; ii) intermediaries; iii) and insurers. Consumer
preferences, in terms of purchasing behavior and satisfaction, rely more on
intermediaries than insurers. The study’s findings concerning consumer preferences can
be used by insurers and intermediaries to improve the efficiency of the insurance market
supply chain, specifically in terms of claims management. Also, an original and brief
questionnaire to measure insurance customers’ satisfaction is tested with acceptable
psychometrics properties.
Keywords: Banking industry, Insurance supply chain management, Insurance
intermediaries, Insurance customers’ satisfaction, Insurance customers’ preferences.

63
1. INTRODUCTION
The insurance industry is more competitive than ever because customers have become
increasingly demanding (Siddiqui and Sharma, 2010). Customers are becoming
increasingly aware of their expectations and demand higher standards of services, as
technology enables them to compare products and services very quickly and accurately
(Siddiqui and Sharma, 2010). Many studies show the importance of supply chain
management (SCM) in this context (see Ismail and Sharifi, 2006; Koh, Saad and
Arunachalam, 2006; Stock and Boyer, 2009; Miguel, Brito, Fernandes, Tescari and
Martins, 2014; Hung Goh and Eldridge, 2015; Ke, Windle, Han and Brito, 2015).
According to Lambert, García-Dastugue and Croxton (2005, as cited in Corominas,
2013), SCM has been used as a synonym for:
i. Logistics;
ii. Operations management;
iii. Purchasing;
iv. A combination of the three.
Naslund and Williamson (2010) argue that the concept of SCM is “complex, poorly
defined and difficult to measure”. In this context, Fisher (1997) recommends an
alignment between the supply chain strategy and the characteristics of products. SCM is
a very difficult and challenging process, as Rugman, Li and Oh state (2009):
[...] Building a global supply chain can be very costly and challenging [...] Besides,
environmental factors that are exogenous to firms in supply chain management, another
challenge is endogenous to firms – that is, managing the relationships among supply chain
partners so as to achieve a high level of integration and cooperation.

64
So, considering that:
Therefore, the following should be considered:
a) Outsourcing carries a greater quality risk than internal production; i.e., a
vertically integrated chain (Gray, Roth and Tomlin, 2007);
b) The supply chain of the insurance sector relies greatly on outsourcing, such as
intermediaries (Doney and Cannon, 1997; Jap, 2000; Beloucif, Donaldson and
Kazanci, 2004; Chang, 2006; O’Loughlin and Szmigin, 2005; Rugman, Li and
Oh, 2009; Robson and Sekhon, 2011; Brophy, 2013);
c) Portuguese insurance customers buy products mostly from intermediaries (in
line with the “purchasing” concept presented by Lambert, García-Dastugue and
Croxton, 2005, as cited in Corominas, 2013), so they are the the main
distribution channel in the Portuguese insurance industry (Associação
Portuguesa de Seguros – Portuguese Association of Insurance, 2014),
The objectives of this investigation are twofold:
• To understand the role and impact of intermediaries and insurers in the
insurance supply chain through customer satisfaction (in line with Rai,
Patnayakuni and Seth, 2006, as cited in Jean, Sinkovics and Kim, 2008);
• To analyze the structure of customer preferences and connect them to the
insurance supply chain (in line with Jean, Sinkovics and Kim, 2008).
The authors chose this experimental research approach because of the complexity of the
insurance supply chain, and analyze this process from the perspective of the customer.
This choice follows the reasoning of Andriopoulos and Slater (2013):

65
Contemporary global supply and value chains involve international networks that are
built upon personal inter- and intra-organizational relationships. Understanding these
relationships and their link to performance, requires an exploratory approach which
gets as close as possible to the actors involved.
2. THEORETICAL FRAMEWORK
2.1. SUPPLY CHAIN MANAGEMENT
According to Lambert, García-Dastugue and Croxton (2005), in 1996 The Global
Supply Chain Forum developed the following definition of supply chain management:
the integration of key business processes from end user through original suppliers that
provides products, services, and information that add value for customers and other
stakeholders (see also Lambert, Cooper and Pagh, 1998, p. 1). Lambert, García-
Dastugue and Croxton 2005’ work presents eight supply management processes that
were included in The Global Supply Chain Forum framework, as follows:
• Customer Relationship Management – the structure that shows how
relationships with customers are developed and maintained;
• Customer Service Management – it is considered the firm’s face to customers, a
single source of information;
• Demand Management – the structure for balancing the customers’ requirements
with supply chain capabilities, including reducing demand variability and
increasing supply chain flexibility;
• Order Fulfilment – includes all activities necessary to define customer
requirements, design a network, and enable the firm to meet customer requests
while minimizing the total delivered cost;
• Manufacturing Flow Management – comprises the activities to obtain,
implement and manage manufacturing flexibility and move products through the
plants in the supply chain;

66
• Supplier Relationship Management – specifies how should be developed and
maintained the relationships with suppliers;
• Product Development – delivers the structure for developing and bringing to
market new products jointly with customers and suppliers;
• Returns Management – “includes all activities related to returns, reverse
logistics, gatekeeping, and avoidance”.
In order to fulfill the goals of this investigation, the authors considered the following
three supply management processes: a) Customer Relationship Management (CRM)
provided by insurers and intermediaries – sales are generally performed by
intermediaries, while claims management are performed by intermediaries
(downstream) and by insurers (upstream); b) Customer Service Management – mainly
provided by intermediaries (Robson and Sekhon, 2011; Brophy, 2013; Portuguese
Association of Insurance, 2014); c) Demand Management – essentially provided by
intermediaries.
2.2. CUSTOMERS’ SATISFACTION
According to Parasuraman, Zeithaml and Berry (1993), there are some basic principles
that provide customer satisfaction, and this relationship can be translated in the
following way:
• The Satisfaction (S) of the client, results from the difference of the set of
perceptions (P) and expectations (E), i.e.: S = P - E
When there is a complaint from a consumer, the more quickly the problem is solved, the
more satisfied the consumer will be (Orsingher, Valentini and de Angelis, 2010). This
situation is frequently called “the paradox of satisfaction”.

67
Satisfaction and loyalty are usually linked because there is a positive relationship
between both concepts and realities (Kim and Yoon, 2004; Bodet, 2008; Kahn, 2012).
Many studies have analyzed the link between customer satisfaction and loyalty
behaviors (Bernhardt, Donthu and Kennett, 2000; Edvardsson, Johnson, Gustafson and
Strandvik, 2000).
According to Orsingher, Valentini and de Angelis (2010), the more satisfied a customer
is, the more likely they are to become loyal to a specific brand (see also Martensen,
Gronholdt and Kristensen, 2000). Many studies show that satisfaction with
products/services has an important impact on the loyalty of customers (see Bitner, 1990;
Dick and Basu, 1994; Oliver, 1999; Nam, Ekinci and Whyatt, 2011).
In a classic sense, loyalty can be defined as the repetitive sequence of purchasing a
particular brand (Cunningham, 1956), or as an individual’s desire for a brand to remain
stable for a period of time (Tucker, 1964). Dick and Basu (1994) define loyalty as the
relationship between an attitude towards an entity (e.g. a brand, service, or sales) and a
repetitive behavior (for more about repetitive behavior, see LaBarbera and Mazursky,
1983; Taylor and Baker, 1994; Zeithaml, Berry and Parasuraman, 1996; Bolton, 1998;
Rauyruen and Miller, 2007; Saaty, 2011; Guillén, Nielson, Scheike and Pérez-Marin,
2012; Khan, 2012). In practice, loyal customers refer and recommend the products and
services of the brand they are loyal to to their colleagues (Mcllroy and Barnett, 2000).
According to Delgado-Ballester and Munuera-Aleman (2001, apud Roy, 2012), the
main advantages of customers’ loyalty are:
• A substantial entry barrier to competitors.
• An increase in the firm’s ability to respond to competitive threats.
• Greater sales and revenues.
• A customer base less sensitive to the marketing efforts of competitors.
Others works (e.g.: Rowley, 2005) identified other advantages from customers’ loyalty,
such as lower customer price sensitivity, reduced expenditure on attracting new
customers and improved organizational profitability. However, this is not a customer
loyalty guarantee. Ganesh, Arnold and Reynolds (2000) refer that:

68
i) Not all customers should be targeted with retention and loyalty efforts;
ii) some of the most satisfied and loyal customers might still switch for reasons beyond
the control of the firm and at times even beyond the control of the customer.
Durvasula, Lysonski, Mehta and Tang (2004) also find that satisfaction is positively
associated with customers’ repurchase intentions, but is weakly associated with
customers’ willingness to make recommendations to others. The findings of Lin and Wu
(2011) show that quality, commitment, and trust are also statistically associated with
customer satisfaction and customer retention.
Customer’s lifetime value
According to Becker, Spann and Schulze (2014), “subscriptions with minimum contract
durations do indeed help companies to successfully retain customers”. They also
conclude that incentives attract customers who would not be retained in other ways,
suggesting that companies should pay special attention to minimum contract durations
as well as incentives.
According to Homburg, Droll and Totzek (2008, firms that use customer prioritization
strategies improve average customer profitability as well as the return on sales, mainly
because: i) it affects relationships with top-tier customers positively but does not affect
relationships with bottom-tier customers; ii) it reduces marketing and sales costs.
According to Homburg, Droll and Totzek (2014), other important issues are related
with:
i) The ability to assess customer profitability;
ii) The quality of the information gave to customers;
iii) Selective organizational alignment;
iv) Selective senior-level involvement;
v) And selective elaboration of planning and control because they positively
moderate the link between a firm's prioritization strategy and actual
customer prioritization.

69
Thus, customization can be an important strategy for increasing customer satisfaction
and loyalty. According to Shugan (2005), many companies operating on the Internet
show a level of customization such as one-to-one customer service.
Given the importance of customer satisfaction in the success of supply chain
management, this paper investigates the impact of intermediaries and insurers on
consumer satisfaction (in line with Rai, Patnayakuni and Seth, 2006 apud Jean,
Sinkovics and Kim, 2008).
2.3. INSURANCE DISTRIBUTION
Intermediaries play a very important role in the insurance sector. Their recommendation
has a significant impact on customers buying process, satisfaction and loyalty.
Regarding these last two concepts, insurance sector has some particularities. Usually
loyal behaviors exist between intermediaries and customers (B2C), and not between
customers and insurers. Eventually this leads to high churn rates in the insurance sector
(see Short, Graefe and Schoen, 2003). In this context, the fact that keeping an existing
customer can cost six times less than bringing a new customer (Rosenberg and Czepiel,
1984) represents a major motivation for business organizations to retain customers.
According to The Council of Insurance Agents & Brokers (TCIAB, 2015), insurance
intermediaries facilitate the placement and purchase of insurance, and provide services
to insurance companies and consumers that complement the insurance placement
process. According to Eckardt and Rathke-Doppner (2010):
The profound information asymmetries between consumers and insurance companies
have resulted in the evolution of institutions that mediate between consumers and
insurance companies. Insurance intermediaries such as exclusive agents and insurance
brokers hold an important position as matchmakers between the supply and demand
sides on insurance markets.

70
Rose (1999) presents different cost reductions from intermediaries’ service, such as
search costs, information costs, opportunity costs (for more specific understanding, see
Table 28).
Transaction
stages
Intermediary service Cost reduction
Searching and
matching
• Direct sales of information
• Matchmaking
• Market-making
• Search costs
• Information costs
• Opportunity costs of
time
Availability or
products and
immediacy
• Compensation of variances
in demand and supply
• Opportunity costs of
time
Negotiating and
contracting
• Strong bargaining position
• Exploitation of differences
in contract terms between
supply and demand market
side
• To standardize contracts
• Negotiation costs
• Information costs
• Administrative costs
• Opportunity cost of
time
Monitoring and
guaranteeing
• Expertise in determining
product and service quality
• Cross-sectional and
temporal reuse of
information
• Guaranteeing high product
quality
• Information costs
• Monitoring and
control costs
• Costs resulting from
uncertainty
• Investment in
expertise
TABLE 28: TRANSACTION COST REDUCTION FROM INTERMEDIARIES
(ROSE, 1999)
There are different channels of insurance products distribution, such as intermediaries
(e.g.: multibrand intermediaries, brokers, reinsurance, banks, postal, etc.) and direct sell

71
(insurers). The intermediary's recommendation plays an important role in insurance
sales (see Doney and Cannon, 1997; Jap, 2000; Beloucif, Donaldson and Kazanci,
2004; Chang, 2006; O’Loughlin and Szmigin, 2007; Robson and Sekhon, 2011;
Brophy, 2013).
Because insurance intermediaries are the main insurance customer–firm interaction
touch point in Portugal, and because they are market leaders in terms of sales (see Table
29), this investigation analyzes the relevance of insurers and intermediaries on the
consumer experience (Jean, Sinkovics and Kim, 2008). This issue is particularly
important in the insurance industry if we consider that “when performance levels and
service offering become too similar within an industry, price is the the only competitive
weapon that remains” (see Bolton, Gustafsson, McColl-Kennedy, Sirianni and Tse,
2014).
Structure of distribution channels
Non-life (%) Life (%)
Intermediaries 89.7 95.3
Tied and captive agents 17.1 77
Brokers 17.6 1
Multi-brand intermediaries 54 17.3
Reinsurance 0 0
Of which: banks 16.1 76.7
Of which: postal 0 8.3
Direct Sell 9.8 4.5
Office 8.1 4.5
Internet 0.3 0
Phone 1.5 0
Others 0.5 0.2
TABLE 29: STRUCTURE OF INSURANCE DISTRIBUTION CHANNELS IN 2013
(“ASSOCIAÇÃO PORTUGUESA DE SEGUROS”, I.E., PORTUGUESE
ASSOCIATION OF INSURANCE, 2014)

72
STUDY 1
3. METHODOLOGY
3.1. SAMPLE
Data was collected from 366 consumers of car insurance. 60.1% were men and 39.9%
women (age: mean=43.79; standard deviation=12.209; minimum=19; maximum=80).
The sample error is ± 5.12 (p=q=50), with a level of confidence of 95% (k=2 sigma).
3.2. DATA COLLECTION
In order to respond to the scientific and managerial challenge of insurer y (development
of a simple tool that could be quickly applied to study customer satisfaction), the
procedure for collecting data for this study encompassed two important stages:
• Stage 1: In order to identify the most important attributes, authors carried out
three focus groups. Two of these focus groups were conducted in the B2C
market (customers) and one in the B2B (intermediaries). Selected attributes
were:
o Number of insurance proposals presented by intermediaries;
o Intermediaries’ recommendation was explained;
o Problems’ resolution by intermediaries;
o Problems’ resolution by insurers;
o Insurers’ fast response to customers’ problems;
o Online services from insurers;
o Contact made by insurers to know if there was any problem;
o Payment facilities;
o Quality of services from insurers;
o Quality of services from intermediaries.

73
• Stage 2: Data were collected through personal interviews, using an ad hoc
questionnaire developed specifically for this research. Interviews took
approximately 20 minutes each to be completed and they were conducted during
July 2013.
4. RESULTS
4.1. DESCRIPTIVE ANALYSIS
As can be seen from Table 30, the higher results are mostly related with intermediaries.
For example: i) the services’ quality provided by intermediaries is evaluated with a
4.12, while insurers with a 3.88; ii) resolution of problems by intermediaries gets 4,
while insurers get 3.77.
These results are even more relevant if we consider the fact that expectations are higher
for intermediaries than for insurers (3.42 and 3.19, respectively). It is also important to
highlight the level of satisfaction with intermediaries and insurers, as intermediaries
have a higher rating for this attribute (4.38 and 4.01, respectively). The only negative
evaluation is related to contact made by insurers (2.88). Finally, it is important to note
that two elements related to intermediaries present a high standard deviation: the
explanation of intermediaries’ recommendations, and the number of products presented
to customers (1.012 and .988, respectively). This may mean that there are many
customers who are unsatisfied with the performance of these attributes.

74
Code Items Mean Standard
Deviation
Bro_1 Number of insurance proposals presented by
intermediaries
3,57 0,988
Bro_2 Intermediaries’ recommendation was explained 3,88 1,012
Bro_3 Problems’ resolution by intermediaries 4 0,939
Ins_1 Problems’ resolution by insurers 3,77 0,876
Ins_2 Insurers’ fast response to customers’ problems 3,71 0,848
Ins_3 Online services from insurers 3,24 0,881
Ins_4 Contact made by insurers to know if there was any
problem
2,88 0,872
Ins_5 Payment facilities 3,8 0,951
Qual_i Quality of services from insurers 3,88 0,593
Qual_b Quality of services from intermediaries 4,12 0,772
Exp_i Expectation-experience with your insurer 3,19 0,516
Exp_b Expectation-experience with your intermediary 3,42 0,699
Sat_i Satisfaction with insurers 4,01 0,719
Sat_b Satisfaction with intermediaries 4,38 0,785
TABLE 30: DESCRIPTIVE ANALYSIS
4.2. MEASUREMENT MODEL
The first step was to perform an exploratory factor analysis in order to understand how
our data was composed in terms of dimensions. We used the maximum likelihood (ML)
method for extraction and PROMAX for rotation. After analyzing communalities, we
removed items with values lower than 0.3 (“ins_3”, “ins_4”, “ins_5” and “exp_i”). Our
model was then able to explain 61.871% of the data.

75
Factor
Initial eigenvalues Extraction Sums of Squared
Loadings
Rotation sums of
Squared
Loadingsa
Total % of
variance
Cumulative% Total % of
variance
Cumulative% Total
1 4,32 43,201 43,201 3,7 36,997 36,997 3,141
2 1,598 15,984 59,185 1,535 15,35 52,347 2,975
3 1,322 13,22 72,406 0,952 9,524 61,871 2,395
4 0,761 7,607 80,013
5 0,494 4,939 84,952
6 0,486 4,86 89,812
7 0,33 3,302 93,114
8 0,299 2,99 96,104
9 0,203 2,028 98,132
10 0,187 1,868 100
Extraction method: Maximum Likelihood
a. When factors are correlated, sums of squared loadings cannot be added to obtain a total variance
TABLE 31: TOTAL VARIANCE EXPLAINED
Kaiser-Meyer-Olkin value obtained is 0.775, indicating a good fit.
Kaiser-Meyer-Olkin Measure of Sampling
Adequacy
.775
Bartlett’s Test of Sphericity
Approx. Chi-square 1816.927
df 45
Sig. .000
TABLE 32: KMO AND BARTLETT’S TEST

76
According to Table 33, it is possible to identify three factors:
• Factor 1: Quality of services provided by intermediaries, quality of services
provided by insurers, expectation–experience with insurers, expectation–
experience with intermediaries, satisfaction with insurers and satisfaction with
intermediaries.
o This factor is related to “overall satisfaction” of customers.
• Factor 2: Resolution of problems by intermediaries, number of products
presented by intermediaries and explanations given by intermediaries about their
recommendation.
o This factor is related to actions that customers value most about
intermediaries.
• Factor 3: Time taken by insurers in order to solve customers’ problems and
positive resolution of problems by insurers.
o This factor is related to actions that customers value most about insurers.

77
Items Factor
1 2 3
Bro_1 0,788
Bro_2 0,869
Bro_3 0,681
Ins_1 0,935
Ins_2 0,807
Qual_I 0,551
Qual_B 0,725
Exp_B 0,455
Sat_I 0,581
Sat_B 0,887
Extraction method: Maximum Likelihood
Rotation method: Promax com with Kaiser Normalization
a. Rotation converged in 6 iterations.
TABLE 33: PATTERN MATRIX
All loadings are greater than 0.3 (Table 33), so convergent validity is achieved. There
are no correlations between factors greater than 0.7 (Table 34) or cross loadings (see
Table 33).
Factor 1 2 3
1 1,000 ,523 ,350
2 ,523 1,000 ,325
3 ,350 ,325 1,000
Extraction Method: Maximum Likelihood.
Rotation Method: Promax with Kaiser Normalization.
TABLE 34: FACTOR CORRELATION MATRIX

78
RELIABILITY ANALYSIS
In order to measure reliability, we used Cronbach’s alpha with a cut-off value of 0.7
(see Nunnaly, 1978). For the overall scale Cronbach’s alpha is 0.848. Cronbach’s alpha
for factor 1, 2 and 3, are 0.848, 0.866 and 0.798 respectively. The measurement model
has an acceptable fit to data. The chi-square of the measurement model is significant
(χ2=118.090, df=29, p<0.001). As the chi-square value is sensitive to sample size, we
present additional fit indices: NFI=0.935, GFI=0.945, CFI=0.950, RMSEA=0.096. So,
the model has an acceptable fit.
MULTICOLLINEARITY ANALYSIS
According to Hair, Anderson, Tatham and Black (2005), the Variance Inflation Factor
(VIF) value should be 10 or less in order to achieve acceptable level of collinearity. In
our model, VIF value is 4.072.

79
Items Standardized loadings
Sat <--- Bro 0,799* Sat <--- Ins -0,145
Ins_2 <--- Ins 0,791* Ins_1 <--- Ins 0,992* Bro_3 <--- Bro 0,91* Bro_2 <--- Bro 0,754* Bro_1 <--- Bro 0,675* Sat_B <--- Sat 0,763* Sat_I <--- Sat 0,364*
Exp_B <--- Sat 0,539* Qual_B <--- Sat 0,946* Qual_I <--- Sat 0,493*
*Significant (p<0.001)
Intermediaries’ performance (Alpha=0.866) Insurers’ performance (Alpha=0.798) Customers’ satisfaction (Alpha=0.848)
TABLE 35: MEASUREMENT INFORMATION
All items are statistically significant, except the insurer construct.

80
Regression Weights: (Group number 1 - Default model)
Estimate S.E. C.R. P
Sat <--- Bro ,261 ,044 5,901 ***
Sat <--- Ins -,057 ,023 -2,490 0,013
Ins_2 <--- Ins 1,000
Ins_1 <--- Ins 1,269 ,119 10,690 ***
Bro_3 <--- Bro 1,000
Bro_2 <--- Bro ,880 ,060 14,626 ***
Bro_1 <--- Bro ,792 ,062 12,716 ***
Sat_B <--- Sat 2,304 ,318 7,246 ***
Sat_I <--- Sat 1,000
Exp_B <--- Sat 1,448 ,248 5,833 ***
Qual_B <--- Sat 2,762 ,416 6,638 ***
Qual_I <--- Sat 1,106 ,142 7,813 ***
TABLE 36: REGRESSION WEIGHTS
The final model is able to explain 55% of the data. However, the effect of satisfaction
with the insurer is not statistically significant (β= -.057; p=0.013). This seems to
indicate that customer satisfaction can be explained to a large degree with reference to
an intermediary’s recommendation (β= .261; p<0.001).

81
FIGURE 3: CAUSAL MODEL

82
STUDY 2
5. METHODOLOGY
5.1. SAMPLE
Data was collected from 433 insurance customers (59.7% men; 40.3% women), aged
between 20 and 80 years old (Mean=43.95; Standard Deviation=12.195). The sample
error was ± 4.71% (p=q=50), with confidence level of 95% (k=2 sigma).
5.2. ATTRIBUTES’ SELECTION
In order to simplify the respondents’ task, seven attributes were finally selected:
o Online services from insurers;
o Contact made by insurers to know if there was any problem;
o Promotion;
o Insurer;
o Intermediaries’ recommendation;
o Premium (price);
o Resolution problem.
5.3. PROCEDURE
Data were gathered based on a rectangular matrix of 433 x 7 (subjects x attributes).
Subjects were asked to order seven attributes based on their preferences. We used
ALSCAL during this procedure because it incorporates individual differences in
multidimensional scaling models with the multidimensional unfolding (MDU) model.
ALSCAL uses the alternating least squares approach (see Takane, Young and de
Leeuw, 1977).

83
6. RESULTS
Model’s fit is good (Stress =0.077; RSQ =0.994). Figure 4 shows the bidimensional
solution. Attributes such as “online services”, “insurers’ contacts” and “product
promotion” are related, and insurers are very close to those attributes.
Interestingly, intermediaries’ recommendation appears between “insurers” and
“premium” resembling its role of intermediation. Also, “the resolution of problems” is
closer to “intermediaries” than to insurers.
If the figure is carefully analyzed, the most part of customers gives more importance to:
i) premium; ii) resolution of problems; iii) intermediaries’ recommendation.
FIGURE 4: PERCEPTUAL MAP FROM MULTIDIMENSIONAL UNFOLDING
(MDU)

84
Through the figure 6 it is possible to observe in more detail how customers’ preferences
are structured exactly as the main dynamics of the insurance market. More specifically,
the the dynamics of the insurance supply chain. Concretely:
• Dimension 1 (vertical) shows premium as being communicated by
intermediaries but estimated by insurers (highlighted in green);
• On the one hand, dimension 2 (horizontal) indicates that the resolution of
problems/claims in the insurance business is closer to the intermediaries, albeit it
always depends on the insurers (e.g.: insurance expertise). On the other hand,
online services used for claims management are provided by insurers
(highlighted in orange).
FIGURE 5: CUSTOMERS’ PREFERENCES AND THE DYNAMICS OF THE
INSURANCE MARKET

85
7. CONCLUSIONS AND DISCUSSION
The insurance sector has some unique characteristics and functionalities. Generally,
insurance customers buy products from intermediaries, and only in a few cases directly
from insurers. Intermediaries have the majority of the market share, making them a key
player in the insurance market (distribution).
Qualitative results from the three focus groups (with intermediaries and customers) have
allowed us to identify 14 items that most affect insurance customer satisfaction.
After obtaining quantitative data, an exploratory factor analysis was performed,
identifying three constructs/factors: a) one was related to the time taken by insurers in
order to solve customers’ problems (claims management) in an appropriate manner; b)
another one related to the actions that customers value most in intermediaries; c) and
another one related to the “overall satisfaction” of customers.
Of those 14 items, four did not fit well in the model. Thus, the final model had three
elements associated with intermediaries, two elements associated with insurers and five
elements related with the expectation–experience and “overall satisfaction” of
customers. The final model was able to explain 55% of the data.
The most interesting result indicates that customers’ satisfaction associated to insurers is
not statistically significant in customers’ global satisfaction. This can be explained
because customers are loyal to intermediaries and not so much with insurers (Chang,
2006; O’Loughlin and Szmigin, 2007; Eckardt and Rathke-Doppner, 2010; Robson and
Sekhon, 2011; Brophy, 2013).
Regarding the preferences of insurance customers, purchase decision is mainly based in
three characteristics: a) the ability to solve problems (claims management); b) the
premium; c) and the recommendation of intermediaries. Interestingly, the majority of
the customers surveyed seems to associate more intermediaries to the resolution of
problems (claims management) and premium negotiation than to insurers. There are just
a few respondents who give greater importance to insurers than to intermediaries.
Finally, it is also interesting to find that customers preferences present similarities with
the insurance supply chain. Concretely, it is possible to compare two important
processes. One is related with premium and it seems that the recommendation of

86
intermediaries plays a central role in premium acceptance from customers (in line with
O’Loughlin and Szmigin, 2007; Eckardt and Rathke-Doppner, 2010; Robson and
Sekhon, 2011; Brophy, 2013), although premium is estimated by insurers. In this sense,
insurers should develop a closer partnership with intermediaries. In this context, there
are specific marketing strategies associated with the level of customers’ financial
involvement. For example, insurers and intermediaries should exchange more
information about customers’ preferences; or it should be presented products with more
coverage and services associated (such as online Web service platform, account
manager) for customers who buy more expensive products. This way, it would be
possible to prevent customers comparing products with low prices (in line with
Gázquez-Abad and Sánchez-Pérez, 2009) and increase the attractiveness of products.
The other process is related to the resolution of problems (claims management). In order
to improve partnerships between insurers and intermediaries, it is important to improve
the online claims management services provided by insurers. Currently, intermediaries
spend too many resources (e.g.: time and money) in managing customers’ claims. This
way, customers would more more satisfied with insurers as well as with intermediaries.
Also, intermediaries would certainly prefer insurers that provide better claim
management services. Because of the crucial importance of these service employees
(e.g.: intermediaries), better training should be provided (see Bateson, Wirtz, Burke and
Vaughan, 2014). Intermediaries (as frontline employees) can play a more important role
in insurance customers experience if they have better back office services provided by
insurers (see Bolton et al., 2014).
Limitations and further research
The questionnaire developed in this study has already received a positive feedback from
two insurer operating in the Portuguese market because it easy to administrate through
telephonic inquiry and results are very important in terms of services supply
management. However, the questionnaire can still be improved.
In this study it was not developed nor tested an IT that could improve the supply chain
related to claims management. In this sense, we suggest carrying out focus groups

87
(composed by insurers, intermediaries, customers and IT developers and programmers)
in order to develop an online tool that would improve claims management.

88
CHAPTER IV – CONCLUSIONS, LIMITATIONS AND FURTHER
RESEARCH

89
GENERAL CONCLUSIONS
The main purpose of this study was to analyze the insurance market from a marketing
strategy perspective. Much of the literature on the insurance industry focuses on
actuarial models, risk management, regulation. So, this study investigated three critical
topics:
1. The determinants of consumer price sensitivity through four important
hypotheses;
2. The importance of the strategic order of products’ attributes presentation in the
insurance market;
3. The individual relevance of insurers and intermediaries on customers’
satisfaction and preferences.
The first topic was analyzed based on four hypotheses. Hypothesis 1 stated that
customers with a higher financial involvement with products were less price sensitive.
Results confirmed this hypothesis. Hypothesis 2 stated that loyal customers were less
price sensitive. Statically, this hypothesis was not confirmed but findings show some
differences that cannot be neglected in terms of marketing strategies in the insurance
sector such as loyal programs. Hypothesis 3 affirmed that loyal customers were more
sensitive to price bundling strategies than nonloyal customers. Findings confirmed this
hypothesis, so bundling strategies could play an important role in product and service
differentiation instead of traditional price discounts. Considering the combined result of
hypotheses 3 and 4, brands and intermediaries must be aware that, although loyal
customers can accept some degree of price oscillation, they still give great importance
to price. This may indicate that both insurers and intermediaries may be more likely to
be successful in increasing their revenues through bundling strategies than by simply
increasing price. Finally, hypothesis 4 indicated that partitioned prices had better
acceptance than combined prices. Therefore, salespeople should pay special attention to
these results when they use price bundling strategies.

90
In the second topic - the importance of the strategic order of products’ attributes
presentation in the insurance market – some interesting results were also obtained. For
instance, when price is presented at the end and is preceded by a relevant attribute (such
as the intermediary’s recommendation), its importance is lower. Concerning the use of
price bundling, a primacy effect was detected, because when this attribute is presented
at the beginning, it gets its highest importance.
Finally, the third topic - The individual relevance of insurers and intermediaries on
customers’ satisfaction and preferences – important results were obtained. Only
intermediaries have a statistic impact on consumers’ satisfaction. This results do not
mean that insurers have no impact on consumers’ satisfaction, but it is the
intermediaries that usually manage customers’ claims. This finding seems to be
confirmed through the similarities that exist between consumers’ preferences and the
insurance supply chain.
THEORETICAL CONTRIBUTIONS
This study addresses some important gaps in the insurance services marketing literature.
Concretely, chapter I analyzes the specific importance of key characteristics (attributes)
in the insurance sector. It also analyzes some determinants of consumers’ price
sensitivity in the insurance market, as well as some determinants of price bundling
strategies. This studies demonstrates that consumers’ financial involvement has a
statistical impact on price sensitivity and that loyalty behaviors increase consumers’
price bundling acceptance. Finally, price elasticity of demand is elastic, customers are
sensitive to this price bundling.
In chapter II, the order of attributes presentation is studied in order to cover a concrete
gap in the literature: how important is the strategic order of products’ attributes
presentation in the insurance business. Primacy, recency and transfer effects were
detected.
In chapter III, the main aim was to try to understand if insurance customers’ satisfaction
is more affected by insurers or intermediaries, and understand insurance customers’

91
preferences. Findings show that customers’ satisfaction is statistically affected by
intermediaries and that insurance customers’ preferences follow a similar dynamic as
the insurance market supply chain, i.e., it depends primarily on intermediaries.
MANAGERIAL IMPLICATIONS
In short, intermediaries play a central role in the insurance market dynamics and
insurance supply chain, as well as in customers’ satisfaction. In order increase
intermediaries’ preference, insurers should increase their support and partnership with
intermediaries as mentioned by Hawksby (2015). This would be especially important in
terms of claims management services. Price bundling increases insurances and
intermediaries’ revenues and profits. So, they should me used more often. In order to
decrease the importance of premium, salespeople should present first the insurer,
followed by the bundling strategy, the intermediary’s recommendation and, finally, the
premium.
LIMITATIONS AND FURTHER RESEARCH
The sample used in the study of consumers’ acceptance of partitioned price versus
combined price was 42 (n=42). In future researches it would be important to have a
larger sample. Intermediaries could play an important role giving qualitative feedback
on how customers react to bundling strategies and what could be other anchor products
and complementary products. It would be interesting to analyze if bundling strategies
are truly able to improve loyalty programs and to bring new customers.
It would be interesting to develop long-term agreements with loyal customers of 3 years
with some benefits, such as more coverage, freezing the price of auto insurance during
the 3 years, increase cross-selling offers (e.g., auto insurance, home insurance, and
health insurance).

92
It could also be important to offer an integrated advisory service based on a dedicated
online Web service platform, an account manager (as in banking), and a specialized
salesperson in order to convert a standard transactional sale to a customer relationship
marketing, i.e., CRM (Sheth, 2002; Baron, Warnaby, and Hunter-Jones, 2014).
It would be interesting to study if it is better that insurers and intermediaries present first
products with more coverage and services associated (e.g., online Web service platform,
account manager) to prevent customers comparing products with low prices (in line
with Gázquez-Abad and Sánchez-Pérez, 2009).
In would be also interesting to test different anchor products as well as different
bundling combinations. It would also be interesting to study the ideal number of
products that would compose the bundling strategy, for example, two anchor products
and a price discount in the third product or different percentages of price discounts in
the two associated products (e.g., home insurance and health insurance). It would be
interesting to understand if the recommended order of attributes’ presentation is able to
improve sells.

93
REFERENCES
REFERENCES (1)
Adams, W. and Yellen, J. (1976), “Commodity bundling and the burden of monopoly”,
Quarterly Journal of Economics, Vol. 90, No. August, pp. 475-498.
Anderson, E. and Mittal, V. (2000), “Strengthening the satisfaction-profit chain”,
Journal of Service Research, Vol. 3, No. 2, pp. 107-20.
Associação Portuguesa de Seguros (APS, 2013), Seguros em Portugal: Panorama do
mercado segurador 12/1, Associação Portuguesa de Seguros, Lisboa.
Assunção, J. and Meyer, R. (1990), “The optimality of consumer stockpiling strategies”,
Marketing Science, Vol. 9, pp. 18-41.
Avlonitis, G. and Indounas, K. (2006), “Pricing practices of service organizations”,
Journal of Services Marketing, Vol. 20, No. 5, pp. 346-356.
Baron, S., Warnaby, G. and Hunter-Jones, P. (2014), “Service(s) marketing research:
Developments and directions”, International Journal of Management Reviews, Vol.
16, pp. 150-171.
Barroso, C. and Picón, A. (2012), “Multi-dimensional analysis of perceived switching
costs”, Industrial Marketing Management, Vol. 41, No. 3, pp. 531–543.
Bennett, R. and Rundle-Thiele, S. (2005), “The brand loyalty life cycle: Implications for
Marketers”. Journal of Brand Management, Vol. 12, No. 4, pp. 250-263.
Bertini, M. and Wathieu, L. (2008), “Attention arousal through price partitioning”,
Marketing Science, Vol. 27, No. 2, pp. 236-246.
Bloemer, J. and Odekerken-Schröder, G. (2002), “Store satisfaction and store loyalty
explained by customer - and store - related factors”. Journal of Consumer
Satisfaction, Dissatisfaction and Complaining Behavior, Vol. 15, pp. 68-80
Bolton, R.N. and Lemon, K.N. (1999), “A dynamic model of customers' usage of
services: Usage as an antecedent and consequence of satisfaction”, Journal of
Marketing Research, Vol. 36, No. 2, pp. 171–186.

94
Brockett, T. and Xia, X. (1995), “Operation research in insurance: A review”,
Transactions of Society of Actuaries, Vol. 47, pp. 7-87.
Brown, R. (1974), “Sales Response to Promotions and Advertising”, Journal of
Advertising Research, Vol. 14, No. 4, pp. 33–39.
Brito, D. and Vasconcelos, H. (2015), “Inter-firm bundling and vertical product
differentiation”, Scandinavian Journal of Economics. Vol. 117, No. 1, pp. 1-27.
Brophy, R. (2011), “Autonomy of a rebrand: How Aviva came to Ireland”, Institute of
Technology Blanchardstown Journal, Vol. 21, No. May, pp.102-107
Brophy, R. (2012), “Development of insurance regulation in Ireland”, Journal of
Financial Regulation and Compliance”, Vol. 20, No. 3, pp. 248-263.
Brophy, R. (2013a), “Adding value to insurance products: The AXA Irish experience”,
Journal of Product & Brand Management, Vol. 22, No. 4, pp. 293-299.
Brophy, R. (2013b), “Bancassurance: An insurance concept from a Irish perspective”,
Journal of Financial Regulation and Compliance, Vol. 21, No. 4, pp. 319-333.
Brophy, R. (2014a), “Financial services education”, Journal of Financial Regulation
and Compliance, Vol. 22, No. 2, pp. 78-95.
Brophy, R. (2014b), “Rebrand in crisis: How Liberty came to Ireland”, Journal of
Strategic Marketing, Vol. 22, No. 2, pp. 93-103.
Brough, A.R. and Chernev, A. (2012), “When opposites detract: categorical reasoning
and subtractive valuations of product combinations”, Journal of Consumer
Research, Vol. 39, No. 2, pp. 399–414.
Chakravarti, D., Rajan, K., Pallab, P. and Srivastava, J. (2002), “Partitioned
presentation of multi-component bundle prices: Evaluation, choice, and underlying
processing effects”, Journal of Consumer Psychology, Vol. 12, No. 3, pp. 215-229.
Chang, H-H. and Chen, F-P. (2014), “When is a 9-ending price perceived lower than a
0-ending price? The moderating role of price consciousness”, International Journal
of Business & Information, Vol. 9, No. 1, pp. 89-116.

95
Choi, J., Li, Y., Rangan, P., Chatterjee, P. and Singh, S. (2014), “The odd-ending price
justification effect: The influence of price-endings on hedonic and utilitarian
consumption”, Journal of the Academy of Marketing Science, Vol. 42, No. 5, pp.
545-557.
Clarke, K. and Belk, R. (1978), “The effects of product involvement and task definition
on anticipated consumer effort”, in Hunt, H.K. and Arbor A, Advances in Consumer
Research Vol. 5, Association for Consumer Research, pp. 313-318.
Cummins, J. and Tennyson, S. (1992), “Controlling automobile insurance costs”,
Journal of Economic Perspectives, Vol. 6, No. 2, pp. 95-115.
Datta, P.R. (2003), “The determinants of brand loyalty”, Journal of the American
Academy Business, Vol. 3, No. 1-2, pp. 138-145.
Deloitte (2012), “Telematics: Driving the automobile insurance market through
disruption), accessed March 19, 2015, http://www.deloitte.com/assets/Dcom-
UnitedStates/Local%20Content/Articles/Financial%20Services/Insurance/US_FSI_
TelematicsPOV_072412.pdf
Derrig, R. and Tennyson, S. (2011), “The impact of rate regulation on claims: Evidence
from Massachusetts automobile insurance, Risk Management and Insurance Review,
Vol. 14, No. 2, pp. 173-199.
Dolan, R.J. and Simon, H. (1996), Power pricing: How managing price transforms the
bottom line, The Free Press, New York.
Dominique-Ferreira, S., Rial, A. and Varela, J. (2012). “Minimizing the risks of
innovation in bottled water design: An application of Conjoint Analysis and focus
group”, African Journal of Business Management, Vol. 6, No. 31, pp. 9096-9104.
Drumwright, M. (1992), “A demonstration of anomalies in evaluations of bundling”,
Marketing Letters, Vol. 3, pp. 311-321.
Dyer, J., Furr, N. and Lefrandt, C. (2014), “The industries plagued by the most
uncertainty”, Harvard Business Review, September.

96
European Commission (2004), Council Directive 2004/113/EC of 13 December 2004,
accessed September 6, 2015, http://eur-
lex.europa.eu/LexUriServ/LexUriServ.do?uri=OJ:L:2004:373:0037:0043:EN:PDF
European Commission (2011), EU Justice Commissioner Viviane Reding meets with
leaders of Europe’s insurance industry, accessed September 6, 2015,
http://europa.eu/rapid/press-release_MEMO-11-624_en.htm?locale=en
Ferrell, O.C. and Hartline, M.D. (2005), Marketing Strategy (3rd Edition). Thomson
Learning/South-Western College Publishing, Ohio.
Gareth, G., Levin, I., Chakraborty, G. and Levin, A. (1990), “Consumer evaluation of
multi-product bundles: An information integration analysis”, Marketing Letters,
Vol. 2, No. 1, pp. 47-57.
Gázquez-Abad, J. and Sánchez-Pérez, M. (2009), “Characterizing the deal-proneness of
consumers by analysis of price sensitivity and brand loyalty: An analysis in the
retail environment”, The International Review of Retail, Distribution and Consumer
Research, Vol. 19, No. 1, pp. 1-28.
Gerdeman, D. (2013), “Product bundling is a smart strategy – But there’s a catch.
Forbes”, available at
http://www.forbes.com/sites/hbsworkingknowledge/2013/01/18/product-bundling-
is-a-smart-strategy-but-theres-a-catch/ (accessed 2 July 2014).
Gilbride, T., Guiltinan, J. and Urbany, J. (2008), “Framing effects in mixed price
bundling”, Marketing Letters, Vol. 19, pp. 125-139.
Golabi, K. (1985), “Optimal Inventory Policies when Ordering Prices are Random”,
Operations Research, Vol. 33, pp. 575-588.
Goldsmith, R.E. (2000), “Service innovativeness and price sensitivity: An exploratory
study”, paper presented at the Association of Marketing Theory and Practice, 5.
Moore, D. (Ed.), Statesboro, pp. 85-91.
Goldsmith, R.E. (2002), “Some personality traits of frequent clothing buyers”, Journal
of Fashion Marketing and Management, Vol. 6, No. 3, pp. 303-316.

97
Goldsmith, R.E. and Hofacker, F. (1991), “Measuring consumer innovativeness”,
Journal of the Academy of Marketing Science, Vol. 19, No. 3, pp. 209-221.
Goldsmith, R.E. and Newell, S.J. (1997), “Innovativeness and price sensitivity:
Managerial, theoretical and methodological issues”, Journal of Product and Brand
Management, Vol. 6, No. 3, pp. 163-173.
Goodman, P.S., Fichman, M., Lerch, F. and Snyder, P.R. (1995), “Customer-firm
relationships, involvement, and customer satisfaction”, Academy of Management
Journal, Vol. 38, No. 5, pp. 1310-1324.
Green, P. (1977), “A new approach to market segmentation”, Business Horizons, Vol.
20, pp. 205-220.
Green, P. and Srinivasan, (1978), “Conjoint Analysis in consumer research: Issues and
outlook”, Journal of Consumer Research, Vol. 5, pp. 103-123.
Guiltinan, J.P. (1987), “The Price Bundling of Services: A Normative Framework”,
Journal of Marketing, Vol. 51, No. April, pp. 74–85.
Hawksby, D. (2015), “Hard/soft market”, Talbot Validus Group, accessed 27 April,
2015, http://www.willis.com/documents/energy/David%20Hawksby.pdf
Hupfer, N. and Gardner, D. (1971), “Differential involvement with products and issues:
An exploratory study", paper presented at the Association for Consumer Research,
Gardner D. (Ed.). MD: Association for Consumer Research, pp. 262-269.
Ibrahim, H. and Najjar, F. (2008), “Relationship bonding tactics, personality traits,
relationship quality and customer loyalty: Behavioral sequence in retail
environment”. The Icfai University Journal of Services Marketing, Vol. 6, No. 4, pp.
1-37
Iyer, R. and Muncy, J.A. (2005), “The role of brand parity in developing loyal
customers”, Journal of Advertising Research, Vol. 45, No. 2, pp. 222-228.
Jacada (2008), “Insurance providers: Improving customer retention through the contact
center”, White Papers, accessed March 19, 2015,
http://www.jacada.com/images/WhitePapers/pdfs/45.100.1108-Insurance-Providers-
Improving-Customer-Retention-through-the-Contact-Center.pdf

98
Jacoby, J. (1975), “A brand loyalty concept: comments on a comment”, Journal of
Marketing, Vol. 12, No. November, pp. 484-487.
Janiszewski, C. and Cunha, M. (2004), “The influence of price discount framing on the
evaluation of a product bundle”, The Journal of Consumer Research, Vol. 30, No. 4,
pp. 534-546.
Jedidi, K. and Jaspal, S. (2009), “Willingness to pay: measurement and managerial
implications”, in Rao, V. (Ed.) Handbook of Pricing Research in Marketing,
Edward Elgar Publishing, Northampton, pp. 37-60.
Johnson, M.D., Herrmann, A. and Bauer, H. (1999), “The effects of price bundling on
consumer evaluations of product offerings”, International Journal of Research in
Marketing, Vol. 16, No. 2, pp. 129-142.
Kahneman, D. and Tversky, A. (1979), “Prospect theory: An analysis of decision under
risk”, Econometrica, Vol. 47, pp. 263-291.
Krishnamurthi, L. and Raj, S.P. (1991), “An empirical analysis of the relationship
between brand loyalty and consumer price elasticity”, Marketing Science, Vol. 10,
No. 2, pp. 172-183.
Krugman, H. (1977), “Memory without recall, exposure without perception”, Journal of
Advertising Research, Vol. 17, pp. 7-12.
Li, M-L, Gree, R., Farazmand, F. and Grodzki, E. (2012), Customer loyalty: influences
on three types of retail stores’ shoppers”, International Journal of Management and
Marketing Research, Vol. 5, No. 1, pp. 1-19.
Light, L. (1997), “Brand loyalty management: The basis for enduring profitable
growth”, Direct Marketing, Vol. 59, No. 11, pp. 36-43.
Mazumbar, T. and Jun, S. (1993), “Consumer evaluations of multiple versus single
price change”, Journal of Consumer Research, Vol. 20, pp. 441-450.
Molin, E., Oppewal, H. and Timmermans, H. (2000), “A comparison of Full Profile and
hierarchical information integration conjoint methods to modeling group
preferences”, Marketing Letters, Vol. 11, No. 2, pp. 165-175.

99
Morwitz, V.G., Greenleaf, E. and Johnson, E. (1998), “Divide and prosper: Consumers’
reactions to partitioned prices”, Journal of Marketing Research, Vol. 35, No.
November, pp. 453-463.
Naylor, G. and Frank, E. (2001), “The effect of price bundling on consumer perceptions
of value”, Journal of Services Marketing, Vol. 15, No. 4, pp. 270-281.
O’Loughlin, D. and Szmigin, I. (2005), “Customer perspectives on the role and
importance of branding in Irish retail financial services”, International Journal of
Bank Marketing, Vol. 21, No. 1, pp. 8-27.
O’Loughlin, D. and Szmigin, I. (2007), “Services branding: Revealing the rhetoric
within retail banking”, The Services Industries Journal, Vol. 27, No. 4, pp. 435-452.
Oppewal, H. and Klabbers, M. (2003), “Compromising between information
completeness and task simplicity: A comparison of self-explicated, hierarchical
information integration, and Full-Profile Conjoint methods”, Advances in Consumer
Research, Vol. 30, No. 1, pp. 298-304.
Picón, E., Varela, J. and Real, E. (2005), “Classificación y segmentación post hoc
mediante el análisis de conglomerados”, in Lévy Mangin, J-P. and Varela, J. (Eds),
Análisis Multivariable para las Ciencias Sociales, Pearson Prentice Hall, Madrid,
pp. 419-450.
PSA Insurance & Financial Services (2013), “PSA Perspective: Hard market vs. soft
market: The insurance industry’s cycle and why we’re currently in a hard market”,
accessed April 27, 2015, http://www.psafinancial.com/2013/01/hard-market-vs-soft-
market-the-insurance-industrys-cycle-and-why-were-currently-in-a-hard-market/
Rai, A. and Medha, S. (2013), “The antecedents of customer loyalty: An empirical
investigation in life insurance context”, Journal of Competitiveness, Vol. 5, No. 2,
pp. 139-163.
Rao, V. and Kartono, B. (2009), “Pricing objectives and strategies: A cross-country
survey”, in Rao, V. (Ed.) Handbook of Pricing Research in Marketing, Edward
Elgar Publishing, Northampton, pp. 9-36.

100
Raju, J. (1992), “The effect of price promotions on variability in product category
sales”, Marketing Science, Vol. 11, No. 3, pp. 207-220.
Ramirez, E. and Goldsmith, R. E. (2009), “Some antecedents of brand loyalty”, Journal
of Marketing Theory and Practice, Vol. 17, No 3, pp. 199-213.
Rauyruen, P., and Miller, K.E. (2007), “Relationship quality as a predictor of B2B
customer loyalty”, Journal of Business Research, Vol. 60, pp. 21-31.
Reichheld, F.F. and Sasser, W.E. (1990), “Zero defections: Quality comes to services”,
Harvard Business Review, Vol. 68, No. 5, pp. 105-111.
Reichheld, F. and Teal, T. (1996), “The loyalty effect: The hidden force behind growth,
profits, and lasting value”. Boston: Harvard Business School Press.
Rial, A., Dominique-Ferreira, S. and Varela, J. (2011), “Conjoint Analysis: A case
study of the consumers’ preferences”, Portuguese Journal of Marketing, Vol. 26, pp.
37.
Richins, M.L., Bloch, P. H. and McQuarrie, E. (1992), “How enduring and situational
involvement combine to create involvement responses”, Journal of Consumer
Psychology, Vol. 1, pp. 143–153.
Robson, J. and Sekhon, Y. (2011), “Addressing the research needs of the insurance
sector”, International Journal of Bank Marketing, Vol. 29, No. 7, pp. 512-516.
Rowley, J. (2005), “The four Cs of customer loyalty”, Marketing Intelligence and
Planning, Vol. 23, No. 6, pp. 574-581.
Roy, S. (2012), “Brand loyalty in insurance companies”, Journal of Economic
Development, Management, IT, Finance and Marketing, Vol. 4, No 1, pp. 12-26.
Russell-Bennett, R., McColl-Kennedy, J. and Coote, L. (2007), Involvement,
satisfaction, and brand loyalty in a small business services setting”, Journal of
Business Research, Vol. 60, pp. 1253-1260.
Sheikhzadeh, M. and Elahi, E. (2013), “Product bundling: Impacts of product
heterogeneity and risk considerations”, International Journal Production
Economics, Vol. 144, pp. 209-222.
101
Sheth, J. (2002), "The future of relationship marketing", Journal of Services Marketing,
Vol. 16, No. 7, pp. 590-592.
Shoemaker, R., Mitra, D., Chen, Y. and Essegaier, S. (2003), “A comment on price
endings when prices signal quality”, Management Science, Vol. 49, No. 12, pp.
1753-1758.
Soeini, R. and Rodpysh, K. (2012), “Applying data mining to insurance customer churn
management”, International Proceedings of Computer Science & Information Tech,
Vol. 30, pp. 82-92.
Stremersch, S. and Tellis, G. (2002), “Strategic Bundling of Products and Prices: A
New Synthesis for Marketing”, Journal of Marketing, Vol. 66, No. 1, pp. 55-72.
Tennyson, S. (1997), “The impact of rate regulation on state automobile insurance
markets”, Journal of Insurance Regulation, Vol. 15, pp. 502-523.
Thaler, R. (1985), “Mental accounting and consumer choice”. Marketing Science, Vol.
3, pp. 199-214.
Tung, W., Capella, P. and Tat, P. (1997), “Service pricing: A multi-step synthetic
approach”, Journal of Services Marketing, Vol. 11, No. 1, pp. 53-65.
Varela, J., Picón, E. and Braña, T. (2004), “Segmentation of the Spanish domestic
tourism market”, Psicothema, Vol. 16 No. 1, pp. 76-83.
Ward, J. (1963), "Hierarchical Grouping to Optimize an Objective Function", Journal of
the American Statistical Association, Vol. 58, pp. 236–244.
Weiss, M., Tennyson, S. and Regan, L. (2010), “The effects of regulated premium
subsidies on insurance costs: An empirical analysis of automobile insurance”, The
Journal of Risk and Insurance, Vol. 77, No. 3, pp. 597-624.
Wind, Y. (1978), “Issues and advances in segmentation research”, Journal of Marketing
Research, Vol. 15, pp. 317-337.
Xia, L. and Monroe, K. (2004), “Price partitioned on the internet”, Journal of
Interactive Marketing, Vol. 18, No. 4, pp. 63-73.

102
Yadav, M. (1994), “How buyers evaluate product bundles: A model of anchoring and
adjustment”, Journal of Consumer Research, Vol. 21, No. September, pp. 342-353.
Yoon, K. and Tran, T. (2011), “Revisiting the relationship between consumer loyalty
and price sensitivity: the moderating role of deal-proneness”, Journal of Marketing
Theory and Practice, Vol. 19, No. 3, pp. 293-306.
Yu, Y-T. and Dean, A. (2001), “The contribution of emotional satisfaction to consumer
loyalty”, International Journal of Service Industry Management, Vol. 12, No. 3, pp.
234-250.
Zaichkowsky, J. (1988), “Involvement and the price cue”, Advances in Consumer
Research, Vol. 15, pp. 323-327.

103
REFERENCES (2)
Associação Portuguesa de Seguros (APS, 2013), Seguros em Portugal: Panorama do
mercado segurador 12/1. Associação Portuguesa de Seguros, Lisboa.
Acito, F. (1977), “An investigation of some data collection issues in Conjoint
Measurement”. American Marketing Association Educator’s Proceedings, pp.
82-85.
Adams, W. and Yellen, J. (1976), “Commodity bundling and the burden of monopoly”,
Quarterly Journal of Economics, Vol. 90, No. August, pp. 475-498.
Atkinson, R. and Shiffrin, R. (1968), “Human memory: A proposed system and its
control processes”. In: K.W. Spence and J.T. Spence (ed) The Psychology of
Learning and Motivation: Advances in Research and Theory. Academic Press,
New York, pp. 89-195
Bagchi, R. and Davis, D. (2012), “$29 for 70 items or 70 items for $29? How
presentation order affects package perceptions”, Journal of Consumer Research,
Vol. 39, No. June, pp. 62-72.
Bagchi, R. and Li, X. (2011), “Illusionary progress in loyalty programs: Magnitudes,
reward distances, and step-size ambiguity”, Journal of Consumer Research, Vol.
37, No. February, pp. 888-901.
Barroso, C. and Picón, A. (2012), “Multi-dimensional analysis of perceived switching
costs”, Industrial Marketing Management, Vol. 41, No 3, pp. 531–543.
Brito, D. and Vasconcelos, H. (2015), “Inter-firm bundling and vertical product
differentiation”, Scandinavian Journal of Economics, Vol. 117, No. 1, pp. 1-27.
Brophy, R. (2013), “Adding value to insurance products: The AXA Irish experience”,
Journal of Product & Brand Management, Vol. 22, No. 4, pp. 293-299.
Brophy R, (2014), “Rebrand in crisis: How Liberty came to Ireland”, Journal of
Strategic Marketing, Vol. 22, No. 2, pp. 93-103.

104
Buda, R. and Zhang, Y. (2000), “Consumer product evaluation: The interactive effect of
message framing, presentation order, and source credibility”, Journal of Product
& Brand Management, Vol. 9, No. 4, pp. 229-242.
Cacioppo, J. and Petty, R. (1982), “The need for cognition”, Journal of Personality and
Social Psychology, Vol. 42, No. 1, pp. 116-131.
Chakravarti, D., Rajan, K., Pallab, P. and Srivastava, J. (2002), “Partitioned
presentation of multi-component bundle prices: Evaluation, choice, and
underlying processing effects”, Journal of Consumer Psychology, Vol. 12, No.
3, pp. 215-229.
Chrzan, K. (1994), “Three kinds of order effect in choice-based conjoint analysis”,
Marketing Letters, Vol. 5, pp. 165-172.
Cohen, J. (1994), “The earth is round (p < .05)”, American Psychologist, Vol. 49, No
12, pp. 997-1003.
Dhar, R., Nowlis, S. and Sherman, S. (1999), “Trying hard or hardly trying: An analysis
of context effects in choice”, Journal of Consumer Psychology, Vol. 9, No. 4,
pp. 189-200.
Dhar, R. and Simonson, I. (1992), “The effects of the focus of comparison on consumer
preference”, Journal of Marketing Research, Vol. 29, No. November, pp. 430-
440.
Diehl, K. and Zauberman, G. (2005), “Searching ordered sets: Evaluations from
sequences under search”, Journal of Consumer Research, Vol. 31, No. 4, pp.
824-832.
DeMoranville, C. and Bienstock, C. (2003), “Question Order Effects in Measuring
Service Quality”, International Journal of Research in Marketing, Vol. 20, No.
3, pp. 217-231.
DeSarbo, W. and Green, P. (1984), “Concepts, theory and techniques, Choice-
constrained conjoint analysis”, Decision Sciences, Vol. 15, pp. 291-323.
Drumwright, M. (1992), “A demonstration of anomalies in evaluations of bundling”,
Marketing Letters, Vol. 3, No. 4, pp. 311-321.

105
Eckardt, M. and Rathke-Doppner, S. (2010), “The quality of insurance intermediary
services – empirical evidence for Germany”, The Journal of Risk and Insurance,
Vol. 77, No. 3, pp. 667-701.
Fishbein, M. and Ajzen, I. (1975), “Belief, Attitude, Intention, and Behavior: An
Introduction to Theory and Research”. Addison-Wesley, Reading.
Gareth, G., Levin, I., Chakraborty, G. and Levin, A. (1990), “Consumer evaluation of
multi-product bundles: An information integration analysis”, Marketing Letters,
Vol. 2, No. 1, pp. 47-57.
Gatzert, N., Huber, C. and Schmeiser, H. (2010), “How do price presentation effects
influence consumer choice? The case of investment guarantees in unit-linked
life insurance products”. Working papers on risk management and insurance,
Vol. 82, pp. 1-38.
Gilbride, T., Guiltinan, J. and Urbany, J. (2008), “Framing effects in mixed price
bundling”, Marketing Letters, Vol. 19, pp. 125-139.
Guiltinan, J. (1987), “The price bundling of services: A normative framework”, Journal
of Marketing, Vol. 51, No. April, pp. 74–85.
Hamilton, R. and Srivastava, J. (2008), “When 2+2 is not the same as 1+3: Variations in
price sensitivity across components of partitioned prices”, Journal of Marketing
Research, Vol. 45, No. 4, pp. 450-461.
Harris, J. and Blair, E. (2012), “Consumer processing of bundled prices: When do
discounts matter?”, Journal of Product and Brand Management, Vol. 21, No. 3,
pp. 205-214.
Hogarth, R.M. and Einhorn, H.J. (1992), “Order effects in belief updating the belief
adjustment model”, Cognitive Psychology, January, pp. 1-55.
Hsee, C. and Zhang, J. (2004), “Distinction bias: Misprediction and mischoice due to
joint evaluation”, Journal of Personality and Social Psychology, Vol. 86, No. 5,
pp. 680-695.

106
Jedidi, K. and Jaspal, S. (2009), “Willingness to pay: measurement and managerial
implications”. In: Rao, V. (Ed.) Handbook of Pricing Research in Marketing,
Edward Elgar Publishing, Northampton, pp. 37-60.
Johnson, R. (1987), “Adaptive Conjoint Analysis Sawtooth Software Conference on
Perceptual Mapping, Conjoint Analysis, and Computer Interviewing”. Sawtooth
Software, Ketcham.
Johnson, M., Herrmann, A. and Bauer, H. (1999), “The effects of price bundling on
consumer evaluations of product offerings”, International Journal of Research
in Marketing, Vol. 16, No. 2, pp. 129-142.
Li, C. (2009), “Primacy effect or recency effect? A long-term memory test of Super
Bowl commercials”, Journal of Consumer Behavior, Vol. 9, No. January-
February, pp. 32-44.
Molin, E., Oppewal, H. and Timmermans, H. (2000), “A comparison of Full Profile and
Hierarchical Information Integration Conjoint Methods to Modeling Group
Preferences”, Marketing Letters, Vol. 11, No. 2, pp. 165-175.
Nowlis, S. and Simonson, I. (1997), “Attribute-task compatibility as a determinant of
consumer preference reversals”, Journal of Marketing Research, Vol. 34, No.
May, pp. 205-218.
Okada, E. (2001), “Trade-ins, mental accounting, and products replacement decisions”,
Journal of Consumer Research, Vol. 27, No March, pp. 433-446.
O’Loughlin, D. and Szmigin, I. (2007), “Services branding: Revealing the rhetoric
within retail banking”, The Services Industries Journal, Vol. 27, No. 4, pp. 435-
452.
Oppewal, H. and Klabbers, M. (2003), “Compromising between information
Completeness and task simplicity: A comparison of self-explicated, hierarchical
information integration, and Full-Profile Conjoint methods”, Advances in
Consumer Research, Vol. 30, No. 1, pp. 298-304.

107
Orme, B., Alpert, M. and Christensen, E. (1997), “Assessing the validity of Conjoint
Analysis – continued”, Sawtooth Software Conference Proceedings, Idaho:
Ketchum, pp. 209-225.
Purohit, D. (1995), “Playing the role of buyer and seller: The mental accounting of
trade-ins”, Marketing Letters, Vol. 6, No. 2, pp. 101-110.
Rai, A. and Medha, S. (2013), “The antecedents of customer loyalty: An empirical
investigation in life insurance context”, Journal of Competitiveness, Vol. 5, No.
2, pp. 139-163.
Robson, J. and Sekhon, Y. (2011), “Addressing the research needs of the insurance
sector”, International Journal of Bank Marketing, Vol. 29, No. 7, pp. 512-516.
Rose, F. (1999), “The economics, concept, and design of information intermediaries”.
Physica Verlag, Heidelberg.
Sela, A. and Berger, J. (2012), “How attribute quantity influences option choice”,
Journal of Marketing Research, Vol. 49, No. December, pp. 942-953.
Sheikhzadeh, M. and Elahi, E. (2013), “Product bundling: Impacts of product
heterogeneity and risk considerations”, International Journal of Production
Economics, Vol. 144, No. 1, pp. 209-222.
Srivastava, J. and Chakravarti, D. (2011), “Price presentation effects in purchases
involving trade-ins”, Journal of Marketing Research, Vol. XLVIII, No. October,
pp. 910-919.
Stremersch, S. and Tellis, G. (2002), “Strategic bundling of products and prices: A new
synthesis for Marketing”, Journal of Marketing, Vol. 66, No. January, pp. 55-72.
Suri, R. and Monroe, K. (2003), “The effects of time constraints on consumers’
judgments of prices and products”, Journal of Consumer Research, Vol. 30, No.
June, pp. 92-104.
Suk, K., Lee, J. and Lichtenstein, D. (2012), “The influence of price presentation order
on consumer choice”, Journal of Marketing Research, Vol. XLIX, No. October,

108
pp. 708-717.
The Council of Insurance Agents & Brokers (2015), The role of insurance
intermediaries, retrieved on February 19 2015,
https://www.ciab.com/uploadedfiles/resources/roleofinsint.pdf
Xie, G-X. and Kahle, L. (2014), “Approach or avoid? The effect of regulatory focus on
consumer behavioral responses to personal selling attempts”, Journal of
Personal Selling & Sales Management, Vol. 34, No. 4, pp. 260-271.
Yadav, M. (1994), “How buyers evaluate product bundles: A model of anchoring and
adjustment”, Journal of Consumer Research, Vol. 21 No. September, pp. 342-
353.
Yan, R., Myers, C., Wang, J. and Sanjoy, G. (2014), “Bundling products to success: The
influence of complementarity and advertising”, Journal of Retailing and
Consumer Services, Vol. 21, pp. 48-53.
Zhu, R., Chen, X. and Dasgupta, S. (2008), “Can trade-ins hurt you? Exploring the
effect of a trade-in on consumers’ willingness to pay for a new product”,
Journal of Marketing Research, Vol. 45, No. April, pp. 159-170.

109
REFERENCES (3)
Andriopoulos, C. and Slater, S. (2013), Exploring the landscape of qualitative research
in international marketing, International Marketing Review, Vol. 30 No. 4, pp.
384-412.
Associação Portuguesa de Seguros (APS, 2013), Seguros em Portugal: Panorama do
mercado segurador 12/1. Associação Portuguesa de Seguros, Lisboa.
Bateson, J., Wirtz, J., Burke and Vaughan, C. (2014), “Psychometric sifting to
efficiently select the right service employees”, Managing Service Quality, Vol.
24 No 5, pp. 418-433.
Becker, J., Spann, M. and Totzek, S. (2014), “Implications of minimum contract
durations on customer retention”, Marketing Letters, forthcoming.
Beloucif, A., Donaldson, B. and Kazanci, U. (2004), “Insurance broker–client
relationships: An assessment of quality and duration”, Journal of Financial
Services Marketing, Vol. 8 No. 4, pp. 327-342.
Bernhardt, K. L., Donthu, N. and Kennett, P. A. (2000), “A longitudinal analysis of
satisfaction and profitability”, Journal of Business Research, Vol. 47 No. 2, pp.
161-171.
Bitner, M. J. (1990), “Evaluating service encounter: the effects of physical surroundings
and employee responses”, Journal of Marketing, Vol. 54, pp. 69-82.
Bodet, G. (2008), “Customer satisfaction and loyalty in service: two concepts, four
construct several relationships”, Journal of Retailing and Consumer Services,
Vol. 15 No. 3, pp. 156-162.
Bolton, R. N. (1998), “A dynamic model of the duration of the customer’s relationship
with a continuous service provider: the role of satisfaction”. Marketing Science,
Vol. 17 No. 1, pp. 45-65.

110
Bolton, R.N., Gustafsson, A., McColl-Kennedy, J., Sirianni, N.J. and Tse, D. (2014),
“Small details that make big differences: A radical approach to consumption
experience as a firm’s differentiating strategy”, Journal of Service Management,
Vol. 25 Vol. 2, pp. 253-274.
Brophy, R. (2013), “Adding value to insurance products: The AXA Irish experience”,
Journal of Product & Brand Management, Vol. 22 No. 4, pp. 293-299.
Chang, H-C. (2006), “Integrating the role of sales agent into the branding model in the
insurance industry”, The Journal of American Academy of Business, Vol. 8 No.
2, pp. 278-285.
Corominas, A. (2013), “Supply chains: What they are and the new problems they arise”,
International Journal of Production Research, Vol. 51 No. 23-24, pp. 6828-
6835.
Cunningham, R.M. (1956), “Brand Loyalty - What, Where, How Much?”. Harvard
Business Review, Vol. 34 No. January-February, pp. 116-128.
Dick, A.S. and Basu, K. (1994), “Customer loyalty: toward an integrated conceptual
framework”, Journal of the Academy of Marketing Science, Vol. 22, pp. 99-113.
Doney, P.M. and Cannon, J. (1997), “An examination of the nature of trust in buyer-
seller relationships”, Journal of Marketing, Vol. 61 No. 2, pp. 35-51.
Durvasula, S., Lysonski, S., Mehta, S. and Tang, B. (2004), “Forging relationships with
services: The antecedents that have an impact on behavioural outcomes in the
life insurance industry”, Journal of Financial Services Marketing, Vol. 8 No. 4,
pp. 314-326.
Eckardt M.,, and Rathke-Doppner S (2010), “The quality of insurance intermediary
services – empirical evidence for Germany”, The Journal of Risk and Insurance,
Vol. 77 No. 3, pp. 667-701.
Edvardsson, B., Johnson, M. D., Gustafson, A. and Strandvik, T. (2000), “The effects of
satisfaction and loyalty in profits and growth: Products versus services”, Total
Quality Management, Vol. 11 No. 7, pp. 917-927.

111
Fisher, M. L. (1997), “What is the right supply chain for your product?”, Harvard
Business Review, Vol. 75, pp. 105-117.
Gázquez-Abad, J. and Sánchez-Pérez, M. (2009), “Characterizing the deal-proneness of
consumers by analysis of price sensitivity and brand loyalty: An analysis in the
retail environment”, The International Review of Retail, Distribution and
Consumer Research, Vol. 19 No 1, pp. 1-28.
Gray, J., Roth, A. and Tomlin, B. (2007), Quality risk in outsourcing: Evidence from
the U.S. Drug Industry. Ohio State University Working Paper.
Guillén, M., Nielsen, J.P., Scheike, T.H. and Pérez-Marín, A.M. (2012), “Time-varying
effects in the analysis of customer loyalty: A case study in insurance”, Expert
Systems with Applications, Vol. 39 No. 3, pp. 3551–3558
Hair, J.F., Anderson, R.E., Tatham, R.L., and Black, W.C. (2005). Análise multivariada
de dados (5a. ed.). Porto Alegre: Bookman.
Homburg, C., Droll, M. and Totzek, D. (2008), “Customer prioritization: Does it pay
fff, and how should it be implemented?”, Journal of Marketing, Vol. 72 No. 5,
pp. 110-130.
Hung, Go., S. and Eldrigde, S. (2015), “New product introduction and supplier
integration in sales and operations planning: Evidence from the Asia Pacific
region”, Journal of Physical Distribution & Logistics Management, Vol. 45 No.
9/10.
Ismail, H.S. and Sharifi, H. (2006), “A balanced approach to building agile supply
chains”, International Journal of Physical Distribution & Logistics
Management, Vol. 36 No. 6, pp. 431-444.
Jap, S.D. (2000), “The strategic role of the salesforce in developing customer
satisfaction across the relationship lifecycle”, Journal of Personal Selling &
Sales Management, Vol. 11 No. 2, pp. 95-108.

112
Jean, R-J., Sinkovics, R. and Kim, D. (2008), Information technology and
organizational performance within international business to business
relationships: A review and an integrated conceptual framework, International
Marketing Review, Vol. 25 No. 5, pp. 563-583.
Khan, I. (2012), “Impact of customers’ satisfaction and customers’ retention on
customer loyalty”, International Journal of Scientific & Technology Research,
Vol. 1 No. 2, pp. 106-110.
Ke, J., Windle, R. J., Han, C. and Brito, R. (2015), “Aligning Supply Chain
Transportation Strategy with Industry Characteristics – Evidence from the US-
Asia Supply Chain”, International Journal of Physical Distribution & Logistics
Management, Vol. 45 No. 9/10, pp. 1-38.
Kim, H.S., and Yoon, C.H. (2004), “Determinants of subscriber churn and customer
loyalty in the Korean mobile telephony market Determinants of subscriber churn
and customer loyalty in the Korean mobile telephony market”,
Telecommunications policy, Vol. 28, pp. 751- 765.
Ko, S. C., Saad, S. and Aranachalam, S. (2006), “Competing in the 21st century supply
chain through supply chain management and enterprise resource planning
integration”, International Journal of Physical Distribution & Logistics
Management, Vol. 36 No. 6, pp. 455-465.
LaBarbera, P. A. and Mazursky, D. (1983), “A longitudinal assessment of consumer
satisfaction/dissatisfaction: the dynamic aspect of the cognitive process”,
Journal of Marketing Research, Vol. 20, pp. 393-404.
Lambert, D. M., Cooper, M. C. and Pagh, J. D. (1998), “Supply chain management:
Implementation issues and research opportunities”, The International Journal of
Logistics Management, Vol. 9 No. 2, pp. 1-19.
Lambert, D. M., García-Dastugue, S. and Croxton, K. L. (2005), “An evaluation of
process-oriented supply chain management frameworks”, Journal of Business
Logistics, Vol. 26 No. 1, pp. 25-51.

113
Lin, J.S. and Wu, C.Y. (2011), “The role of expected future use in relationship-based
service retention”, Managing Service Quality, Vol. 21 No. 5, pp. 535-551.
Martensen, A., Gronholdt, L., and Kristensen, K. (2000), “The drivers of customer
satisfaction and loyalty: cross-industry findings from Denmark”, Total Quality
Management & Business Excellence, Vol. 11 No. 4,5,6, pp. 544-553.
Mcllroy, A. and Barnett, S. (2000), “Building customer relationships: Do discount cards
work?”, Managing service quality, Vol. 10 No. 6, pp. 347-355.
Miguel, P., Brito, L., Fernandes, A., Tescari, F. and Martins, G. (2014), “Relational
value creation and appropriation in buyer-supplier relationships”, International
Journal of Physical Distribution and Logistics Management, Vol. 44 No. 7, pp.
559-576.
Nam, J., Ekinci, Y. and Whyatt, G. (2011), “Brand equity, brand loyalty and consumer
satisfaction”, Annals of Tourism Research, Vol. 38 No. 3, pp. 1009-1030.
Nunnally, J.C. (1978). Psychometric theory (2nd ed.). New York: McGraw-Hill.
O’Loughlin, D. and Szmigin, I. (2005), “Customer perspectives on the role and
importance of branding in Irish retail financial services”, International Journal
of Bank Marketing, Vol. 21 No 1, pp. 8-27.
Oliver, R. L. (1999), “Whence consumer loyalty?”, Journal of Marketing, Vol. 63, pp.
33-44.
Orsingher C., Valentini S. and de Angelis M. (2010), “A meta-analysis of satisfaction
with com- plaint handling in services”, Journal of the Academy of Management
Science, Vol. 38, pp. 169-186.
Parasuraman, A., Zeithaml V. and Berry, L. (1993). Calidad total en la gestión de
servicios: cómo lograr el equilibrio entre las percepciones y las expectativas de
los consumidores. Madrid: Díaz de Santos.
Rauyruen, P., and Miller, K.E. (2007), “Relationship quality as a predictor of B2B
customer loyalty”, Journal of Business Research, Vol. 60, pp. 21-31.�

114
Robson, J. and Sekhon, Y. (2011), “Addressing the research needs of the insurance
sector”, International Journal of Bank Marketing, Vol. 29 No 7, pp. 512-516.
Rose, F. (1999), The economics, concept, and design of information intermediaries.
Physica Verlag, Heidelberg.
Rosenberg, L. and Czepiel, J. (1984), “A marketing approach for customer retention”,
Journal of Consumer Marketing, Vol. 1 No. 2, pp. 45-51.
Rowley, J. (2005), “The four Cs of customer loyalty”, Marketing Intelligence and
Planning, Vol. 23 No. 6, pp. 574-581.
Roy, S. (2012), “Brand loyalty in insurance companies”, Journal of Economic
Development, Management, IT, Finance and Marketing, Vol. 4 No. 1, pp. 12-26.
Rugman, A., Li, J. and Oh, C.H. (2009), Are supply chains global or regional?,
International Marketing Review, Vol. 26 No. 4/5, 384-395.
Saaty, A. (2011), “Assessing the satisfaction of insurance customers and its impact with
reference to Saudi Arabia”, Interdisciplinary Journal of Contemporary Research
in Business, Vol. 2, pp. 290-305.
Short, P. F., Graefe, D. R. and Schoen, C. (2003), Churn, churn, churn: How instability
of health insurance shapes America’s uninsured problem. Commonwealth Fund.
Shugan, S. (2005), “Are consumers rational? Experimental evidence?”, Marketing
Science, Vol. 25 No. 1, pp. 1-7.
Siddiqui M. H., and Sharma T. G. (2010), “Measuring the customer perceived service
quality for life insurance services: An empirical investigation”, International
Business Research, Vol. 3 No. 3, pp. 171-186.
Stock, J. R. and Boyer, S. L. (2009), “Developing a consensus definition of supply
chain management: A qualitative study”, International Journal of Physical
Distribution and Logistics Management, Vol. 39 No. 8, pp. 690-711.
Taylor, S. A. and Baker, T. L. (1994), “An assessment of the relationship between
service quality and customer satisfaction in the formation of customer´ purchase
intentions”, Journal of Retailing, Vol. 70 No. 2, pp. 163-78.

115
The Council of Insurance Agents & Brokers (2015), The role of insurance
intermediaries, retrieved on February 19 2015,
https://www.ciab.com/uploadedfiles/resources/roleofinsint.pdf
Tucker, W.T. (1964), “The Development of Brand Loyalty”, Journal of Marketing
Research, Vol. 1, pp. 32-35.
Zeithaml, V.A., Berry, L.L. and Parasuraman, A. (1996), “The behavioral consequences
of service quality”, Journal of Marketing, Vol. 60, pp. 31-46.

116
APPENDIX In Chapter I and Chapter II
Selected Attributes and levels
Ø Intermediaries recommendation: i) yes; ii) opinion omitted;
Ø Premium: i) 150€ - Standard product through regulation (after the decree-law
no. 72/2008, April 16th); ii) 200€ - the same coverage as the option of 150€ and
vehicle occupants’ insurance; iii) 250€ - the same coverage as the option of 200€
and auto glass insurance; iv) 300€ - the same coverage as the option of 250€ and
theft coverage;
Ø Insurers: i) Fidelidade-Mundial; ii) Açoreana; iii) Allianz; iv) Tranquilidade;
Ø Price bundling (home insurance with a promotion discount, for just 30€): i) yes;
ii) no.
In Chapter III
Ø Number of insurance proposals presented by intermediaries;
Ø Intermediaries’ recommendation was explained;
Ø Problems’ resolution by intermediaries;
Ø Problems’ resolution by insurers;
Ø Insurers’ fast response to customers’ problems;
Ø Online services from insurers;
Ø Contact made by insurers to know if there was any problem;
Ø Payment facilities;
Ø Quality of services from insurers;
Ø Quality of services from intermediaries.