integrate quality by design (qbd) into process validation · 1 integrate quality by design (qbd)...
TRANSCRIPT

1
Integrate Quality by Design (QbD) into Process Validation
Sanjay Sharma.Sr. General Manager & Head Technology Transfer

2
• QbD in Product Lifecycle – An Overview
• QbD Enablers
• Establishing Control Strategy in Product Lifecycle
• Quality Metrics in Process Validation
• QbD case studies
Agenda

3
• QbD in Product Lifecycle – An Overview
• QbD Enablers
• Establishing Control Strategy in Product Lifecycle
• Quality Metrics in Process Validation
• QbD case studies
Agenda

4
QbD in Product Lifecycle – An Overview
• Product Lifecycle Pathway
• Conceptual application of QbD through out a products lifecycle.

5
DEVELOPMENT EXHIBITFILING AND APPROVAL
VALIDATION AND LAUNCH
POST LAUNCH
FTO
PRODUCT LIFECYCLE
Stage 1Process Design
Stage 2Process Qualification
Stage 3Continuous Process
Verification
Product Lifecycle – Pathway

6
FTO
QbD approachQTPP, CTQ (CQA,
CPP and CMA)
Design Space & Control Strategy
F
I
L
I
N
G
Stage 1Process Design
Product Lifecycle – Pathway

7
FTO
Product Lifecycle – Pathway
Risk Assessment
post deficiency response
Scale up &
PPQ Batches
Recommendation for CPV
F
I
L
I
N
G
D
E
F
I
C
I
E
N
C
Y
C
P
V
Stage 2Process Qualification

8
Approach Followed for calculating no of PPQ batches
- The Bayesian method can be used to determine the number of validation batches required for stage2 PPQ.
- Process Performance data from stage1 are modelled through Beta error distribution and combined with expected outcomes of stage2 PPQ to derive posterior probability for future batches to meet specifications.
Product Lifecycle – Pathway

9
Sample Data – Product A • Batch wise dissolution data:
Test Specification UnitsBatch 1Pre EB
Batch 2EB1
Batch 3EB2
Batch 4EB3
Batch 5Pre-Val
DissolutionNot less than 80% (Q) of the labelled amount is dissolved
in 45 minutes.
1 98 92 90 90 92
2 94 97 94 97 102
3 96 99 87 101 94
4 104 98 88 90 96
5 95 94 102 97 84
6 99 97 100 85 93
Product Lifecycle – Pathway

10
Process Performance Based on Cpk Values
Batch Cpk YieldProcess
Performance (y)(yi-ybar)^2
Batch 1 1.23 98.6 0.986 0.0086
Batch 2 2.03 100.0 1.000 0.0112
Batch 3 0.91 88.5 0.885 0.0001
Batch 4 1.17 97.7 0.977 0.0071
Batch 5 0.60 61.8 0.618 0.0756
Mean = = 0.8930 Var = Syy= 0.02566
Product Lifecycle – Pathway

11
Estimation of Parameters
•
Y bar 0.8930
Syy 0.0257
Alpha Estimated 2.43
Beta Estimated 0.29
Y = (Y1…….YJ) denotes the Dissolution data of batches produced during stage1 PD
Product Lifecycle – Pathway

12
Estimation of Parameters
n 3.11 4
4 qualification batches should be used for stage2 PPQ
If n=4, the posterior probability for a future batch produced after a successful stage2 PPQ to pass specification is = 0.96
Product Lifecycle – Pathway

13
FTO
Product Lifecycle – Pathway
CPV Phase 1 Risk Assessment
CPV Phase 2P
P
Q
C
O
M
M
E
R
C
I
A
L
Stage 3Continuous Process Verification

14
FTO
CPV is a formal procedure which enables detection of a variation in the manufacturing
process that might have impact on the product quality / process consistency
CPV should
- Evaluate that a Process consistently delivers product with
acceptable QA’s & continues to operate robustly, within the
validated state.
- Identify any new sources of variability in the process that may
have arisen since the stage 2 (PQ stage) was performed
Continuous Improvement
Variation
Product Lifecycle – Pathway

15
Continuous Improvement
Variation
FTO
CPV is a formal procedure which enables detection of a variation in the manufacturing
process that might have impact on the product quality / process consistency
CPV Scope
- Since we have limited data when commercial production starts, it is recommended that
CPV analysis is performed in two phases
CPV Phase 1- Pre-SPC
CPV Phase 2- SPC Phase
Product Lifecycle – Pathway

16
FTO
CPV Phase 1 – Pre SPC
- Process performance can be analysed on limited data set (including PPQ, Submission & Optimization batches) to get understanding of the normal process variability in the commercial facility.
- At the completion of Phase 1 the alert limits to be established and also risk assessment to be relooked which was performed at end of PPQ batches to determine whether it has changed the risk score. And whether parameters not originally included in the plan for the initial CPV phase needs to be added.
Optimization Batches
Submission Batches
PPQ & Commercial
Batches
10 – 30 Batches
Product Lifecycle – Pathway

17
FTO
▪ Batch Release and Trends
▪ OOS/OOT/Incidents/Deviations
▪ CAPA / Change Control
PQR (Document) (Site Committee)
▪ Product Scorecard (Cp/CpK, other
tools)
▪ CTQ & Risk Document
Product
Information
Real Time Batch
Wise Review
Product Quality Reviews
with frequency determined
by product risk
Statistical review (lean/ 6 sigma tools) of CTQ
data, PAT and CPPs when each batch is
manufactured. SQC to SPC
CPV Phase 2 – SPC Phase
- Ongoing verification of the process over the lifetime of the product lifecycle
- Identify trends which may be within the normal process variability but indicate a potential to trend outside the alert limits
- Continue to build the understanding of the sources of variability in the process & its impact.
Product Lifecycle – Pathway

18
Process design
Only for CB/EB after PO
• Sampling plan based on confidence and reliability for each CQA (success run theorem or Z1.9)
• In process IPDU for blend and content uniformity
• Determine number of PPQ batches based on PilotBio, CB and EB batch data
Process performance qualification
• In process IPDU for blend and content uniformity
• Sampling plan - risk based approach for each CQA using EB/CB data
• Determine no of CPV I batches based on pre-validation and PPQ batch data
Continuous process verification – I
• In process IPDU
• Sampling plan - risk based approach for each CQA using pre-validation and PPQ data
• Risk assessment
Continuous process verification - II
• Sampling plan - risk based approach for each CQA using CPV I data
• Data monitoring
• Quality reporting
• CPV
Ris
k as
sess
me
nt
Ris
k as
sess
men
t
Eval
uat
ion
Conceptual application of QbD through out a products lifecycle.

19
Conceptual application of QbD through out a products lifecycle.
QTPPProcess
SelectionPrior
Knowledge
Process Developm
ent
Design Space
Control Strategy
Continual Improvem
ent
Define Quality targets
based on Product
intended use
List the unit operations
in the process selected
Based on prior
knowledge-Initial Risk
Assessment to identify CQA & CPP
Perform developmen
t trials –DOE, PAT,
Risk Assessment
Summarize scientific
understanding of
material & process
Define Control strategy based on
design space created
Proposal for Life cycle
management basis of
Quality Risk Managemen
t.
DEVELOPMENT
MNUFACTURING
LIFECYCLE MANAGEMENT

20
• QbD in Product Lifecycle – An Overview
• QbD Enablers
• Establishing Control Strategy in Product Lifecycle
• Quality Metrics in Process Validation
• QbD case studies
Agenda

21
QbD in Product Lifecycle – An Overview
QTPPProcess
SelectionPrior
Knowledge
Process Developm
ent
Design Space
Control Strategy
Continual Improvem
ent
Design Of Experiments (DOE)
Process Analyzers (PAT)
SPC, SQC & Acceptance Sampling
Process Modelling
Enab
ling
too
ls

22
QbD in Product Lifecycle – An Overview
QTPPProcess
SelectionPrior
Knowledge
Process Developm
ent
Design Space
Control Strategy
Continual Improvem
ent
Design Of Experiments (DOE)
Enab
ling
too
ls

23
DOE- Design Of Experiments
• Systematically chosen group of experiments where the levels of (chosen) process parameters are varied together to measure an effect on a Critical Quality Attribute (CQA)
– Some factors are controlled while others are held constant
– Basic Metrics
• Number of factors
• Number of runs
• Confidence and power
– Isolate effects including interactions

24
DOE- Predicting Process Performance

25
DOE- Developing Process Understanding

26
DOE- Comparison of Experimental Environments
Characteristic Screening Characterization Optimization
No. of Factors >6 3-6 2-5
Desired Information
Critical FactorsUnderstand how
system works
Prediction Equation, Optimization,
Design Space
Model Form Linear or Main effectsLinear & Interaction
EffectsLinear, Interaction &
Curvilinear Effects
Experiment Design
Plackett-BurmanFractional-Factorials
DSD- Definitive screening design
Full & FractionalFactorials
Taguchi Orthogonal arrays, Split Plot
designs
Full & FractionalFactorials,
Response Surface

27
QbD in Product Lifecycle – An Overview
QTPPProcess
SelectionPrior
Knowledge
Process Developm
ent
Design Space
Control Strategy
Continual Improvem
ent
Process Analyzers (PAT)
Enab
ling
too
ls

28
PAT FRAMEWORK
FTO
DESIGN FOR
QUALITYSENSORS
PROCESS
CONTROLSDATA ANALYSIS
DOE, FMEA
Univariate, Multivariate, Real time
Soft- Temp, CFMDirect- NIR, Raman
Feedback, Feedforward
Its just not about NIRs
“PAT is considered to be a system for designing, analysing and controlling manufacturing through timeline measurements (i.e., during processing of critical quality and performance attributes of raw and in-process materials and processes
with the goal of ensuring final product quality)”

29
PAT in Product Lifecycle Management
FTO
Process Qualificatio
n
Continuous Process
Verification
Product Design
PAT can be employed during the entire Product Life cycle for varying benefits

30
FTO
Process Qualificat
ion
Continuous Process
Verification
Product Design
New Products- PAT utilized throughout development & Scale up.
Better understanding of Impact of CPP,CMA on the CQA
PAT in Product Lifecycle Management

31
FTO
Process Qualificat
ion
Continuous Process
Verification
Product Design
Commercial Products- PAT utilized for Analyzing CQA’s & Monitoring CPP
Step wise approach, first improve quality & then efficiency
PAT in Product Lifecycle Management

32
FTO
Process Qualificat
ion
Continuous Process
Verification
Product Design
Existing Marketed Robust Products-PAT utilized to improve efficiency.
Mechanism to keep ensuring product is in state of control
State of Control
PAT in Product Lifecycle Management

33
QbD in Product Lifecycle – An Overview
QTPPProcess
SelectionPrior
Knowledge
Process Developm
ent
Design Space
Control Strategy
Continual Improvem
ent
SPC, SQC & Acceptance SamplingEn
ablin
g to
ols

34
Process Step-1
Process Step-2
Process Step-3
Product Output
Statistical Process Control Statistical Quality Control
Statistical quality control can be divided into three broad categories: 1. Descriptive statistics are used to describe quality characteristics and relationships for e.g. mean, standard deviation, the
range, and a measure of the distribution of data. 2. Statistical Process Control (SPC) involves inspecting a random sample of the output from a process and deciding
whether the process is producing products with characteristics that fall within a predetermined range. SPC answers the question of whether the process is functioning properly or not.
3. Acceptance Sampling is the process of randomly inspecting a sample of goods and deciding whether to accept the entire lot based on the results. Acceptance sampling determines whether a batch of goods should be accepted or rejected.
SPC & SQC

35
Data Acquisition
• Acquire from different sources –Manual, Online data including from ERP, LIMS, e-BPRs, Analytical data etc.
Data Preparation
• Identification of Continuous, Discrete Data
• Identification of Outliers
• Parametric
• Non-Parametric Analysis
Data Analysis
• Basic Statistics
• Checking Data Distribution
• Data transformation (if necessary)
• Plotting Control Charts
• Run tests
• Process Capability Analysis
Control Charts & Process Capability Estimation
SPC & SQC- A Roadmap

36
Data Acquisition
• Acquire from different sources – Manual, Online data including from ERP, LIMS, e-BPRs, Analytical data etc.
“How the data is collected is at least as important as the data themselves”
Remember Garbage in= Garbage Out
- Start with a clear objective
- Use Validated Measurement Methods
- Calibrated instruments
- Well defined and documented operating procedures
- Lack of experimenter bias
- Scientific based selection and assignment of samples
- Traceability
- Chain of Custody
- Well- written signed protocol
SPC & SQC- A Roadmap

37
Data Preparation
• Identification of Continuous, Discrete Data
• Identification of Outliers
• Parametric
• Non-Parametric Analysis
“First, Last and Always:
Plot your data.”
A lot of the Statistical tests and treatments we use ‘assume’. Always check assumptions.
Use: • Histograms
• Scatter Plots
• Probability Plots
10610410210098969492
105.0
102.5
100.0
97.5
95.0
S3
S1
Scatterplot of S1 vs S3
10410210098969492
20
15
10
5
0
S3
Fre
qu
en
cy
Mean 100.2
StDev 2.213
N 77
Histogram of S3Normal
SPC & SQC- A Roadmap

38
Data Analysis
• Basic Statistics
• Checking Data Distribution
• Data transformation (if necessary)
• Plotting Control Charts
• Run tests
• Process Capability Analysis
Identify Outliers using Box Whisker plots.
Correlate with OOS, OOTs, Deviations history, relevant CAPAs and then cleanse these points before doing any further analysis.
Basic Statistics
Mean, Median, Mode, Frequency of Mode, %RSD/ Coefficient of Variation, Range, Maxima, Minima
Tell a lot! Use them!
SPC & SQC- A Roadmap
Control Charts & Process Capability Estimation

39
SPC & SQC- Control Charts
Potential Applications-- To proactively monitor and trend a process- To detect the presence of special cause
variation- To identify continual improvement
opportunities- To maintain the process in the state of
statistical control
Control Chart- It’s a graphical display of a product quality characteristic that has been measured or computed periodically from a process at a defined frequency.

40
• Process capability is the ability of the process to meet the design specifications for a service or product.
• Nominal value is a target for design specifications.
• Tolerance is an allowance above or below the nominal value.
SPC & SQC- Process Capability
Centering –The Process Is On Target
Spread – Reduce The Variation
LSL USL
DefectsDefects

41
Introduction to Sampling
• Sampling is the process of selecting predetermined number of units from a population of interest.
• By studying the sample we may fairly generalize our results back to the population from which they were chosen.
• The sample should be a representation of the entire population.
• When taking a sample from a larger population, it is important to consider how the sample is chosen and how many samples to be collected.
Acceptance Sampling

42
Sampling Risks
• Sampling involves risks:
- Good product/lot may be rejected
- Bad product/lot may be accepted
Because we inspect only a sample, not the whole lot.
Acceptance Sampling
43
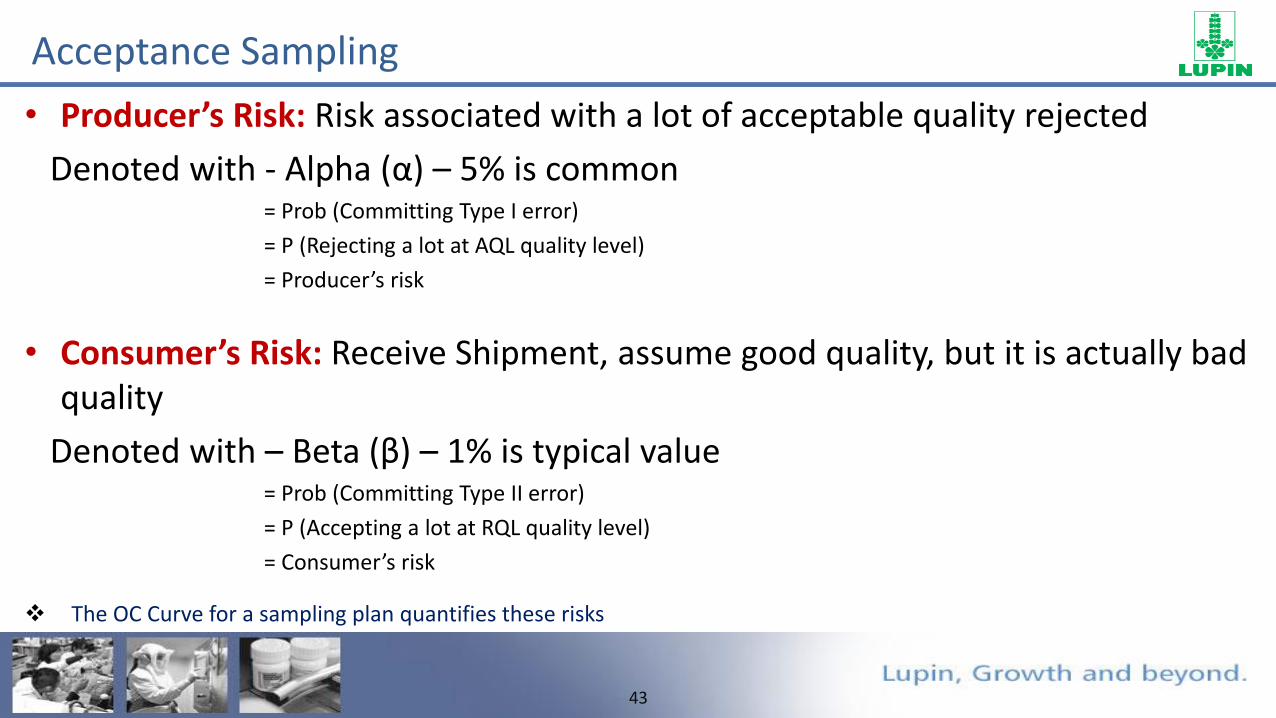
• Producer’s Risk: Risk associated with a lot of acceptable quality rejected
Denoted with - Alpha (α) – 5% is common= Prob (Committing Type I error)
= P (Rejecting a lot at AQL quality level)
= Producer’s risk
• Consumer’s Risk: Receive Shipment, assume good quality, but it is actually bad quality
Denoted with – Beta (β) – 1% is typical value= Prob (Committing Type II error)
= P (Accepting a lot at RQL quality level)
= Consumer’s risk
The OC Curve for a sampling plan quantifies these risks
Acceptance Sampling

44
Why Not 100% Inspection
• Very Expensive
• Can’t use when product must be destroyed to test
Hence 100% inspection is tedious and difficult. So we inspect/test sample of few items taken from the lot and generalize our results to entire lot.
? Then the obvious question comes in our mind that, what is the suitable sample size required in order to well represent the entire lot…
Acceptance Sampling

45
Determine Sample Size
• Determining sample size is a very important issue because –
- Samples that are too large may waste time, resources and money.
- While samples that are too small may lead to inaccurate results.
• Many times there will be two situations to determine sample size.- Calculating sample size without historical data
- Calculating sample size with historical data
Acceptance Sampling

46
Scenario 1: Calculating sample size without historical data - Success Run Theorem
• The success run theorem uses the confidence level (how sure we are) and reliabilityvalue (valid, consistent results) to determine the appropriate statistically valid sample size for process validation.
• Before we start success run theorem method, we must establish our definitions of risk and their associated confidence level and reliability value. These definitions will vary based on organizational needs.
• The better way of determining the risk level is failure mode and effect analysis (FMEA).
Acceptance Sampling

47
• Below are general definitions of risk in relation to patient safety.
Risk Definition
High Life threatening or may result in death
Medium
Many result in temporary or permanent injury
requiring medical intervention
Low May result in minor injury or inconvenience
not requiring medical intervention.
Acceptance Sampling

48
• If the product is medical device, The following can be used as a guidelines to establish confidence and reliability levels based on patient risk.
• Different confidence and reliability levels can be utilized based on the organizational risk acceptance and industry practice, guidance documents and regulatory requirements.
Risk Confidence Reliability
High 95% 99%
Medium 95% 95%
Low 95% 90%
Acceptance Sampling

49
Success Run Theorem Method:
• When calculating the sample size based on confidence and reliability with zero failures, we can use the below formula:
Where:
Ln = Natural log
n = Sample size
C = Confidence level
R = Reliability
n = ln(1−𝐶)
ln(𝑅)
Acceptance Sampling

50
Example to calculate sample
size (using SRT) at finished stage.
Product: XYZ Cap (Batch Size : 500000 Capsules)
* For the case above with 59 samples (95% confident that a process is 95% reliable) we can state that we are 95% confident the true defect rate is between 0 and 5%.
Critical Quality Attributes - Finished Product Stage
Sno Attribute Type of attribute Safety/Quality/Efficacy
Criticality level of the attribute
Sample Size
1 Description Quality Low 29
2 Loss on drying Quality Low 29
3 Drug Release: Acid Stage Efficacy High 299
4 Drug Release: Basic Stage Efficacy High 299
5 Assay Efficacy High 299
6 Omeprazole related compound F and G
Safety Medium 59
7 5-methoxy-1 H-benzimidazole-2-thiol Safety Medium 59
8 Any Other individual impurity Safety Medium 59
9 Total impurities Safety High 299
1431
Acceptance Sampling

51
Product: ABC tabs (Batch Size : 200000 Tablets)
Critical Quality Attributes - Finished Product Stage
Sno Attribute Criticality level of the attribute Sample Size
1 Uniformity of Dosage Units High 299
2 Assay High 299
3 Dissolution Medium 59
4 Related Substances Low 29
686
Acceptance Sampling

52
OC Curve:
• This is a graph used in quality control to determine the probability of accepting production lots when using different sampling schemes.
• It shows percentage defectives on the X-axis and probability of acceptance on the Y-axis.
• Lots having more than the acceptable percentage of defectives are rejected.
• It helps in the selection of sampling plans that are effective in reducing risk.
Acceptance Sampling

53
OC Curves with different Sample Sizes (Acceptance Number c=0)
Sample Size 29 59 299
Acceptable No. 0 0 0
Percent Defective Low Medium High
0.00 1.00 1.00 1.00
0.05 0.23 0.05 0.00
0.10 0.05 0.00 0.00
0.15 0.01 0.00 0.00
0.20 0.00 0.00 0.00
0.25 0.00 0.00 0.00
0.30 0.00 0.00 0.00
0.35 0.00 0.00 0.00
0.40 0.00 0.00 0.00
0.45 0.00 0.00 0.00
0.50 0.00 0.00 0.00
0.55 0.00 0.00 0.00
0.60 0.00 0.00 0.00
0.65 0.00 0.00 0.00
0.70 0.00 0.00 0.00
0.75 0.00 0.00 0.00
0.80 0.00 0.00 0.00
0.85 0.00 0.00 0.00
0.90 0.00 0.00 0.00
0.95 0.00 0.00 0.00
1.00 0.00 0.00 0.00
0.00
0.10
0.20
0.30
0.40
0.50
0.60
0.70
0.80
0.90
1.00
0.00 0.01 0.02 0.03 0.04 0.05 0.06 0.07 0.08 0.09 0.10P
rob
abili
ty o
f ac
cep
tan
ce (
Pa)
Percent Defective
OC Curve
Low
Medium
High
Sample SizeProbability of Acceptance
0.1 0.25 0.5 0.75 0.9 0.95 0.9929 7.00% 4.70% 3.00% 1.50% 0.60% 0.30% 0.10%
59 4.50% 3.60% 2.30% 1.20% 0.50% 0.30% 0.10%299 4.20% 3.30% 2.20% 1.20% 0.50% 0.30% 0.10%
Acceptance Sampling

54
Scenario 2: Calculating Sample Size with Historical Data - Risk Based Approach
• Formula to calculate Sample size:
n = (Zα + Zβ)2 S2 / ∆2
• Where: n = Sample Size (Need to be calculated)
Zα = Type I error rate
Zβ = Type II error rate
∆ = Standard deviation shift
S = Process + Measurement variability
Confidence
LevelΒ
Α
1 - Sided 2 – Sided
80% 0.842 0.842 1.282
90% 1.282 1.282 1.645
95% 1.645 1.645 1.96
98% 1.96 1.96 2.241
99% 2.326 2.326 2.576
100% 2.576 2.576 2.807
Values of Alpha and Beta for various Confidence Levels
Acceptance Sampling

55
Sample data for Finished Product Analysis - Example
Test Specification Batch 1 Batch 2 Batch 3 Batch 4
Uniformity of Dosage Units
The Acceptance value (AV) should be less than or equal to 15.0
Sno Value1 101.72 100.53 100.94 100.65 99.86 100.27 100.98 100.09 96.4
10 99.4AV= 3.5 AV= 3.4 AV= 2.5 AV= 2.7
Acceptance Sampling

56
Sample Size Calculation - Uniformity of Dosage Units
Uniformity of Dosage Units
n = (Zα + Zβ)2 S2 / ∆2
Criticality Level Type I Error Rate α - Value Type II Error Rate β - Value SD (S) Delta (∆) Sample Size (n)
High 5% | 95% 1.96 1% | 99% 2.326 1.43 0.5 150
Acceptance Sampling

57
Comparison: With and Without Historical Data
Risk Based Approach – Product A n = (Zα + Zβ)2 S2 / ∆2
CQA Criticality Level Type I Error Rate α - Value Type II Error Rate β - Value SD (S)Delta
(∆)Sample Size (n)
Uniformity of Dosage
High 5% | 95% 1.96 1% | 99% 2.326 1.43 0.5 150
Success Run Theorem – Product A n = ln(1 - C)/ln( R )
CQA Criticality Level Confidence Reliability Sample Size (n)
Uniformity of DosageHigh 95% 99% 299
Acceptance Sampling

58
• QbD in Product Lifecycle – An Overview
• QbD Enablers
• Establishing Control Strategy in Product Lifecycle
• Quality Metrics in Process Validation
• QbD case studies
Agenda

59
CPV Monitoring Plan- Legacy Products
Review known CQA’s
Process Robust &
statistically capable
Conduct retrospective product risk assessment
Document the statistical assessment & review
frequency
Review Product- CMA- Control Strategy (CPP)- In Process Controls- Quality system Indicators (Mkt
complaint)- Environment Condn’s
Priority Matrix
Review & Identify additional elements for enhanced monitoring
Establish Process Performance
Process Robust &
statistically capable
Database creation & Data collection
YES
YES
NO
NO
60
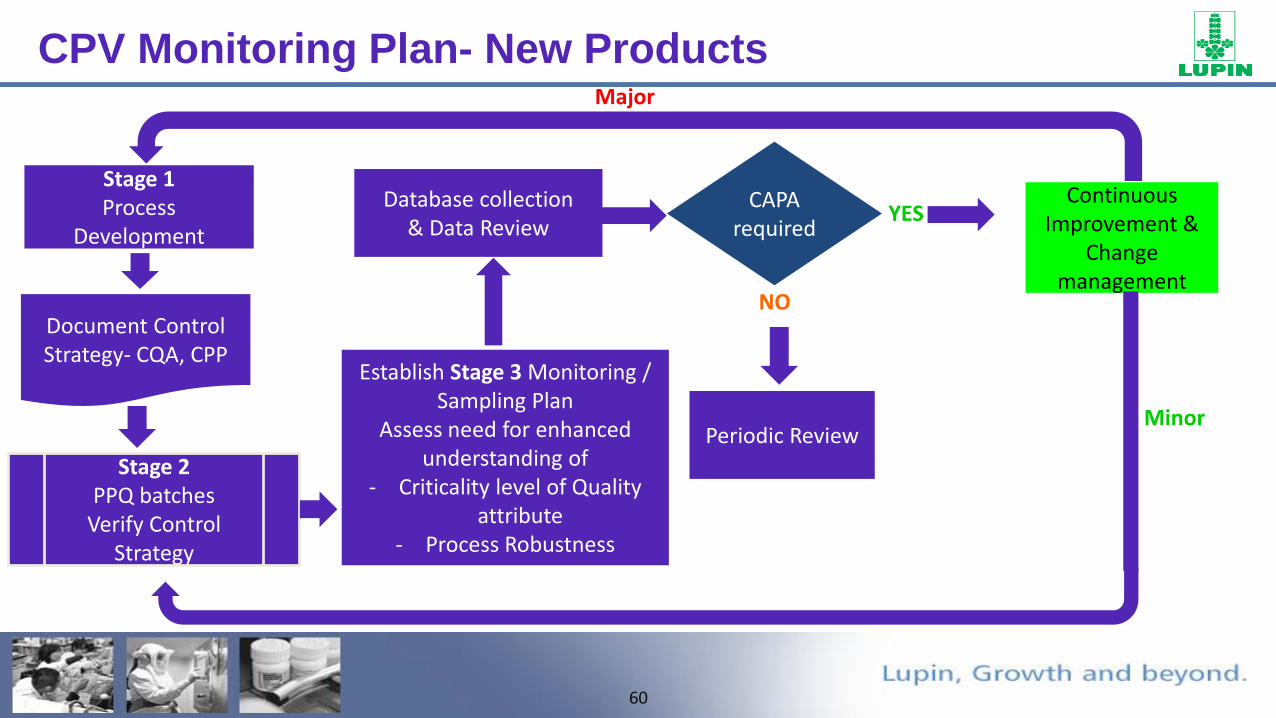
CPV Monitoring Plan- New Products
Stage 1Process
Development
CAPA required
Continuous Improvement &
Change management
Establish Stage 3 Monitoring / Sampling Plan
Assess need for enhanced understanding of
- Criticality level of Quality attribute
- Process Robustness
Periodic Review
Database collection& Data Review
YES
NODocument Control Strategy- CQA, CPP
Stage 2 PPQ batches
Verify Control Strategy
Minor
Major

61
Flow for the Critical to Quality (CTQ) template
List of CQA’s
• Provides a list of Critical Quality Attributes along with the type and criticality level for the attributes for both Finished Product and Intermediates
Impact of CPP/CMA on CQA
•Evaluates impact of CMA of API on CQAs (High/Medium/Low)
•Evaluates impact of CPP of both Intermediates and Finished Product on CQAs (High/Medium/Low)
Deep dive of impact of
CMA on CQA & CS
•Provides justification for criticality of CMA for CQA
CPP & Control Strategy
•Evaluates in detail impact of CPPs and their control strategy value

62
List of CQAs
Level 1A : Critical Quality Attributes - Finished Product (Coated Tablet)
S. No. AttributeType of attribute
Safety/Quality/EfficacyCriticality level of the attribute
1 Description Quality Medium2 Odor Quality Low3 Identification Quality Medium4 Assay (%w/w) Efficacy High
5 Content uniformity by UOD Efficacy High
6 Dissolution profile (%) Efficacy High
7 Related Substances limit (%w/w) Safety High
8 Anti-oxidant potency (%w/w) Quality Medium
9 Water content (%w/w) Quality High
10 Residual Solvents (%w/w) Safety Medium
11 Solid state nature of API in product Quality High
12 Microbial enumeration Safety Medium
Note: In similar lines CQA for intermediates will also be listed

63
Impact of CMA on CQAs
Level 2A: Evaluation of impact of CMA of API & RM on CQA
S.No.Assay
(%w/w)
Related Substances
(%w/w)
Content uniformity by
UOD
Dissolution profile (%)
Water content (%w/w)
Solid state nature of API
in product
1 API Low Medium Low Low Low High2 Copovidone (Kollidon VA64) Low Medium Low Low Low Low
3 Butylated HydroxyToluene Low Low Low Low Low Low
4 Butylated Hydroxy Anisole Low Low Low Low Low Low
6 Methanol Low Low Low Low Low Low
7Polyethylene Oxide (PEO WSR303) Low Low Low High Low Low
8 Polyethylene Glycol (PEG 8000) Low Low Low Low Low Low
9 Hypromellose (HPMC K100 LVCR) Low Low Low High Low Low
10 Magnesium Stearate Low Low Low Low Low Low
11 Hypromellose (HPMC E5 LV) Low Low Low Low Low Low
12 Polyethylene Glycol NF Low Low Low Low Low Low
13 Isopropyl Alcohol Low Low Low Low Low Low
14 Opadry 200 Yellow (for 50 mg ) Low Low Low Low Low Low
15 Opadry 200 Brown (for 25 mg) Low Low Low Low Low Low
16 Purified Water Low Low Low Low Low Low
CQACMA

64
Impact of CPP on CQAsLevel 2B: Evaluation of impact of CPP on CQA
Finished Product CQA
S.No.Assay
(%w/w)
Related Substances
(%w/w)
Content uniformity
by UOD
Dissolution profile (%)
Water content (%w/w)
Solid state nature of
API in product
1 Sifting Low Low Low Low Low Low
2 Drug-binder solution preparation Low Low Low Low Low Low
3 Dry mixing Low Low Low Low Low Low4 Fluid bed granulation Low Low Low High Low High6 Granules drying Low Low Low Low Low Low7 Milling Low Low Low Low Low Low8 Blending (Pre-lubrication) Low Low Low Low Low Low9 Blending (Lubrication) Low Low Low Low Low Low
10 Compression Low Low Medium High Low Low
11Seal & Film Coating solution preparation
Low Low Low Low Low Low
12 Seal coating Low Low Low Low Low Medium13 Film coating Low Low Low Low Low High14 Seal & Film coating drying Low Low Low Low Low Low
CPP
CQA

65
Deep dive of impact of CMA on CQA & CSLevel 2A: Evaluation of impact of CMA on CQA
S.No.Specificat
ionAssay
(%w/w)
Related Substances (%w/w)
Content
uniformity by
UOD
Dissolution
profile (%)
Water content (%w/w)
Solid state
nature of API in
product
Justification for criticality (only for High/Medium)
1Water content (API)
NMT 4.0% w/w
Low Medium Low Low Low High
(I) API is hygroscopic in nature and is prone to hydrolytic degradtion as evident from the API forced degradation study and this may impact the related substance of the product. Hence the risk is rated as Medium.
(II) Impact of water content of active on retaining the input polymorphic form of API is considered as high, because API is hygroscopic in nature and polymorphic conversion may take place due to change in the water content of API. However API water content will be controlled through API specification. Hence the risk is High.
2
Limit of Peroxides (Copovidone)
NMT 0.40% w/w
Low Medium Low Low Low Low
The drug substance is prone to oxidation. Peroxide content may trigger oxidation of drug substance which expedite the impurity generation due to oxidation. The impurities likely have to impact on safety of product. Hence, the risk is medium.
3
Viscosity (HPMC K100 LVCR)
NLT 80 & NMT 120
mPas
Low Low Low High Low Low
The viscosity hypromellose depends on polymer parameters like molecular weight, hydrophilicy etc. Drug release through polymer matrix is inversely proportional to viscosity of hypromellose. The viscosity of selected grade of polymer is 80-120 mPas. The lot of hypromellose used for development trials had viscosity of 98 mPas and 102 mPas. The viscosity of hypromellose towards extremity of specification (towards lower side and higher side of the specification) will have impact on drug through polymer matrix. Hence, it is rated as High.
CQA
CMA

66
CPP and Control StrategyLevel 4: Detailed evaluation of impact of critical process parameter & its Control strategy value
Unit Operation Parameter Value (Lab scale) UOM
Fluid bed granulation
Spray rate 36 (15-60) g/min
Airflow 100 (80-140) CFM
% inlet RH 5 -55 %
Atomization pressure 1 (0.8-1.2) bar
Granules dryingInlet temperature 25-45 ˚C
EXhaust temperature 25-30 ˚C
Milling Milling speed 1200 (1200 -1700) RPM
Blending (Lubrication) Blending time 5 min.
Compression
Precompression force 10% of MCF kN
Main compression force (MCF) 20-Oct kN
Turret speed 20-40 RPM
Seal coatingSpray rate 2-15 g/min
Atomization pressure 1-2 bar
Film coating
Spray rate 1-5 g/min
Atomization pressure 2-3 bar
Inlet temperature 30-65 ˚C
EXhaust temperature 35-45 ˚C

67
• QbD in Product Lifecycle – An Overview
• QbD Enablers
• Establishing Control Strategy in Product Lifecycle
• Quality Metrics in Process Validation
• QbD case studies
Agenda

68
Quality Metrics in Process Validation
• Create quality score card at various stages of product lifecycle
• Track quality using quality metrics

69

70
• Capable of being deployed for all products and compare products• Same basis of evaluation• Capture all key patient centric parameters• Serve as a basis for taking preventive action – Lead indicator• Quantified and based on statistically appropriate concepts
Create Product Quality Score cards
71
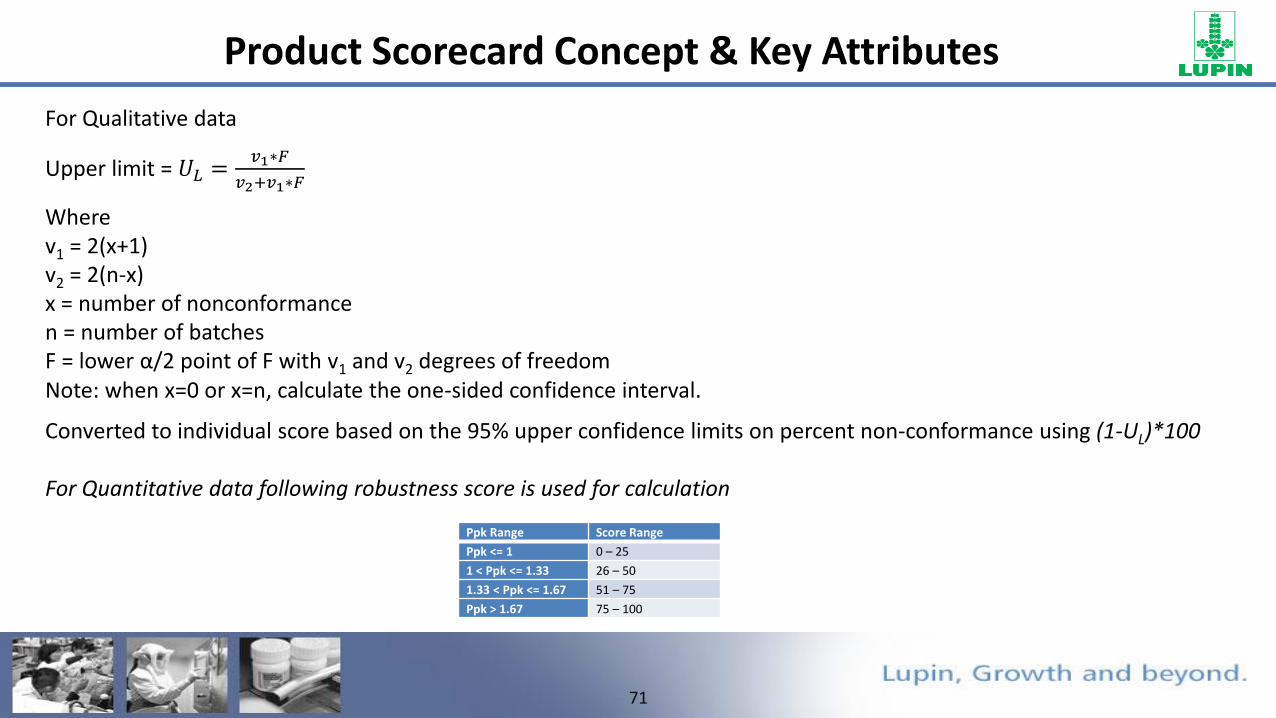
For Qualitative data
Upper limit = 𝑈𝐿 =𝑣1∗𝐹
𝑣2+𝑣1∗𝐹
Wherev1 = 2(x+1)v2 = 2(n-x)x = number of nonconformancen = number of batchesF = lower α/2 point of F with v1 and v2 degrees of freedomNote: when x=0 or x=n, calculate the one-sided confidence interval.
Converted to individual score based on the 95% upper confidence limits on percent non-conformance using (1-UL)*100
For Quantitative data following robustness score is used for calculation
Ppk Range Score Range
Ppk <= 1 0 – 25
1 < Ppk <= 1.33 26 – 50
1.33 < Ppk <= 1.67 51 – 75
Ppk > 1.67 75 – 100
Product Scorecard Concept & Key Attributes

72
Process Engineering Update
Use Non parametric PpK to compute an overall Product score
Method:Continuous data: Non parametric calculation of PpK using medians and percentiles Correction Factor assign scoreDiscrete data: Calculate failure rate UL of Non-conformance assign score
• Independent of normality assumption, batch size
• Sensitive to variability & closeness to specs
Product Scorecard Concept & Key Attributes
Ppk Range Score Range
Ppk <= 1 0 – 25
1 < Ppk <= 1.33 26 – 50
1.33 < Ppk <= 1.67 51 – 75
Ppk > 1.67 75 – 100

73
Process Engineering Update
Product Scorecard – Online Tracking
85
87
89
91
93
95
97
0
0.5
1
1.5
2
2.5
3
3.5
4
4.5
5
Water by KF
0
1
2
3
4
5
6
7
8
9
Assay UOD
Product Score
Score – CQA ( High)
Score – CQA ( Medium)
The process is behaving normally
& within limits as indicated by
the product score and the CQAs,
the advantage of this
methodology is capturing the
performance at a ‘batch level’
and thus capturing information
on an almost real time basis and
thus enabling the organization to
take pre-emptive/ corrective
action wherever necessary
The process though has not
produced any OOS, even an out
of trend/ extreme observation is
magnified and highlighted to the
management for taking
appropriate corrective action.

74
• QbD in Product Lifecycle – An Overview
• QbD Enablers
• Establishing Control Strategy in Product Lifecycle
• Quality Metrics in Process Validation
• QbD case studies
Agenda

75
Pharmaceutical Development Background
• API Characteristics– Relatively High dose compound
– High Water Solubility, Moderate Permeability
• Formulation Design– Extended Release Formulation
– Level A IVIVC has been established for all dose strengths
• Process Design– Roll Compactor process
QbD Case study – Example

76
Quality Risk Assessments
• Product CQA’s– Risk assessment focusing on Voice of Customer applied to propose CQA’s
• Material Attributes & Process Parameters– FMEA applied
– Critical & Non Critical Process parameters were identified
– Manufacturability were addressed
– DoE performed at small scale to study potential CPP’s
– DoE applied for validation at full scale
QbD Case study – Example

77
Risk Prioritization Matrix
QbD Case study – Example

78
Potential CPPs and MAs
QbD Case study – Example

79
Roller Compactor Design Space
• Developed using DoE at small scale
• Roll force and Roll gap– No impact on the performance of the drug product (no change in dissolution
profiles observed)
– Impact manufacturabity of the product (flow issues)
• Scale up factors used to predict large scale design space
• Relationship of equipment & scale and design space was addressed
QbD Case study – Example

80
DoE used for scale up
QbD Case study – Example

81
Design space confirmed at full scale
QbD Case study – Example

82