integrated chemical exposure assessment of coastal green
TRANSCRIPT

Accepted Manuscript
Integrated chemical exposure assessment of coastal green turtleforaging grounds on the Great Barrier Reef
C. Gallen, A.L. Heffernan, S. Kaserzon, G. Dogruer, S.Samanipour, M.J. Gomez-Ramos, J.F. Mueller
PII: S0048-9697(18)34678-3DOI: https://doi.org/10.1016/j.scitotenv.2018.11.322Reference: STOTEN 29671
To appear in: Science of the Total Environment
Received date: 31 July 2018Revised date: 19 November 2018Accepted date: 21 November 2018
Please cite this article as: C. Gallen, A.L. Heffernan, S. Kaserzon, G. Dogruer, S.Samanipour, M.J. Gomez-Ramos, J.F. Mueller , Integrated chemical exposure assessmentof coastal green turtle foraging grounds on the Great Barrier Reef. Stoten (2018),https://doi.org/10.1016/j.scitotenv.2018.11.322
This is a PDF file of an unedited manuscript that has been accepted for publication. Asa service to our customers we are providing this early version of the manuscript. Themanuscript will undergo copyediting, typesetting, and review of the resulting proof beforeit is published in its final form. Please note that during the production process errors maybe discovered which could affect the content, and all legal disclaimers that apply to thejournal pertain.

ACC
EPTE
D M
ANU
SCR
IPT
Integrated chemical exposure assessment of coastal green turtle foraging grounds on the Great
Barrier Reef
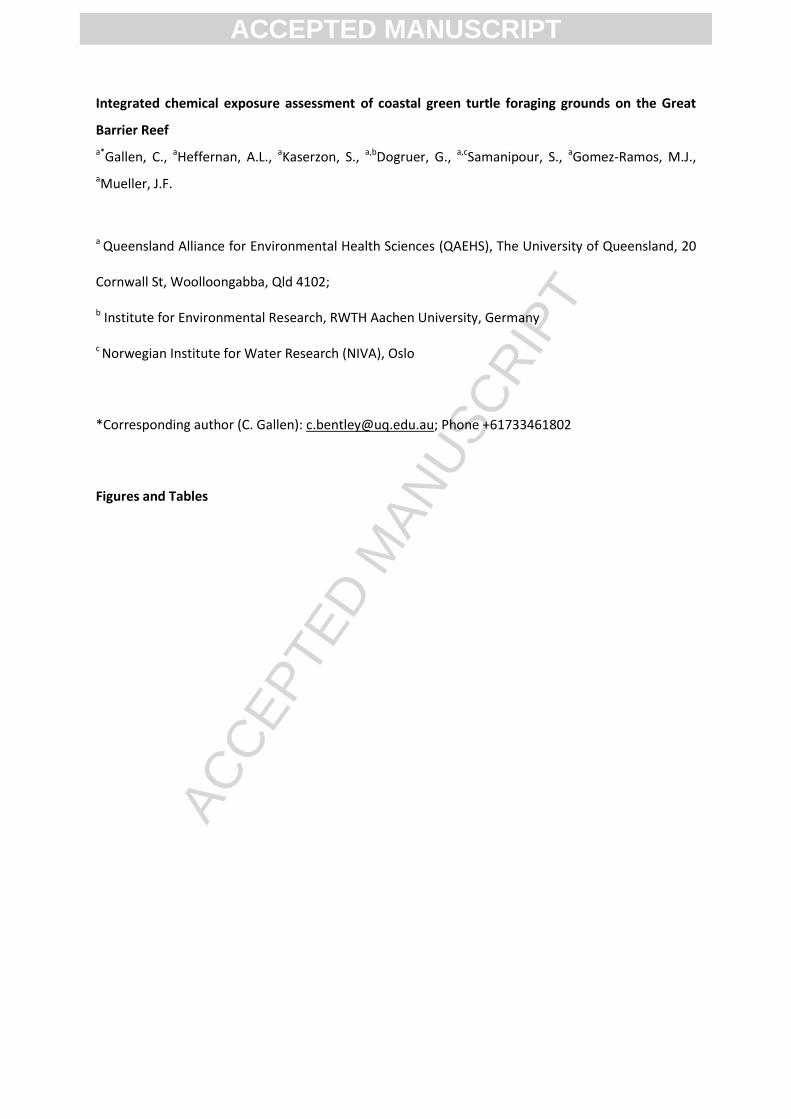
a*Gallen, C., aHeffernan, A.L., aKaserzon, S., a,bDogruer, G., a,cSamanipour, S., aGomez-Ramos, M.J.,
aMueller, J.F.
a Queensland Alliance for Environmental Health Sciences (QAEHS), The University of Queensland, 20
Cornwall St, Woolloongabba, Qld 4102, Australia.
b Institute for Environmental Research, RWTH Aachen University, Germany
c Norwegian Institute for Water Research (NIVA), Oslo, Norway
*Corresponding author (C. Gallen): [email protected]; Phone +61733461802
Highlights
Case-control sampling investigated green turtle exposure to land-based pollutants
Analysis of water and sediment showed catchment-specific pollutant profiles
Low concentrations of pesticides, pharmaceuticals and industrial chemicals detected
Turtles foraging in coastal areas are exposed to a diverse mixtures of chemicals
ACCEPTED MANUSCRIPT

ACC
EPTE
D M
ANU
SCR
IPT
2
Abstract
The Great Barrier Reef receives run-off from 424,000 km2 catchment area across coastal Queensland,
incorporating diffuse agricultural run-off, and run-off point sources of land-based chemical
pollutants from urban and industrial development. Marine biota, such as green turtles (Chelonia
mydas), are exposed to these diverse chemical mixtures in their natural environments, and the long
term effects on turtle and ecosystem health remain unknown. This study was part of a larger multi-
disciplinary project characterising anthropogenic chemical exposures from the marine environment
and turtle health. The aim of this study was to screen for a wide range of anthropogenic chemical
pollutants present in the external and internal environment of green turtles, using a combination of
traditional targeted chemical analyses, non-target suspect screening, and effect-based bioassay
methods, while employing a case-control study design. A combination of passive (water) and grab
(water, sediment) samples were investigated. Three known green turtle foraging sites were selected
for sampling: two coastal ‘case’ sites influenced primarily by urban/industrial and agricultural
activities, respectively; and a remote, offshore ‘control’ site. Water and sediment samples from each
of the three sampling locations showed differences in chemical pollutant profiles that reflected the
dominant land uses in the adjacent catchment. Targeted mass spectrometric analysis for a range of
pesticides, industrial chemicals, pharmaceuticals and personal care products found the greatest
detection frequency and highest concentrations in coastal samples, compared to the control. Non-
target screening analysis of water showed clear differentiation in chemical profile of the
urban/industrial site. In-vitro assays of sediment samples from the control site had lowest induction,
compared to coastal locations, as expected. Here we present evidence that turtles foraging in
coastal areas are exposed to a range of anthropogenic pollutants derived from the adjacent coastal
catchment areas.
KEYWORDS: high resolution mass spectrometry (HRMS); chemical exposure; exposure assessment
marine wildlife; green turtle; passive sampling
ACCEPTED MANUSCRIPT

ACC
EPTE
D M
ANU
SCR
IPT
1. Introduction
The World Heritage Great Barrier Reef (GBR) Marine Park covers an area of 344,400 km2 and spans
2,300 km along the Queensland coast of Eastern Australia. The GBR receives run-off from 35 river
catchments that drain approximately 424,000 km2 of coastal Queensland; 80% of this catchment
area is currently used for agriculture (DSITIA 2012). Diffuse pesticide run-off from agricultural land
has been identified as a threat to the GBR ecosystem (Kroon et al. 2013, GBRMPA 2014), and
herbicides inhibiting photosynthetic function, such as photosystem II (PSII) herbicides, are
recognised as priority pollutants due to their heavy use and demonstrated toxicity (Davis et al.
2013). These and other agrichemicals can remain in the marine environment at elevated
concentrations for extended periods of time (i.e. several weeks) (Devlin and Schaffelke 2009,
Grant et al. 2017). Urban and industrial development including ports and aquaculture can
represent smaller point sources of land-based chemical pollutants (e.g. pharmaceuticals and
personal care products; PPCPs).
Green turtles (Chelonia mydas) are one of the iconic species of the GBR, and are regarded as either
endangered or vulnerable by both The World Conservation Union and the Australian Government
(GBRMPA 2016a). Green turtles are long-lived marine reptiles that show strong fidelity to inshore
foraging areas (few km2) where they spend approximately two to eight years between breeding
cycles, and feed primarily on seagrass and algae (Arthur et al. 2008, GBRMPA 2016a). Exposure
to chemical contaminants occurs via consumption of contaminated water or food, and sediment-
bound compounds are an important exposure source for benthic marine biota such as the green
turtles (Gaus et al. 2001a, Gaus et al. 2004, Hermanussen et al. 2004). Once ingested or
absorbed, contaminants may act on target sites at a molecular level to trigger adverse health effects,
as recently demonstrated (Dogruer et al. 2018).
The contribution of agricultural runoff, urban and industrial development may contribute to
declining water quality in the inshore marine environment, and in turn, may decrease the resilience
of green turtle to other stressors, such as climate change. Considered sentinels for a healthy marine
ecosystem, changes in green turtle population health may affect the entire ecosystem. Ensuring the
continued health of this iconic species is of universal value to the biodiversity of the Reef itself and
the communities that rely on it economically.
In 2014, the authors were part of a multidisciplinary team which aimed to determine the role, if any,
of anthropogenic pollutants on adverse turtle health. In parallel, a turtle toxicology and health
ACCEPTED MANUSCRIPT
ACC
EPTE
D M
ANU
SCR
IPT
sampling program was undertaken with the goal to explore any correlations between identified
pollutants and turtle heath baseline parameters. Chemical monitoring activities within the GBR to
date have focused on agricultural chemicals (Huggins et al. 2017, Grant et al. 2018). The aim of
this study was to screen for a wide range of anthropogenic chemical pollutants present in the
external (i.e. water, sediment) and internal (blood) environment of green turtles, using a
combination of traditional targeted chemical analyses, non-target suspect screening, and effect-
based methods employing a case-control study design.
2. Materials and Methods
2.1 Sample Collection
Water quality monitoring was conducted using both grab ‘snap-shot’ sampling and passive sampling
techniques, where chemicals sorb from water to a collection membrane via passive diffusion. Grab
water samples (1 L) were collected directly into high density polyethylene bottles (pre-rinsed with
acetone and MilliQ water) at each site (n=9-12 per site), typically during passive sampler deployment
or retrieval. The bottle was attached to a sampling pole, submerged to depth of 50cm, filled, capped,
covered in foil to prevent photodegradation and frozen within 24 h of collection. Field blank samples
(MilliQ water) were uncapped for the duration of sampling activities.
Two types of passive samplers were used:
(1) Styrenedivinylbenzene Reverse Phase Sulfonated (SDB-RPS) EmporeTM Extraction Disks (EDs;
Phenomenex, Sydney, AUS). Polar passive samplers for hydrophilic organic chemicals with
relatively low octanol-water partition coefficients (logKOW < 3) were deployed in the naked
configuration i.e. without diffusion limiting polyether sulfone membranes (Stephens et al.
2009), and archived at -20°C following retrieval. For quantitative analysis a correction factor
based on Shaw and Mueller (2009) was applied to account for naked deployment. For
chemicals where a correction factor was not reported, the factor ratio for atrazine was used.
(2) Polydimethylsiloxane (PDMS; Purple Pig, Brisbane, AUS). Non-polar passive samplers were
used for hydrophobic organic chemicals with relatively higher octanol-water partition
coefficients (logKow> 3). A minimum of two PDMS strips (25mm × 92cm × 500 µm) were
deployed per housing (i.e. stainless steel cage), and combined during extraction and analysis.
Passive flow monitors (PFMs) were deployed alongside EDs and PDMS as a method of in situ
calibration to estimate site-specific flow conditions. The rate of loss of plaster from the PFM
can be used to predict changes in the uptake of chemicals into a sampler dependent on flow
and turbulence (O’Brien et al. 2011).
ACCEPTED MANUSCRIPT

ACC
EPTE
D M
ANU
SCR
IPT
Sediment samples were collected and stored in acetone-rinsed 375 mL glass jars using gloved hands
from the seabed surface (i.e. the top 10cm) at low tide and within the turtle foraging areas.
Sediment samples were collected from three locations within each foraging site and pooled by
weight prior to extraction and analysis. Jars were wrapped in aluminium foil to prevent
photodegradation and frozen at -20°C within 24 h of collection.
2.2 Sampling sites
Three sampling locations were selected for the case-control comparison: two ‘case’ coastal locations
influenced by adjacent catchment activities; and a remote, offshore location as a ‘control’. A
summary of the type and number of samples collected at each site are shown in Figure 1. The sites
included:
1) Upstart Bay, a rural coastal area within the Burdekin region that receives agricultural run-off
from sugar cane cultivation via the Burdekin Delta River;
2) Cleveland Bay, approximately 100 km north of Upstart Bay and 20 km South East of
Townsville, home to ~20% of the GBR population (Gunn and Manning 2009). Land use
activities include urban/residential land use, grazing, and small areas of manufacturing,
industry and waste treatment; and
3) Howicks Group of Islands, a collection of remote, unpopulated islands approximately 100 km
off-shore from the adjacent Cape York region.
Sampling activities were carried out between May and August of 2015, by members of the
multidisciplinary team who were also conducting turtle health studies at the same time. Details of
types of samples collected (grab water, passive samplers and sediment), dates and descriptions of
the sampling sites are provided in the supplementary information (Tables S1-S3, Figure S1).
2.3 Sample preparation for chemical analysis and bioassay
2.3.1 Passive samplers (Empore Disks (EDs) and Polydimethylsiloxane (PDMS))
The methods for preparation, deployment, transportation and extraction of passive samplers have
been extensively described previously (Page et al. 2014, GBRMPA 2016b, O’Brien et al. 2016),
and further details are provided in the Supplementary Material and Figure S2.
2.3.2 Grab water samples
500 mL water was fortified with isotope-labelled internal standards (mixture of herbicides and
PPCPs; Table S4), extracted using Strata-X 200mg 6cc cartridges (Phenomenex), concentrated under
ACCEPTED MANUSCRIPT

ACC
EPTE
D M
ANU
SCR
IPT
nitrogen, filtered (0.2 µm regenerated cellulose syringe filter; Phenomenex) and reconstituted in 0.5
mL 20% methanol prior to analysis by LC-MS/MS. For EDs, PDMS and grab water samples, field and
procedural blanks were processed in parallel.
2.3.3 Sediment
For chemical analysis sediment samples were pooled, homogenized, refrozen and freeze-dried. 20 g
sediment was fortified with isotopically-labelled surrogate (50 ng 2,7-dichlorodibenzodioxin;
Wellington Laboratories, Guelph, CAN), and extracted with hexane:dichloromethane (1:1, v/v) using
accelerated solvent extraction (ASE, Thermo Scientific 350; Dionex, USA). Extracts were
concentrated under nitrogen, purified with 3% deactivated silica/6% deactivated aluminium oxide
(Sigma Aldrich, Sydney, AUS), eluted with 40 mL hexane:dichloromethane (1:1), concentrated on a
rotary evaporator, and reconstituted in 200 µL hexane for analysis via GC-MS/MS.
2.3.4 Bioassays
Six g of freeze-dried sediment was extracted using pre-cleaned diatomaceous earth (approx. 1/3 of
the cell`s volume) (Sigma-Aldrich) and hexane:acetone (1:1, v/v) using accelerated solvent extraction
(ASE) and following the standardised US EPA Method 3545A (Li et al. 2013). The extraction efficiency
of this ASE method was tested previously and ranges from 80-120% for chlorinated pesticides, semi-
volatile organics and PCBs (Li et al. 2013). The extracts were concentrated under nitrogen stream,
and reconstituted in 60 μL DMSO in 1.5 mL amber HPLC vials prior to in vitro assay. DMSO extracts
were directly used for analysis on the in vitro bioassays with no further clean-up procedures.
Furnaced DE (550°C for 24h) served as a process control for QA/QC.
2.4 Sample analysis
2.4.1 Mass spectrometric analysis
2.4.1.1 Polar analytes (target and non-target analysis)
Grab water samples, ED and PDMS extracts, and sediment samples were subjected to a range of
mass spectrometric analyses (Figure 1). Briefly, EDs and grab water samples were analysed for polar
compounds (herbicides and PPCPs) using targeted LC-MS/MS; screened against a commercial
spectral library containing >3000 common pesticides, PPCPs and forensic compounds using high
resolution and subjected to unknown (non-targeted) analysis via LC-QTOF-MS. For non-targeted
analysis, full details of the analytical system and data processing methods are described in
Heffernan et al. (2017). A full list of target chemical analytes is provided in Tables S4-S5. Further
ACCEPTED MANUSCRIPT

ACC
EPTE
D M
ANU
SCR
IPT
details of the analytical system(s), chromatography and mass spectrometry parameters are
described in the Supplementary Material.
When processing target chemical results (EDs), blank subtraction was performed when field blank
concentration was 5-20% measured concentration in unknown sample; if >20%, the result was
discarded. Contamination of both field and laboratory blanks with several PPCPs including N,N-
diethyl-meta-toluamide (DEET), caffeine, triclosan, paracetamol, salicyclic acid and ibuprofen, was
evident in passive samplers and grab water samples. This was likely due to common use of products
containing these compounds by either field or laboratory personnel. Thus, any results of these
detected in deployed samplers have been excluded.
2.4.1.2 Non-polar analytes (target and non-target analysis)
Passive PDMS samplers and sediment samples were analysed for polychlorinated biphenyls (PCBs)
and pesticides using GC-MS/MS; and polyaromatic hydrocarbons (PAHs) via high resolution GC-MS
(Figure 1). Non-target screening of sediment and PDMS samples was conducted at the Norwegian
Institute of Water Research (NIVA) via GC-MS/MS. Details of the analytical system are described in
the Supplementary Material.
2.4.2 In vitro bioassays
Pooled sediment sample extracts were subjected to a battery of in vitro bioassays (AhR-CAFLUX,
AREc32, NFκB-bla, VM7Luc4E2), each with a different mode of action (MOA; Ah receptor mediated
xenobiotics, Nrf2-mediated oxidative stress, NFκBmediated response to inflammation, estrogen
activity, respectively), as described previously (Bräunig et al. 2016; Dogruer et al. 2018). All cells,
AhR-CAFLUX, AREc32, and VM7Luc4E2 bioassays in monolayers and for the NFκB bioassay in
suspension were grown in 75 cm2 flasks in 10 mL growth medium at 37˚C in a 5% CO2 atmosphere. A
detailed description of each assay is described in supplementary information. For the bioanalytical
screening, an aliquot of the extract was added to the microtiter plate and reconstituted (diluted) in
the respective assay medium. For this, DMSO extracts were directly used for analysis with no further
clean-up procedures. The representative effect-concentrations for both the samples and reference
compounds for each assay are described in the Supplemental Information (Table S8). The highest
final concentration of DMSO was 1 % in the AhR-CAFLUX assay and 0.1 % in the other assays. Each
experiment was run as 3-5 replicates on independent plates on different days. The experimental
data were evaluated and statistically analysed using Prism 5.0 (GraphPad, San Diego, CA, USA). The
statistical significance of differences between the three sites was assessed using ANOVA, whereby
values of p< 0.05 were considered statistically significant.
ACCEPTED MANUSCRIPT

ACC
EPTE
D M
ANU
SCR
IPT
3. Results and Discussion
3.1 Concentration of polar chemicals in water
A range of herbicides and PPCPs were detected at all sites using the ED passive samplers. Water
concentrations for several compounds detected in EDs were estimated from available calibration
data (i.e. sampling rates; Table 1). Additionally there were detections for chemicals for which no
passive sampler calibration data is available, and these have simply been reported as ‘detected’
(Table 1). Overall, the estimated concentrations of target chemicals in the EDs was low (i.e. < 1 ng/L).
The total number of chemicals detected in the EDs was highest in Cleveland Bay (10 herbicides and
herbicide metabolites and 9 PPCPs), followed by Upstart Bay (9 herbicides and herbicide
metabolites) and the Howicks Group of Islands (5 herbicides and herbicide metabolites) (Table 1).
Catchment-specific chemical profiles were evident between the coastal sites, with agrichemicals
detected at Upstart Bay (rural/ agricultural catchment) and agrichemicals and PPCPs detected at
Cleveland Bay, (urban/ industrial catchment). At both coastal locations, the PSII herbicides atrazine,
diuron and hexazinone were consistently detected in the highest concentrations (ranging between
0.13 to 0.68 ng/L). Atrazine and diuron were also detected sporadically at Howicks, although at very
low concentrations (<0.1 ng/L). In Cleveland Bay, the PPCPs were primarily detected in the EDs
located in closest proximity to the WWTP, suggesting effluent is a potential source of these
chemicals. In Upstart Bay, two atrazine metabolites (desethyl atrazine and desisopropyl atrazine),
together with ametryn-hydroxy (a metabolite of either atrazine or ametryn) and simazine were
detected at very low concentrations at UB 2 only (< 0.05 ng/L). The carbamate insecticide methomyl
was detected at Upstart Bay and none of the other locations
In the grab samples, concentrations of chemicals were also similarly low (< 2 ng/L). The number of
chemicals detected in grabs at Howicks was again the lowest of all three sampling locations as
expected (four herbicides and two PPCPs), however converse to the EDs, Upstart Bay had a slightly
higher number of detections (10 herbicides and herbicide metabolites and one PPCP) than Cleveland
Bay (seven herbicides and herbicide metabolites and one PPCP). Atrazine was again the most
frequently detected chemical at both coastal locations (range 0.30 to 0.58 ng/L). Diuron was also
frequently detected in 83 % of Upstart Bay samples, but less frequently (33 %) of samples from
Cleveland Bay. Notably absent was hexazinone, which was not detected in any samples but was
found in all EDs at both coastal locations. The herbicide metabolites desethyl atrazine and ametryn
hydroxy were both frequently detected at Cleveland Bay (both in 67 % of samples) and also at
Upstart Bay (33 % and 25 % of samples respectively), reflecting the ED results. Finally, the insecticide
ACCEPTED MANUSCRIPT
ACC
EPTE
D M
ANU
SCR
IPT
methomyl was detected only at Upstart Bay (42 % of samples; mean concentration 0.27 ng/L), also
consistent with its detection in the EDs.
The results show differences in the chemical profiles detected between the EDs and grab samples.
Overall, fewer chemicals were detected in the grab samples than in the EDs with the PPCPs primarily
detected in the EDs. Differences can reasonably occur as the two sampling methods are
representative of different time periods (i.e. ‘instant, point-in-time’ for grab samples, and ‘over
several days’ for EDs). In addition, they represent different volumes/ packets of water sampled (500
mL extracted for the grabs versus up to approximately 7 L for certain chemicals using the EDs). Due
to the low concentrations present in the marine environment, the concentrating effect of the EDs
allow accumulation of enough mass of chemical to exceed the detection limits of the analytical
methods, that may not be overcome using grab samples. Additionally, the physico-chemical
properties of chemicals may make them more or less suitable for uptake onto the EDs. Therefore
employing a combination of these sampling techniques provides the broadest approach to capturing
the widest range of anthropogenic pollutants.
Similarly, screening of grab water samples against a commercial spectral library containing >3000
common pesticides, PPCPs and forensic compounds generated few positive matches (Table 2);
caffeine and paracetamol in Cleveland Bay, and amphetamine in Upstart Bay. Non-targeted
analysis had limited discriminant statistical power due to low sample numbers (n=9, 3 per site).
Methyl-, ethyl-, butyl- and propyl-paraben, commonly used in PPCPs, were all tentatively identified
in one sample each from Upstart Bay and Howicks, with a relative concentration of seven orders of
magnitude higher in the Upstart Bay sample. The parabens were not detected in field and
procedural blanks, suggesting that the contamination was an isolated incident during field
sampling (Data not shown).
3.2 Herbicide concentrations on the Great Barrier Reef
Diffuse pesticide run-off is a significant contributor to declining water quality on the GBR.
Environmental monitoring and research activities have focused primarily on five priority PSII
herbicides - ametryn, atrazine, diuron, hexazinone and tebuthiuron. As part of best farming practice,
the use of alternative ‘knockdown’ herbicides (including 2,4-dichlorophenoxyacetic acid (2,4-D),
acifluorfen, imazapic, imazethapyr, isoxaflutole, metribuzin, trifloxysulfuron-Na, metolachlor,
trifluralin, pendimethalin) have been encouraged (Smith et al. 2015). These non-selective
herbicides are being marketed as preferred tools to enable no-till fallows to be economically and
ACCEPTED MANUSCRIPT

ACC
EPTE
D M
ANU
SCR
IPT
efficiently managed, theoretically reducing the risk of erosion and improving soil structure and water
content. However, these too have been reported in passive samplers in marine environments
(Garzon-Garcia et al. 2015) with metolachlor detected in EDs at both coastal locations in the
current study (0.03 ng/L to 0.16 ng/L). Overall, the types and concentration of pollutants detected in
water in this study are within the range observed in other marine monitoring activities and also
consistent with the adjacent land uses, with the chemical profile of Upstart Bay dominated by
agrichemicals, rather than PPCPs which are often associated with urban areas and water effluent.
Herbicide concentrations in this study are lower than previously reported, but consistent with low
reported PSII herbicide concentrations during periods of low rainfall and river discharge, which were
the hydrological conditions under which these samples were collected. Some of the difference may
be due to differences in passive sampler configuration and deployment time between relevant
studies (Gallen et al. 2014). Despite efforts to further clean up the sample extracts, non-target
analysis of ED extracts suffered from high levels of background interference and generated little
useful data.
3.3 Estimated semi-polar and non-polar chemical concentrations in water and sediment
3.3.1 Targeted analysis of PDMS passive samplers and sediment
PDMS and pooled sediment extracts underwent targeted analysis for a range of PCBs, pesticides and
PAHs (Table S6). In pooled sediment samples, six PAHs were detected at Upstart Bay (benzo[b +
k]fluoranthene, benzo-[e]-pyrene, benzo-a-pyrene; benzo[ghi]perylene; indeno[1,2,3-cd]pyrene,
benzo[a]anthracene) at a range of 1-3 pg/g sediment; and ten at Cleveland Bay (anthracene,
fluoranthene, pyrene, benzo[a]anthracene, chrysene, benzo[bkj]fluoranthene, benzo[e]pyrene,
benzo[a]pyrene, indeno[1,2,3-cd]pyrene, benzo[ghi]perylene), at a higher concentration range of 13-
80 pg/g sediment. There were no reportable results from PDMS extracts. These very low
concentrations are consistent with previous studies undertaken on coastal GBR sediments adjacent
to the Burdekin region (Cavanagh et al. 1999, Müller et al. 1999, Davis et al. 2012).
3.3.2 Non-targeted screening of PDMS and sediment
PDMS and sediment extracts underwent non-target screening for GC-amenable compounds. By
applying filtering criteria for detector response, NIST match score, and presence in procedural blank,
the number of candidate spectral features was reduced to <100 per sample. Tentative identification
of compounds with a confidence level of 3 (i.e. with evidence for possible structure(s), but
insufficient evidence for one exact structure) are presented in Table 3. This included pesticides,
herbicides, human and veterinary pharmaceuticals, fragrances, flavours, and industrial
ACCEPTED MANUSCRIPT
ACC
EPTE
D M
ANU
SCR
IPT
hydrocarbons. Additionally, hundreds of identified spectral features were suggestive of organic
compounds including long chain aliphatic and aromatic hydrocarbons, alcohols and ketones were
identified, but their source and/or use was not identified (data not shown). The main source of
hydrocarbons on GBR are spills, leaks and discharge from vessels, and industrial and urban activity
(Kroon et al. 2015). It is also possible some of these compounds were synthesised by endogenous
algae and phytoplankton. Upstart Bay showed markers of both agricultural and urban input into the
marine environment (i.e. herbicides and PPCPs), and Cleveland Bay showed primarily urban markers
(PPCPs), both consistent with the adjacent land use. Despite its relatively remote location, numerous
pharmaceuticals were also identified at Howicks. Both hydrocarbons and PPCPs have been named as
emerging chemicals of concern in the GBR (Kroon et al. 2015).
3.4 Correlating results from blood and water samples
To correlate internal and external exposure, results from non-target screening of EDs (2015 sampling
campaign) and grab water samples were compared with previously reported results from whole
turtle blood from the same sampling locations (Heffernan et al. 2017) (Table 2). Of these, 20:4 long
chain fatty acid, was detected in the blood, passive and grab samples at Upstart Bay and Cleveland
Bay; and the DNA adduct n-ethylguanine was detected in turtle blood and passive samplers from the
same locations. Few PPCPs were identified in blood samples: allopurinol and milrinone in Cleveland
Bay, and azaelic acid in both Cleveland Bay and Upstart Bay but these compounds were not detected
in the corresponding water samples. Pesticides were identified in water samples from Cleveland Bay
(atrazine and TEPP), and Upstart Bay (cyromazine), but not from Howicks. This is consistent with
reported tentative identification of an insecticide metabolite (ethiofencarb sulfone) in blood samples
from turtles in Cleveland Bay (Heffernan et al. 2017), providing evidence that (i) insecticides are
used in the adjacent land in Cleveland Bay; and (ii) these insecticides are being metabolised by the
resident turtle population.
Five pharmaceuticals were identified in turtle blood and water samples from Cleveland Bay, but no
single compound was detected in both matrices (Table 2; excluding DEET and Salysilic acid). We
expect most compounds to be metabolised and excreted by turtles. Thus, detecting short-lived
parent chemicals in water and matching them to the corresponding metabolite in blood is
challenging. One polybrominated compound was indentified in turtle blood from Cleveland Bay, but
no structure or compound name was generated. It is possible that this brominated compound is of
natural origin, with many natural halogenated chemicals identified previously in passive samplers on
the GBR (Vetter et al. 2009).
ACCEPTED MANUSCRIPT

ACC
EPTE
D M
ANU
SCR
IPT
3.5 Correlating data from sediment chemical analysis and bioassay results
Sediments can act as a sink for many chemicals in the aquatic environment. Incidental sediment
ingestion may occur during seagrass foraging, with turtles potentially exposed to a diverse chemical
mixture over a long period of time (Gaus et al. 2001b). Characterising such a diverse chemical
mixture with traditional targeted mass spectrometry methods is expensive and time consuming. An
effect-based approach using a battery of in vitro bioassays each with a different mode of action
(MOA) can help mitigate this limitation. Bioassay results for pooled sediment samples relative to
their bioanalytical equivalent concentrations (BEQs; TCDD (2,3,7,8- Tetrachloro-dibenzo-diozin),
tBHQ (t-Butylhydroquone), TNF-alpha (Tumor necrosis factor- alpha), and E (17-beta estradiol)
equivalent (EQ) values for AhR-CAFLUX, AREc32, NFκB-bla, and VM7Luc4E2; respectively) are
presented in Figure 2 and supplementary information (Table S8).
For the AhR–CAFLUX assay, data was evaluated after exposure times of 24 and 72 hours to reduce
the contribution of potentially labile AhR-active compounds present in the samples (e.g. PAHs). The
impact of such labile compounds can be assessed by comparing the effect concentrations for both
exposure times. A longer exposure time (72 hours) isolates the effects of more persistent
compounds according to Ling et al (2015). For the AhR–CAFLUX assay evaluated after 24h exposure,
Cleveland Bay showed the highest BEQTCDD induction (559 ng/kg sediment dry weight; dwt), followed
by Howicks and Upstart Bay (283 and 202 ng/kg dwt, respectively). Results from Cleveland Bay are
lower than previously reported concentrations in the nearby Brisbane River (927 ng/kg dwt), but
higher than Oxley Creek (360 ng/kg dwt) and the Port of Brisbane (352 ng/kg dwt) (Li et al. 2013).
Furthermore, Cleveland bay results were comparable to values found in Gladstone harbour (Bräunig
et al. 2016). Interestingly, differences between remote Howicks and agricultural/industrial Upstart
Bay areas were insignificant. This is despite a previous report of high concentrations of dioxin-like
chemicals in soil and sediment in coastal areas of Queensland from extensive use of pesticides in the
area (Holt et al. 2008). A longer exposure time isolates the effects of more persistent compounds in
the AhR-CAFLUX assay. After 72h BEQs had decreased to 21, 26, and 128 ng/kg dwt for Howicks,
Upstart and Cleveland Bay, respectively. This suggests that labile compounds (e.g. PAHs) play a more
significant role in inducing cellular response than highly persistent compounds (e.g. organochlorine
pesticides; OCPs).
As many AhR ligands also exhibit endocrine disrupting potential, we expected a similar response in
the VM7Luc4E2 assay. Surprisingly, Upstart bay had the greatest induction with 44 ng EEQ/kg dwt,
followed by Cleveland bay (26 ng/kg dwt) and Howicks (13 ng/kg dwt). ), which suggest that
ACCEPTED MANUSCRIPT

ACC
EPTE
D M
ANU
SCR
IPT
endrocrine active compounds play a bigger role in Upstart bay in relation to the two other study
sites. In our study BEQtBHQ concentration was 2.6, 5.6 and 15.7 mg/ kg dwt for Howicks, Upstart and
Cleveland Bay, respectively. The BEQtBHQ values from another Australian study ranged from 5.7 to
21.2 mg/kg wet weight in sediments associated with a broad range of land-uses (e.g. industry, urban,
mining and agriculture) as well as reference sites (e.g. Hummock Hill Island) and are comparable
with values from the present study (Bräunig et al. 2016). Furthermore, the values from the present
study were all relatively low compared with the control site in Li et al. (2013) of 3.1 mg/kg dwt,
suggesting low levels of chemicals capable of inducing oxidative stress in these sediment samples.
Similarly, we apply the NF-κB-bla assay, an indicator of inflammatory response, for the first time to
sediment samples. Howicks had the lowest induction with TNF-alpha equivalent concentration of
0.68 pg/kg dwt, followed by Cleveland and Upstart Bay (2.13 and 2.19 pg/kg dwt, respectively). Due
to the low specificity of this assay, and the large number of potential chemical compounds that can
illicit this response, we cannot narrow down likely candidates in these samples. However, the
extraction method is validated (recoveries ranging from 80- 130 %) for several groups of compounds
(organophosphorus and organochloride pesticides, chlorinated herbicides, PCBs, and PCDDs/PCDFs)
all of which are possible candidates. Overall, Howicks sediments had low BEQ results in all
bioassays, confirming its suitability as a control site. The results showed differences in the chemical
mixture among the three turtle habitats. Howicks sediments had low BEQ results in all bioassays in
comparison with the two other study sites (Cleveland Bay and Upstart Bay). Considering the feeding
behaviour of marine sea turtles and the previously documented correlation of contaminant levels in
sea turtles with sediments of their foraging ground, sediments represent an important exposure
source to anthropogenic contaminants (Hermanussen et al. 2004, 2006).
3.6 Emerging anthropogenic pollutants of concern in the GBR
The majority of pollutant monitoring on the GBR has focused on five priority PSII herbicides, but
research into other compounds is emerging. Information on PPCPs in the GBR is limited to data from
two waste water treatment plants north of both Upstart and Cleveland Bay (O'Brien et al. 2014,
Scott et al. 2014). Authors reported 26 pharmaceuticals in waste water effluent in the sub-µg/L
range, including venlafaxine, hydrochlorathiazide, and citalopram. These three compounds were also
detected in our study, typically < 1 ng/L, demonstrating the substantial dilution that occurs. More
broadly, in a survey of 73 sites from 19 waterways across Queensland the PPCPs caffeine,
paracetamol and salicylic acid were detected in 60% of samples, followed by carbamazepine (27 %)
and triclosan (25 %) (Scott et al. 2014). Wastewater is one of the most significant sources of PPCPs
pollution, and the risk is greatest around urban centres (Kroon et al. 2015). At least 50 WWTPs are
ACCEPTED MANUSCRIPT
ACC
EPTE
D M
ANU
SCR
IPT
operational within GBR catchment areas that discharge effluent into the environment. As the
population increases over the coming decades, chemicals associated with urban and industrial uses
may become of greater concern to coastal environments and wildlife.
There are no recent or reliable data available for use of agricultural chemicals in GBR catchments.
End-of-catchment pesticide loads monitoring demonstrates that usage is dynamic and can fluctuate
yearly based on specific pest pressures, climatic conditions, regulatory action, use of resistant crop
varieties or the development of herbicide resistance in weeds (Devlin et al. 2015). Due to this
significant knowledge gap, the use of non-targeted mass spectrometry and effects-directed analyses
are the most informative approach for characterising chemical exposure of marine wildlife.
4. Conclusions
This study describes an innovative and comprehensive approach to monitoring exposure and
associated health effects of organic environmental pollutants on marine wildlife. A combination of
effect-based and non-targeted chemical analysis screening tools allowed detection of a large
number of chemicals that are not captured by existing monitoring programs which arguably
underestimate the exposure risk to marine wildlife. The ‘case-control’ approach to sampling and
comparative analysis confirmed spatial differences in the external exposures of resident coastal
versus offshore green turtles. Overall low concentrations of pesticides, pharmaceuticals and
personal care products associated with known uses in the adjacent catchments were detected in
water, passive samplers and sediment. Despite these low concentrations, the cumulative effects of
exposure on such long-lived species such as the green turtle are unknown.
Acknowledgements
This study was funded by the Worldwide Fund for Nature (WWF) Australia, through a grant from the
Banrock Station Environmental Trust. The authors gratefully acknowledge Dr Michael Gallen and Dr
Laurence Hearn for GC/MS-MS analysis, and A/Prof Caroline Gaus and Dr Janet Tang for assistance
with sediment bioassays. JFM is funded by an Australian Research Council (ARC) Future Fellowship
(FF120100546); ALH receives funding support from the ARC and the National Health and Medical
Research Council (GNT1106911). The Queensland Alliance for Environmental Health Sciences
(QAEHS) at the University of Queensland, is co-funded by Queensland Health.
ACCEPTED MANUSCRIPT

ACC
EPTE
D M
ANU
SCR
IPT
References
Arthur, K. E., M. C. Boyle, and C. J. Limpus. 2008. Ontogenetic changes in diet and habitat
use in green sea turtle (Chelonia mydas) life history. Marine Ecology Progress Series
362:303-311.
Bräunig, J., J. Y. Tang, M. S. J. Warne, and B. I. Escher. 2016. Bioanalytical effect-balance
model to determine the bioavailability of organic contaminants in sediments affected
by black and natural carbon. Chemosphere 156:181-190.
Cavanagh, J. E., K. A. Burns, G. J. Brunskill, and R. J. Coventry. 1999. Organochlorine
Pesticide Residues in Soils and Sediments of the Herbert and Burdekin River
Regions, North Queensland – Implications for Contamination of the Great Barrier
Reef. Marine pollution bulletin 39:367-375.
Davis, A. M., S. E. Lewis, Z. T. Bainbridge, L. Glendenning, R. D. Turner, and J. E. Brodie.
2012. Dynamics of herbicide transport and partitioning under event flow conditions in
the lower Burdekin region, Australia. Marine pollution bulletin 65:182-193.
Davis, A. M., P. J. Thorburn, S. E. Lewis, Z. T. Bainbridge, S. J. Attard, R. Milla, and J. E.
Brodie. 2013. Environmental impacts of irrigated sugarcane production: Herbicide
run-off dynamics from farms and associated drainage systems. Agriculture,
Ecosystems & Environment 180:123-135.
Devlin, M., and B. Schaffelke. 2009. Spatial extent of riverine flood plumes and exposure of
marine ecosystems in the Tully coastal region, Great Barrier Reef. Marine and
Freshwater Research 60:1109-1122.
Devlin, M. M., S. S. Lewis, A. A. Davis, R. R. Smith, A. A. Negri, M. M. Thompson, and M.
M. Poggio. 2015. Advancing our understanding of the source, management, transport
and impacts of pesticides on the Great Barrier Reef 2011-2015.
Dogruer, G., L. Weijs, J. Y.-M. Tang, H. Hollert, M. Kock, I. Bell, C. A. M. Hof, and C.
Gaus. 2018. Effect-based approach for screening of chemical mixtures in whole blood
of green turtles from the Great Barrier Reef. Science of the total environment
612:321-329.
DSITIA. 2012. Land use summary 1999–2009: Great Barrier Reef catchments. Queensland
Department of Science, Information Technology, Innovation and the Arts, Brisbane.
Gallen, C., M. Devlin, K. Thompson, C. Paxman, and J. Mueller. 2014. Pesticide monitoring
in inshore waters of the Great Barrier Reef using both time-integrated and event
monitoring techniques (2013 - 2014). The University of Queensland, The National
Research Centre for Environmental Toxicology (Entox).
Garzon-Garcia, A., R. Wallace, R. Huggins, R. Turner, R. A. Smith, D. Orr, B. Ferguson, R.
Gardiner, B. Thomson, and M. S. J. Warne. 2015. Total suspended solids, nutrient and
pesticide loads (2013–2014) for rivers that discharge to the Great Barrier Reef – Great
Barrier Reef Catchment Loads Monitoring Program. Department of Science,
Information Technology and Innovation. Brisbane.
Gaus, C., M. O'Donohue, D. Connell, J. Mueller, D. Haynes, and O. Papke. 2004. Exposure
and potential risks of dioxins to the marine mammal dugong. Pages 1532-1538 in
Dioxin 2004-24 International Symposium on Halogenated Environmental Organic
Pollutants and POPs. TU Berlin Servicegesellschaft mbH.
Gaus, C., O. Papke, W. Blanchard, D. Haynes, D. Connell, and J. F. Muller. 2001a.
Bioaccumulation and pathways of PCDDs in the lower trophic marine system.
Gaus, C., O. Päpke, N. Dennison, D. Haynes, G. R. Shaw, D. W. Connell, and J. F. Müller.
2001b. Evidence for the presence of a widespread PCDD source in coastal sediments
and soils from Queensland, Australia. Chemosphere 43:549-558.
GBRMPA. 2014. Great Barrier Reef Outlook Report 2014. Great Barrier Reef Marine Park
Authority, Townsville.
ACCEPTED MANUSCRIPT

ACC
EPTE
D M
ANU
SCR
IPT
GBRMPA. 2016a. About the Reef. Great Barrier Reef Marine Park Authority.
GBRMPA. 2016b. Marine Monitoring Program quality assurance and quality control manual
2015/16. GBRMPA, Townsville.
Grant, S., C. Gallen, K. Thompson, C. Paxman, D. Tracey, and J. Mueller. 2017. Marine
Monitoring Program: Annual Report for inshore pesticide monitoring 2015-2016.,
Townsville.
Grant, S., K. Thompson, C. Paxman, G. Elisei, G. C., D. Tracey, S. Kaserzon, H. Jiang, S.
Samanipour, and J. Mueller. 2018. Marine Monitoring Program: Annual Report for
inshore pesticide monitoring 2016-2017., Townsville.
Gunn, J., and C. Manning. 2009. Basins, Catchments and Receiving Waters of the Black
Ross Water Quality Improvement Plan Area. Townsville City Council - Creek to
Coral, Townsville.
Heffernan, A. L., M. M. Gómez-Ramos, C. Gaus, S. Vijayasarathy, I. Bell, C. Hof, J. F.
Mueller, and M. J. Gómez-Ramos. 2017. Non-targeted, high resolution mass
spectrometry strategy for simultaneous monitoring of xenobiotics and endogenous
compounds in green sea turtles on the Great Barrier Reef. Science of the total
environment 599:1251-1262.
Hermanussen, S., C. Limpus, O. Papke, D. Connell, and C. Gaus. 2006. Foraging habitat
contamination influences green sea turtle PCDD/F exposure. Pages 592-595 in
International Symposium on Halogenated Persistent Organic Pollutants. Norwegian
Institute of Public Health.
Hermanussen, S., C. J. Limpus, O. Papke, W. Blanchard, D. Connell, and C. Gaus. 2004.
Evaluating spatial patterns of dioxins in sediments to aid determination of potential
implications for marine reptiles. Pages 1837-1843 in Dioxin 2004. TU Berlin
Servicegesellschaft mbH.
Holt, E., R. Von Der Recke, W. Vetter, D. Hawker, V. Alberts, B. Kuch, R. Weber, and C.
Gaus. 2008. Assessing dioxin precursors in pesticide formulations and environmental
samples as a source of octachlorodibenzo-p-dioxin in soil and sediment.
Environmental Science & Technology 42:1472-1478.
Huggins, R., R. Wallace, D. N. Orr, B. Thomson, R. A. Smith, C. Taylor , O. King, R.
Gardiner, B. Ferguson, S. Preston, S. Simpson, J. Shanks, M. S. J. Warne, R. Turner,
and R. M. Mann. 2017. Total suspended solids, nutrient and pesticide loads (2015–
2016) for rivers that discharge to the Great Barrier Reef – Great Barrier Reef
Catchment Loads Monitoring Program. Department of Science, Information
Technology and Innovation. Brisbane.
Kroon, F., R. Turner, R. Smith, M. Warne, H. Hunter, R. Bartley, S. Wilkinson, S. Lewis, D.
Waters, and C. Carroll. 2013. 2013 Scientific Consensus Statement: Chapter 4
Sources of sediment, nutrients, pesticides and other pollutants in the Great Barrier
Reef catchment.
Kroon, F. J., K. L. E. Berry, D. L. Brinkman, A. Davis, O. King, R. Kookan, S. Lewis, F.
Leush, O. Makarynskyy, S. Melvin, J. Mueller, P. Neale, D. O'Brien, R. Smith, J.
Tsang, J. van de Merwe, M. Warne, and M. Williams. 2015. Identification, impacts,
and prioritisation of emerging contaminants present in the GBR and Torres Strait
marine environments. Report to the National Environmental Science Programme.,
Reef and Rainforest Research Centre Limited, Cairns.
Li, J. Y., J. Y. M. Tang, L. Jin, and B. I. Escher. 2013. Understanding bioavailability and
toxicity of sediment‐associated contaminants by combining passive sampling with in
vitro bioassays in an urban river catchment. Environmental Toxicology and
Chemistry 32:2888-2896.
ACCEPTED MANUSCRIPT

ACC
EPTE
D M
ANU
SCR
IPT
Müller, J. F., D. Haynes, M. McLachlan, F. Böhme, S. Will, G. R. Shaw, M. Mortimer, R.
Sadler, and D. W. Connell. 1999. PCDDS, PCDFS, PCBS and HCB in marine and
estuarine sediments from Queensland, Australia. Chemosphere 39:1707-1721.
O'Brien, D., S. Lewis, C. Gallen, J. O'Brien, K. Thompson, G. Eaglesham, and J. Mueller.
2014. Barron River pesticide monitoring and Cairns WWTP WQ assessment. Report
No. 14/40. Centre for Tropical Water & Aquatic Ecosystem Research (TropWATER)
Publication, James Cook University, Cairns.
O’Brien, D., M. Bartkow, and J. F. Mueller. 2011. Determination of deployment specific
chemical uptake rates for SDB-RPD Empore disk using a passive flow monitor
(PFM). Chemosphere 83:1290-1295.
O’Brien, D., S. Lewis, A. Davis, C. Gallen, R. Smith, R. Turner, M. Warne, S. Turner, S.
Caswell, and J. F. Mueller. 2016. Spatial and temporal variability in pesticide
exposure downstream of a heavily irrigated cropping area: application of different
monitoring techniques. Journal of Agricultural and Food Chemistry 64:3975-3989.
Page, D., K. Miotliński, D. Gonzalez, K. Barry, P. Dillon, and C. Gallen. 2014.
Environmental monitoring of selected pesticides and organic chemicals in urban
stormwater recycling systems using passive sampling techniques. Journal of
contaminant hydrology 158:65-77.
Scott, P. D., M. Bartkow, S. J. Blockwell, H. M. Coleman, S. J. Khan, R. Lim, J. A.
McDonald, H. Nice, D. Nugegoda, and V. Pettigrove. 2014. A national survey of
trace organic contaminants in Australian rivers. Journal of environmental quality
43:1702-1712.
Shaw, M., and J. F. Mueller. 2009. Time Integrative Passive Sampling: How Well Do
Chemcatchers Integrate Fluctuating Pollutant Concentrations? Environmental Science
& Technology 43:1443-1448.
Smith, R., R. Turner, S. Vardy, R. Huggins, R. Wallace, and M. S. J. Warne. 2015. An
evaluation of the prevalence of alternate pesticides of environmental concern in Great
Barrier Reef catchments: RP57C. . Department of Science, Information Technology,
Innovation and the Arts. Brisbane.
Stephens, B. S., A. P. Kapernick, G. Eaglesham, and J. F. Mueller. 2009. Event monitoring of
herbicides with naked and membrane-covered Empore disk integrative passive
sampling devices. Marine pollution bulletin 58:1116-1122.
Vetter, W., P. Haase-Aschoff, N. Rosenfelder, T. Komarova, and J. F. Mueller. 2009.
Determination of Halogenated Natural Products in Passive Samplers Deployed along
the Great Barrier Reef, Queensland/Australia. Environmental Science & Technology
43:6131-6137.
ACCEPTED MANUSCRIPT
ACC
EPTE
D M
ANU
SCR
IPT
Integrated chemical exposure assessment of coastal green turtle foraging grounds on the Great
Barrier Reef
a*Gallen, C., aHeffernan, A.L., aKaserzon, S., a,bDogruer, G., a,cSamanipour, S., aGomez-Ramos, M.J.,
aMueller, J.F.
a Queensland Alliance for Environmental Health Sciences (QAEHS), The University of Queensland, 20
Cornwall St, Woolloongabba, Qld 4102;
b Institute for Environmental Research, RWTH Aachen University, Germany
c Norwegian Institute for Water Research (NIVA), Oslo
*Corresponding author (C. Gallen): [email protected]; Phone +61733461802
Figures and Tables
ACCEPTED MANUSCRIPT

ACC
EPTE
D M
ANU
SCR
IPT
Table 1 Estimated water concentrations (range, ng/L; detection frequency, %) of selected chemicals
with (top) and without (bottom) available passive sampling calibration data, detected using Empore
disk (ED) passive samplers and grab samples.
Site Name Howicks Upstart Bay Cleveland Bay
Sample type ED (n=3)
Grabs (n=12)
ED (n=3)
Grabs (n=12)
ED (n=3)
Grabs (n=9)
Estimated concentration range (ng/L)
Ametryn <LOD <LOD - 0.65 (8%)
<LOD <LOD - 0.65 (8%)
<LOD <LOD - 0.3 (11%)
Atrazine <LOD - 0.07 (33%)
<LOD 0.19 - 0.23 (100%)
0.30 - 0.46 (100%)
0.61 - 0.66 (100%)
0.41 - 0.58 (100%)
Atrazine desethyl <LOD <LOD <LOD - 0.05 (67%)
<LOD - 0.14 (33%)
<LOD <LOD - 0.14 (67%)
Bromacil <LOD <LOD - 0.56 (17%)
<LOD
Diuron <LOD - 0.03 (33%)
<LOD 0.16 (100%)
<LOD - 0.68 (83%)
0.14 - 0.25 (100%)
<LOD - 0.28 (33%)
Hexazinone <LOD <LOD 0.14 - 0.18 (100%)
<LOD 0.14 - 0.15 (100%)
<LOD
Metolachlor <LOD <LOD 0.03 (100%)
<LOD 0.15 - 0.16 (100%)
<LOD - 0.25 (22%)
Simazine <LOD - 0.02 (67%)
<LOD <LOD - 0.02 (33%)
<LOD 0.04 - 0.11 (100%)
<LOD
Tebuthiuron <LOD <LOD <LOD <LOD <LOD - 0.02 (33%)
<LOD
Imadicloprid <LOD - 0.03 (33%)
<LOD - 0.21 (17%)
<LOD <LOD <LOD - 0.03 (33%)
<LOD
Desisopropyl atrazine <LOD <LOD <LOD - 0.01 (67%)
<LOD <LOD - 0.01 (33%)
<LOD
Prometryn <LOD <LOD <LOD - 0.71 (8%)
<LOD <LOD - 0.31 (11%)
Chlorpyrifos <LOD <LOD <LOD <LOD - 0.15 (8%)
<LOD <LOD
Propoxur <LOD <LOD - 0.14 (8%)
<LOD <LOD <LOD <LOD
Positive identification^
Acesulfame . n.d. - 1.4 (8%)
n.d. - 0.26 (11%)
Carbamazepine (67%)
Citalopram (33%)
Codeine (67%)
Desmethyl Citalopram (33%)
Iopromide (67%)
Methomyl (100%)
n.d. - 0.33 (42%)
Paracetamol
Tramadol (33%)
Venlafaxine (33%)
DCPMU n.d. - 0.38 (17%)
(33%)
Ametryn hydroxy (67%)
n.d. - 0.26 (25%)
(67%)
n.d. - 0.37 (67%)
Triclopyr (33%)
Triclosan (67%)
Hydrochlorthiazide n.d. - 0.12 (8%)
(33%)
ACCEPTED MANUSCRIPT

ACC
EPTE
D M
ANU
SCR
IPT
^ results for EDs for these chemicals are represented in mass per sampler (i.e. presence/ absence) only as no passive sampling calibration data is available to calculate water concentrations
ACCEPTED MANUSCRIPT

ACCEPTED MANUSCRIP
T
8
Table 2 Summary of compounds tentatively identified by library screening (using non-target LC-QTOF/MS) in Cleveland and Upstart Bay, as detected in passive (ED) and grab samples. Library match was
based on accurate mass, isotopic distribution and fragmentation profile; or compounds identified manually as a structural isomer of a library compound. Turtle blood results reproduced from Heffernan et
al. (2017)
Compound Howicks Islands Cleveland Bay Upstart Bay
Blood Passive H2O Grab H2O Blood Passive H2O Grab H2O Blood Passive H2O Grab H2O
Endogenous compounds 2-Octenoyl-carnitine - - - - - - - - Adenine - - - - - - - Adenosine - - - - - - - Dopamine - - - - - - - - Fatty acid (C20:4) - Inosine - - - - - - - - N-ethylguanine - - - - Nicotinamide - - - - Pharmaceuticals & personal care products Allopurinol - - - - - - - - Para-aminomethyl-benzoic acid - - - - - - - -
Azelaic acid - - - - - - -
Cyclopentamine - - - - - - - - DEET - - - Milrinone - - - - - - - - Salicylic acid - - - - - - - Viloxazine - - - - - - - - Pesticides and industrial products
8-hydroxy quinolone - - - - - - - - Atrazine - - - - - - - - Cyromazine - - - - - - - - Tetraethyl pyrophosphate (TEPP) - - - - - - - - Other
Acesulfame - - - - - - - - Hordenine - - - - - - - -
ACCEPTED MANUSCRIPT

ACC
EPTE
D M
ANU
SCR
IPT
Table 3 Selected compoundsa tentatively identified in sediment and PDMS samples using non-target GC-MS/MS.
Howicks Cleveland Bay Upstart Bay
Pre-wet
PDMS Sediment PDMS Sediment PDMS Sediment
Pharmaceuticals and personal care products
Ajmaline
Azomycin
Benzophenone
Cimaterol
Clozapine
Enalapril
Fenfluramine
Flurbiprofen
Imipramine
Lamotrigine
Mefenamic Acid
Methaqualone
Naproxen
Perphenazine
Phenytoin
Physostigmine
Pyrazinamide
Ribavirine
Remoxipride
Risperidone
Sertraline
Pesticides and industrial chemicals
Amidosulfuron
Bensulfuron-methyl
Carbendazim
Chlortoluron
Diazinon
Disperse Orange 3
Isoproturon
Metolachlor
Isoproturon
Other Acetophenone
Arginine
Diethyl Phthalate
Ethyl 2-hexenoate
Pulegone
Yohimbine a Those that could be classified into a chemical class; b no data available as sampler lost during field deployment
Figure 1 Location, type and number of samples collected at each sampling site (top table) and a
schematic diagram of the analytical and bioassay methods conducted on each sample type (bottom).
ACCEPTED MANUSCRIPT

ACC
EPTE
D M
ANU
SCR
IPT
Figure 2 TCDD (2,3,7,8- Tetrachloro-dibenzo-diozin), tBHQ (t-Butylhydroquone), TNF-alpha (Tumor
necrosis factor- alpha), and E (17-beta estradiol) bioanalytical equivalent values (BEQ; mean, SD) of
sediments (dry weight; dwt) from each site (blue dot (Howicks); green square (Cleveland bay); red
triangle (Upstart bay)) for a battery of bioassays tested in this study.
ACCEPTED MANUSCRIPT
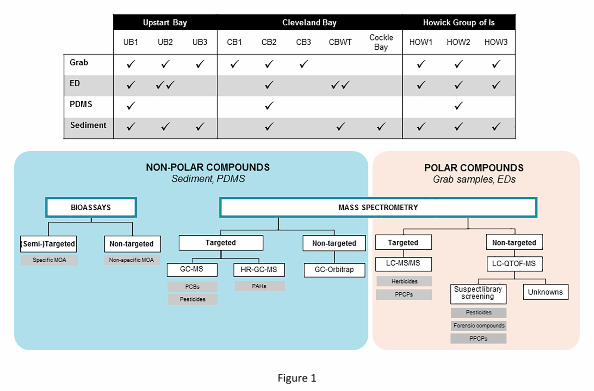
Figure 1

Figure 2