integrated data analysis for measurements in fusion ... · integrated data analysis for...
TRANSCRIPT
Integrated Data Analysis for Measurements in Fusion Devices – Concept and Applications
R. Fischer and the ASDEX Upgrade TeamMax-Planck-Institut für Plasmaphysik, Garching
Greifswald, Germany, May 08-12, 2017
11th IAEA TM on Control, Data Acquisition, and Remote Participation for Fusion Research

IDA for Nuclear Fusion
Different measurement techniques for the same quantities complementary data
Coherent combination of measurements from different diagnostics
Goal:➢ replace combination of results from
individual diagnostics➢ with combination of measured
data one-step analysis of pooled data
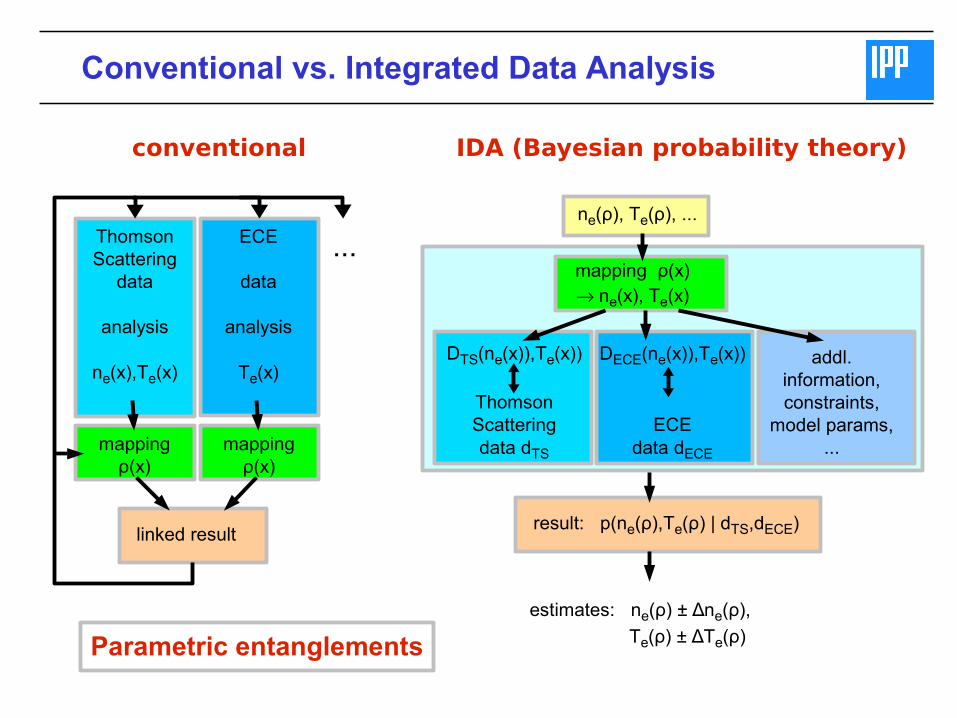
Conventional vs. Integrated Data Analysis
ThomsonScattering
data
analysis
ne(x),Te(x)
ECE
data
analysis
Te(x)
mappingρ(x)
mappingρ(x)
linked result
ne(ρ), Te(ρ), ...
mapping ρ(x)ne(x), Te(x)
DTS(ne(x)),Te(x))
ThomsonScatteringdata dTS
DECE(ne(x)),Te(x))
ECEdata dECE
result: p(ne(ρ),Te(ρ) | dTS,dECE)
addl. information,constraints,
model params,...
conventional IDA (Bayesian probability theory)
estimates: ne(ρ) ± Δne(ρ),
Te(ρ) ± ΔTe(ρ)
...
Parametric entanglements

Conventional vs. Integrated Data Analysis (2)
● (self-)consistent results? (cumbersome; do they exist?)● data and result validation? (How to deal with inconsistencies?)● information propagation? (Single estimates as input for analysis of other diagnostics?)● non-Gaussian error propagation? (frequently neglected: underestimation of the true error?)● difficult to be automated (huge amount of data from steady state devices: W7X, ITER, ...)● often backward inversion techniques (noise fitting? numerical instability? loss of information?)● result: estimates and error bars (sufficient? non-linear dependencies?)
Drawbacks of conventional data analysis: iterative
Probabilistic combination of different diagnostics (IDA)✔ uses only forward modeling (complete set of parameters → modeling of measured data)✔ synergistic effects via diagnostic interdependencies (complementary diagnostics)✔ additional physical information easily to be integrated✔ systematic and unified error interpretation → Bayesian Probability Theory ✔ result: probability distribution of parameters of interest
IDA offers a unified way
of combining data (information) from various experiments (sources)
to obtain improved results

Probabilistic (Bayesian) Recipe
Reasoning about parameter θ:
(uncertain) prior information
+ (uncertain) measured data
+ physical model
+ Bayes theorem
+ additional uncertain (nuisance) parameter β
+ parameter averaging (model comparison)
p ∣d =pd∣× p
p d
}p
likelihood distribution
prior distributiond=D
D= f p d∣
posterior distribution
p ∣d =∫ d p ,∣d marginalization(integration)
generalization of Gaussian error propagation laws
=∫ d pd∣ ,× p× p
p d
prior predictive valuepd∣M =∫d p , d∣M =∫ d p d∣ ,M p

Bayesian Recipe for IDA: LIB + DCN + ECE + TS
Reasoning about parameter ne, Te:
(uncertain) prior information
+ diagnostic 1:
+ diagnostic 2:
+ diagnostic 3:
+ diagnostic 4:
+ Bayes theorem
p ne , T e∣d TS , d ECE , d LiB , d DCN ∝ pd TS∣ne ,T e ×
p ne ,T e
likelihood distributions
prior distribution
dTS=DTS ne ,T e ; p d TS∣ne ,T e
posterior distribution
d ECE=DECE T e ; pd ECE∣T e
d LiB=DLiB ne ,T e ; p d LiB∣ne ,T e
dDCN=DDCN ne ; pd DCN∣ne
p d ECE∣T e ×
p d LiB∣ne ,T e ×
p d DCN∣ne ×
p ne ,T e

Likelihood probability distribution
measured data:
Example: Gaussian (independent, normally distributed measurement errors)
=1
∏i
N
√2πσ i2exp {−χ
2
2 }p ( d⃗∣T e , σ⃗ )=∏
i
N
p (d i∣T e ,σ i)
d=D (T e)+ϵ
modeled data: D (T e)
noise (measurement uncertainty): ϵ
Likelihood: p (d∣T e)= p (ϵ=d−D (T e))
χ2=∑
i
N [d i−Di (T e)]2
σ i2
many variants: Poisson, Cauchy for outliers (robust estimation), ...
measurement uncertainty: :σ
with
p (ϵ)∼exp (− ϵ2
2σ 2 )

Application: W7-AS
R. Fischer, A. Dinklage, and E. Pasch, Bayesian modelling of fusion diagnostics, Plasma Phys. Control. Fusion, 45, 1095-1111 (2003)
ne, Te: Thomson scattering, interferometry, soft X-ray
Electron density30% reduced error
Synergism: Total effect is greater than the sum of the individual effects
→ synergism by exploiting full probabilistic correlation structure
Thomson Scattering
Soft-X-ray
edT =∫

Application: JET
➢ ne , Te : Interferometry, core LIDAR and edge LIDAR diagnostics
➢ ne : Lithium beam forward modelling
D. Dodt, et al., Electron Density Profiles from the Probabilistic Analysis of the Lithium Beam at JET, P-2.148, EPS 2009, Sofia
O Ford, et al., Bayesian Combined Analysis of JET LIDAR, Edge LIDAR andInterferometry Diagnostics, P-2.150, EPS 2009, Sofia
J. Svensson, A. Werner, Plasma Physics and Controlled Fusion 50 (2008) 085022
MINERVA framework (now also used at W7X):
“Probabilistic "data fusion" framework based on Bayesian principles”“... which implements a flexible and general way of modelling and carrying out analysis on this type of interconnected probabilistic systems by modelling of diagnostics, physics models and their dependencies through the use of Bayesian graphical models”

Application: TJ-II
B. Ph. van Milligen, et al., Integrated data analysis at TJ-II: The density profile, Rev. Sci. Instrum. 82, 073503 (2011)
ne : Interferometry, reflectometry, Thomson scattering, and Helium beam
Full forward model for InterferometryReflectometry (group delay)
Partial forward model forThomson scatteringHelium beam

Application: ...
“An integrated data analysis tool for improving measurements on the MST RFP”L. M. Reusch, et al., Review of Scientific Instruments 85, 11D844 (2014)
Madison Symmetric Torus: Te from SXR and TS
“Towards integrated data analysis of divertor diagnostics with ray-tracing”M. Carr, et al., Proceedings of 44th EPS conference (2016)
“Integrated Analysis of Spectroscopic Data”D. Dodt, et al., Proceedings of ITC/ISHW2007
“Determination of Zeff by integrating measurements from x-ray tomography and charge exchange recombination spectroscopy”M.E. Galante, et al., Nucl. Fusion 55 123016 (2015)
“Estimation of profiles of the effective ion charge at ASDEX Upgrade with Integrated Data Analysis”S. Rathgeber, et al., Plasma Phys. Control. Fusion 52 (2010) 095008
and many more … (also in other fields of science)

LIB: new forward model
Lithium beam diagnostic:
→ electron density ne at the plasma edge
→ collisional radiative model to be solved
→ old: “shooting method”
noise fitting → temporal binning 20 ms
numerical instability → density profile stops just before pedestal
→ new: forward model → Dlib(ne)
temporal resolution: 20 s
Pedestal well determined
“Probabilistic lithium beam analysis”R. Fischer, et al., PPCF 50 (2008) 085009
comparison of profiles from Thomson scattering, old data analysis, and new probabilistic method

IDA at ASDEX Upgrade
➢Lithium beam impact excitation spectroscopy (LIB)
➢Interferometry measurements (DCN)
➢Electron cyclotron emission (ECE)
➢ Thomson scattering (TS)
➢ Reflectometry (REF)
➢ Beam emission spectroscopy (BES)
(1) multi-diagnostic profile reconstruction: ne , Te
(2) Equilibrium reconstructions for diagnostics mapping: New and flexible equilibrium code IDEcombining all measured data and modeling information
R. Fischer et al., Integrated data analysis of profile diagnostics at ASDEX Upgrade, Fusion Sci. Technol., 58, 675-684 (2010)
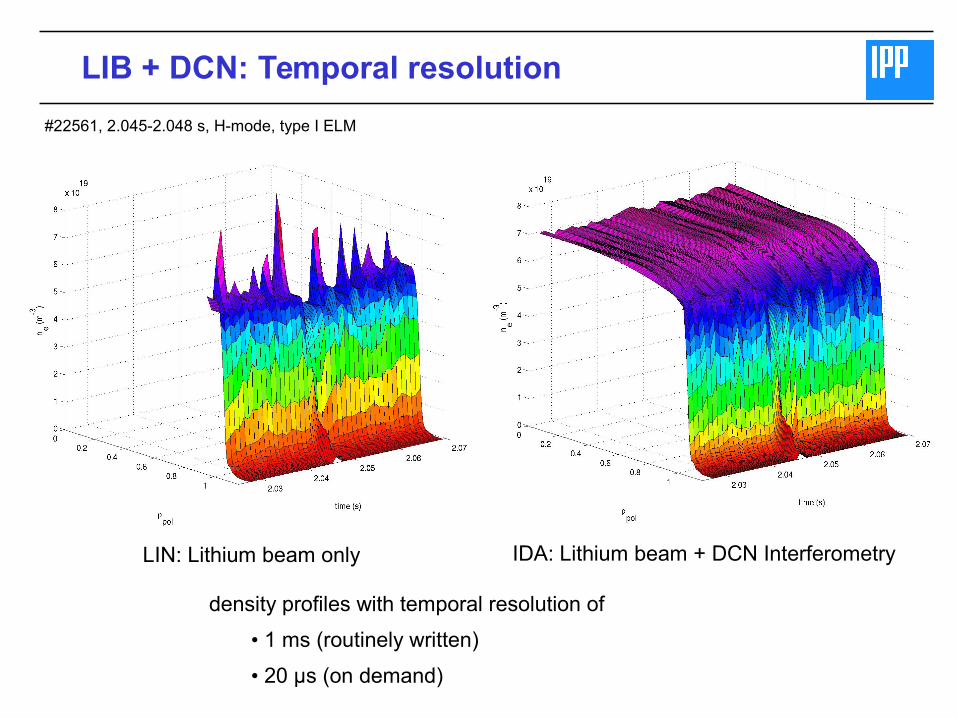
LIB + DCN: Temporal resolution
LIN: Lithium beam only IDA: Lithium beam + DCN Interferometry
#22561, 2.045-2.048 s, H-mode, type I ELM
density profiles with temporal resolution of
• 1 ms (routinely written)
• 20 μs (on demand)

IDA: LIB + DCN + ECE
➔ simultaneous:✔ full density profiles ✔ (partly) temperature profiles
→ pressure profile➔ ne > 0.95*ne,cut-off → masking of ECE channels
➔ opt. depth ~ neTe → masking of ECE channels

IDA: LIB + DCN + ECE: radiation transport
• ECE assumptions: local emission and black-body radiation (optically thick plasma)• Optically thin plasma (edge and core)
→ EC emission depends on Te and ne
→ combination with data from density diagnostics is mandatory → calculate broadened EC emission and absorption
profiles by solving the radiation transport equation
→ electron cyclotron forward model (ECFM) in the framework of Integrated Data Analysis (S.K. Rathgeber et al., PPCF 55 (2013) 025004; S. Denk, to be published)
dI ω(s)ds= jω( s ;ne ,T e)−αω(s ;ne ,T e) I ω( s)
s LOS coordinateI ω spectral intensityjω emissivityαω reabsorption

IDA: LIB + DCN + ECE: New LIB Optics
➔ additional midplane LIB optics :✔ large signal-to-noise ratio ✔ density profiles consistent
➔ turbulence studies (200 kHz data sampling)
old LOSnew
data, fit, residues
M. Willensdorfer et al., PPCF 56 (2014) 025008

IDA: LIB + DCN + ECE: New central DCN channel
H-1
H-2
H-3
H-4
H-0
H-5
A. Mlynek
Shift of one DCN channel (H-0) closer to the center→ smaller uncertainty in center→ core density variations of 10% significantly observable
Bi-notch filter on H-0 signal (mirror vibrations at 123 ± 18 Hz and 280 ± 40
Hz):→ large spurious oscillations in central density suppressed
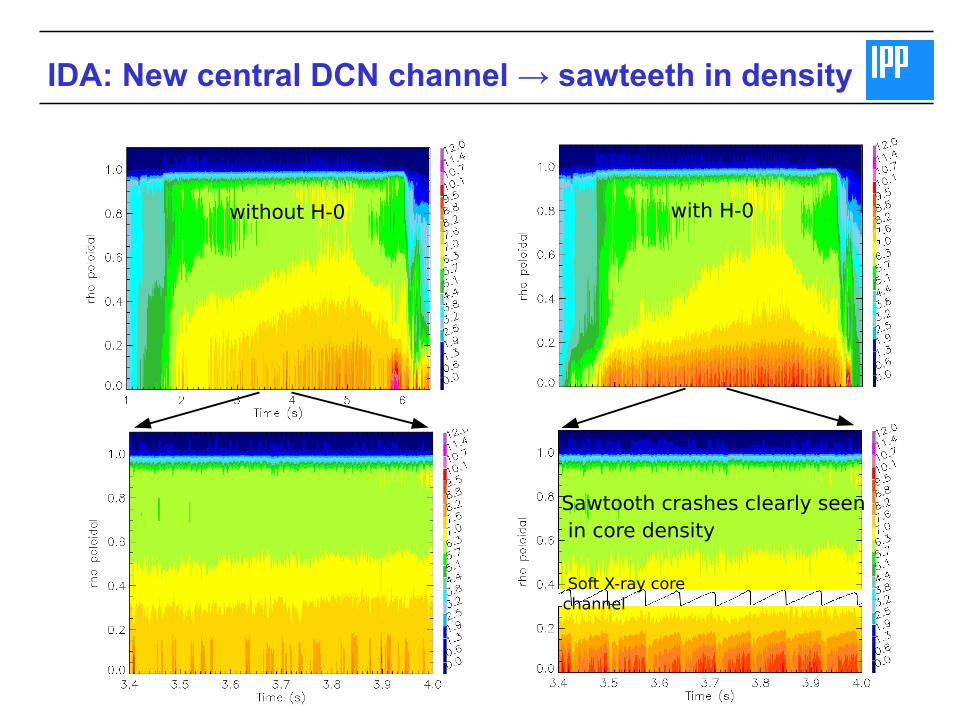
IDA: New central DCN channel → sawteeth in density
without H-0
Sawtooth crashes clearly seen in core density
with H-0
Soft X-ray core channel

The Magnetic Equilibrium
➢Tokamak equilibrium (Grad-Shafranov equation)
➢ Various codes: EFIT, CLISTE, IDE, …
➢ External constraints: Magnetic probe and flux loop measurements → ill-posed equilibrium (core)
➢ Internal constraints: Motional Stark effect (MSE, iMSE) → frequently cumbersome to be calibrated
➢ Additional inner constraints:
✗ Pressure profile (electrons, ions, fast particles) → constrains P'
✗ Edge pressure profiles (thermal electrons + ions) → reconstruct edge current distribution
✗ Core pressure profiles (+ fast particles from TRANSP) → locate magnetic axis
✗ Faraday rotation (new)
✗ Motional Stark Effect: MSE and imagingMSE (new)
✗ divertor tile currents, q, q0, loop voltage, …
✗ Geometric information about the shape of magnetic surfaces (iso-flux constraints)
from multiple temperature measurements (Te and T
i) on the same flux surface
➢ Extension of equilibrium equation:
✗ toroidal flows
✗ current diffusion
(R ∂∂ R1R∂∂ R+∂ ²∂ z ² )Ψ=−(2π) ²μ0R
2P '+μ0FF '

Pressure: Edge constraint
Kinetic profile constraints
pe = n
e*T
e , p
i = f(n
e, Z
eff, T
i ) , p
fast {TRANSP} → p = p
e + p
i + p
fast
→ Improves definition of edge pressure and current density profiles
→ resolves full ELM cycle
M. Dunne, et al., NF 52 (2012) 124014
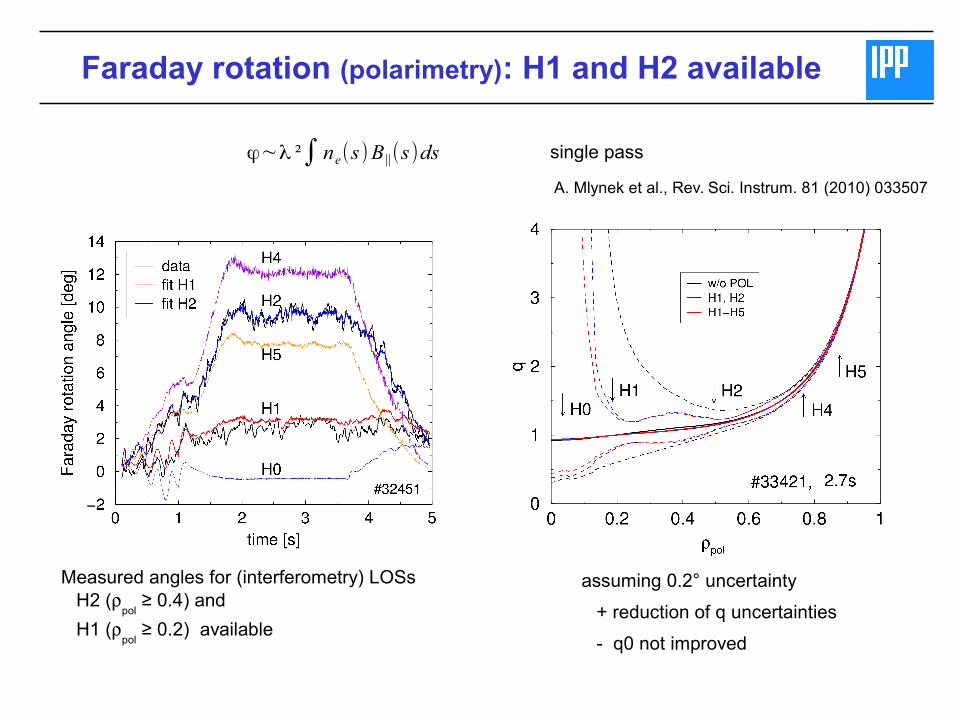
Faraday rotation (polarimetry): H1 and H2 available
single passϕ∼λ ²∫ne(s)B∥(s)ds
Measured angles for (interferometry) LOSs H2 (
pol ≥ 0.4) and
H1 (pol
≥ 0.2) available
assuming 0.2° uncertainty
+ reduction of q uncertainties
- q0 not improved
A. Mlynek et al., Rev. Sci. Instrum. 81 (2010) 033507
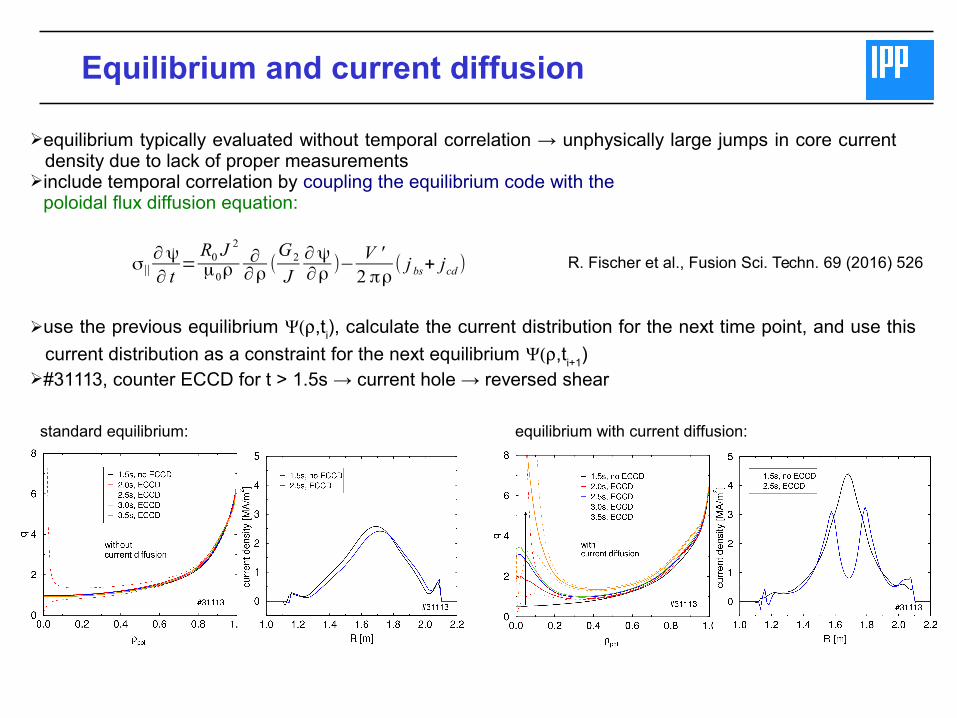
Equilibrium and current diffusion
➢equilibrium typically evaluated without temporal correlation → unphysically large jumps in core current density due to lack of proper measurements➢include temporal correlation by coupling the equilibrium code with the
poloidal flux diffusion equation:
σ||∂ψ
∂ t=R0 J
2
μ0ρ∂∂ρ(G2
J∂ψ∂ρ)−
V '2 πρ( j bs+ jcd )
➢use the previous equilibrium Ψ,ti), calculate the current distribution for the next time point, and use this
current distribution as a constraint for the next equilibrium Ψ,ti+1
)➢#31113, counter ECCD for t > 1.5s → current hole → reversed shear
standard equilibrium: equilibrium with current diffusion:
R. Fischer et al., Fusion Sci. Techn. 69 (2016) 526

IDA for Nuclear Fusion (1)
✔ forward modeling only (synthetic diagnostic)✔ probability distributions: describes all kind of uncertainties ✔ multiply probability distributions, marginalization of nuisance parameters✔ parameter estimates and uncertainties
➢ Probabilistic modeling of individual diagnostics
➢ Probabilistic combination of different diagnostics✔ systematic and unified error analysis is a must for comparison of diagnostics✔ error propagation beyond single diagnostics
Different measurement techniques (diagnostics: LIB, DCN, ECE, TS, ...)for the same quantities (ne, Te, …)
and parametric entanglement in data analysis→ magnetic equilibrium

• Redundant data: ➢ more reliable results by larger (meta-) data set
→ reduction of estimation uncertainties➢ detect and resolve data inconsistencies (reliable/consistent diagnostics)
• Complementary data: ➢ resolve parametric entanglement➢ resolve complex error propagation (non-Gaussian) ➢ synergistic effects➢ automatic in-situ and in-vivo calibration (transient effects, degradation, …)➢ advanced data analysis technique
→ improvements in modelling (ECE) and diagnostics hardware (LIB)
• Goal: Coherent combination of measurements from different diagnostics➢ replace combination of results from individual diagnostics➢ with combination of measured data → one-step analysis of pooled data➢ in a probabilistic framework → unified error analysis!
IDA for Nuclear Fusion (2)