integrated data handling and visualization - geo … · integrated data handling and visualization...
TRANSCRIPT

Integrated Data handling and Visualization Investigating the concept of Digital Earth Module part of Remote Sensing and GIS Integration Course (GRS-60312) Wageningen University and Research
Prepared by Lammert Kooistra, John Stuiver and Ron van Lammeren Version: May 2017

Table of content
Module Integrated Data handling and Visualization ......................................... 1
Introduction ............................................................................................ 1
Assignment Integrated Data handling and Visualization ................................ 2
Digital Earth Application Portfolio ............................................................... 2
Planning ................................................................................................. 2
Laboratory for learning: Living Lab The Reirinck ........................................... 3
Elements of Digital Earth Application Portfolio ................................................ 4
Specification of use case (wk1) .................................................................. 4
Data management plan (wk1) ................................................................... 5
Field work plan (wk2) ............................................................................... 5
Publication of geo-data and acceptance test (wk4) ....................................... 6
Usability strategy (wk4) ........................................................................... 7
Final implementation and visualization in presentation (wk5) ......................... 8
Final remarks ............................................................................................ 8
Literature ................................................................................................. 8
Appendix 1: Potential Use Cases for Living Lab the Reirinck: some inspiration .... 9
Appendix 2: Evaluation criteria for portfolio assessment ................................ 15

1
Module Integrated Data handling and Visualization
Introduction
Recent advances in information-technology have triggered the development of innovative concepts for integrated systems which make it possible to find, visualise and make sense of vast amounts of geo-referenced information on physical and social environments. For example, the vision of ‘Digital Earth’ as proposed by US Vice-President Al Gore in a speech in 1999 has resulted in whole new field of research (Craglia et al., 2012a). This field is focussing on the development of systems which would allow users to navigate through space and time, accessing historical data as well as future predictions (based for example on environmental models), and would support its use by scientists, policy-makers and laymen alike. The Digital Earth concept brings together a large range of geo-data sources like base registers, remote sensing sources, in-situ sensor network and increasingly also citizen observed information (Craglia et al., 2012b). Critical aspects for integration of these sources are a complete and standardized description of data-sets, assessment of data quality and harmonized publication of the data through web mapping services (WMS). For more background on recent developments and applications of the concept of Digital Earth you can watch the documentary ‘Big Earth Data: the digitized planet’ (produced by ZDF: available from https://www.youtube.com/watch?v=Bj9VyOm2S08). In an initial paper by Craglia et al. (2008), eight key elements for the concept of Digital Earth were described: 1. Not one Digital Earth, but multiple connected globes/infrastructures addressing the
needs of different audiences: citizens, communities, policymakers, scientists, educationalists.
2. Problem oriented: e.g. environment, health, societal benefit areas, and transparent on the impacts of technologies on the environment
3. Allowing search through time and space to find similar/analogue situations with real time data from both sensors and humans (different from what existing GIS can do, and different from adding analytical functions to a virtual globe)
4. Asking questions about change, identification of anomalies in space in both human and environmental domains (flag things that are not consistent with their surroundings in real time)
5. Enabling access to data, information, services, and models as well as scenarios and forecasts: from simple queries to complex analyses across the environmental and social domains.
6. Supporting the visualization of abstract concepts and data types (e.g. low income, poor health, and semantics)
7. Based on open access, and participation across multiple technological platforms, and media (e.g. text, voice and multi-media)
8. Engaging, interactive, exploratory, and a laboratory for learning and for multidisciplinary education and science.

2
In this Integrated Data handling and Visualization (IDV) module of the course you will explore and analyse current developments in this geo-information science field and develop a digital earth application.
Assignment Integrated Data handling and Visualization
The assignment for this module can be summarized as follows: Develop a reproducible Digital Earth application for a specific Use Case present in the Living Lab The Reirinck Additional conditions referring to the eight key-elements of the Digital Earth concept are:
• Combine open geo-data sources with own measured geo-data;
• Make use of 3D visualization elements and data sources;
• Publish newly acquired data-sets as open data sources and document data quality;
• Prepare and present a visualization demonstrator based on a specified usability strategy.
In the following sections this assignment will be elaborated in more detail.
Digital Earth Application Portfolio
Every group will prepare a Digital Earth Application Portfolio (DEAP) containing the following elements: • pitch presentation and specification of use case (wk1) • data management plan (wk1) • field work plan (wk2) • acceptance test (wk4) • usability strategy (wk4) • final implementation, visualization in presentation and demonstrator (wk5) • Selection of 4-5 key datasets which will be published The portfolio needs to be submitted on Tuesday June 13 for evaluation. Evaluation criteria can be found in Appendix 2. In the next sections, the individual elements of the portfolio are described in more detail.
Planning This module is part of the course RS and GIS Integration (GRS-60312). Next to the IDV module students will work on the preparation of a consultancy project. In Table 1, a potential planning is presented but this is based on the approximate number of days to be spend on the different activities. The project team is free to set their own priorities as long as the deadlines as specified in the course documents on the delivery of the products are achieved.

3
Table 1: Planning of Module Integrated Data handling and Visualization within GRS-60312
Laboratory for learning: Living Lab The Reirinck
The hostel the Reirinck (Figure 1) near Groenlo in the Achterhoek (address: Oude Winterswijkseweg 52, 7141 HE, Oost-Gelre) is a historic property which is currently used as a hostel with a large variation in functions (sleeping, catering, parties, weddings, ...: see http://www.reirinck.com/). The properties include historic buildings, an area of (historic) forest, nature areas and some cultural objects. The land-use around the Reirinck is characterized by a combination of agriculture (both arable and livestock) and natural areas in a small-scale landscape with remnant hedge rows and small-scale forested areas. The landscape is attractive for tourism and also the city of Groenlo has some well-known historic buildings. Also, Groenlo was the location where the famous beer brand Grolsch was produced. Unfortunately, since a decade the Grolsch production has been moved to the city of Enschede. For the management of the Reirinck, property information is required to support decisions on when maintenance is required, for PR and communication, comply with regulations etc. But also tourists are interested in unique locations to visit, nature lovers would like to spot rare species and the sporty people among us would like to follow challenging tracks. This supporting information can be derived from geo-data sources and need proper visualization and communication and description of the quality aspects.

4
Figure 1: Location and surrounding of hostel Reirinck near Groenlo in the Achterhoek (52.0320527 N, 6.6470871 E).
Elements of Digital Earth Application Portfolio In the next sections, the different elements of the Digital Earth Application Portfolio (DEAP) will be elaborated in some more detail. The specific format or presentation of DEAP is not fixed. This could be either a complete word/pdf type of document, or a folder structure with the separate components, but it could also be a web-page where the different elements are presented. The choice for this design is free and to be decided by the project team.
Specification of use case (wk1)
At the core of this assignment is the decision for a specific use case for which the Digital Earth application will be developed. Think about questions like: 1. What are current development around the Living Lab the Reirinck (see description in
Appendix 1)?
2. Who are the stake-holders in these processes?
3. What are the (geo)data and information requirements?
4. What would be possible ways to present/visualize this to end-users?
5. And of course, very important what is the personal interest and motivation for the team?
After week 1 of the course, every team will prepare a case study description (max 1500 words) for their Digital Earth application based on the questions as stated above. This

5
version can be updated during the execution of the module till a final version which will be part of the DEAP. On Tuesday May 16, every team will prepare a first idea of their case study and present this in a short pitch (max 4 slides and 5 minutes) to the whole group.
Data management plan (wk1)
Central in the Digital Earth concept is the search, access, processing and visualization of a large amount of heterogenous data-sources required to address a specified application. These data could consist of open geo-data sources (including (processed) earth observation data, in-situ sensors) but also newly acquired datasets which will be collected during the fieldwork week in Groenlo (week 3). To organize and manage these data-sources, a data management plan (DMP) needs to be prepared. This DMP deals with the following:
• The types of data, software and other materials produced within the Digital Earth
application;
• The standards to be used for data and metadata format and content;
• Policies for access, sharing and ownership of data and products;
• Plans for archiving data, software and other research products, and for preservation of
access to them.
For the preparation of the DMP a specific format has been prepared which can be found here (add link). By the end of week 1 every group will prepare an initial version of the DMP for their Digital Earth application. This could mean that not all items of the format could be filled in yet. You should consider the DMP as a living document which will be updated on a regular basis until the version which will be submitted at the end of the module as part of DEAP.
Field work plan (wk2)
An important component of the Digital Earth concept is the availability of real-time and actual data. This could be actual data identifying change when compared with historic data, collection of new data to fill-in missing data or increase the detail of existing datasets, or acquisition of new data to check the quality of available datasets through validation as part of quality control (QC) procedures. In this context validation is defined as ‘the process of assessing, by independent means, the quality of the data products derived from the system outputs’ (CEOS definition). Quality control is the whole process of evaluation and documentation of the (scientific) quality of the products with respect to their intended performance which includes storage of product meta data and publication of QC documents and protocols. The latter is described in the DMP. Several validation methods can be used but the most common one is to compare field measurements for a specific parameter from the real world with the products which are used in the Digital Earth. As an example, land use can be classified from a remote sensing image and can be validated by field observations at the same location. During the fieldwork week in Groenlo (week 3), specific new geo-data sets will be acquired by the project teams to support their Digital Earth application. A range of (geo-)equipment is available allowing to acquire a broad range of thematic datasets. However, we also would like to ask attention for quality evaluation of already existing (open) datasets. To organize and prepare the fieldwork activities a Field work plan will be prepared in week 2 of the

6
course in the office in Wageningen. During two days in Groenlo (May 31 and June 1), the plan will be executed and the resulting datasets will be published and made available through the Digital Earth application (week 4). The fieldwork plan is a structured description of the fieldwork methodology for the identified datasets which will be collected to support the Digital Earth application. The plan should be descriptive and reproducible and covers the following aspects:
• Short overview of Digital Earth application;
• Description of datasets and variables which will be collected: definition and justification
(e.g., actuality, validation);
• Description of the (statistical) quality parameter(s) which will be used to compare the
field
• measured variable with comparable variables in the Digital Earth application;
• Description of the sampling scheme both in space and time;
• Description of the (geo) data which are required for preparation of the fieldwork, actual
maps etc.;
• Description of the (field) instruments which will be adopted in the collection procedure;
• Description of measurement protocols indicating the actual detailed steps to carry out
the
• fieldwork, referring to instrument, sampling schemes etc.;
• Description of the field forms either on paper or digitally to store data in the field;
• Description of data-storage including metadata and analysis (as part of DMP);
• Description of feasibility and risks for planned fieldwork activities.
A draft version of the fieldwork plan (pdf format) needs to be submitted for feasibility check on Tuesday May 23 before 17:00 to Lammert Kooistra: when < 1 Mb by email to [email protected], otherwise send by www.wetransfer.com. On Wednesday May 24 before 11:00, feedback will be send to all groups, after which there is time to update the fieldwork plans. On Wednesday May 24 at 17:00, the final version of the fieldwork plan needs to be submitted and this will be evaluated.
Publication of geo-data and acceptance test (wk4) A Digital Earth application should enable open access to geo-data (key element 5 and 7). Also the geo-data acquired in Living Lab the Reirinck could be of relevance to other users than your own team. Therefore, we ask every team to publish a selection of 3-4 key datasets from the fieldwork collected data through a Web Mapping Service (WMS). For this activity, we offer ArcGIS online as publication platform. As part of the publication process, a specified acceptance test needs to be followed in order to ensure the quality of the dataset according to specific geo-data standards. The instructions for publication and the acceptance test can be found here (add link). The selected datasets need to be published in week 4, ideally before Wednesday June 7 at 17:00. This will allow other teams to make use of the datasets in their Digital Earth application.

7
Usability strategy (wk4)
To support the user-centric approach of Digital Earth application, the analysis of user requirements is critical. Within the field of geo-information, usability analysis is gaining importance in order to:
• make products and systems easier to use,
• and match them more closely to user needs and requirements (www.usabilitynet.org).
Within this context, usability goals are related to:
• Effectiveness: can users do what they want to do?
• Efficiency: how much effort do users require to do this?
• Satisfaction: what do users think about the products ease of use?
In preparation of the visualisation functionality of your Digital Earth application, every team is asked to prepare a Usability Strategy. An introduction on the concept of Usability for Communication and Visualization will be given on Thursday May 18 by Ron van Lammeren. To prepare the Usability strategy as part of your DEAP, we ask you to describe the following elements:
• The intended users of the Digital Earth application and their characteristics (e.g.,
according to concept of personas);
• An initial inventory of potential functional requirements for the Digital Earth application
to be developed;
• A choice of a methodology for usability analysis based on the overview of Usability
analysis methods as presented on http://www.usabilitynet.org/tools/methods.htm
(Figure 2). Note: the usability analysis doesn’t need to be executed within this module,
however an explanation of the chosen methodology needs to be presented;
• A description of the selected visualization functionality which has been implemented for
the final Digital Earth application which will be presented
Figure 2: Usability method selection matrix as presented on www.usabilitynet.org

8
Final implementation and visualization in presentation (wk5)
The final result of this module will be a presentation of the Digital Earth application including a demonstrator of the visualization approach. For the demonstrator focus on the user-interface and an overview of the functionality where especially the combination of existing (open) geo-data sources and the newly acquired data should be presented. In the presentation, the following elements of the Digital Earth application should be highlighted:
• The relevance of case study for the Living Lab the Reirinck;
• The intended users and their profile;
• Selection of newly acquired data-sets;
• Usability strategy;
• Developed demonstrator
The presentation should fulfil the following requirements:
• Presentation 20 minutes
• Discussion 10 minutes
• Audience: potential users specified for the Digital Earth application
For the presentations we will go back to the Reirinck on Monday June 12 where the presentations will be done in the Herberg building. You could use the actual surroundings in your presentation and present the demonstrator in a field situation making use of for example a mobile platform. As a final result include the presentation and the developed demonstrator for the Digital Earth application in your DEAP.
Final remarks This module has been newly designed for the Remote Sensing and GIS Integration Course in 2017. The intention of this module is to get insight into the whole process from geo-data collection to final use in a specific case within the Digital Earth concept. Although the products for the DEAP are clearly defined, the actual implementation, the detailed content and the graphical design are still loosely defined. This means there is room for own interpretation, creativity and choices according to available geo-standards. As this module is done as a team its critical that the choices made have been discussed and that all team members actively contribute to this process and bring in their own expertise and skills. We as developers of this module are always open for feedback so we can also learn from you.
Literature Craglia et al., 2012a. Digital Earth 2020: towards the vision for the next decade. International Journal of Digital Earth 5: 4-21. Craglia, M., Ostermann, F., Spinsanti, L., 2012b. Digital Earth from vision to practice: making sense of citizen-generated content. Journal of Digital Earth 5: 398-416. Guo, H., Liu, Z., Jiang, H., Wang, C., Liu, J., Liang, D., 2017. Big Earth Data: a new challenge and opportunity for Digital Earth’s development. International Journal of Digital Earth, 10:1, 1-12.
9
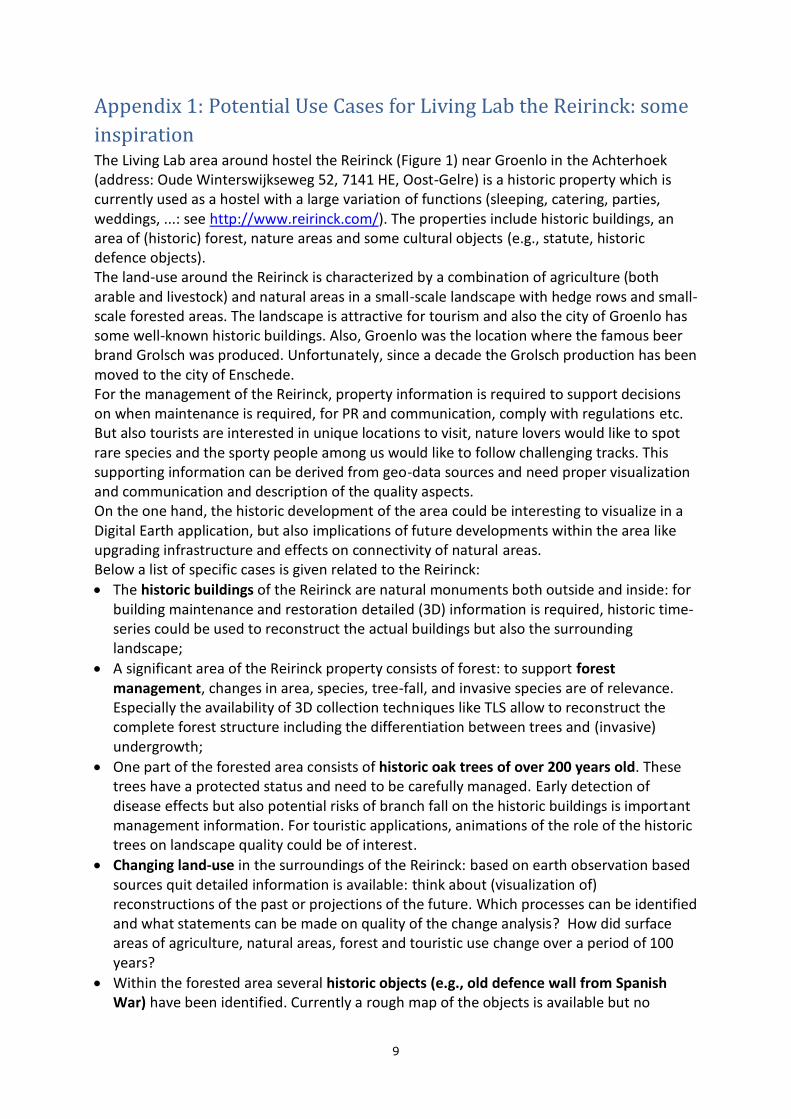
Appendix 1: Potential Use Cases for Living Lab the Reirinck: some
inspiration The Living Lab area around hostel the Reirinck (Figure 1) near Groenlo in the Achterhoek (address: Oude Winterswijkseweg 52, 7141 HE, Oost-Gelre) is a historic property which is currently used as a hostel with a large variation of functions (sleeping, catering, parties, weddings, ...: see http://www.reirinck.com/). The properties include historic buildings, an area of (historic) forest, nature areas and some cultural objects (e.g., statute, historic defence objects). The land-use around the Reirinck is characterized by a combination of agriculture (both arable and livestock) and natural areas in a small-scale landscape with hedge rows and small-scale forested areas. The landscape is attractive for tourism and also the city of Groenlo has some well-known historic buildings. Also, Groenlo was the location where the famous beer brand Grolsch was produced. Unfortunately, since a decade the Grolsch production has been moved to the city of Enschede. For the management of the Reirinck, property information is required to support decisions on when maintenance is required, for PR and communication, comply with regulations etc. But also tourists are interested in unique locations to visit, nature lovers would like to spot rare species and the sporty people among us would like to follow challenging tracks. This supporting information can be derived from geo-data sources and need proper visualization and communication and description of the quality aspects. On the one hand, the historic development of the area could be interesting to visualize in a Digital Earth application, but also implications of future developments within the area like upgrading infrastructure and effects on connectivity of natural areas. Below a list of specific cases is given related to the Reirinck:
• The historic buildings of the Reirinck are natural monuments both outside and inside: for building maintenance and restoration detailed (3D) information is required, historic time-series could be used to reconstruct the actual buildings but also the surrounding landscape;
• A significant area of the Reirinck property consists of forest: to support forest management, changes in area, species, tree-fall, and invasive species are of relevance. Especially the availability of 3D collection techniques like TLS allow to reconstruct the complete forest structure including the differentiation between trees and (invasive) undergrowth;
• One part of the forested area consists of historic oak trees of over 200 years old. These trees have a protected status and need to be carefully managed. Early detection of disease effects but also potential risks of branch fall on the historic buildings is important management information. For touristic applications, animations of the role of the historic trees on landscape quality could be of interest.
• Changing land-use in the surroundings of the Reirinck: based on earth observation based sources quit detailed information is available: think about (visualization of) reconstructions of the past or projections of the future. Which processes can be identified and what statements can be made on quality of the change analysis? How did surface areas of agriculture, natural areas, forest and touristic use change over a period of 100 years?
• Within the forested area several historic objects (e.g., old defence wall from Spanish War) have been identified. Currently a rough map of the objects is available but no

10
detailed 3D characterization of the objects has yet been made: this could be of relevance to assess the quality of these objects but also to give more detailed information to tourists visiting the area.
• Tourism around the Reirinck: what is the intensity of the number of visitors passing roads (counting and questionnaires) but also which quality aspects are important and how did these develop over time.
• Can historic views be like beer brewery life (Reirinck was also brewery for some period) or Groenlo under attack of Spanish army be projected in current situation (augmented reality).
• Dynamics and time-series to construct animations: how are people using the Reirinck area: do we have trackers available (students were trackers during fieldwork week, wearables, AMS trackers, strave/runkeeper etc.).
• Sustainable energy is a general theme which could be relevant for the Reirinck and the connected community of Zwolle. Which opportunities does this area have for increasing the sustainable energy production as a community.
• The border landscape: the Reirinck and Groenlo is located close to the Dutch-German border. How has the area changed geographically on a decadal time-scale under the influence of local and global changes.
Photo: The Reirinck main building surrounded by historic oak trees
Photo: Restored building the Herberg

11
Photo: Surrounding natural small-scale landscape with hedge-rows and forest
Photo: Surrounding forested area with a variety of tree species and varying undergrowth
Photo: Historic defence wall dating from the Spanish War hidden in the landscape

12
Photo: recent infrastructure: new cycling path connecting Groenlo and the community of Zwolle. On the background agricultural land-use: mowing the large grassland fields.
Photo: historic cycling path on the Reirinck property: a large contrast with the newly developed cycling path (see above)

13
Photo: Tourist sign on the location of historic objects in the surroundings of the Reirinck
Photo: detail of the currently available map
Photo: Tourists cycling the Achterhoek area

14
Photo: Connecting cycling and hiking routes on the Reirinckpad
Photo: large-scale expansion of touristic land-use in surroundings of the Reirinck

15
Appendix 2: Evaluation criteria for portfolio assessment The following evaluation criteria will be used in the assessment of the portfolio: Description and relevance of use case Selection approach data sets Reproducibility of digital earth application Completeness of acceptability test Quality of usability strategy Quality of the presentation Creativity and graphical design For the criteria, rubrics will be prepared and communicated to the project teams in week 2 of the course.