integrated data system structure for active traffic management - planninggp and...
TRANSCRIPT
Integrated Data System Structure for Active Traffic Management - Planning and Operationg g p
National Highway Data Workshop and ConferenceHiD CHiDaC
Sept. 22-24, 2009
Dr. Xiao-Yun LuR h E iResearch Engineer
California PATH, U. C. Berkeley
1

Outlines
• Integrated Corridor Management (ICM)
• Active Traffic Management (ATM)
• Towards Integrated Traffic Data SystemsTowards Integrated Traffic Data Systems
2

Integrated Corridor Management (ICM)
• Integrated Corridor Management Larger Scale CorridorLarger Scale Corridor All Roads All Modes All the TimesAll the Times
• Active Traffic Management System Corridor Wide Road Network TrafficCorridor Wide Road Network Traffic Demand Manage Capacity manage Network Traffic Flow Manage Network Traffic Flow Manage Data Supporting System
3

Active Traffic Management
• TRB Definition of ATM• Lesson Learned in Traditional Traffic ManagementLesson Learned in Traditional Traffic Management• Traffic Characteristics• Overall Picture of ATM• Demand Manage• Demand Manage• Capacity Management• Freeway Traffic Control
B l k D i d H dli• Bottleneck Detection and Handling• Traffic Control Assistance Measures• Coordination between Freeway and Arterial Traffic Control
4

TRB Definition of ATM
• TRB Active Traffic Management Subcommittee (2009)
Active Traffic Management (ATM) can be defined as the concept of
dynamically managing and controlling traffic demand and available
capacity of transportation facilities By continuously monitoringcapacity of transportation facilities. By continuously monitoring
system performance and related real time data, strategies would be
employed based on prevailing and anticipated conditions to
optimize the effectiveness, efficiency and safety of the
transportation network.
5

• Maximizing utility of available
– Highway infrastructure
– Sensor, communication and information technologies
– Control system technologies
• Improved safety
I d bilit• Improved mobility
• Minimized pollution – noise and emission
6

Lesson Learned in Traditional Traffic Management
• Operation locally
• Operation only divide traffic into two state: free-flow or congested
• Corresponding traffic control was trying to bring congested traffic into
f fl hi h i t l ibl if d d i t hi hfree-flow, which is not always possible if demand is too high
• Freeway traffic and arterial traffic managed separately
• Demand partially managed passively through driver information• Demand partially managed passively through driver information
• Capacity is not properly managed
• Inadequate attention on traffic data qualityInadequate attention on traffic data quality
• Current traffic data systems do not support ATM
• Traffic control (mainly ramp metering) performance rather low( y p g) p
7

Traffic Characteristics
• Traffic system cannot be treated a closed system: Dynamic interactions exist between subsystems of all levels y– Freeways– Freeway and arterials– Arterials, local surface street, driveway, , y
• Highly stochastic– Demand uncertainty
• Variety of sinks and sourcesy• Complex network connection• Special event• OD table is not available
– Large variance in driver behavior • Mode and rout choices: based on experiences and current
perception
8
• Driving behavior

Traffic Characteristics
• Uncertainty directly affecting traffic flow– Driver behavior: time headway, speed, acceleration/decelerationDriver behavior: time headway, speed, acceleration/deceleration– Weather condition– Road geometry: available lanes, curvature, grade, – VisibilityVisibility– Vehicle differences
• Non-recurrent bottleneck challengeNon recurrent bottleneck challenge– Quick automatic detection and estimation of bottleneck capacity
flow– Traffic control responsep– Incident/accident clearance
• Traffic control strategy for multiple bottleneck along a corridor
9
gy p g

Overall Picture of ATM
Demand manage Capacity Manage
Combined VSL & CRM for mainstream traffic control
Bottleneck detection and management
Traffic Control Assistance Measures
10

Overall Picture of ATM
Traveler’s info for tripplanning & routing
Demand manage Capacity Manage
Combined VSL & CRM for integrated mainstream and arterial traffic control
Bottleneck detection and managementarterial traffic control
T ffi C t l A i tTraffic Control Assistance Measures
Driver advice or mandate on: speed limit lane
11
Driver advice or mandate on: speed limit, lane use limit, lane changing assistance/limit, dynamic shoulder use, HOV/HOT dynamic use, merging assistance, gap etc

Overall Picture of ATMT i l i & d
Traffic assignment for individual veh. routing
Trip planning & mode use selection
Demand Manage Capacity Manage
Combined VSL & CRM for integrated mainstream and arterial traffic control
Bottleneck detection and managementarterial traffic control
T ffi C t l A i tTraffic Control Assistance Measures
Driver advice or mandate on: speed limit lane
12
Driver advice or mandate on: speed limit, lane use limit, lane changing assistance/limit, dynamic shoulder use, HOV/HOT dynamic use, merging assistance, gap etc

Demand Manage
• Demand manage - Semi-global (corridor or network) range – dynamically
assigning traffic according to predicted demand and practical capacity
– Routing
N t k id hi h l ti• Network wide - highway selection
• Routing through arterial/surface street (using alternate onramp
and off-ramp)and off ramp)
– Diverging (using alternate onramp and off-ramp)
– Integrated manage for freeway connectionsg g y
13
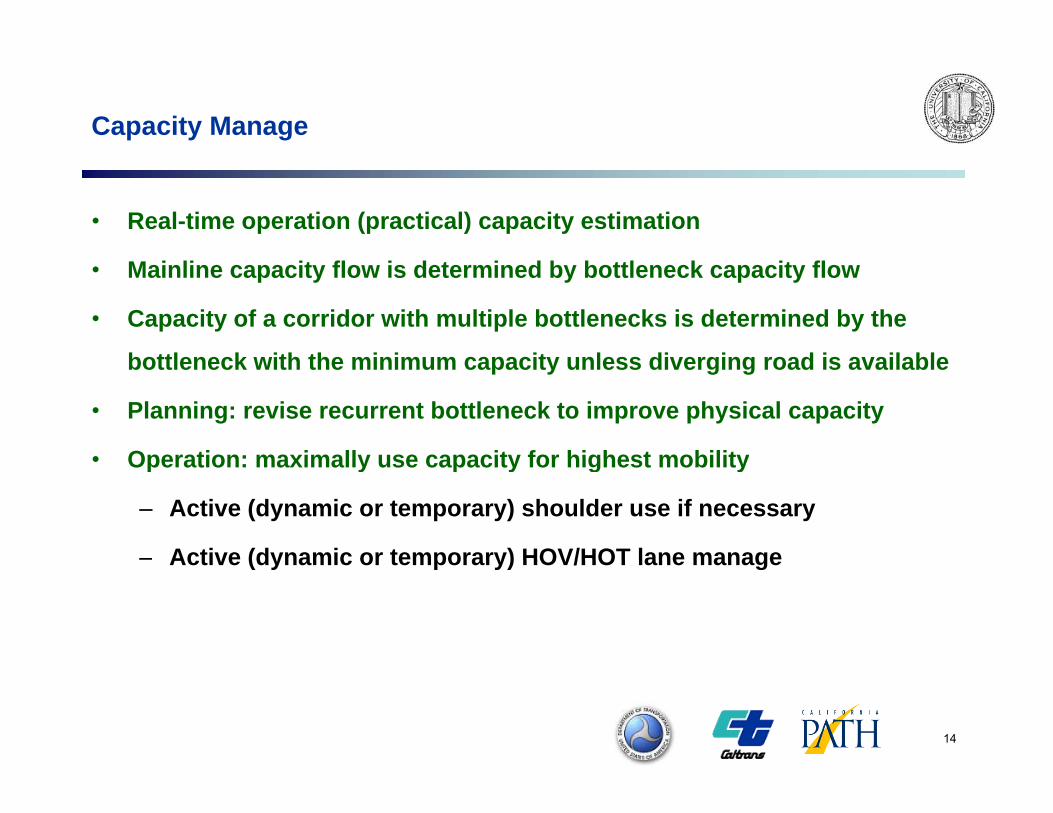
Capacity Manage
• Real-time operation (practical) capacity estimation
• Mainline capacity flow is determined by bottleneck capacity flow
• Capacity of a corridor with multiple bottlenecks is determined by the
b ttl k ith th i i it l di i d i il blbottleneck with the minimum capacity unless diverging road is available
• Planning: revise recurrent bottleneck to improve physical capacity
• Operation: maximally use capacity for highest mobility• Operation: maximally use capacity for highest mobility
– Active (dynamic or temporary) shoulder use if necessary
– Active (dynamic or temporary) HOV/HOT lane manageActive (dynamic or temporary) HOV/HOT lane manage
14
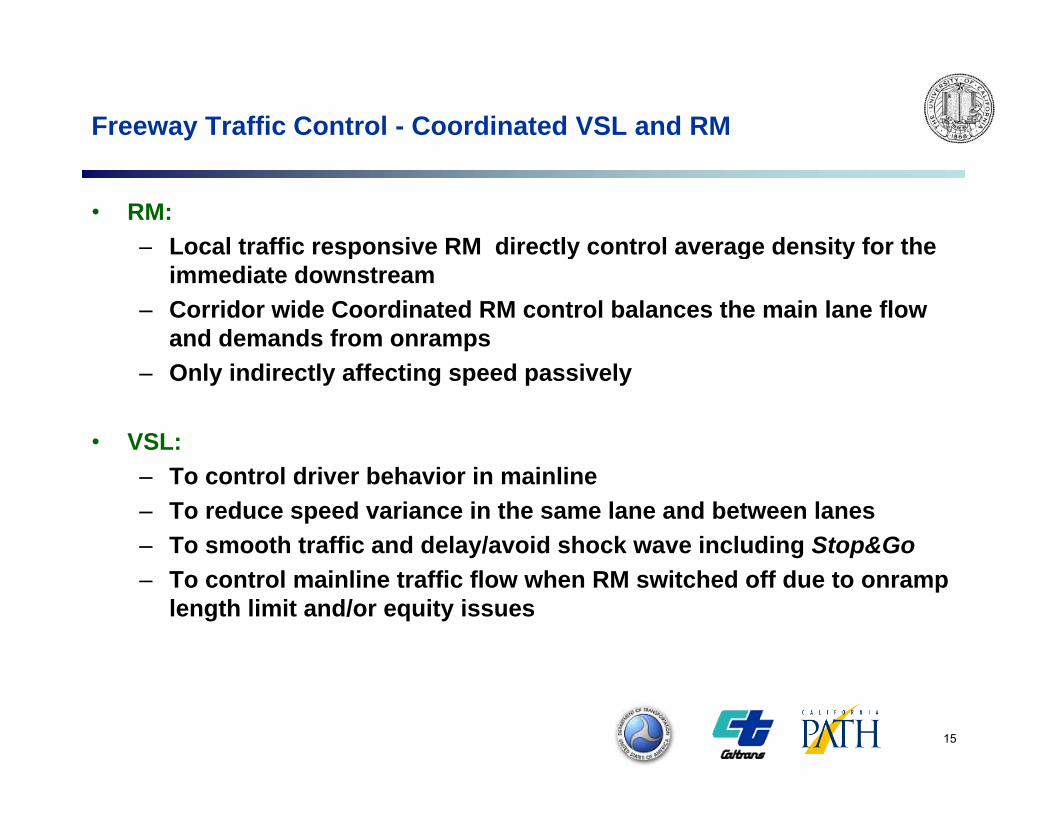
Freeway Traffic Control - Coordinated VSL and RM
• RM: – Local traffic responsive RM directly control average density for theLocal traffic responsive RM directly control average density for the
immediate downstream– Corridor wide Coordinated RM control balances the main lane flow
and demands from onramps– Only indirectly affecting speed passively
• VSL:– To control driver behavior in mainline– To reduce speed variance in the same lane and between lanes– To smooth traffic and delay/avoid shock wave including Stop&Go– To control mainline traffic flow when RM switched off due to onramp
length limit and/or equity issues
15
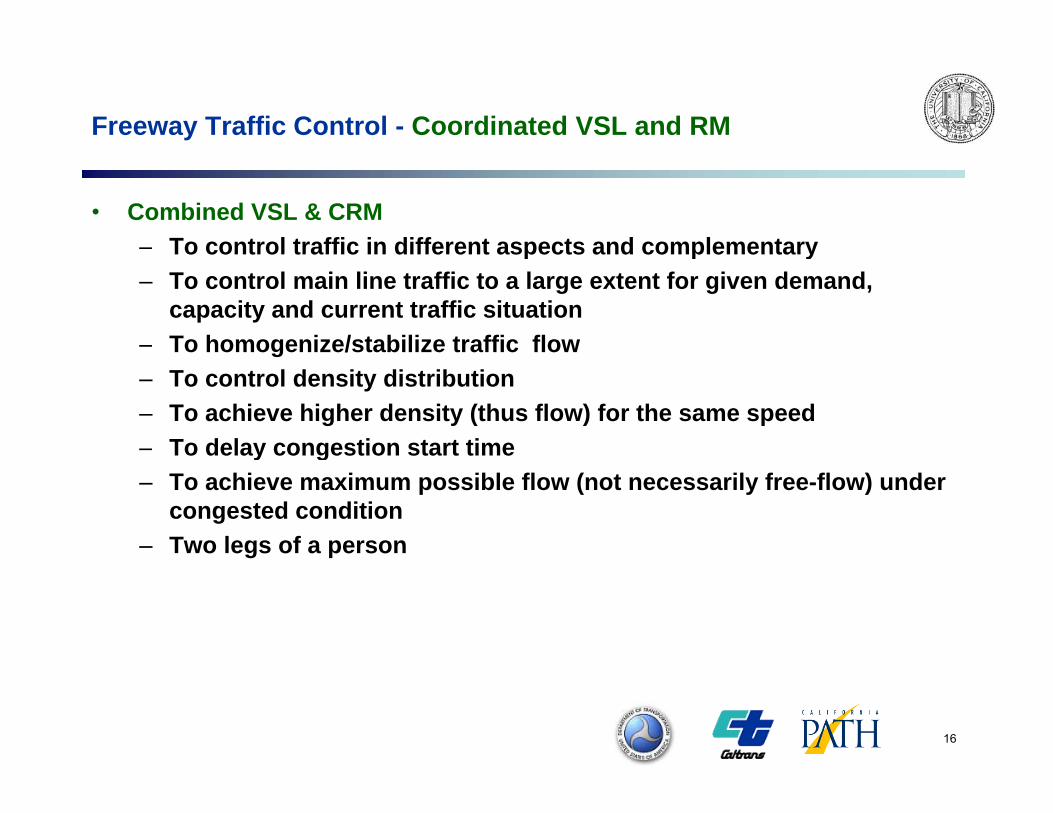
Freeway Traffic Control - Coordinated VSL and RM
• Combined VSL & CRM– To control traffic in different aspects and complementaryTo control traffic in different aspects and complementary– To control main line traffic to a large extent for given demand,
capacity and current traffic situation– To homogenize/stabilize traffic flowg– To control density distribution– To achieve higher density (thus flow) for the same speed– To delay congestion start timey g– To achieve maximum possible flow (not necessarily free-flow) under
congested condition– Two legs of a person
16

Freeway Traffic Control – Other Measures
• Local Active Traffic Management to smooth traffic– Merging manage – assisting onramp mergingMerging manage assisting onramp merging
• Macroscopic • Microscopic – zipper-like approach
– Weaving manageWeaving manage• Planning – removing weaving section• Operation – similar to merging assistance + lane use limit
– Maximizing off-ramp flowMaximizing off ramp flow • Avoid spill-back to block off-ramp in traffic control strategy• Coordinate with local traffic signal
– Lane ManageLane Manage• Lane change limit/advice• Dynamic lane marker – lane use limit• TOD (Time of Day) Lane Use
17
TOD (Time of Day) Lane Use

Bottleneck Detection and Handling
• Needs traffic data immediate upstream as well as within the bottleneck
• Recurrent bottleneck caused by– Demand over capacity–lane drop due to geometry or road work zone
• Diversion/routing if possibleDiversion/routing if possible• Maximizing bottleneck flow by controlling upstream flow• Reduce shockwave caused by bottleneck
– Off-ramp spills back: case-by-case based on traffic & road geometryOff ramp spills back: case by case based on traffic & road geometry• Can be quickly detected if sensor installed properly• Temporary use of hard shoulder if available• Coordinate with arterials/surface-street intersectionCoordinate with arterials/surface street intersection• Diversion – using off-ramp upstream or downstream if available• Active lane manage to confine waiting vehicle on curbside lane if
not hard shoulder
18

Example: Data Needs for Bottleneck Traffic Control, I-80W
Bottleneck Detection and Handling
– Onramp high demand• Can be detected if sensor installed properlyCan be detected if sensor installed properly• Coordination of freeway traffic control & arterial traffic signaling • Discouraging short freeway user by metering short and long
freeway users separatelyy p y• Enforcement is more effective than advice• Dynamic lane manage
– Avoid road design flaws
20
Bottleneck Detection and Handling
• Non-recurrent – detection and assessment are crucial
– Incident/accident: • Automatic detection is indispensible• Need high sensor density• Incorporate driver report and automatic detection
– Driver behavior or slow vehicle: moving bottleneckLane use and lane wise VSL• Lane use and lane-wise VSL
• Post both minimum and maximum speed• Lane use limit by ground sign or VMS
– Off-ramp spill back
21

Bottleneck Detection and Handling
– Onramp high demand
– Weather/visibility
• Challenge:Challenge: – To quickly identify the type of bottleneck, its location– To quantitatively estimate/predict its impact on traffic
• Queue length upstreamQueue length upstream• Potentiality of blocking off-ramp• Time needed to clean up
– To determineTo determine • traffic control strategy• upstream traveler information for feedback
22

Coordination between Freeway and Arterial Traffic Control
• Objectives:– To relieve the conflict between high demand to freeway and trafficTo relieve the conflict between high demand to freeway and traffic
congestion in arterials to optimize the traffic systematically. – To avoid/minimize traffic spills back into arterial/surface street– Balance the efficiency of moving in peak hoursy g p
• The problem: subsystems interact with each other needs coordination– Arterial traffic control
• Tends to maximize the flow into freewayy• Vehicle moving in platoons
– Freeway Traffic Control• To maximize mainline flow, may reduce flow into the freeway if , y y
mainline demand/density • To avoid/reduce onramp queue• To spread out (breaking platoon) vehicle entry into freeway
23

Coordination between Freeway and Arterial Traffic Control
• Possible solution: systematic coordination– Optimize w. r. t. an integrated system performance measureOptimize w. r. t. an integrated system performance measure– Slow down arterial multiple intersection traffic flow if necessary– Diversion to adjacent street if necessary
• Planning:Planning:– Onramp length for adequate storage capacity for peak hours– Smart road geometry design
• Issues for integrationIssues for integration– Equity among multiple onramps subject to length limit– Technical
• Require integrated data system (data format timing )Require integrated data system (data format, timing, …)• Communication systems and protocol• Coordination between control system – priority issues
– Institutional: close cooperation of state DOT county & cityInstitutional: close cooperation of state DOT, county & city
24

Towards Integrated Traffic Data Systems
• Data Requirement for ATM• Current Traffic Data Systems Structure• Current Traffic Data Systems Structure• New Technologies and Information Available• Next Step Data Systems Structure• Data Quality and ATM Performance• Function of VII• Data System Examples• Systematic Sensor Fault Detection and Management• Developing Reliable Communication Systems• How to Maximally Use Current Data System• How to Maximally Use Current Data System • Integrated Traffic Data System for Planning and Operation
25

Data Requirement for ATM
• Low Goal for local traffic responsive or coordinated RM– Distance mean speedDistance mean speed– Average density– Data aggregation level:
• Time: 30~60sTime: 30 60s• Space: 150~200m
• High Goal: Accurate and reliable traffic state parameter estimation over time and spacep– Spatial-temporal (distance mean) speed estimation– Spatial-temporal density distribution – Traffic prediction over certain period of timep p– Data aggregation level:
• Time: 10 ~ 20s• Space ~ 150mp
26

Data Requirement for ATM
• OD for a given set of modes:– Only possible ifOnly possible if
• VII is available for individual vehicle• Traffic assignment conducted network wide• Dynamic rerouting in case of incident/accidentDynamic rerouting in case of incident/accident
• VSL and RM have to be coordinated instead of local– Real-time capacity estimationReal time capacity estimation
• Recurrent bottleneck: influence zone• Non-recurrent bottleneck: influence zone
– Integration with arterial and surface street traffic controlIntegration with arterial and surface street traffic control – Dynamic reconfiguration through wireless or cable
27

Data Requirement for ATM
• Coordinated RM Needs: – Minimum RequirementMinimum Requirement
• Onramp queue length measure• Off-ramp flow
– Medium Goal: in additionMedium Goal: in addition• Density distribution• Synchronized data along a corridor
– High Goal: in addition for merging assistanceHigh Goal: in addition for merging assistance • Individual vehicle movement
• VSL Needs:– Spatial-temporal speed estimationSpatial temporal speed estimation– Spatial-temporal density estimation
28

Example: Traffic Drop probability and flow Contour
70
0 0. 0 0.1
I80W @ Station: 1; 25(vpm) < Density
50
60
0.02 0.040.06
08
0.10.12.1416
0.180 18
0.20.2
0.22
40
50
0.020.04
0.060.08
0.10.12
0.14
0.14
0.16
0.16
0.18
peed
(mph
)
30
0.020.04
0 04
0.060.06
0.080.08
0.10.12S
p
20 30 40 50 60 70 80 90 10010
202
0.020.04
29
Density (vpm)

Example: Traffic Drop probability and flow Contour
70 0.0 0
0.
I80W @ Station: 6; 25(vpm) < Density
60 0.0204
0.060.08
0.120.14
16 0.18
0.18
0.2
40
50
00.04
0.06
0.08
0.12
0.12 0.12
0.140.14
0.16 0.16
eed
(mph
)
30
0.02
0 02
0.040.04
0.06 0.06
0.08 0.08
0.1 0.1Spe
20 30 40 50 60 70 80 90 10010
200.02
0.020 04
30
20 30 40 50 60 70 80 90 100Density (vpm)

Current Traffic Data Systems Structure
31

New Technologies and Information Available
• Computer technologies-miniature and used in almost all corners• Road sensors: smart cards for inductive loops, magnetometer, lidar,Road sensors: smart cards for inductive loops, magnetometer, lidar,
microwave radar, digital video camera, infrared radar, acoustic sensor, piezoelectric (WIM), light beam, …
• Vehicle Information: J-Bus, onboard and remote Sensors, GPS, …• Communication System
– Wireless (GPRS, Cell-phone, DSRC – VII radio, WiFi, Bluetooth, )– Fiber-optics cable– Telephone line - DSL
• Information System– Internet, GIS, iPhone– Video, Radio– VMS, Traffic signs: Real-time feedback to the driver– Individual vehicle feedback
32

Immediate Next Step Data Systems Structure
33
Function of VII in Active Traffic Management
• VII Vehicle include: probe vehicles; vehicle equipped with VII DSRC; vehicle equipped with combined cell-phone and GPSq pp p
• VII Vehicle Info:– Continuous measure over time– High market penetration of VII provides data continuous in both time
and space– Single VII vehicle providing narrow moving distance-window
measure– Certain percent of market penetration VII vehicles provide traffic
measurement continuous over time and distance
• Road sensor only provide point/short range measure: heavily depends on sensor type, location, density, measurement accuracy, reliability, …
34

Function of VII in Active Traffic Management
• Application: – Traffic state estimation/prediction;Traffic state estimation/prediction;
• OD estimation• Spatial and temporal speed and density estimation• Retrieving microscopic traffic dataRetrieving microscopic traffic data• Refined RM, merging assistance,…
– Congestion onset detection and management;– Active safetyActive safety
• Collision warning and avoidance• Intelligent intersection
• Future Trend:Future Trend: – VII data directly routed to control cabinet– Gradual merging/fusing point sensor data with VII data
35
Function of VII in Active Traffic Management
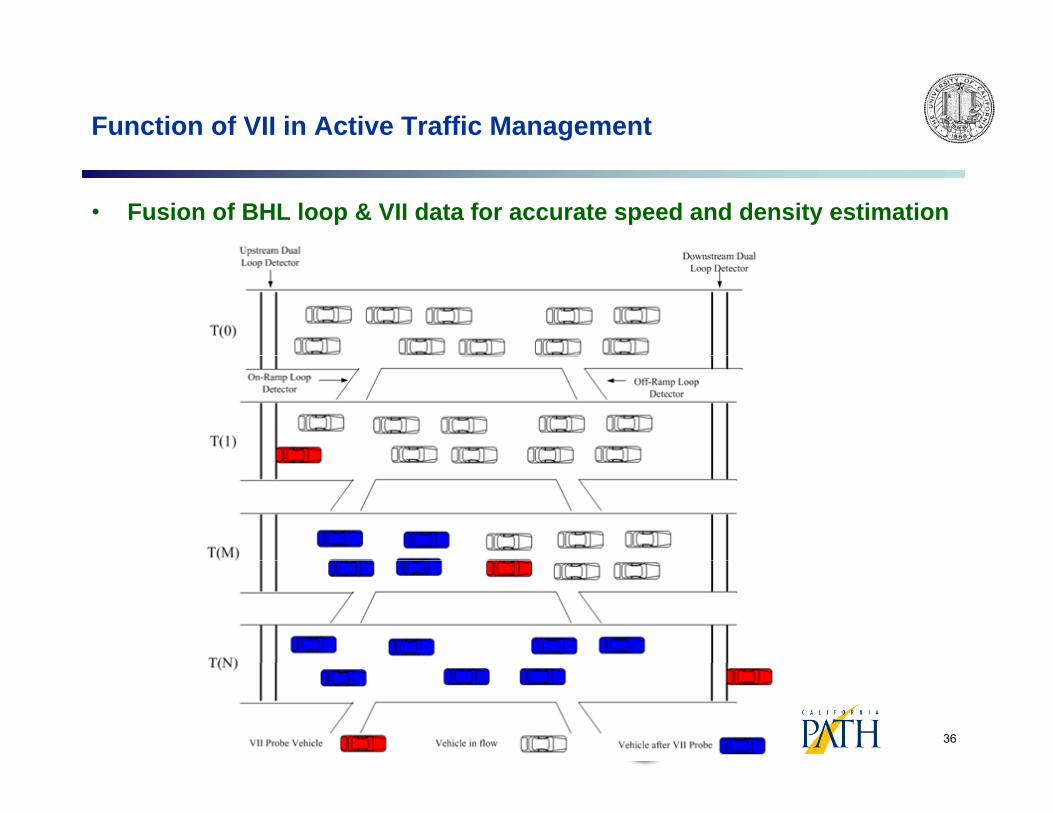
• Fusion of BHL loop & VII data for accurate speed and density estimation
36

Data System Examples: 1. PeMS
• Data Source and Application:• 30 second raw data30 second raw data• Lane by lane 5 minutes aggregated data: flow, occ., speed• Hourly and Longer Time LOS (A, B, C, D, E, F)• Speed/Occupancy plotSpeed/Occupancy plot• Bottleneck Information• Vehicle Hours of delay• CA Yearly VHT/VMTCA Yearly VHT/VMT• Lost productivity (Lane-Mile-Hours)• Dynamic Maps/ Google maps• AADT/Peak HoursAADT/Peak Hours• CHP Incidents Data

Data System Examples: 2. Netherlands NDW
• NDW – National Data Workhouse– the databank to collect, process, store and distribute all relevantthe databank to collect, process, store and distribute all relevant
traffic data of all motorway, major provincial and city roads– A network organization of municipalities, regions, provinces and the
state• Objectives:
– Active Traffic Management for mobility and safety– Reduce congestion at 2020 to the level of 1992
• Data types– Real-time data – traffic flow, travel time, speed, traffic jam– Status data:
• Actual and planned road work• Actual and planned availability of infrastructure
– Historical data
38

Data System Examples: 2. Netherlands
39

Data System Examples: 3. Berkeley Highway Lab (BHL)
40

Data System Examples: 3. Berkeley Highway Lab (BHL)
• 8 dual loop stations in two directions
• Station distance: 500~2100 [ft]
• Update rate 1s with 60Hz information for loop ON/OFF time
instant
• Traffic state parameter estimation at each station
• Detector health information
41
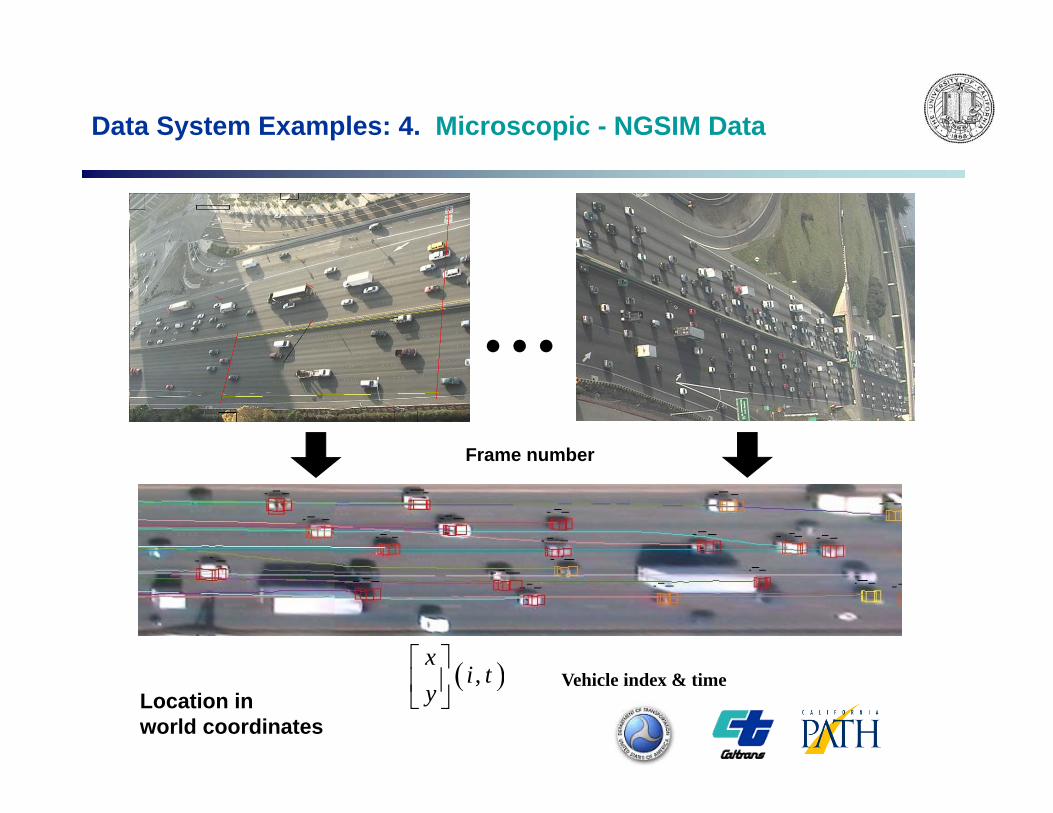
Data System Examples: 4. Microscopic - NGSIM Data
...Frame numberFrame number
( )x⎡ ⎤ ( ),x
i ty
⎡ ⎤⎢ ⎥⎣ ⎦Location in
world coordinates
Vehicle index & time

Data System Examples: 4. Microscopic - NGSIM Data
• For microscopic traffic analysis
• For driver behavior analysis and modeling
• For calibration of microscopic traffic simulation model
• For refined ATM strategy design and qualitative evaluation
43

Data Quality and ATM Performance
• Data quality determines traffic control performance• Most RM methods very simple; mostly determined by data qualityMost RM methods very simple; mostly determined by data quality• Quantitatively sensitivity analysis of the control system
• Data quality Measurement noise and error (discrepancy)Measurement noise and error (discrepancy) Reliability Time Delay
• That from sensorThat from sensor• That from communication for data passing• That from data processing (such as aggregation)
• Improving data quality in different levelImproving data quality in different level• Microscopic (sensor reading) - essential• Mesoscopic – a section of freeway & arterial• Macroscopic – corridor level (PeMS/TMC)Macroscopic corridor level (PeMS/TMC)
44

Systematic Sensor Fault Detection and Management
• Faults mainly come from:– Sensor system faulty
• Component broken• Improper installation• Reliability with environmental including traffic conditions• Physical limit• Sensitivity selection• Mode selection (pulse or presence)
Communication system fault– Communication system fault• Sensor fault detection and data correction:
– In different levels: macroscopic, mesoscopic and microscopic levels– Using historical dataUsing historical data– Using threshold bound check– Using other faulty data analysis techniques– Using model based or statistical time series based predictiong p
45
Developing Reliable Communication Systems
• Current Communication Systems: – Infrastructure:Infrastructure:
• Fiber optics, Cell phone line, Old telephone line, GPRS Modem, CDPD Modem, WiFi, Bluetooth, others
– Communication protocol: p• TCP (acknowledgment of receiving; may resending )• UDP (no acknowledgment nor resending)
• Recommendation: – Using fiber optics, GPRS modem, telephone line with DSL– Protocol: Using TCP with resending and Automatic fault detection g g
capability
46

Developing Reliable Communication Systems
– Professionals regularly checking/reporting sensor and comm.. faults– Regular and in-time system maintenanceRegular and in time system maintenance– Communication system reconfiguration capability– Short/medium range communication:
• Sensors, Control Cabinet Corridor Hub Computer &Sensors, Control Cabinet Corridor Hub Computer & Database
– Long Range• Corridor TMC or PeMS
47
How to Maximally Use Current Data System
• Progressive improving in sensor density, data processing
• Maximally using current infrastructure with software modification
• Progressively incorporating VII with the increase of market penetrationProgressively incorporating VII with the increase of market penetration of VII vehicles: real-time routing to control cabinet
• Systematic plan for new sensor installation to complementary to y p p yprevious sensors in location/density/function: single loop dual loop
• Cost effective; affordability; data security in a long run
• Towards integrated planning and operation data system
48

Integrated Traffic Data System for Planning and Operation
49

Integrated Traffic Data System for Planning and Operation
• Systems approach for supporting ATM– Integrated and system wide performance measurementIntegrated and system wide performance measurement– Integrated freeway and arterial data system– Synchronized data in time and unified coordinate in space– Private and public data, from road-side and on-vehicle sensorsPrivate and public data, from road side and on vehicle sensors– Optimal combination of sensor types and locations
• Minimizing data storage and maximizing data utility– Local data fusion and traffic parameter estimation for operationLocal data fusion and traffic parameter estimation for operation– ATM; ATIS; corridor level and system wide strategic planning– Processed and classified database at PeMS or TMC level
• Improving data qualityImproving data quality– Systematic sensor fault detection, remedy and maintenance– Developing reliable communication systems for data passing – Adopting software for data correction and filtering in applicationAdopting software for data correction and filtering in application
50
