integrated design of steel castings: case...
TRANSCRIPT
1
Presented at the 63rd Technical and Operating Conference of the Steel Founders’ Society of America, December 9-12, 2009, Chicago, Illinois.
Integrated Design of Steel Castings: Case Studies
Richard A. Hardin and Christoph Beckermann
Department of Mechanical and Industrial Engineering The University of Iowa, Iowa City, IA 52242
Abstract A methodology for steel casting design for performance has been developed where local stress concentrations due to anomalies in the metal, multi-axial fatigue calculations based on the local stresses, and the fatigue properties of the steel are employed. In this paper the methodology is applied to two castings as “what-if” case study demonstrations that address the question, “will discontinuities from the casting process be of concern in this design?”. If discontinuities are of concern, either the casting design or the casting process must be modified. The casting design is provided by an industry partner through solid CAD models, design loads, boundary conditions and material property data. Casting process models of the rigging, and casting conditions, are also provided by the industry partner. In each case study, the casting process is modeled using MAGMAsoft to determine porosity discontinuities, and the porosity is mapped to the nodes of a finite element stress model of the casting using MAGMAlink. Finite element stress analyses (FEA) are performed without and with the use of porosity dependent elastic properties varying locally at the FEA nodes. Results of the stress analyses are imported into a commercial multi-axial fatigue life model (fe-safe) to predict the fatigue life of the part without and with porosity dependent strain-life properties. By comparing the part performance with and without porosity, an engineering decision can be made to remedy the porosity or not. In one case study, the porosity is found to not lower the predicted fatigue life below the runout condition of 5 million cycles. While in the other case study, porosity is predicted at three locations. Cut sections at those locations verified the porosity prediction. At one of the three locations, the stress is low and the porosity has no adverse effect. While at the other two locations the porosity is of concern, lowering the predicted life of the component below the runout condition. I. INTRODUCTION Discontinuities (porosity, inclusions and hot tears) arising from the casting process and their effects on performance are not considered in casting design. Typically, in a design for fatigue approach, modifying factors are employed; multiplying the endurance limit of the steel by factors based on the surface condition, part size, load type, temperature and other miscellaneous factors. The approach used in this paper replaces this de-rating of the material with predicting local stress concentrations due to porosity, multi-axial fatigue calculations based on the local stresses, and the fatigue properties of the steel varying locally. With this approach, the prediction of the part performance is more reliable, focused and realistic, and capable of identifying critical locations in the part to apply NDT. This methodology is possible due to new methods for predicting discontinuities (porosity, inclusions and hot tears) and their effects on the static performance and fatigue life of cast steel components.
2
By using computational tools to predict discontinuities and their effects on performance, engineers will have more confidence in their casting designs, and can request non-destructive testing that is relevant to part performance. For the past several years, the Defense Logistics Agency has sponsored research to develop computer models that predict the formation of discontinuities in castings from processing and their effects on casting performance. Combination of casting process modeling, stress and fatigue analysis results in a comprehensive and integrated approach to the design, production and non-destructive testing of castings, and will assist in providing reliable and high performance components for new and legacy weapon systems. This paper presents the results of two case studies applying these computational tools to steel castings. The case study parts were analyzed in partnership with Oshkosh Corporation and JLG Industries Inc. Both parts are steering spindle castings. These are “what-if” case studies applying our method to predict fatigue life in the presence of porosity answering the question “will porosity affect the fatigue life of the part?”. If the answer is yes, then the casting process and/or the part must be redesigned. If the engineer has access to all the software tools and the knowledge to use them, this can be accomplished without time consuming iterations between engineers modeling the casting process and the component performance. As observed by one engineer we worked with in these case studies, "Lengthy and costly test programs are often required to validate castings before being put into production. Being able to predict the fatigue life of castings can help with optimization of the casting geometry before samples are poured, allowing a shorter duration of the test program, and reducing the overall time to market."
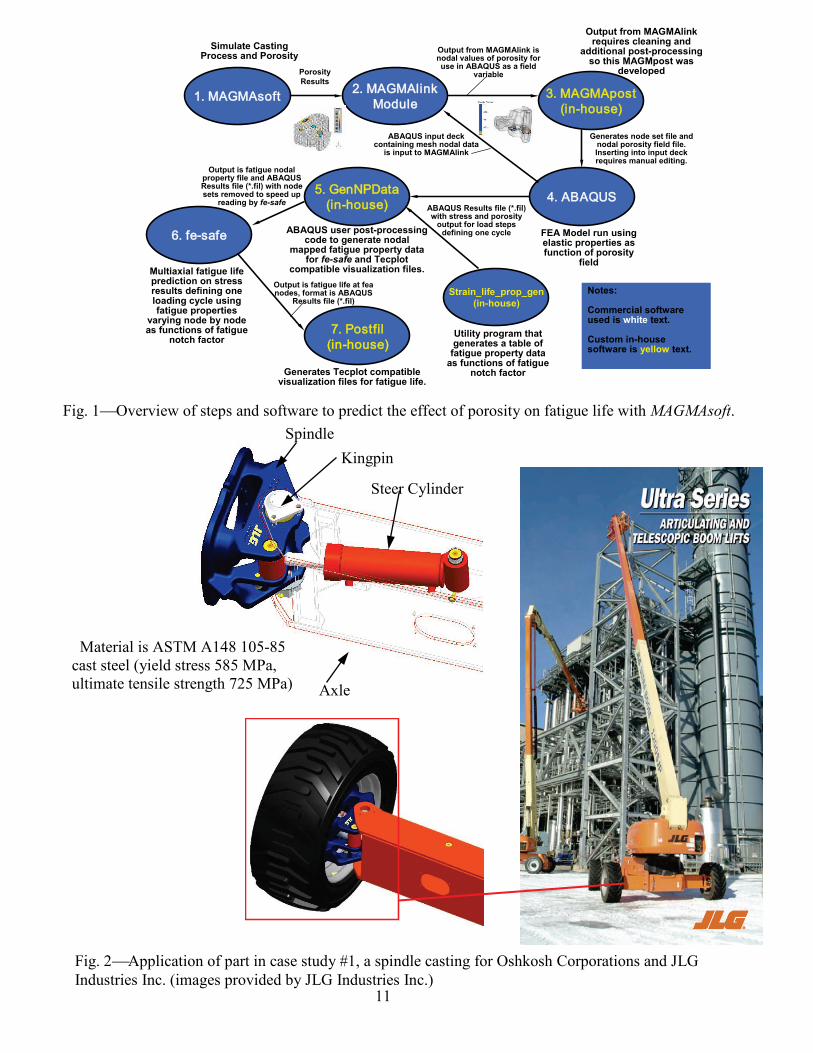
II. PROCEDURES The procedure for the analysis is given in detail in references [1-3], but a brief description will be given here. In Figure 1, a graphical overview is presented of the analysis procedures and software used. The porosity in the casting is simulated using MAGMAsoft; its advanced feeding module is used since it can predict microporosity, which can affect fatigue life but is difficult to detect. The porosity is incorporated into finite element analysis (FEA) by mapping it through interpolation onto the nodal points of the finite element mesh. This is done using the MAGMAlink module within MAGMAsoft. MAGMAlink allows the user to import and export results to and from other software into and out of MAGMAsoft. MAGMAlink allows interfacing with a number of other FEA software packages (ANSYS, PATRAN, PERMAS, PAMCRASH, and RADIOSS) and computed tomography data. It allows the user to translate and rotate the FEA mesh to properly overlay the MAGMAsoft model in case they do not happen to match up. The FEA mesh is generated before the stress simulation (in this case using ABAQUS CAE [4]). The data from MAGMAlink requires additional postprocessing and here this is performed automatically with an in-house software package (MAGMApost). The resulting data of node sets and nodal porosity data is cut and pasted into the ABAQUS input file, which contains all the commands, boundary conditions and properties needed to run the stress simulation. The ABAQUS results file containing the stresses for each step in the defined loading cycle (defining one cycle in the fatigue analysis) and porosity field data is post-processed to prepare for the fatigue analysis. Our “in-house” software that performs this step (step 5 in Figure 1) is called GenNPData; it converts the porosity values at the nodes to fatigue notch factors, and then generates the nodal strain-life fatigue property data corresponding to the notch factors. The
3
( ) ( )cffb
fmfn NεN
Eσσε 275.12
)(65.1
2Δ
2Δ max ′+
−′=+
γ
( )SS)( ννφφνφν −+= ∞∞
5.2
5.01)(
−=
φφ soundEE
fatigue property data are mapped node by node to a file that is used in a multi-axial strain-life analysis. This is performed using the durability simulation software fe-safe [5] to determine the fatigue life in number of cycles for the defined load cycle. The results from fe-safe can be visualized a number of ways, but here the Tecplot [6] software is used. A brief description will be given here on the properties and models used in the analysis, but a complete description of the model and its validation is given in references [1-3]. Since all load steps in these cases studies gave stresses well below yield, even with porosity taken into account, the stress analyses presented here are elastic. The FEA is performed using locally degraded elastic modulus, E, and Poisson ratio, ν, as functions of the predicted porosity volume fraction φ at the nodes. The relation for E as a function of porosity φ is given by
(1) where Esound is the elastic modulus of the sound steel (without porosity). Here, Esound = 207 GPa. The relation for the Poisson ratioν as function of porosity is given by
(2) with = 0.14, = 0.472 , and = 0.3. The fatigue modeling is incorporated within the constraints of the commercial software fe-safe, and uses an adaptive subgrid technique to improve the model’s ability to predict the detrimental effects of porosity that a coarse computational grid cannot resolve. The steps required to compute the fatigue notch factor and fatigue properties can be summarized as
• a pore size model defines maximum pore radius as function of porosity fraction, φ.
• a local sub-grid model, using spherical stress concentration factors Kt, is used to correct the FEA stresses to account for un- or under-resolved local stresses at pores.
• a local fatigue notch factor Kf is calculated as a function of Kt, maximum pore radius and
material notch sensitivity (Neuber/Peterson).
• strain-life fatigue properties (σf′ , b, εf′ and c) that are locally degraded according to Kf values are mapped to the nodes for use in fe-safe.
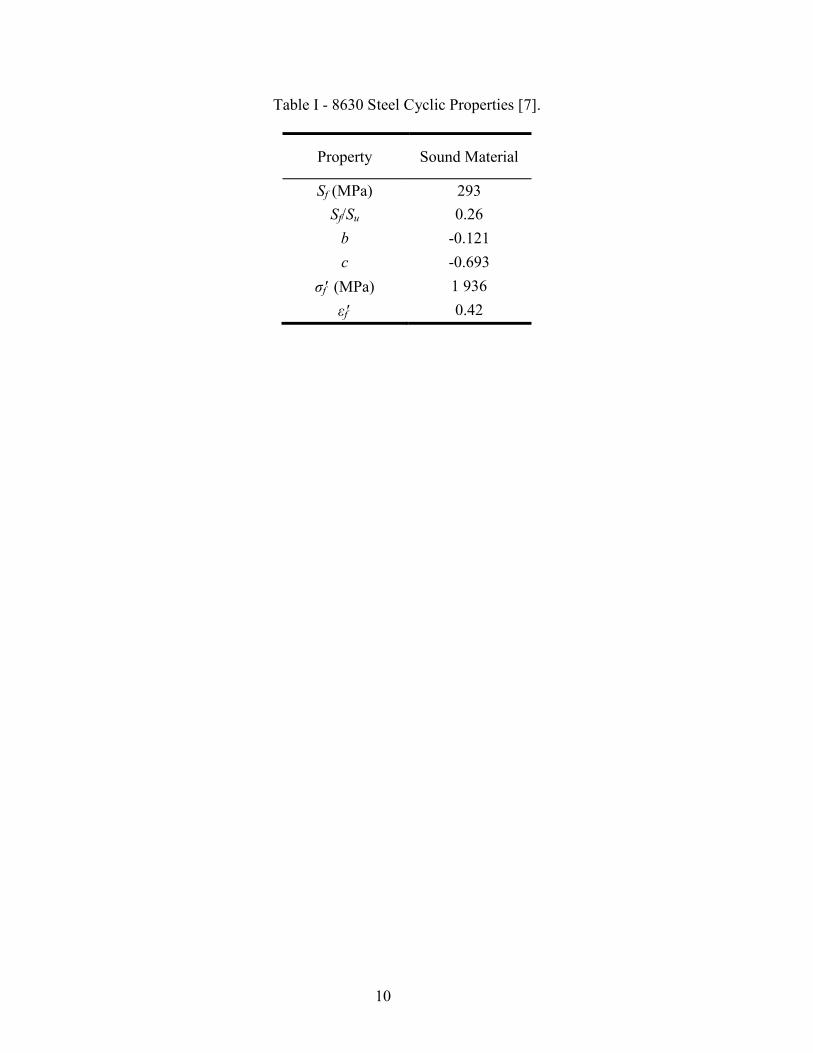
From the FEA stresses and strain-life fatigue properties, the Brown-Miller multi-axial algorithm with Morrow mean stress correction and a critical plane analysis is used in fe-safe to predict crack initiation fatigue life. This algorithm is recommended for ductile steels. Strain-life fatigue properties (σf′ , b, εf′ and c given in Table I from [7]) are degraded only if Kf ≠ 1. The life 2Nf is determined by solving (3)
∞φ∞ν Sν
4
at each FEA node for its critical plane, where ∆γmax/2 is the maximum shear strain amplitude and ∆εn/2 is the strain normal to the shear stress plane, σf′ is the fatigue strength coefficient, b is the fatigue strength exponent, εf′ is the fatigue ductility coefficient, and c is the fatigue ductility exponent. The critical plane for a given node is defined as the plane having the maximum value of 2/Δ2/Δ max nε+γ . The values for σf′, b, εf′, and c for sound 8630 steel are given Table I and were determined by curve fitting test data [7]. The endurance limit Sf is also given in Table I. Fatigue and durability prediction software uses uni-axial data in multi-axial fatigue algorithms. As mentioned, when porosity is present at a node, the fatigue properties are locally degraded according to Kf values mapped to the nodes in fe-safe, and details on this procedure can be found in references [2,8]. The steel specified for these case studies was ASTM A148 105-85 cast steel (yield stress 585 MPa, ultimate tensile strength 725 MPa), and the 8630 data serves for the purposes of the present case studies for this steel. As mentioned earlier, in the textbook design for fatigue approach, modifying factors are applied by multiplying the endurance limit by factors based on the surface condition, size, load type, temperature and other miscellaneous factors. These are the Marin factors, as described in reference [9]. In other design approaches, factors of safety (fos) are determined by comparing the maximum stress under static load to the yield stress and determining the factor of safety. Based on this fos approach, the design is accepted or rejected by comparing it to an acceptable fos corresponding to the degree to which the conditions of the part in service are known. These conditions can be broken down into uncertainty due to loading, stress, environment and material. The less well known the conditions, the higher the fos used. Castings are usually de-rated more than parts produced as weldments or forgings due to material uncertainties. The approach used in this paper replaces the de-rating of the fatigue properties by factors, and overly conservative or, more dangerously, non-conservative fos, with a process employing predicted stress concentrations due to the local porosity, multi-axial fatigue calculations based on the local stresses, and the fatigue properties of the steel. Here part designs will be rejected if at any point in the casting a crack initiation fatigue life is predicted below 5 million cycles. In both case studies, the loads and boundary conditions on the steering spindles were provided by the design engineers. Solid CAD models were also provided. Both case study stress analyses had loading cycles made up of a steering extension load step and a steering retraction load step; the order of the steps is irrelevant to the fatigue life given the damage model used in fe-safe. CAD models of the casting rigging were provided by the foundries producing the part, through our industry partner Oshkosh Corp. Casting and stress simulations were performed, and the stress simulations compared with original FEA stress results from the designers to confirm proper implementation of boundary conditions and loads. The next section provides the details of the simulation conditions and results of each case study. III. SIMULATION CONDITIONS AND RESULTS
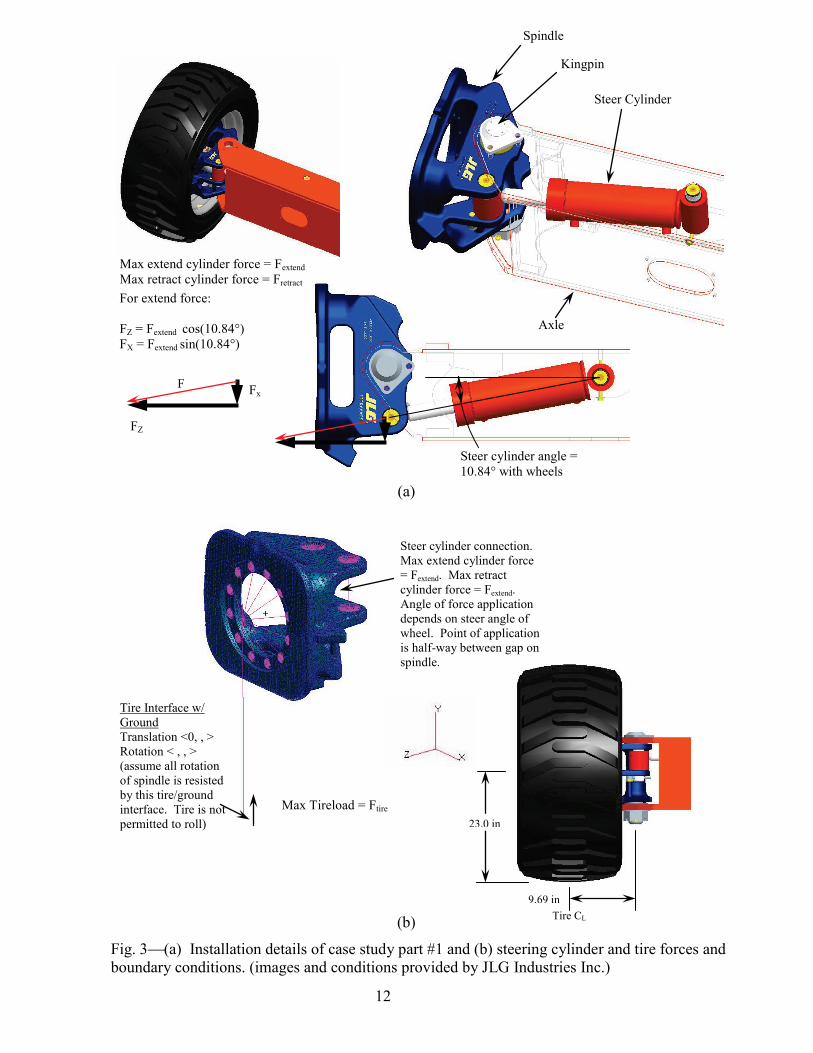
Case Study #1: Ultraboom Spindle The first case study presented is the steering spindle of a telescopic boom lift as shown in Figure 2. It is designed with large safety factors. Because of its application, a steel casting is ideal. The details of the installation of the spindle casting and the forces applied to it by the steering
5
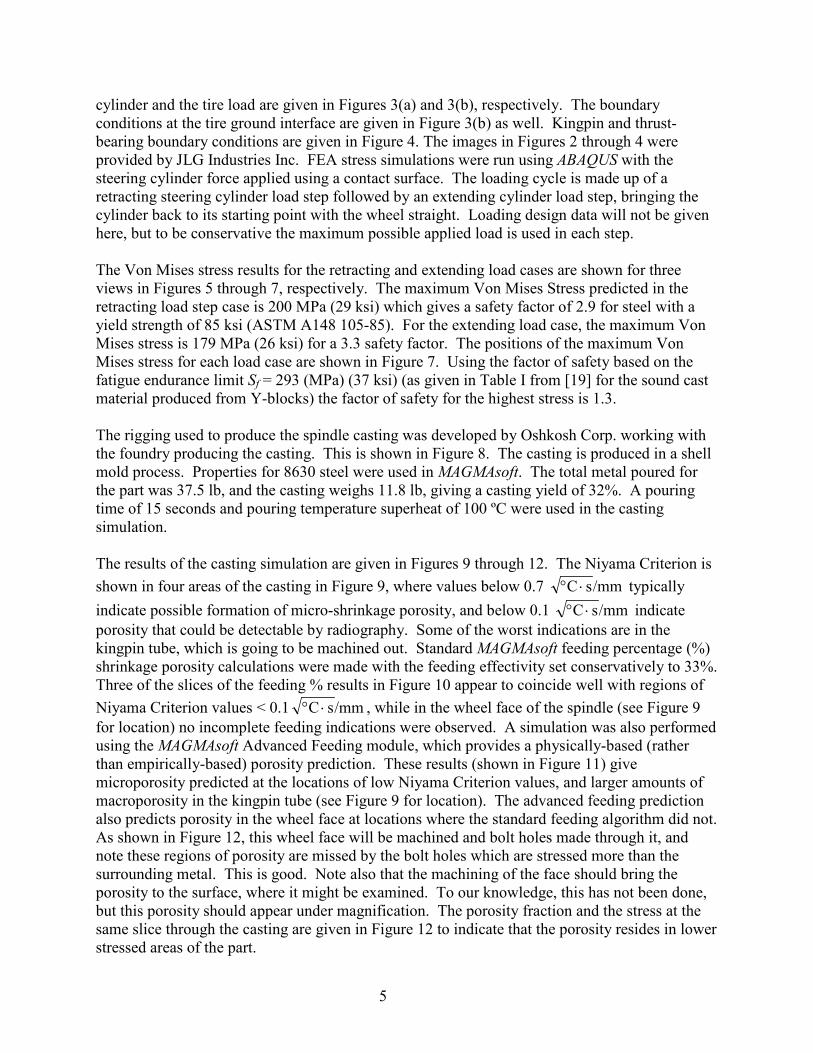
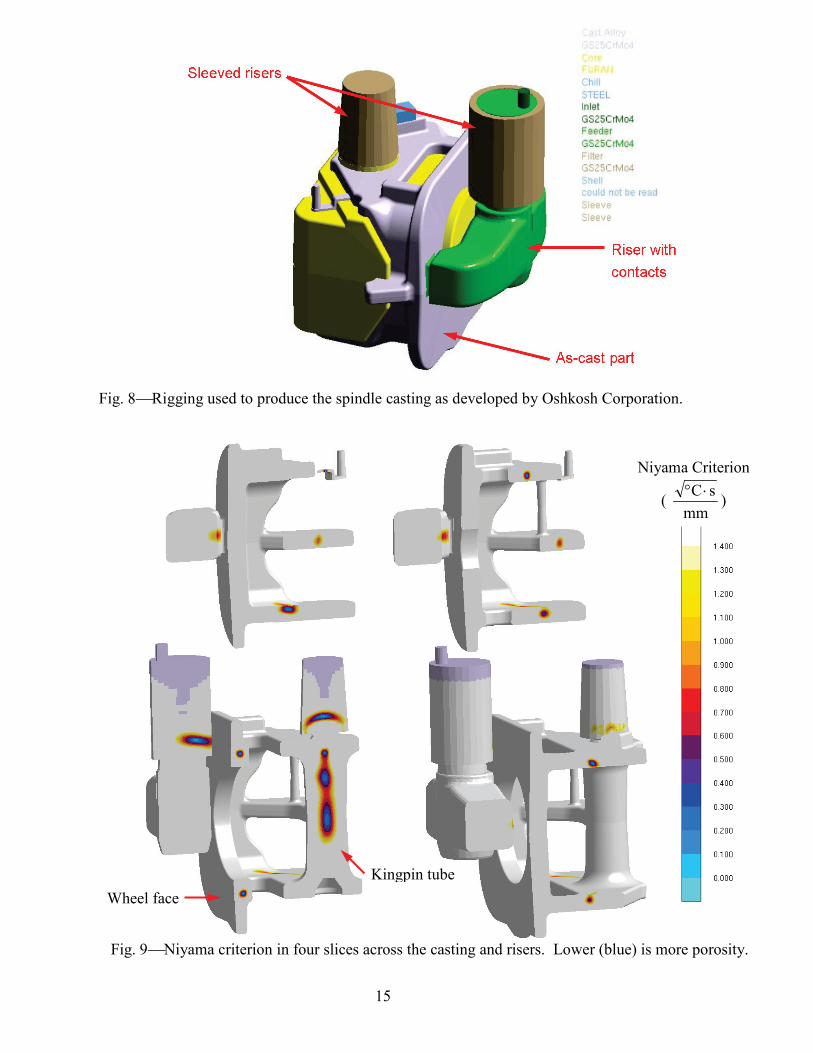
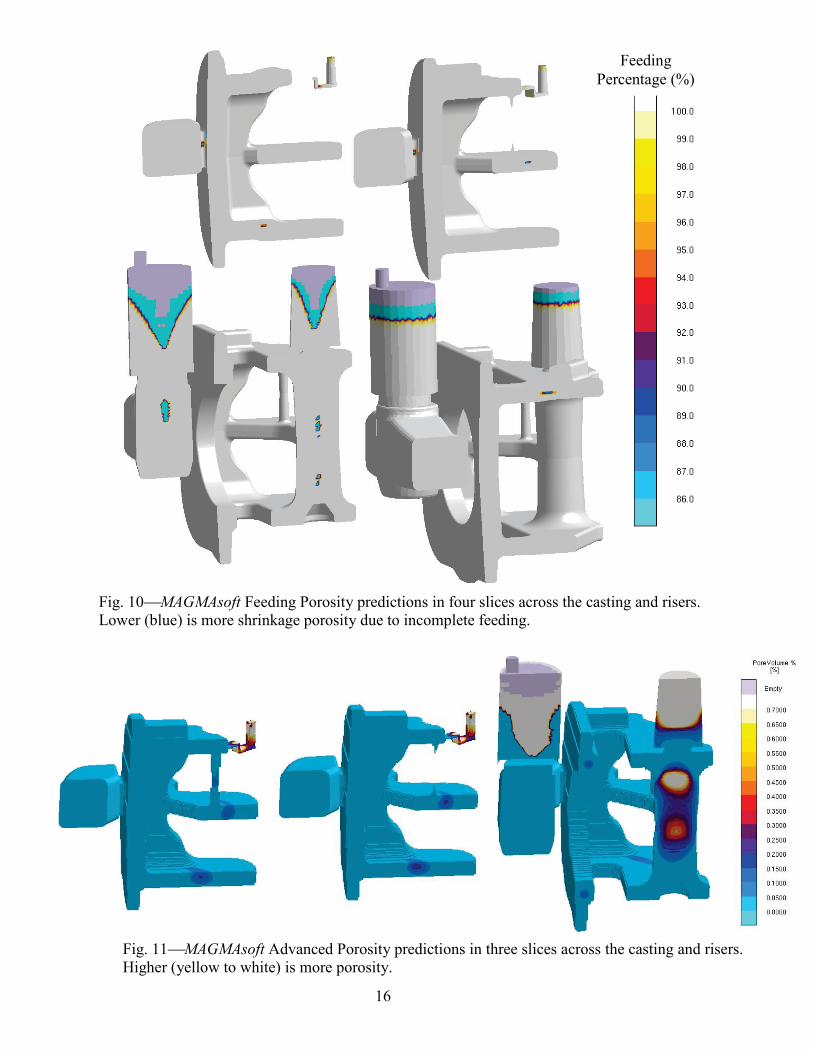
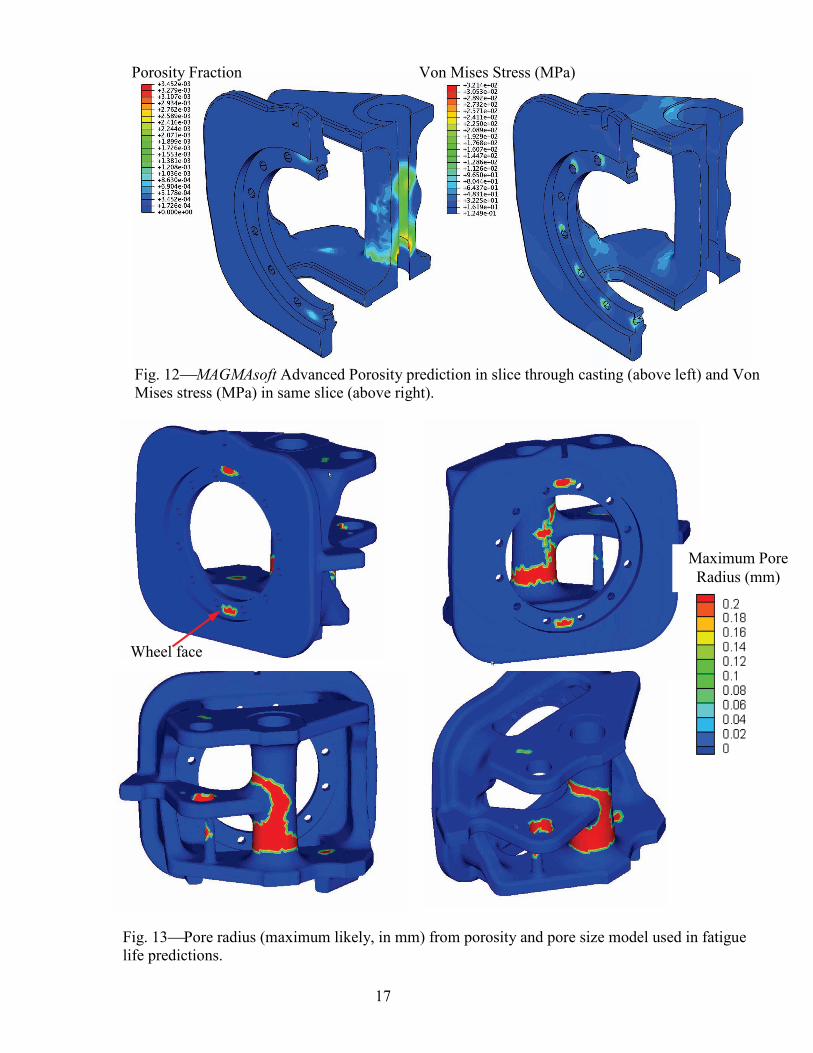
cylinder and the tire load are given in Figures 3(a) and 3(b), respectively. The boundary conditions at the tire ground interface are given in Figure 3(b) as well. Kingpin and thrust-bearing boundary conditions are given in Figure 4. The images in Figures 2 through 4 were provided by JLG Industries Inc. FEA stress simulations were run using ABAQUS with the steering cylinder force applied using a contact surface. The loading cycle is made up of a retracting steering cylinder load step followed by an extending cylinder load step, bringing the cylinder back to its starting point with the wheel straight. Loading design data will not be given here, but to be conservative the maximum possible applied load is used in each step. The Von Mises stress results for the retracting and extending load cases are shown for three views in Figures 5 through 7, respectively. The maximum Von Mises Stress predicted in the retracting load step case is 200 MPa (29 ksi) which gives a safety factor of 2.9 for steel with a yield strength of 85 ksi (ASTM A148 105-85). For the extending load case, the maximum Von Mises stress is 179 MPa (26 ksi) for a 3.3 safety factor. The positions of the maximum Von Mises stress for each load case are shown in Figure 7. Using the factor of safety based on the fatigue endurance limit Sf = 293 (MPa) (37 ksi) (as given in Table I from [19] for the sound cast material produced from Y-blocks) the factor of safety for the highest stress is 1.3. The rigging used to produce the spindle casting was developed by Oshkosh Corp. working with the foundry producing the casting. This is shown in Figure 8. The casting is produced in a shell mold process. Properties for 8630 steel were used in MAGMAsoft. The total metal poured for the part was 37.5 lb, and the casting weighs 11.8 lb, giving a casting yield of 32%. A pouring time of 15 seconds and pouring temperature superheat of 100 ºC were used in the casting simulation. The results of the casting simulation are given in Figures 9 through 12. The Niyama Criterion is shown in four areas of the casting in Figure 9, where values below 0.7 /mmsC ⋅° typically indicate possible formation of micro-shrinkage porosity, and below 0.1 /mmsC ⋅° indicate porosity that could be detectable by radiography. Some of the worst indications are in the kingpin tube, which is going to be machined out. Standard MAGMAsoft feeding percentage (%) shrinkage porosity calculations were made with the feeding effectivity set conservatively to 33%. Three of the slices of the feeding % results in Figure 10 appear to coincide well with regions of Niyama Criterion values < 0.1 /mmsC ⋅° , while in the wheel face of the spindle (see Figure 9 for location) no incomplete feeding indications were observed. A simulation was also performed using the MAGMAsoft Advanced Feeding module, which provides a physically-based (rather than empirically-based) porosity prediction. These results (shown in Figure 11) give microporosity predicted at the locations of low Niyama Criterion values, and larger amounts of macroporosity in the kingpin tube (see Figure 9 for location). The advanced feeding prediction also predicts porosity in the wheel face at locations where the standard feeding algorithm did not. As shown in Figure 12, this wheel face will be machined and bolt holes made through it, and note these regions of porosity are missed by the bolt holes which are stressed more than the surrounding metal. This is good. Note also that the machining of the face should bring the porosity to the surface, where it might be examined. To our knowledge, this has not been done, but this porosity should appear under magnification. The porosity fraction and the stress at the same slice through the casting are given in Figure 12 to indicate that the porosity resides in lower stressed areas of the part.
6
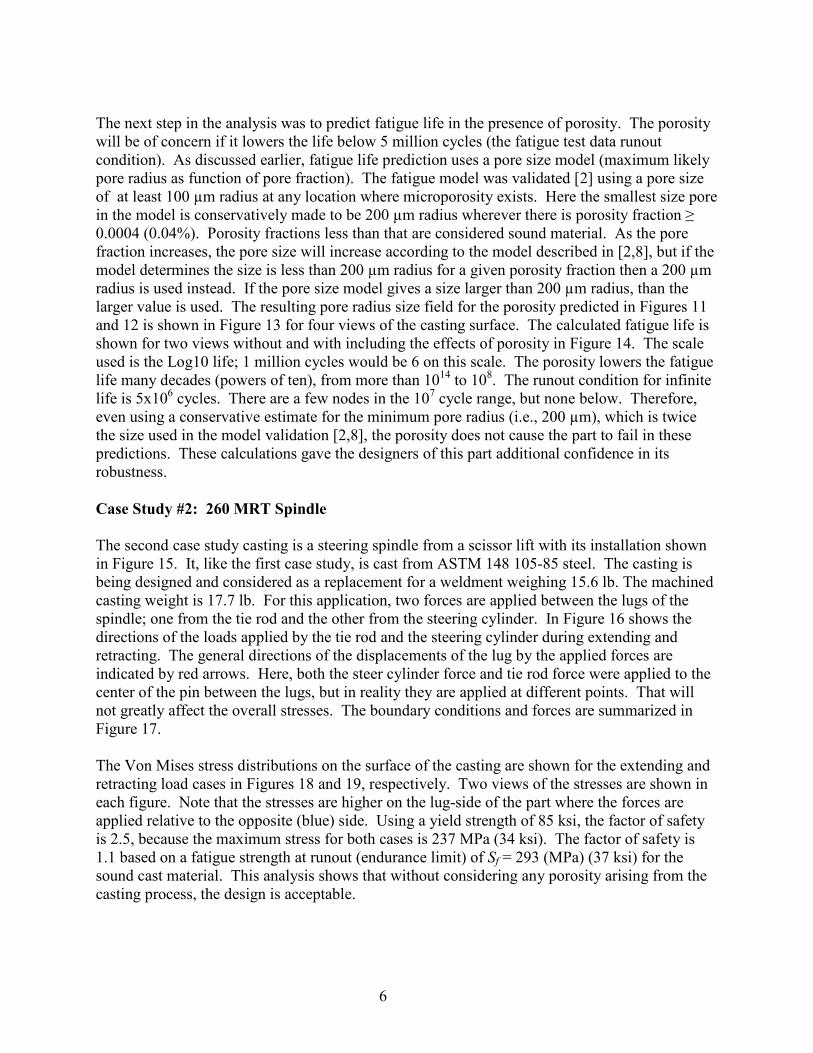
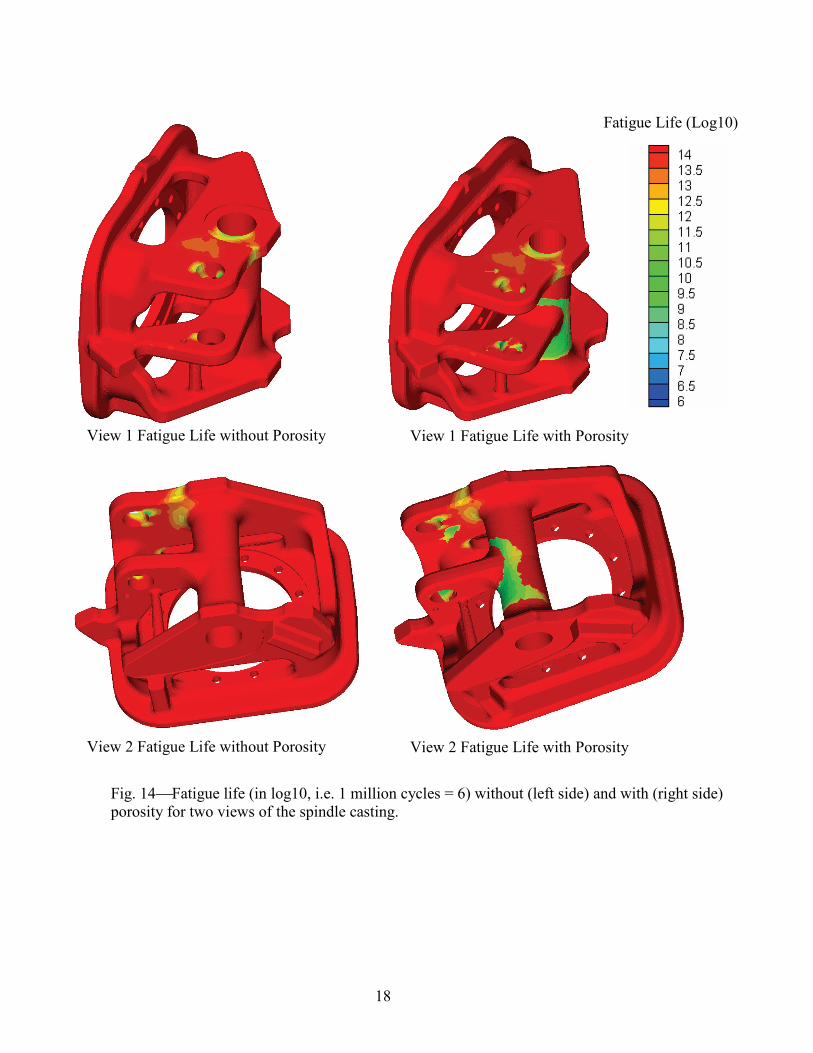
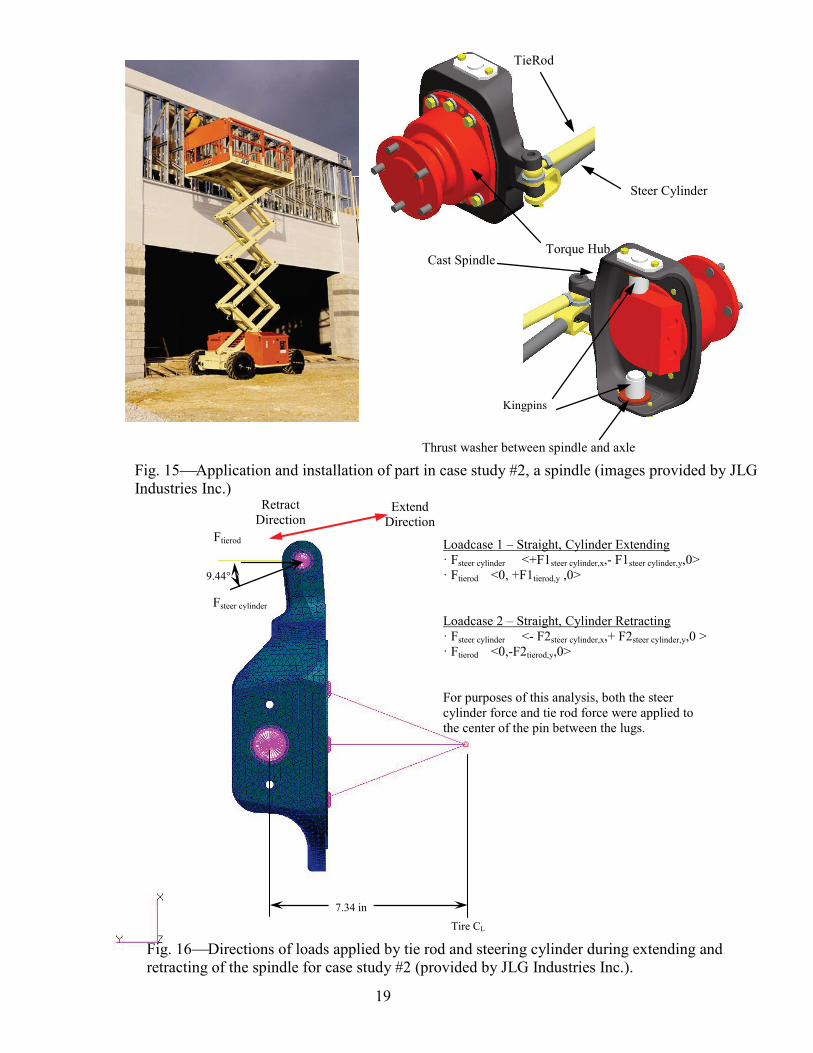
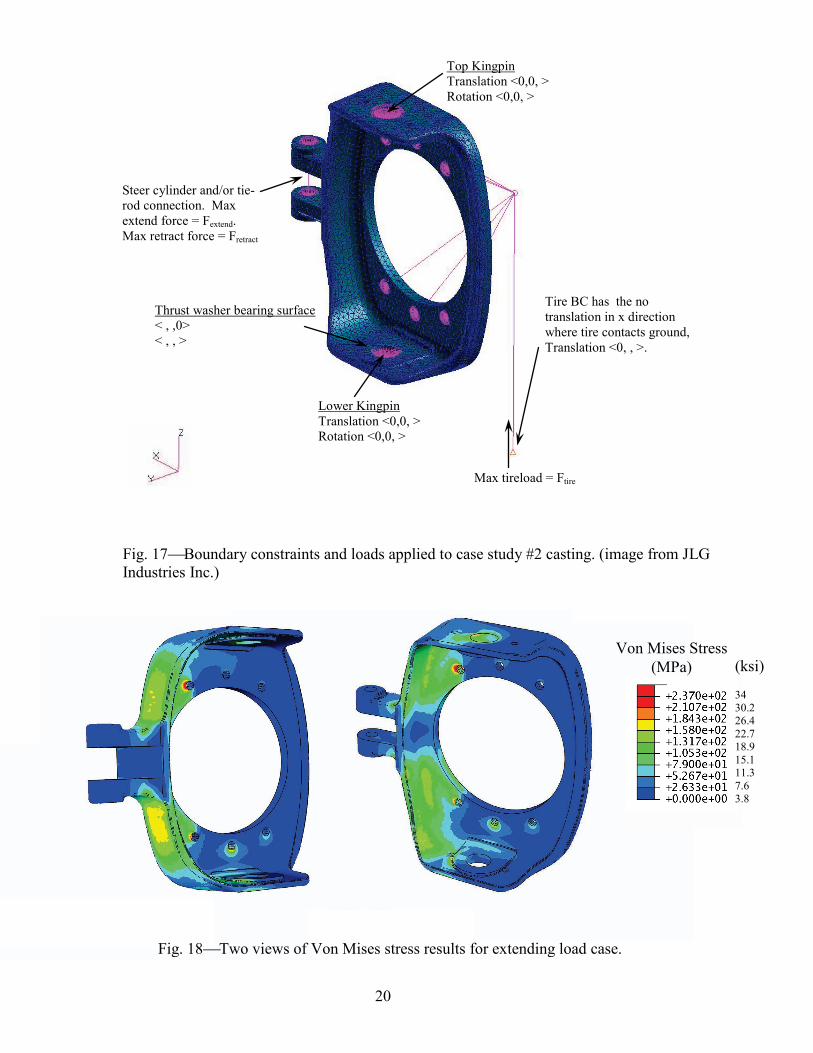
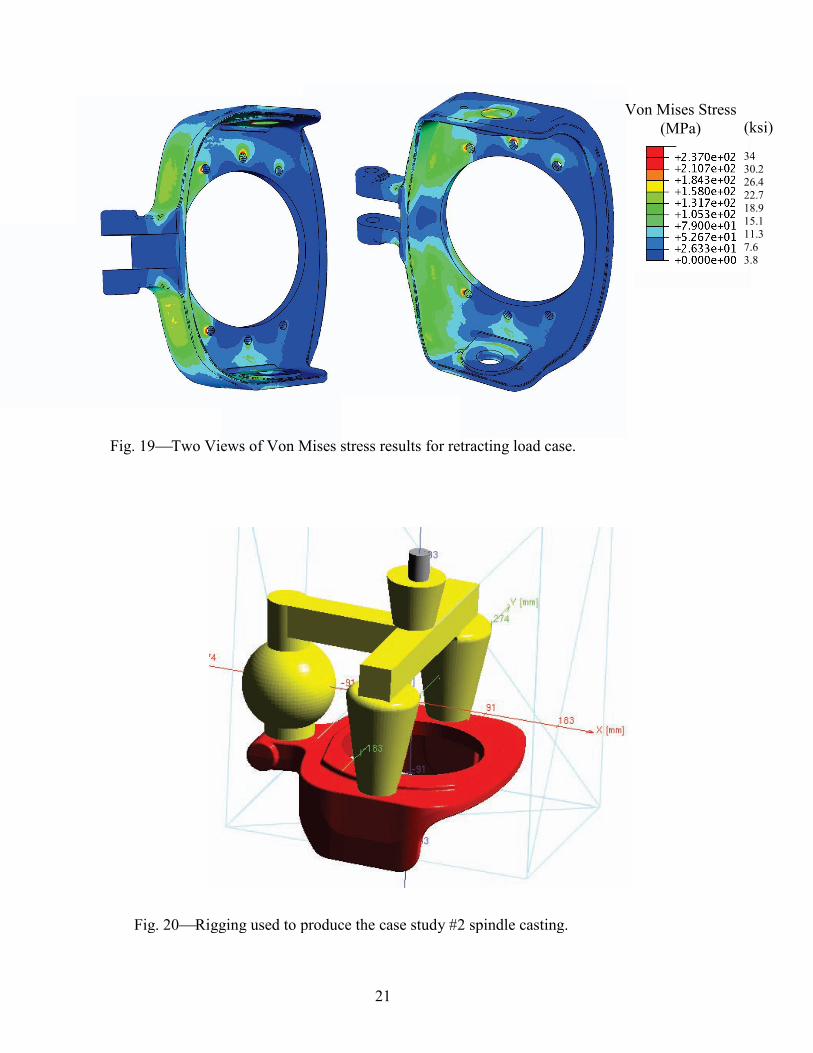
The next step in the analysis was to predict fatigue life in the presence of porosity. The porosity will be of concern if it lowers the life below 5 million cycles (the fatigue test data runout condition). As discussed earlier, fatigue life prediction uses a pore size model (maximum likely pore radius as function of pore fraction). The fatigue model was validated [2] using a pore size of at least 100 µm radius at any location where microporosity exists. Here the smallest size pore in the model is conservatively made to be 200 µm radius wherever there is porosity fraction ≥ 0.0004 (0.04%). Porosity fractions less than that are considered sound material. As the pore fraction increases, the pore size will increase according to the model described in [2,8], but if the model determines the size is less than 200 µm radius for a given porosity fraction then a 200 µm radius is used instead. If the pore size model gives a size larger than 200 µm radius, than the larger value is used. The resulting pore radius size field for the porosity predicted in Figures 11 and 12 is shown in Figure 13 for four views of the casting surface. The calculated fatigue life is shown for two views without and with including the effects of porosity in Figure 14. The scale used is the Log10 life; 1 million cycles would be 6 on this scale. The porosity lowers the fatigue life many decades (powers of ten), from more than 1014 to 108. The runout condition for infinite life is 5x10⁶ cycles. There are a few nodes in the 107 cycle range, but none below. Therefore, even using a conservative estimate for the minimum pore radius (i.e., 200 µm), which is twice the size used in the model validation [2,8], the porosity does not cause the part to fail in these predictions. These calculations gave the designers of this part additional confidence in its robustness. Case Study #2: 260 MRT Spindle The second case study casting is a steering spindle from a scissor lift with its installation shown in Figure 15. It, like the first case study, is cast from ASTM 148 105-85 steel. The casting is being designed and considered as a replacement for a weldment weighing 15.6 lb. The machined casting weight is 17.7 lb. For this application, two forces are applied between the lugs of the spindle; one from the tie rod and the other from the steering cylinder. In Figure 16 shows the directions of the loads applied by the tie rod and the steering cylinder during extending and retracting. The general directions of the displacements of the lug by the applied forces are indicated by red arrows. Here, both the steer cylinder force and tie rod force were applied to the center of the pin between the lugs, but in reality they are applied at different points. That will not greatly affect the overall stresses. The boundary conditions and forces are summarized in Figure 17. The Von Mises stress distributions on the surface of the casting are shown for the extending and retracting load cases in Figures 18 and 19, respectively. Two views of the stresses are shown in each figure. Note that the stresses are higher on the lug-side of the part where the forces are applied relative to the opposite (blue) side. Using a yield strength of 85 ksi, the factor of safety is 2.5, because the maximum stress for both cases is 237 MPa (34 ksi). The factor of safety is 1.1 based on a fatigue strength at runout (endurance limit) of Sf = 293 (MPa) (37 ksi) for the sound cast material. This analysis shows that without considering any porosity arising from the casting process, the design is acceptable.
7
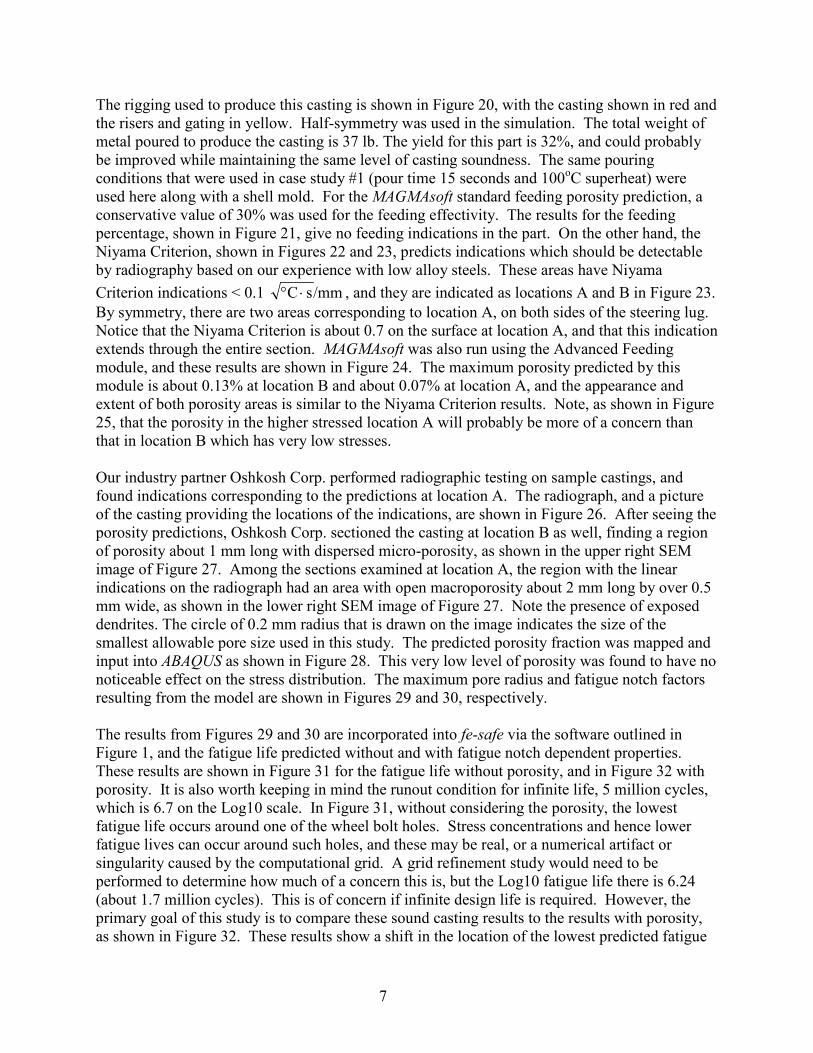
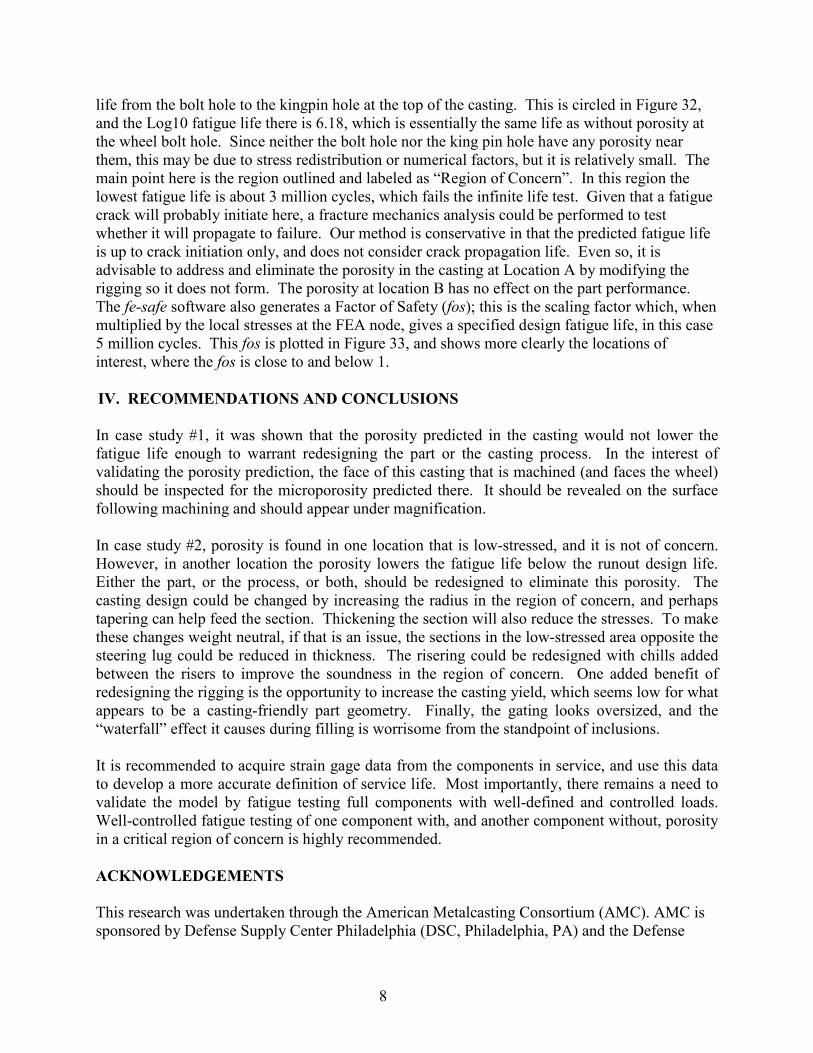
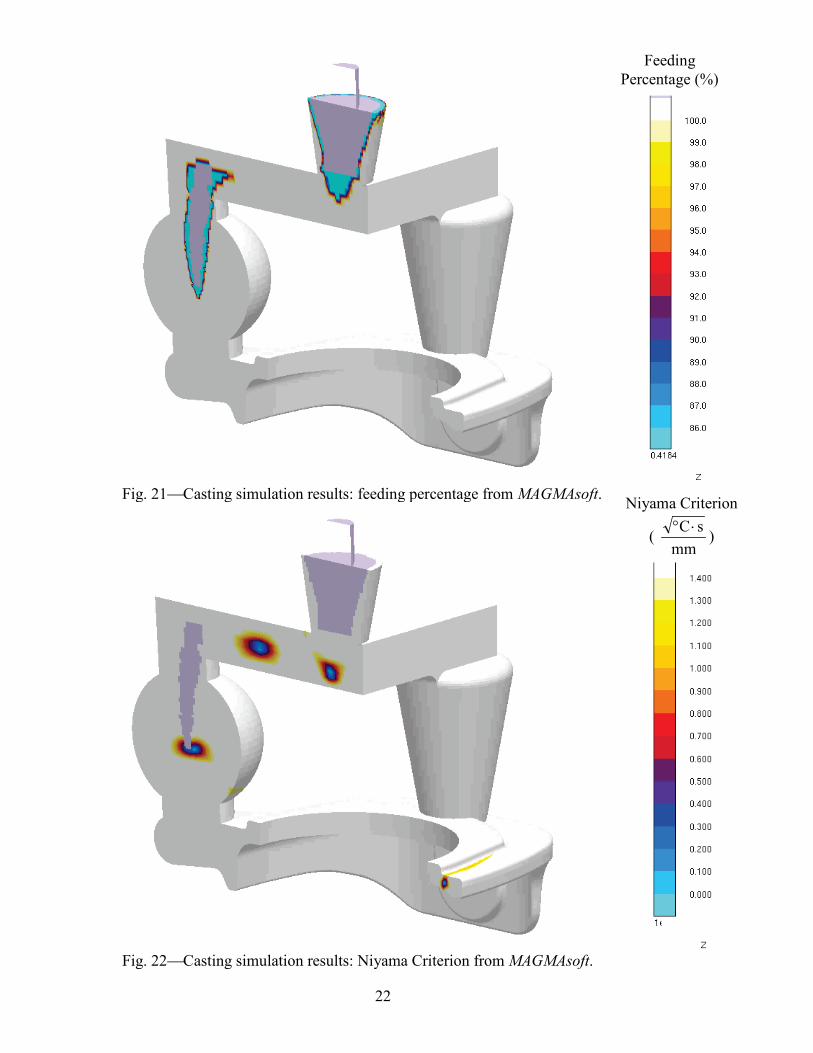
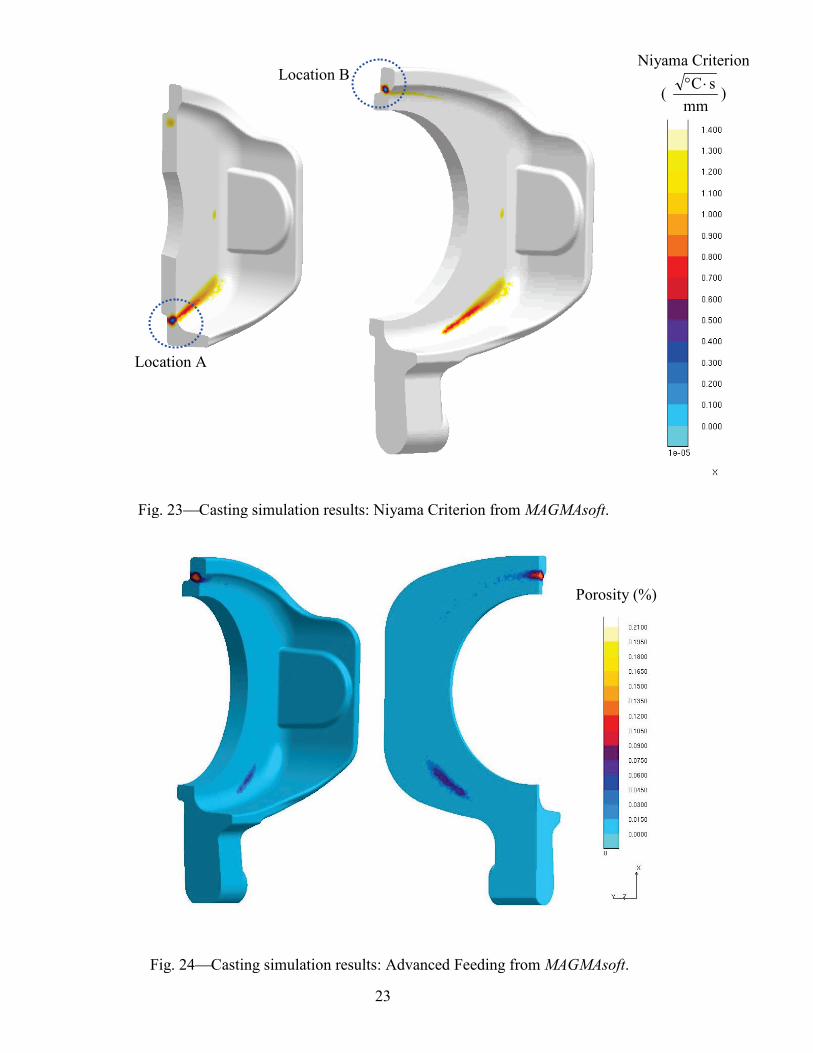
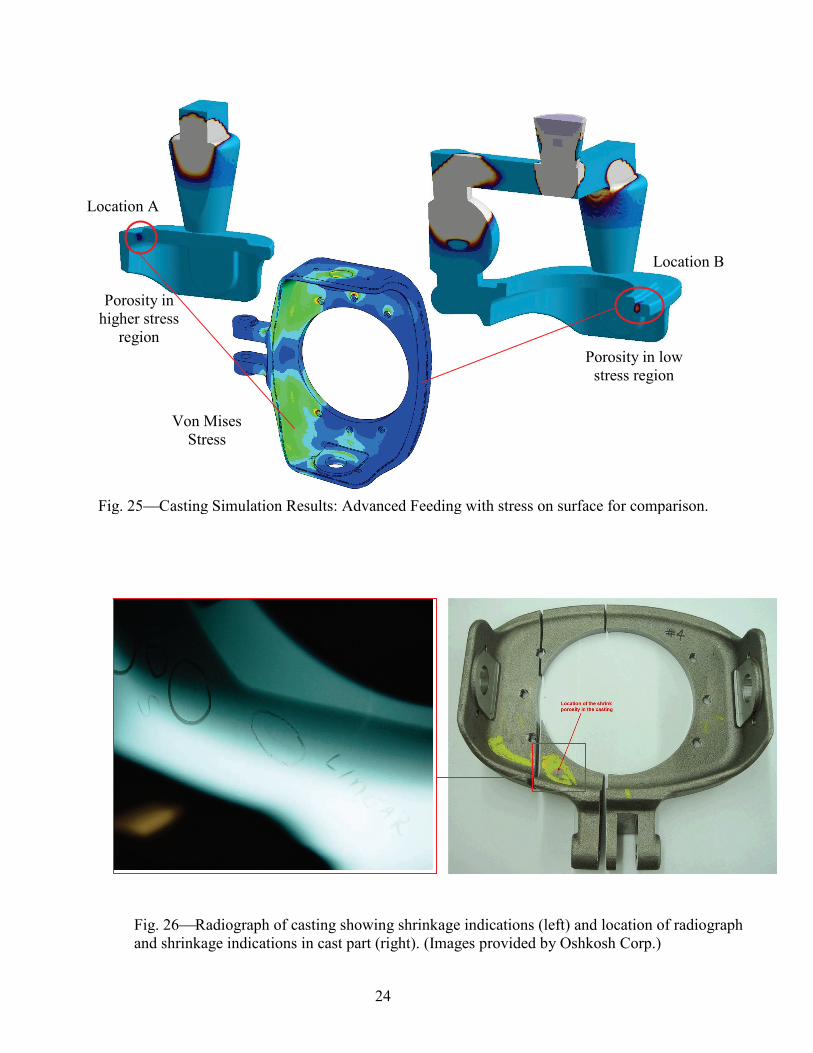
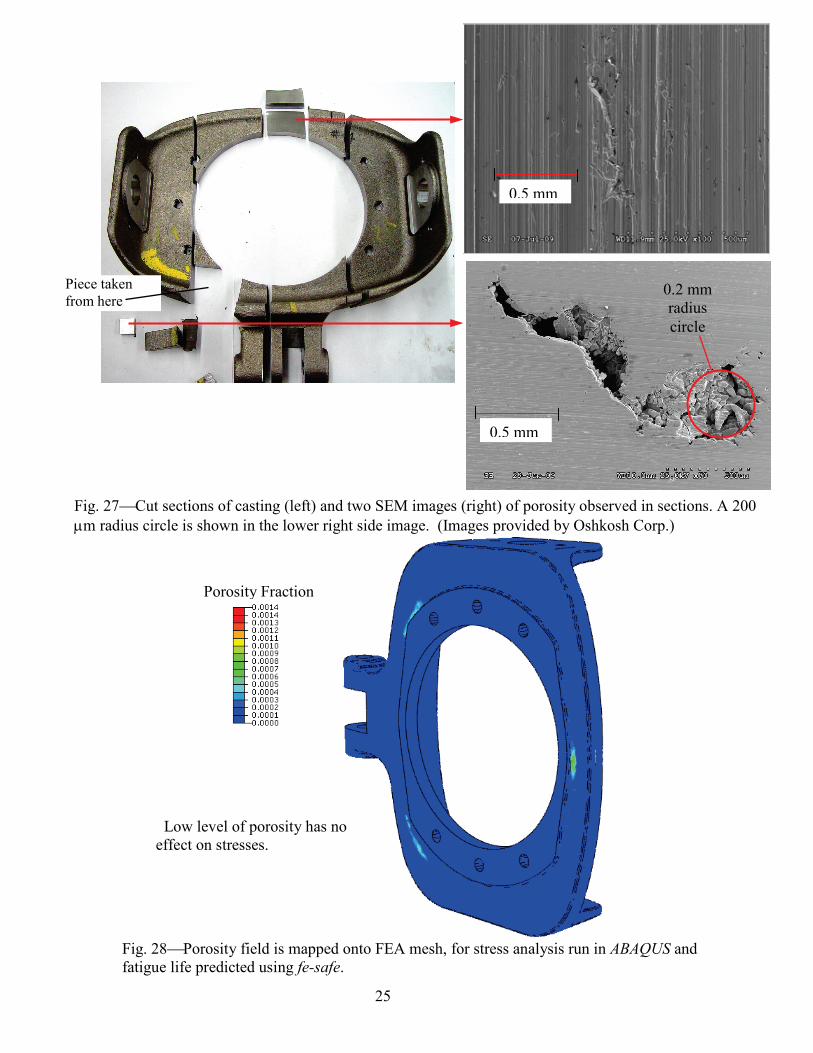
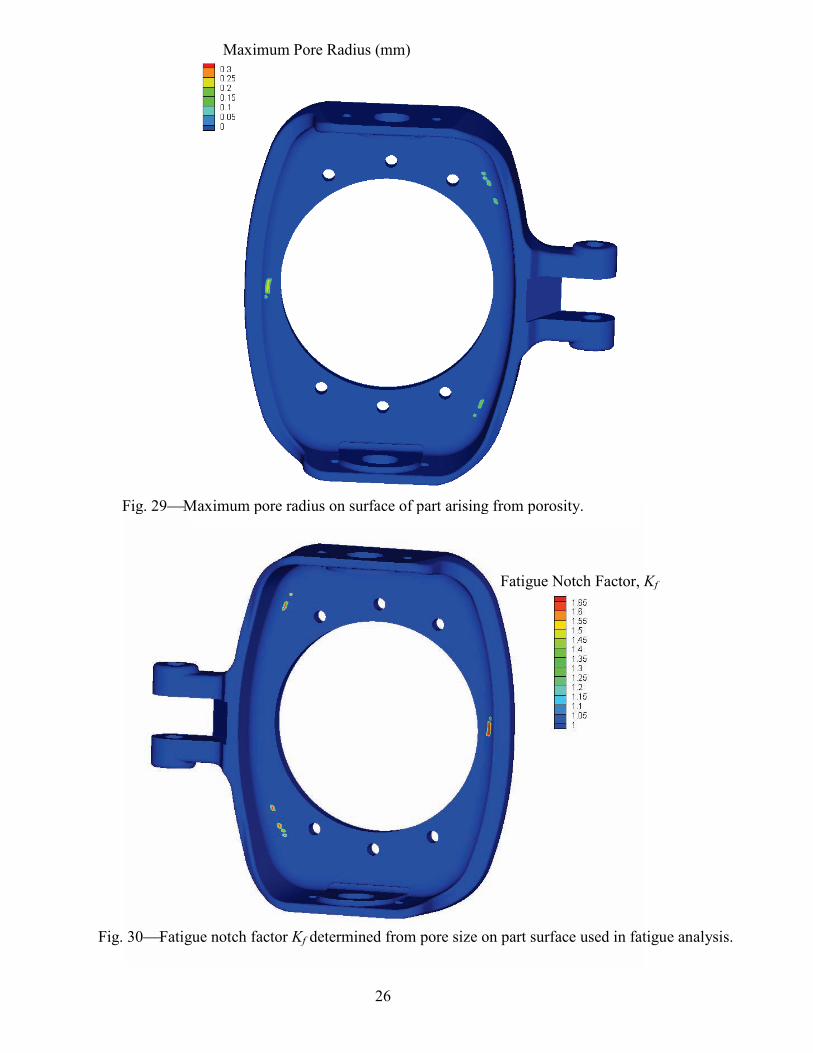
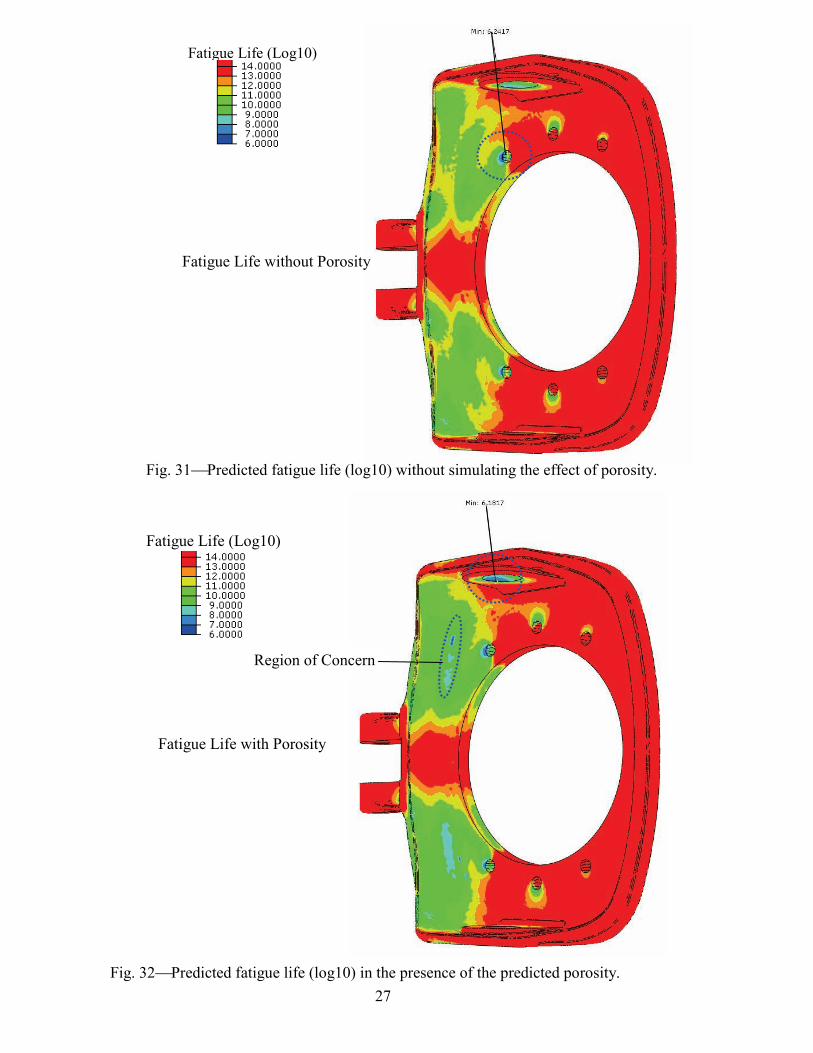
The rigging used to produce this casting is shown in Figure 20, with the casting shown in red and the risers and gating in yellow. Half-symmetry was used in the simulation. The total weight of metal poured to produce the casting is 37 lb. The yield for this part is 32%, and could probably be improved while maintaining the same level of casting soundness. The same pouring conditions that were used in case study #1 (pour time 15 seconds and 100oC superheat) were used here along with a shell mold. For the MAGMAsoft standard feeding porosity prediction, a conservative value of 30% was used for the feeding effectivity. The results for the feeding percentage, shown in Figure 21, give no feeding indications in the part. On the other hand, the Niyama Criterion, shown in Figures 22 and 23, predicts indications which should be detectable by radiography based on our experience with low alloy steels. These areas have Niyama Criterion indications < 0.1 /mmsC ⋅° , and they are indicated as locations A and B in Figure 23. By symmetry, there are two areas corresponding to location A, on both sides of the steering lug. Notice that the Niyama Criterion is about 0.7 on the surface at location A, and that this indication extends through the entire section. MAGMAsoft was also run using the Advanced Feeding module, and these results are shown in Figure 24. The maximum porosity predicted by this module is about 0.13% at location B and about 0.07% at location A, and the appearance and extent of both porosity areas is similar to the Niyama Criterion results. Note, as shown in Figure 25, that the porosity in the higher stressed location A will probably be more of a concern than that in location B which has very low stresses. Our industry partner Oshkosh Corp. performed radiographic testing on sample castings, and found indications corresponding to the predictions at location A. The radiograph, and a picture of the casting providing the locations of the indications, are shown in Figure 26. After seeing the porosity predictions, Oshkosh Corp. sectioned the casting at location B as well, finding a region of porosity about 1 mm long with dispersed micro-porosity, as shown in the upper right SEM image of Figure 27. Among the sections examined at location A, the region with the linear indications on the radiograph had an area with open macroporosity about 2 mm long by over 0.5 mm wide, as shown in the lower right SEM image of Figure 27. Note the presence of exposed dendrites. The circle of 0.2 mm radius that is drawn on the image indicates the size of the smallest allowable pore size used in this study. The predicted porosity fraction was mapped and input into ABAQUS as shown in Figure 28. This very low level of porosity was found to have no noticeable effect on the stress distribution. The maximum pore radius and fatigue notch factors resulting from the model are shown in Figures 29 and 30, respectively. The results from Figures 29 and 30 are incorporated into fe-safe via the software outlined in Figure 1, and the fatigue life predicted without and with fatigue notch dependent properties. These results are shown in Figure 31 for the fatigue life without porosity, and in Figure 32 with porosity. It is also worth keeping in mind the runout condition for infinite life, 5 million cycles, which is 6.7 on the Log10 scale. In Figure 31, without considering the porosity, the lowest fatigue life occurs around one of the wheel bolt holes. Stress concentrations and hence lower fatigue lives can occur around such holes, and these may be real, or a numerical artifact or singularity caused by the computational grid. A grid refinement study would need to be performed to determine how much of a concern this is, but the Log10 fatigue life there is 6.24 (about 1.7 million cycles). This is of concern if infinite design life is required. However, the primary goal of this study is to compare these sound casting results to the results with porosity, as shown in Figure 32. These results show a shift in the location of the lowest predicted fatigue
8
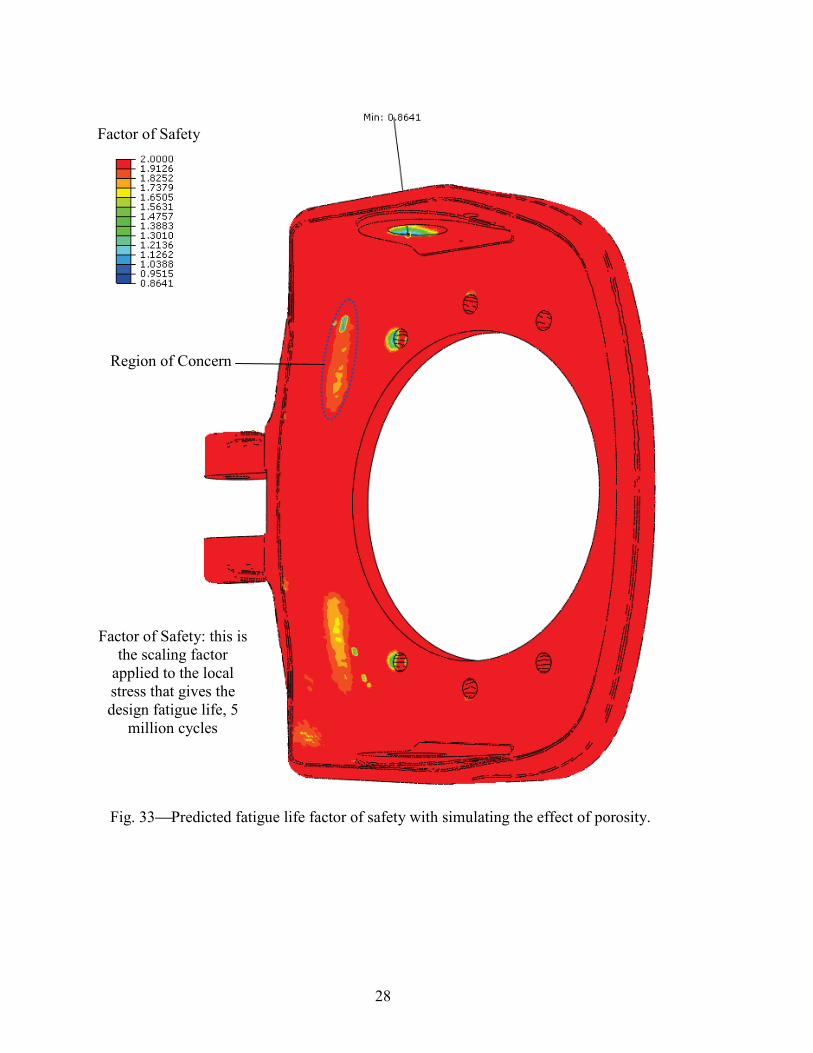
life from the bolt hole to the kingpin hole at the top of the casting. This is circled in Figure 32, and the Log10 fatigue life there is 6.18, which is essentially the same life as without porosity at the wheel bolt hole. Since neither the bolt hole nor the king pin hole have any porosity near them, this may be due to stress redistribution or numerical factors, but it is relatively small. The main point here is the region outlined and labeled as “Region of Concern”. In this region the lowest fatigue life is about 3 million cycles, which fails the infinite life test. Given that a fatigue crack will probably initiate here, a fracture mechanics analysis could be performed to test whether it will propagate to failure. Our method is conservative in that the predicted fatigue life is up to crack initiation only, and does not consider crack propagation life. Even so, it is advisable to address and eliminate the porosity in the casting at Location A by modifying the rigging so it does not form. The porosity at location B has no effect on the part performance. The fe-safe software also generates a Factor of Safety (fos); this is the scaling factor which, when multiplied by the local stresses at the FEA node, gives a specified design fatigue life, in this case 5 million cycles. This fos is plotted in Figure 33, and shows more clearly the locations of interest, where the fos is close to and below 1.
IV. RECOMMENDATIONS AND CONCLUSIONS In case study #1, it was shown that the porosity predicted in the casting would not lower the fatigue life enough to warrant redesigning the part or the casting process. In the interest of validating the porosity prediction, the face of this casting that is machined (and faces the wheel) should be inspected for the microporosity predicted there. It should be revealed on the surface following machining and should appear under magnification. In case study #2, porosity is found in one location that is low-stressed, and it is not of concern. However, in another location the porosity lowers the fatigue life below the runout design life. Either the part, or the process, or both, should be redesigned to eliminate this porosity. The casting design could be changed by increasing the radius in the region of concern, and perhaps tapering can help feed the section. Thickening the section will also reduce the stresses. To make these changes weight neutral, if that is an issue, the sections in the low-stressed area opposite the steering lug could be reduced in thickness. The risering could be redesigned with chills added between the risers to improve the soundness in the region of concern. One added benefit of redesigning the rigging is the opportunity to increase the casting yield, which seems low for what appears to be a casting-friendly part geometry. Finally, the gating looks oversized, and the “waterfall” effect it causes during filling is worrisome from the standpoint of inclusions. It is recommended to acquire strain gage data from the components in service, and use this data to develop a more accurate definition of service life. Most importantly, there remains a need to validate the model by fatigue testing full components with well-defined and controlled loads. Well-controlled fatigue testing of one component with, and another component without, porosity in a critical region of concern is highly recommended. ACKNOWLEDGEMENTS
This research was undertaken through the American Metalcasting Consortium (AMC). AMC is sponsored by Defense Supply Center Philadelphia (DSC, Philadelphia, PA) and the Defense
9
Logistics Agency (DLA, Ft. Belvoir, VA). This work was conducted under the auspices of the Steel Founders' Society of America (SFSA) through their in-kind support and guidance. In addition, substantial in-kind support for the case studies was provided by Oshkosh Corporation and JLG Industries Inc. Any opinions, findings, conclusions, or recommendations expressed herein are those of the authors and do not necessarily reflect the views of DSC, DLA, Oshkosh Corporation, or the SFSA or any of its members. REFERENCES 1. R.A. Hardin and C. Beckermann, "Effect of Porosity on the Stiffness of Cast Steel," Metall.
Mater. Trans. A, Vol. 38A, 2007, pp. 2992-3006. 2. R.A. Hardin and C. Beckermann, "Prediction of the Fatigue Life of Cast Steel Containing
Shrinkage Porosity," Metall. Mater. Trans. A, Vol. 40A, 2009, pp. 581-597. 3. R.A. Hardin, R.K. Huff and C. Beckermann, “Integrated Design of Steel Castings for Service
Performance,” Modeling of Casting, Welding and Advanced Solidification Processes – XI, ed. C. Gandin and M. Bellet, TMS, Warrendale, Pennsylvania, USA, 2006, pp. 653-660.
4. ABAQUS/CAE Version 6.7-1, Dassault Systèmes, 2007. 5. fe-safe Version 5.4, Safe Technology Ltd., 2008. 6. Tecplot Focus 2008, Tecplot Inc., 2008. 7. R. I. Stephens, Fatigue and Fracture Toughness of Five Carbon or Low Alloy Cast Steels at
Room or Low Climatic Temperatures (Carbon and Low Alloy Technical Research Committee, Steel Founders’ Society of America, Des Plaines, IL, 1982).
8. R.A. Hardin and C. Beckermann, “Prediction of Fatigue Life of Cast Steel in the Presence of
Porosity,” in Proceedings of the 61st Technical and Operating Conference, SFSA, Chicago (2007).
9. J.E. Shigley, and C.R. Mishke, Mechanical Engineering Design, McGraw-Hill, 2001, pp.
374-395.
10
Table I - 8630 Steel Cyclic Properties [7].
Property Sound Material
Sf (MPa) 293 Sf/Su 0.26
b -0.121 c -0.693
σf′ (MPa) 1 936 εf′ 0.42
11
Spindle
Steer Cylinder
Axle
Kingpin
1. MAGMAsoft
5. GenNPData(in-house)
6. fe-safe
Multiaxial fatigue life prediction on stress results defining one loading cycle using fatigue properties
varying node by node as functions of fatigue
notch factor
ABAQUS user post-processing code to generate nodal
mapped fatigue property data for fe-safe and Tecplot
compatible visualization files.
Simulate Casting Process and Porosity
PorosityResults
4. ABAQUS
ABAQUS input deck containing mesh nodal data
is input to MAGMAlink
FEA Model run using elastic properties as function of porosity
field
2. MAGMAlinkModule
Output from MAGMAlink is nodal values of porosity for use in ABAQUS as a field
variable
3. MAGMApost(in-house)
Generates node set file and nodal porosity field file. Inserting into input deck requires manual editing.
Output from MAGMAlinkrequires cleaning and
additional post-processing so this MAGMpost was
developed
ABAQUS Results file (*.fil) with stress and porosity
output for load steps defining one cycle
Output is fatigue nodal property file and ABAQUS Results file (*.fil) with node sets removed to speed up
reading by fe-safe
Utility program that generates a table of
fatigue property data as functions of fatigue
notch factor
Strain_life_prop_gen(in-house)
7. Postfil(in-house)
Generates Tecplot compatible visualization files for fatigue life.
Output is fatigue life at feanodes, format is ABAQUS
Results file (*.fil)Notes:
Commercial software used is white text.
Custom in-house software is yellow text.
Material is ASTM A148 105-85 cast steel (yield stress 585 MPa, ultimate tensile strength 725 MPa)
Fig. 1Overview of steps and software to predict the effect of porosity on fatigue life with MAGMAsoft.
Fig. 2Application of part in case study #1, a spindle casting for Oshkosh Corporations and JLG Industries Inc. (images provided by JLG Industries Inc.)
12
Steer cylinder angle = 10.84° with wheels
Spindle
Steer Cylinder
Axle
Kingpin
FZ
Fx
Max extend cylinder force = Fextend Max retract cylinder force = Fretract For extend force: FZ = Fextend cos(10.84°) FX = Fextend sin(10.84°)
F
Tire Interface w/ Ground Translation <0, , > Rotation < , , > (assume all rotation of spindle is resisted by this tire/ground interface. Tire is not permitted to roll)
Max Tireload = Ftire
Steer cylinder connection. Max extend cylinder force = Fextend. Max retract cylinder force = Fextend. Angle of force application depends on steer angle of wheel. Point of application is half-way between gap on spindle.
23.0 in
9.69 in Tire CL
Fig. 3(a) Installation details of case study part #1 and (b) steering cylinder and tire forces and boundary conditions. (images and conditions provided by JLG Industries Inc.)
(a)
(b)
13
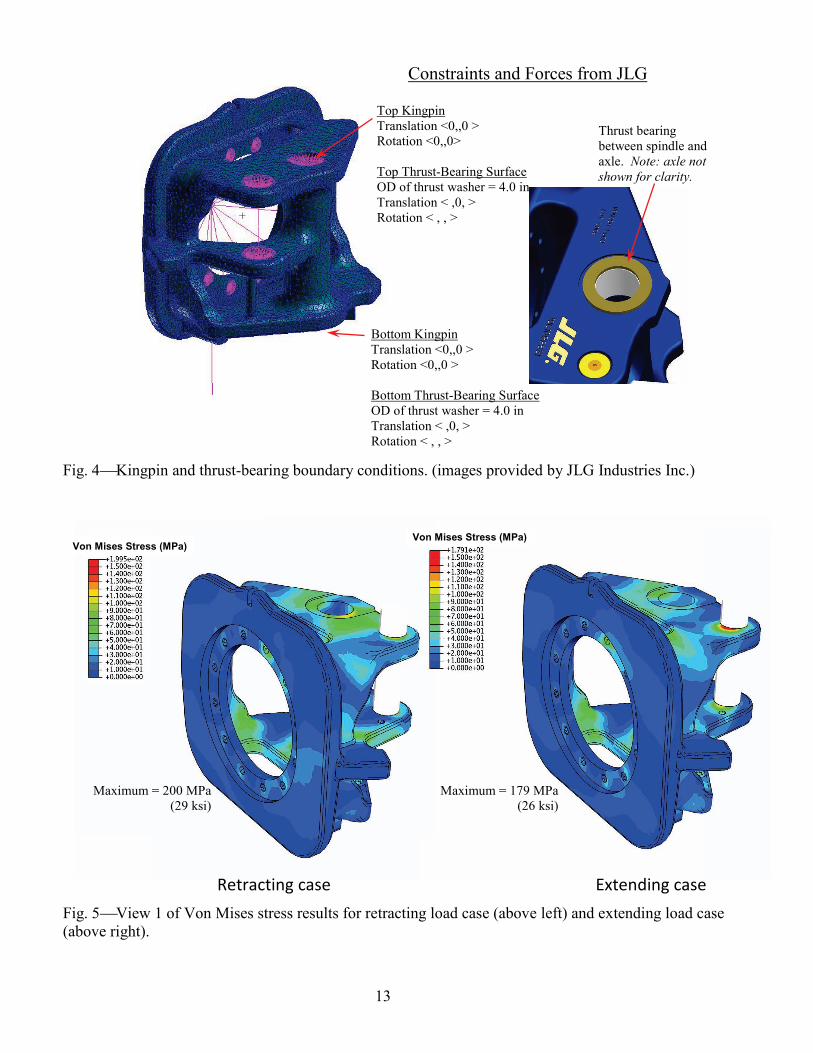
Top Kingpin Translation <0,,0 > Rotation <0,,0> Top Thrust-Bearing Surface OD of thrust washer = 4.0 in Translation < ,0, > Rotation < , , >
Bottom Kingpin Translation <0,,0 > Rotation <0,,0 > Bottom Thrust-Bearing Surface OD of thrust washer = 4.0 in Translation < ,0, > Rotation < , , >
Constraints and Forces from JLG
Thrust bearing between spindle and axle. Note: axle not shown for clarity.
Von Mises Stress (MPa)Von Mises Stress (MPa)
Retracting case Extending case
Fig. 4Kingpin and thrust-bearing boundary conditions. (images provided by JLG Industries Inc.)
Fig. 5View 1 of Von Mises stress results for retracting load case (above left) and extending load case (above right).
Maximum = 200 MPa (29 ksi)
Maximum = 179 MPa (26 ksi)
14
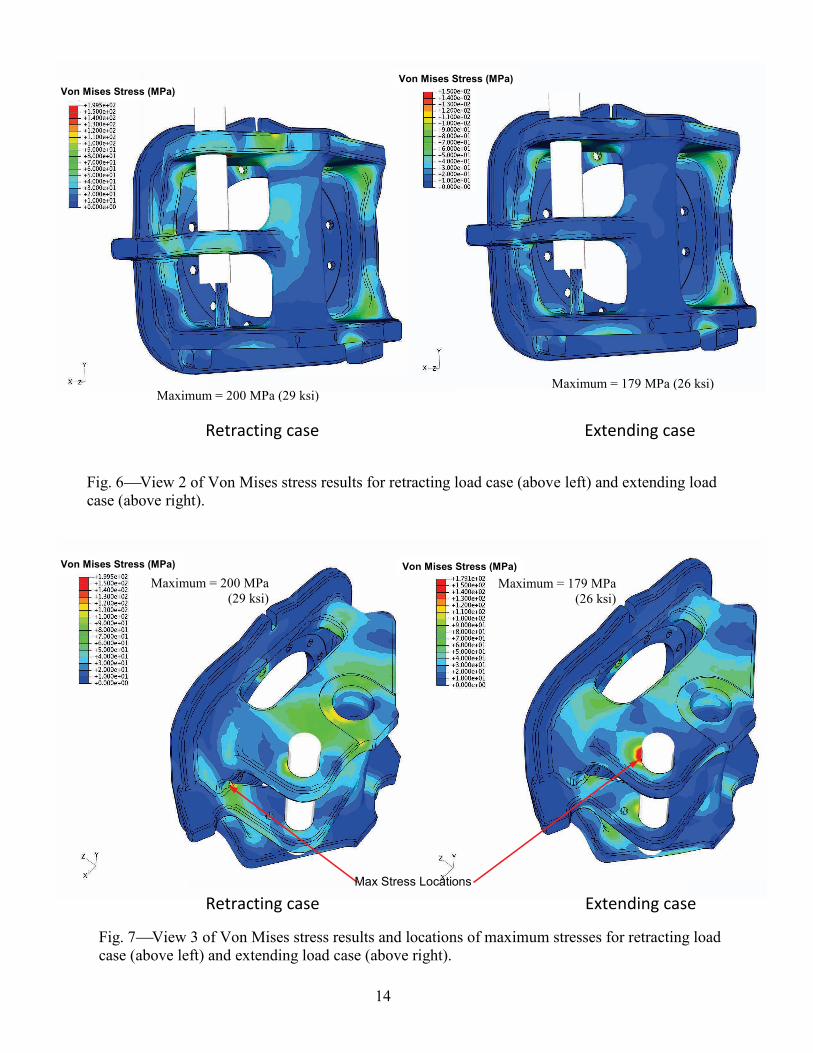
Von Mises Stress (MPa)Von Mises Stress (MPa)
Retracting case Extending case
Von Mises Stress (MPa)Von Mises Stress (MPa)
Retracting case Extending caseMax Stress Locations
Fig. 6View 2 of Von Mises stress results for retracting load case (above left) and extending load case (above right).
Maximum = 200 MPa (29 ksi) Maximum = 179 MPa (26 ksi)
Fig. 7View 3 of Von Mises stress results and locations of maximum stresses for retracting load case (above left) and extending load case (above right).
Maximum = 200 MPa (29 ksi)
Maximum = 179 MPa (26 ksi)
15
Niyama Criterion
(mm
sC ⋅° )
Wheel face Kingpin tube
Fig. 8Rigging used to produce the spindle casting as developed by Oshkosh Corporation.
Fig. 9Niyama criterion in four slices across the casting and risers. Lower (blue) is more porosity.
16
Feeding Percentage (%)
Fig. 10MAGMAsoft Feeding Porosity predictions in four slices across the casting and risers. Lower (blue) is more shrinkage porosity due to incomplete feeding.
Fig. 11MAGMAsoft Advanced Porosity predictions in three slices across the casting and risers. Higher (yellow to white) is more porosity.
17
Porosity Fraction Von Mises Stress (MPa)
Fig. 12MAGMAsoft Advanced Porosity prediction in slice through casting (above left) and Von Mises stress (MPa) in same slice (above right).
Fig. 13Pore radius (maximum likely, in mm) from porosity and pore size model used in fatigue life predictions.
Maximum Pore Radius (mm)
Wheel face
18
View 1 Fatigue Life with Porosity
Fatigue Life (Log10)
View 1 Fatigue Life without Porosity
View 2 Fatigue Life with Porosity View 2 Fatigue Life without Porosity
Fig. 14Fatigue life (in log10, i.e. 1 million cycles = 6) without (left side) and with (right side) porosity for two views of the spindle casting.
19
7.34 in
Tire CL
9.44°
Fsteer cylinder
Ftierod
Loadcase 1 – Straight, Cylinder Extending · Fsteer cylinder <+F1steer cylinder,x,- F1steer cylinder,y,0> · Ftierod <0, +F1tierod,y ,0> Loadcase 2 – Straight, Cylinder Retracting · Fsteer cylinder <- F2steer cylinder,x,+ F2steer cylinder,y,0 > · Ftierod <0,-F2tierod,y,0> For purposes of this analysis, both the steer cylinder force and tie rod force were applied to the center of the pin between the lugs.
Extend Direction
Retract Direction
Kingpins
Torque Hub
Steer Cylinder
TieRod
Cast Spindle
Thrust washer between spindle and axle
Fig. 15Application and installation of part in case study #2, a spindle (images provided by JLG Industries Inc.)
Fig. 16Directions of loads applied by tie rod and steering cylinder during extending and retracting of the spindle for case study #2 (provided by JLG Industries Inc.).
20
Lower Kingpin Translation <0,0, > Rotation <0,0, >
Top Kingpin Translation <0,0, > Rotation <0,0, >
Max tireload = Ftire
Steer cylinder and/or tie-rod connection. Max extend force = Fextend. Max retract force = Fretract
Thrust washer bearing surface < , ,0> < , , >
Tire BC has the no translation in x direction where tire contacts ground, Translation <0, , >.
Von Mises Stress (MPa) (ksi)
34 30.2 26.4 22.7 18.9 15.1 11.3 7.6 3.8
Fig. 18Two views of Von Mises stress results for extending load case.
Fig. 17Boundary constraints and loads applied to case study #2 casting. (image from JLG Industries Inc.)
21
Von Mises Stress (MPa) (ksi)
34 30.2 26.4 22.7 18.9 15.1 11.3 7.6 3.8
Fig. 19Two Views of Von Mises stress results for retracting load case.
Fig. 20Rigging used to produce the case study #2 spindle casting.
22
Fig. 21Casting simulation results: feeding percentage from MAGMAsoft.
Fig. 22Casting simulation results: Niyama Criterion from MAGMAsoft.
Niyama Criterion
(mm
sC ⋅° )
Feeding Percentage (%)
23
Fig. 23Casting simulation results: Niyama Criterion from MAGMAsoft.
Fig. 24Casting simulation results: Advanced Feeding from MAGMAsoft.
Niyama Criterion
(mm
sC ⋅° )
Location A
Location B
Porosity (%)
24
Porosity in low stress region
Porosity in higher stress
region
Von Mises Stress
Fig. 25Casting Simulation Results: Advanced Feeding with stress on surface for comparison.
Fig. 26Radiograph of casting showing shrinkage indications (left) and location of radiograph and shrinkage indications in cast part (right). (Images provided by Oshkosh Corp.)
Location A
Location B
25
Porosity Fraction
0.5 mm
0.5 mm
Low level of porosity has no effect on stresses.
Fig. 27Cut sections of casting (left) and two SEM images (right) of porosity observed in sections. A 200 µm radius circle is shown in the lower right side image. (Images provided by Oshkosh Corp.)
Fig. 28Porosity field is mapped onto FEA mesh, for stress analysis run in ABAQUS and fatigue life predicted using fe-safe.
Piece taken from here
0.2 mm radius circle
26
Fatigue Notch Factor, Kf
Maximum Pore Radius (mm)
Fig. 29Maximum pore radius on surface of part arising from porosity.
Fig. 30Fatigue notch factor Kf determined from pore size on part surface used in fatigue analysis.
27
Fatigue Life (Log10)
Fatigue Life without Porosity
Fatigue Life (Log10)
Fatigue Life with Porosity
Fig. 31Predicted fatigue life (log10) without simulating the effect of porosity.
Fig. 32Predicted fatigue life (log10) in the presence of the predicted porosity.
Region of Concern
28
Factor of Safety
Factor of Safety: this is the scaling factor
applied to the local stress that gives the design fatigue life, 5
million cycles
Fig. 33Predicted fatigue life factor of safety with simulating the effect of porosity.
Region of Concern