integrated energy and environmental planning with … energy and environmental planning with markal...
TRANSCRIPT
Integrated Energy and Environmental Planning with
MARKAL Model
Environmental Protection Agency – Region 2
Brookhaven National Laboratory
State University of New York at Stony Brook

Overview of the Presentation Relationship of Energy with Cities MARKAL Methodology to Address Urban
Energy and Environmental Issues A Demonstrative Case-study: New York
City
Relationship of Energy with Cities
EPA cites Adaptation as KeyStrategy for Climate Change Response Dr. Joel ScheragaInside EPA February 9, 2007
Energy in Today’s World “Extending hope and opportunity depends
on a stable supply of energy that keeps America's economy running and America's environment clean” – the President of United State’s State of the Union address 2007 (this is a global issue)
"Warming of the climate system is unequivocal," the cause is "very likely" man-made, and "would continue for centuries.“ – the Fourth Assessment Report - WG1-IPCC, February 2007

Energy and Cities Globalizing cities consume 75% of world energy Providing energy security and sustainable
environment are major concerns for policymakers U.S. Conference of Mayors’ National Summit On Energy and
the Environment, May 2006 London: The Mayor’s Energy Strategy, February 2004 New York: PLANYC 2030, December 2006 Large Cities Climate Summit – C20: 2005, C40: 2007
Energy & Environmental systems in agglomerated urban regions consist of highly interconnected subsystems
Planning for these systems are comprised of two levels: Analysis of the overall local or regional systems for long-term
strategic planning Analysis and optimization of subsystems

Energy-Water NexusEnergy and water are inextricably linked
• ASE (Alliance to Save Energy). (2002). Watergy: Taking Advantage of Untapped Energy and Water Efficiency Opportunities in Municipal Water Systems, report by K James, SL Campbell, CE Godlove, ASE, Washington, D.C. 2. EIA (U.S. Department of Energy-Energy Information Administration). (2005). Annual Energy Outlook 2005, report prepared by JJ Conti, PD Holtberg, JA Beamon, JM Kendell, AS Kydes, U.S. Department of Energy-EIA, Washington, D.C. 3. USGS Circular 1268 Estimated Use of Water in the United States in 2000 (2004)
• Globally, 7% of the total energy consumed is for water delivery
•Worldwide, 2-3% of energy is consumed for water conveyance and treatment to serve urban populations and industry1.
• Water heating is typically the 2nd largest user of energy in the home (19% of home energy use) (according to Rocky Mountain Institute)
Water for Energy
Energy for Water
•About 54% of U.S. generating capacity comprised of one-through cooling (requires reliable, large volumes of water
• In 2000, 39% of U.S. water withdrawals were for thermoelectric power production3
• 136 BGD-freshwater withdrawals• 59 BGD- seawater withdrawals• 3 BGD-water consumption (about 20% of nonagricultural water consumption)
MARKAL Methodology to Address Urban Energy and
Environmental Issues
NYC MARKAL to reduce GHG’sElectricity,Water and Solid
Waste Nexus

MARKAL as an Energy & Environment Planning Tool
30 years of development under the auspices of the International Energy Agency and the US Department of Energy
Approximately 120 user institutions in more than 50 countries
Flexible and transparent framework - allows use of different features depending on modeling needs
Methodology is well documented
Total OECD = 22 Total Developing = 23Total Other = 13
Well established state-of-the-art tool for energy systems analysis, developed at BNL in 1970s.

MARKAL Framework Overview
Constraintson Importand Miningof Energy
Capital Needs &Technology Deployment
Demand for
Energy
Ecological effects Emissions
Energy Economy
Economy
and
Society
Environment
Services
Availability of technologies
MARKAL
Energy Consumption

MARKAL Modeling Framework MARKAL (MARKet ALlocation) is an integrated
energy, environment and economic model, to examine market potential for energy technologies over a short-, medium- and long-term horizon under alternative policy scenarios within the entire energy system.
Utilizes a bottom-up approach to represent and characterize technology specific portfolios at subsystem level – highlights synergies, offsets and feedback effects
Facilitates Urban Planners in selecting cost effective technology mix over the entire system based on life cycle accounting Involve all relevant interest groups in the planning process Set-up a plan for continuous improvement and monitoring

Demonstrative MARKAL Reference Energy System
ResourceExtraction
Refining &Conversion Transport Generation Transmission
& DistributionUtilizationDevices End-use
Renewables
Crude Oil
Coal
Natural Gas
Refined Products
OtherSources
Nuclear
Electrolysis
Hydrogen Fuel-CellFuel-Cell Vehicles
Electricity
Air-conditioningSpace HeatingWater HeatingOffice EquipmentsMisc. Electric BuildingMisc. Electric Industrial
Process Heat
Petro/Biochemicals
Other TransportationPassenger Travel

US National Energy Planning Applications of MARKALSupport for 3 US Department of Energy offices Analyze the long-term market competitiveness of R&D
portfolio Office of Energy Efficiency & Renewable Energy Office of Nuclear Energy
Assess competitiveness of alternative and boutique fuels for the Office of Policy and International Affairs
Options and tradeoffs of alternative hydrogen production infrastructure pathways with respect to demand, technology cost, regional mix, and feedstock prices
Develop and demonstrate the utility of analysis at the Census Region level
Provides platform to model DOE programs such as Global Nuclear Energy Partnership
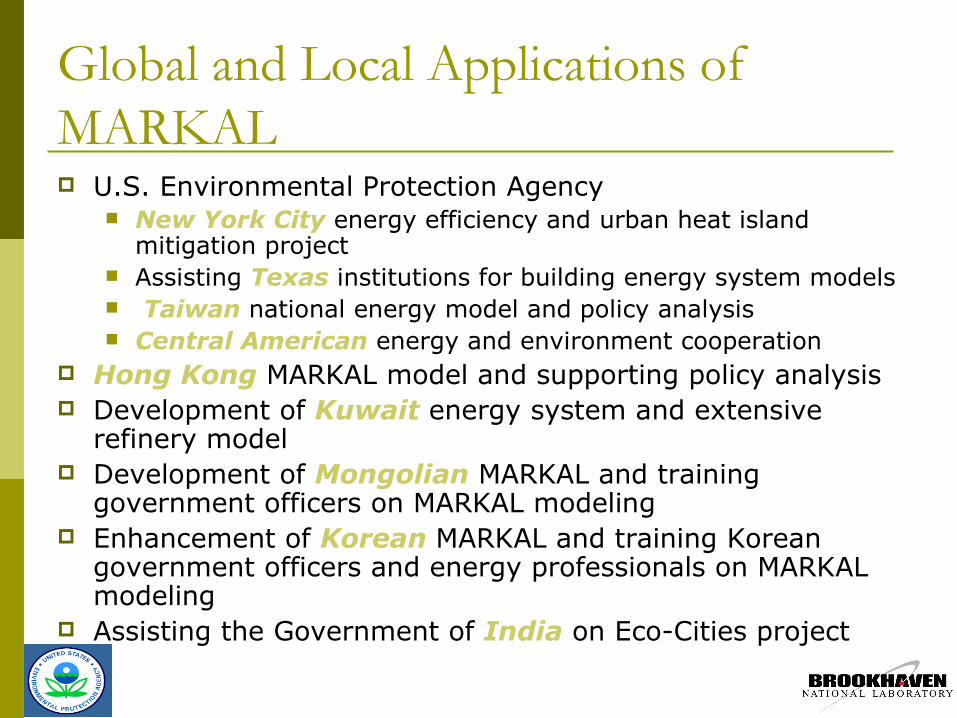
Global and Local Applications of MARKAL U.S. Environmental Protection Agency
New York City energy efficiency and urban heat island mitigation project
Assisting Texas institutions for building energy system models Taiwan national energy model and policy analysis Central American energy and environment cooperation
Hong Kong MARKAL model and supporting policy analysis Development of Kuwait energy system and extensive
refinery model Development of Mongolian MARKAL and training
government officers on MARKAL modeling Enhancement of Korean MARKAL and training Korean
government officers and energy professionals on MARKAL modeling
Assisting the Government of India on Eco-Cities project

A Demonstrative Case-study: New York City
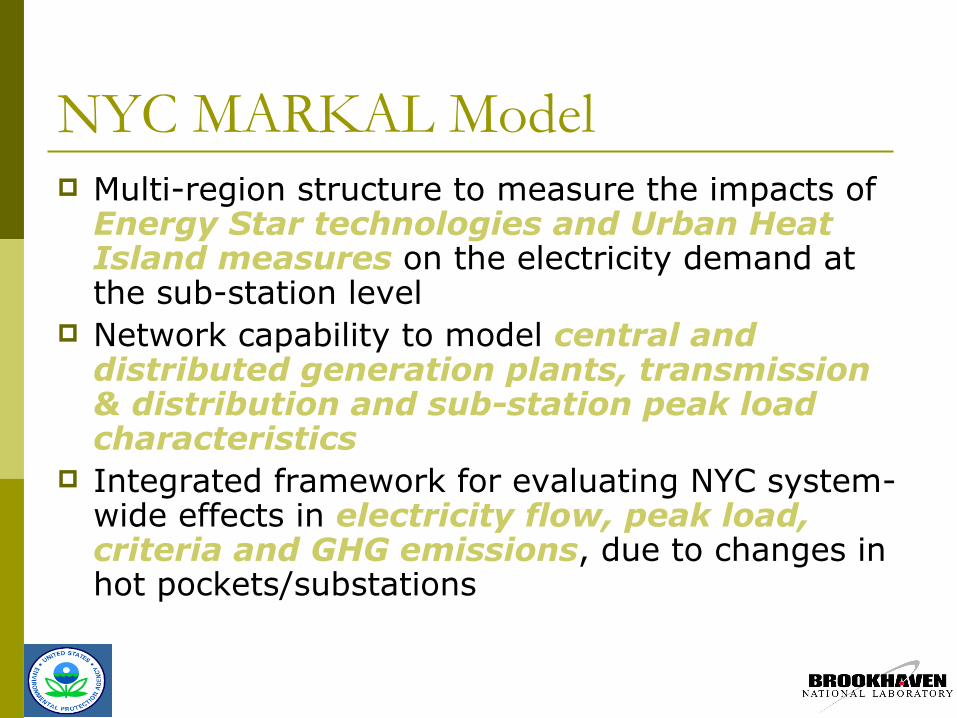
NYC MARKAL Model Multi-region structure to measure the impacts of
Energy Star technologies and Urban Heat Island measures on the electricity demand at the sub-station level
Network capability to model central and distributed generation plants, transmission & distribution and sub-station peak load characteristics
Integrated framework for evaluating NYC system-wide effects in electricity flow, peak load, criteria and GHG emissions, due to changes in hot pockets/substations
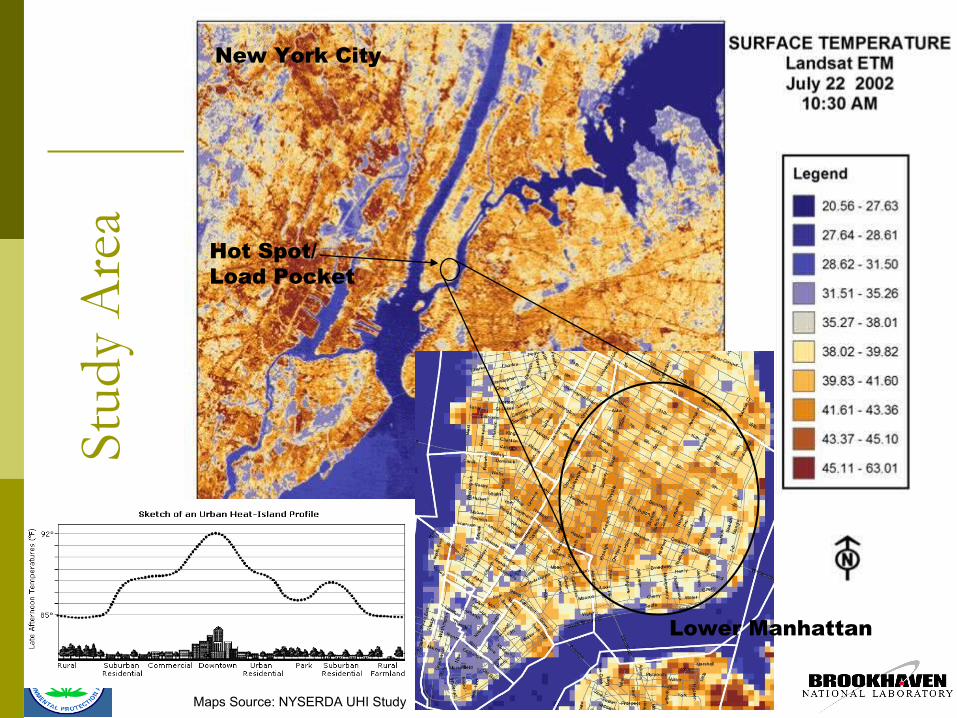
Stud
y A
rea
Lower Manhattan
New York City
Hot Spot/Load Pocket
Maps Source: NYSERDA UHI Study

MARKAL-EnergyPlus-MM5 Interactions
Central Stations
DER
TEELC TEXLCGrid
Exchange
Energy StarAC
Centrifugal Chiller
Electric HeatPumps
Conventional AC
ConservationShell - DSM
Demand for AC in Buildings
EnergyPlus
MM5MM5: Meso-scale Climate ModelEnergyPlus: Building Energy Simulation ModelDSM: Demand Side ManagementDER: Distributed Energy ResourcesTEELC: High Voltage Electricity Transmission TEXLC: Low Voltage Electricity Transmission

NYC MARKAL Modeling FrameworkDelivered
Resources Generation Transmission& Distribution
UtilizationDevices/DSM End-useUtilization
Regions
Natural Gas
Electricity
RavenswoodArthur KillAstoria
Electricity Imports Neighboring
States
CanadaUpstate
Refined Oil Products Gowanus
74th StHudson
Others
Others
Ocean Parkway - Brklyn
Crown Heights - Brklyn
Other Sub-stations
Lower Manhattan
Midtown Manhattan
Maspeth - Queens
Fordham - BronxNew
Yor
k C
ity
Public AuthoritySubway & Other Train Transport
Industrial Misc.
Air ConditioningSpace HeatingLightingBuilding Misc.
Commercial & Residential
Builds on extensive plant level information from the Energy Information Administration and the Environmental Protection Agency
Time of the day peak-load was modeled on the basis of seasonal variability

MARKAL Modeling System
RES Diagram
Case Parameter Emission 1990 2000 2010Base w/ CO2 Emission Marginal Carbon Dioxide 0 -20.91 -19.54Adv & Eff technology w/ CO2 Emission Marginal Carbon Dioxide 0 -17.81 -18.92MM - Base w/ CO2 Emission Marginal Carbon Dioxide 0 -22.62 -21.25MM - Adv & Eff technology w/ CO2 Emission Marginal Carbon Dioxide 0 -21.92 -18.91
-25
-20
-15
-10
-5
0
$/to
n
1990 2000 2010
Years
Emissions Marginal Cost: CO2Base w/ CO2Emission MarginalCarbon Dioxide
Adv & Eff technologyw/ CO2 EmissionMarginal CarbonDioxideMM - Base w/ CO2Emission MarginalCarbon Dioxide
MM - Adv & Efftechnology w/ CO2Emission MarginalCarbon Dioxide
Output w/ Excel Graph
Data Management & Scenario Development
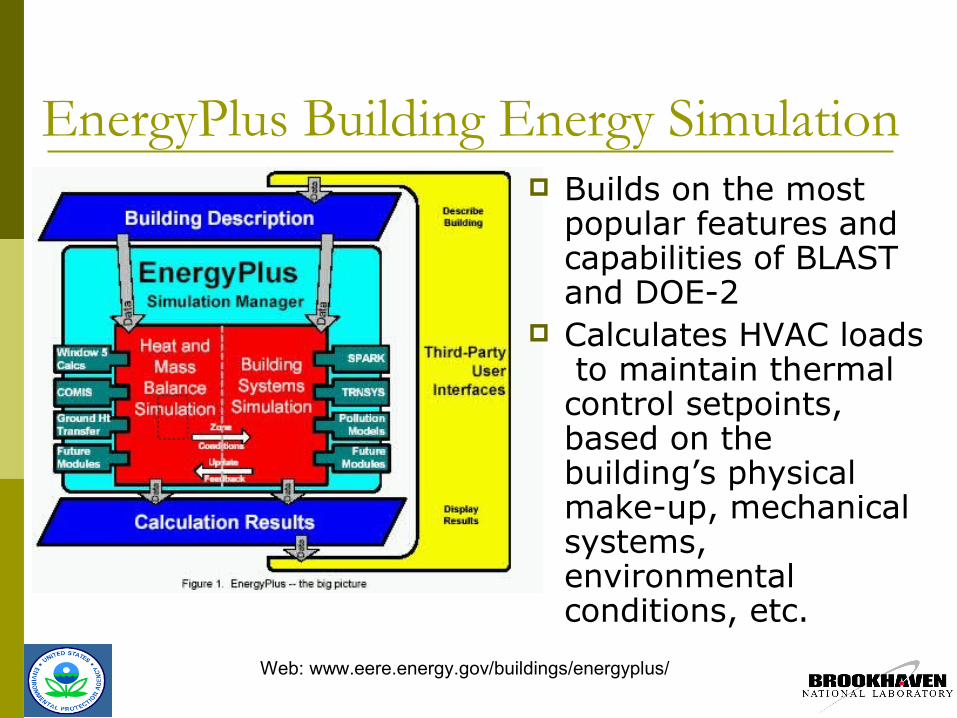
EnergyPlus Building Energy Simulation
Web: www.eere.energy.gov/buildings/energyplus/
Builds on the most popular features and capabilities of BLAST and DOE-2
Calculates HVAC loads to maintain thermal control setpoints, based on the building’s physical make-up, mechanical systems, environmental conditions, etc.

EnergyPlus/UHI: Building Mix
Maps Source: NYSERDA UHI Study

Building Inventory to Cooling DemandCOOLING DEMAND Older 3 Older 10 Glass 3 Glass 10
Peak
buildings - - - -
base (kW / sq meter) 0.019 0.066 0.028 0.095
deg & roof (kW / sq meter) 0.016 0.057 0.021 0.075
reduction -16% -13% -23% -21%
Daily
buildings - - - -
base (kW / sq meter) 0.30 1.01 0.38 1.27
deg & roof (kW / sq meter) 0.24 0.83 0.25 0.88
reduction -20% -18% -33% -31%
Prototype buildings were selected from the building inventory of the area to measure benefits of various mitigation measures
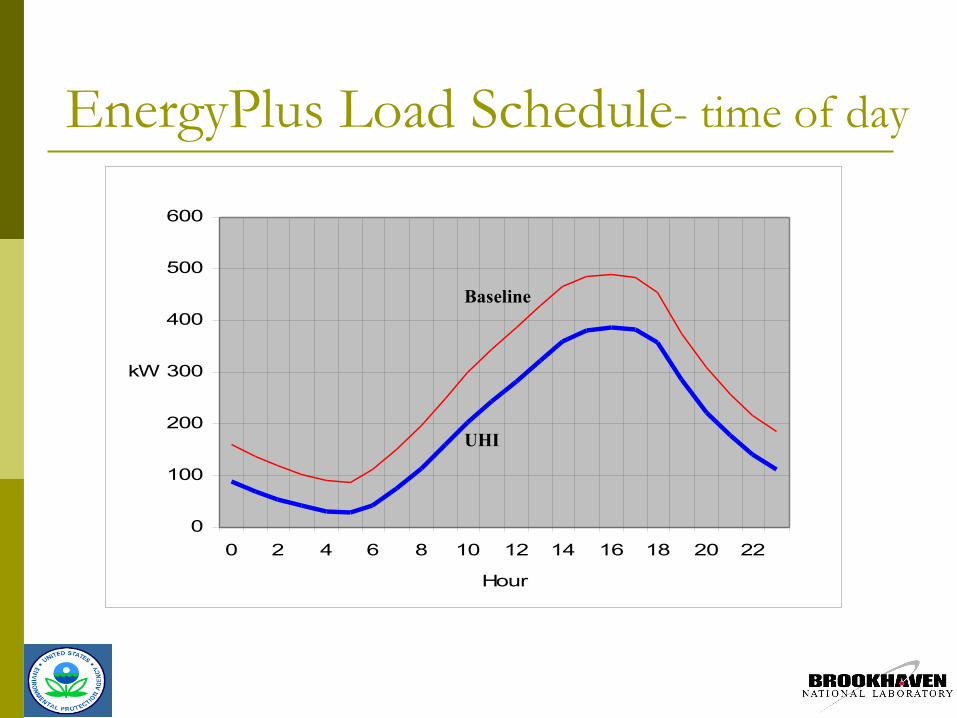
EnergyPlus Load Schedule- time of day
0
100
200
300
400
500
600
0 2 4 6 8 10 12 14 16 18 20 22
Hour
kW
UHI
Baseline

Energy Star Technologies

Key Benefits to the City Carbon
xx% reduction in carbon from Municipal facilities/sources by 2010
xx% reduction in carbon from the entire city by 2030 Energy
Reduction in energy use per capita Reduction in energy use intensity Increased use of renewable resources Decreased reliance on imported fossil fuels Increased use of efficient appliances/ green technology/etc. Decrease in energy for transportation
Sustainability Increase in recycling of solid waste Efficient and reliable transportation
Society Provide a clean environment for all city residents Keep energy costs as low as possible

Peaking Load for Low er Manhattan Sub-station
0
50
100
150
200
250
300
350
2005 2010 2015 2020 2025
Years
MW
BASE ESUHI1
Impacts of UHI Measures and Energy Star Technologies
Annual Electricity Consum ption for Low er Manhattan Sub-station
0
200,000
400,000
600,000
800,000
1,000,000
1,200,000
2005 2010 2015 2020 2025
Years
MW
h
BASE ESUHI1
UHI – Urban Heat Island effect
Peaking Load Reduction for New York City System
-120
-100
-80
-60
-40
-20
02005 2010 2015 2020 2025
Years
MW
Annual Electricity Savings for New York City System
-350,000
-300,000
-250,000
-200,000
-150,000
-100,000
-50,000
02005 2010 2015 2020 2025
Years
MW
h

NYC: Emission Reductions due to UHI Measures and Energy Star Technologies
Net Reductions in Criteria Pollutants for New York City
-180
-160
-140-120
-100
-80
-60-40
-20
02005 2010 2015 2020 2025
Years
Ton
NOX P10 SOX
Net CO2 Reductions for New York City
-45,000
-40,000
-35,000
-30,000
-25,000
-20,000
-15,000
-10,000
-5,000
02005 2010 2015 2020 2025
Years
Ton
CO2

Summary Urban system responses of alternative
strategies are complex and need a systematic integrated analysis
Adaptation to such a new concept can lead to cost-effective solutions to the long-term energy security and the environmental sustainability
BNL’s longstanding research and experience brings a paradigm shift in local energy and environmental planning
Such a comprehensive framework will provide us with a robust tool to address an upcoming need to tackle pressing urban energy and environmental issues worldwide