integrated transport strategy for the period until … · integrated transport strategy for the...
TRANSCRIPT
INTEGRATED TRANSPORT STRATEGY
FOR THE PERIOD UNTIL 2030
MAY 2017
Ministry of Transport, Information Technology and Communications
2
TABLE OF CONTENTS TABLE OF CONTENTS 2
I. INTRODUCTION 13
II. STRATEGIC FRAMEWORK 13 2.1 EUROPEAN UNION TRANSPORT POLICY 13 2.2. NATIONAL TRANSPORT POLICY 17 2.3 NATIONAL STRATEGIC DOCUMENTS 19 III. NATIONAL OBJECTIVES AND PRIORITIES 21
IV. SITUATION ANALYSIS 22 4.1 DATABASE 22
4.1.1 ORGANISATION FOR DATA COLLECTION 22 4.1.2 ASSESSMENT OF THE DATA 24 4.1.3 ELECTRONIC DATABASE 26
4.2 MACROECONOMIC, DEMOGRAPHIC AND SOCIAL ANALYSIS 28 4.2.1 MACROECONOMIC ANALYSIS 28 4.2.2 DEMOGRAPHIC ANALYSIS 34 4.2.3 SOCIAL ANALYSIS 39 4.2.4 INDUSTRY 40 4.2.5 INTERNATIONAL TRADE 50 4.2.6 TRASNPORT AND ENVIRONMENT 57
4.3 RAILWAY TRANSPORT 62 4.3.1 INSTITUTIONAL FRAMEWORK 62 4.3.2 PERFORMANCE AND VOLUME INDICATORS OF Rail TRANSPORT 62 4.3.3 MARKET STRUCTURE 66 4.3.4 RAILWAY INFRASTRUCTURE 81 4.3.5 ROLLING STOCK 87 4.3.6 SAFETY AND SECURITY 88 4.3.7 INTEROPERABILITY 88 4.3.8 INTELLIGENT TRANSPORT SYSTEMS 89
4.4 ROAD TRANSPORT 91 4.4.1 PERFORMANCE AND VOLUME INDICATORS OF ROAD TRANSPORT 91 4.4.2 MARKET STRUCTURE 91 4.4.3 ROAD INFRASTRUCTURE 105 4.4.4 SAFETY AND SECURITY 115 4.4.5 ANALYSIS OF THE ROAD VEHICLES STRUCTURE AND CONDITION 116
4.5 MARITIME AND INLAND TRANSPORT 117 4.5.1 INDICATORS FOR THE WORK AND VOLUME OF TRANSPORT IN THE PORTS 117 4.5.2 MARKET STRUCTURE OF SEA AND RIVER TRANSPORT 118 4.5.3 PORT INFRASTRUCTURE 120 4.5.5 ACCESIBILITY OF TRANSPORT SERVICeS 131 4.5.6 SAFETY AND SECURITY 133
4.6 TRANSPORT 135 4.6.1 PERFORMANCE AND VOLUME INDICATORS OF air TRANSPORT 135 4.6.2 MARKET STRUCTURE 138 4.6.3 AIRPORT INFRASTRUCTURE 149 4.6.4 AIRPLANES 163 4.6.5 SAFETY AND SECURITY 165 4.6.6 INTELLIGENT TRANSPORT SYSTEMS IN AIR TRANSPORT 166
4.7 INTERMODAL TRANSPORT 172 4.7.1 INTERMODAL TERMINALS 172 4.7.2 DEVELOPMENT OF INDUSTRIAL ZONES IN BULGARIA 176
4.8 TRANSPORT SERVICE QUALITY 177 4.8.1 FREIGHT TRANSPORT 177 4.8.2 PASSENGER TRANSPORT 179
4.9 STRENGTHS AND WEAKNESSES, OPPORTUNITIES AND THREATS OF THE TRANSPORT SECTOR 180
Ministry of Transport, Information Technology and Communications
3
V. FORECASTS OF THE DEMAND FOR TRANSPORT SERVICES 187 5.1. ASSESSMENT OF THE CURRENT DEMAND FOR TRANSPORT SERVICES 187 5.2 ASSESSMENT OF THE FUTURE DEMAND FOR TRANSPORT SERVICES 188
5.2.1 IDENTIFICATION OF THE FUTURE PASSENGER TRANSPORT NEEDS, WHICH WOULD OCCUR IN A FUTURE "DO NOTHING” SITUATION 188 5.2.2. IDENTIFICATION OF THE FUTURE FREIGHT TRANSPORT NEEDS, WHICH WOULD ARISE IN A FUTURE "DO NOTHING” SITUATION 190
5.3 FORECASTS OF FREIGHT TURNOVER AND PASSENGERS TRANSPORTED IN PORTS 192 5.4 FORECASTS FOR COMMODITIES AND PASSENGERS TRANSPORTED BY AIR 200 V. ASSESSMENT OF THE ADMINISTRATIVE CAPACITY 202 6.1 SCOPE AND METHODOLOGY OF THE ASSESSMENT OF THE ADMINISTRATIVE CAPACITY 202 6.2 MAIN FINDINGS AND CONCLUSIONS 205
6.2.1 IDENTIFIED PROBLEMS FOR ADMINISTRATIVE CAPACITY 205 6.2.2 GOOD PRACTICES AND METHODS IMPLEMENTED BY THE BENEFICIARIES 207 6.2.3 MEASURES FOR ENHANCING OF ADMINISTRATIVE CAPACITY FROM THE BENEFICIARIES 208 6.2.4 TRAINING NEEDS OF THE BENEFICIARIES 210
VII. OBJECTIVES AND MEASURES 212 7.1 METHODOLOGY FOR DETERMINING MEASURES 212 7.2 IDENTIFIED PROBLEM 214 7.3 PARTICULATE OBJECTIVES 216 7.4 MEASURES TO ACHIEVE SPECIFIC GOALS 218
7.4.1 MEASURES TO STRATEGIC OBJECTIVE 1 INCREASING THE EFFECTIVENESS AND COMPETITIVENESS OF THE TRANSPORT SECTOR 218 7.4.2 MEASURES TO STRATEGIC OBJECTIVE 2. IMPROVEMENT OF THE TRANSPORT CONNECTIVITY AND ACCESS (INTERNAL AND EXTERNAL) 224 7.4.3 MEASURES TO TRATEGIC OBJECTIVE 3. LIMITING THE NEGATIVE EFFECTS OF THE TRANSPORT SECTOR DEVELOPMENT. 227 7.4.4. INDICATORS FOR ASSESSMENT FOR OBJECTIVE ACHIEVEMENT 228
VIII. PROJECTS AND SCENARIOS 230 8.1. METHODOLOGY OF PROJECT IDENTIFICATION 230 8.2 LIST OF PROJECTS 235 8.3 BUDGET AND FINANCIAL PLAN FOR THE PROJECTS 242
Ministry of Transport, Information Technology and Communications
4
LIST OF TABLES Table 4-1 Medium-term GDP forecast Table 4-2 Long-term GDP forecast for the Republic of Bulgaria
Table 4-3 Distribution of the income per member of household by decile groups for 2014 and assessment of the differentiation and polarization thereof
Table 4-4 Main data for the processing industry Table 4-5 Number of countries partners and key partners by commodity groups for import and export
Table 4-6 Number of partner countries for import and export of the Top 20 partner countries by transport modes
Table 4-7 Structuring commodity groups for exports and imports by transport odes Table 4-8 Number of partner countries and key partners (Top 10) for import and export by structural groups Table 4-9 Number of delays of trains in 2015 when compared to 2010 Table 4-10 Unified classification of freight in transport (NST 20) Table 4-11 Average transport distance Table 4-12 Types of freight categorized in 10 groups Table 4-13 Values of the utility function Table 4-14 Values of the indicators for assessment of the concentration of the market Table 4-15 Share distribution of types of railways Table 4-16 List of railway lines part of the TEN-T network Table 4-17 Length of the railway network part of the TEN-T network
Table 4-18 NTP and MTP for 24-hours for railway sections of the railway network in Bulgaria for regular non-parallel and partial-block train schedule
Table 4-19 Maximal transportability
Table 4-20 Freight transported for hire or reward by road freight transport: domestic transport, import, export, and transit
Table 4-21 Freight transported by road freight transport by types of commodities and by regions (thousand tonnes)
Table 4-22 Passengers transported and performance of the road transport for the period 2012 -2015 Table 4-23 NRN length by road class as of 31.12.2015 (km) Table 4-24 Change in the length of the NRN by districts Table 4-25 Capacity and speed of the road vehicles in categories of road vehicles Table 4-26 Revenues from the road infrastructure Table 4-27 Main data from the existing port infrastructure of national significance in the region of Burgas Table 4-28 Main data from the existing port infrastructure of regional significance in the region of Burgas Table 4-29 Main data for port terminals of national significance in the region of VARNA Table 4-30 Main data for port terminals of regional significance in the region of VARNA Table 4-31 Main data for port terminals in the region of RUSE Table 4-32 Port terminals of national significance in the region of LOM and VIDIN Table 4-33 Capacity of ports of national and regional significance Table 4-34 Volume of international passenger transport carried by Bulgarian air carriers Table 4-35 Volume of domestic passenger transport carried by Bulgarian air carriers Table 4-36 Transport activity carried by “Bulgaria Air” for international regular transport Table 4-37 Transport activity carried by “Bulgaria Air” for international charter transport Table 4-38 Indicators of transport activity for regular domestic flights carried by “Bulgaria Air” AD Table 4-39 Indicators of transport activity for international charter flights carried by “Air Via” OOD Table 4-40 Indicators of the volume of international charter flights carried by “BH Air” Table 4-41 Indicators of the volume of international charter transport carried by “Bulgarian Air Charter” OOD Table 4-42 Indicators of the volume of international charter transport carried by “Heli Air” ООD Table 4-43 Indicators of the volume of international charter transport carried by „Air Max” ООD Table 4-44 Indicators of the volume of international charter transport carried by „Cargo Air” ООD Table 4-45 Air lines available to the population for the territory of the country Table 4-46 Information on the traffic at Sofia Airport Table 4-47 Information of the traffic at Varna Airport Table 4-48 Information on the traffic at Plovdiv Airport Table 4-49 Information on the traffic at Gorna Oryahovitsa Airport Table 4-50 Basic data for the aircraft fleet of the country
Table 4-51 Status, property and connections with other modes of transport of studied intermodal terminals in Bulgaria
Table 4-52 Design parameters of Plovdiv intermodal terminal

Ministry of Transport, Information Technology and Communications
5
Table 4-53 Container traffic (forecast) within the zone of influence of Ruse IMT Table 4-54 Priorities, projects and measures for development of industrial zones in Bulgaria Table 4-55 Utility function values Table 4-56 Strengths and weaknesses, opportunities and threats of the transport sector Table 5-1 Forecasts of container turnover by areas of planning and time sections Table 5-2 Forecasts for the packaged commodities, which can be transported in containers. Table 5-3 Forecast for the freight turnover of bulk cereals by ports Table 5-4 Copper concentrates, forecast of the export through the Bulgarian ports (tonnes) Table 5-5 Copper concentrates, forecast of the import through the Bulgarian ports (tonnes) Table 5-6 Forecast of the import freight turnover of coals (tonnes) Table 5-7 Forecast of the freight turnover of bulk commodities by ports (tonnes) Table 5-8 Forecast of the import of metals by ports Table 5-9 Forecast of the freight turnover for the export of metals and metal products by ports Table 5-10 Forecast of the export of sulphuric acid by ports Table 5-11 Forecast of the freight turnover in the import of machines by ports Table 5-12 Liquid fuels handled in the Bulgarian ports (tonnes) Table 5-13 Forecast of the development of sea cruises (passengers) Table 5-14 Forecast of the development of river cruises (passengers) Table 5-15 Forecast for the passengers serviced in Bulgarian airports and growth factors Table 6-1 Scope of the assessment of the administrative capacity Table 6-2 Plan for performing the administrative capacity assessment Table 6-3 Matrix of the used sources of data and the methods of the collection thereof
Table 6-4 Problems associated with the administrative capacity of the beneficiaries having general characteristics
Table 6-5 General problems associated with administrative capacity of the beneficiaries, during work on projects Table 6-6 Good practices and approaches for project implementation and management under OPTTI 2014 -2020 Table 6-7 Measures for enhancing administrative capacity which are the same for all beneficiaries Table 6-8 Priority training topics associated with the project cycle for the 8 beneficiaries Table 6-9 Priority training topics for specialized competences for all beneficiaries Table 6-10 Priority training topics for social and managerial competencies, contributing to project work Table 7-1 Distribution of problems by objectives
Table 7-2 Particulate objectives for achieving strategic objective 1 increasing the effectiveness and competitiveness of the transport sector
Table 7-3 Particulate objectives for achieving strategic objective 2. Improvement of the transport connectivity and access (internal and external)
Table 7-4 Particulate objectives for achieving strategic objective 3. limiting the negative effects of the transport sector development
Table 7-5 Measures to achieve Strategic Priority 1. Effective maintenance, modernization and development of transport infrastructure
Table 7-6 Measures to achieve Strategic priority 2. Improvement of the management of the transport system Table 7-7 Measures to achieve Strategic priority 3. Development of intermodal transport.
Table 7-8 Measures to achieve Strategic priority 4. Improvement of the conditions for implementation of the principles for liberalization of the transport market
Table 7-9 Measures to achieve Strategic priority 5.Reduction of the consumption of fuel and increasing the energy efficiency of transport
Table 7-10 Measures to achieve Strategic priority 6. Improvement of the connectivity of the Bulgarian transport system with the single European transport space.
Table 7-11 Measures to achieve Strategic priority 7. Ensuring quality and easily accessible transport in all re gions of the country
Table 7-12 Measures to achieve Strategic priority 8 Limiting the negative effects of transport on environment and people’s health
Table 7-13 Measures to achieve Strategic priority 9 Increasing security and safety of the transport sys tem Table 7-14 Indicators for assessment of the degree of achievement of objectives Table 8-1 Indicators for assessment of the scenarios for the implementation of infrastructure projects Table 8-2 Final ranking of scenarios
Table 8-3 Projects - Scenario B – structure, phases of implementation, implementation periods and indicative values of the included projects
Table 8-4 Budget for scenario В (in BGN)
Ministry of Transport, Information Technology and Communications
6
LIST OF FIGURES Figure 2-1 Strategic and normative framework of the transport sector
Figure 3-1 National strategic objectives and priorities for development of the transport sector
Figure 4-1 Data collecting process
Figure 4-2 Location of count points on the national road map
Figure 4-3 Location of railway stations where counts have been carried out
Figure 4-4 Locations of bus stations
Figure 4-5 Data systematization
Figure 4-6 Diagrams of the processes for assessment of the collected data according to criteria
Figure 4-7 Data Structure
Figure 4-8 Real GDP growth for the Republic of Bulgaria
Figure 4-9 Long-term forecasts for actual GDP growth of the Republic of Bulgaria
Figure 4-10 Long-term forecast of the real growth of GDP of Bulgaria by regions
Figure 4-11 Sorted GDP shares by regions
Figure 4-12 GDP shares by regions
Figure 4-13 Sorted GVA shares by regions
Figure 4-14 GVA shares by regions
Figure 4-15 Levels and dynamics of inflation
Figure 4-16 Unemployment coefficient
Figure 4-17 Tax burden on labour expenses
Figure 4-18 Main taxes
Figure 4-19 Number of births and deaths by years
Figure 4-20 International migration of the population
Figure 4-21 Coefficient of birth rate, death rate and natural growth
Figure 4-22 Distribution of the population by age
Figure 4-23 Long-term forecast for the population of the country for the period 2000 - 2070.
Figure 4-24 Forecast of GDP per capita for the country, by regions and by horizons
Figure 4-25 Main economic indicators - Mining Industry Sector
Figure 4-26 Main economic indicators – Processing Industry Sector
Figure 4-27 Industrial production indices
Figure 4-28 Turnover index
Figure 4-29 Turnover indices of the internal market
Figure 4-30 Turnover index of the international market
Figure 4-31 Reserve quantities and conditional provision by type of mineral resources
Figure 4-32 Mining production by type mineral resources
Figure 4-33 Map for the provided concession areas for raw material mining
Figure 4-34 Map of existing permits for exploration and/or research of mineral resources
Figure 4-35 Business demography of the Mining industry sector and Processing industry sector enterprises
Figure 4-36 Data for the coefficient for survival of the Mining and Processing industry sectors
Figure 4-37 Production and sale of Portland cement and other hydraulic cement in the domestic market
Figure 4-38 Production hand sale of milled cement "clinker" in the internal market
Figure 4-39 Realized export of cement, the Republic of Bulgaria
Figure 4-40 Data on the state of steel, production of rolled ferrous metals (production, domestic consumption and exports) to 2014
Figure 4-41 Data produced and marketed production of iron and steel
Figure 4-42 Data on output and its realization of ferrous metallurgy in Bulgaria.
Figure 4-43 Share of basic metals production of ferrous metallurgy in Bulgaria
Figure 4-44 Realized total exports of electrolytic copper
Figure 4-45 Realized export of produced main non-ferrous metals and rolled metal made of them
Ministry of Transport, Information Technology and Communications
7
Figure 4-46 Number of partner countries by commodity groups – exports and import (2007-2015)
Figure 4-47 Structure of the physical volume of export and import %
Figure 4-48 Export and import by commodity groups (EU-INTRA, EU-EXTRA)
Figure 4-49 Structure of the physical volume of imports and exports by transport modes for countries outside of the EU, %
Figure 4-50 Total imports and exports by transport modes and by commodity groups in physical units (tons), 2007-2015
Figure 4-51 Total imports and exports by transport modes and by commodity groups in percent (2007-2015)
Figure 4-52 Average value of imports and exports by commodity groups in total за Transport sector (2007 -2015)
Figure 4-53 Final energy consumption by sectors, thous. t.n.e. (2007-2014)
Figure 4-54 Structure of final energy consumption by transport modes
Figure 4-55 Share of renewable energy for the gross domestic consumption of energy
Figure 4-56 Share of renewable energy in fuel consumption for transport (2007-2014)
Figure 4-57 Consumption of fuel in the road transport (2007-2014)
Figure 4-58 Structure of fuel consumption in road transport (2007-2014)
Figure 4-59 Greenhouse gas emissions (2007-2013)
Figure 4-60 Share of greenhouse gases from the transport sector when compared in general emissions, mln. tons(2007-2013)
Figure 4-61 Precursors of acidifying substances Transport sector (2000-2014)
Figure 4-62 Share of emissions of acidifying substances Transport sector in national emissions (2000 -2014)
Figure 4-63 Share of ozone precursor emissions from sector Transport in national emissions (2000-2014)
Figure 4-64 Share of the emissions of the Transport sector for the national emissions of ozone precursors (2000-2014
Figure 4-65 Precursors of fine particles in the Transport sector (2000-2014)
Figure 4-66 Share of fine particle in the national emissions (2000-2014)
Figure 4-67 Volume of freight by carriers
Figure 4-68 Work performed by carriers
Figure 4-69 Passengers in domestic and international traffic by transport modes
Figure 4-70 Passenger kilometres in the domestic and international traffic by transport modes
Figure 4-71 Comparison of the market shares of the cargo transported by railway transport for 2013 and 2014
Figure 4-72 Freight trains set in the 2014 - timetable
Figure 4-73 Freight train shares (by number and train-kilometres) by categories set in the 2014-timetables
Figure 4-74 Dynamics of the passengers transported by public road transport
Figure 4-75 Dynamics of the market shares of the passengers transported by the bus and railway transport
Figure 4-76 Dynamics of the realized passenger kilometres by the public road transport
Figure 4-77 Dynamics of the market shares of the realized passenger kilometres by the bus and railway transport
Figure 4-78 Passenger trains set in the 2014 timetables
Figure 4-79 Shares of passenger trains (by number and train kilometres) by categories set in the 2014-timetables
Figure 4-80 Transported passengers under PSO for the period 2010-2015
Figure 4-81 Pkm. reached under PSO for the period 2010-2015.
Figure 4-82 Transported passengers using MRST for the period 2010-2015
Figure 4-83 Pkm. reached using MRST for the period 2010-2015
Figure 4-84 Transported passengers with amusement travel for the period 2010-2015
Figure 4-85 Pkm.’s reached with amusement travel for the period 2010-2015
Figure 4-86 Transported passengers using international transportations for the period 2010-2015
Figure 4-87 Pkm. reached using international transportations for the period 2010-2015
Figure 4-88 Comparison of transportations by categories of trains, distributed by travel distance for 2014
Ministry of Transport, Information Technology and Communications
8
Figure 4-89 Total transported passengers by months for 2010 and 2014
Figure 4-90 Transported passengers by PT by months for 2014
Figure 4-91 Transported passengers by FT by months for 2014
Figure 4-92 Transported passengers by AFT by months for 2014
Figure 4-93 Volume of freight transportations for 2013
Figure 4-94 Volume of freight transportations for 2014
Figure 4-95 Tonnage transported in in-country and international communication
Figure 4-96 Work carried out in in-country and international communication
Figure 4-97 Tons of freights transported by BDZ - FT for the period 2007-2016 by 10 types of freights.
Figure 4-98 Tons/km achieved by BDZ - FT for the period 2007-2016 by 10 types of freights.
Figure 4-99 Values of the individual indicators comprising the utility function for the railway freight transport
Figure 4-100 Values of the utility function by types of freight transport
Figure 4-101 Market shares in %, based on volume of freight transportations
Figure 4-102 Market shares in %, based on work performed
Figure 4-103 Map of the railway network of the Republic of Bulgaria
Figure 4-104 Number and structure of loaded vehicles by types (HGV, MGV, LGV, Trailers) and by zones of loading
Figure 4-105 Annual average daily road traffic - generated trips by passenger cars
Figure 4-106 National bus transport network
Figure 4-107 Number of bus lines by zones of origin of the national transport system
Figure 4-108 Number of trips by bus per day in areas under the national transport system
Figure 4-109 Annual average daily bus traffic under the national transport system
Figure 4-110 Time daily profile of bus traffic (international and under the national transport system)
Figure 4-111 Average daily bus traffic realized, including international buses, buses included in the national transport system, and buses included in the regional transport systems
Figure 4-112 Goods transported by road transport for own account, domestic transport
Figure 4-113 Goods transported by road transport for hire or reward, domestic transport
Figure 4-114 Goods transported by road transport for own account, international transport
Figure 4-115 Goods transported by road transport for hire or reward, international transport
Figure 4-116 Average distance travelled, domestic transport
Figure 4-117 Average distance travelled, international transport
Figure 4-118 Shares of freight loaded (thousand tonnes) by types for each region, transported by road
Figure 4-119 NRN density based on the area (km/1000 sq.km)
Figure 4-120 Road condition by districts
Figure 4-121 Map of the locations of bus stations and stops
Figure 4-122 Assessment and ranking of the districts by the road infrastructure condition development
Figure 4-123 Dynamics of change in total freight turnover at ports for the period 2007 - 2015 and its distribution between sea and river ports
Figure 4-124 Total passenger flow and distribution by sea and river ports
Figure 4-125 Structure of freight turnover at sea ports by means of transport
Figure 4-126 Capacity of ports
Figure 4-127 Relative share of air transport in the total number of transported passengers by Bulgarian carriers
Figure 4-128 Relative share of air transport in the total volume of passenger transport operations performed by Bulgarian carriers
Figure 4-129 Change in the number of passengers transported, the transport operations carried and th e average distance travelled per one passenger by air transport compared to 2007.
Figure 4-130 Number of passengers serviced at Bulgarian airports
Figure 4-131 Change in the number of passengers serviced at Bulgarian airports compared to 2007.
Figure 4-132 Dynamics of passenger traffic at Bulgarian airports by years compared to the previous year
Ministry of Transport, Information Technology and Communications
9
Figure 4-133 Change in the indicators for volume of international regular transport carried by “Bulgaria Air” compared to 2007
Figure 4-134 Change in the volume of international charter transport carried by “Bulgaria Air” compared to 2007
Figure 4-135 Change in the volume of regular domestic transport carried by “Bulgaria Air” compared to 2007
Figure 4-136 Change in the volume of transport carried by “Air Via” compared to 2007
Figure 4-137 Change in the indicators for volume of international charter transport carried by “BH Air” compared to 2007
Figure 4-138 Change of the indicators for volume of charter transport carried by “Bulgarian Air Charter” compared to 2007
Figure 4-139 Change in the number of aircraft movements at Sofia Airport compared to 2007.
Figure 4-140 Change in the number of passengers served at Sofia Airport compared to 2007.
Figure 4-141 Change in the quantities of freight serviced at Sofia Airport compared to 2007.
Figure 4-142 Change in the number of aircraft movements at Burgas Airport compared to 2007.
Figure 4-143 Change in the number of passengers services at Burgas Airport compared to 2007
Figure 4-144 Change in the quantities of freight serviced at Burgas Airport compared to 2007.
Figure 4-145 Change in the number of aircraft movement at Varna Airport compared to 2007.
Figure 4-146 Change in the number of passengers serviced at Varna Airport compared to 2007.
Figure 4-147 Change in the quantities of freight services at Varna Airport compared to 2007
Figure 4-148 Change in the number of aircraft movements at Plovdiv Airport compared to 2007
Figure 4-149 Change in the number of passengers serviced at Plovdiv Airport compared to 2007
Figure 4-150 Change in the quantities of freight serviced at Plovdiv Airport compared to 2007
Figure 4-151 Change in the number of aircraft movements at Gorna Oryahovitsa Airport compared to 2007
Figure 4-152 Change in the number of passengers serviced at Gorna Oryahovitsa Airport compared to 2007.
Figure 4-153 Change in the number of airplanes, passenger seats and hours flown by transport a viation compared to 2007
Figure 4-154 Change in the average number of seats in one airplane and the average number of hours flown per one airplane compared to 2007
Figure 4-155 Location of studies intermodal terminals in Bulgaria
Figure 4-156 Zones of influence of Ruse IMT
Figure 4-157 Values of the individual factors included in the utility function for the road freight transport
Figure 4-158 Values of the utility functions by transport modes based on the interviews conducted for 2015
Figure 4-159 Values of the utility functions by transport modes
Figure 4-160 Graphical representation of the strengths.
Figure 4-161 Graphical representation of the weaknesses.
Figure 4-162 Graphical representation of the opportunities
Figure 4-163 Graphic presentation of threats
Figure 4-164 Strategic framework.
Figure 5-1 Forecast of the passengers transported by type of transport
Figure 5-2 Growth factors of passengers transported by type of transport
Figure 5-3 Forecast of the transport work for the domestic land freight transport
Figure 5-4 Growth factors of the transport work by type of transport
Figure 5-5 Forecast of the commodities transported for the domestic land freight transport
Figure 5-6 Growth factors of commodities transported by type of transport
Figure 5-7 Figure 5-7 Forecast of the transport work for the international land freight transport
Figure 5-8 Growth factors of the transport work by type of transport
Figure 5-9 Forecast of the transport work for the international land freight transport
Figure 5-10 Growth factors of the transport work by type of transport
Figure 6-1 Number of survey participants in the 8 beneficiaries
Figure 6-2 Number of interviewed managers
Ministry of Transport, Information Technology and Communications
10
Figure 7-1 Logical and functional links between the objectives, problems and measures
Figure 7-2 Process for determination of the connections between objectives, problems and measures.
Figure 7-3 Distribution of problems by functional range
Figure 7-4 Distribution of problems by impact nature
Figure 8-1 Process for identification of projects and scenarios for the development of the integrated transport system
Figure 8-2 Budget for Scenario B by financing source
Figure 8-3 Budget for Scenario B
Figure 8-4 Budget for Scenario B by financing sources only from operation programmes and CEF
Figure 8-5 Budget for Scenario B only from operation programmes and CEF
Figure 8-6 Budget for Scenario B by time periods
ABBREVIATIONS AC ADMINISTRATIVE CAPACITY
AFT ACCELERATED FAST TRAIN
AISMS AIRPORT SOFIA SAFETY MANAGEMENT SYSTEM
BATSA BULGARIAN AIR TRAFFIC SERVICES AUTHORITY
BDZ BULGARIAN STATE RAILWAYS
BDZ-FT BDZ – FREIGHT TRANSPORT
BDZH BDZ HOLDING
BDZ-PT BDZ – PASSENGER TRANSPORT
BPIC BULGARIAN PORTS INFRASTRUCTURE COMPANY
CCTV CLOSED-CIRCUIT TELEVISION SUPERVISION CAMERAS FOR THE TRAFFIC CONDITIONS FROM THE TRAFFIC MANAGEMENT CENTER
CEF CONNECTING EUROPE FACILITY
CF COHESION FUND
CPCP CENTRALIZED PASSENGER CONTROL POINT
CPPO CONTRACT FOR PUBLIC PROCUREMENT OBLIGATIONS
CRC COMPUTER ROUTING CENTRALIZATION
DFT DIRECT FREIGHT TRAINS
DG CAA DIRECTORATE GENERAL CIVIL AVIATION ADMINISTRATION
EA EXECUTIVE AGENCY
EAEMDR EXECUTIVE AGENCY FOR EXPLORATION AND MAINTENANCE OF THE DANUBE RIVER
EAMA EXECUTIVE AGENCY MARITIME ADMINISTRATION
EARA EXECUTIVE AGENCY ROAD ADMINISTRATION
EARA EXECUTIVE AGENCY RAILWAY ADMINISTRATION
EC EUROPEAN COMMISSION
EFA EXECUTIVE FOREST AGENCY
EIA ENVIRONMENT IMPACT ASSESSMENT
EAFDRA EUROPEAN AGRICULTURAL FUND FOR DEVELOPMENT OF RURAL AREAS
ERDF EUROPEAN REGIONAL DEVELOPMENT FUND
ERTMS EUROPEAN RAILWAY TRAFFIC MANAGEMENT SYSTEM
ESF EUROPEAN STRUCTURAL FUNDS
ESIF EUROPEAN STRUCTURAL AND INVESTMENT FUNDS
ETCS EUROPEAN TRAIN CONTROL SYSTEM
FAB FUNCTIONAL AIRSPACE BLOCK
FAO FOOD AND AGRICULTURAL STATISTICS OF THE UNITED NATIONS
FT FAST TRAIN
Ministry of Transport, Information Technology and Communications
11
FTMR FAST TRAIN WITH MANDATORY RESERVATION
GSF GENERAL STRATEGIC FRAMEWORK
GAV GROSS ADDED VALUE
GDP GROSS DOMESTIC PRODUCT
GS GROSS SALARY
IATA INTERNATIONAL AIR TRANSPORT ASSOCIATION
IDFT INTERNATIONAL DIRECT FREIGHT TRAINS
IFI INTERNATIONAL FINANCIAL INSTITUTIONS
IFT INTERNATIONAL FAST TRAIN
IM INFRASTRUCTURE MANAGER
LFTK LOCAL FREIGHT TRAINS
LPSIWPRB LAW ON MARITIME SPACES, INLAND WATERWAYS AND PORTS OF THE REPUBLIC OF BULGARIA
LWAEPP LAW ON WEAPONS, AMMUNITION, EXPLOSIVES AND PYROTECHNIC PRODUCTS
MCA MULTI-CRITERIA ANALYSIS
MRDPW MINISTRY OF REGIONAL DEVELOPMENT AND PUBLIC WORKS
MTITC MINISTRY OF TRANSPORT, INFORMATION TECHNOLOGY AND COMMUNICATIONS
MTP MASTER TRANSPORT PLAN FOR BULGARIA
NF NATIONAL FUNDS
NRIC NATIONAL RAILWAY INFRASTRUCTURE COMPANY
NRP NATIONAL REFORM PROGRAMME
NSA NATIONAL SAFETY AUTHORITY
NSTR SINGLE NOMENCLATURE OF GOODS FOR THE TRANSPORT STATISTICS OBJECTIVES
OPRG OPERATIONAL PROGRAMME REGIONS IN GROWTH
OPT OPERATIONAL PROGRAMME TRANSPORT 2007-2013
OPTTI OPERATIONAL PROGRAMME TRANSPORT AND TRANSPORT INFRASTRUCTURE 2014-2020
PA PARTNERSHIP AGREEMENT
PM PARTICULATE MATTER
PPA PUBLIC PROCUREMENT ACT
PPO PUBLIC PROCUREMENT OBLIGATIONS
PPP PUBLIC-PRIVATE PARTNERSHIP
PT PASSENGER TRAIN
RER RENEWABLE ENERGY RESOURCES
RIA ROAD INFRASTRUCTURE AGENCY
RRN REPUBLICAN ROAD NETWORK
RSKI RELAY SYSTEM WITH KEY INTERCONNECTIONS
RTL RAILWAY TRANSPORT LAW
SEA STRATEGIC ENVIRONMENTAL ASSESSMENT
SES SINGLE EUROPEAN SKY
SIB SOCIAL INSURANCE BENEFITS
SITC STANDARD INTERNATIONAL TRADE CLASSIFICATION
SMS SAFETY MANAGEMENT SYSTEM
SPT SUBURBAN PASSENGER TRAIN
TA TRAFFIC ACCIDENT
TO THEMATIC OBJECTIVE
TEN-T TRANS-EUROPEAN TRANSPORT NETWORK
TEU TWENTY-FOOT EQUIVALENT UNIT
Ministry of Transport, Information Technology and Communications
12
TMCM TRAIN MOVEMENT AND CAPACITY MANAGEMENT
TMS TRAIN MOVEMENT SCHEDULE
TSI TECHNICAL SPECIFICATION FOR INTEROPERABILITY
TSIs TECHNICAL SPECIFICATIONS FOR INTEROPERABILITY
TSMS TRAIN SAFETY MANAGEMENT SYSTEM
UMISEUSI UNIFIED MANAGEMENT INFORMATION SYSTEM FOR THE EU STRUCTURAL INSTRUMENTS
UNFCCC UNITED NATIONS FRAMEWORK CONVENTION ON CLIMATE CHANGE. THE UNITED NATIONS FRAMEWORK CONVENTION ON CLIMATE CHANGE
USCRN UNIFIED SYSTEM FOR CONTROL OF THE RAILWAY NETWORK
VAT VALUE ADDED TAX
VTMIS VESSEL TRAFFIC MANAGEMENT INFORMATION SYSTEM
WLT WORK LABOR TRAIN
ЕО EUROPEAN COMMUNITY
ЕС EUROPEAN UNION
TOM TRAFFIC OPERATION AND MANAGEMENT
Ministry of Transport, Information Technology and Communications
13
I. INTRODUCTION
The Integrated Transport Strategy for the period until 2030 represents a comprehensive plan for sustainable development of the transport system of the Republic of Bulgaria and a framework for investments in transport.
The document complies with the requirements for the scope, structure and content of a comprehensive transport plan and complies with the applicable thematic prerequisites for ESIF for the period 2014-2020 undertaken as a commitment in the Partnership Agreement with the Republic of Bulgaria.
The strategy defines the contribution of the Republic of Bulgaria to the Single European Transport Area in accordance with the general priorities under Article 10 of Regulation (EU) No. 1315/2013 of the European Parliament and the Council, including priorities for investments in primary and extended TEN-T network in secondary connectivity.
With the development of the Integrated Transport Strategy for the period until 2030 the following specific objectives have been achieved:
A database required for the analysis of the transport sector for forecast of the development of the transport system and for the development of a national transport model;
A detailed analysis of the needs of the transport sector was performed, including road transport, railway transport, inland waterways transport, maritime transport, air and intermodal transport;
A national multi-modal transport model was developed;
National strategic objectives and strategic priorities have been defined;
Appropriate measures to achieve the objectives have been formulated;
A list of realistic projects was proposed, planned for financing from CF and ERDF (with the relevant timetable, budget and funding sources);
Based on the analyses performed are measures were proposed to develop the administrative capacity of the beneficiaries to prepare and implement the planned projects;
A Strategic Environmental Assessment (SEA) of the Integrated Transport Strategy was prepared for the period until 2030, according to the requirements of Art. 29, para. 1 of the Ordinance on the conditions and procedure for carrying out ecological assessment of plans and programs, which has been approved by the MoEW. The statement regarding EA No 1-1/2017 and the conditions and measures set out therein form an integral part of ITS, in particular Report 7. These will be applied to all plans, programs, projects and investment proposals relevant to or stemming from the strategy and will be taken into account in their design and implementation phases.
II. STRATEGIC FRAMEWORK
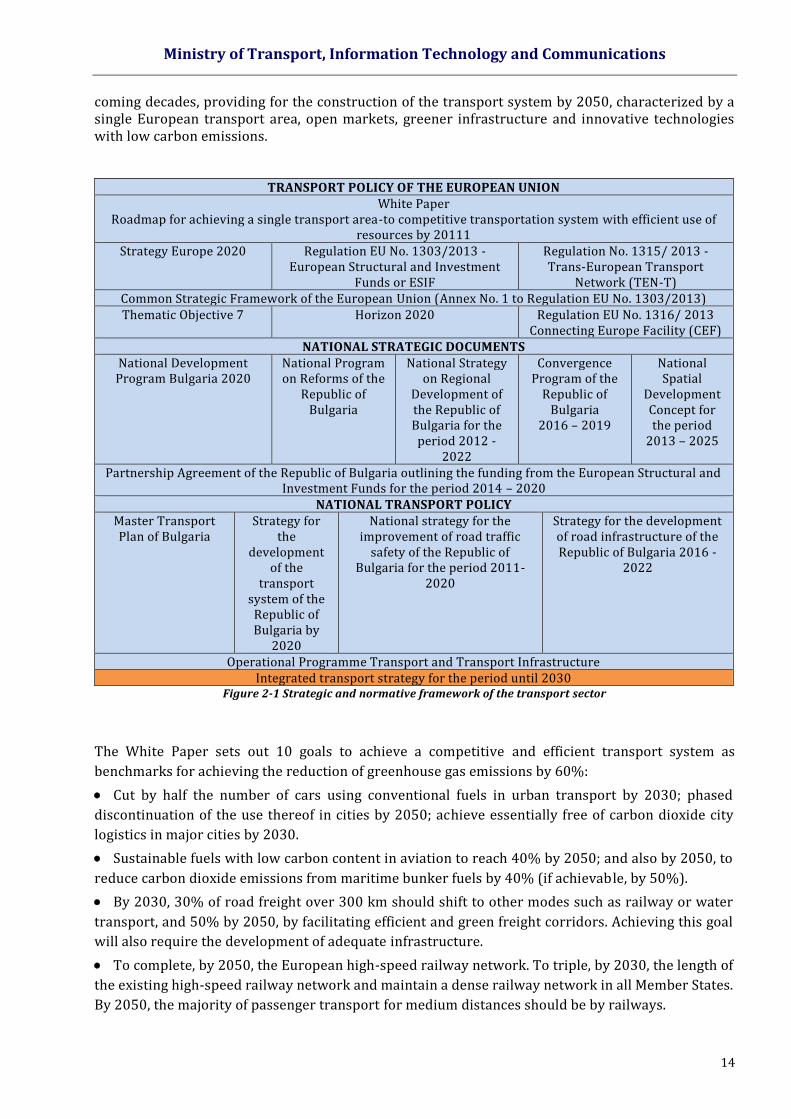
The Integrated Transport Strategy for the period until 2030 has been developed in compliance with the principles of consistency, continuity and synergy with national and European strategic documents. The framework of defining the strategic objectives and priorities for the development of the transport system for the period until 2030 is determined by the strategic objectives and priorities of the EU transport policy; the national transport policy and the relevant strategic and legal documents (Figure 2-1).
2.1 EUROPEAN UNION TRANSPORT POLICY
White Paper The White Paper "Roadmap to a Single European Transport Area - Towards a competitive and efficient transport system resource use" from 2011 is the main European strategic document outlining the guidelines for the development of transport. It describes the European Commission plans for the
Ministry of Transport, Information Technology and Communications
14
coming decades, providing for the construction of the transport system by 2050, characterized by a single European transport area, open markets, greener infrastructure and innovative technologies with low carbon emissions.
TRANSPORT POLICY OF THE EUROPEAN UNION White Paper
Roadmap for achieving a single transport area-to competitive transportation system with efficient use of resources by 20111
Strategy Europe 2020 Regulation EU No. 1303/2013 - European Structural and Investment
Funds or ESIF
Regulation No. 1315/ 2013 - Trans-European Transport
Network (TEN-T) Common Strategic Framework of the European Union (Annex No. 1 to Regulation EU No. 1303/2013) Thematic Objective 7 Horizon 2020 Regulation EU No. 1316/ 2013
Connecting Europe Facility (CEF) NATIONAL STRATEGIC DOCUMENTS
National Development Program Bulgaria 2020
National Program on Reforms of the
Republic of Bulgaria
National Strategy on Regional
Development of the Republic of Bulgaria for the
period 2012 - 2022
Convergence Program of the
Republic of Bulgaria
2016 – 2019
National Spatial
Development Concept for the period
2013 – 2025
Partnership Agreement of the Republic of Bulgaria outlining the funding from the European Structural and Investment Funds for the period 2014 – 2020
NATIONAL TRANSPORT POLICY Master Transport Plan of Bulgaria
Strategy for the
development of the
transport system of the Republic of Bulgaria by
2020
National strategy for the improvement of road traffic
safety of the Republic of Bulgaria for the period 2011-
2020
Strategy for the development of road infrastructure of the Republic of Bulgaria 2016 -
2022
Operational Programme Transport and Transport Infrastructure Integrated transport strategy for the period until 2030
Figure 2-1 Strategic and normative framework of the transport sector
The White Paper sets out 10 goals to achieve a competitive and efficient transport system as
benchmarks for achieving the reduction of greenhouse gas emissions by 60%:
Cut by half the number of cars using conventional fuels in urban transport by 2030; phased
discontinuation of the use thereof in cities by 2050; achieve essentially free of carbon dioxide city
logistics in major cities by 2030.
Sustainable fuels with low carbon content in aviation to reach 40% by 2050; and also by 2050, to
reduce carbon dioxide emissions from maritime bunker fuels by 40% (if achievable, by 50%).
By 2030, 30% of road freight over 300 km should shift to other modes such as railway or water
transport, and 50% by 2050, by facilitating efficient and green freight corridors. Achieving this goal
will also require the development of adequate infrastructure.
To complete, by 2050, the European high-speed railway network. To triple, by 2030, the length of
the existing high-speed railway network and maintain a dense railway network in all Member States.
By 2050, the majority of passenger transport for medium distances should be by railways.
Ministry of Transport, Information Technology and Communications
15
A fully functional and EU-wide multimodal core network for the TEN-T program by 2030, high-
quality network with greater capacity by 2050 and a corresponding set of information services.
By 2050, all central network airports to be connected to the railway network, preferably the high-
speed one. To ensure adequate connection of all central network ports to the railway freight network
and, where possible, the inland waterways system.
Implementation of a modernized infrastructure for air traffic management (SESAR) in Europe by
2020 and completion of the Single European Aviation Area. Implementation of equivalent systems for
managing road and water transport (ERTMS, ITS, SSN and LRIT, RIS). Commissioning of the European
Global Navigation Satellite System (Galileo).
To create a framework of a European system for information, management and payments in
multimodal transport by 2020.
Attempt to achieve zero fatalities in road transport by 2050. In line with this objective, the EU aims
to reduce in half road accident casualties by 2020. The EU can become a world leader in safety and
security for all kinds of transport.
To extend the implementation of the "user pays" and "polluter pays" principles and the
involvement of the private sector in the elimination of violations (including harmful subsidies),
generate revenues and ensure financing for future transport investments.
Europe 2020 Strategy
The Europe 2020strategy constitutes the political framework for the European Union for the period until 2020, according to which five main objectives have to be achieved in the areas of employment, research and development, climate change, energy, education, social inclusion and poverty reduction. The objectives of the strategy are supported by seven flagship initiatives for "Smart Growth" (Program of the Digital Agenda for Europe, Innovation Union, Youth on the Move), "Sustainable growth" (Europe on efficient use of resources, industrial policy for the era of globalization and “Inclusive growth” (Agenda for new skills and jobs, an European platform against poverty).
Regulation (ЕU) No. 1303/2013
Regulation (EU) No. 1303/2013 defines certain common provisions to the "European structural and investment funds" (ESIFs). There are eleven thematic objectives defined of ESIFs and the Common Strategic Framework of the EU (CSF). For each of the thematic objectives there are key objectives to be achieved, key actions for each CSF Fund and corresponding general principles for implementation to ensure effective and efficient use of funds.
TS7 "Promoting sustainable transport and removing bottlenecks in key network infrastructures." Is directly related to the transport sector.
Trans European Transport Network (TEN-T)
The guidelines for the development of the Trans-European Transport Network are defined in Regulation No. 1315/2013 of the European Parliament and the Council. The defined objectives are aimed at cohesion, efficiency, sustainability and maximizing of the benefits for network users.
Policy development of transport infrastructure across modes and provides for structuring the network at two levels: a core network (including the most important EU transport links and nodes that should be implemented by 2030); a comprehensive network (provides full coverage of the EU territory and should be completed by 2050).

Ministry of Transport, Information Technology and Communications
16
The main TEN-T network on the territory of Bulgaria includes: – directions of the Pan-European Transport Corridors (Rhine-Danube – the Danube River inland
waterway, the ports of Vidin and Ruse and the intermodal terminals in Ruse Orient/East Mediterranean - railway and road route in the directions Vidin - Sofia - Kulata and Sofia - Plovdiv – Burgas/Svilengrad (Turkish border);
– Railway direction Sofia - Gorna Oryahovitsa - Ruse - Bucharest; – Road direction Sofia - Veliko Tarnovo - Ruse - Bucharest.
The map of the comprehensive network, in addition to the directions and nodes in the TEN-T existing map, includes the following new proposals: five new traffic routes - the direction of Sofia - Veliko Tarnovo - Sofia – Varna, Rila Speed Road, the direction Kiustendil - Dupnitsa - Samokov – Bogoroditsa Road Junction – Trakia Motorway/Hemus Motorway, Speed Road I-2 Ruse – Shumen, Speed Road Varna - Durankulak and the Plovdiv – Rudozem road, Port Silistra. This also includes the railway links to Varna.
From a national point of view, the road sections of regional importance linking secondary and tertiary nodes to the TEN-T network will also be developed. These road sections are included in the Methodology and Criteria for Prioritization of Road Sections, which was approved by RIA in February 2015 and was prepared on the basis of the Strategy for the Development of Road Infrastructure of the Republic of Bulgaria 2016-2022 and the Mid-Term Operational Program for its implementation. The road sections are included in the scope of priority axis 7 “Regional Road Infrastructure” of OPRG 2014-2020. The total value of priority axis 7 is BGN 380 461 585.94.
The implementation of the network is supported by the CF, the Connecting Europe Facility (CEF) and the ERDF, which can be supplemented by investment from the EAFRD for the transport infrastructure and the transport services at local level and in rural areas.
The nodes of the core and the comprehensive network on the territory of the Republic of Bulgaria are presented in Table 2-1.
Table 2-1 Nodes of the core and the comprehensive TEN-T network on the territory of the Republic of Bulgaria
TEN-T network
AIRPORTS MARITIME
PORTS INLAND WATERWAYS
PORTS RAILWAY-ROAD
TERMINALS
Co
re
Sofia Burgas
Ruse Gorna Oryahovitsa
Plovdiv
Vidin Ruse
Sofia
Co
mp
reh
en
siv
e
Burgas
Varna
Lom Dragoman
Gorna Oryahovitsa Oryahovo
Plovdiv Silistra Svilengrad
Varna Svishtov
General strategic framework of the EU:
The Common Strategic Framework (Annex 1 to Regulation (EU) No. 1303/2013) provides the basis for better coordination between ESIFs and other instruments.
The political commitments made in the Europe 2020 strategy are coordinated, through the CSF, with actual investments and promote integration between funds. The framework provides a source of strategic guidance to Member States and the regions to implement the programming of funds with a view to their specific needs, opportunities and challenges.
Horizon 2020
Ministry of Transport, Information Technology and Communications
17
The Horizon 2020 is the EU Framework Programme for Research and Innovation. The Societal Challenges Priority support research and innovation in areas such as climate, environment and transport. The objective for smart, green and integrated transport program Horizon 2020 provides budget to support the development of resource efficient transport that respects the environment.
Connecting Europe Facility
The Connecting Europe Facility funds projects which fill the missing links in the energy, transport and digital structure of Europe. The tool also helps the European economy to become greener by promoting cleaner transport modes, high-speed broadband connections and ease of use of renewable energy in accordance with the Europe 2020 Strategy.
CEF Transport will fund co-financed projects under the TEN-T and projects of "common interest", such as infrastructure projects with high added value for the EU. These infrastructure investments can work together in projects financed by the ERDF, CF and EAFRD affecting other parts of the TEN-T core network as well as the comprehensive network.
Partnership Agreement
The Partnership Agreement with Bulgaria was prepared according to the Common Strategic Framework of the European Union, the specific recommendations of the Council for 2012 and 2013 and the EC's position on negotiations with the Republic of Bulgaria for the programming period 2014-2020.
In the Partnership Agreement, on the grounds of the critical points for the development of Bulgaria and the identified prerequisites for growth, in line with the Europe 2020 Strategy, there are formulated four strategic priorities for ESIFs for the 2014-2020 period. The development of the transport sector within the scope of Priority 3: Connectivity and green economy for sustainable growth, which covers the following sub-priorities: Connectivity (external and internal); Moving to a low carbon economy; Energy and resource efficiency; Climate and climate change, prevention and risk management"; "Environment and protection of natural wealth."
The SP includes thematic objectives by which Bulgaria will contribute to the objectives of the Europe 2020 strategy for smart, sustainable and inclusive growth. The selection was based on three sets of criteria: development needs, regulatory commitments as a Member State and development potential and opportunities for achievement.
The preconditions set out in the SP are requirements for the implementation of the thematic objectives, which are a prerequisite for receiving financial assistance for the 2014 - 2020 period.
2.2. NATIONAL TRANSPORT POLICY
Strategy for development of the transport system of the Republic of Bulgaria until 2020
The mission formulated in the Strategy for the transport sector is to:
promote the economic and social development of the country by: - Providing efficient (with full benefits), effective (at minimal cost) and sustainable (with a minimum
of external influences) transport. - Supporting balanced regional development. - Assisting in the full integration of the country into European structures, taking into account the
crossroads position of Bulgaria and its transit potential. The strategic objectives of the policy in the transport sector until 2020 are as follows: - Achieving cost-effectiveness; - Development of a sustainable transport sector; - Improvement of regional and social development and commitment. The strategic priorities of the transport sector until 2020 are as follows:
Ministry of Transport, Information Technology and Communications
18
- Effective maintenance, modernization and development of transport infrastructure; - Integration of the Bulgarian transport system in Europe; - Transparent and harmonized conditions for competition in the transport market. Providing better
business environment; - Provide adequate funding for the operation and development of the transport sector. Effective use
of EU funds; - Limiting the negative impact of transport on the environment and human health; - Achieving a high level of safety and transport security; - Ensuring quality and easily accessible transportation in all regions of the country; - Sustainable development of mass public transport.
The strategic document sets out the main priorities and measures that need to be implemented by 2020. The vision is for the period until 2020. The Republic of Bulgaria has modern, safe and secure transport system that meets the needs for quality and safe transport.
Master Transport Plan for Bulgaria
The Master Transport Plan for Bulgaria (MTP) has been developed on the grounds of the development strategy of the transport system of the Republic of Bulgaria until 2020.
An assessment of the MTP, prepared in 2014, identifies deficiencies related to the need to ensure a better link between the objectives, problems and measures, to pay greater attention to organizational and operational measures, as well as the requirements for enhancing administrative capacity in the field of transport.
A general update of the analysis and evaluations is required using current transport data and documents in the field of transport policy. The updated scenario will contribute to the identification of priority investments in the core and comprehensive TEN-T network for the horizons until 2020 and 2030.
• Operational Programme Transport and transport infrastructure
The strategy of the Operational Programme Transport and Transport Infrastructure (OPTTI) 2014-2020 provides continuity and logical sequence of the investments from the 2007-2013 programming period, ensuring the completion of the directions where investments were already made.
OPTTI formulates the following axis:
Development of railway infrastructure along the “core” and “comprehensive” Trans-European transport network”;
Development of road infrastructure along the „core” Trans-European transport network;
Improvement of intermodal transport services for passengers and freights and development of sustainable urban transport;
Innovations in management and services - establishment of modern infrastructure for traffic management and transport safety improvement;
Technical assistance.
Along with the investments provided under OPTTI 2014-2020, PPP opportunities will be used for meeting part of the needs, in particular for the development of airports and ports. Investments related to the development of air, river and maritime transport funded under OPTTI, and focused entirely on the creation and/or development of intelligent systems to improve services and management of air, river and maritime transport.
In order to achieve the overall objective of OPTTI 2014-2020, and therefore the investment priorities, seven specific objectives have been formulated:
The first specific objective is Increasing railway traffic of passenger and freight through improving the quality of the TEN-T railway infrastructure;
Ministry of Transport, Information Technology and Communications
19
The second specific objective is Removal of bottlenecks in the TEN-T road network;
The third specific objective is Increased intermodal transport;
The fourth specific objective is Increased use of metro;
The fifth specific objective is Improved transport management through introduction of innovative systems;
The sixth specific objective is Improved management of the railway network;
The seventh specific objective is Establishment of necessary conditions for successful completion of OPT 2007-2013 and implementation of OPTTI 2014-2020, strengthening the administrative capacity and public awareness of OPTTI.
2.3 NATIONAL STRATEGIC DOCUMENTS
The national strategic documents pertaining to the development of the transport sector have also been reviewed and taken into account during the definition of the strategic objectives and priorities:
National Development Programme – Bulgaria 2020; The NDP BG2020 is a long term national program document for the development of the Republic of Bulgaria, which forms the basis for the programming of strategic documents related to the implementation of both national policies and EU policies. The scope of the document is determined by both national and European strategic framework and their uniformity. The vision is that by 2020 Bulgaria will be a country with a competitive economy, providing conditions for full social, creative and professional development of personality through smart, sustainable, inclusive and regionally balanced economic growth. There have been three main strategic objectives and eight strategic priorities defined. Strategic objective 2 Construction of infrastructure networks to ensure optimal conditions for economic development and quality and healthy environment for the population is directly related to the transport sector and with the priorities related thereto:
Achieving sustainable integrated regional development and use of local potential. Strengthening of the institutional environment for higher efficiency of public services for
citizens and businesses. Energy security and increasing of resource efficiency. Improvement of transport connectivity and access to markets.
National strategy for regional development of the Republic of Bulgaria for the period
2012 – 2022. The NSRD defines the strategic framework of the state regional policy and territorial and sets territorially related targets and mechanisms for the achievement thereof. The main strategic objective of the NSRD is "Achieving sustainable integrated regional development based on the use of local potential and cohesion of the regions in economic, social and territorial aspect." The NSRF defines four strategic objectives related to different degrees and in different aspects of the development of the transport system:
Economic cohesion in the European, national and intra regional plan by developing the own potential of the regions and environment preservation.
Social cohesion and reduction of regional disparities in the social sphere by creating conditions for the development and realization of human capital.
Territorial cohesion and development of cross-border, transnational and interregional and transnational cooperation.
Balanced regional development by strengthening the network of city-centers, improving connectivity in the regions and the quality of environment in settlements.
Ministry of Transport, Information Technology and Communications
20
The following priorities within the strategic objectives are directly aimed at the development of the transport system:
PRIORITY 1.1. Jump-starting the specific potential of regional and local economies by providing support for increasing the competitiveness of small and medium businesses.
PRIORITY 2.2. Support for employment geographic mobility in the regions. PRIORITY 3.1 Developing cross-border cooperation and mobilizing the potential of
peripheral border areas. PRIORITY 3.2 Promotion of inter-regional and transnational cooperation, including as a
means of fulfilling the strategic priorities at macro-regional level. PRIORITY 4.1. Integrated sustainable urban development and strengthening of the
polycentric network of urban centres. PRIORITY 4.2. Improving the connectivity of regions in a national and international context,
including with major urban centres in neighbouring countries.
National Reform Programme The National Reform Programme (NRP) was prepared in implementation of the Europe 2020 strategy and within the framework tool for better coordination of economic policies in the EU - the European semester. The document includes measures to implement the recommendations and addresses the deficiencies identified in the National Report for Bulgaria and policies for enhancing the competitiveness of the economy. A review of the implementation of the national objectives of the Europe 2020 strategy was carried out which includes increasing the share of renewable energy in the gross final energy consumption of transport, consumption of electricity and advanced generation biofuels and limiting the increase in the levels of greenhouse gases (GHG). It presents the relationship between the priorities in funding ESIF for 2014-2020 with the challenges identified in the National Report for Bulgaria for 2016, the SP for 2015 and the implementation of National objective (NO) for the Europe 2020 strategy.
Ministry of Transport, Information Technology and Communications
21
III. NATIONAL OBJECTIVES AND PRIORITIES
The defined strategic objectives are aimed at realizing the mission of the transport sector and the vision of its development set out in the Strategy for Development of the transport system of the Republic of Bulgaria until 2020.
The priorities within each strategic objective are aimed at achieving the objectives and priorities of OPTTI for the period 2014 – 2020. At the same time, the strategic objectives and priorities reflecting the challenges for the transport sector in the context of EU transport policy until 2030 and the problems of the national transport system identified in the analyses.
The following requirements and criteria are complied with for the definition of the strategic objectives:
- Compliance with the common transport policy, strategic and normative documents of the EU;
- Compliance with the national transport policy and national strategic and normative documents;
- Focus on achieving the main objective: sustainable development of the transport sector;
- Coverage of economic, environmental and social aspects of development of the transport system;
- Compliance with the priorities and requirements set out in the preliminary conditions of the European Commission for the use of EU funds in the period 2014 - 2020, as well as the regulations for the Trans-European Transport Network;
- Compliance with the relevant thematic preconditions undertaken as commitment in the Partnership Agreement;
- Satisfaction of the requirements for well formulated objectives;
- Inclusion of all modes of transport and the interaction between these.
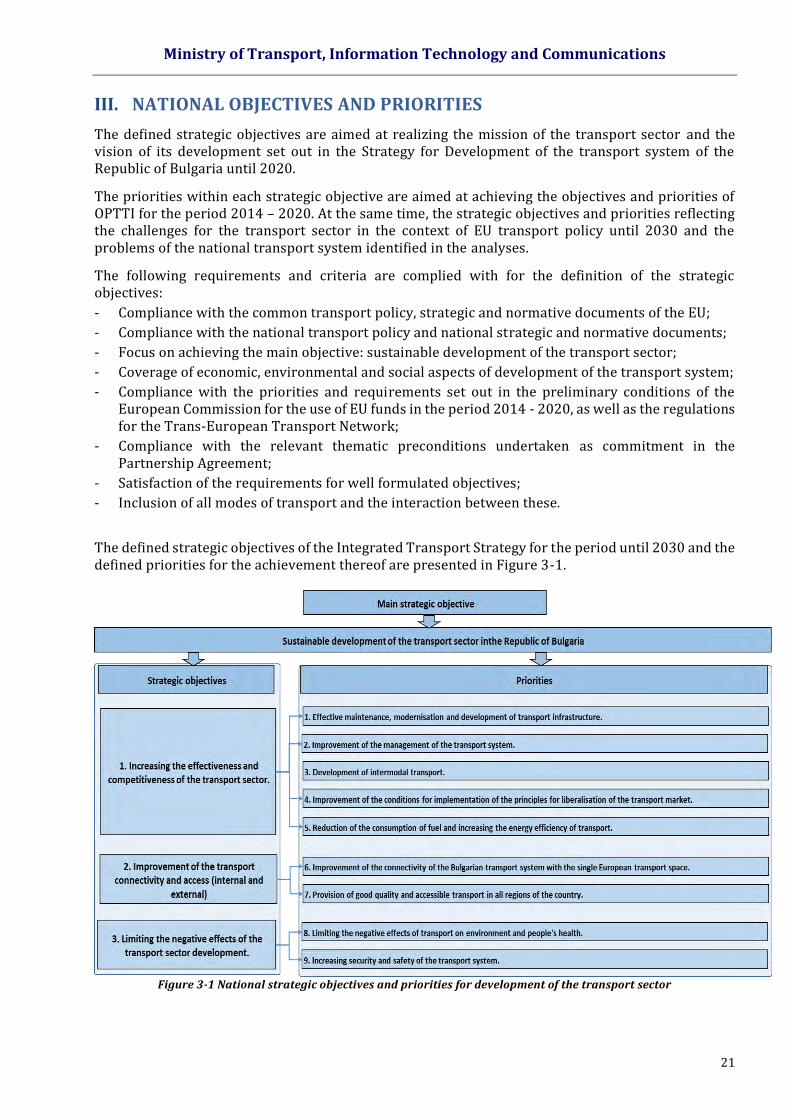
The defined strategic objectives of the Integrated Transport Strategy for the period until 2030 and the defined priorities for the achievement thereof are presented in Figure 3-1.
Figure 3-1 National strategic objectives and priorities for development of the transport sector
Ministry of Transport, Information Technology and Communications
22
IV. SITUATION ANALYSIS
4.1 DATABASE
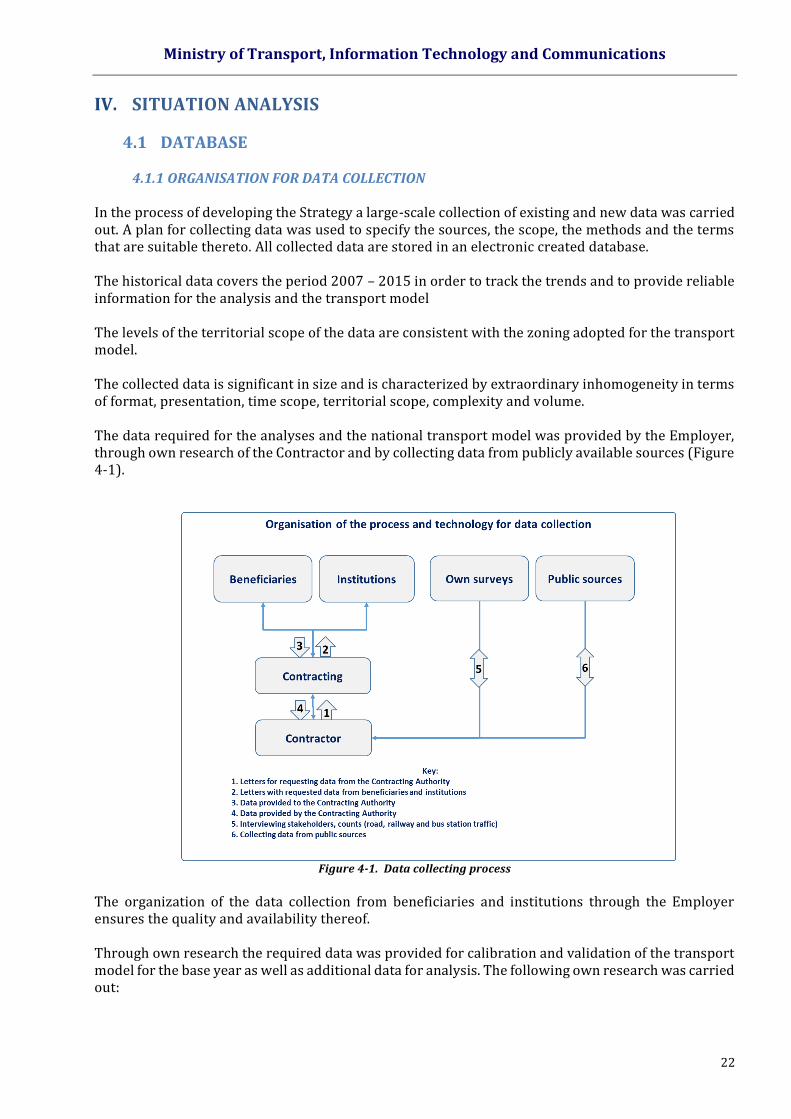
4.1.1 ORGANISATION FOR DATA COLLECTION In the process of developing the Strategy a large-scale collection of existing and new data was carried out. A plan for collecting data was used to specify the sources, the scope, the methods and the terms that are suitable thereto. All collected data are stored in an electronic created database. The historical data covers the period 2007 – 2015 in order to track the trends and to provide reliable information for the analysis and the transport model The levels of the territorial scope of the data are consistent with the zoning adopted for the transport model. The collected data is significant in size and is characterized by extraordinary inhomogeneity in terms of format, presentation, time scope, territorial scope, complexity and volume. The data required for the analyses and the national transport model was provided by the Employer, through own research of the Contractor and by collecting data from publicly available sources (Figure 4-1).
Figure 4-1. Data collecting process
The organization of the data collection from beneficiaries and institutions through the Employer ensures the quality and availability thereof. Through own research the required data was provided for calibration and validation of the transport model for the base year as well as additional data for analysis. The following own research was carried out:
Ministry of Transport, Information Technology and Communications
23
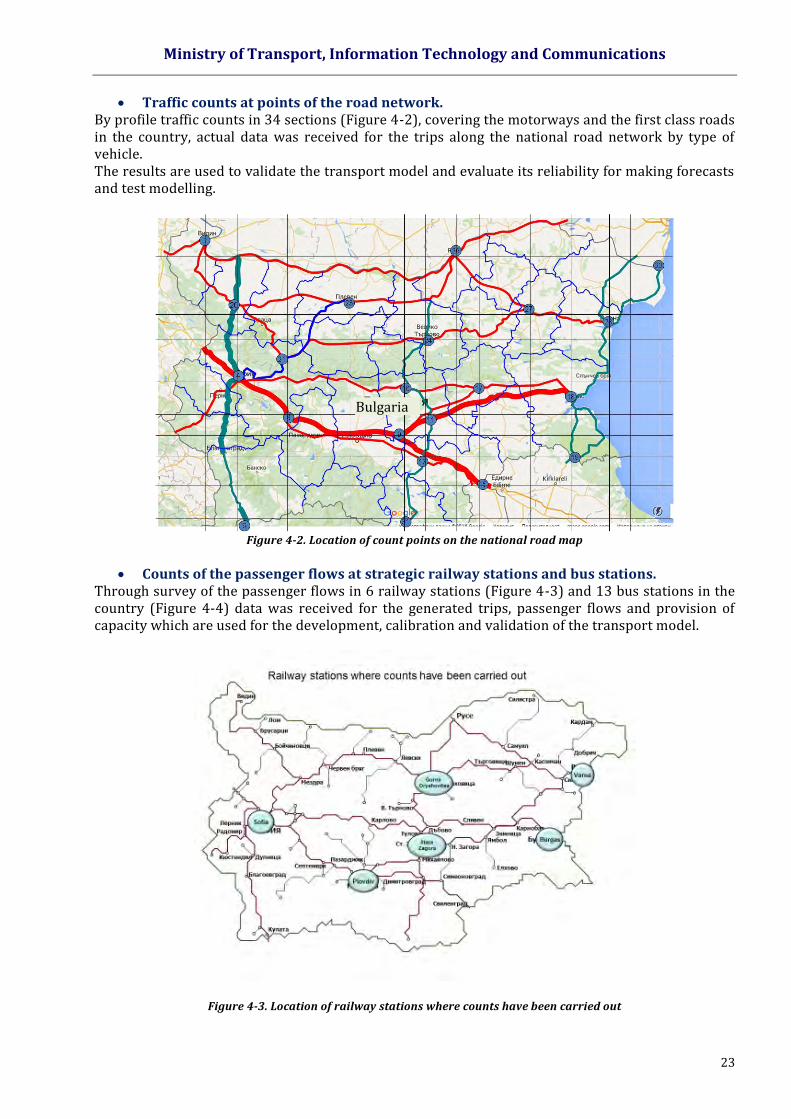
Traffic counts at points of the road network. By profile traffic counts in 34 sections (Figure 4-2), covering the motorways and the first class roads in the country, actual data was received for the trips along the national road network by type of vehicle. The results are used to validate the transport model and evaluate its reliability for making forecasts and test modelling.
Figure 4-2. Location of count points on the national road map
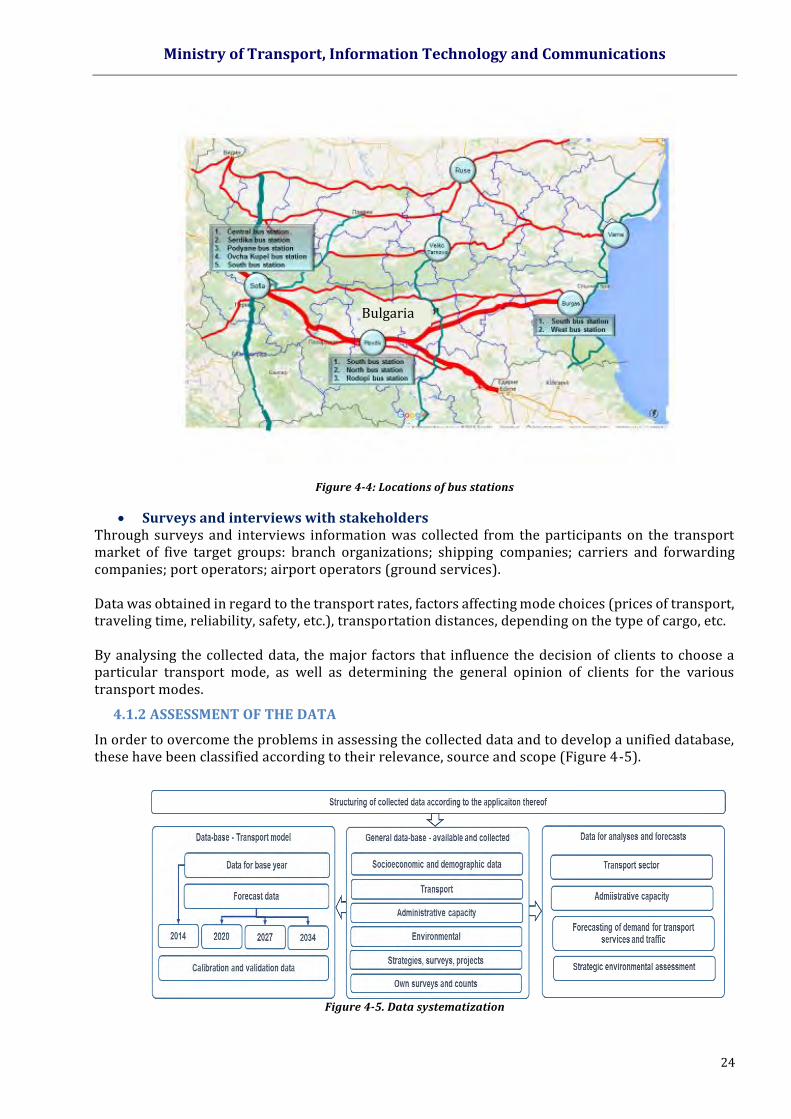
Counts of the passenger flows at strategic railway stations and bus stations.
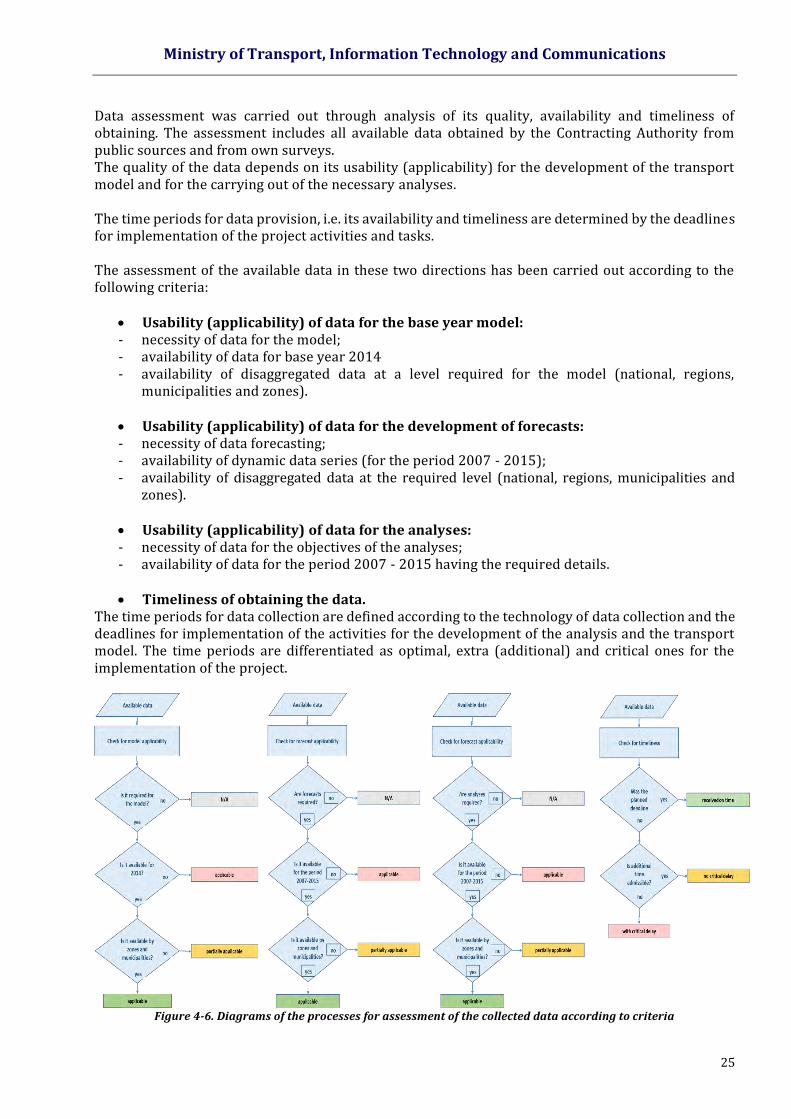
Through survey of the passenger flows in 6 railway stations (Figure 4-3) and 13 bus stations in the country (Figure 4-4) data was received for the generated trips, passenger flows and provision of capacity which are used for the development, calibration and validation of the transport model.
Figure 4-3. Location of railway stations where counts have been carried out
Bulgaria
Ministry of Transport, Information Technology and Communications
24
Figure 4-4: Locations of bus stations
Surveys and interviews with stakeholders Through surveys and interviews information was collected from the participants on the transport market of five target groups: branch organizations; shipping companies; carriers and forwarding companies; port operators; airport operators (ground services). Data was obtained in regard to the transport rates, factors affecting mode choices (prices of transport, traveling time, reliability, safety, etc.), transportation distances, depending on the type of cargo, etc. By analysing the collected data, the major factors that influence the decision of clients to choose a particular transport mode, as well as determining the general opinion of clients for the various transport modes.
4.1.2 ASSESSMENT OF THE DATA
In order to overcome the problems in assessing the collected data and to develop a unified database, these have been classified according to their relevance, source and scope (Figure 4-5).
Figure 4-5. Data systematization
Bulgaria
Ministry of Transport, Information Technology and Communications
25
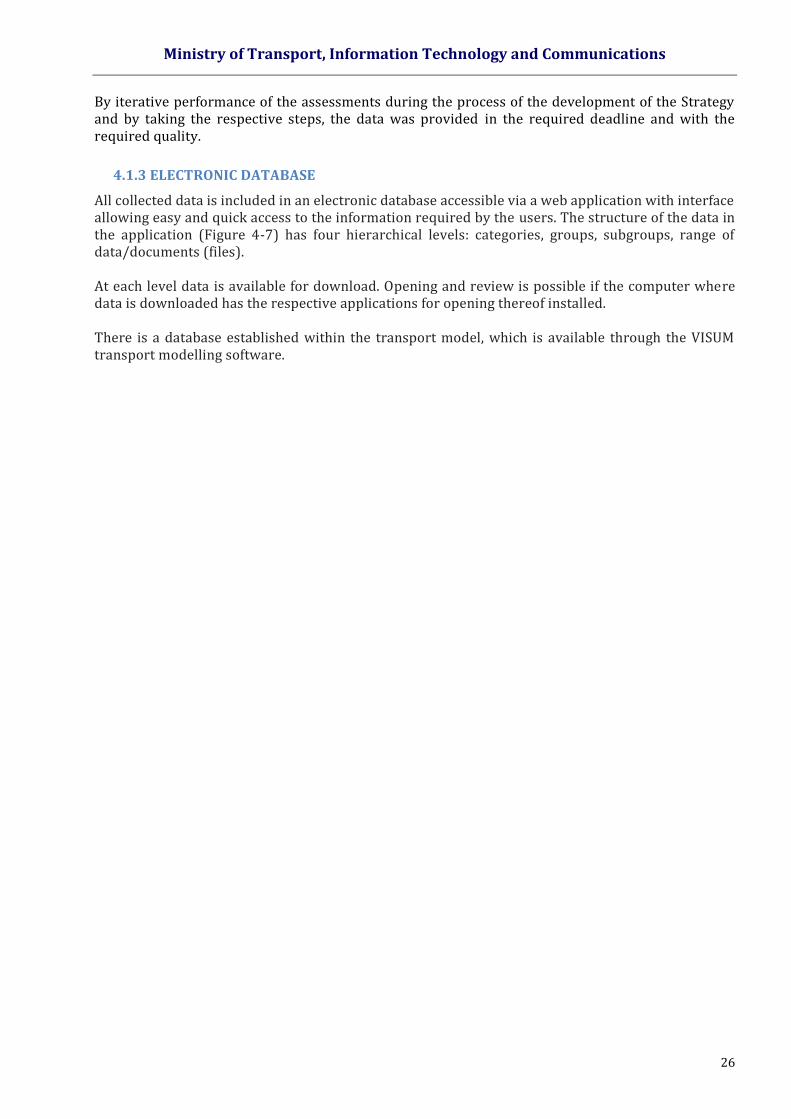
Data assessment was carried out through analysis of its quality, availability and timeliness of obtaining. The assessment includes all available data obtained by the Contracting Authority from public sources and from own surveys. The quality of the data depends on its usability (applicability) for the development of the transport model and for the carrying out of the necessary analyses. The time periods for data provision, i.e. its availability and timeliness are determined by the deadlines for implementation of the project activities and tasks. The assessment of the available data in these two directions has been carried out according to the following criteria:
Usability (applicability) of data for the base year model: - necessity of data for the model; - availability of data for base year 2014 - availability of disaggregated data at a level required for the model (national, regions,
municipalities and zones). Usability (applicability) of data for the development of forecasts: - necessity of data forecasting; - availability of dynamic data series (for the period 2007 - 2015); - availability of disaggregated data at the required level (national, regions, municipalities and
zones). Usability (applicability) of data for the analyses: - necessity of data for the objectives of the analyses; - availability of data for the period 2007 - 2015 having the required details. Timeliness of obtaining the data.
The time periods for data collection are defined according to the technology of data collection and the deadlines for implementation of the activities for the development of the analysis and the transport model. The time periods are differentiated as optimal, extra (additional) and critical ones for the implementation of the project.
Figure 4-6. Diagrams of the processes for assessment of the collected data according to criteria
Ministry of Transport, Information Technology and Communications
26
By iterative performance of the assessments during the process of the development of the Strategy and by taking the respective steps, the data was provided in the required deadline and with the required quality.
4.1.3 ELECTRONIC DATABASE
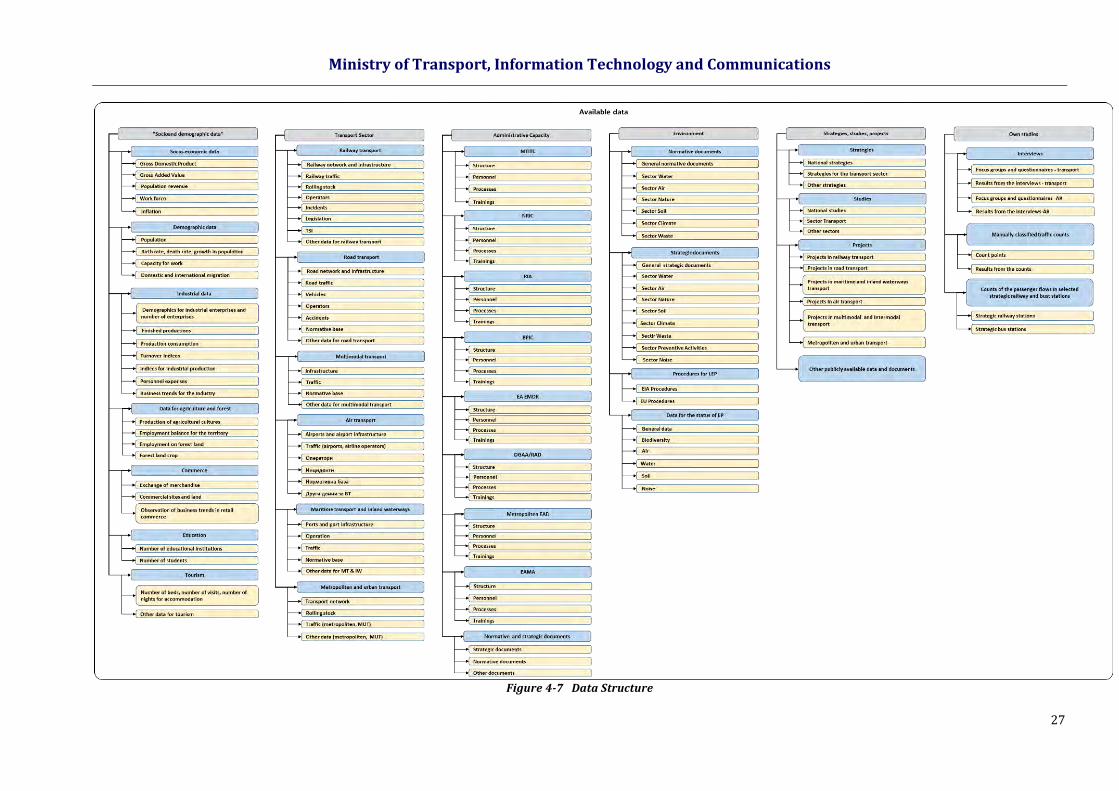
All collected data is included in an electronic database accessible via a web application with interface allowing easy and quick access to the information required by the users. The structure of the data in the application (Figure 4-7) has four hierarchical levels: categories, groups, subgroups, range of data/documents (files). At each level data is available for download. Opening and review is possible if the computer where data is downloaded has the respective applications for opening thereof installed. There is a database established within the transport model, which is available through the VISUM transport modelling software.
Ministry of Transport, Information Technology and Communications
27
Figure 4-7 Data Structure
Ministry of Transport, Information Technology and Communications
28
4.2 MACROECONOMIC, DEMOGRAPHIC AND SOCIAL ANALYSIS
4.2.1 MACROECONOMIC ANALYSIS
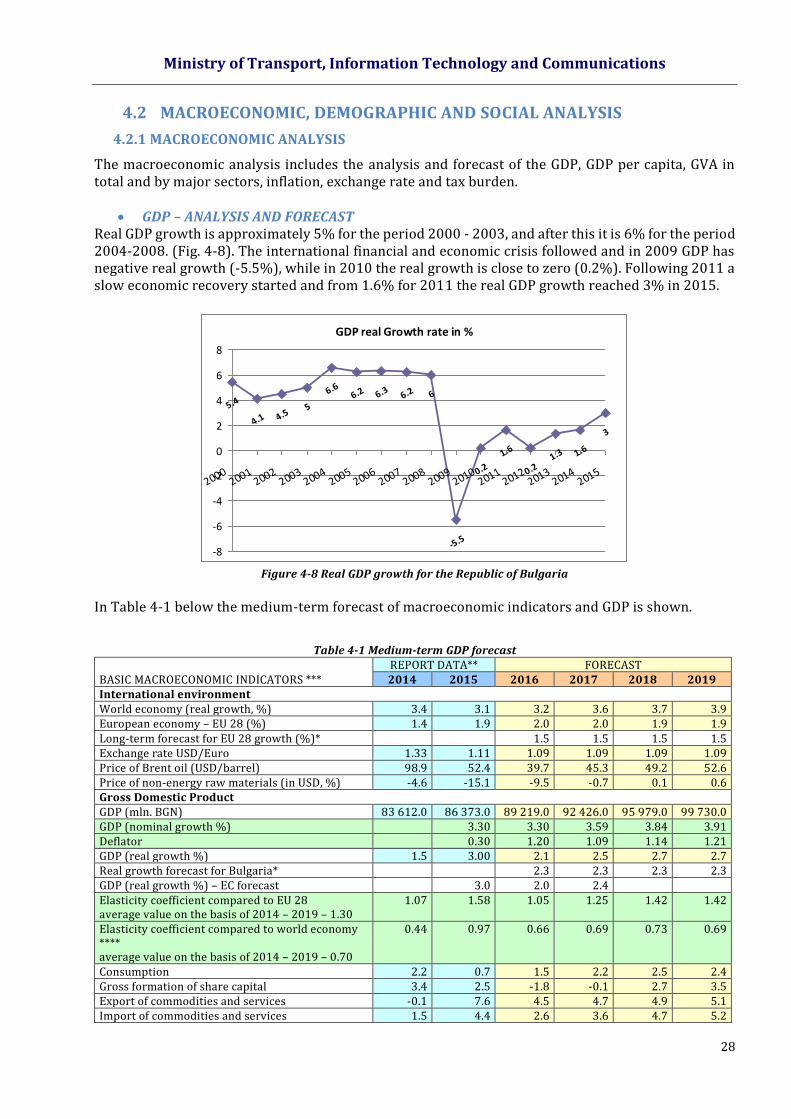
The macroeconomic analysis includes the analysis and forecast of the GDP, GDP per capita, GVA in total and by major sectors, inflation, exchange rate and tax burden.
GDP – ANALYSIS AND FORECAST
Real GDP growth is approximately 5% for the period 2000 - 2003, and after this it is 6% for the period 2004-2008. (Fig. 4-8). The international financial and economic crisis followed and in 2009 GDP has negative real growth (-5.5%), while in 2010 the real growth is close to zero (0.2%). Following 2011 a slow economic recovery started and from 1.6% for 2011 the real GDP growth reached 3% in 2015.
Figure 4-8 Real GDP growth for the Republic of Bulgaria
In Table 4-1 below the medium-term forecast of macroeconomic indicators and GDP is shown.
Table 4-1 Medium-term GDP forecast
BASIC MACROECONOMIC INDICATORS *** REPORT DATA** FORECAST 2014 2015 2016 2017 2018 2019
International environment World economy (real growth, %) 3.4 3.1 3.2 3.6 3.7 3.9 European economy – ЕU 28 (%) 1.4 1.9 2.0 2.0 1.9 1.9 Long-term forecast for EU 28 growth (%)* 1.5 1.5 1.5 1.5 Exchange rate USD/Euro 1.33 1.11 1.09 1.09 1.09 1.09 Price of Brent oil (USD/barrel) 98.9 52.4 39.7 45.3 49.2 52.6 Price of non-energy raw materials (in USD, %) -4.6 -15.1 -9.5 -0.7 0.1 0.6 Gross Domestic Product GDP (mln. BGN) 83 612.0 86 373.0 89 219.0 92 426.0 95 979.0 99 730.0 GDP (nominal growth %) 3.30 3.30 3.59 3.84 3.91 Deflator 0.30 1.20 1.09 1.14 1.21 GDP (real growth %) 1.5 3.00 2.1 2.5 2.7 2.7 Real growth forecast for Bulgaria* 2.3 2.3 2.3 2.3 GDP (real growth %) – EC forecast 3.0 2.0 2.4 Elasticity coefficient compared to EU 28 average value on the basis of 2014 – 2019 – 1.30
1.07 1.58 1.05 1.25 1.42 1.42
Elasticity coefficient compared to world economy **** average value on the basis of 2014 – 2019 – 0.70
0.44 0.97 0.66 0.69 0.73 0.69
Consumption 2.2 0.7 1.5 2.2 2.5 2.4 Gross formation of share capital 3.4 2.5 -1.8 -0.1 2.7 3.5 Export of commodities and services -0.1 7.6 4.5 4.7 4.9 5.1 Import of commodities and services 1.5 4.4 2.6 3.6 4.7 5.2
GDP real Growth rate in %
5.4
4.1 4.55
6.66.2 6.3 6.2 6
-5.5
0.2
1.6
0.21.3 1.6
3
-8
-6
-4
-2
0
2
4
6
8
20002001
20022003
20042005
20062007
20082009
20102011
20122013
20142015
Ministry of Transport, Information Technology and Communications
29
* Trends for development of energy, transport and greenhouse gas emissions in the EU by 2050, reference scenario 2013 (https://ec.europa.eu/commission/2014-2019/georgieva/announcements/proletnata-prognoza-na-ek-potvrzhdava-tendenciyata-na-vzstanovyavane-na-evropeyskata-ikonomika_en; https://ec.europa.eu/commission/sites/cwt/files/ip025_en_80.pdf) ** Statistical data published by 17 March 2016 was used for the preparation of the forecast. *** Source: Spring macroeconomic forecast of the Ministry of Finance in 2016, March 2016 (http://www.minfin.bg/document/17862:3; http://www.minfin.bg/bg/page/866) **** Source: https://ec.europa.eu/commission/2014-2019/georgieva/announcements/proletnata-prognoza-na-ek-potvrzhdava-tendenciyata-na-vzstanovyavane-na-evropeyskata-ikonomika_en (https://ec.europa.eu/commission/sites/cwt/files/ip025_en_80.pdf)
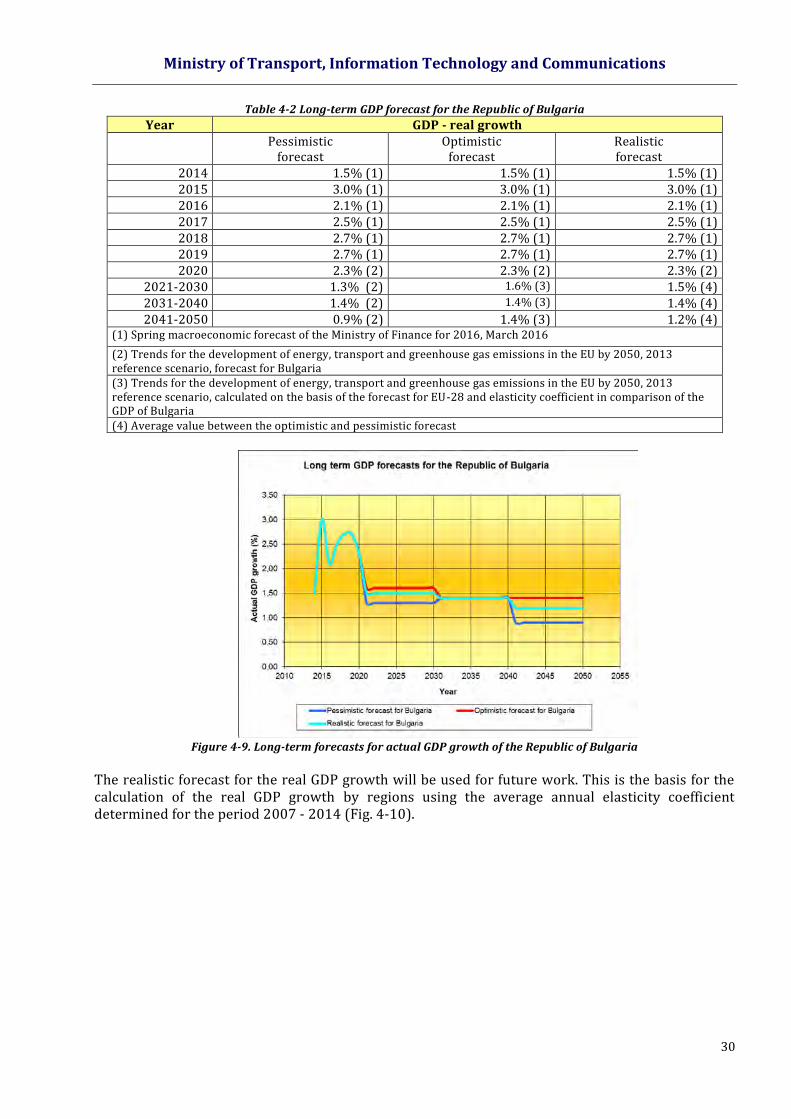
For the needs of the long-term GDP forecasting the data were used "Trends for development of energy, transport and greenhouse gas emissions in the EU by 2050, 2013 reference scenario." 1 On this basis and on the basis of the medium-term forecast presented above, three forecasts for the real growth of GDP have been developed - pessimistic, realistic and optimistic. The pessimistic forecast is determined by using data from the "Spring macroeconomic forecast" the Ministry of Finance, 2016 - 2019 year and from 2020 to 2050 used data directly from the "Trends for development of energy, transport and greenhouse gas emissions in the EU at 2050, 2013 reference scenario. " In this forecast, real growth of GDP of Bulgaria is lower than the EU 28 for the period from 2020 to 2050. It is quite negative and does not meet the ongoing cohesion policy of the EU. The optimistic forecast is defined as a factor of elasticity of real growth of GDP of the Republic of Bulgaria to that of the EU 28. Designated elasticity coefficient is 1.30. The long-term forecast of real GDP growth in the EU 28 is taken directly from the "Trends for development of energy, transport and greenhouse gas emissions in the EU by 2050, 2013 reference scenario." The forecast for Bulgaria is made as these data are multiplied by an agreed coefficient of elasticity. In this forecast, real growth of GDP of Bulgaria moderate than that of the EU 28 for the entire forecast period. The realistic forecast is obtained as the average of the values of pessimistic and optimistic forecast for each year. In this forecast growth of GDP of Bulgaria moderate than that of the EU 28 for the period 2016-2040 year and is equal to that of the EU 28 for the period 2041-2050 year. This forecast fully complies with the EU cohesion policy, until 2040 Bulgaria was developing a little more accelerated than the EU 28, but after 2041 the conditions are now aligned. Estimates are presented in Table 4-2 and Figure 4-9.
1 https://ec.europa.eu/commission/2014-2019/georgieva/announcements/ proletnata-prognoza-na-ek-potvrzhdava-tendenciyata-na-vzstanovyavane-na-evropeyskata-ikonomika_en; https://ec.europa.eu/commission/sites/cwt/files/ip025_en_80.pdf
Ministry of Transport, Information Technology and Communications
30
Table 4-2 Long-term GDP forecast for the Republic of Bulgaria
Year GDP - real growth Pessimistic
forecast Optimistic
forecast Realistic forecast
2014 1.5% (1) 1.5% (1) 1.5% (1) 2015 3.0% (1) 3.0% (1) 3.0% (1) 2016 2.1% (1) 2.1% (1) 2.1% (1) 2017 2.5% (1) 2.5% (1) 2.5% (1) 2018 2.7% (1) 2.7% (1) 2.7% (1) 2019 2.7% (1) 2.7% (1) 2.7% (1) 2020 2.3% (2) 2.3% (2) 2.3% (2)
2021-2030 1.3% (2) 1.6% (3) 1.5% (4) 2031-2040 1.4% (2) 1.4% (3) 1.4% (4) 2041-2050 0.9% (2) 1.4% (3) 1.2% (4)
(1) Spring macroeconomic forecast of the Ministry of Finance for 2016, March 2016
(2) Trends for the development of energy, transport and greenhouse gas emissions in the EU by 2050, 2013 reference scenario, forecast for Bulgaria (3) Trends for the development of energy, transport and greenhouse gas emissions in the EU by 2050, 2013 reference scenario, calculated on the basis of the forecast for EU-28 and elasticity coefficient in comparison of the GDP of Bulgaria (4) Average value between the optimistic and pessimistic forecast
Figure 4-9. Long-term forecasts for actual GDP growth of the Republic of Bulgaria
The realistic forecast for the real GDP growth will be used for future work. This is the basis for the calculation of the real GDP growth by regions using the average annual elasticity coefficient determined for the period 2007 - 2014 (Fig. 4-10).
Ministry of Transport, Information Technology and Communications
31
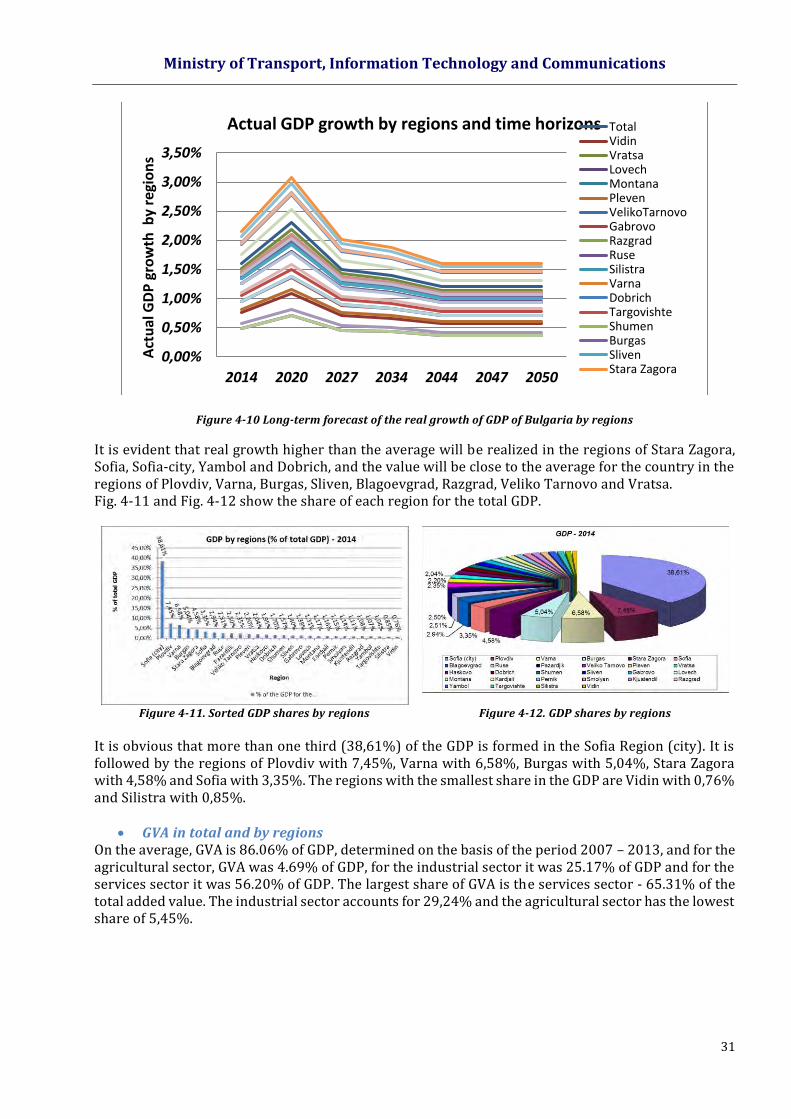
Figure 4-10 Long-term forecast of the real growth of GDP of Bulgaria by regions
It is evident that real growth higher than the average will be realized in the regions of Stara Zagora, Sofia, Sofia-city, Yambol and Dobrich, and the value will be close to the average for the country in the regions of Plovdiv, Varna, Burgas, Sliven, Blagoevgrad, Razgrad, Veliko Tarnovo and Vratsa. Fig. 4-11 and Fig. 4-12 show the share of each region for the total GDP.
Figure 4-11. Sorted GDP shares by regions Figure 4-12. GDP shares by regions
It is obvious that more than one third (38,61%) of the GDP is formed in the Sofia Region (city). It is followed by the regions of Plovdiv with 7,45%, Varna with 6,58%, Burgas with 5,04%, Stara Zagora with 4,58% and Sofia with 3,35%. The regions with the smallest share in the GDP are Vidin with 0,76% and Silistra with 0,85%.
GVA in total and by regions On the average, GVA is 86.06% of GDP, determined on the basis of the period 2007 – 2013, and for the agricultural sector, GVA was 4.69% of GDP, for the industrial sector it was 25.17% of GDP and for the services sector it was 56.20% of GDP. The largest share of GVA is the services sector - 65.31% of the total added value. The industrial sector accounts for 29,24% and the agricultural sector has the lowest share of 5,45%.
0,00%
0,50%
1,00%
1,50%
2,00%
2,50%
3,00%
3,50%
2014 2020 2027 2034 2044 2047 2050
Act
ual
GD
P g
row
th b
y re
gio
ns
Actual GDP growth by regions and time horizons TotalVidinVratsaLovechMontanaPlevenVelikoTarnovoGabrovoRazgradRuseSilistraVarnaDobrichTargovishteShumenBurgasSlivenStara Zagora
Ministry of Transport, Information Technology and Communications
32
Source: NSI and own calculations
Figure 4-13. Sorted GVA shares by regions Source: NSI and own calculations
Figure 4-14. GVA shares by regions
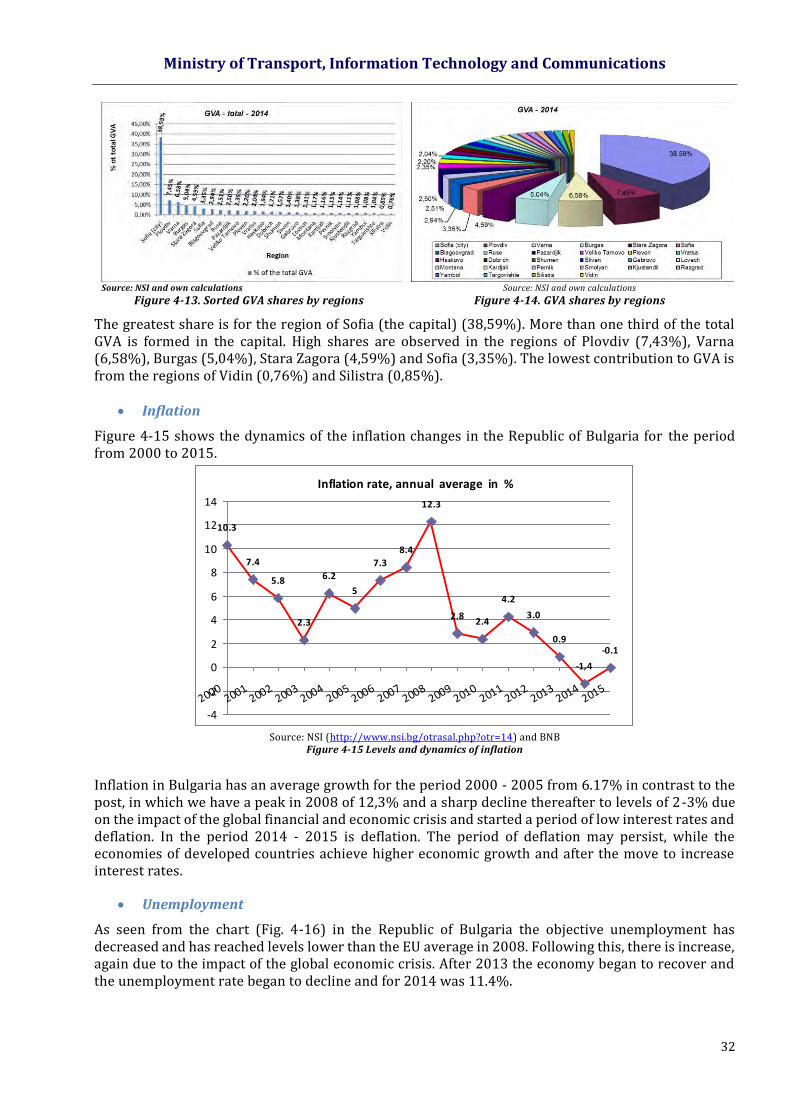
The greatest share is for the region of Sofia (the capital) (38,59%). More than one third of the total GVA is formed in the capital. High shares are observed in the regions of Plovdiv (7,43%), Varna (6,58%), Burgas (5,04%), Stara Zagora (4,59%) and Sofia (3,35%). The lowest contribution to GVA is from the regions of Vidin (0,76%) and Silistra (0,85%).
Inflation
Figure 4-15 shows the dynamics of the inflation changes in the Republic of Bulgaria for the period from 2000 to 2015.
Source: NSI (http://www.nsi.bg/otrasal.php?otr=14) and BNB
Figure 4-15 Levels and dynamics of inflation
Inflation in Bulgaria has an average growth for the period 2000 - 2005 from 6.17% in contrast to the post, in which we have a peak in 2008 of 12,3% and a sharp decline thereafter to levels of 2-3% due on the impact of the global financial and economic crisis and started a period of low interest rates and deflation. In the period 2014 - 2015 is deflation. The period of deflation may persist, while the economies of developed countries achieve higher economic growth and after the move to increase interest rates.
Unemployment
As seen from the chart (Fig. 4-16) in the Republic of Bulgaria the objective unemployment has decreased and has reached levels lower than the EU average in 2008. Following this, there is increase, again due to the impact of the global economic crisis. After 2013 the economy began to recover and the unemployment rate began to decline and for 2014 was 11.4%.
Inflation rate, annual average in %
10.3
7.4
5.8
2.3
6.2
5
7.3
8.4
12.3
2.82.4
4.2
3.0
0.9
-1.4
-0.1
-4
-2
0
2
4
6
8
10
12
14
20002001
20022003
20042005
20062007
20082009
20102011
20122013
20142015
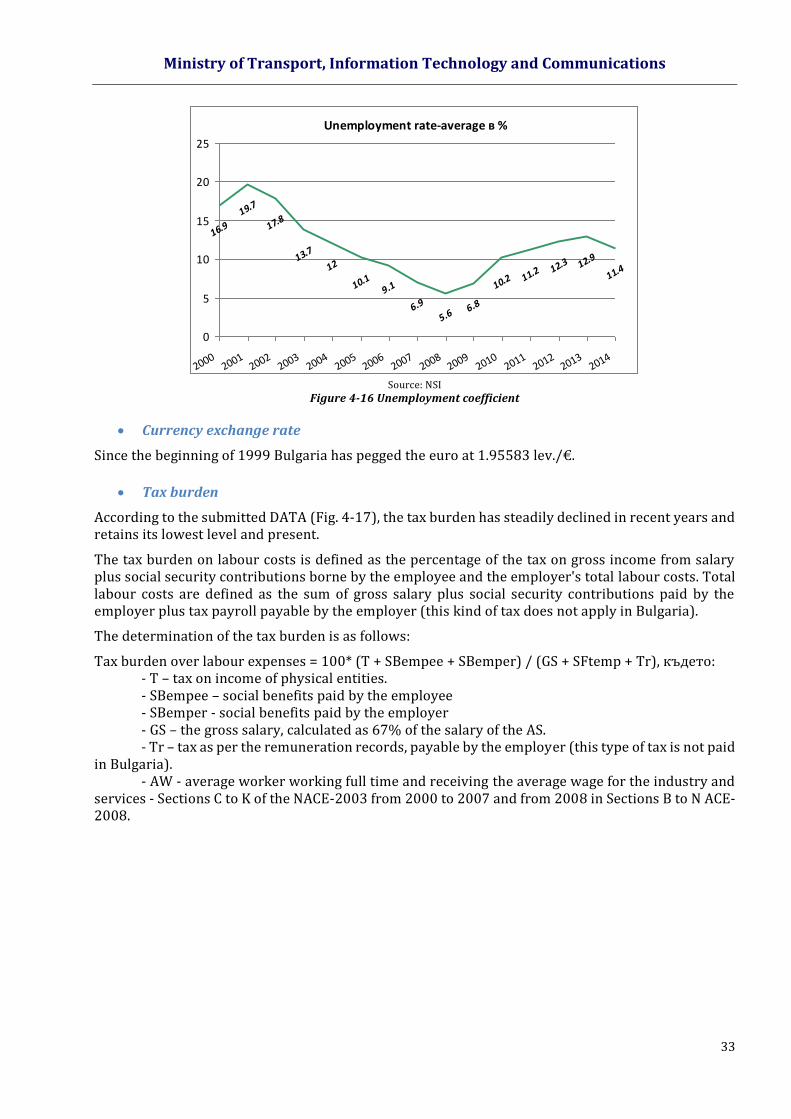
Ministry of Transport, Information Technology and Communications
33
Source: NSI
Figure 4-16 Unemployment coefficient
Currency exchange rate
Since the beginning of 1999 Bulgaria has pegged the euro at 1.95583 lev./€.
Tax burden
According to the submitted DATA (Fig. 4-17), the tax burden has steadily declined in recent years and retains its lowest level and present.
The tax burden on labour costs is defined as the percentage of the tax on gross income from salary plus social security contributions borne by the employee and the employer's total labour costs. Total labour costs are defined as the sum of gross salary plus social security contributions paid by the employer plus tax payroll payable by the employer (this kind of tax does not apply in Bulgaria).
The determination of the tax burden is as follows:
Tax burden over labour expenses = 100* (T + SBempee + SBemper) / (GS + SFtemp + Tr), където: - T – tax on income of physical entities. - SBempee – social benefits paid by the employee - SBemper - social benefits paid by the employer - GS – the gross salary, calculated as 67% of the salary of the AS. - Tr – tax as per the remuneration records, payable by the employer (this type of tax is not paid
in Bulgaria). - AW - average worker working full time and receiving the average wage for the industry and
services - Sections C to K of the NACE-2003 from 2000 to 2007 and from 2008 in Sections B to N ACE- 2008.
Unemployment rate-average в %
16.9
19.7
17.8
13.7
12
10.1
9.1
6.9
5.66.8
10.2 11.
2 12.3 12.
9
11.4
0
5
10
15
20
25
20002001
20022003
20042005
20062007
20082009
20102011
20122013
2014
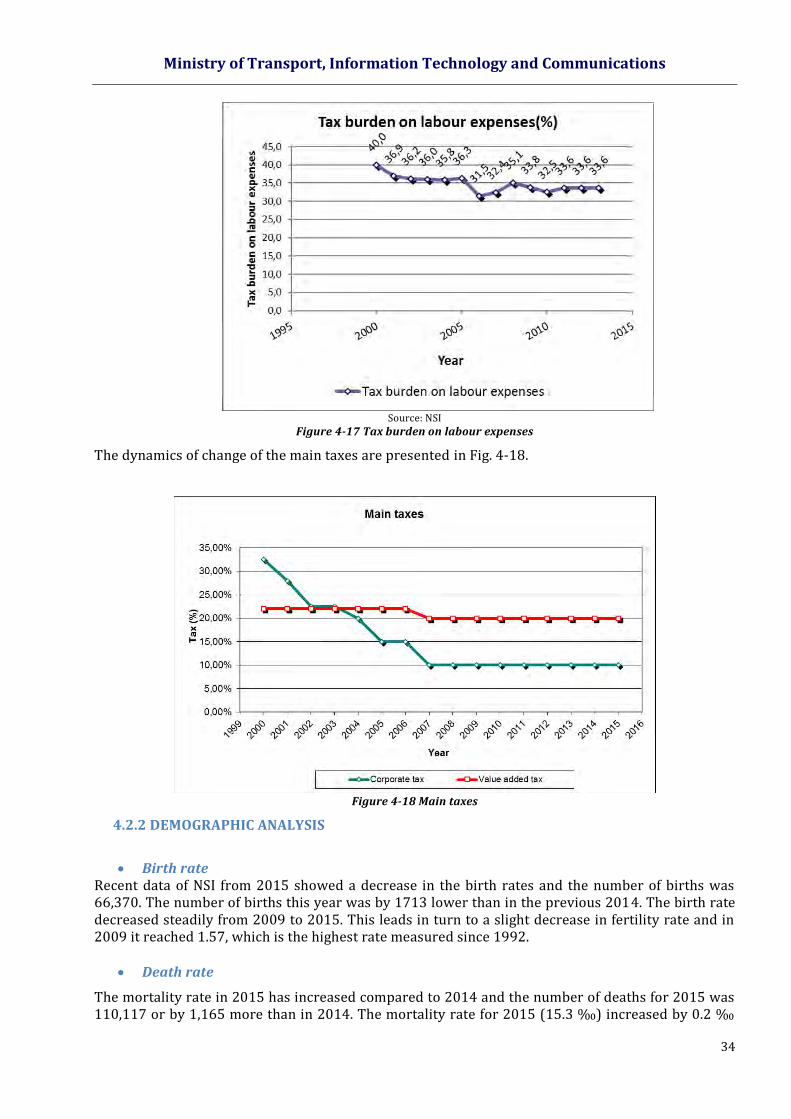
Ministry of Transport, Information Technology and Communications
34
Source: NSI
Figure 4-17 Tax burden on labour expenses
The dynamics of change of the main taxes are presented in Fig. 4-18.
Figure 4-18 Main taxes
4.2.2 DEMOGRAPHIC ANALYSIS
Birth rate
Recent data of NSI from 2015 showed a decrease in the birth rates and the number of births was 66,370. The number of births this year was by 1713 lower than in the previous 2014. The birth rate decreased steadily from 2009 to 2015. This leads in turn to a slight decrease in fertility rate and in 2009 it reached 1.57, which is the highest rate measured since 1992.
Death rate
The mortality rate in 2015 has increased compared to 2014 and the number of deaths for 2015 was 110,117 or by 1,165 more than in 2014. The mortality rate for 2015 (15.3 ‰) increased by 0.2 ‰

Ministry of Transport, Information Technology and Communications
35
compared to the previous year. An increased mortality rate was observed in men (16.3 ‰) than in women (14.4 ‰) and higher was the mortality rate among the rural population compared to the urban residents.
It can be concluded that the high mortality is mainly due to the death of the elderly people.
Fig. 4-19 shows the dynamics of change in mortality and fertility rates for the period from 2004 to 2015.
Source: NSI
Figure 4-19 Number of births and deaths by years
Migration
As a result of the internal migration the rural population decreases and on this basis increases the number of inhabitants of the cities.
With the accession of Bulgaria to the European Union, the internal migration starting reporting people who change their permanent address from Bulgaria to another country - member of the Community. At the same time, an insignificant part of the population of these countries is registered for permanent residence in Bulgaria. As a result of the international migration, population has decreased by 15,729 people in 2009 and by 24,190 in 2010. Since 2011 the mechanical negative growth caused by international migration has decreased (fig. 4-20).
Source: NSI
Figure 4-20 International migration of the population
0
25 000
50 000
75 000
100 000
125 000
150 000
Death rate Birth rate
Dynamic of the international migration
-1 397 -876
-15 729
-24 190
-4 795 -2 512 -1 108
-4 247 -2 112
-30 000
-25 000
-20 000
-15 000
-10 000
-5 000
0
5 000
2007 2008 2009 2010 2011 2012 2013 2014 2015
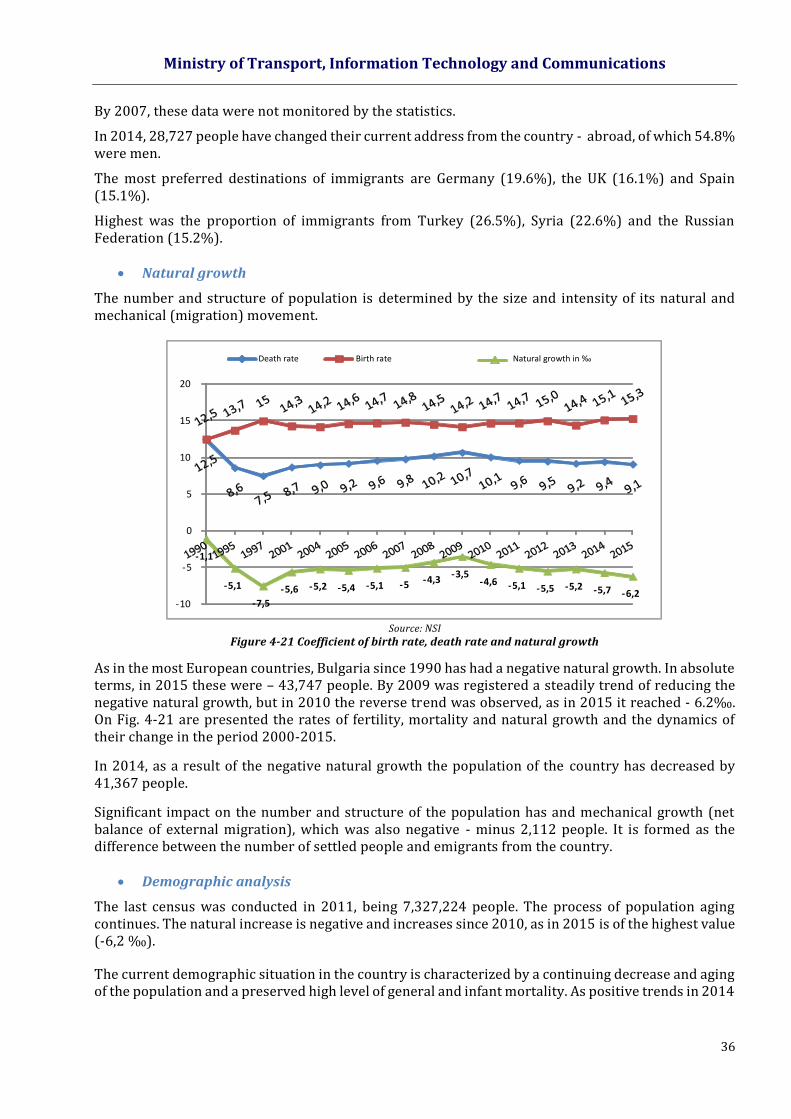
Ministry of Transport, Information Technology and Communications
36
By 2007, these data were not monitored by the statistics.
In 2014, 28,727 people have changed their current address from the country - abroad, of which 54.8% were men.
The most preferred destinations of immigrants are Germany (19.6%), the UK (16.1%) and Spain (15.1%).
Highest was the proportion of immigrants from Turkey (26.5%), Syria (22.6%) and the Russian Federation (15.2%).
Natural growth
The number and structure of population is determined by the size and intensity of its natural and mechanical (migration) movement.
Source: NSI
Figure 4-21 Coefficient of birth rate, death rate and natural growth
As in the most European countries, Bulgaria since 1990 has had a negative natural growth. In absolute terms, in 2015 these were – 43,747 people. By 2009 was registered a steadily trend of reducing the negative natural growth, but in 2010 the reverse trend was observed, as in 2015 it reached - 6.2‰. On Fig. 4-21 are presented the rates of fertility, mortality and natural growth and the dynamics of their change in the period 2000-2015.
In 2014, as a result of the negative natural growth the population of the country has decreased by 41,367 people.
Significant impact on the number and structure of the population has and mechanical growth (net balance of external migration), which was also negative - minus 2,112 people. It is formed as the difference between the number of settled people and emigrants from the country.
Demographic analysis
The last census was conducted in 2011, being 7,327,224 people. The process of population aging continues. The natural increase is negative and increases since 2010, as in 2015 is of the highest value (-6,2 ‰).
The current demographic situation in the country is characterized by a continuing decrease and aging of the population and a preserved high level of general and infant mortality. As positive trends in 2014
- 1,1
- 5,1 - 7,5
- 5,6 - 5,2 - 5,4 - 5,1 - 5 - 4,3 - 3,5 - 4,6 - 5,1 - 5,5 - 5,2 - 5,7 - 6,2
- 10
- 5
0
5
10
15
20
Death rate Birth rate Natural growth in ‰
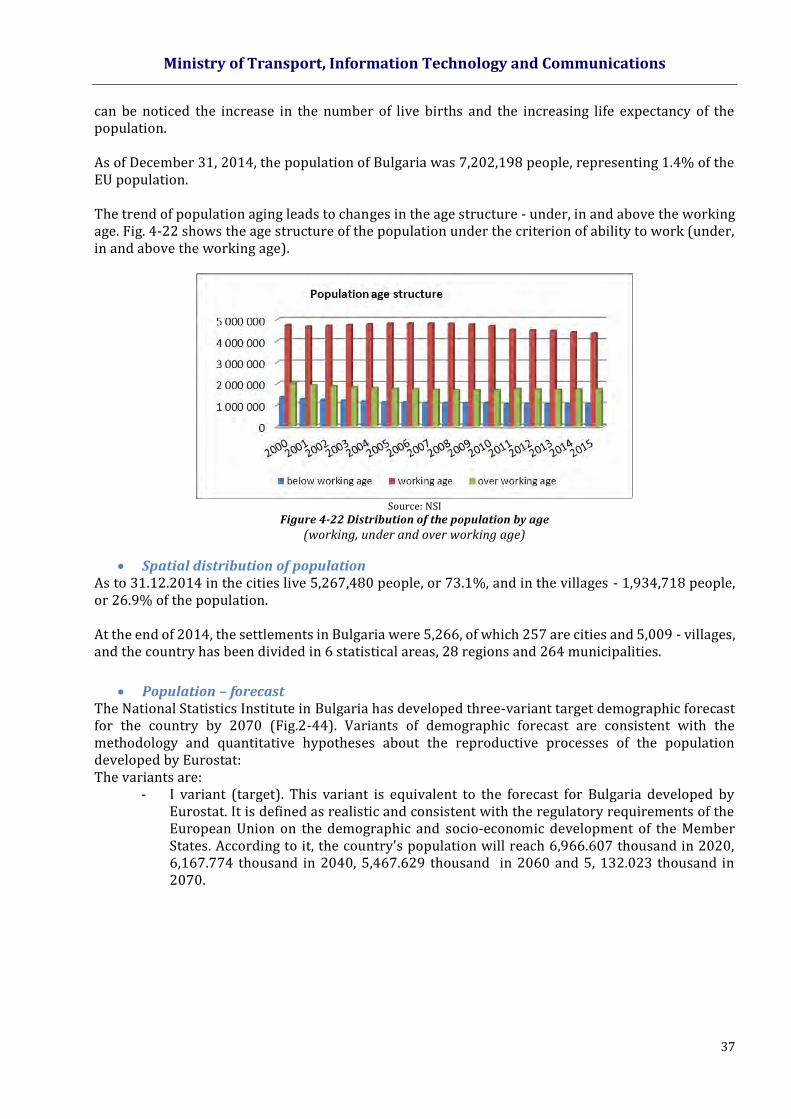
Ministry of Transport, Information Technology and Communications
37
can be noticed the increase in the number of live births and the increasing life expectancy of the population. As of December 31, 2014, the population of Bulgaria was 7,202,198 people, representing 1.4% of the EU population. The trend of population aging leads to changes in the age structure - under, in and above the working age. Fig. 4-22 shows the age structure of the population under the criterion of ability to work (under, in and above the working age).
Source: NSI
Figure 4-22 Distribution of the population by age
(working, under and over working age)
Spatial distribution of population As to 31.12.2014 in the cities live 5,267,480 people, or 73.1%, and in the villages - 1,934,718 people, or 26.9% of the population. At the end of 2014, the settlements in Bulgaria were 5,266, of which 257 are cities and 5,009 - villages, and the country has been divided in 6 statistical areas, 28 regions and 264 municipalities.
Population – forecast The National Statistics Institute in Bulgaria has developed three-variant target demographic forecast for the country by 2070 (Fig.2-44). Variants of demographic forecast are consistent with the methodology and quantitative hypotheses about the reproductive processes of the population developed by Eurostat: The variants are:
- I variant (target). This variant is equivalent to the forecast for Bulgaria developed by Eurostat. It is defined as realistic and consistent with the regulatory requirements of the European Union on the demographic and socio-economic development of the Member States. According to it, the country's population will reach 6,966.607 thousand in 2020, 6,167.774 thousand in 2040, 5,467.629 thousand in 2060 and 5, 132.023 thousand in 2070.
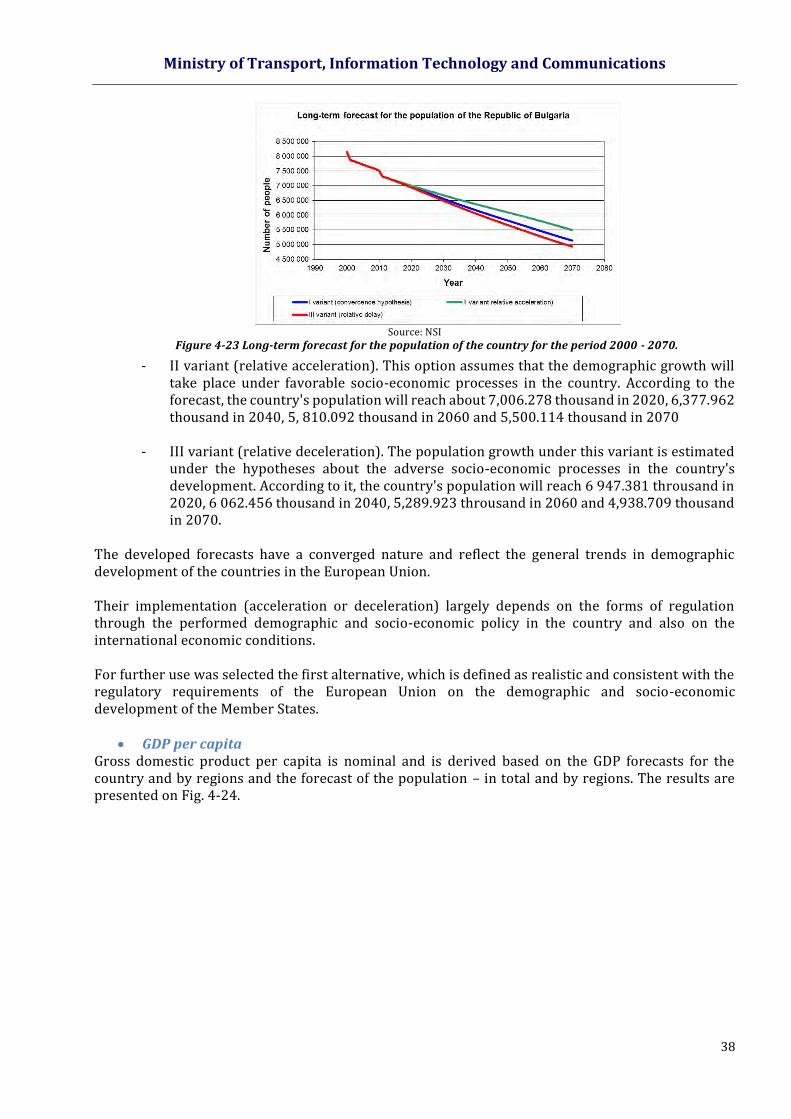
Ministry of Transport, Information Technology and Communications
38
Source: NSI
Figure 4-23 Long-term forecast for the population of the country for the period 2000 - 2070.
- II variant (relative acceleration). This option assumes that the demographic growth will take place under favorable socio-economic processes in the country. According to the forecast, the country's population will reach about 7,006.278 thousand in 2020, 6,377.962 thousand in 2040, 5, 810.092 thousand in 2060 and 5,500.114 thousand in 2070
- III variant (relative deceleration). The population growth under this variant is estimated
under the hypotheses about the adverse socio-economic processes in the country's development. According to it, the country's population will reach 6 947.381 throusand in 2020, 6 062.456 thousand in 2040, 5,289.923 throusand in 2060 and 4,938.709 thousand in 2070.
The developed forecasts have a converged nature and reflect the general trends in demographic development of the countries in the European Union. Their implementation (acceleration or deceleration) largely depends on the forms of regulation through the performed demographic and socio-economic policy in the country and also on the international economic conditions. For further use was selected the first alternative, which is defined as realistic and consistent with the regulatory requirements of the European Union on the demographic and socio-economic development of the Member States.
GDP per capita
Gross domestic product per capita is nominal and is derived based on the GDP forecasts for the country and by regions and the forecast of the population – in total and by regions. The results are presented on Fig. 4-24.
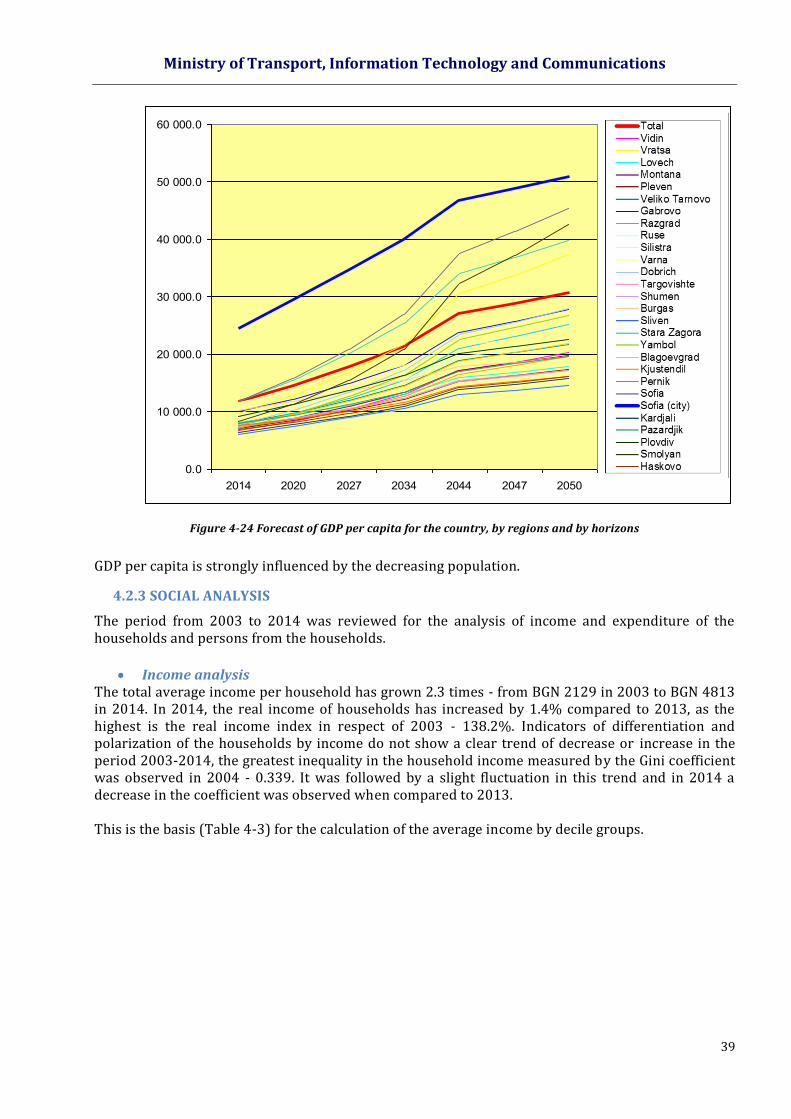
Ministry of Transport, Information Technology and Communications
39
Figure 4-24 Forecast of GDP per capita for the country, by regions and by horizons
GDP per capita is strongly influenced by the decreasing population.
4.2.3 SOCIAL ANALYSIS
The period from 2003 to 2014 was reviewed for the analysis of income and expenditure of the households and persons from the households.
Income analysis
The total average income per household has grown 2.3 times - from BGN 2129 in 2003 to BGN 4813 in 2014. In 2014, the real income of households has increased by 1.4% compared to 2013, as the highest is the real income index in respect of 2003 - 138.2%. Indicators of differentiation and polarization of the households by income do not show a clear trend of decrease or increase in the period 2003-2014, the greatest inequality in the household income measured by the Gini coefficient was observed in 2004 - 0.339. It was followed by a slight fluctuation in this trend and in 2014 a decrease in the coefficient was observed when compared to 2013. This is the basis (Table 4-3) for the calculation of the average income by decile groups.
0.0
10 000.0
20 000.0
30 000.0
40 000.0
50 000.0
60 000.0
2014 2020 2027 2034 2044 2047 2050
ОбщоВидинВрaцaЛoвeчМoнтaнaПлeвeнВeликo ТърнoвoГaбрoвoРaзгрaдРусeСилистрaВaрнaДoбричТъргoвищeШумeнБургaсСливeнСтaрaЗaгoрaЯмбoлБлaгoeвгрaдКюстeндилПeрникСoфияСoфия (стoлицa)КърджaлиПaзaрджикПлoвдивСмoлянХaскoвo
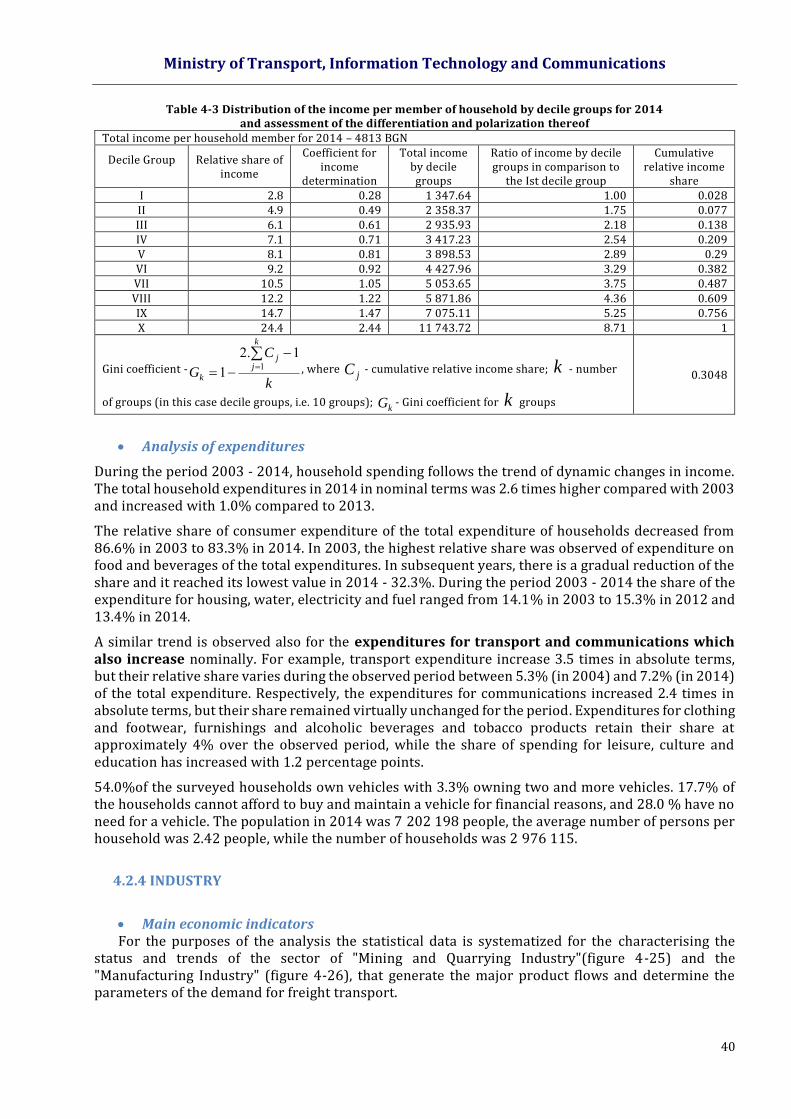
Ministry of Transport, Information Technology and Communications
40
Table 4-3 Distribution of the income per member of household by decile groups for 2014 and assessment of the differentiation and polarization thereof
Total income per household member for 2014 – 4813 BGN
Decile Group
Relative share of income
Coefficient for income
determination
Total income by decile groups
Ratio of income by decile groups in comparison to
the Ist decile group
Cumulative relative income
share I 2.8 0.28 1 347.64 1.00 0.028 II 4.9 0.49 2 358.37 1.75 0.077 III 6.1 0.61 2 935.93 2.18 0.138 IV 7.1 0.71 3 417.23 2.54 0.209 V 8.1 0.81 3 898.53 2.89 0.29 VI 9.2 0.92 4 427.96 3.29 0.382 VII 10.5 1.05 5 053.65 3.75 0.487 VIII 12.2 1.22 5 871.86 4.36 0.609 IX 14.7 1.47 7 075.11 5.25 0.756 X 24.4 2.44 11 743.72 8.71 1
Gini coefficient - , where - cumulative relative income share; - number
of groups (in this case decile groups, i.e. 10 groups); - Gini coefficient for groups
0.3048
Analysis of expenditures
During the period 2003 - 2014, household spending follows the trend of dynamic changes in income. The total household expenditures in 2014 in nominal terms was 2.6 times higher compared with 2003 and increased with 1.0% compared to 2013.
The relative share of consumer expenditure of the total expenditure of households decreased from 86.6% in 2003 to 83.3% in 2014. In 2003, the highest relative share was observed of expenditure on food and beverages of the total expenditures. In subsequent years, there is a gradual reduction of the share and it reached its lowest value in 2014 - 32.3%. During the period 2003 - 2014 the share of the expenditure for housing, water, electricity and fuel ranged from 14.1% in 2003 to 15.3% in 2012 and 13.4% in 2014.
A similar trend is observed also for the expenditures for transport and communications which also increase nominally. For example, transport expenditure increase 3.5 times in absolute terms, but their relative share varies during the observed period between 5.3% (in 2004) and 7.2% (in 2014) of the total expenditure. Respectively, the expenditures for communications increased 2.4 times in absolute terms, but their share remained virtually unchanged for the period. Expenditures for clothing and footwear, furnishings and alcoholic beverages and tobacco products retain their share at approximately 4% over the observed period, while the share of spending for leisure, culture and education has increased with 1.2 percentage points.
54.0%of the surveyed households own vehicles with 3.3% owning two and more vehicles. 17.7% of the households cannot afford to buy and maintain a vehicle for financial reasons, and 28.0 % have no need for a vehicle. The population in 2014 was 7 202 198 people, the average number of persons per household was 2.42 people, while the number of households was 2 976 115.
4.2.4 INDUSTRY
Main economic indicators For the purposes of the analysis the statistical data is systematized for the characterising the
status and trends of the sector of "Mining and Quarrying Industry"(figure 4-25) and the "Manufacturing Industry" (figure 4-26), that generate the major product flows and determine the parameters of the demand for freight transport.
k
C
G
k
jj
k
1
1.21 jC k
kG k
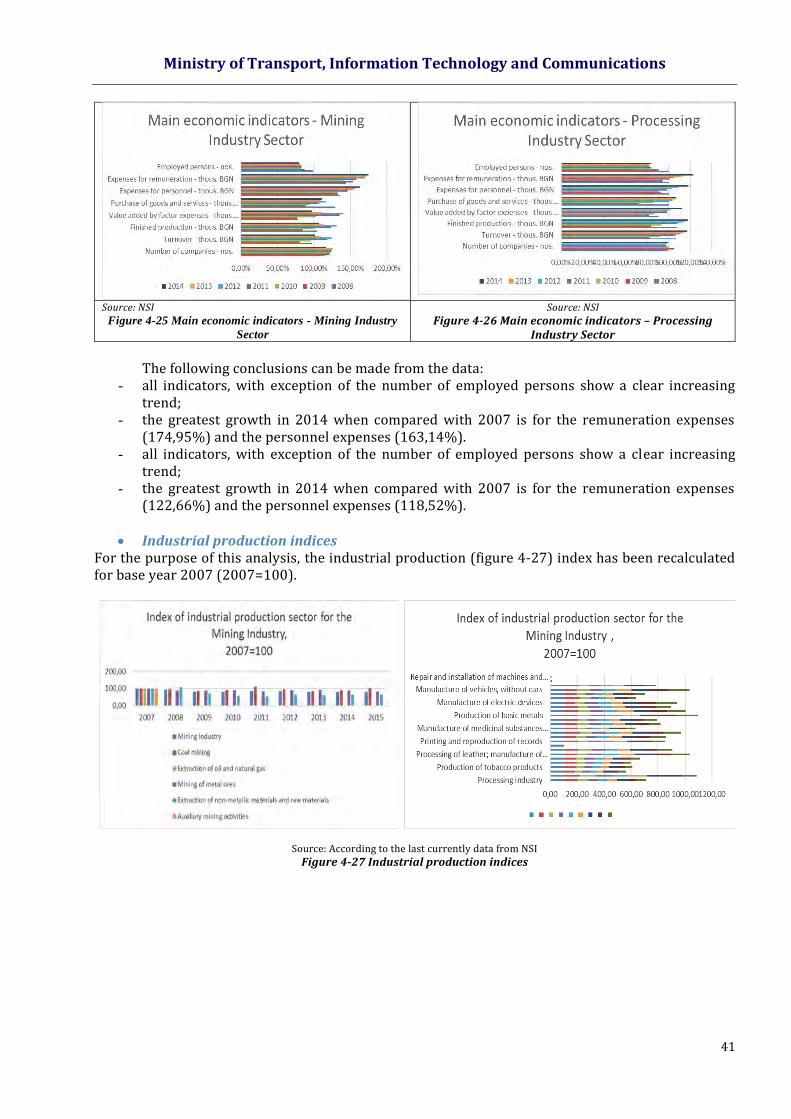
Ministry of Transport, Information Technology and Communications
41
Source: NSI
Figure 4-25 Main economic indicators - Mining Industry
Sector
Source: NSI
Figure 4-26 Main economic indicators – Processing Industry Sector
Тhe following conclusions can be made from the data:
- all indicators, with exception of the number of employed persons show a clear increasing trend;
- the greatest growth in 2014 when compared with 2007 is for the remuneration expenses (174,95%) and the personnel expenses (163,14%).
- all indicators, with exception of the number of employed persons show a clear increasing trend;
- the greatest growth in 2014 when compared with 2007 is for the remuneration expenses (122,66%) and the personnel expenses (118,52%).
Industrial production indices
For the purpose of this analysis, the industrial production (figure 4-27) index has been recalculated for base year 2007 (2007=100).
Source: According to the last currently data from NSI
Figure 4-27 Industrial production indices
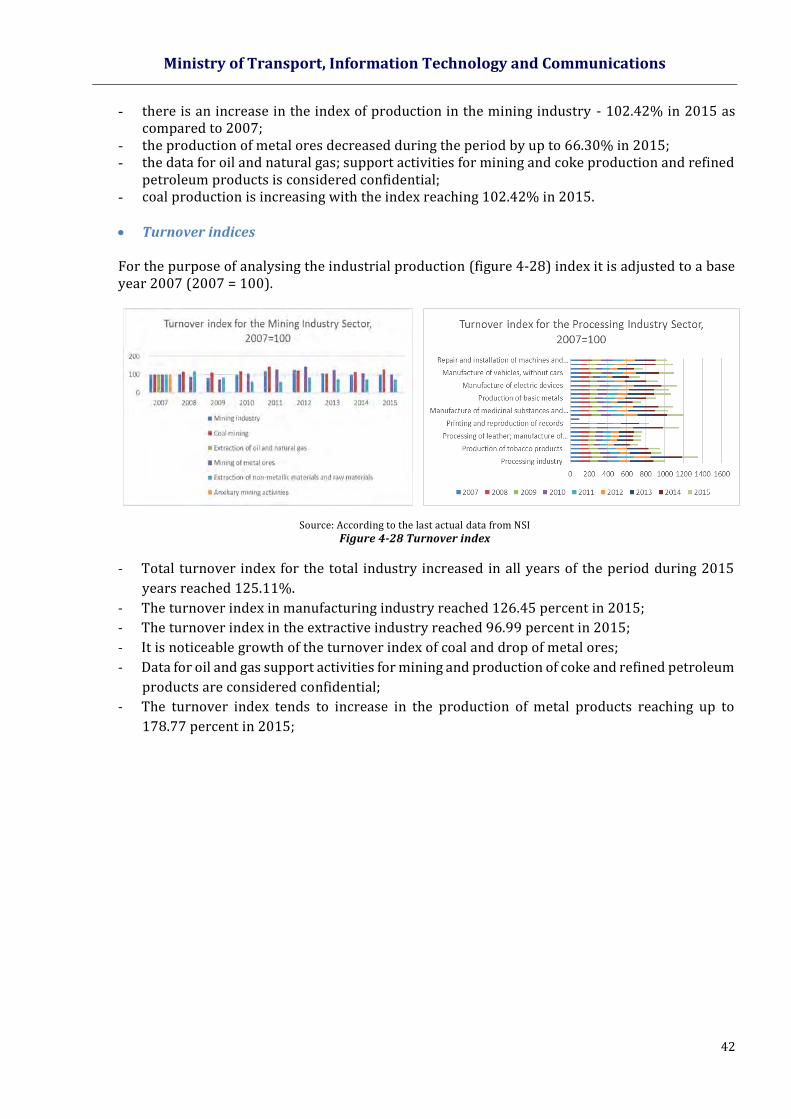
Ministry of Transport, Information Technology and Communications
42
- there is an increase in the index of production in the mining industry - 102.42% in 2015 as compared to 2007;
- the production of metal ores decreased during the period by up to 66.30% in 2015; - the data for oil and natural gas; support activities for mining and coke production and refined
petroleum products is considered confidential; - coal production is increasing with the index reaching 102.42% in 2015.
Turnover indices For the purpose of analysing the industrial production (figure 4-28) index it is adjusted to a base year 2007 (2007 = 100).
Source: According to the last actual data from NSI
Figure 4-28 Turnover index
- Total turnover index for the total industry increased in all years of the period during 2015
years reached 125.11%.
- The turnover index in manufacturing industry reached 126.45 percent in 2015;
- The turnover index in the extractive industry reached 96.99 percent in 2015;
- It is noticeable growth of the turnover index of coal and drop of metal ores;
- Data for oil and gas support activities for mining and production of coke and refined petroleum
products are considered confidential;
- The turnover index tends to increase in the production of metal products reaching up to
178.77 percent in 2015;
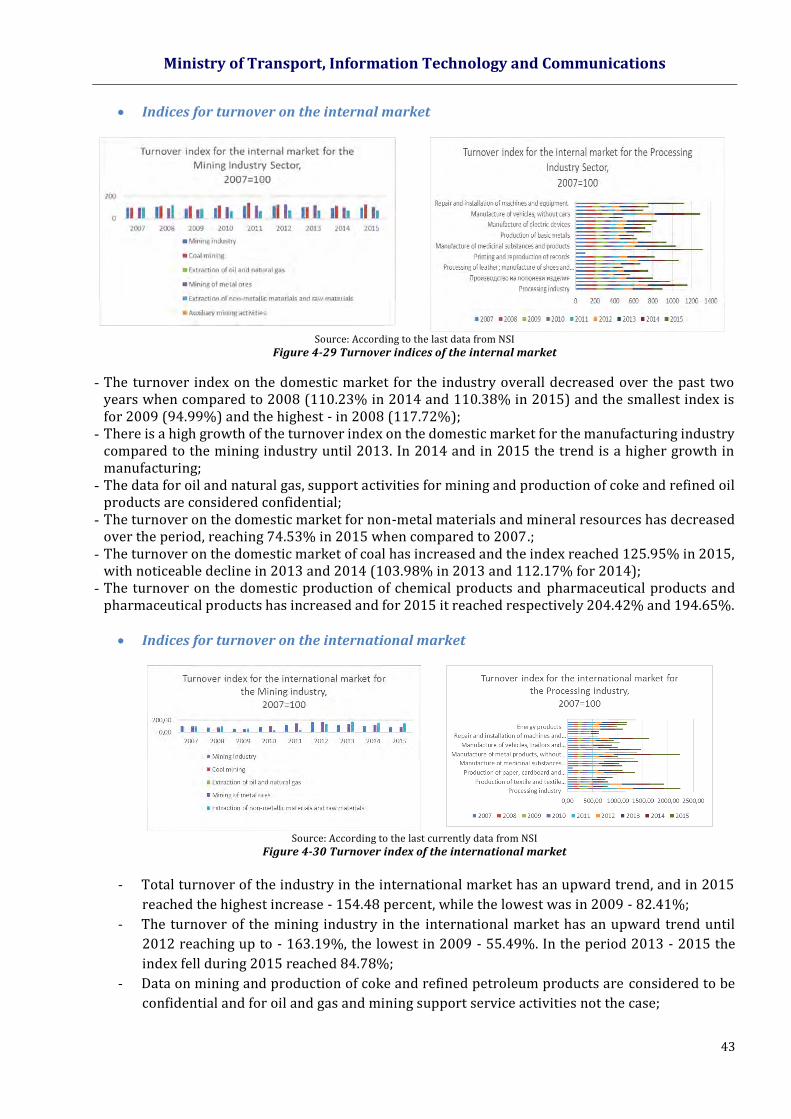
Ministry of Transport, Information Technology and Communications
43
Indices for turnover on the internal market
Source: According to the last data from NSI
Figure 4-29 Turnover indices of the internal market
- The turnover index on the domestic market for the industry overall decreased over the past two years when compared to 2008 (110.23% in 2014 and 110.38% in 2015) and the smallest index is for 2009 (94.99%) and the highest - in 2008 (117.72%);
- There is a high growth of the turnover index on the domestic market for the manufacturing industry compared to the mining industry until 2013. In 2014 and in 2015 the trend is a higher growth in manufacturing;
- The data for oil and natural gas, support activities for mining and production of coke and refined oil products are considered confidential;
- The turnover on the domestic market for non-metal materials and mineral resources has decreased over the period, reaching 74.53% in 2015 when compared to 2007.;
- The turnover on the domestic market of coal has increased and the index reached 125.95% in 2015, with noticeable decline in 2013 and 2014 (103.98% in 2013 and 112.17% for 2014);
- The turnover on the domestic production of chemical products and pharmaceutical products and pharmaceutical products has increased and for 2015 it reached respectively 204.42% and 194.65%.
Indices for turnover on the international market
Source: According to the last currently data from NSI
Figure 4-30 Turnover index of the international market
- Total turnover of the industry in the international market has an upward trend, and in 2015
reached the highest increase - 154.48 percent, while the lowest was in 2009 - 82.41%;
- The turnover of the mining industry in the international market has an upward trend until
2012 reaching up to - 163.19%, the lowest in 2009 - 55.49%. In the period 2013 - 2015 the
index fell during 2015 reached 84.78%;
- Data on mining and production of coke and refined petroleum products are considered to be
confidential and for oil and gas and mining support service activities not the case;
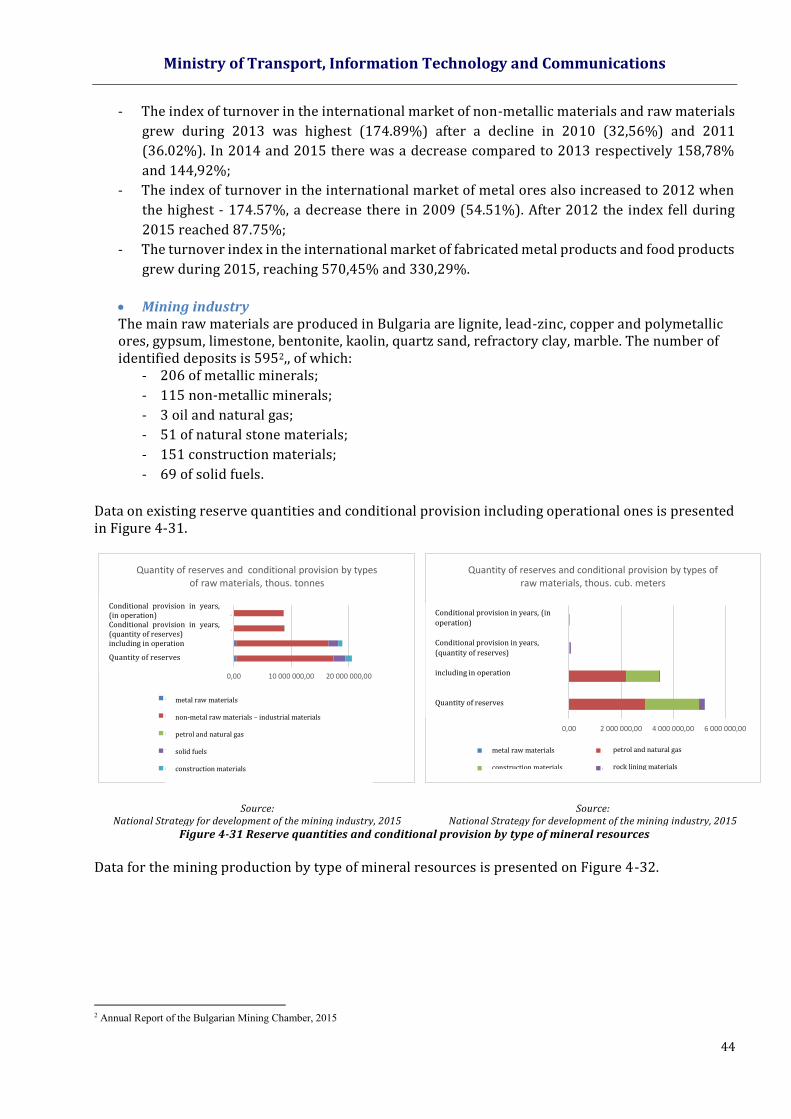
Ministry of Transport, Information Technology and Communications
44
- The index of turnover in the international market of non-metallic materials and raw materials
grew during 2013 was highest (174.89%) after a decline in 2010 (32,56%) and 2011
(36.02%). In 2014 and 2015 there was a decrease compared to 2013 respectively 158,78%
and 144,92%;
- The index of turnover in the international market of metal ores also increased to 2012 when
the highest - 174.57%, a decrease there in 2009 (54.51%). After 2012 the index fell during
2015 reached 87.75%;
- The turnover index in the international market of fabricated metal products and food products
grew during 2015, reaching 570,45% and 330,29%.
Mining industry The main raw materials are produced in Bulgaria are lignite, lead-zinc, copper and polymetallic ores, gypsum, limestone, bentonite, kaolin, quartz sand, refractory clay, marble. The number of identified deposits is 5952,, of which:
- 206 of metallic minerals;
- 115 non-metallic minerals;
- 3 oil and natural gas;
- 51 of natural stone materials;
- 151 construction materials;
- 69 of solid fuels.
Data on existing reserve quantities and conditional provision including operational ones is presented in Figure 4-31.
Source: National Strategy for development of the mining industry, 2015
Source: National Strategy for development of the mining industry, 2015
Figure 4-31 Reserve quantities and conditional provision by type of mineral resources
Data for the mining production by type of mineral resources is presented on Figure 4-32.
2 Annual Report of the Bulgarian Mining Chamber, 2015
0,00 10 000 000,00 20 000 000,00
КОЛИЧЕСТВО ЗАПАСИ
В Т.Ч. В ЕКСПЛОАТАЦИЯ
УСЛОВНА ОСИГУРЕНОСТ В ГОДИНИ …
УСЛОВНА ОСИГУРЕНОСТ В ГОДИНИ …
Quantity of reserves and conditional provision by types of raw materials, thous. tonnes
метални полезни изкопаеми
неметални полезни изкопаеми-индустриални материали
нефт и природен газ
твърди горива
строителни материали
0,00 2 000 000,00 4 000 000,00 6 000 000,00
КОЛИЧЕСТВО ЗАПАСИ
В Т.Ч. В ЕКСПЛОАТАЦИЯ
УСЛОВНА ОСИГУРЕНОСТ В ГОДИНИ (количество запаси)
УСЛОВНА ОСИГУРЕНОСТ В ГОДИНИ (в експлоатация)
Quantity of reserves and conditional provision by types of raw materials, thous. cub. meters
метални полезни изкопаеми нефт и природен газ
строителни материали скално-облицовъчни материали
Conditional provision in years, (in
operation)
Conditional provision in years,
(quantity of reserves)
including in operation
Quantity of reserves
Conditional provision in years, (in operation) Conditional provision in years, (quantity of reserves) including in operation
Quantity of reserves
metal raw materials
construction materials
metal raw materials
non-metal raw materials – industrial materials
petrol and natural gas
solid fuels
construction materials
petrol and natural gas rock lining materials
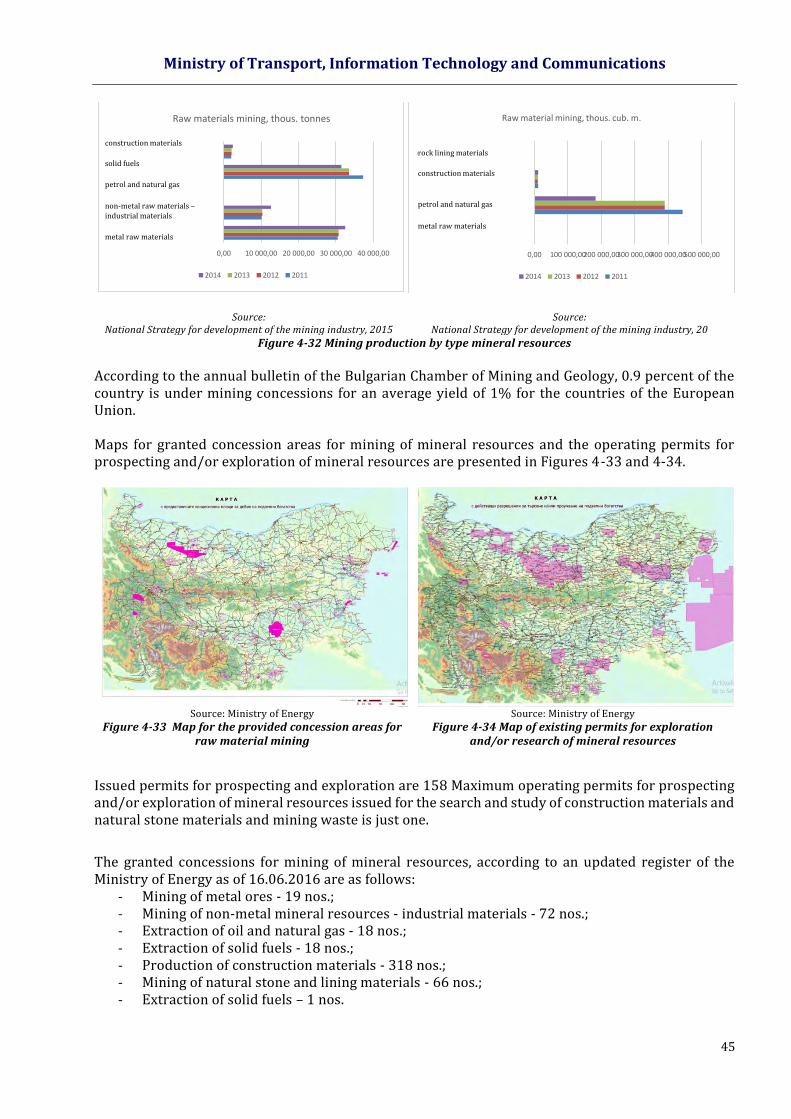
Ministry of Transport, Information Technology and Communications
45
Source: National Strategy for development of the mining industry, 2015
Source: National Strategy for development of the mining industry, 20
Figure 4-32 Mining production by type mineral resources
According to the annual bulletin of the Bulgarian Chamber of Mining and Geology, 0.9 percent of the country is under mining concessions for an average yield of 1% for the countries of the European Union. Maps for granted concession areas for mining of mineral resources and the operating permits for prospecting and/or exploration of mineral resources are presented in Figures 4-33 and 4-34.
Source: Ministry of Energy
Figure 4-33 Map for the provided concession areas for raw material mining
Source: Ministry of Energy
Figure 4-34 Map of existing permits for exploration and/or research of mineral resources
Issued permits for prospecting and exploration are 158 Maximum operating permits for prospecting and/or exploration of mineral resources issued for the search and study of construction materials and natural stone materials and mining waste is just one.
The granted concessions for mining of mineral resources, according to an updated register of the Ministry of Energy as of 16.06.2016 are as follows:
- Mining of metal ores - 19 nos.; - Mining of non-metal mineral resources - industrial materials - 72 nos.; - Extraction of oil and natural gas - 18 nos.; - Extraction of solid fuels - 18 nos.; - Production of construction materials - 318 nos.; - Mining of natural stone and lining materials - 66 nos.; - Extraction of solid fuels – 1 nos.
0,00 10 000,00 20 000,00 30 000,00 40 000,00
метални полезни изкопаеми
неметални полезни изкопаеми-индустриални материали
нефт и природен газ
твърди горива
строителни материали
Raw materials mining, thous. tonnes
2014 2013 2012 2011
construction materials
solid fuels
petrol and natural gas
non-metal raw materials –industrial materials
metal raw materials
0,00 100 000,00200 000,00300 000,00400 000,00500 000,00
метални полезни изкопаеми
нефт и природен газ
строителни материали
скално-облицовъчни материали
Raw material mining, thous. cub. m.
2014 2013 2012 2011
rock lining materials
construction materials
petrol and natural gas
metal raw materials

Ministry of Transport, Information Technology and Communications
46
Processing industry
Table 4-4 Main data for the processing industry
Sector
Percentage of the total industrial
production for the country
Percentage of the added value in the
industry
Percentage of the
employed in the sector out of the
total
Average monthly
remuneration
Share of the sector for import
Leading export destinations
PRODUCTION OF ХРАНИТЕЛНИ PRODUCTS (C10) 14% 14% 15% 540 BGN 7.9% Greece, Romania, Turkey, France и Germany
PRODUCTION OF BEVERAGES (C11) 3% 4% 3% 830 BGN 0.6% Russia, Greece, Poland, Romania, Turkey
PRODUCTION OF TOBACCO PRODUCTS (C12) 2% 1% 1% 1 600 BGN 1.2% United Arab Emirates, Iraq, Montenegro, Ukraine and Philippines
PRODUCTION OF TEXTILE AND ITEMS OF TEXTILE, WITHOUT CLOTHING (C13)
1% 2% 2% 540 BGN 2.1% Italy, Great Britain, Germany, Turkey and Greece
PRODUCTION OF CLOTHING (C14) 4% 9% 20% 390 BGN 7.6% Germany, Italy, Greece, France and Great Britain
PROCESSING OF LETHER, PRODUCTION OF SHOES AND OTHER ITEMS OF PROCESSED FURS
1% 2% 3% 360 BGN 1.3% Italy, Hungary, Greece, France and Germany
PRODUCTION OF WOOD MATERIAL AND ITEMS OF WOOD MATERIAL AND CORK, WOHTOUT FURNITURE; PRODUCTION OF ITEMS OF HAY AND MATERIALS FOR KNITTING (С16)
1.5% 1.5% 3.1% 383 BGN 1.2% Turkey, Greece, Italy, France and Macedonia
PRODUCTION OF PAPER, CARD BOARD AND ITEMS OF PAPER AND CARDBOARD (C17)
1.7% 2.0% 1.7% 574 BGN 1.5% Greece, Romania, Turkey, Italy and Germany
PRINTING AND REPRODUCTION OF ELECTRONIC MEANS (C18)
1.2% 2.0% 1.7% 598 BGN 0.001% Germany, Turkey, Greece, Macedonia and Ukraine
PRODUCTION OF CHEMICAL PRODUCTS (C20) 4.5% 4.7% 2.6% 897 BGN 5.0% Romania, Turkey, Italy, Greece and France
PRODUCTION OF ITEMS OF RUBBER AND PLASTIC (C22)
3.2% 4.1% 4.6% 529 BGN 3.3% Germany, Romania, Greece, Italy and Poland
PRODUCTION OF ITEMS OF OTHER NON-METAL MINERAL RESOURCES (C23)
4.2% 6.9% 4% 729 BGN 2.6% Romania, Greece, Italy, Germany and Great Britain
PRODUCTION OF BASIC METALS (С24) 14.9% 9% 2.2% 1 059 BGN 17.8% Germany, Turkey, China, Italy and Romania
PRODUCTION OF METAL ITEMS, WITHOUT MACHINES AND EQUIPMENT (С25)
5.1% 8.5% 10.2% 577 BGN 2.7% Germany, Italy, Romania, Greece and Russia
RODUCTION OF COMPUTES, ELECTRONIC AND OPTIC PRODUCTS (С26)
1.2% 2.4% 1.6% 926 BGN 3.6% Germany, Romania, Italy, USA and France
PRODUCTION OF ELECTRIC EQUIPMENT (С27) 4.1% 4.3% 3.8% 850 BGN 7.1% Germany, France, Netherlands, Italy and Greece
PRODUCTION OF MACHINES AND EQUIPMENT WITH GENERAL AND SPECIFIC PURPOSE (С28)
4.5% 6.8% 5.8% 849 BGN 7.7% Romania, Germany, Italy, Russia and France
PRODUCTION OF CARS, TRAILORS AND SEMI-TRAILORS (С29)
2.3% 2.6% 2.4% 694 BGN 2.9% Germany, Turkey, Romania, France and Russia
PRODUCTION OF VEHICLES, WITHOUT CARS (С30) 0.9% 0.5% 0.9% 738 BGN 1.2% Germany, France, USA, Belgium and Greece
PRODUCTION OF FURNITURE (С31) 1.6% 2.1% 4.2% 400 BGN 1.3% Germany, Italy, France, Check Republic and Great Britain
Source: Ministry of Economy of the Republic of Bulgaria, Amadeius Database,
Demographics of industrial enterprises Figure 4-35 presents business demographics of enterprises from the sectors mining and processing industry.
Source: National Statistical Institute
Figure 4-35 Business demography of the Mining industry sector and Processing industry sector enterprises
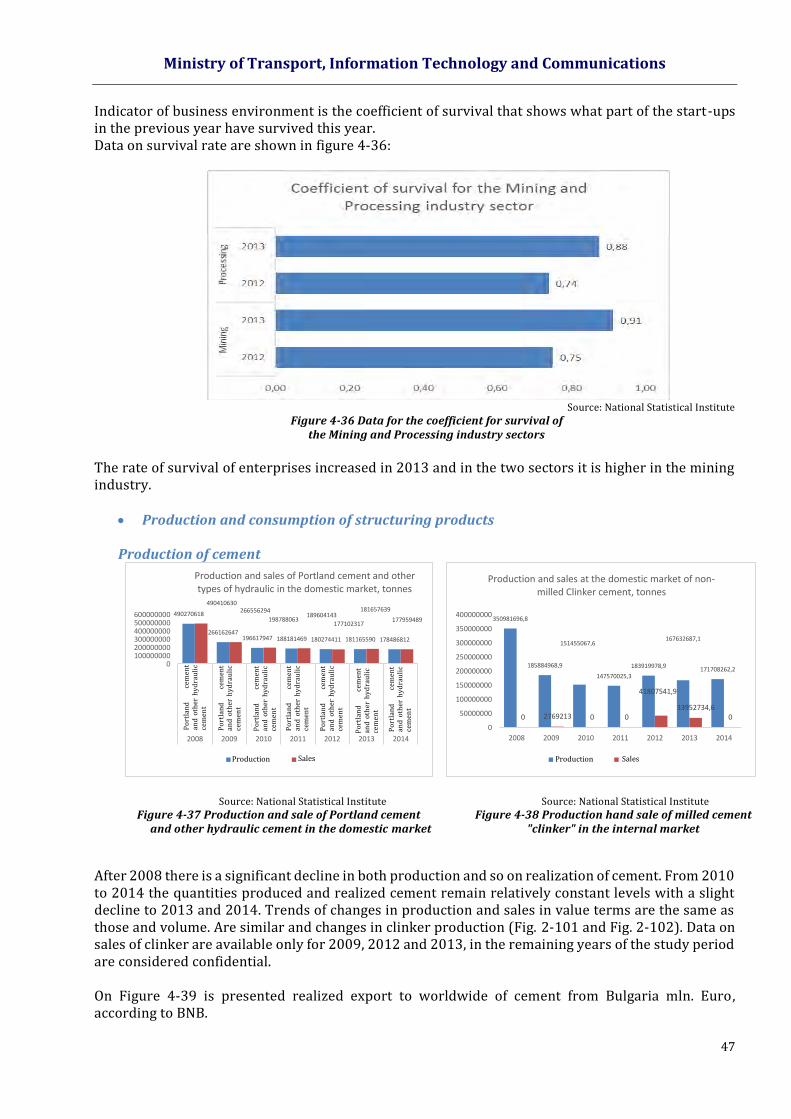
Ministry of Transport, Information Technology and Communications
47
Indicator of business environment is the coefficient of survival that shows what part of the start-ups in the previous year have survived this year. Data on survival rate are shown in figure 4-36:
Source: National Statistical Institute
Figure 4-36 Data for the coefficient for survival of the Mining and Processing industry sectors
The rate of survival of enterprises increased in 2013 and in the two sectors it is higher in the mining industry.
Production and consumption of structuring products
Production of cement
Source: National Statistical Institute
Figure 4-37 Production and sale of Portland cement and other hydraulic cement in the domestic market
Source: National Statistical Institute
Figure 4-38 Production hand sale of milled cement "clinker" in the internal market
After 2008 there is a significant decline in both production and so on realization of cement. From 2010 to 2014 the quantities produced and realized cement remain relatively constant levels with a slight decline to 2013 and 2014. Trends of changes in production and sales in value terms are the same as those and volume. Are similar and changes in clinker production (Fig. 2-101 and Fig. 2-102). Data on sales of clinker are available only for 2009, 2012 and 2013, in the remaining years of the study period are considered confidential. On Figure 4-39 is presented realized export to worldwide of cement from Bulgaria mln. Euro, according to BNB.
490270618
266162647196617947 188181469 180274411 181165590 178486812
490410630266556294
198788063189604143
177102317
181657639
177959489
0100000000200000000300000000400000000500000000600000000
Портландцимент
и други видове
хидравличен …
Портландцимент
и други видове
хидравличен …
Портландцимент
и други видове
хидравличен …
Портландцимент
и други видове
хидравличен …
Портландцимент
и други видове
хидравличен …
Портландцимент
и други видове
хидравличен …
Портландцимент
и други видове
хидравличен …
2008 2009 2010 2011 2012 2013 2014
Production and sales of Portland cement and other types of hydraulic in the domestic market, tonnes
Производство Продажби
350981696,8
185884968,9
151455067,6
147570025,3
183919978,9
167632687,1
171708262,2
0 2769213 0 0
41807541,9
33952734,60
0
50000000
100000000
150000000
200000000
250000000
300000000
350000000
400000000
2008 2009 2010 2011 2012 2013 2014
Production and sales at the domestic market of non-milled Clinker cement, tonnes
Производство Продажби
Po
rtla
nd
ce
men
t an
d o
ther
hy
dra
uli
c ce
men
t
Po
rtla
nd
ce
men
t an
d o
ther
hy
dra
uli
c ce
men
t
Po
rtla
nd
ce
men
t an
d o
ther
hy
dra
uli
c ce
men
t
Po
rtla
nd
ce
men
t an
d o
ther
hy
dra
uli
c ce
men
t
Po
rtla
nd
ce
me
nt
and
oth
er h
yd
rau
lic
cem
ent
Po
rtla
nd
ce
men
t an
d o
ther
hy
dra
uli
c ce
men
t
Po
rtla
nd
ce
men
t an
d o
ther
hy
dra
uli
c ce
men
t
Production Production Sales Sales
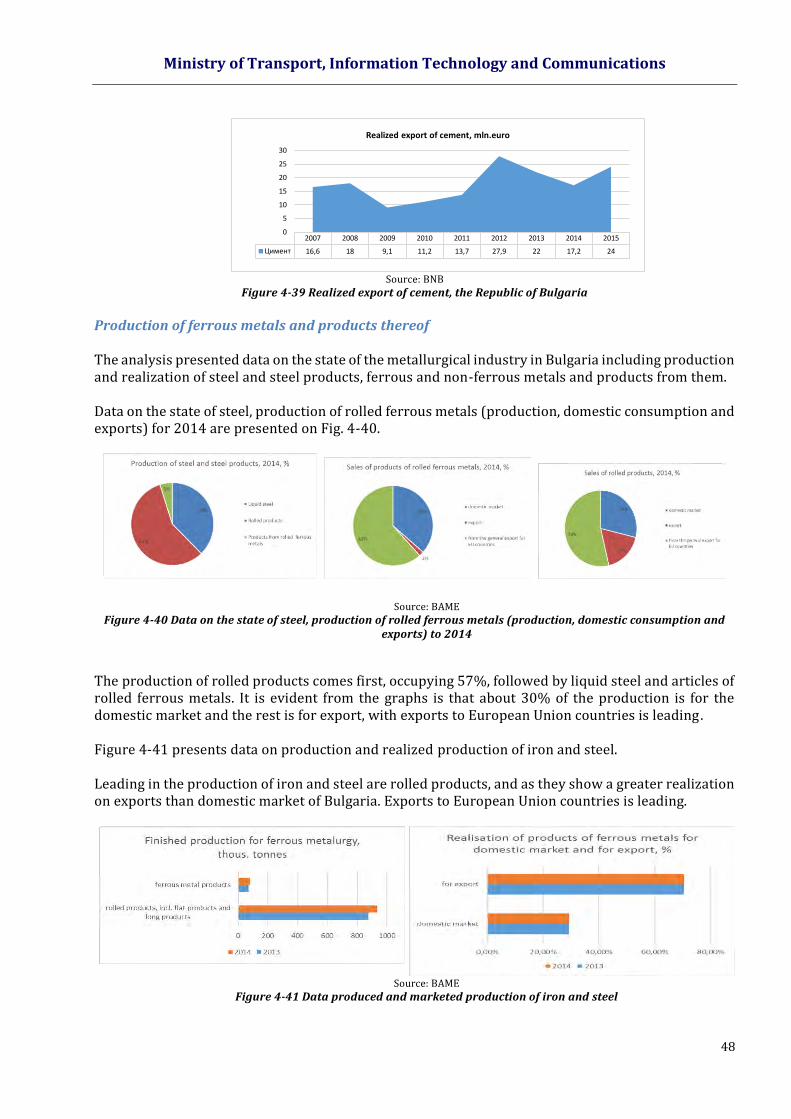
Ministry of Transport, Information Technology and Communications
48
Source: BNB
Figure 4-39 Realized export of cement, the Republic of Bulgaria
Production of ferrous metals and products thereof The analysis presented data on the state of the metallurgical industry in Bulgaria including production and realization of steel and steel products, ferrous and non-ferrous metals and products from them. Data on the state of steel, production of rolled ferrous metals (production, domestic consumption and exports) for 2014 are presented on Fig. 4-40.
Source: BAME
Figure 4-40 Data on the state of steel, production of rolled ferrous metals (production, domestic consumption and exports) to 2014
The production of rolled products comes first, occupying 57%, followed by liquid steel and articles of rolled ferrous metals. It is evident from the graphs is that about 30% of the production is for the domestic market and the rest is for export, with exports to European Union countries is leading. Figure 4-41 presents data on production and realized production of iron and steel. Leading in the production of iron and steel are rolled products, and as they show a greater realization on exports than domestic market of Bulgaria. Exports to European Union countries is leading.
Source: BAME
Figure 4-41 Data produced and marketed production of iron and steel
2007 2008 2009 2010 2011 2012 2013 2014 2015
Цимент 16,6 18 9,1 11,2 13,7 27,9 22 17,2 24
0
5
10
15
20
25
30
Realized export of cement, mln.euro
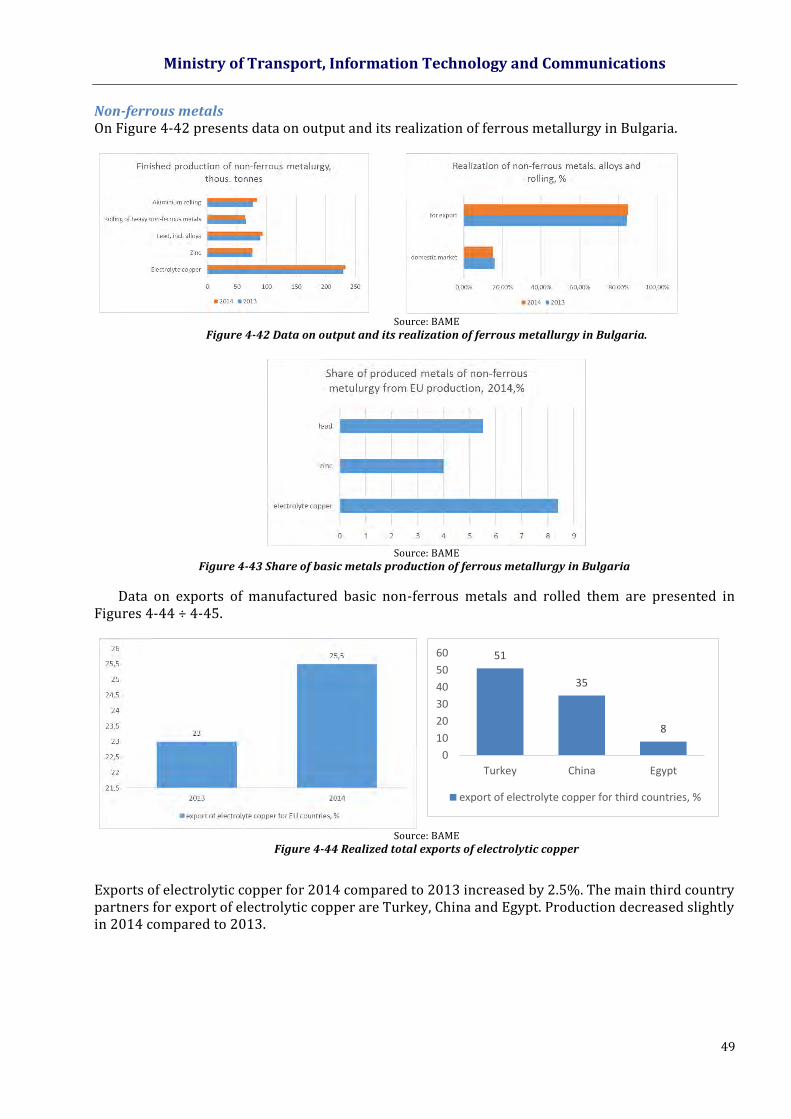
Ministry of Transport, Information Technology and Communications
49
Non-ferrous metals On Figure 4-42 presents data on output and its realization of ferrous metallurgy in Bulgaria.
Source: BAME
Figure 4-42 Data on output and its realization of ferrous metallurgy in Bulgaria.
Source: BAME
Figure 4-43 Share of basic metals production of ferrous metallurgy in Bulgaria
Data on exports of manufactured basic non-ferrous metals and rolled them are presented in Figures 4-44 ÷ 4-45.
Source: BAME
Figure 4-44 Realized total exports of electrolytic copper
Exports of electrolytic copper for 2014 compared to 2013 increased by 2.5%. The main third country partners for export of electrolytic copper are Turkey, China and Egypt. Production decreased slightly in 2014 compared to 2013.
51
35
8
0
10
20
30
40
50
60
Turkey China Egypt
export of electrolyte copper for third countries, %
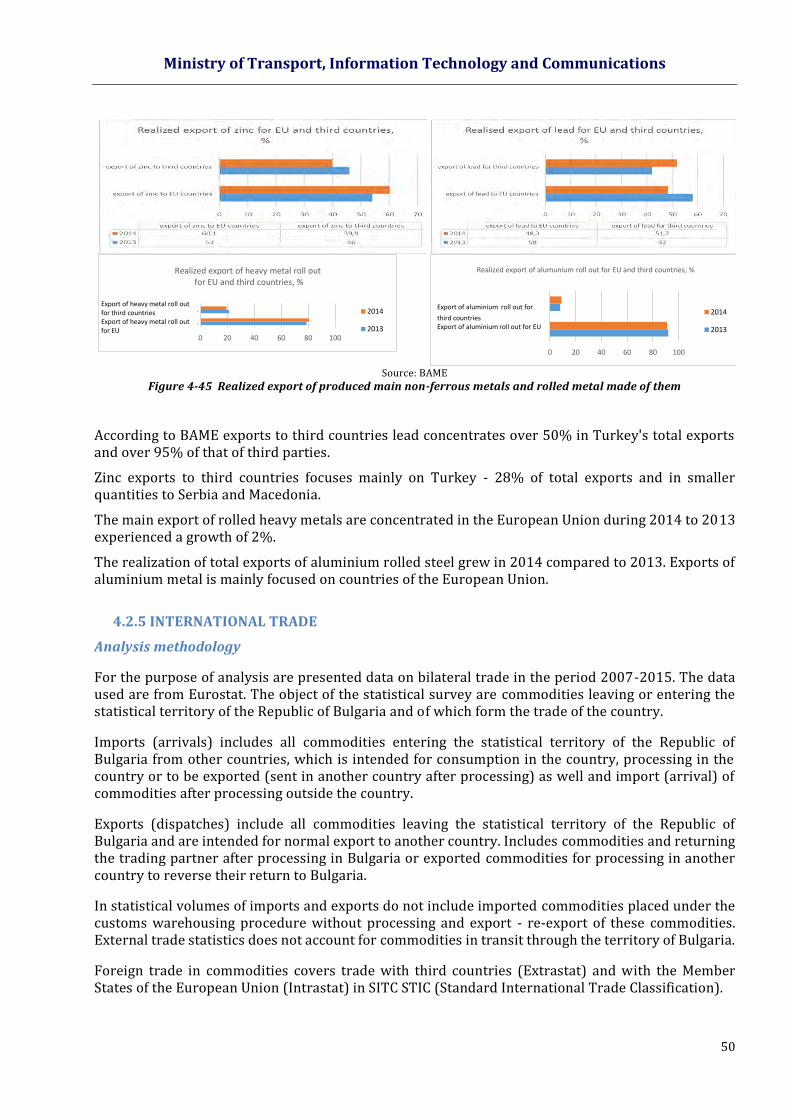
Ministry of Transport, Information Technology and Communications
50
Source: BAME
Figure 4-45 Realized export of produced main non-ferrous metals and rolled metal made of them
According to BAME exports to third countries lead concentrates over 50% in Turkey's total exports and over 95% of that of third parties.
Zinc exports to third countries focuses mainly on Turkey - 28% of total exports and in smaller quantities to Serbia and Macedonia.
The main export of rolled heavy metals are concentrated in the European Union during 2014 to 2013 experienced a growth of 2%.
The realization of total exports of aluminium rolled steel grew in 2014 compared to 2013. Exports of aluminium metal is mainly focused on countries of the European Union.
4.2.5 INTERNATIONAL TRADE
Analysis methodology
For the purpose of analysis are presented data on bilateral trade in the period 2007-2015. The data used are from Eurostat. The object of the statistical survey are commodities leaving or entering the statistical territory of the Republic of Bulgaria and of which form the trade of the country.
Imports (arrivals) includes all commodities entering the statistical territory of the Republic of Bulgaria from other countries, which is intended for consumption in the country, processing in the country or to be exported (sent in another country after processing) as well and import (arrival) of commodities after processing outside the country.
Exports (dispatches) include all commodities leaving the statistical territory of the Republic of Bulgaria and are intended for normal export to another country. Includes commodities and returning the trading partner after processing in Bulgaria or exported commodities for processing in another country to reverse their return to Bulgaria.
In statistical volumes of imports and exports do not include imported commodities placed under the customs warehousing procedure without processing and export - re-export of these commodities. External trade statistics does not account for commodities in transit through the territory of Bulgaria.
Foreign trade in commodities covers trade with third countries (Extrastat) and with the Member States of the European Union (Intrastat) in SITC STIC (Standard International Trade Classification).
0 20 40 60 80 100
износ на прокат от тежки …
износ на прокат от тежки …
Realized export of heavy metal roll out for EU and third countries, %
2014
2013
Export of heavy metal roll out for third countriesExport of heavy metal roll out for EU
0 20 40 60 80 100
износ на алуминиев прокат за страни от ЕС
износ на алуминиев прокат за трети страни
Realized export of alumunium roll out for EU and third countries, %
2014
2013
Export of aluminium roll out for
third countriesExport of aluminium roll out for EU

Ministry of Transport, Information Technology and Communications
51
Foreign trade in commodities covers trade the modes of transport with third countries (Extrastat) Nomenclature NSTR.
Trade turnover is analysed in physical units (tons) by commodity groups corresponding to the following sections and combinations thereof:
- Exports and imports by country partners;
- Exports and imports by type of transport (only for non-EU countries);
- Exports and imports by type of transport and by commodity groups;
- Exports and imports in modes of structural freight transport modes (only for non-EU
countries);
- Concrete structural loads for modal key partners (air, inland waterway, road, rail and sea);
The objectives of the analysis are: - Determination of modal shares of transport modes (rail, road, air, sea and inland) in
international trade; - Determination of trends in the development of international freight; - Identification of structurally kinds of cargo for international transport; - Identify key areas and key partners for international trade for the transport modes;
Trade flow (export and import)
Data on the number of partner countries total and by year for commodity groups are presented in Figure 4-46.
Figure 4-46 Number of partner countries by commodity groups – exports and import (2007-2015)
- For the period 2007- 2015 export from Bulgaria was realized to 222 countries and imports from 201 and outside the EU;
- The total number of partner countries varies by commodity groups; - At most - a large number of countries the export of commodities from groups 7 - Machines,
equipment and vehicles; 6 - Industrial commodities classified chiefly by material and 8 - Miscellaneous manufactured articles.
- From the largest number of countries, imports of commodities from groups 7 - Machines, equipment and vehicles and 2 - Raw materials, inedible except fuels.
0 20 40 60 80 100 120 140 160 180
0 - Храни и живи животни
1 - Напитки и тютюн
2 - Необработени материали, негодни …
3 - Минерални горива, масла и …
4 - животински и растителни масла, …
5 - Химикали и свързани с тях …
6 - Промишлени стоки, …
7 - Машини, оборудване и превозни …
8 - Разни видове изделия
9 - стоки и сделки, които не са …
Number of partner countries by groups of commodities -export
2015 2014 2013 2012 2011 2010 2009 2008 2007
0 20 40 60 80 100 120 140
0 - Храни и живи животни
1 - Напитки и тютюн
2 - Необработени материали, …
3 - Минерални горива, масла и …
4 - животински и растителни масла, …
5 - Химикали и свързани с тях …
6 - Промишлени стоки, …
7 - Машини, оборудване и превозни …
8 - Разни видове изделия
9 - стоки и сделки, които не са …
Number of partner countries by groups of commodities -import
2015 2014 2013 2012 2011 2010 2009 2008 2007
9 – commodities and transactions, which are not included elsewhere in SITC 8 – various types of items 7 – machines, equipment and transport vehicles 6 – industrial commodities classified mainly according to the type of material 5 – chemicals and products related thereto, n.e.s . 4 – animal and vegetable oils, fats and waxes 3 – Mineral fuels, oils and similar products 2 – Non-processed materials, unfit for consumption, with exception of fuels 1 – drinks and tobacco 0 - food and livestock
9 – commodities and transactions, which are not included elsewhere in SITC 8 – various types of items 7 – machines, equipment and transport vehicles 6 – industrial commodities classified mainly according to the type of material 5 – chemicals and products related thereto, n.e.s. 4 – animal and vegetable oils, fats and waxes 3 – Mineral fuels, oils and similar products 2 – Non-processed materials, unfit for consumption, with exception of fuels 1 – drinks and tobacco 0 - food and livestock
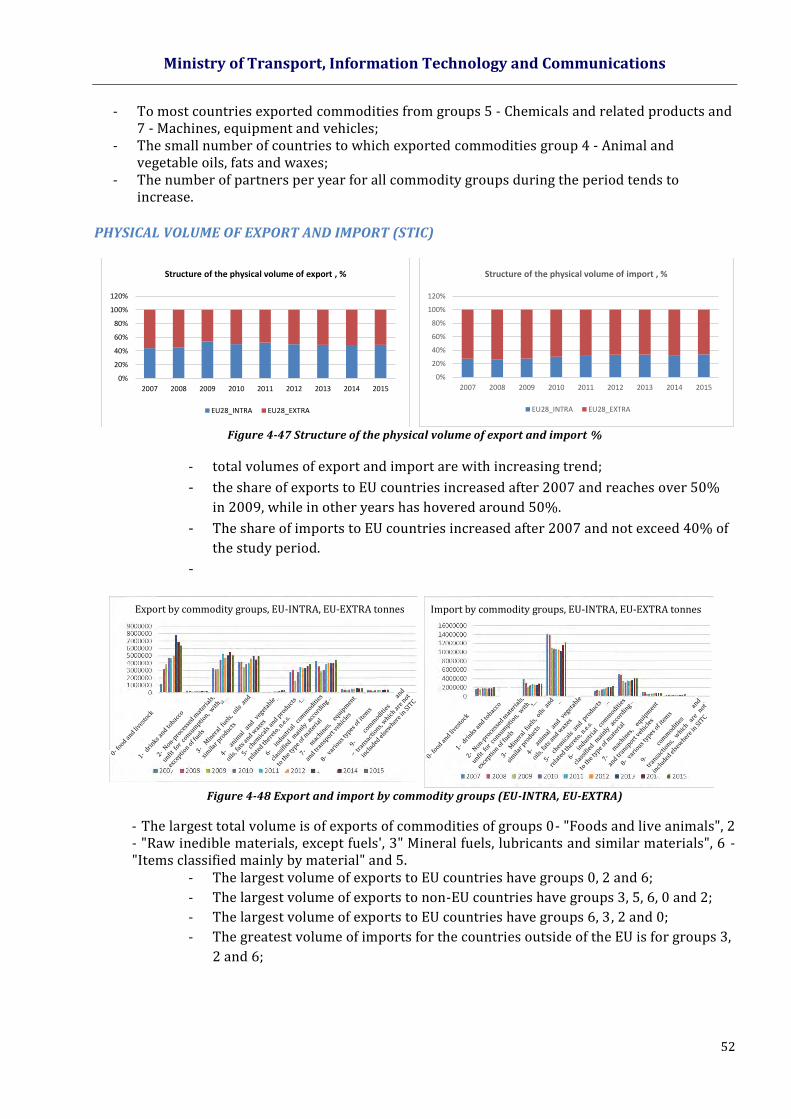
Ministry of Transport, Information Technology and Communications
52
- To most countries exported commodities from groups 5 - Chemicals and related products and 7 - Machines, equipment and vehicles;
- The small number of countries to which exported commodities group 4 - Animal and vegetable oils, fats and waxes;
- The number of partners per year for all commodity groups during the period tends to increase.
PHYSICAL VOLUME OF EXPORT AND IMPORT (STIC)
Figure 4-47 Structure of the physical volume of export and import %
- total volumes of export and import are with increasing trend;
- the share of exports to EU countries increased after 2007 and reaches over 50%
in 2009, while in other years has hovered around 50%.
- The share of imports to EU countries increased after 2007 and not exceed 40% of
the study period.
-
Figure 4-48 Export and import by commodity groups (EU-INTRA, EU-EXTRA)
- The largest total volume is of exports of commodities of groups 0- "Foods and live animals", 2 - "Raw inedible materials, except fuels', 3" Mineral fuels, lubricants and similar materials", 6 - "Items classified mainly by material" and 5.
- The largest volume of exports to EU countries have groups 0, 2 and 6;
- The largest volume of exports to non-EU countries have groups 3, 5, 6, 0 and 2;
- The largest volume of exports to EU countries have groups 6, 3, 2 and 0;
- The greatest volume of imports for the countries outside of the EU is for groups 3,
2 and 6;
0%
20%
40%
60%
80%
100%
120%
2007 2008 2009 2010 2011 2012 2013 2014 2015
Structure of the physical volume of export , %
EU28_INTRA EU28_EXTRA
0%
20%
40%
60%
80%
100%
120%
2007 2008 2009 2010 2011 2012 2013 2014 2015
Structure of the physical volume of import , %
EU28_INTRA EU28_EXTRA
Export by commodity groups, EU-INTRA, EU-EXTRA tonnes Import by commodity groups, EU-INTRA, EU-EXTRA tonnes
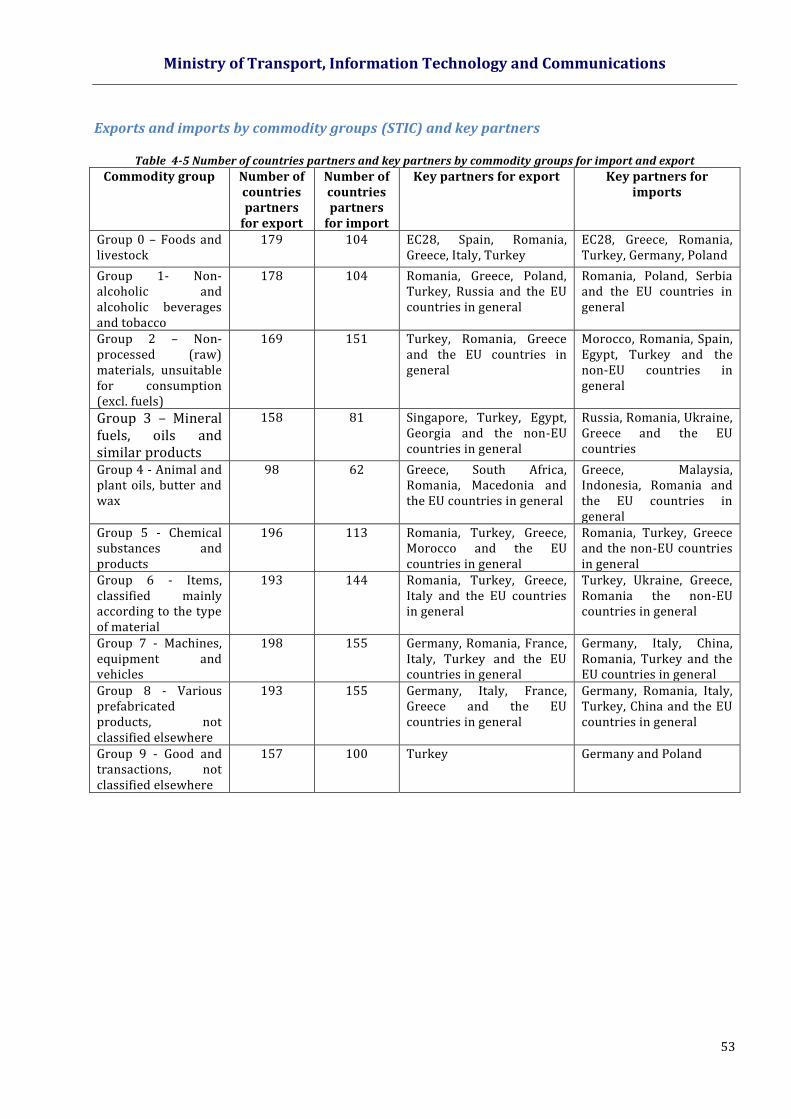
Ministry of Transport, Information Technology and Communications
53
Exports and imports by commodity groups (STIC) and key partners
Table 4-5 Number of countries partners and key partners by commodity groups for import and export
Commodity group Number of countries partners
for export
Number of countries partners
for import
Key partners for export Key partners for imports
Group 0 – Foods and livestock
179 104 ЕС28, Spain, Romania, Greece, Italy, Turkey
ЕС28, Greece, Romania, Turkey, Germany, Poland
Group 1- Non-alcoholic and alcoholic beverages and tobacco
178 104 Romania, Greece, Poland, Turkey, Russia and the EU countries in general
Romania, Poland, Serbia and the EU countries in general
Group 2 – Non-processed (raw) materials, unsuitable for consumption (excl. fuels)
169 151 Turkey, Romania, Greece and the EU countries in general
Morocco, Romania, Spain, Egypt, Turkey and the non-EU countries in general
Group 3 – Mineral fuels, oils and similar products
158 81 Singapore, Turkey, Egypt, Georgia and the non-EU countries in general
Russia, Romania, Ukraine, Greece and the EU countries
Group 4 - Animal and plant oils, butter and wax
98 62 Greece, South Africa, Romania, Macedonia and the EU countries in general
Greece, Malaysia, Indonesia, Romania and the EU countries in general
Group 5 - Chemical substances and products
196 113 Romania, Turkey, Greece, Morocco and the EU countries in general
Romania, Turkey, Greece and the non-EU countries in general
Group 6 - Items, classified mainly according to the type of material
193 144 Romania, Turkey, Greece, Italy and the EU countries in general
Turkey, Ukraine, Greece, Romania the non-EU countries in general
Group 7 - Machines, equipment and vehicles
198 155 Germany, Romania, France, Italy, Turkey and the EU countries in general
Germany, Italy, China, Romania, Turkey and the EU countries in general
Group 8 - Various prefabricated products, not classified elsewhere
193 155 Germany, Italy, France, Greece and the EU countries in general
Germany, Romania, Italy, Turkey, China and the EU countries in general
Group 9 - Good and transactions, not classified elsewhere
157 100 Turkey Germany and Poland
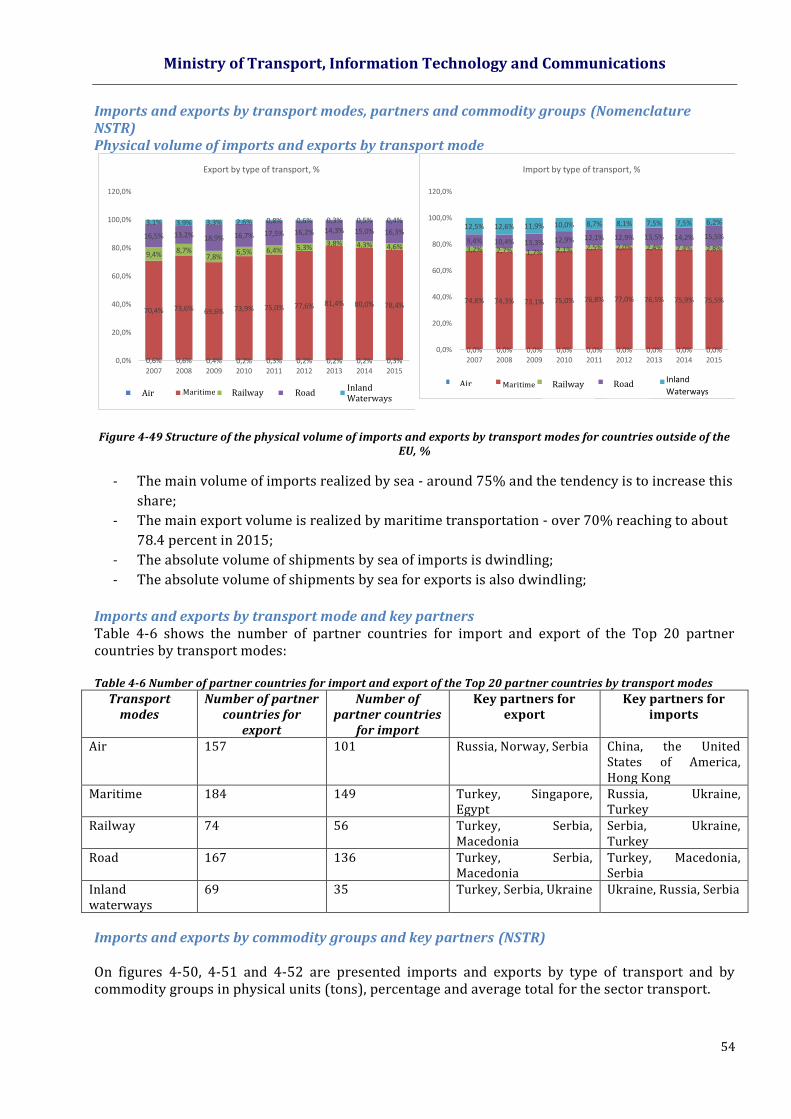
Ministry of Transport, Information Technology and Communications
54
Imports and exports by transport modes, partners and commodity groups (Nomenclature NSTR) Physical volume of imports and exports by transport mode
Figure 4-49 Structure of the physical volume of imports and exports by transport modes for countries outside of the
EU, %
- The main volume of imports realized by sea - around 75% and the tendency is to increase this
share;
- The main export volume is realized by maritime transportation - over 70% reaching to about
78.4 percent in 2015;
- The absolute volume of shipments by sea of imports is dwindling;
- The absolute volume of shipments by sea for exports is also dwindling;
Imports and exports by transport mode and key partners Table 4-6 shows the number of partner countries for import and export of the Top 20 partner countries by transport modes:
Table 4-6 Number of partner countries for import and export of the Top 20 partner countries by transport modes
Transport modes
Number of partner countries for
export
Number of partner countries
for import
Key partners for export
Key partners for imports
Air 157 101 Russia, Norway, Serbia China, the United States of America, Hong Kong
Maritime 184 149 Turkey, Singapore, Egypt
Russia, Ukraine, Turkey
Railway 74 56 Turkey, Serbia, Macedonia
Serbia, Ukraine, Turkey
Road 167 136 Turkey, Serbia, Macedonia
Turkey, Macedonia, Serbia
Inland waterways
69 35 Turkey, Serbia, Ukraine Ukraine, Russia, Serbia
Imports and exports by commodity groups and key partners (NSTR) On figures 4-50, 4-51 and 4-52 are presented imports and exports by type of transport and by commodity groups in physical units (tons), percentage and average total for the sector transport.
0,6% 0,6% 0,4% 0,2% 0,3% 0,2% 0,2% 0,2% 0,3%
70,4% 73,6% 69,6% 73,9% 75,0% 77,6% 81,4% 80,0% 78,4%
9,4% 8,7%7,8%
6,5% 6,4% 5,3%3,8% 4,3% 4,6%
16,5% 13,2% 18,9% 16,7% 17,5% 16,2% 14,3% 15,0% 16,3%3,1% 3,9% 3,3% 2,6% 0,8% 0,6% 0,3% 0,5% 0,4%
0,0%
20,0%
40,0%
60,0%
80,0%
100,0%
120,0%
2007 2008 2009 2010 2011 2012 2013 2014 2015
Export by type of transport, %
въздушен морски железопътен автомобилен вътрешноводен
0,0% 0,0% 0,0% 0,0% 0,0% 0,0% 0,0% 0,0% 0,0%
74,8% 74,3% 73,1% 75,0% 76,8% 77,0% 76,5% 75,9% 75,5%
3,2% 2,7% 1,7% 2,1% 2,5% 2,0% 2,4% 2,4% 2,8%9,4% 10,4% 13,3% 12,9% 12,1% 12,9% 13,5% 14,2% 15,5%
12,5% 12,6% 11,9% 10,0% 8,7% 8,1% 7,5% 7,5% 6,2%
0,0%
20,0%
40,0%
60,0%
80,0%
100,0%
120,0%
2007 2008 2009 2010 2011 2012 2013 2014 2015
Import by type of transport, %
въздушен морски железопътен автомобилен вътрешноводенInland
WaterwaysAir Maritime Railway Road Inland Waterways
Air Maritime Railway Road
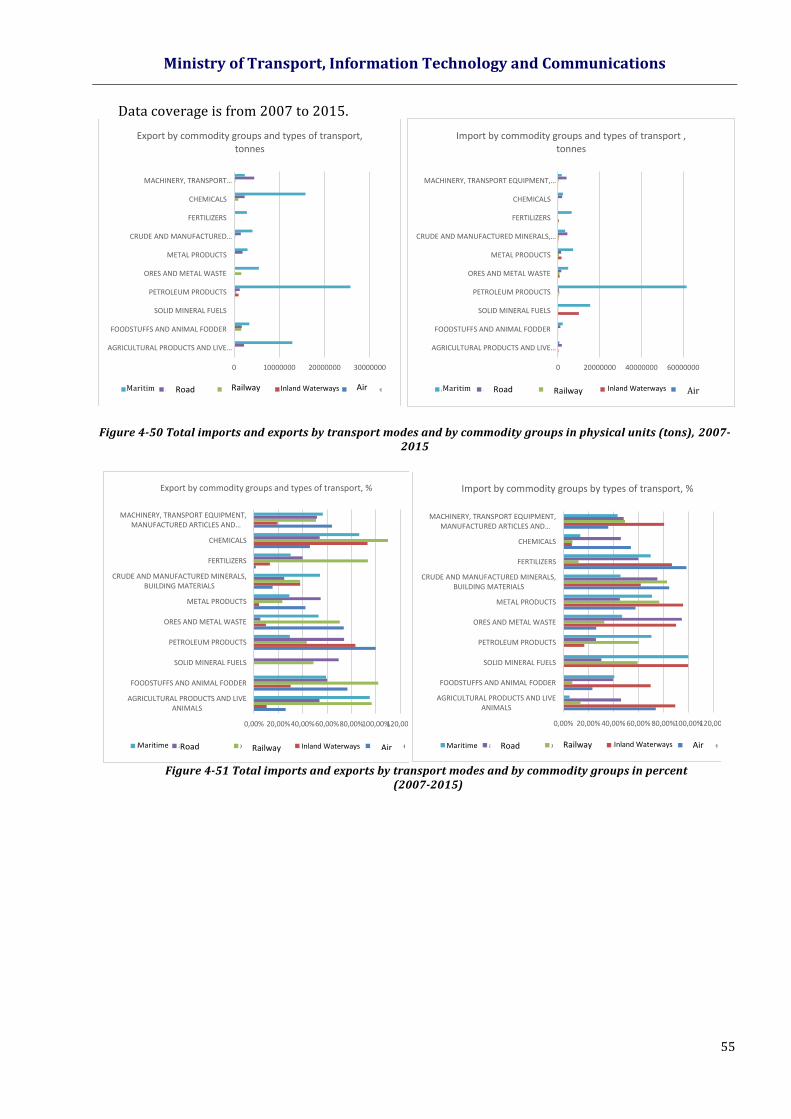
Ministry of Transport, Information Technology and Communications
55
Data coverage is from 2007 to 2015.
Figure 4-50 Total imports and exports by transport modes and by commodity groups in physical units (tons), 2007-
2015
Figure 4-51 Total imports and exports by transport modes and by commodity groups in percent (2007-2015)
0 10000000 20000000 30000000
AGRICULTURAL PRODUCTS AND LIVE…
FOODSTUFFS AND ANIMAL FODDER
SOLID MINERAL FUELS
PETROLEUM PRODUCTS
ORES AND METAL WASTE
METAL PRODUCTS
CRUDE AND MANUFACTURED…
FERTILIZERS
CHEMICALS
MACHINERY, TRANSPORT…
Export by commodity groups and types of transport, tonnes
морски автомобилен железопътен вътрешноводен въздушенRoad Railway Inland Waterways Air
0 20000000 40000000 60000000
AGRICULTURAL PRODUCTS AND LIVE…
FOODSTUFFS AND ANIMAL FODDER
SOLID MINERAL FUELS
PETROLEUM PRODUCTS
ORES AND METAL WASTE
METAL PRODUCTS
CRUDE AND MANUFACTURED MINERALS,…
FERTILIZERS
CHEMICALS
MACHINERY, TRANSPORT EQUIPMENT,…
Import by commodity groups and types of transport , tonnes
морски автомобилен железопътен вътрешноводен въздушен
0,00% 20,00%40,00%60,00%80,00%100,00%120,00%
AGRICULTURAL PRODUCTS AND LIVEANIMALS
FOODSTUFFS AND ANIMAL FODDER
SOLID MINERAL FUELS
PETROLEUM PRODUCTS
ORES AND METAL WASTE
METAL PRODUCTS
CRUDE AND MANUFACTURED MINERALS,BUILDING MATERIALS
FERTILIZERS
CHEMICALS
MACHINERY, TRANSPORT EQUIPMENT,MANUFACTURED ARTICLES AND…
Export by commodity groups and types of transport, %
морски автомобилен железопътен вътрешноводен въздушенMaritime
0,00% 20,00% 40,00% 60,00% 80,00%100,00%120,00%
AGRICULTURAL PRODUCTS AND LIVEANIMALS
FOODSTUFFS AND ANIMAL FODDER
SOLID MINERAL FUELS
PETROLEUM PRODUCTS
ORES AND METAL WASTE
METAL PRODUCTS
CRUDE AND MANUFACTURED MINERALS,BUILDING MATERIALS
FERTILIZERS
CHEMICALS
MACHINERY, TRANSPORT EQUIPMENT,MANUFACTURED ARTICLES AND…
Import by commodity groups by types of transport, %
морски автомобилен железопътен вътрешноводен въздушенAir
Maritime
Air Inland Waterways Railway Road Maritime
Road Railway Inland Waterways Air Maritime Road Railway Inland Waterways

Ministry of Transport, Information Technology and Communications
56
Figure 4-52 Average value of imports and exports by commodity groups in total for the Transport sector
(2007-2015)
- The largest volume of exports are commodity groups: 8 - chemicals; 3 - 0 and petroleum
products - agricultural products and live animals; - The largest volume of imports are commodity groups: 2 - solid mineral fuels; 3 - petroleum
products and 5 - metal products. Imports and exports of structuring commodities by transport mode and key partners The following commodity groups have been considered individually by transport mode as structurally defining for exports and imports and are presented in Table 4-7.:
Table 4-7 Structuring commodity groups for exports and imports by transport odes
Commerce / Transport
Air Transport
Inland Waterways
Railway Transport
Road Transport
Maritime Transport
Export
3 PETROLIUM PRODUCTS
3 PETROLIUM PRODUCTS
8 CHEMICALS 9 MACHINES, TRANSPORT EQUIPMENT, ITEMS AND VARIOUS ITEMS
8 CHEMICALS
9 MACHINES, TRANSPORT EQUIPMENT, ITEMS AND VARIOUS ITEMS
1 FOODS AND FOOD FOR ANIMALS
1 FOODS AND FOOD FOR ANIMALS
8 CHEMICALS 3 PETROLIUM PRODUCTS
8 CHEMICALS 6 RAW AND PROCESSED MINERALS, CONSTRUCTION MATERIALS
6 RAW AND PROCESSED MINERALS, CONSTRUCTION MATERIALS
1 FOODS AND FOOD FOR ANIMALS
1 FOODS AND FOOD FOR ANIMALS
Import
9 MACHINES, TRANSPORT EQUIPMENT, ITEMS AND VARIOUS ITEMS
2 SOLID MINERAL FUELS
3 PETROLIUM PRODUCTS
9 MACHINES, TRANSPORT EQUIPMENT, ITEMS AND VARIOUS ITEMS
3 PETROLIUM PRODUCTS
8 CHEMICALS 5 METAL PRODUCTS 5 METAL PRODUCTS 6 RAW AND PROCESSED MINERALS, CONSTRUCTION MATERIALS
7 FERTILIZERS
1 FOODS AND FOOD FOR ANIMALS
7 FERTILIZERS 4 ORES AND METAL WASTE
8 CHEMICALS 5 METAL PRODUCTS
0,00% 20,00% 40,00% 60,00% 80,00%100,00%120,00%
AGRICULTURAL PRODUCTS AND LIVE…
FOODSTUFFS AND ANIMAL FODDER
SOLID MINERAL FUELS
PETROLEUM PRODUCTS
ORES AND METAL WASTE
METAL PRODUCTS
CRUDE AND MANUFACTURED…
FERTILIZERS
CHEMICALS
MACHINERY, TRANSPORT EQUIPMENT,…
Average value of imports and exports by commodity groups in total for the Transport , %
average export average import
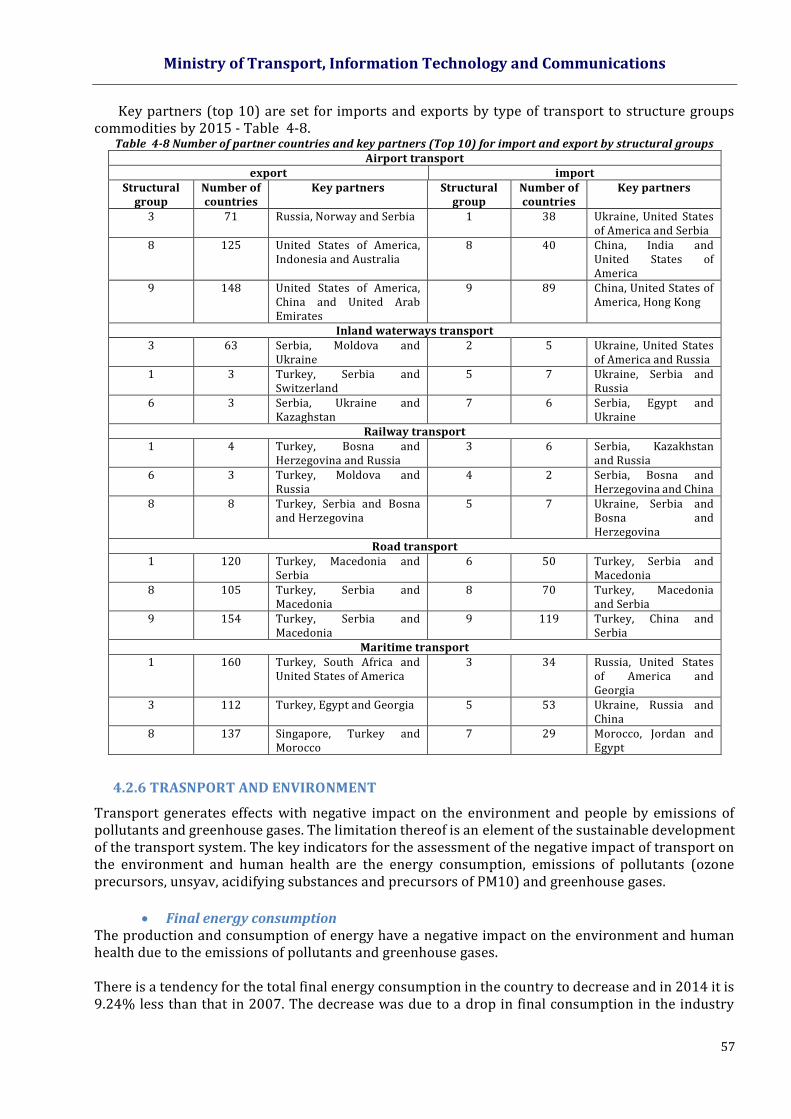
Ministry of Transport, Information Technology and Communications
57
Key partners (top 10) are set for imports and exports by type of transport to structure groups commodities by 2015 - Table 4-8.
Table 4-8 Number of partner countries and key partners (Top 10) for import and export by structural groups Airport transport
export import Structural
group Number of countries
Key partners Structural group
Number of countries
Key partners
3 71 Russia, Norway and Serbia 1 38 Ukraine, United States of America and Serbia
8 125 United States of America, Indonesia and Australia
8 40 China, India and United States of America
9 148 United States of America, China and United Arab Emirates
9 89 China, United States of America, Hong Kong
Inland waterways transport 3 63 Serbia, Moldova and
Ukraine 2 5 Ukraine, United States
of America and Russia 1 3 Turkey, Serbia and
Switzerland 5 7 Ukraine, Serbia and
Russia 6 3 Serbia, Ukraine and
Kazaghstan 7 6 Serbia, Egypt and
Ukraine Railway transport
1 4 Turkey, Bosna and Herzegovina and Russia
3 6 Serbia, Kazakhstan and Russia
6 3 Turkey, Moldova and Russia
4 2 Serbia, Bosna and Herzegovina and China
8 8 Turkey, Serbia and Bosna and Herzegovina
5 7 Ukraine, Serbia and Bosna and Herzegovina
Road transport 1 120 Turkey, Macedonia and
Serbia 6 50 Turkey, Serbia and
Macedonia 8 105 Turkey, Serbia and
Macedonia 8 70 Turkey, Macedonia
and Serbia 9 154 Turkey, Serbia and
Macedonia 9 119 Turkey, China and
Serbia Maritime transport
1 160 Turkey, South Africa and United States of America
3 34 Russia, United States of America and Georgia
3 112 Turkey, Egypt and Georgia 5 53 Ukraine, Russia and China
8 137 Singapore, Turkey and Morocco
7 29 Morocco, Jordan and Egypt
4.2.6 TRASNPORT AND ENVIRONMENT
Transport generates effects with negative impact on the environment and people by emissions of pollutants and greenhouse gases. The limitation thereof is an element of the sustainable development of the transport system. The key indicators for the assessment of the negative impact of transport on the environment and human health are the energy consumption, emissions of pollutants (ozone precursors, unsyav, acidifying substances and precursors of PM10) and greenhouse gases.
Final energy consumption The production and consumption of energy have a negative impact on the environment and human health due to the emissions of pollutants and greenhouse gases. There is a tendency for the total final energy consumption in the country to decrease and in 2014 it is 9.24% less than that in 2007. The decrease was due to a drop in final consumption in the industry
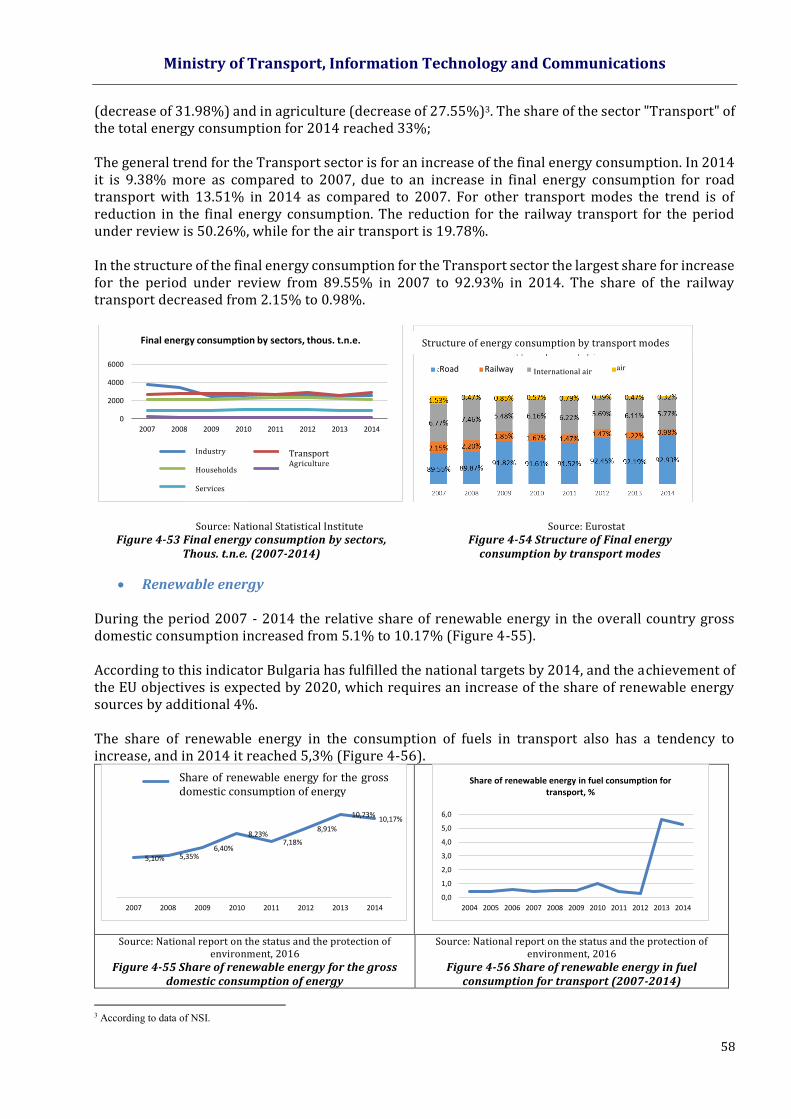
Ministry of Transport, Information Technology and Communications
58
(decrease of 31.98%) and in agriculture (decrease of 27.55%)3. The share of the sector "Transport" of the total energy consumption for 2014 reached 33%; The general trend for the Transport sector is for an increase of the final energy consumption. In 2014 it is 9.38% more as compared to 2007, due to an increase in final energy consumption for road transport with 13.51% in 2014 as compared to 2007. For other transport modes the trend is of reduction in the final energy consumption. The reduction for the railway transport for the period under review is 50.26%, while for the air transport is 19.78%. In the structure of the final energy consumption for the Transport sector the largest share for increase for the period under review from 89.55% in 2007 to 92.93% in 2014. The share of the railway transport decreased from 2.15% to 0.98%.
Source: National Statistical Institute
Figure 4-53 Final energy consumption by sectors, Thous. t.n.e. (2007-2014)
Source: Eurostat
Figure 4-54 Structure of Final energy consumption by transport modes
Renewable energy During the period 2007 - 2014 the relative share of renewable energy in the overall country gross domestic consumption increased from 5.1% to 10.17% (Figure 4-55). According to this indicator Bulgaria has fulfilled the national targets by 2014, and the achievement of the EU objectives is expected by 2020, which requires an increase of the share of renewable energy sources by additional 4%. The share of renewable energy in the consumption of fuels in transport also has a tendency to increase, and in 2014 it reached 5,3% (Figure 4-56).
Source: National report on the status and the protection of environment, 2016
Figure 4-55 Share of renewable energy for the gross domestic consumption of energy
Source: National report on the status and the protection of environment, 2016
Figure 4-56 Share of renewable energy in fuel consumption for transport (2007-2014)
3 According to data of NSI.
0
2000
4000
6000
2007 2008 2009 2010 2011 2012 2013 2014
Final energy consumption by sectors, thous. t.n.e.
Индустрия Транспорт
Домакинства Селско стопанство
Услуги
5,10% 5,35%6,40%
8,23%7,18%
8,91%
10,73%10,17%
2007 2008 2009 2010 2011 2012 2013 2014
Дял на ВЕИ в брутното вътрешно потребление на енергия
0,0
1,0
2,0
3,0
4,0
5,0
6,0
2004 2005 2006 2007 2008 2009 2010 2011 2012 2013 2014
Share of renewable energy in fuel consumption for transport, %
Industry Households
Services
Transport Agriculture
Road Railway International air air Structure of energy consumption by transport modes
Share of renewable energy for the gross domestic consumption of energy

Ministry of Transport, Information Technology and Communications
59
Fuel consumption The total fuel consumption in road transport in 2014 increased by 6.44% when compared to 2007 (Figure 4-57). The increase in the consumption of fuel for diesel engines is 16.44%, and for propane-butane mixture it is 13.35%. The consumption of petrol is reduced by 19.30%. The main, increasing share in the structure of fuel consumption in road transport is occupied by the fuels for diesel engines (Figure 4-58). The share of biodiesel in the total consumption of diesel fuels for the road transport for the period 2007- 2014 has increased from 0.3% to 6.38% but remains below the national indicative target of achieving 10% by 2020, specified in the National long-term program to promote consumption of biofuels in the transport sector for the period 2008 – 2020.
Source: National report on the status and the protection of environment, 2016
Figure 4-57 Consumption of fuel in the road transport (2007-2014)
Figure 4-58 Structure of fuel consumption in road transport (2007-2014)
Greenhouse gases The main greenhouse gases included in the United Nations Framework Convention on Climate Change (UNFCCC) are carbon dioxide (CO2), methane (CH4), nitrous oxide (N2O), hydrofluorocarbons (HFCs), perfluorocarbons (PFCs) and sulphur hexafluoride (SF6). The country's total greenhouse gas emissions for the period 2007-2014 show a decreasing trend and by 2014 the index to the base 1988 has a value of 50%.4 Greenhouse gas emissions from the Transport sector have a decreasing trend after 2009. Transport is a major source of greenhouse gases from the Energy sector with a growing share in national emissions, which in 2013 was 13.19%. About 94% of greenhouse gas emissions from transport are from road transport.
4 Source: National Report on the Condition and Protection of the Environment, 2016.
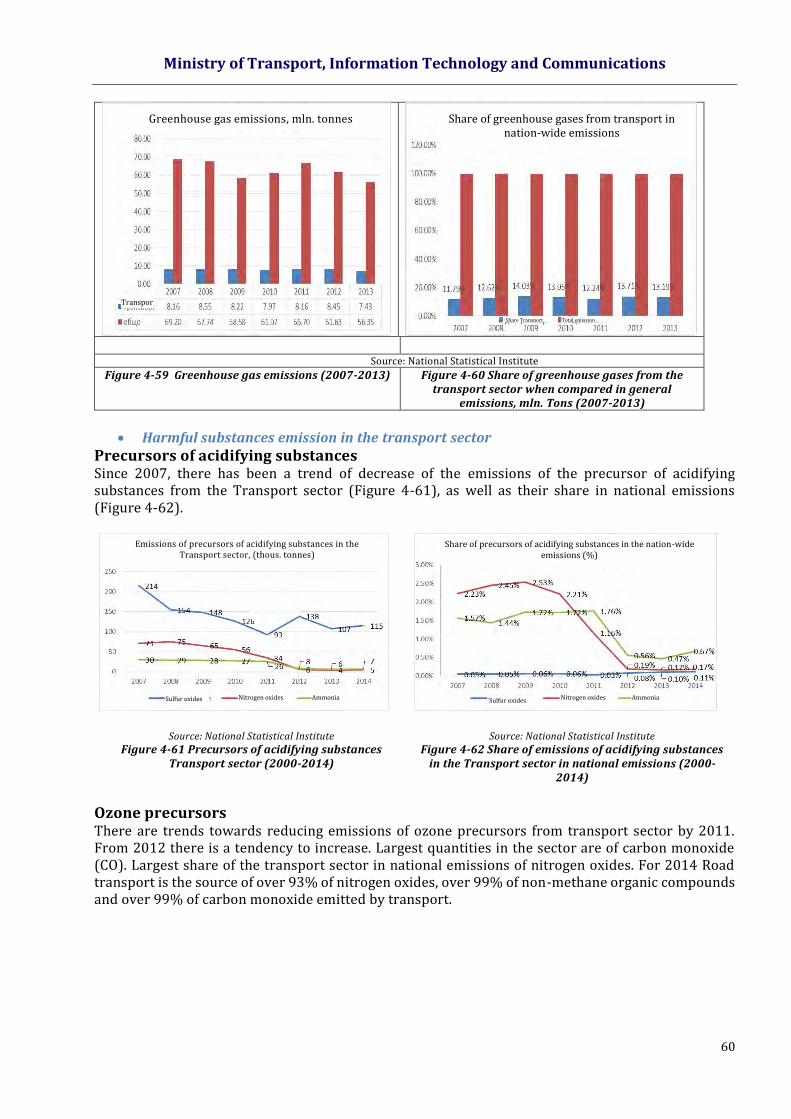
Ministry of Transport, Information Technology and Communications
60
Source: National Statistical Institute
Figure 4-59 Greenhouse gas emissions (2007-2013) Figure 4-60 Share of greenhouse gases from the transport sector when compared in general
emissions, mln. Tons (2007-2013)
Harmful substances emission in the transport sector
Precursors of acidifying substances Since 2007, there has been a trend of decrease of the emissions of the precursor of acidifying substances from the Transport sector (Figure 4-61), as well as their share in national emissions (Figure 4-62).
Source: National Statistical Institute
Figure 4-61 Precursors of acidifying substances Transport sector (2000-2014)
Source: National Statistical Institute
Figure 4-62 Share of emissions of acidifying substances in the Transport sector in national emissions (2000-
2014)
Оzone precursors There are trends towards reducing emissions of ozone precursors from transport sector by 2011. From 2012 there is a tendency to increase. Largest quantities in the sector are of carbon monoxide (CO). Largest share of the transport sector in national emissions of nitrogen oxides. For 2014 Road transport is the source of over 93% of nitrogen oxides, over 99% of non-methane organic compounds and over 99% of carbon monoxide emitted by transport.
Greenhouse gas emissions, mln. tonnes Share of greenhouse gases from transport in nation-wide emissions
Transport Total
Share Transport
Total emission
Emissions of precursors of acidifying substances in the Transport sector, (thous. tonnes)
Share of precursors of acidifying substances in the nation-wide emissions (%)
Sulfur oxides
Nitrogen oxides
Ammonia
Ammonia
Nitrogen oxides
Sulfur oxides
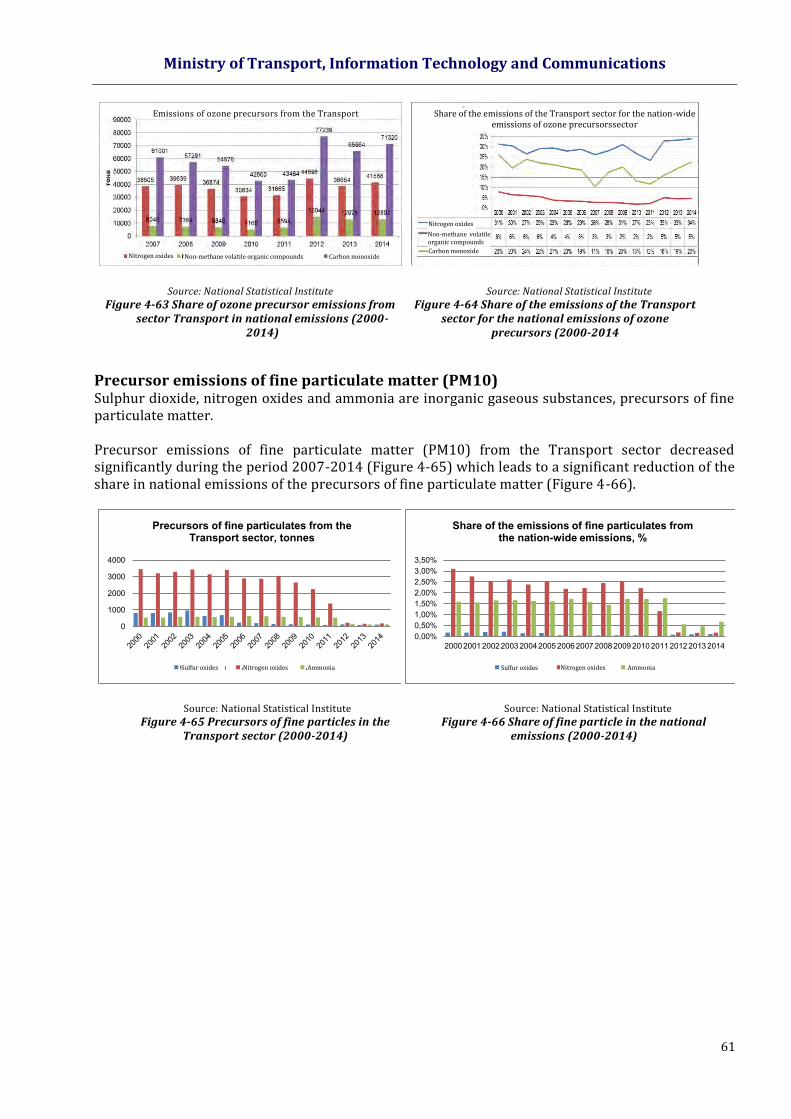
Ministry of Transport, Information Technology and Communications
61
Source: National Statistical Institute
Figure 4-63 Share of ozone precursor emissions from sector Transport in national emissions (2000-
2014)
Source: National Statistical Institute
Figure 4-64 Share of the emissions of the Transport sector for the national emissions of ozone
precursors (2000-2014
Precursor emissions of fine particulate matter (PM10) Sulphur dioxide, nitrogen oxides and ammonia are inorganic gaseous substances, precursors of fine particulate matter. Precursor emissions of fine particulate matter (PM10) from the Transport sector decreased significantly during the period 2007-2014 (Figure 4-65) which leads to a significant reduction of the share in national emissions of the precursors of fine particulate matter (Figure 4-66).
Source: National Statistical Institute
Figure 4-65 Precursors of fine particles in the Transport sector (2000-2014)
Source: National Statistical Institute
Figure 4-66 Share of fine particle in the national emissions (2000-2014)
0
1000
2000
3000
4000
Precursors of fine particulates from the Transport sector, tonnes
Серни окиси Азотни окиси Амоняк
0,00%0,50%1,00%1,50%2,00%2,50%3,00%3,50%
20002001 20022003 20042005200620072008 20092010201120122013 2014
Share of the emissions of fine particulates from the nation-wide emissions, %
Серни окиси Азотни окиси Амоняк
Nitrogen oxides
Non-methane volatile organic compounds
Carbon monoxide
Carbon monoxide
Non-methane volatile organic compounds
Nitrogen oxides
Emissions of ozone precursors from the Transport sector
Share of the emissions of the Transport sector for the nation-wide emissions of ozone precursorssector
Sulfur oxides
Nitrogen oxides
Ammonia
Sulfur oxides
Nitrogen oxides
Ammonia
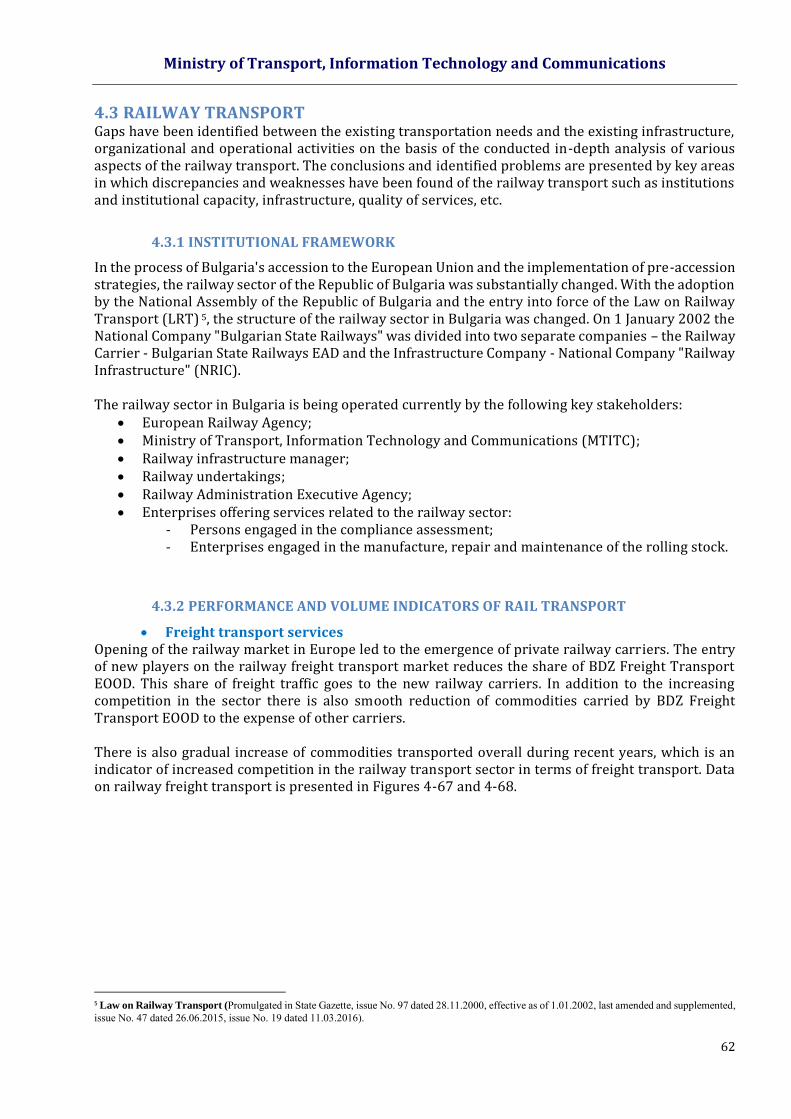
Ministry of Transport, Information Technology and Communications
62
4.3 RAILWAY TRANSPORT Gaps have been identified between the existing transportation needs and the existing infrastructure, organizational and operational activities on the basis of the conducted in-depth analysis of various aspects of the railway transport. The conclusions and identified problems are presented by key areas in which discrepancies and weaknesses have been found of the railway transport such as institutions and institutional capacity, infrastructure, quality of services, etc.
4.3.1 INSTITUTIONAL FRAMEWORK
In the process of Bulgaria's accession to the European Union and the implementation of pre-accession strategies, the railway sector of the Republic of Bulgaria was substantially changed. With the adoption by the National Assembly of the Republic of Bulgaria and the entry into force of the Law on Railway Transport (LRT) 5, the structure of the railway sector in Bulgaria was changed. On 1 January 2002 the National Company "Bulgarian State Railways" was divided into two separate companies – the Railway Carrier - Bulgarian State Railways EAD and the Infrastructure Company - National Company "Railway Infrastructure" (NRIC). The railway sector in Bulgaria is being operated currently by the following key stakeholders:
European Railway Agency; Ministry of Transport, Information Technology and Communications (МТIТС); Railway infrastructure manager; Railway undertakings; Railway Administration Executive Agency; Enterprises offering services related to the railway sector:
- Persons engaged in the compliance assessment; - Enterprises engaged in the manufacture, repair and maintenance of the rolling stock.
4.3.2 PERFORMANCE AND VOLUME INDICATORS OF RAIL TRANSPORT
Freight transport services Opening of the railway market in Europe led to the emergence of private railway carriers. The entry of new players on the railway freight transport market reduces the share of BDZ Freight Transport EOOD. This share of freight traffic goes to the new railway carriers. In addition to the increasing competition in the sector there is also smooth reduction of commodities carried by BDZ Freight Transport EOOD to the expense of other carriers. There is also gradual increase of commodities transported overall during recent years, which is an indicator of increased competition in the railway transport sector in terms of freight transport. Data on railway freight transport is presented in Figures 4-67 and 4-68.
5 Law on Railway Transport (Promulgated in State Gazette, issue No. 97 dated 28.11.2000, effective as of 1.01.2002, last amended and supplemented, issue No. 47 dated 26.06.2015, issue No. 19 dated 11.03.2016).
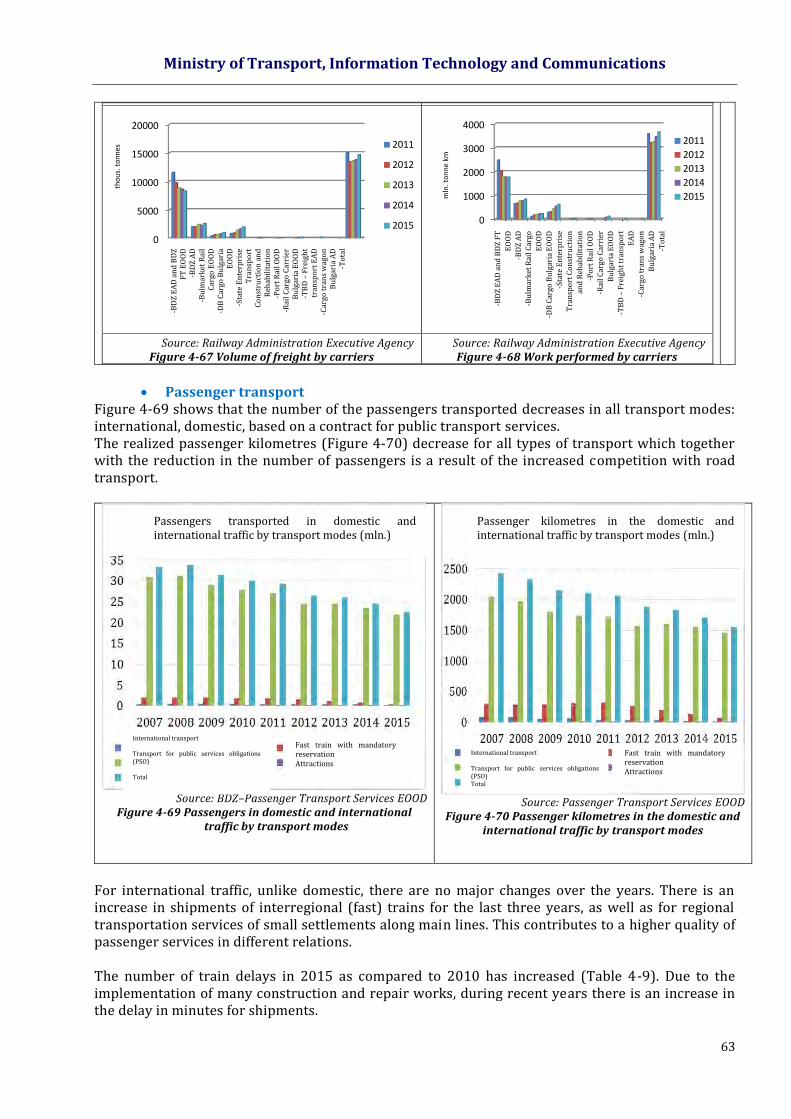
Ministry of Transport, Information Technology and Communications
63
Source: Railway Administration Executive Agency Figure 4-67 Volume of freight by carriers
Source: Railway Administration Executive Agency Figure 4-68 Work performed by carriers
Passenger transport
Figure 4-69 shows that the number of the passengers transported decreases in all transport modes: international, domestic, based on a contract for public transport services. The realized passenger kilometres (Figure 4-70) decrease for all types of transport which together with the reduction in the number of passengers is a result of the increased competition with road transport.
Source: BDZ–Passenger Transport Services EOOD
Figure 4-69 Passengers in domestic and international traffic by transport modes
Source: Passenger Transport Services EOOD
Figure 4-70 Passenger kilometres in the domestic and international traffic by transport modes
For international traffic, unlike domestic, there are no major changes over the years. There is an increase in shipments of interregional (fast) trains for the last three years, as well as for regional transportation services of small settlements along main lines. This contributes to a higher quality of passenger services in different relations. The number of train delays in 2015 as compared to 2010 has increased (Table 4-9). Due to the implementation of many construction and repair works, during recent years there is an increase in the delay in minutes for shipments.
0
5000
10000
15000
20000
БДЖ ЕАД и БДЖ …
БЖК АД
Булмаркет Рейл …
Ди Би Карго …
ДП ТСВ
Порт Рейл ООД
Рейл Карго …
ТБД -Товарни …
Карго Транс …
общо
2011
2012
2013
2014
2015
tho
us.
to
nn
es
0
1000
2000
3000
4000
БДЖ ЕАД и БДЖ ТП …
БЖК АД
Булмаркет Рейл …
Ди Би Карго …
ДП ТСВ
Порт Рейл ООД
Рейл Карго Кериър …
ТБД -Товарни …
Карго Транс Вагон АД
общо
2011
2012
2013
2014
2015mln
. to
nn
e km
-BD
Z E
AD
an
d B
DZ
FT
EO
OD
-BD
Z A
D
-Bu
lmar
ket
Rai
l Car
go
EO
OD
-DB
Car
go B
ulg
aria
EO
OD
-Sta
te E
nte
rpri
se
Tra
nsp
ort
Co
nst
ruct
ion
and
Reh
abil
itat
ion
-Po
rt R
ail
OO
D
-Rai
l Car
go C
arri
er
Bu
lgar
ia E
OO
D
-TB
D –
Fre
igh
t tr
ansp
ort
EA
D
-Car
go t
ran
s w
ago
n
Bu
lgar
ia A
D
-To
tal
-BD
Z E
AD
an
d B
DZ
F
T E
OO
D
-BD
Z A
D
-Bu
lmar
ket
Rai
l C
argo
EO
OD
-D
B C
argo
Bu
lgar
ia
EO
OD
-S
tate
En
terp
rise
T
ran
spo
rt
Co
nst
ruct
ion
an
d
Reh
abil
itat
ion
-P
ort
Rai
l O
OD
-R
ail
Car
go C
arri
er
Bu
lgar
ia E
OO
D
-TB
D –
Fre
igh
t tr
ansp
ort
EA
D
-Car
go t
ran
s w
ago
n
Bu
lgar
ia A
D
-To
tal
Passengers transported in domestic and international traffic by transport modes (mln.)
Passenger kilometres in the domestic and international traffic by transport modes (mln.)
International transport Transport for public services obligations (PSO) Total
Fast train with mandatory reservation Attractions
Fast train with mandatory reservation Attractions
International transport Transport for public services obligations (PSO) Total
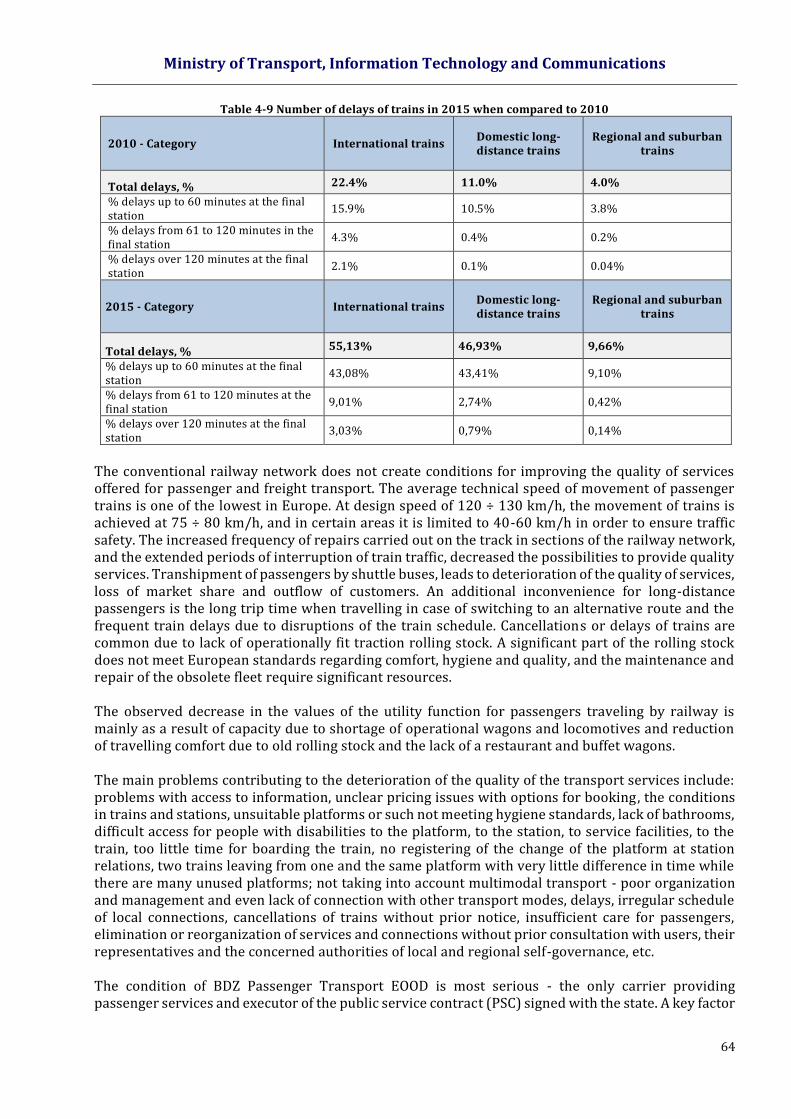
Ministry of Transport, Information Technology and Communications
64
Table 4-9 Number of delays of trains in 2015 when compared to 2010
2010 - Category International trains Domestic long-distance trains
Regional and suburban trains
Total delays, % 22.4% 11.0% 4.0%
% delays up to 60 minutes at the final station
15.9% 10.5% 3.8%
% delays from 61 to 120 minutes in the final station
4.3% 0.4% 0.2%
% delays over 120 minutes at the final station
2.1% 0.1% 0.04%
2015 - Category International trains Domestic long-distance trains
Regional and suburban trains
Total delays, % 55,13% 46,93% 9,66%
% delays up to 60 minutes at the final station
43,08% 43,41% 9,10%
% delays from 61 to 120 minutes at the final station
9,01% 2,74% 0,42%
% delays over 120 minutes at the final station
3,03% 0,79% 0,14%
The conventional railway network does not create conditions for improving the quality of services offered for passenger and freight transport. The average technical speed of movement of passenger trains is one of the lowest in Europe. At design speed of 120 ÷ 130 km/h, the movement of trains is achieved at 75 ÷ 80 km/h, and in certain areas it is limited to 40-60 km/h in order to ensure traffic safety. The increased frequency of repairs carried out on the track in sections of the railway network, and the extended periods of interruption of train traffic, decreased the possibilities to provide quality services. Transhipment of passengers by shuttle buses, leads to deterioration of the quality of services, loss of market share and outflow of customers. An additional inconvenience for long-distance passengers is the long trip time when travelling in case of switching to an alternative route and the frequent train delays due to disruptions of the train schedule. Cancellations or delays of trains are common due to lack of operationally fit traction rolling stock. A significant part of the rolling stock does not meet European standards regarding comfort, hygiene and quality, and the maintenance and repair of the obsolete fleet require significant resources. The observed decrease in the values of the utility function for passengers traveling by railway is mainly as a result of capacity due to shortage of operational wagons and locomotives and reduction of travelling comfort due to old rolling stock and the lack of a restaurant and buffet wagons. The main problems contributing to the deterioration of the quality of the transport services include: problems with access to information, unclear pricing issues with options for booking, the conditions in trains and stations, unsuitable platforms or such not meeting hygiene standards, lack of bathrooms, difficult access for people with disabilities to the platform, to the station, to service facilities, to the train, too little time for boarding the train, no registering of the change of the platform at station relations, two trains leaving from one and the same platform with very little difference in time while there are many unused platforms; not taking into account multimodal transport - poor organization and management and even lack of connection with other transport modes, delays, irregular schedule of local connections, cancellations of trains without prior notice, insufficient care for passengers, elimination or reorganization of services and connections without prior consultation with users, their representatives and the concerned authorities of local and regional self-governance, etc. The condition of BDZ Passenger Transport EOOD is most serious - the only carrier providing passenger services and executor of the public service contract (PSC) signed with the state. A key factor
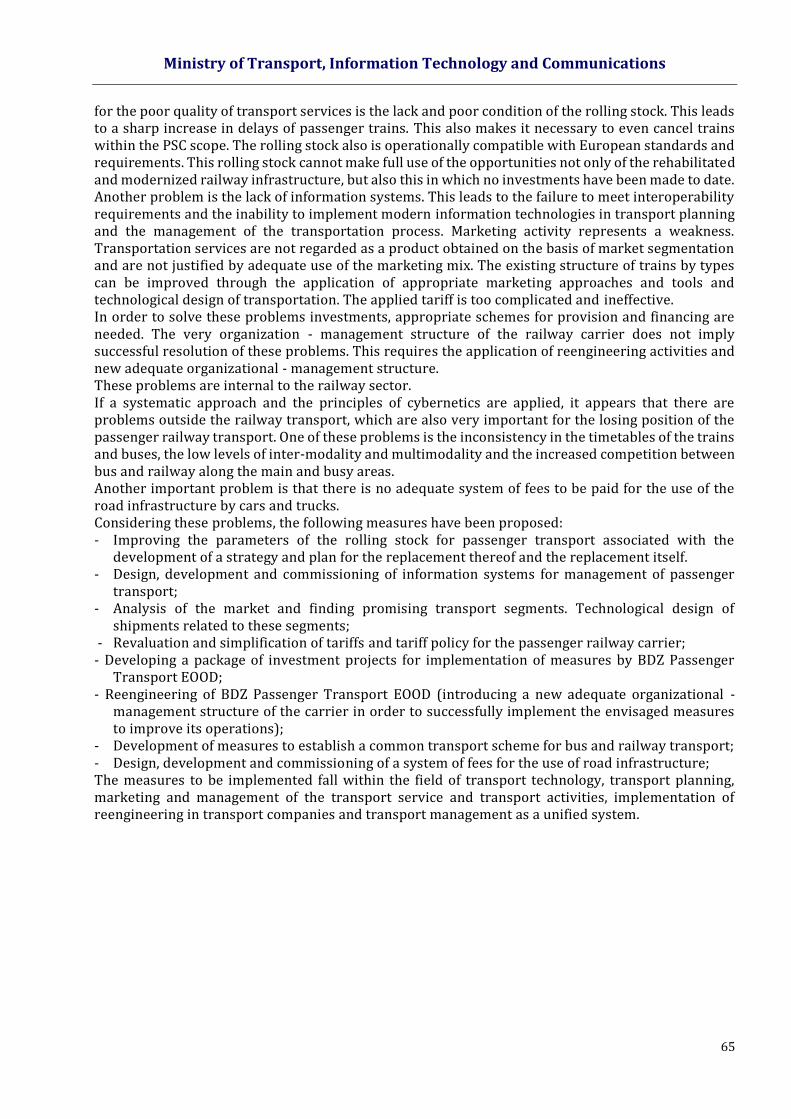
Ministry of Transport, Information Technology and Communications
65
for the poor quality of transport services is the lack and poor condition of the rolling stock. This leads to a sharp increase in delays of passenger trains. This also makes it necessary to even cancel trains within the PSC scope. The rolling stock also is operationally compatible with European standards and requirements. This rolling stock cannot make full use of the opportunities not only of the rehabilitated and modernized railway infrastructure, but also this in which no investments have been made to date. Another problem is the lack of information systems. This leads to the failure to meet interoperability requirements and the inability to implement modern information technologies in transport planning and the management of the transportation process. Marketing activity represents a weakness. Transportation services are not regarded as a product obtained on the basis of market segmentation and are not justified by adequate use of the marketing mix. The existing structure of trains by types can be improved through the application of appropriate marketing approaches and tools and technological design of transportation. The applied tariff is too complicated and ineffective. In order to solve these problems investments, appropriate schemes for provision and financing are needed. The very organization - management structure of the railway carrier does not imply successful resolution of these problems. This requires the application of reengineering activities and new adequate organizational - management structure. These problems are internal to the railway sector. If a systematic approach and the principles of cybernetics are applied, it appears that there are problems outside the railway transport, which are also very important for the losing position of the passenger railway transport. One of these problems is the inconsistency in the timetables of the trains and buses, the low levels of inter-modality and multimodality and the increased competition between bus and railway along the main and busy areas. Another important problem is that there is no adequate system of fees to be paid for the use of the road infrastructure by cars and trucks. Considering these problems, the following measures have been proposed: - Improving the parameters of the rolling stock for passenger transport associated with the
development of a strategy and plan for the replacement thereof and the replacement itself. - Design, development and commissioning of information systems for management of passenger
transport; - Analysis of the market and finding promising transport segments. Technological design of
shipments related to these segments; - Revaluation and simplification of tariffs and tariff policy for the passenger railway carrier; - Developing a package of investment projects for implementation of measures by BDZ Passenger
Transport EOOD; - Reengineering of BDZ Passenger Transport EOOD (introducing a new adequate organizational -
management structure of the carrier in order to successfully implement the envisaged measures to improve its operations);
- Development of measures to establish a common transport scheme for bus and railway transport; - Design, development and commissioning of a system of fees for the use of road infrastructure; The measures to be implemented fall within the field of transport technology, transport planning, marketing and management of the transport service and transport activities, implementation of reengineering in transport companies and transport management as a unified system.
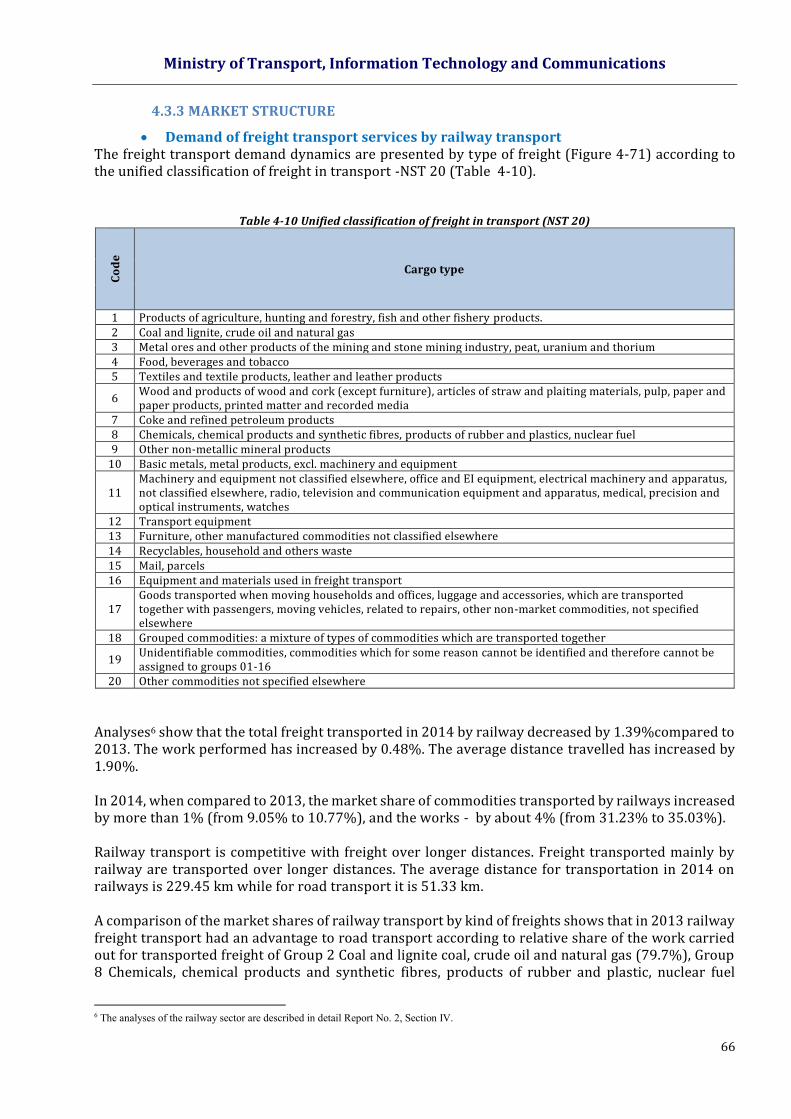
Ministry of Transport, Information Technology and Communications
66
4.3.3 MARKET STRUCTURE
Demand of freight transport services by railway transport The freight transport demand dynamics are presented by type of freight (Figure 4-71) according to the unified classification of freight in transport -NST 20 (Table 4-10).
Table 4-10 Unified classification of freight in transport (NST 20)
Co
de
Cargo type
1 Products of agriculture, hunting and forestry, fish and other fishery products. 2 Coal and lignite, crude oil and natural gas 3 Metal ores and other products of the mining and stone mining industry, peat, uranium and thorium 4 Food, beverages and tobacco 5 Textiles and textile products, leather and leather products
6 Wood and products of wood and cork (except furniture), articles of straw and plaiting materials, pulp, paper and paper products, printed matter and recorded media
7 Coke and refined petroleum products 8 Chemicals, chemical products and synthetic fibres, products of rubber and plastics, nuclear fuel 9 Other non-metallic mineral products
10 Basic metals, metal products, excl. machinery and equipment
11 Machinery and equipment not classified elsewhere, office and EI equipment, electrical machinery and apparatus, not classified elsewhere, radio, television and communication equipment and apparatus, medical, precision and optical instruments, watches
12 Transport equipment 13 Furniture, other manufactured commodities not classified elsewhere 14 Recyclables, household and others waste 15 Mail, parcels 16 Equipment and materials used in freight transport
17 Goods transported when moving households and offices, luggage and accessories, which are transported together with passengers, moving vehicles, related to repairs, other non-market commodities, not specified elsewhere
18 Grouped commodities: a mixture of types of commodities which are transported together
19 Unidentifiable commodities, commodities which for some reason cannot be identified and therefore cannot be assigned to groups 01-16
20 Other commodities not specified elsewhere
Analyses6 show that the total freight transported in 2014 by railway decreased by 1.39%compared to 2013. The work performed has increased by 0.48%. The average distance travelled has increased by 1.90%. In 2014, when compared to 2013, the market share of commodities transported by railways increased by more than 1% (from 9.05% to 10.77%), and the works - by about 4% (from 31.23% to 35.03%). Railway transport is competitive with freight over longer distances. Freight transported mainly by railway are transported over longer distances. The average distance for transportation in 2014 on railways is 229.45 km while for road transport it is 51.33 km. A comparison of the market shares of railway transport by kind of freights shows that in 2013 railway freight transport had an advantage to road transport according to relative share of the work carried out for transported freight of Group 2 Coal and lignite coal, crude oil and natural gas (79.7%), Group 8 Chemicals, chemical products and synthetic fibres, products of rubber and plastic, nuclear fuel
6 The analyses of the railway sector are described in detail Report No. 2, Section IV.
Ministry of Transport, Information Technology and Communications
67
(54.6%), group 12 Transport equipment (62.8%), Group 19 Unidentifiable freight, freight which for some reason cannot be identified (79.5%) and Group 20 Other freight not classified anywhere else (64.5%). In 2014 the advantaged competitive position (over 50% share) of railway transport for these groups remains. The competitive position for freight of Group 7 Coke and refined petroleum products has improved, with the market share of railway transport increasing from 35.14% increased to 53.08%.
Source: NSI and own calculations
Figure 4-71 Comparison of the market shares of the cargo transported by railway transport for 2013 and 2014
Supply of freight transport services by railway transport Railway freight transport supply is carried out by various categories of freight trains: international direct freight trains (IDFT); direct freight trains (DFT); local freight trains (LFT) and shunting trains (ST). Also, there are operational container block trains and Ro-La block trains. Railway transport network supply, as a number of scheduled trains for 2014, is shown in Fig. 4-72. The structure of the planned train timetable as number of trains and train kilometres is presented in next figures.
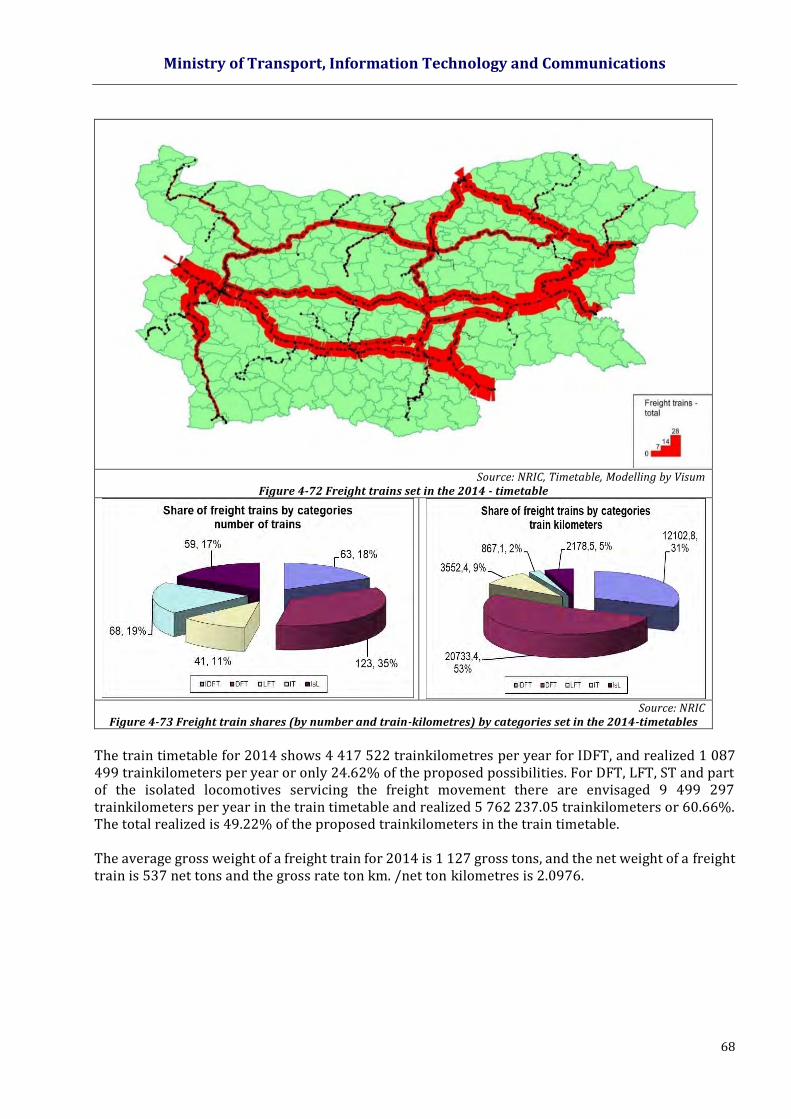
Ministry of Transport, Information Technology and Communications
68
Source: NRIC, Timetable, Modelling by Visum Figure 4-72 Freight trains set in the 2014 - timetable
Source: NRIC Figure 4-73 Freight train shares (by number and train-kilometres) by categories set in the 2014-timetables
The train timetable for 2014 shows 4 417 522 trainkilometres per year for IDFT, and realized 1 087 499 trainkilometers per year or only 24.62% of the proposed possibilities. For DFT, LFT, ST and part of the isolated locomotives servicing the freight movement there are envisaged 9 499 297 trainkilometers per year in the train timetable and realized 5 762 237.05 trainkilometers or 60.66%. The total realized is 49.22% of the proposed trainkilometers in the train timetable. The average gross weight of a freight train for 2014 is 1 127 gross tons, and the net weight of a freight train is 537 net tons and the gross rate ton km. /net ton kilometres is 2.0976.
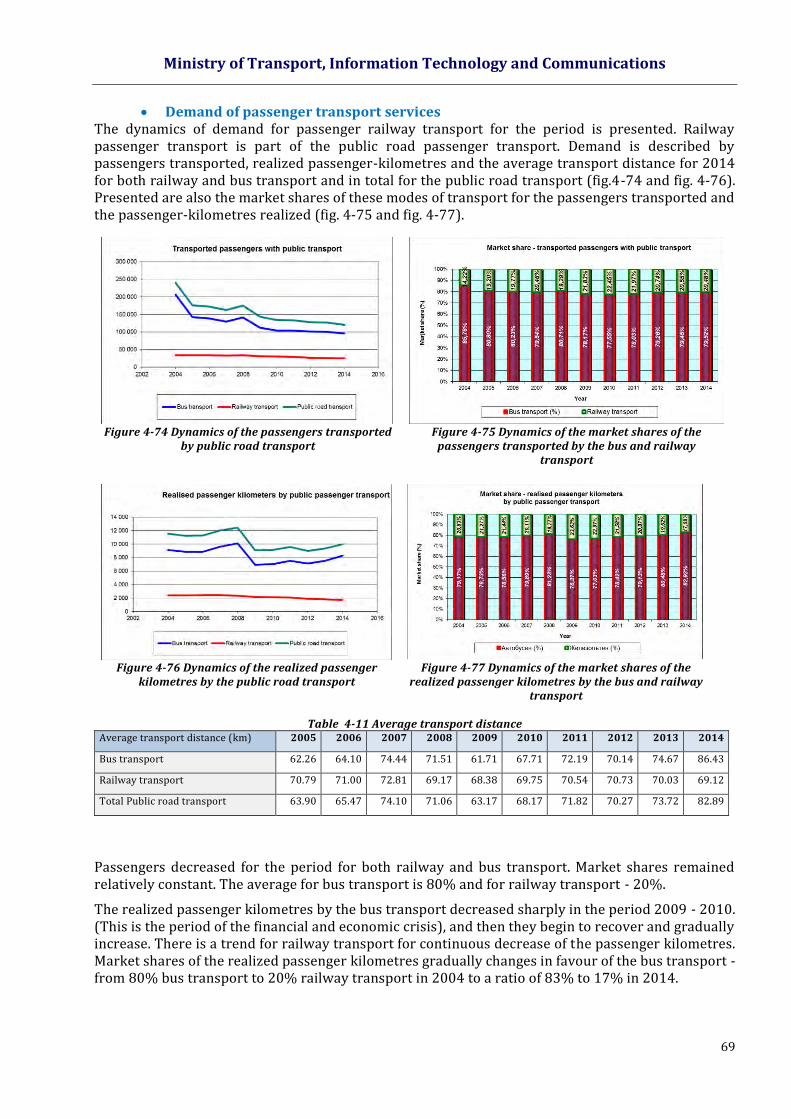
Ministry of Transport, Information Technology and Communications
69
Demand of passenger transport services The dynamics of demand for passenger railway transport for the period is presented. Railway passenger transport is part of the public road passenger transport. Demand is described by passengers transported, realized passenger-kilometres and the average transport distance for 2014 for both railway and bus transport and in total for the public road transport (fig.4-74 and fig. 4-76). Presented are also the market shares of these modes of transport for the passengers transported and the passenger-kilometres realized (fig. 4-75 and fig. 4-77).
Figure 4-74 Dynamics of the passengers transported by public road transport
Figure 4-75 Dynamics of the market shares of the passengers transported by the bus and railway
transport
Figure 4-76 Dynamics of the realized passenger kilometres by the public road transport
Figure 4-77 Dynamics of the market shares of the realized passenger kilometres by the bus and railway
transport
Table 4-11 Average transport distance Average transport distance (km) 2005 2006 2007 2008 2009 2010 2011 2012 2013 2014
Bus transport 62.26 64.10 74.44 71.51 61.71 67.71 72.19 70.14 74.67 86.43
Railway transport 70.79 71.00 72.81 69.17 68.38 69.75 70.54 70.73 70.03 69.12
Total Public road transport 63.90 65.47 74.10 71.06 63.17 68.17 71.82 70.27 73.72 82.89
Passengers decreased for the period for both railway and bus transport. Market shares remained relatively constant. The average for bus transport is 80% and for railway transport - 20%.
The realized passenger kilometres by the bus transport decreased sharply in the period 2009 - 2010. (This is the period of the financial and economic crisis), and then they begin to recover and gradually increase. There is a trend for railway transport for continuous decrease of the passenger kilometres. Market shares of the realized passenger kilometres gradually changes in favour of the bus transport - from 80% bus transport to 20% railway transport in 2004 to a ratio of 83% to 17% in 2014.
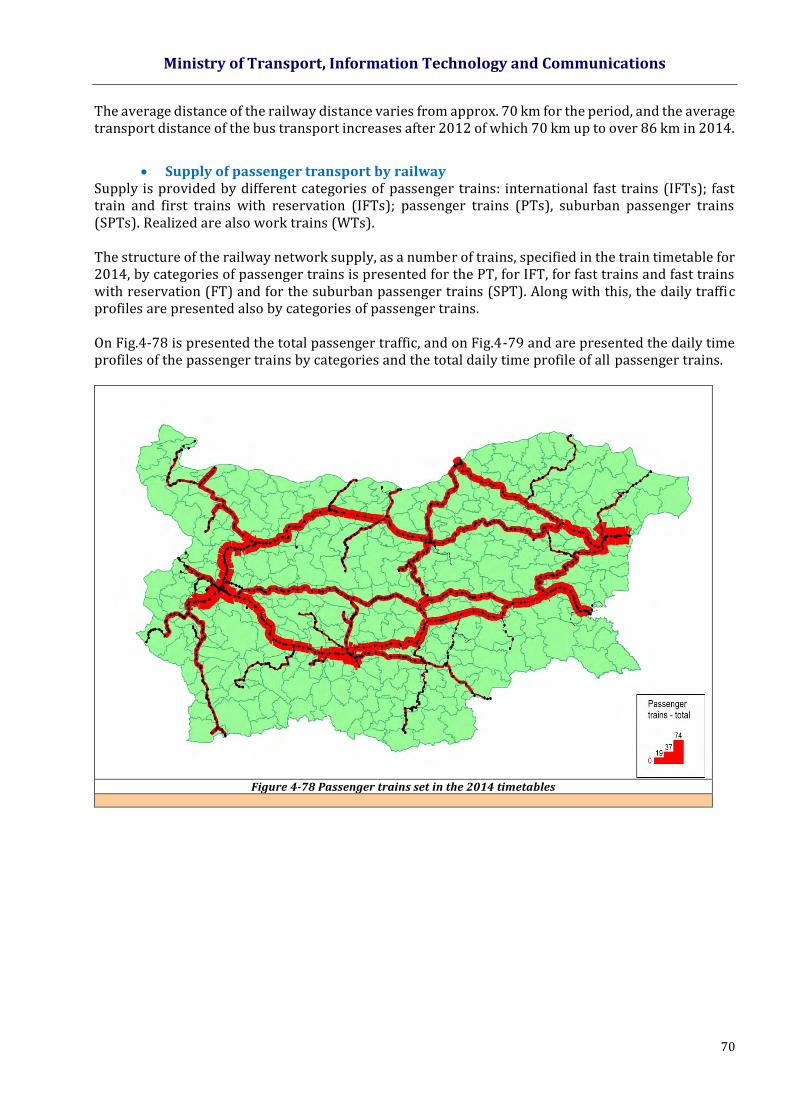
Ministry of Transport, Information Technology and Communications
70
The average distance of the railway distance varies from approx. 70 km for the period, and the average transport distance of the bus transport increases after 2012 of which 70 km up to over 86 km in 2014.
Supply of passenger transport by railway
Supply is provided by different categories of passenger trains: international fast trains (IFTs); fast train and first trains with reservation (IFTs); passenger trains (PTs), suburban passenger trains (SPTs). Realized are also work trains (WTs). The structure of the railway network supply, as a number of trains, specified in the train timetable for 2014, by categories of passenger trains is presented for the PT, for IFT, for fast trains and fast trains with reservation (FT) and for the suburban passenger trains (SPT). Along with this, the daily traffic profiles are presented also by categories of passenger trains. On Fig.4-78 is presented the total passenger traffic, and on Fig.4-79 and are presented the daily time profiles of the passenger trains by categories and the total daily time profile of all passenger trains.
Figure 4-78 Passenger trains set in the 2014 timetables
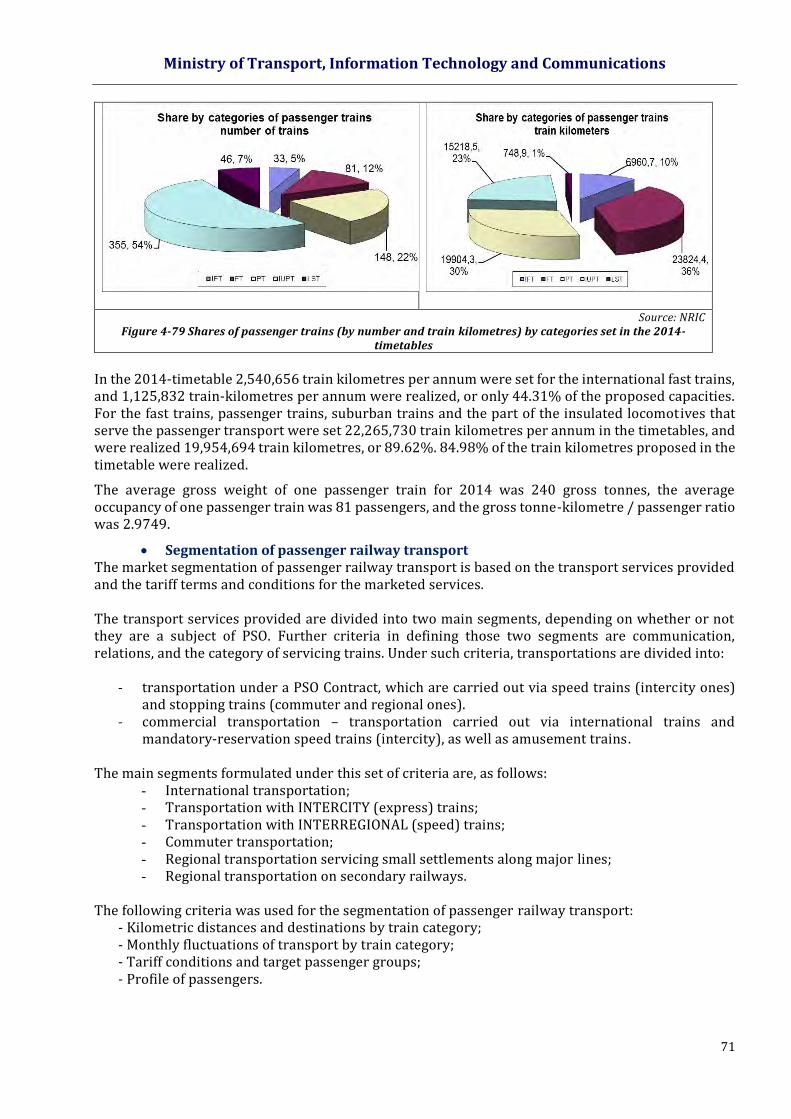
Ministry of Transport, Information Technology and Communications
71
Source: NRIC Figure 4-79 Shares of passenger trains (by number and train kilometres) by categories set in the 2014-
timetables
In the 2014-timetable 2,540,656 train kilometres per annum were set for the international fast trains, and 1,125,832 train-kilometres per annum were realized, or only 44.31% of the proposed capacities. For the fast trains, passenger trains, suburban trains and the part of the insulated locomotives that serve the passenger transport were set 22,265,730 train kilometres per annum in the timetables, and were realized 19,954,694 train kilometres, or 89.62%. 84.98% of the train kilometres proposed in the timetable were realized.
The average gross weight of one passenger train for 2014 was 240 gross tonnes, the average occupancy of one passenger train was 81 passengers, and the gross tonne-kilometre / passenger ratio was 2.9749.
Segmentation of passenger railway transport The market segmentation of passenger railway transport is based on the transport services provided and the tariff terms and conditions for the marketed services. The transport services provided are divided into two main segments, depending on whether or not they are a subject of PSO. Further criteria in defining those two segments are communication, relations, and the category of servicing trains. Under such criteria, transportations are divided into:
- transportation under a PSO Contract, which are carried out via speed trains (intercity ones) and stopping trains (commuter and regional ones).
- commercial transportation – transportation carried out via international trains and mandatory-reservation speed trains (intercity), as well as amusement trains.
The main segments formulated under this set of criteria are, as follows:
- International transportation; - Transportation with INTERCITY (express) trains; - Transportation with INTERREGIONAL (speed) trains; - Commuter transportation; - Regional transportation servicing small settlements along major lines; - Regional transportation on secondary railways.
The following criteria was used for the segmentation of passenger railway transport:
- Kilometric distances and destinations by train category; - Monthly fluctuations of transport by train category; - Tariff conditions and target passenger groups; - Profile of passengers.
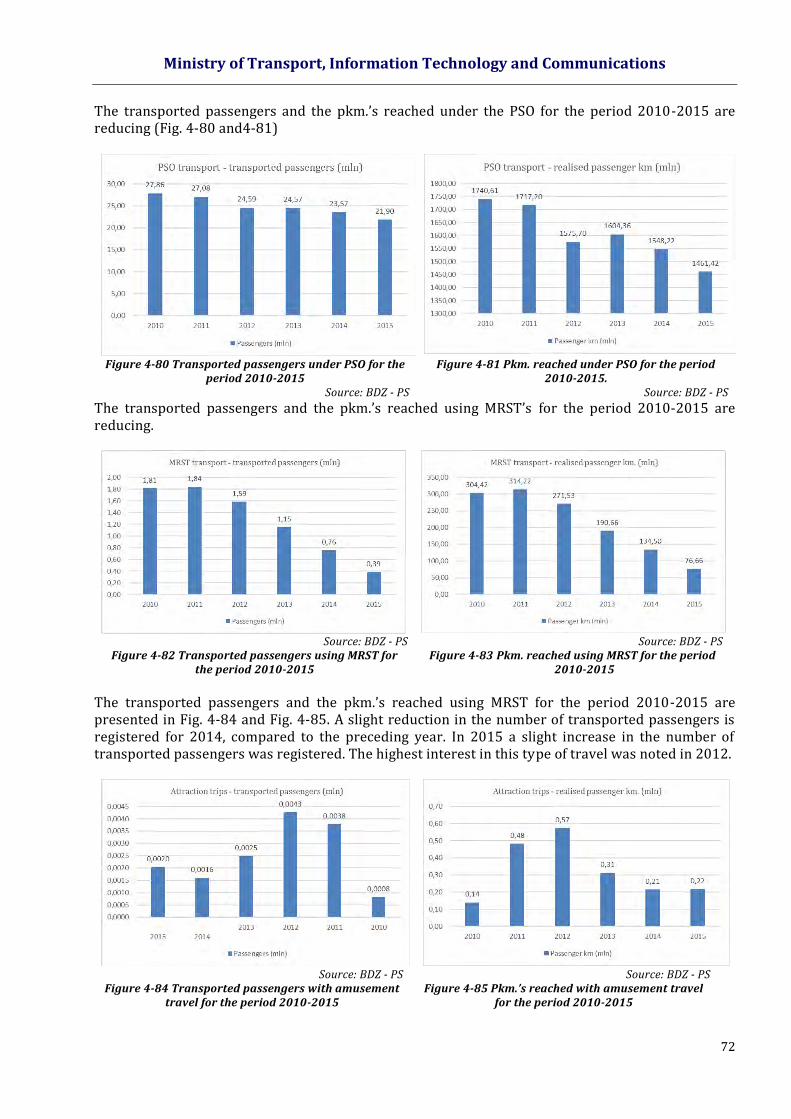
Ministry of Transport, Information Technology and Communications
72
The transported passengers and the pkm.’s reached under the PSO for the period 2010-2015 are reducing (Fig. 4-80 and4-81)
Figure 4-80 Transported passengers under PSO for the
period 2010-2015 Source: BDZ - PS
Figure 4-81 Pkm. reached under PSO for the period 2010-2015.
Source: BDZ - PS
The transported passengers and the pkm.’s reached using MRST’s for the period 2010-2015 are reducing.
Source: BDZ - PS
Figure 4-82 Transported passengers using MRST for the period 2010-2015
Source: BDZ - PS Figure 4-83 Pkm. reached using MRST for the period
2010-2015
The transported passengers and the pkm.’s reached using MRST for the period 2010-2015 are presented in Fig. 4-84 and Fig. 4-85. A slight reduction in the number of transported passengers is registered for 2014, compared to the preceding year. In 2015 a slight increase in the number of transported passengers was registered. The highest interest in this type of travel was noted in 2012.
Source: BDZ - PS
Figure 4-84 Transported passengers with amusement travel for the period 2010-2015
Source: BDZ - PS Figure 4-85 Pkm.’s reached with amusement travel
for the period 2010-2015
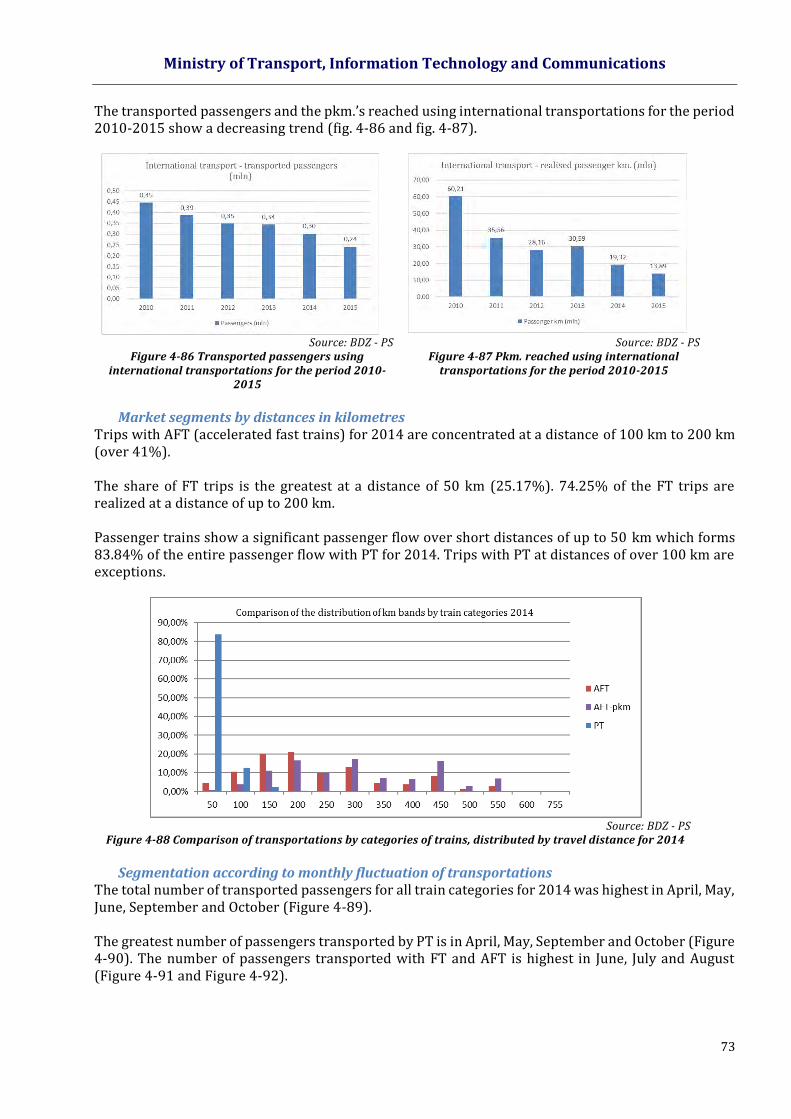
Ministry of Transport, Information Technology and Communications
73
The transported passengers and the pkm.’s reached using international transportations for the period 2010-2015 show a decreasing trend (fig. 4-86 and fig. 4-87).
Source: BDZ - PS
Figure 4-86 Transported passengers using international transportations for the period 2010-
2015
Source: BDZ - PS Figure 4-87 Pkm. reached using international
transportations for the period 2010-2015
Market segments by distances in kilometres
Trips with AFT (accelerated fast trains) for 2014 are concentrated at a distance of 100 km to 200 km (over 41%).
The share of FT trips is the greatest at a distance of 50 km (25.17%). 74.25% of the FT trips are realized at a distance of up to 200 km.
Passenger trains show a significant passenger flow over short distances of up to 50 km which forms 83.84% of the entire passenger flow with PT for 2014. Trips with PT at distances of over 100 km are exceptions.
Source: BDZ - PS
Figure 4-88 Comparison of transportations by categories of trains, distributed by travel distance for 2014
Segmentation according to monthly fluctuation of transportations
The total number of transported passengers for all train categories for 2014 was highest in April, May, June, September and October (Figure 4-89). The greatest number of passengers transported by PT is in April, May, September and October (Figure 4-90). The number of passengers transported with FT and AFT is highest in June, July and August (Figure 4-91 and Figure 4-92).
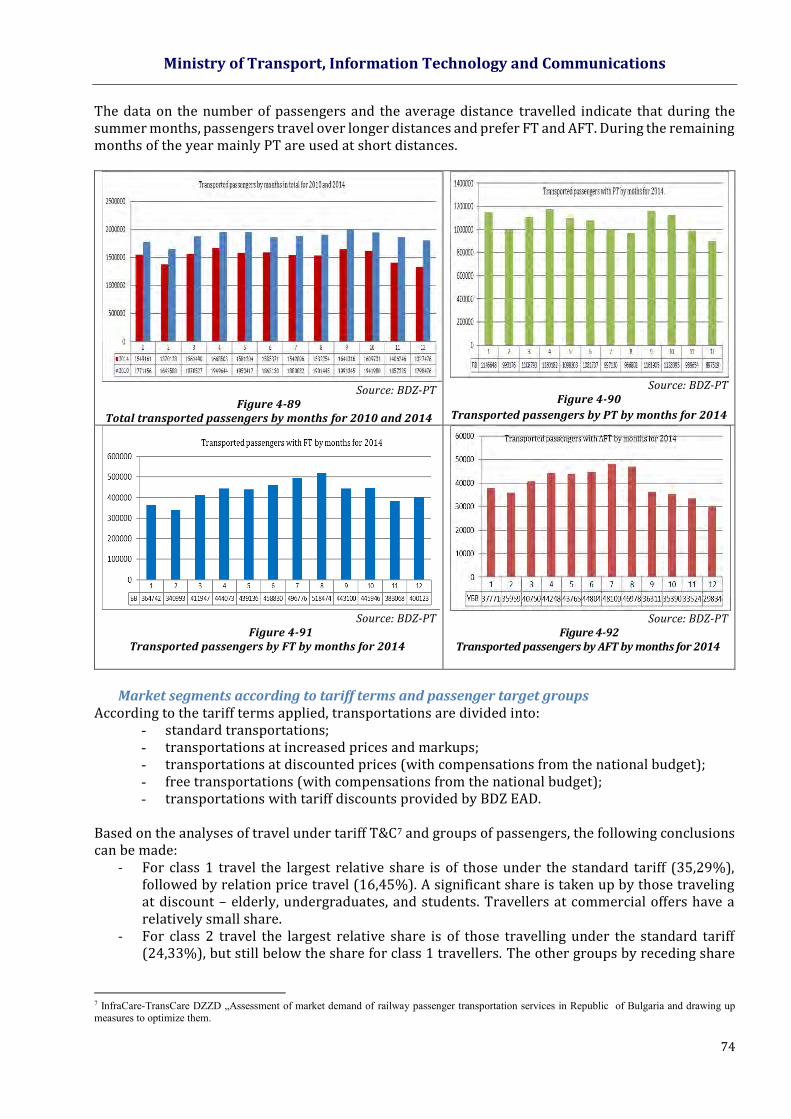
Ministry of Transport, Information Technology and Communications
74
The data on the number of passengers and the average distance travelled indicate that during the summer months, passengers travel over longer distances and prefer FT and AFT. During the remaining months of the year mainly PT are used at short distances.
Source: BDZ-PT
Figure 4-89 Total transported passengers by months for 2010 and 2014
Source: BDZ-PT
Figure 4-90
Transported passengers by PT by months for 2014
Source: BDZ-PT
Figure 4-91 Transported passengers by FT by months for 2014
Source: BDZ-PT
Figure 4-92 Transported passengers by AFT by months for 2014
Market segments according to tariff terms and passenger target groups
According to the tariff terms applied, transportations are divided into: - standard transportations; - transportations at increased prices and markups; - transportations at discounted prices (with compensations from the national budget); - free transportations (with compensations from the national budget); - transportations with tariff discounts provided by BDZ EAD.
Based on the analyses of travel under tariff T&C7 and groups of passengers, the following conclusions can be made:
- For class 1 travel the largest relative share is of those under the standard tariff (35,29%), followed by relation price travel (16,45%). A significant share is taken up by those traveling at discount – elderly, undergraduates, and students. Travellers at commercial offers have a relatively small share.
- For class 2 travel the largest relative share is of those travelling under the standard tariff (24,33%), but still below the share for class 1 travellers. The other groups by receding share
7 InfraCare-TransCare DZZD „Assessment of market demand of railway passenger transportation services in Republic of Bulgaria and drawing up measures to optimize them.
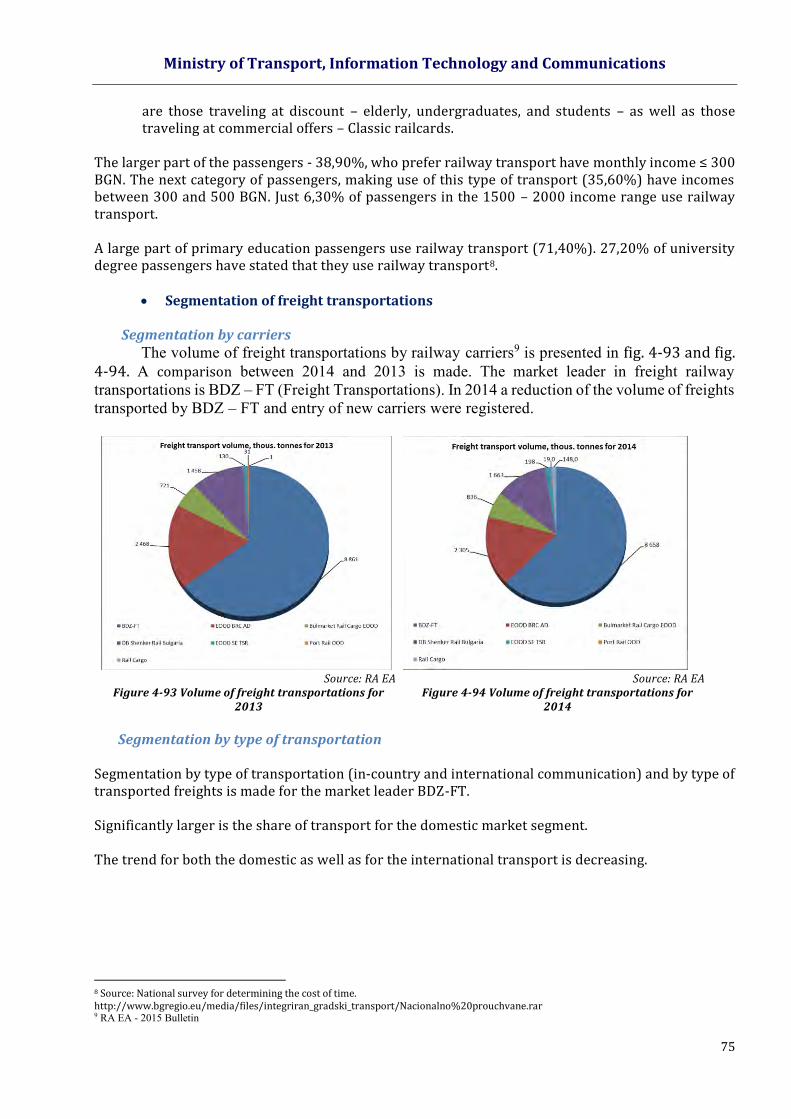
Ministry of Transport, Information Technology and Communications
75
are those traveling at discount – elderly, undergraduates, and students – as well as those traveling at commercial offers – Classic railcards.
The larger part of the passengers - 38,90%, who prefer railway transport have monthly income ≤ 300 BGN. The next category of passengers, making use of this type of transport (35,60%) have incomes between 300 and 500 BGN. Just 6,30% of passengers in the 1500 – 2000 income range use railway transport. A large part of primary education passengers use railway transport (71,40%). 27,20% of university degree passengers have stated that they use railway transport8.
Segmentation of freight transportations
Segmentation by carriers
The volume of freight transportations by railway carriers9 is presented in fig. 4-93 and fig. 4-94. A comparison between 2014 and 2013 is made. The market leader in freight railway transportations is BDZ – FT (Freight Transportations). In 2014 a reduction of the volume of freights transported by BDZ – FT and entry of new carriers were registered.
Source: RA EA
Figure 4-93 Volume of freight transportations for 2013
Source: RA EA Figure 4-94 Volume of freight transportations for
2014
Segmentation by type of transportation
Segmentation by type of transportation (in-country and international communication) and by type of transported freights is made for the market leader BDZ-FT. Significantly larger is the share of transport for the domestic market segment. The trend for both the domestic as well as for the international transport is decreasing.
8 Source: National survey for determining the cost of time. http://www.bgregio.eu/media/files/integriran_gradski_transport/Nacionalno%20prouchvane.rar 9 RA EA - 2015 Bulletin

Ministry of Transport, Information Technology and Communications
76
Source: BDZ - FT
Figure 4-95 Tonnage transported in in-country and international communication
Source: BDZ - FT
Figure 4-96 Work carried out in in-country and international communication
Segmentation by freights
The BDZ-FT transport are analysed by freight for the period from 2007 to 2015 for 10 main groups and are presented in Table 4-12.
Table 4-12 Types of freight categorized in 10 groups Designation Types of freights
0 Farming products and live animals
1 Foodstuffs and forages
2 Solid mineral fuels
3 Oil and oil products
4 Ores and metal waste
5 Items for the ferrous and non-ferrous metallurgy
6 Processed and non-processed non-metallic raw materials
7 Fertilizers
8 Chemical substances and products
9 Machinery, transport equipment, factory products
In comparison to 2013 there was an increase during 2014 the transported freights from the following groups: 2- Solid mineral fuels, 4- Ores and metal waste, 5- Items for the ferrous and non-ferrous metallurgy, and 6 – Processed and non-processed non-metallic raw materials. The volume of transported freights from other groups has declined. Comparison of the transported freights by groups for 2015, vis-à-vis 2014, illustrates an increase of the transported tonnage of freights from the following groups: 3- Oil and oil products, 4- Ores and metal waste, 6 – Processed and non-processed non-metallic raw ma, 7 – Fertilizers, and Group 8 – Chemical substances and products.

Ministry of Transport, Information Technology and Communications
77
Source: BDZ - FT
Figure 4-97 Tons of freights transported by BDZ - FT for the period 2007-2016 by 10 types of freights.
Source: BDZ - FT Figure 4-98 tons/km achieved by BDZ - FT for the
period 2007-2016 by 10 types of freights.
Transport service quality Quality of freight transportations The transport service quality was evaluated by means of utility function10. Utility to customers using transport services (transportation via train) is presented as a function11 of the following indicators: speed; incidence; price; holding capacity (capacity of the rolling stock); comfort; accessibility . For these indicators values, have been defined on a scale of 0 – 5 based on questionnaire surveys on passengers. carried out by interviews with the defined five target groups. The maximum value of the utility function is 40 and corresponds to the provided excellent quality services. The values of the individual indicators comprising the utility function for the railway freight transport for 2015 are shown in figure 4-99.
Figure 4-99 Values of the individual indicators comprising the utility function for the railway
freight transport Source: Interviews held with players on the transport market
With railway freight transport, the highest values go to these indicators: holding capacity, security, price, and reliability, while the lowest-value indicators are flexibility and incidence.
10 Razmov Т. К., Varadinova J. Е., Quality analysis of transport services, Science Journal Mechanics, Transport, Communications., issue 3, 2013. 11 Varadinova-Milkova, J., „Models for sustainable development of railway infrastructure” , thesis, С., HTI ”Т. Kableshkov”, 2014
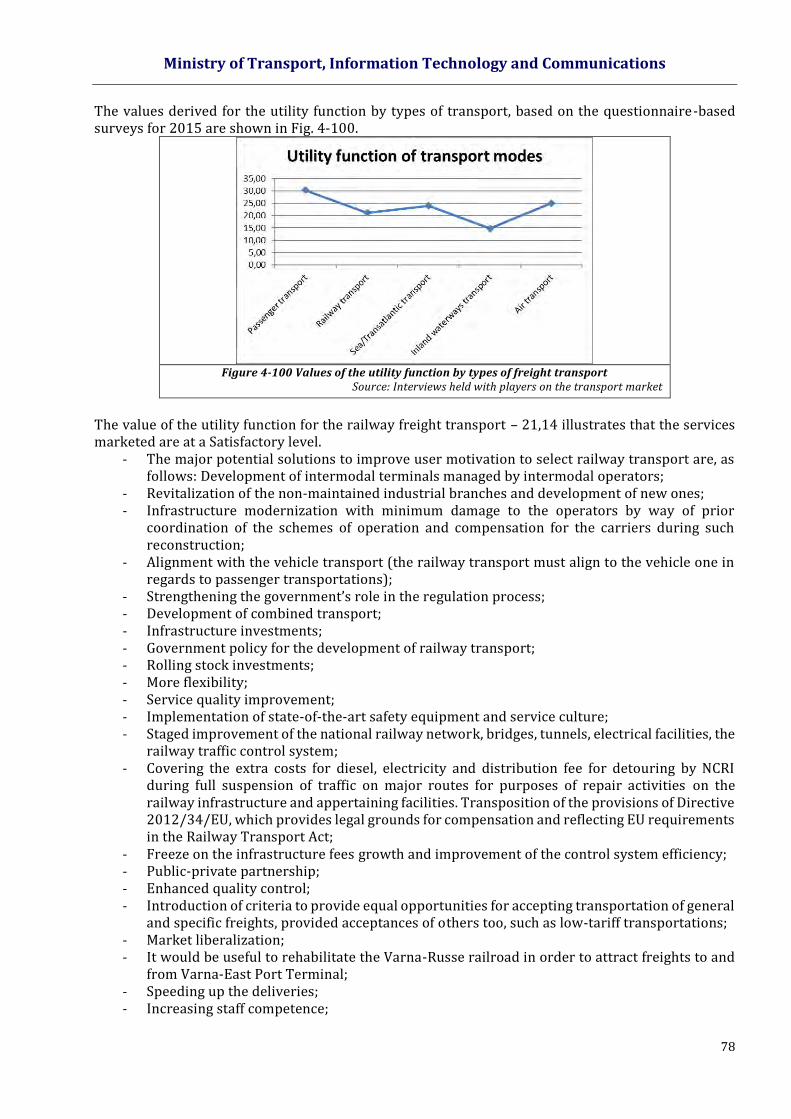
Ministry of Transport, Information Technology and Communications
78
The values derived for the utility function by types of transport, based on the questionnaire-based surveys for 2015 are shown in Fig. 4-100.
Figure 4-100 Values of the utility function by types of freight transport
Source: Interviews held with players on the transport market
The value of the utility function for the railway freight transport – 21,14 illustrates that the services marketed are at a Satisfactory level.
- The major potential solutions to improve user motivation to select railway transport are, as follows: Development of intermodal terminals managed by intermodal operators;
- Revitalization of the non-maintained industrial branches and development of new ones; - Infrastructure modernization with minimum damage to the operators by way of prior
coordination of the schemes of operation and compensation for the carriers during such reconstruction;
- Alignment with the vehicle transport (the railway transport must align to the vehicle one in regards to passenger transportations);
- Strengthening the government’s role in the regulation process; - Development of combined transport; - Infrastructure investments; - Government policy for the development of railway transport; - Rolling stock investments; - More flexibility; - Service quality improvement; - Implementation of state-of-the-art safety equipment and service culture; - Staged improvement of the national railway network, bridges, tunnels, electrical facilities, the
railway traffic control system; - Covering the extra costs for diesel, electricity and distribution fee for detouring by NCRI
during full suspension of traffic on major routes for purposes of repair activities on the railway infrastructure and appertaining facilities. Transposition of the provisions of Directive 2012/34/EU, which provides legal grounds for compensation and reflecting EU requirements in the Railway Transport Act;
- Freeze on the infrastructure fees growth and improvement of the control system efficiency; - Public-private partnership; - Enhanced quality control; - Introduction of criteria to provide equal opportunities for accepting transportation of general
and specific freights, provided acceptances of others too, such as low-tariff transportations; - Market liberalization; - It would be useful to rehabilitate the Varna-Russe railroad in order to attract freights to and
from Varna-East Port Terminal; - Speeding up the deliveries; - Increasing staff competence;
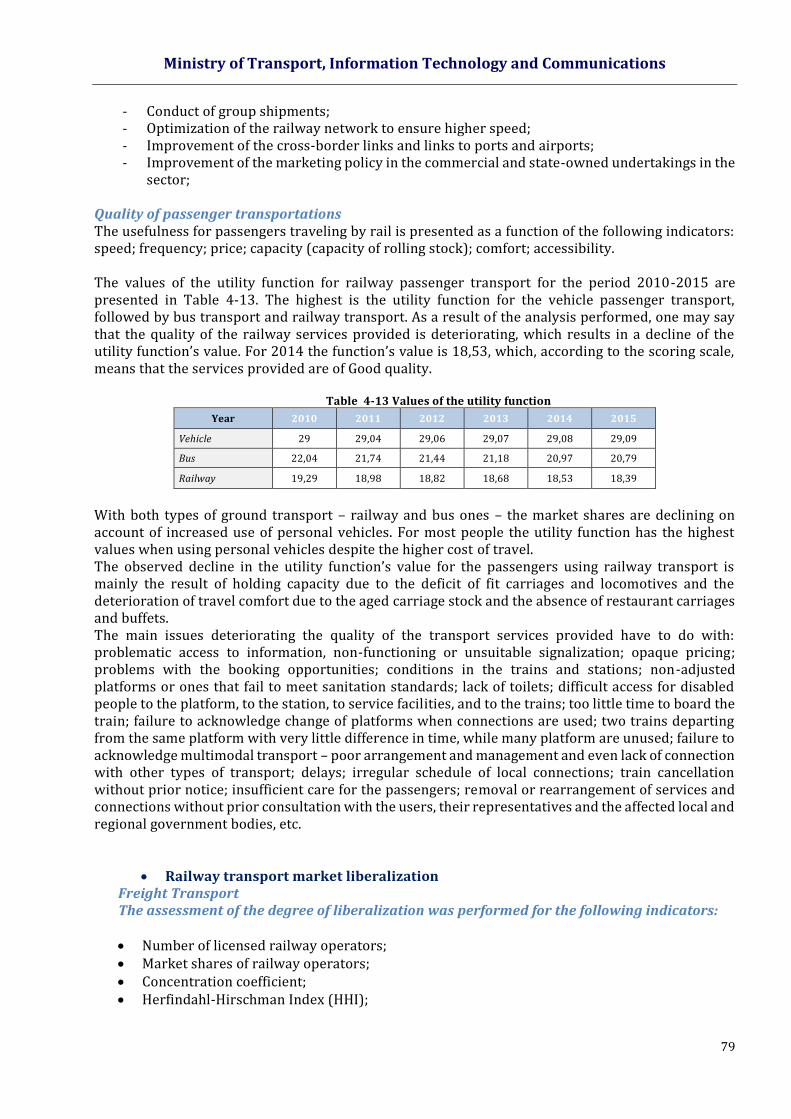
Ministry of Transport, Information Technology and Communications
79
- Conduct of group shipments; - Optimization of the railway network to ensure higher speed; - Improvement of the cross-border links and links to ports and airports; - Improvement of the marketing policy in the commercial and state-owned undertakings in the
sector; Quality of passenger transportations The usefulness for passengers traveling by rail is presented as a function of the following indicators: speed; frequency; price; capacity (capacity of rolling stock); comfort; accessibility. The values of the utility function for railway passenger transport for the period 2010-2015 are presented in Table 4-13. The highest is the utility function for the vehicle passenger transport, followed by bus transport and railway transport. As a result of the analysis performed, one may say that the quality of the railway services provided is deteriorating, which results in a decline of the utility function’s value. For 2014 the function’s value is 18,53, which, according to the scoring scale, means that the services provided are of Good quality.
Table 4-13 Values of the utility function
Year 2010 2011 2012 2013 2014 2015
Vehicle 29 29,04 29,06 29,07 29,08 29,09
Bus 22,04 21,74 21,44 21,18 20,97 20,79
Railway 19,29 18,98 18,82 18,68 18,53 18,39
With both types of ground transport – railway and bus ones – the market shares are declining on account of increased use of personal vehicles. For most people the utility function has the highest values when using personal vehicles despite the higher cost of travel. The observed decline in the utility function’s value for the passengers using railway transport is mainly the result of holding capacity due to the deficit of fit carriages and locomotives and the deterioration of travel comfort due to the aged carriage stock and the absence of restaurant carriages and buffets. The main issues deteriorating the quality of the transport services provided have to do with: problematic access to information, non-functioning or unsuitable signalization; opaque pricing; problems with the booking opportunities; conditions in the trains and stations; non-adjusted platforms or ones that fail to meet sanitation standards; lack of toilets; difficult access for disabled people to the platform, to the station, to service facilities, and to the trains; too little time to board the train; failure to acknowledge change of platforms when connections are used; two trains departing from the same platform with very little difference in time, while many platform are unused; failure to acknowledge multimodal transport – poor arrangement and management and even lack of connection with other types of transport; delays; irregular schedule of local connections; train cancellation without prior notice; insufficient care for the passengers; removal or rearrangement of services and connections without prior consultation with the users, their representatives and the affected local and regional government bodies, etc.
Railway transport market liberalization Freight Transport The assessment of the degree of liberalization was performed for the following indicators: Number of licensed railway operators; Market shares of railway operators; Concentration coefficient; Herfindahl-Hirschman Index (HHI);
Ministry of Transport, Information Technology and Communications
80
Concentration curve; Lorenz curve.
The licensed railway carriers for freight transport in Bulgaria, according to the official bulletins of the Railway Administration Executive Agency, are 13 in total: Bulgarian Railway Company AD; BDZ - Freight Transport EOOD; Gastrade AD; DB Cargo Bulgaria EOOD; Express Service OOD; State Enterprise Transport Construction and Rehabilitation; CARGO TRANS WAGON BULGARIA AD; Port Rail OOD; Rail Cargo Carrier Bulgaria EOOD; Bulmarket Rail Cargo EOOD; TBD – Freight transport EAD; PIMK Rail EAD; Mini Maritsa Iztok EAD. The market share for the railway transport market participants are determined for the work performed in mln. tonkilometers (Figure 4-101) and for transported freight quantities (Figure 4-102).
Figure 4-101 Market shares in %, based on volume of freight transportations
Source: 2013-2015 RAEA Bulletins
Figure 4-102 Market shares in %, based on work performed
Source: 2013-2015 RAEA Bulletins.
In 2015 the market leader is BDZ - Freight transport EOOD, with a market share of 56,50 % (volume of freight transportations), registering a 8, 32 % decrease of the market share for 2015, vis-à-vis 2013. Increasing their market shares are Bulmarket Railway Cargo EOOD by 2,08 %, DB Schenker Railway Bulgaria с 2,95 % and Railway Cargo with 1,67 %. The market leader is BDZ - Freight transport EOOD, as calculated based on work performed, was 48, 61% for 2015. There is a 6,7 % decline of the 2015 market share vis-à-vis 2013. A slight market share decline for 2015, vis-à-vis 2013, is also registered for: BRC AD by 0,87 % and SE TCR by 0,09%. There was a market share increase for: DB Schenker Railway Bulgaria ЕООД by 3,59 % and Railway Cargo by 3,57%. The other carriers also registered slight market share increases. The values of the indicators for the concentration of the freight railway market (Table 4-14), show that the freight railway transport market has a low competitiveness level, with a high concentration level.
Table 4-14 Values of the indicators for assessment of the concentration of the market
Year
Concentration ratio
CR4 CR3 HHI CR4 CR3 HHI
Transport volume Performed work
2013 98, 81 95,54 4670 99, 38 93,04 3865
2014 97,37 91,32 4384 96,53 90,02 3448
2015 95,43 88,08 3761 95,66 89, 06 3255

Ministry of Transport, Information Technology and Communications
81
In 2015, the degree of concentration is lower compared to 2013 which is due to the entry of new carriers in the market and a reduction of the market share of the leader BDZ - Freight Transport EOOD.
Passenger Transport The market for passenger railway transport has only one carrier operating and there is absence of competition. After the announcement of the tender for passenger transport, the only candidate was the BDZ Passenger Transport, which was contracted for 15 years. Through this contract BDZ Passenger Transport EOOD was contracted to perform the duties of the state to provide public services that are subsidized by the state budget. The participation of the railway transport on the market for passenger transport shows a continuous decline. Competitiveness of the development of the railways versus other transport modes has decreased.
4.3.4 RAILWAY INFRASTRUCTURE
Availability The total length of the railway network is 6,474 km, which, when related to the area of Bulgaria, makes an average density of the railway network of 58.9 km / 1,000 km2. Figure 4-103 shows the distribution of the railway lines on the territory of the country.
Source: Reference Document of NRIC, 2016-2017
Figure 4-103 Map of the railway network of the Republic of Bulgaria
Table 4-15 presents the share distribution of single, double, and narrow-gauge railway lines and station tracks.
Ministry of Transport, Information Technology and Communications
82
Table 4-15 Share distribution of types of railways
Parameter Length, km Relative share
2015 %
Total length (km) 6 474 100.0
Single railway lines (km) 2 906 45
Double railway lines (km) 1 976 30.5
Narrow-gauge railway lines (km) 125 1.9
Station tracks (km) 1 467 22.7
Station tracks 1,435 mm 1 439 22.2
Station tracks 760 mm 13 0.2
Station tracks 1,520 mm 15 0.2 Source: Report of Railway Stations Division of NRIC
The total length of the electrified railway lines is 4,712 km (around 73%), including the single and double lines and station tracks. As part of the railway infrastructure, the following are also in operation:
Railroad switches – 7,300 pcs Railway tunnels - 186 pcs with total length of 47.9 km Railway bridges – 1,003 pcs with total length of 42.8 km Crossings - 777 pcs
Table 4- 16 List of railway lines part of the TEN-T network
Railway line No.
Railway line directions
Railway lines of rail-highways class
1 Kalotina-West (state border with the Republic of Serbia) - Sofia - Plovdiv - Dimitrovgrad - Svilengrad (state borders with the Republic of Greece and the Republic of Turkey)
2 Sofia – Mezdra – Gorna Oryahovitsa
4 Ruse (state border with Romania) - Gorna Oryahovitsa – Dabovo - Tulovo – Stara Zagora – Mihailovo - Dimitrovgrad
5 Sofia - Vladaya - Radomir - Dupnitsa - Kulata (state border with the Republic of Greece)
6 Radomir - Gueshevo (state border with the Republic of Macedonia)
7 Mezdra - Vidin
8 Plovdiv Filipovo - Burgas
- Railway lines part of the large scale TEN-T network 2 Gorna Oryahovitsa – Kaspichan – Sindel – Varma
3 Karnobat – Komunari – Sindel Razpredelitelna – Varna Ferry – Razdelna
9 Ruse - Kaspichan
Source: Regulation (EU) No. 1315/2013 OF THE EUROPEAN PARLIAMENT AND THE COUNCIL dated 11 December 2013 in regard to guidelines of the Union on the development of the Trans-European Transport Network
Table 4-17 Length of the railway network part of the TEN-T network
Length of the railway network part of the TEN-T network, km
Main TEN-T network Length (km) Relative share (%)
Large-scale TEN-T network 2 242 45.9
Outside of the scope of the TEN-T network 845 17.3
Main TEN-T network 1795 36.8
The railway network has 299 railway stations, 16 separate posts, and 379 stops.
Border crossings12 With the Republic of Turkey - rail border crossing Svilengrad - Kapi Kule with exchange
border station Kapi Kule and border station Svilengrad;
With the Republic of Greece:
12 Report on the Actual Condition of the Railway Infrastructure / Reference Document 2016-2017/

Ministry of Transport, Information Technology and Communications
83
o rail border crossing Svilengrad - Dikea with exchange border station Svilengrad and border station Dikea;
o rail border crossing Kulata - Promachonas with exchange border station Kulata and border station Promachonas;
With the Republic of Serbia - rail border crossing Dragoman - Dimitrovgrad ZS with common border station Dimitrovgrad ZS and border stations Dragoman and Kalotina west;
With the Republic of Romania:
o rail border crossing Ruse - Giurgiu north with common border station for freight trains Ruse marshalling yard and for passenger trains Ruse, with border station Giurgiu north;
o rail border crossing Kardam - Negru Voda with exchange border station Negru Voda and border station Kardam;
o rail border crossing Vidin - Calafat with common border stations Vidin passengers for passenger trains and Vidin cargo for freight trains on the territory of the Republic of Bulgaria and border station Golentsi on the Romanian territory;
Ferry Complex Varna – provides transportation of railway wagons across the Black Sea to other ports;
With the Republic of Macedonia – no rail link.
Ports The ports of the Black Sea connected with the railway network of the Republic of Bulgaria are
Varna and Burgas.
The Danube ports connected with the railway network of the Republic of Bulgaria are Vidin, Lom, Svishtov, Ruse North, and Ruse West.
Condition The analysis of the railway infrastructure has established an insufficient integration of the national railway network in the European rail system and the need for bringing the technical characteristics of the main directions in accordance with Art. 39 of Regulation (EU) No. 1315/2013. There are insufficient links to maritime and inland-waterway ports with the national railway network with a view to enhancing the development potential of intermodality. The railway network has a large capacity that is not used by railway carriers. A determining indicator of the effectiveness of the network for its role and the importance of the transport system of the country are the speed conditions specified in the Trains Timetable (TT). The main conclusions are as follows: – Only 38.8% of the total length of the main lines are operated at design speed; – The predominant speed range is 60 ÷ 80 km/h - 41,0% of the total length of the main lines; – Speed range 80 ÷ 100 km/h - 24,4% of the total length of the main lines; – Speeds below 60 km/h is possible for 17.4% of the total length of the main directions; – Speed over 100 km/h is possible only for 17.2% of the total length of the main directions. This data shows that the average technical speed of traveling of passenger trains is one of the lowest in Europe, which is the reason for the low quality of service. The more significant problems are identified in the analysis of the railway infrastructure:
Track and facilities
In the railway infrastructure, in its track and facilities part, the following issues have been identified:
- There is a significant difference between the design speed and the actual operating speed on the main railway lines, an indicator of the actual condition of the track.
- The permissible maximum load of 23 tons / axle is limited for individual sections to 22 tons / axle;
- The average technical speed of movement of the passenger trains is one of the lowest in Europe, which is the reason for the low quality of the service provided.

Ministry of Transport, Information Technology and Communications
84
- Poor physical condition of the assets, failure of major repairs on the main directions in the network in sections with a total length of about 1,700 km,
- The track geometry along the main railway lines in laden condition is not regularly measured: the latest measure of the track geometry along the main railway lines, in laden condition, with track recording railcar EM-120 "Plasser & Theurer" dates back to the end of 2013;
- The policy on the rail infrastructure implemented so far is aimed at renewal and / or repair of individual sections, which does not change the overall carrying capacity of the Bulgarian railway network;
- Aging and outdated technologies are still used, requiring higher staffing levels and large material costs.
Power facilities
In the railway infrastructure, in its overhead wiring and traction substations part, the following issues have been identified:
- The average service life of the overhead wiring is 30 years; after this period, the operating costs in most cases exceed the cost of new construction.
- The facilities of the traction substations are morally and physically obsolete, with low reliability, requiring frequent repairs and many resources;
- Change in the status of many operating points in the last two years; some were differentiated as separate posts, while others were differentiated as stops. These operating points require reconstruction of the overhead lines due to the dismantling of switches and tracks and the inability to reach the facilities of the overhead lines because of tracks filled with parked rolling stock, in troubleshooting this increases the time to remove the damage and the time of delay of the trains;
- Increase in the damage to rail self-propelled specialized machines in recent years;
Security equipment and telecommunications In regard to the railway infrastructure, in the part for security and telecommunications equipment, the following problems were identified:
• The limit technical resource of the relay interlocking systems is exhausted - the risk of a dangerous failure increases due to long service life, lack of backup equipment, inadequate maintenance personnel;
• In ensuring the safety of the train traffic, there is tangible presence of the human factor (in the stations without interlocking systems, with temporary control desks, and relay systems with key connections) in about 30% of the stations along the entire railway network as well as in about 20% of the stations on the main railway network, without the branch lines;
• In about 59% of the stations along the entire railway network and in about 68% of the stations on the main railway network without the branch lines, the human factor is minimized to a reasonable limit which tends to zero but the main part of the relay interlocking systems is with a realized service life in the range of 35-57 years, while in the electromechanical interlocking systems and the relay systems with key connections this period exceeds 50 and reaches 80 years;
• The re-equipment of the stations on the main lines with modern interlocking systems (route-computer interlocking systems) is carried out very slowly;
• One of the findings that make an impression in connection with the closing of operating stations relates to the closure of the stations equipped with route-relay interlocking systems whereat neighbouring stations equipped, for example, with relay systems with key connections, remain active;
• The main equipment of the telecommunications is at a very low technological level, given the pace of development in this area and the new technologies introduced;
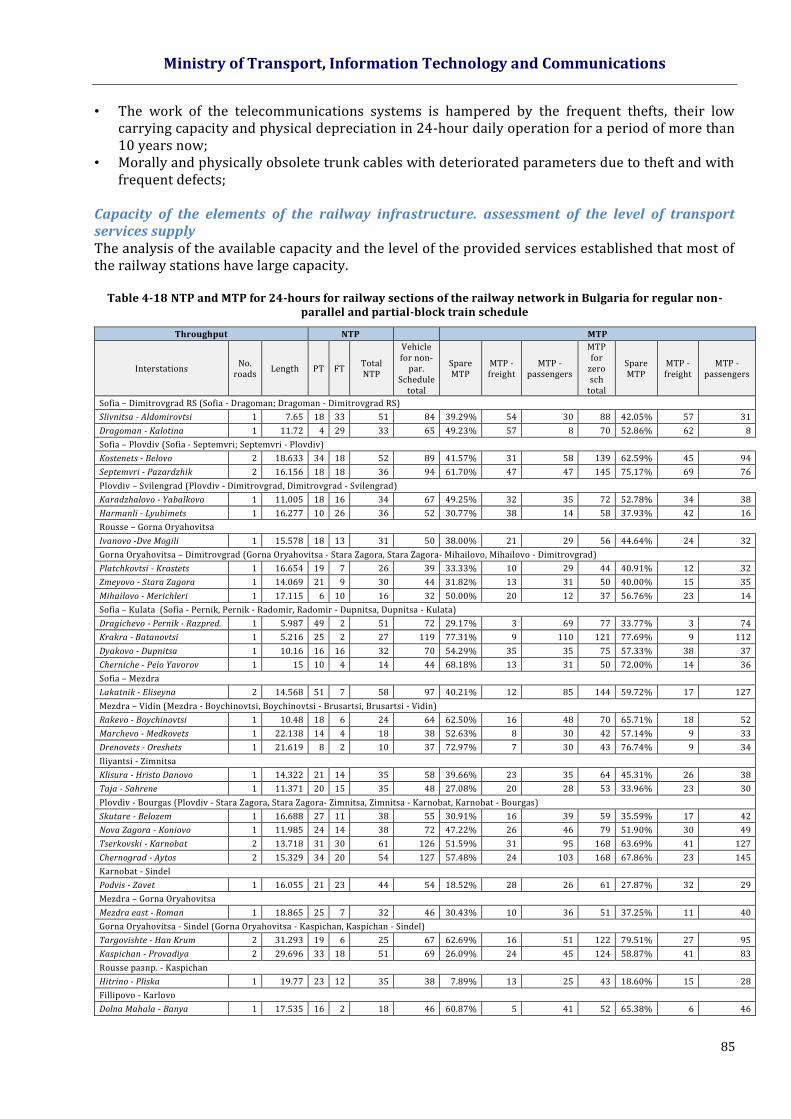
Ministry of Transport, Information Technology and Communications
85
• The work of the telecommunications systems is hampered by the frequent thefts, their low carrying capacity and physical depreciation in 24-hour daily operation for a period of more than 10 years now;
• Morally and physically obsolete trunk cables with deteriorated parameters due to theft and with frequent defects;
Capacity of the elements of the railway infrastructure. assessment of the level of transport services supply The analysis of the available capacity and the level of the provided services established that most of the railway stations have large capacity.
Table 4-18 NTP and MTP for 24-hours for railway sections of the railway network in Bulgaria for regular non-parallel and partial-block train schedule
Throughput NTP MTP
Interstations No.
roads Length PT FT
Total NTP
Vehicle for non-
par. Schedule
total
Spare MTP
MTP - freight
MTP - passengers
MTP for
zero sch
total
Spare MTP
MTP - freight
MTP - passengers
Sofia – Dimitrovgrad RS (Sofia - Dragoman; Dragoman - Dimitrovgrad RS)
Slivnitsa - Aldomirovtsi 1 7.65 18 33 51 84 39.29% 54 30 88 42.05% 57 31
Dragoman - Kalotina 1 11.72 4 29 33 65 49.23% 57 8 70 52.86% 62 8
Sofia – Plovdiv (Sofia - Septemvri; Septemvri - Plovdiv)
Kostenets - Belovo 2 18.633 34 18 52 89 41.57% 31 58 139 62.59% 45 94
Septemvri - Pazardzhik 2 16.156 18 18 36 94 61.70% 47 47 145 75.17% 69 76
Plovdiv – Svilengrad (Plovdiv - Dimitrovgrad, Dimitrovgrad - Svilengrad)
Karadzhalovo - Yabalkovo 1 11.005 18 16 34 67 49.25% 32 35 72 52.78% 34 38
Harmanli - Lyubimets 1 16.277 10 26 36 52 30.77% 38 14 58 37.93% 42 16
Rousse – Gorna Oryahovitsa
Ivanovo -Dve Mogili 1 15.578 18 13 31 50 38.00% 21 29 56 44.64% 24 32
Gorna Oryahovitsa – Dimitrovgrad (Gorna Oryahovitsa - Stara Zagora, Stara Zagora- Mihailovo, Mihailovo - Dimitrovgrad)
Platchkovtsi - Krastets 1 16.654 19 7 26 39 33.33% 10 29 44 40.91% 12 32
Zmeyovo - Stara Zagora 1 14.069 21 9 30 44 31.82% 13 31 50 40.00% 15 35
Mihailovo - Merichleri 1 17.115 6 10 16 32 50.00% 20 12 37 56.76% 23 14
Sofia – Kulata (Sofia - Pernik, Pernik - Radomir, Radomir - Dupnitsa, Dupnitsa - Kulata)
Dragichevo - Pernik - Razpred. 1 5.987 49 2 51 72 29.17% 3 69 77 33.77% 3 74
Krakra - Batanovtsi 1 5.216 25 2 27 119 77.31% 9 110 121 77.69% 9 112
Dyakovo - Dupnitsa 1 10.16 16 16 32 70 54.29% 35 35 75 57.33% 38 37
Cherniche - Peio Yavorov 1 15 10 4 14 44 68.18% 13 31 50 72.00% 14 36
Sofia – Mezdra
Lakatnik - Eliseyna 2 14.568 51 7 58 97 40.21% 12 85 144 59.72% 17 127
Mezdra – Vidin (Mezdra - Boychinovtsi, Boychinovtsi - Brusartsi, Brusartsi - Vidin)
Rakevo - Boychinovtsi 1 10.48 18 6 24 64 62.50% 16 48 70 65.71% 18 52
Marchevo - Medkovets 1 22.138 14 4 18 38 52.63% 8 30 42 57.14% 9 33
Drenovets - Oreshets 1 21.619 8 2 10 37 72.97% 7 30 43 76.74% 9 34
Iliyantsi - Zimnitsa
Klisura - Hristo Danovo 1 14.322 21 14 35 58 39.66% 23 35 64 45.31% 26 38
Taja - Sahrene 1 11.371 20 15 35 48 27.08% 20 28 53 33.96% 23 30
Plovdiv - Bourgas (Plovdiv - Stara Zagora, Stara Zagora- Zimnitsa, Zimnitsa - Karnobat, Karnobat - Bourgas)
Skutare - Belozem 1 16.688 27 11 38 55 30.91% 16 39 59 35.59% 17 42
Nova Zagora - Koniovo 1 11.985 24 14 38 72 47.22% 26 46 79 51.90% 30 49
Tserkovski - Karnobat 2 13.718 31 30 61 126 51.59% 31 95 168 63.69% 41 127
Chernograd - Aytos 2 15.329 34 20 54 127 57.48% 24 103 168 67.86% 23 145
Karnobat - Sindel
Podvis - Zavet 1 16.055 21 23 44 54 18.52% 28 26 61 27.87% 32 29
Mezdra – Gorna Oryahovitsa
Mezdra east - Roman 1 18.865 25 7 32 46 30.43% 10 36 51 37.25% 11 40
Gorna Oryahovitsa - Sindel (Gorna Oryahovitsa - Kaspichan, Kaspichan - Sindel)
Targovishte - Han Krum 2 31.293 19 6 25 67 62.69% 16 51 122 79.51% 27 95
Kaspichan - Provadiya 2 29.696 33 18 51 69 26.09% 24 45 124 58.87% 41 83
Rousse разпр. - Kaspichan
Hitrino - Pliska 1 19.77 23 12 35 38 7.89% 13 25 43 18.60% 15 28
Fillipovo - Karlovo
Dolna Mahala - Banya 1 17.535 16 2 18 46 60.87% 5 41 52 65.38% 6 46

Ministry of Transport, Information Technology and Communications
86
Table 4-19 Maximum transportability
Interstations
Vehicles Maximum transportability in tonne per year
Vehicles
for zero
schedule
total
Spare
Vehicles
Vehicles
- freight
Vehicles
for zero
schedule
total
Spare
Vehicles
Vehicles
- freight
Maximum
transportability
for zero sch total
(350 tonnes per
train)
Maximum
transportability
for zero sch total
(350 tonnes per
train)
Maximum
transportability
for zero sch total
(700 tonnes per
train)
Maximum
transportability
for zero sch total
(700 tonnes per
train)
Sofia – Dimitrovgrad RS (Sofia - Dragoman; Dragoman - Dimitrovgrad RS)
Slivnitsa - Aldomirovtsi 84 39.29% 54 88 42.05% 57 6 898 500 7 281 750t 13 797 000 14 563 500
Dragoman - Kalotina 65 49.23% 57 70 52.86% 62 7 281 750 7 920 500 14 563 500 15 841 000
Sofia – Plovdiv (Sofia - Septemvri; Septemvri - Plovdiv)
Kostenets - Belovo 89 41.57% 31 139 62.59% 45 3 960 250 5 748 750 7 920 500 11 497 500
Septemvri - Pazardzhik 94 61.70% 47 145 75.17% 69 6 004 250 8 814 750 12 008 500 17 629 500
Plovdiv – Svilengrad (Plovdiv - Dimitrovgrad, Dimitrovgrad - Svilengrad)
Karadzhalovo - Yabalkovo 67 49.25% 32 72 52.78% 34 4 088 000 4 343 500 8 176 000 8 687 000
Harmanli - Lyubimets 52 30.77% 38 58 37.93% 42 4 854 500 5 365 500 9 709 000 10 731 000
Rousse – Gorna Oryahovitsa
Иваново – Dve Mogili 50 38.00% 21 56 44.64% 24 2 682 750 3 066 000 5 365 500 6 132 000
Gorna Oryahovitsa – Dimitrovgrad (Gorna Oryahovitsa - Stara Zagora, Stara Zagora- Mihailovo, Mihailovo - Dimitrovgrad)
Platchkovtsi - Krastets 39 33.33% 10 44 40.91% 12 1 277 500 1 533 000 2 555 000 3 066 000
Zmeyovo - Stara Zagora 44 31.82% 13 50 40.00% 15 1 660 750 1 916 250 3 321 500 3 832 500
Mihailovo - Merichleri 32 50.00% 20 37 56.76% 23 2 555 000 2 938 250 5 110 000 5 876 500
Sofia – Kulata (Sofia - Pernik, Pernik - Radomir, Radomir - Dupnitsa, Dupnitsa - Kulata)
Dragichevo - Pernik - Razpred. 72 29.17% 3 77 33.77% 3 383 250 383 250 766 500 766 500
Krakra - Batanovtsi 119 77.31% 9 121 77.69% 9 1 149 750 1 149 750 2 299 500 2 299 500
Dyakovo - Dupnitsa 70 54.29% 35 75 57.33% 38 4 471 250 4 854 500 8 942 500 9 709 000
Cherniche - Peio Yavorov 44 68.18% 13 50 72.00% 14 1 660 750 1 788 500 3 321 500 3 577 000
Sofia – Mezdra
Lakatnik - Eliseyna 97 40.21% 12 144 59.72% 17 1 533 000 2 171 750 3 066 000 4 343 500
Mezdra – Vidin (Mezdra - Boychinovtsi, Boychinovtsi - Brusartsi, Brusartsi - Vidin)
Rakevo - Boychinovtsi 64 62.50% 16 70 65.71% 18 2 044 000 2 299 500 4 088 000 4 599 000
Marchevo - Medkovets 38 52.63% 8 42 57.14% 9 1 022 000 1 149 750 2 044 000 2 299 500
Drenovets - Oreshets 37 72.97% 7 43 76.74% 9 894 250 1 149 750 1 788 500 2 299 500
Iliyantsi - Zimnitsa
Klisura - Hristo Danovo 58 39.66% 23 64 45.31% 26 2 938 250 3 321 500 5 876 500 6 643 000
Taja - Sahrene 48 27.08% 20 53 33.96% 23 2 555 000 2 938 250 5 110 000 5 876 500
Plovdiv - Bourgas (Plovdiv - Stara Zagora, Stara Zagora- Zimnitsa, Zimnitsa - Karnobat, Karnobat - Bourgas)
Skutare - Belozem 55 30.91% 16 59 35.59% 17 2 044 000 2 171 750 4 088 000 4 343 500
Nova Zagora - Koniovo 72 47.22% 26 79 51.90% 30 3 321 500 3 832 500 6 643 000 7 665 000
Tserkovski - Karnobat 126 51.59% 31 168 63.69% 41 3 960 250 5 237 750 7 920 500 10 475 500
Chernograd - Aytos 127 57.48% 24 168 67.86% 23 3 066 000 2 938 250 6 132 000 5 876 500
Karnobat - Sindel
Podvis - Zavet 54 18.52% 28 61 27.87% 32 3 577 000 4 088 000 7 154 000 8 176 000
Mezdra – Gorna Oryahovitsa
Mezdra east - Roman 46 30.43% 10 51 37.25% 11 1 277 500 1 405 250 2 555 000 2 810 500
Gorna Oryahovitsa - Sindel (Gorna Oryahovitsa - Kaspichan, Kaspichan - Sindel)
Targovishte - Han Krum 67 62.69% 16 122 79.51% 27 2 044 000 3 449 250 4 088 000 6 898 500
Kaspichan - Provadiya 69 26.09% 24 124 58.87% 41 3 066 000 5 237 750 6 132 000 10 475 500
Rousse разпр. - Kaspichan
Hitrino - Pliska 38 7.89% 13 43 18.60% 15 1 660 750 1 916 250 3 321 500 3 832 500
Fillipovo - Karlovo
Dolna Mahala - Banya 46 60.87% 5 52 65.38% 6 638 750 766 500 1 277 500 1 533 000
There is a significant difference between permitted speed and the technical speeds specified in the Train Timetable. This is due to the fact that the railway infrastructure offers operating conditions (high limit speeds and capacity) that cannot be effectively used by passenger and freight operators. Carriers do not have rolling stock that can take advantage of the available railway infrastructure conditions of transportation.

Ministry of Transport, Information Technology and Communications
87
The increased speed limit up to 160 km/h for passenger trains and 120 km/h for freight trains in railway stations, where projects for rehabilitation or modernization are implemented, cannot improve the railway services if the technical characteristics of the railway carrier rolling stock are not improved. The capacity is determined by the technical speeds, and these depend on the rolling stock. Some of the stations in-between stations are closed to traffic and are turned into stops. This does not diminish the accessibility of passenger railway services. The capacity is reduced, but the availability of a large reserve that continues to increase (railway traffic continues to decline) does not adversely affect operational activities. Some of the stations are closed to traffic services for part of the day, which reduces capacity. Railway traffic has adjusted to these restrictions, as evidenced by the daily time profile of railway traffic. Railway carriers do not use all routes specified in the train timetable. There are disruptions of the train timetable. This is an adverse aspect in terms of planning the operation of the railway infrastructure. Greater resources, than required, are planned to ensure its safety and traffic than necessary. The low quality and capacity of the rolling stock hinders the innovative development of railway infrastructure. Lack of equipment in locomotives for ERTMS hampers the commissioning and normal operation of the equipment. The realized changes in the railway network are also related to the capacity management. So far, these are low-tech solutions. It is required, despite of the large reserve, to carry out technological upgrading of the methods for managing the network capacity. This would also have economic impact. Costs for operation and maintenance For the period 2007 - 2014 there is a shortage in the financing of the operation and the maintenance of the railway infrastructure. The mean values for the period are set at 25% and 30% of direct costs and are between 25 and 96 million BGN per year. Assuming that the direct costs of the minimum access package are 27.5% of the total costs, the deficit for the period 2007-2014 was an average of about 58 million BGN per year.
4.3.5 ROLLING STOCK
There are 282 diesel and 285 electric locomotives operating on the territory of the country. The diesel locomotives include 73% property of Holding BDZ EAD (5%), BDZ PT EOOD (27%) and BDZ FT EOOD (41%). The electric locomotives include 76% property of Holding BDZ EAD (5%), BDZ PT EOOD (43%) and BDZ FT EOOD (28%). The main problem at BDZ-PT related to the big number of failures of traction rolling stock is the increase in the overmilleage of the locomotives for overhaul. There are exceptionally many cases, in which locomotives are in operation with approved two or three protocols for overmilleage, which even more leads to deterioration of the general technical status of the rolling stones. 70% of the freight wagons on the network are property of Holding BDZ EAD and BDZ FT EOOD. There is low efficiency of use of the freight wagons caused by excess capacity, high turnover of the freight wagon, and a high percentage of trips without load. BDZ PT EOOD owns a total of 381 passenger wagons, 280 of which are more than 26 years old. Significant share of the rolling stock operating on the national railway infrastructure is obsolete, requiring use of funds for its maintenance and needs renovation and modernization.
Ministry of Transport, Information Technology and Communications
88
4.3.6 SAFETY AND SECURITY
Safety and security are of major importance for each transport system. The users of transport services expect the transport process to be safe. At European level, one of the roles of the European Commission is to respond to these expectations by ensuring the implementation of the necessary safety and security standards in all modes of transport throughout the EU. The importance of the safety and security issues has considerably increased in recent years due to the unstable international climate and the heightened alert of terrorist attacks at a global level. In analysing the safety and security of railway transport, the following issues of normative and operational nature were established:
The general safety method for the risk identification and assessment and the results thereof in practice is difficult to apply and is untimely, although the IM and the railway carriers apply the developed SMS;
30% of the cases of derailments in 2013 and 2014 occurred due to damaged geometric and dynamic parameters of the track. The main reasons are as follows: - Reduced production capacity of the staff responsible for the ongoing track maintenance
and low productivity. Staff is contracted year round, and is actively used during the Spring-Summer period.
- Low productivity and constant inability to eliminate current deficiencies in the railway track.
- The railway lines that are not along the European corridors route, do not provided with the necessary financial resources for the ongoing track maintenance and the absence of such funding imposes delays in planned repairs, technical parameters deteriorate and this leads to deteriorated operating parameters. The operational programs do not provide funds for the repair, maintenance, rehabilitation and modernization of these lines.
- 23,5 % of the cases of derailments in 2013 and 2014 occurred due to technical causes of the rolling stock and incorrect load placement.
- There is no integrated system for load control and weight of the wagons and the status of their sockets, which do not meet the requirements of TSI OPE.
4.3.7 INTEROPERABILITY
The aim of the interoperability analysis of the freight and passenger services is to establish the scope and extent of implementation of the requirements of the TSIs for the conventional national railway system in the Republic of Bulgaria. The findings should identify problems and areas of failure of interoperability and the underlying factors.
Factors that have caused the identified incompliance can be summarized as follows: Weak will for imposing the European technical requirements for interoperability; Formal strategic planning without reporting, monitoring and adjustment instruments; Lack of qualified and motivated expert team and specialists; Not adapted environment and investment climate, reflecting the need for imposing the
requirements for interoperability; Disinterest and non-professional attitude on the specifics of the requirements for
interoperability; Transferring responsibilities and postponing obligations by key stakeholders and responsible
authorities; Heavy administrative and bureaucratic procedures in imposing changes to national
regulations and requirements; Non-existence of clearly identified administrative authorities with specific commitments and
competence for implementing the requirements for interoperability;
Ministry of Transport, Information Technology and Communications
89
Non-establishment of administrative structure with the infrastructure manager, competent and responsible for the interoperability implementation.
Multiple incompliances are established in transposing the Directive on interoperability in the national law, as any subsequent amendment of Ordinance No. 57 brings new requirements of the amendments to Directive 57, but the underlying and reported incompliances are not addressed.
There is uncertainty about who in practice defines the scope of the modernization/ renovation of a structural subsystem - the Applicant, the National Safety Authority or The Supervisory Authority;
In practice, the cumbersome and uncertain process of commissioning of the subsystems leads to operation of the same without being commissioned according to the requirements of Ordinance 57 and there are no measures/sanctions provided to prevent this.
For difficult applicability of Ordinance No. 57 speaks the fact that the Ordinance is effective since 2004 and still here is no structural subsystem commissioned (excluding the vehicles);
There is ambiguity, both at national and European level, in defining when a subsystem is new, when it is modernized, and when it was renovated, according to the different definitions in different regulations.
In the most railway projects in Bulgaria is performed modernization or renovation of a subsystem or part of a subsystem, leading to the issuance of interim certificate of verification (ISV) of this subsystem. This makes impossible its commissioning due to the requirement for availability of EC Verification certificate. This means that a modernized/ renovated subsystem or part of a subsystem cannot be commissioned until it is fully covered by the TSI or derogated.
There are incompliances in the technical requirements of the national and European regulatory base.
TSI Telematics applications for freight transport applies in part to some functional and technical specifications of the subsystem (data from the documents for tracking, route request, wagon movement, reports on the exchanges, developing a common interface). Currently, there is developed and operational software for planning of train operations, designated as "Timetable Generator";
Currently the state of the application of the TSI Telematics applications for passenger transport has not changed significantly compared to the moment of the preparation of the strategy for implementation of the TSI Telematics applications for passenger transport of the Trans-European Regulation No. 454/2011/EU from June 2013 of the Ministry of Transport, Information Technology and Communications. This TSI is not applied, and neither the Infrastructure Manager nor the Railway Company providing passenger services is ready for data exchange according to the technical specifications for interoperability.
4.3.8 INTELLIGENT TRANSPORT SYSTEMS
Intelligent Transport Systems (ITS) encompass a wide range of technical solutions designed to improve transportation by improving mobility and increasing safety of road/rail traffic. Telematics (a combination of telecommunications and informatics) uses advanced technologies to meet the transport needs. In the road infrastructure they may include traffic sensors, accidents registration systems, and in the road and railway Infrastructure - applications in the field of planning and traffic management, safety, security and end users services. Intelligent Transport Systems have the following three basic properties:
• Receive information from the external environment; • Have a memory of past events; • On the basis of the first two properties make decisions and respond to the respective situation.
From the perspective of the above, none of the known systems in the railway transport in our country can be attributed to the ITS, even the microcomputer and interlocking systems, irrespectively they have part of the ITS properties.
Ministry of Transport, Information Technology and Communications
90
In regard to the ERTMS system, the following problems have been identified:
- Lack of comprehensively implemented ERTMS modern signalling systems and telecommunications (with ETCS and GSM-R subsystems) for achieving interoperability along the core and comprehensive Trans-European railway network;
- There is a delay in the implementation of the National Plan of the Republic of Bulgaria for the implementation of the European System for Rail Traffic Management (ERTMS) due to the impossibility to provide funding which leads to delay in the construction works on the subsystems preceding the ERTMS implementation and the preparation of the documentations required for the announcement of the tender procedures for selection of a Contractor.
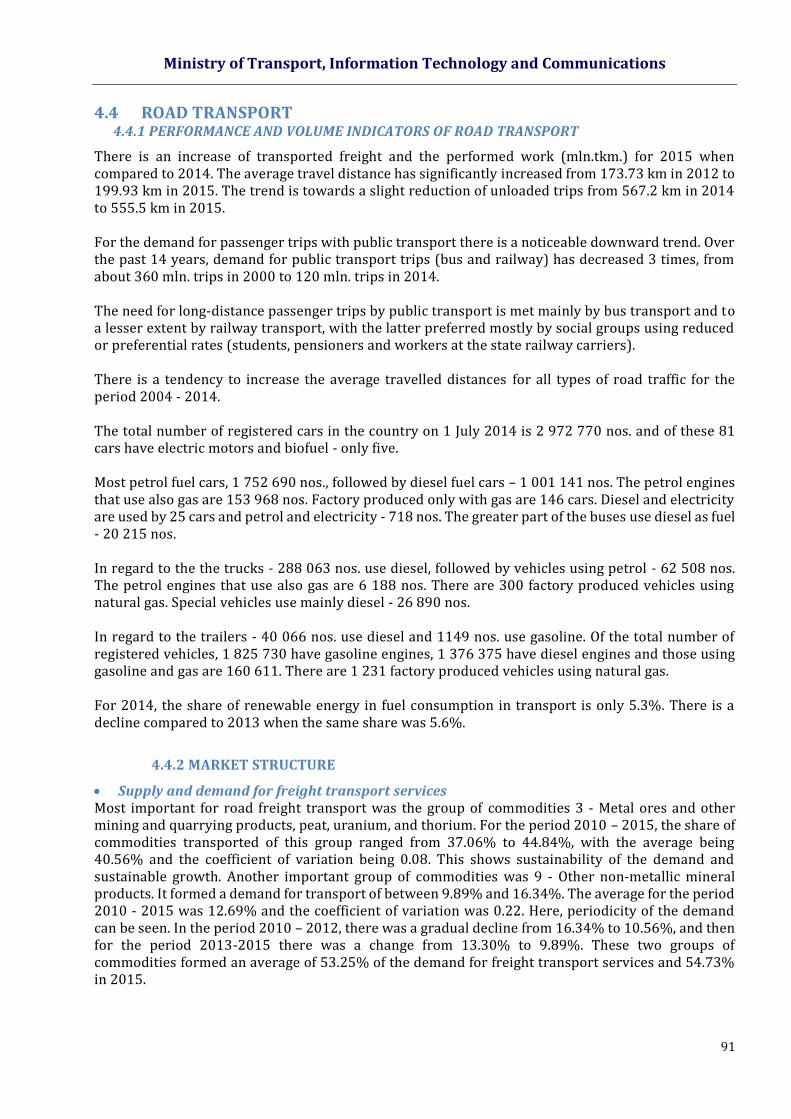
Ministry of Transport, Information Technology and Communications
91
4.4 ROAD TRANSPORT 4.4.1 PERFORMANCE AND VOLUME INDICATORS OF ROAD TRANSPORT
There is an increase of transported freight and the performed work (mln.tkm.) for 2015 when compared to 2014. The average travel distance has significantly increased from 173.73 km in 2012 to 199.93 km in 2015. The trend is towards a slight reduction of unloaded trips from 567.2 km in 2014 to 555.5 km in 2015. For the demand for passenger trips with public transport there is a noticeable downward trend. Over the past 14 years, demand for public transport trips (bus and railway) has decreased 3 times, from about 360 mln. trips in 2000 to 120 mln. trips in 2014. The need for long-distance passenger trips by public transport is met mainly by bus transport and to a lesser extent by railway transport, with the latter preferred mostly by social groups using reduced or preferential rates (students, pensioners and workers at the state railway carriers). There is a tendency to increase the average travelled distances for all types of road traffic for the period 2004 - 2014. The total number of registered cars in the country on 1 July 2014 is 2 972 770 nos. and of these 81 cars have electric motors and biofuel - only five. Most petrol fuel cars, 1 752 690 nos., followed by diesel fuel cars – 1 001 141 nos. The petrol engines that use also gas are 153 968 nos. Factory produced only with gas are 146 cars. Diesel and electricity are used by 25 cars and petrol and electricity - 718 nos. The greater part of the buses use diesel as fuel - 20 215 nos. In regard to the the trucks - 288 063 nos. use diesel, followed by vehicles using petrol - 62 508 nos. The petrol engines that use also gas are 6 188 nos. There are 300 factory produced vehicles using natural gas. Special vehicles use mainly diesel - 26 890 nos. In regard to the trailers - 40 066 nos. use diesel and 1149 nos. use gasoline. Of the total number of registered vehicles, 1 825 730 have gasoline engines, 1 376 375 have diesel engines and those using gasoline and gas are 160 611. There are 1 231 factory produced vehicles using natural gas. For 2014, the share of renewable energy in fuel consumption in transport is only 5.3%. There is a decline compared to 2013 when the same share was 5.6%.
4.4.2 MARKET STRUCTURE
Supply and demand for freight transport services Most important for road freight transport was the group of commodities 3 - Metal ores and other mining and quarrying products, peat, uranium, and thorium. For the period 2010 – 2015, the share of commodities transported of this group ranged from 37.06% to 44.84%, with the average being 40.56% and the coefficient of variation being 0.08. This shows sustainability of the demand and sustainable growth. Another important group of commodities was 9 - Other non-metallic mineral products. It formed a demand for transport of between 9.89% and 16.34%. The average for the period 2010 - 2015 was 12.69% and the coefficient of variation was 0.22. Here, periodicity of the demand can be seen. In the period 2010 – 2012, there was a gradual decline from 16.34% to 10.56%, and then for the period 2013-2015 there was a change from 13.30% to 9.89%. These two groups of commodities formed an average of 53.25% of the demand for freight transport services and 54.73% in 2015.
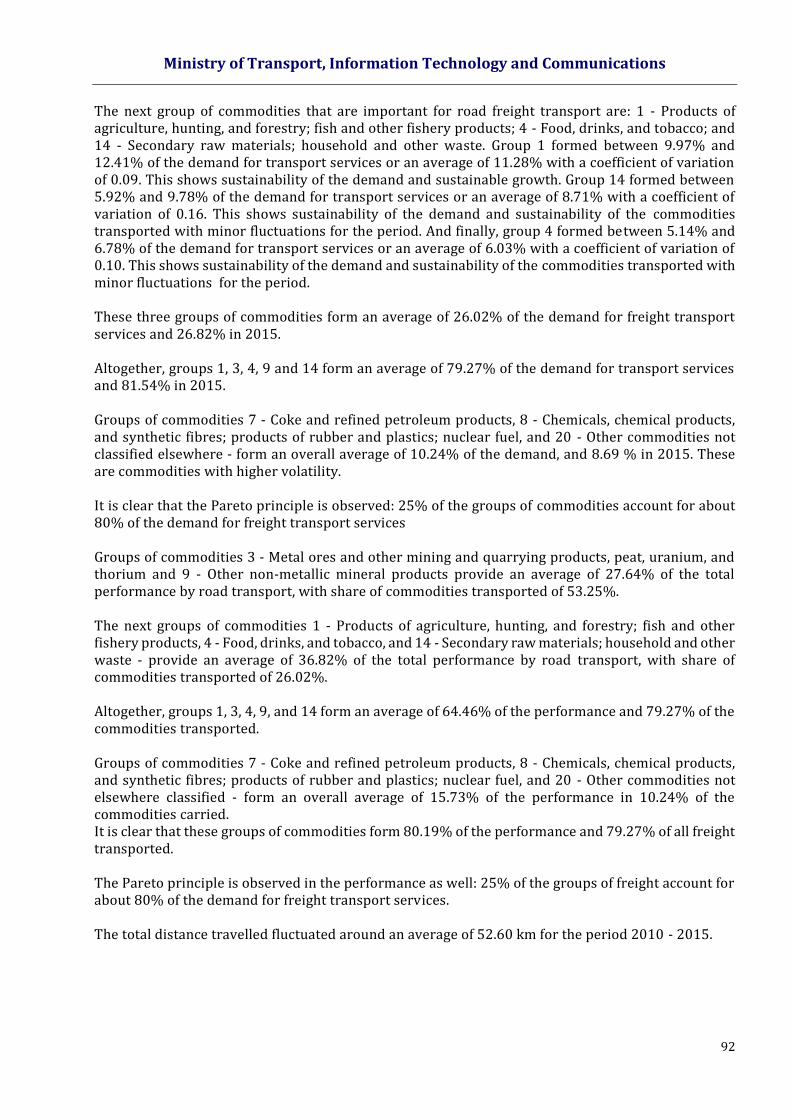
Ministry of Transport, Information Technology and Communications
92
The next group of commodities that are important for road freight transport are: 1 - Products of agriculture, hunting, and forestry; fish and other fishery products; 4 - Food, drinks, and tobacco; and 14 - Secondary raw materials; household and other waste. Group 1 formed between 9.97% and 12.41% of the demand for transport services or an average of 11.28% with a coefficient of variation of 0.09. This shows sustainability of the demand and sustainable growth. Group 14 formed between 5.92% and 9.78% of the demand for transport services or an average of 8.71% with a coefficient of variation of 0.16. This shows sustainability of the demand and sustainability of the commodities transported with minor fluctuations for the period. And finally, group 4 formed between 5.14% and 6.78% of the demand for transport services or an average of 6.03% with a coefficient of variation of 0.10. This shows sustainability of the demand and sustainability of the commodities transported with minor fluctuations for the period.
These three groups of commodities form an average of 26.02% of the demand for freight transport services and 26.82% in 2015. Altogether, groups 1, 3, 4, 9 and 14 form an average of 79.27% of the demand for transport services and 81.54% in 2015.
Groups of commodities 7 - Coke and refined petroleum products, 8 - Chemicals, chemical products, and synthetic fibres; products of rubber and plastics; nuclear fuel, and 20 - Other commodities not classified elsewhere - form an overall average of 10.24% of the demand, and 8.69 % in 2015. These are commodities with higher volatility.
It is clear that the Pareto principle is observed: 25% of the groups of commodities account for about 80% of the demand for freight transport services Groups of commodities 3 - Metal ores and other mining and quarrying products, peat, uranium, and thorium and 9 - Other non-metallic mineral products provide an average of 27.64% of the total performance by road transport, with share of commodities transported of 53.25%. The next groups of commodities 1 - Products of agriculture, hunting, and forestry; fish and other fishery products, 4 - Food, drinks, and tobacco, and 14 - Secondary raw materials; household and other waste - provide an average of 36.82% of the total performance by road transport, with share of commodities transported of 26.02%. Altogether, groups 1, 3, 4, 9, and 14 form an average of 64.46% of the performance and 79.27% of the commodities transported. Groups of commodities 7 - Coke and refined petroleum products, 8 - Chemicals, chemical products, and synthetic fibres; products of rubber and plastics; nuclear fuel, and 20 - Other commodities not elsewhere classified - form an overall average of 15.73% of the performance in 10.24% of the commodities carried. It is clear that these groups of commodities form 80.19% of the performance and 79.27% of all freight transported. The Pareto principle is observed in the performance as well: 25% of the groups of freight account for about 80% of the demand for freight transport services. The total distance travelled fluctuated around an average of 52.60 km for the period 2010 - 2015.

Ministry of Transport, Information Technology and Communications
93
Supply of road freight transport conducted for this project, the origin - destination matrices (PTV Visum) were obtained for 32 count points. Using these matrices, the number of loaded commodities vehicles was calculated by types and by zone of origin (loading). The origin - destination matrices were applied to the road network and the loadings on road sections were calculated. Using the number of loaded vehicles, the supply of transport services by road freight transport was estimated. Four types of freight vehicles were classified: Heavy Goods Vehicles - HGV; Medium Goods Vehicles - MGV; Light Goods Vehicles – LGV, and Trailers. The number and structure of loaded vehicles by types and zones of loading are presented in fig. 4-104.
Figure 4-104 Number and structure of loaded vehicles by types (HGV, MGV, LGV, Trailers) and by zones
of loading
Supply and demand for passenger transport services Trips by private passenger cars Intercity trips by passenger cars are analysed. Urban trips are excluded. Trips by passenger cars can be considered as demand for this type of transport. This mode of transport, in its large part, is for own account, except those for business and paid by the respective companies or organizations. An alternative to these trips are the public transport trips. Based on the counts of traffic transported out each year by the RIA and based on the profile counts conducted for this project, the origin - destination matrices (PTV Visum) were obtained for 32 count points.
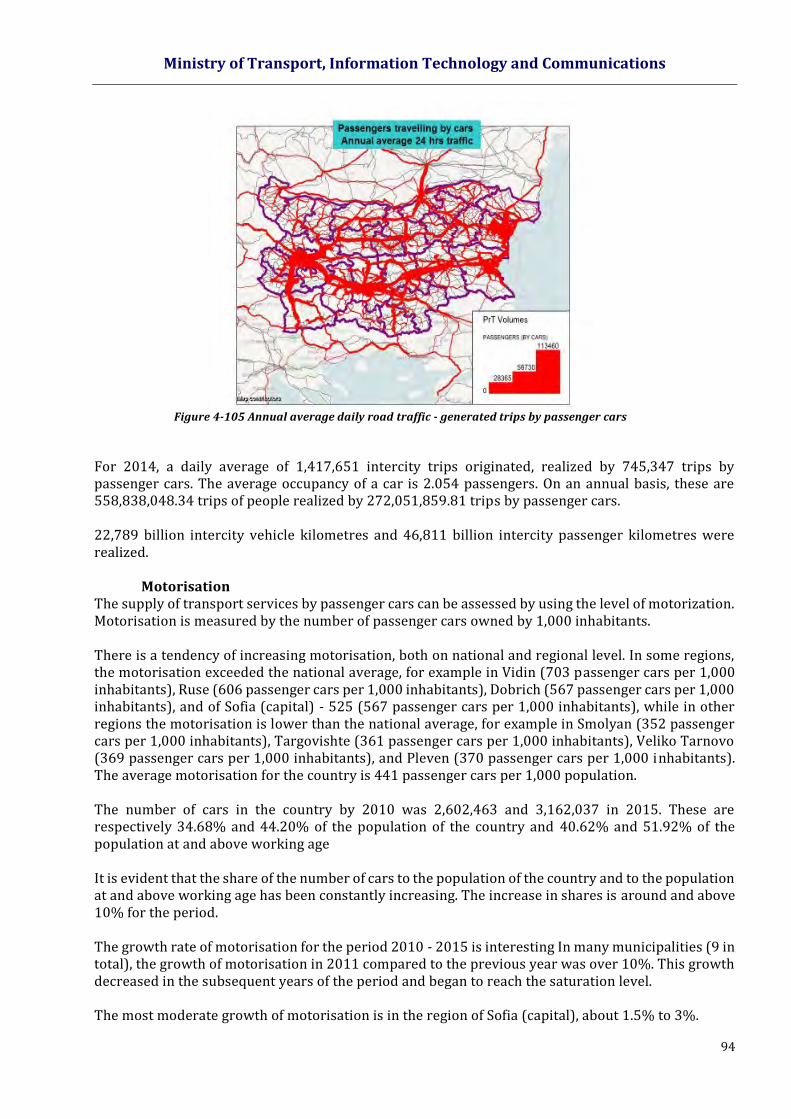
Ministry of Transport, Information Technology and Communications
94
Figure 4-105 Annual average daily road traffic - generated trips by passenger cars
For 2014, a daily average of 1,417,651 intercity trips originated, realized by 745,347 trips by passenger cars. The average occupancy of a car is 2.054 passengers. On an annual basis, these are 558,838,048.34 trips of people realized by 272,051,859.81 trips by passenger cars. 22,789 billion intercity vehicle kilometres and 46,811 billion intercity passenger kilometres were realized.
Motorisation
The supply of transport services by passenger cars can be assessed by using the level of motorization. Motorisation is measured by the number of passenger cars owned by 1,000 inhabitants. Тhere is a tendency of increasing motorisation, both on national and regional level. In some regions, the motorisation exceeded the national average, for example in Vidin (703 passenger cars per 1,000 inhabitants), Ruse (606 passenger cars per 1,000 inhabitants), Dobrich (567 passenger cars per 1,000 inhabitants), and of Sofia (capital) - 525 (567 passenger cars per 1,000 inhabitants), while in other regions the motorisation is lower than the national average, for example in Smolyan (352 passenger cars per 1,000 inhabitants), Targovishte (361 passenger cars per 1,000 inhabitants), Veliko Tarnovo (369 passenger cars per 1,000 inhabitants), and Pleven (370 passenger cars per 1,000 inhabitants). The average motorisation for the country is 441 passenger cars per 1,000 population. The number of cars in the country by 2010 was 2,602,463 and 3,162,037 in 2015. These are respectively 34.68% and 44.20% of the population of the country and 40.62% and 51.92% of the population at and above working age It is evident that the share of the number of cars to the population of the country and to the population at and above working age has been constantly increasing. The increase in shares is around and above 10% for the period. The growth rate of motorisation for the period 2010 - 2015 is interesting In many municipalities (9 in total), the growth of motorisation in 2011 compared to the previous year was over 10%. This growth decreased in the subsequent years of the period and began to reach the saturation level. The most moderate growth of motorisation is in the region of Sofia (capital), about 1.5% to 3%.
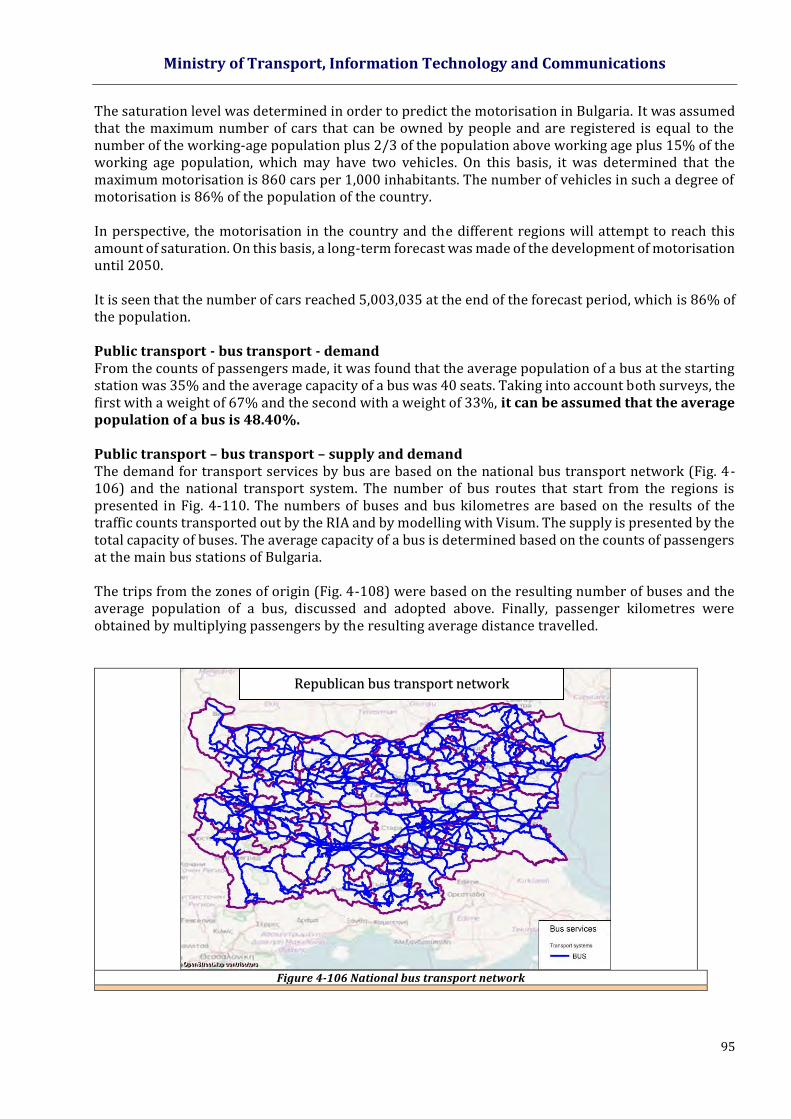
Ministry of Transport, Information Technology and Communications
95
The saturation level was determined in order to predict the motorisation in Bulgaria. It was assumed that the maximum number of cars that can be owned by people and are registered is equal to the number of the working-age population plus 2/3 of the population above working age plus 15% of the working age population, which may have two vehicles. On this basis, it was determined that the maximum motorisation is 860 cars per 1,000 inhabitants. The number of vehicles in such a degree of motorisation is 86% of the population of the country. In perspective, the motorisation in the country and the different regions will attempt to reach this amount of saturation. On this basis, a long-term forecast was made of the development of motorisation until 2050. It is seen that the number of cars reached 5,003,035 at the end of the forecast period, which is 86% of the population.
Public transport - bus transport - demand From the counts of passengers made, it was found that the average population of a bus at the starting station was 35% and the average capacity of a bus was 40 seats. Taking into account both surveys, the first with a weight of 67% and the second with a weight of 33%, it can be assumed that the average population of a bus is 48.40%. Public transport – bus transport – supply and demand The demand for transport services by bus are based on the national bus transport network (Fig. 4-106) and the national transport system. The number of bus routes that start from the regions is presented in Fig. 4-110. The numbers of buses and bus kilometres are based on the results of the traffic counts transported out by the RIA and by modelling with Visum. The supply is presented by the total capacity of buses. The average capacity of a bus is determined based on the counts of passengers at the main bus stations of Bulgaria. The trips from the zones of origin (Fig. 4-108) were based on the resulting number of buses and the average population of a bus, discussed and adopted above. Finally, passenger kilometres were obtained by multiplying passengers by the resulting average distance travelled.
Figure 4-106 National bus transport network
Републиканска автобусна транспортна мрежаRepublican bus transport network
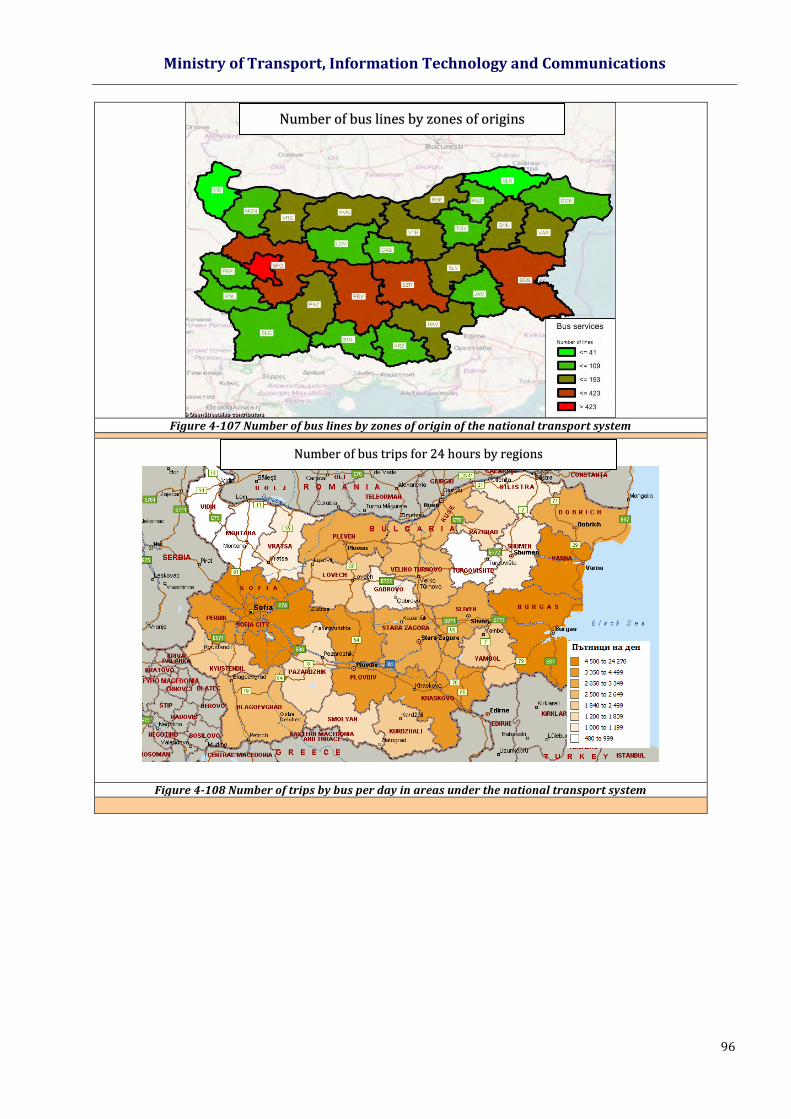
Ministry of Transport, Information Technology and Communications
96
Figure 4-107 Number of bus lines by zones of origin of the national transport system
Figure 4-108 Number of trips by bus per day in areas under the national transport system
Брой автобусни линии по зони на възникване
Брой пътувания с автобуси на денонощие по области
Number of bus lines by zones of origins
Number of bus trips for 24 hours by regions
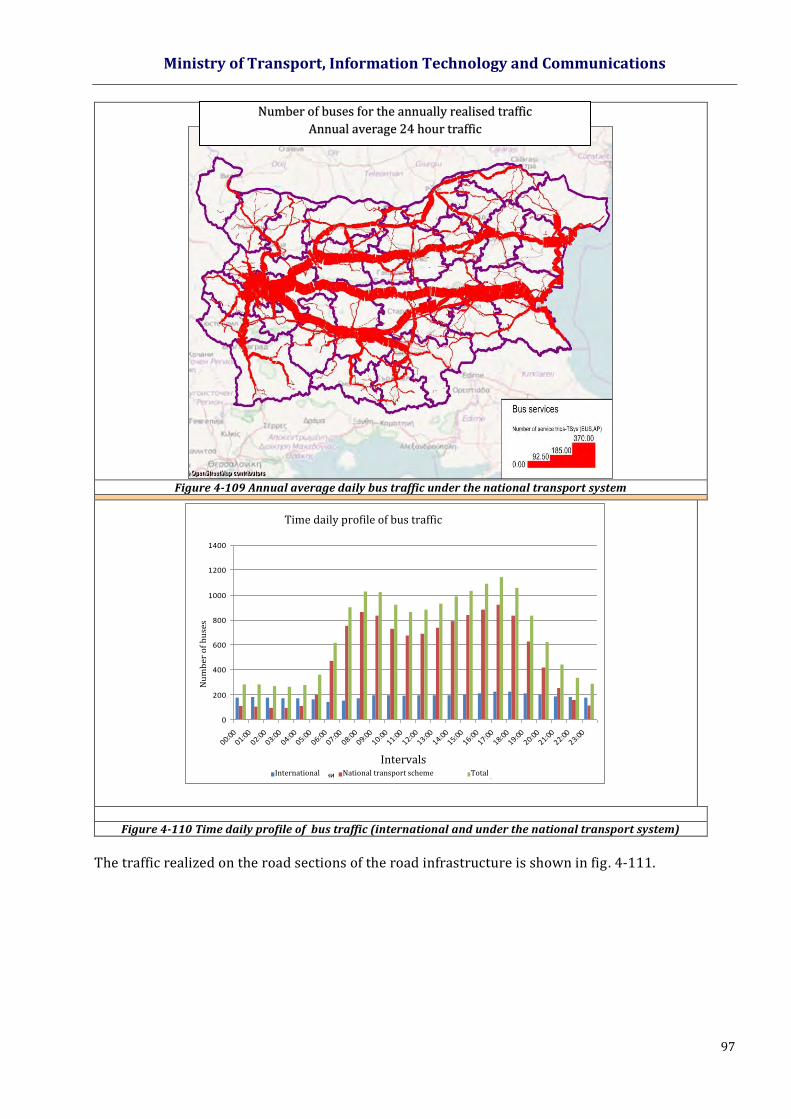
Ministry of Transport, Information Technology and Communications
97
Figure 4-109 Annual average daily bus traffic under the national transport system
Figure 4-110 Time daily profile of bus traffic (international and under the national transport system)
The traffic realized on the road sections of the road infrastructure is shown in fig. 4-111.
Брой автобуси, с които са реализирани пътуванияГодишен средно денонощен трафик
Времеви дневен профил на автобусния трафик
0
200
400
600
800
1000
1200
1400
00:00
01:00
02:00
03:00
04:00
05:00
06:00
07:00
08:00
09:00
10:00
11:00
12:00
13:00
14:00
15:00
16:00
17:00
18:00
19:00
20:00
21:00
22:00
23:00
Интервали
Бр
ой
авт
об
уси
Международни Национална транспортна схема Общо
Number of buses for the annually realised traffic
Annual average 24 hour traffic
Time daily profile of bus traffic
Nu
mb
er o
f b
use
s
Intervals International
National transport scheme
Total
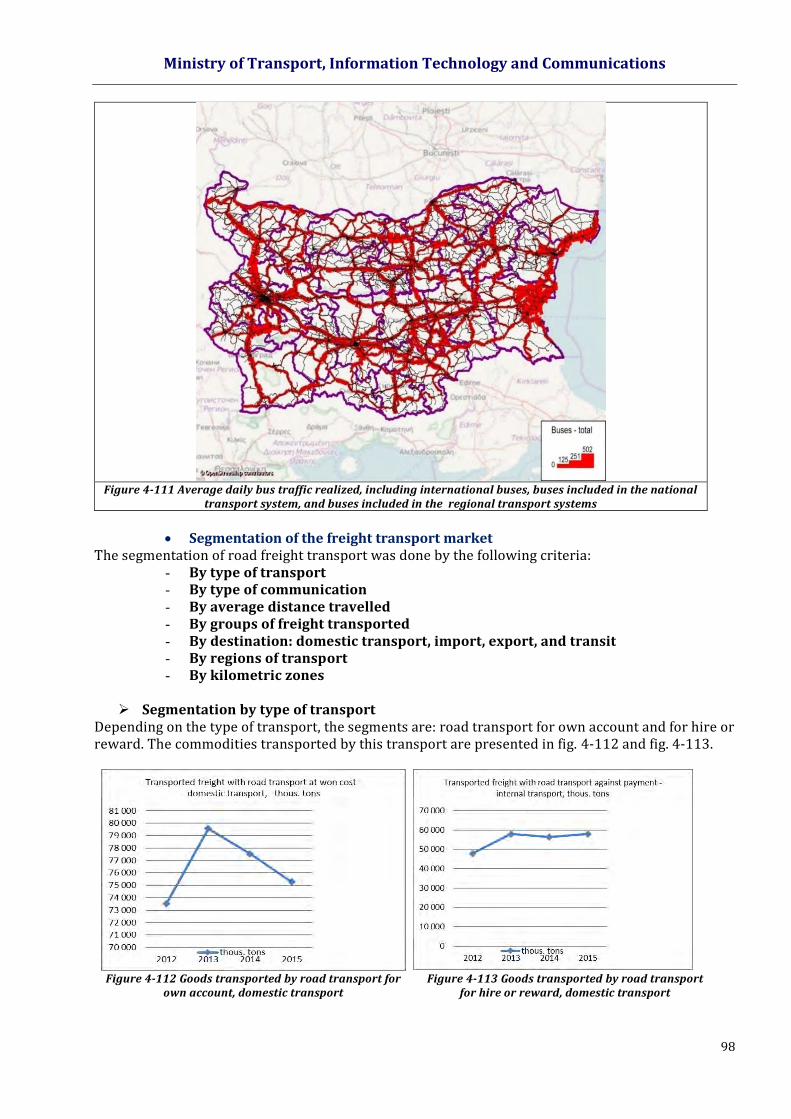
Ministry of Transport, Information Technology and Communications
98
Figure 4-111 Average daily bus traffic realized, including international buses, buses included in the national
transport system, and buses included in the regional transport systems
Segmentation of the freight transport market
The segmentation of road freight transport was done by the following criteria: - By type of transport - By type of communication - By average distance travelled - By groups of freight transported - By destination: domestic transport, import, export, and transit - By regions of transport - By kilometric zones
Segmentation by type of transport Depending on the type of transport, the segments are: road transport for own account and for hire or reward. The commodities transported by this transport are presented in fig. 4-112 and fig. 4-113.
Figure 4-112 Goods transported by road transport for
own account, domestic transport Figure 4-113 Goods transported by road transport
for hire or reward, domestic transport
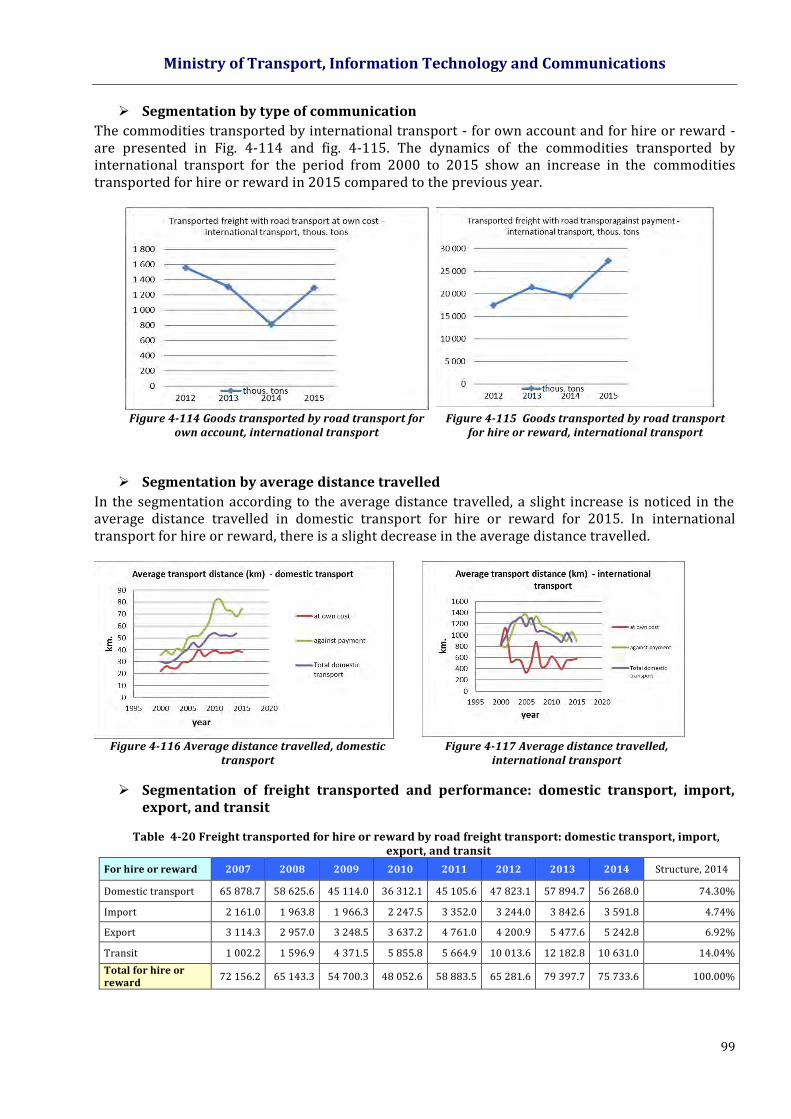
Ministry of Transport, Information Technology and Communications
99
Segmentation by type of communication
The commodities transported by international transport - for own account and for hire or reward - are presented in Fig. 4-114 and fig. 4-115. The dynamics of the commodities transported by international transport for the period from 2000 to 2015 show an increase in the commodities transported for hire or reward in 2015 compared to the previous year.
Figure 4-114 Goods transported by road transport for
own account, international transport Figure 4-115 Goods transported by road transport
for hire or reward, international transport
Segmentation by average distance travelled
In the segmentation according to the average distance travelled, a slight increase is noticed in the average distance travelled in domestic transport for hire or reward for 2015. In international transport for hire or reward, there is a slight decrease in the average distance travelled.
Figure 4-116 Average distance travelled, domestic
transport Figure 4-117 Average distance travelled,
international transport
Segmentation of freight transported and performance: domestic transport, import, export, and transit
Table 4-20 Freight transported for hire or reward by road freight transport: domestic transport, import,
export, and transit
For hire or reward 2007 2008 2009 2010 2011 2012 2013 2014 Structure, 2014
Domestic transport 65 878.7 58 625.6 45 114.0 36 312.1 45 105.6 47 823.1 57 894.7 56 268.0 74.30%
Import 2 161.0 1 963.8 1 966.3 2 247.5 3 352.0 3 244.0 3 842.6 3 591.8 4.74%
Export 3 114.3 2 957.0 3 248.5 3 637.2 4 761.0 4 200.9 5 477.6 5 242.8 6.92%
Transit 1 002.2 1 596.9 4 371.5 5 855.8 5 664.9 10 013.6 12 182.8 10 631.0 14.04%
Total for hire or reward
72 156.2 65 143.3 54 700.3 48 052.6 58 883.5 65 281.6 79 397.7 75 733.6 100.00%

Ministry of Transport, Information Technology and Communications
100
The largest share is that of domestic freight transported for hire or reward for the period 2007 to
2014. For 2014, 74.30% of the transport for hire or reward is domestic, 4.74% is import, 6.92% is
export, and 14.04% is transit.
The largest share is that of domestic freight transported for own account in the period from 2007 to
2014. For 2014, 98.95% of the transport for own account is domestic, 0.33% is imported, 0.67% is
exported, and only 0.05% is transit.
Segmentation by groups of freight transported
The analysis was performed for the transportation of 20 freight groups and is presented in table 4-21.
Table 4-21 Freight transported by road freight transport by types of commodities and by regions (thousand tonnes)
The greatest contribution of commodities transported is that of type 3, with the most tonnes transported in the region of Varna. Other commodities transported in larger volume are: commodities type 8 – again in the region of Varna, commodities type 9 in the regions of Varna and Sofia, commodities type 4 in the regions of Sofia and Plovdiv, and commodities type 1 in the regions of Pleven, Razgrad, and Varna. The following types of commodities are with greatest values of performance indicator, i.e. million tonne-
km: - Type of commodities 1 for the regions of Pleven, Vratsa, and Veliko Tarnovo; - Type of commodities 4 for the regions of Plovdiv, Sofia, and Blagoevgrad; - Type of commodities 3 for the regions of Varna, Haskovo, and Yambol.
Regions1 2 3 4 5 6 7 8 9 10 11 12 13 14 15 16 17 18 19 20
VIDIN 70,8 0 145,5 25,7 0 11,8 5 0 0 0 13,5 0 0 428,3 4 0 0 2,3 0 239,3
VRATSA 620,8 22,1 954 47 13,3 6,7 15,4 0,7 756,6 7,3 84,7 0 3,4 210 81,9 14,2 0 15,4 0 129,7LOVECH 368,1 0 1319,6 104,2 0,4 46,7 0 55,8 321,9 0 45 0 15,5 182,6 0 8,9 0 0 0 89,2MONTANA 781,2 80,9 69,3 48,9 0 0 30,6 0 106,3 21,5 12,9 0 0 206,3 0 10,3 0 1,9 0 604,8PELVEN 1614,6 0 665,9 92,3 0 0 68,4 42,9 486,5 84,4 10,9 0 25,9 306,3 0 0 0 21,8 0 20,4VELIKO TARNOVO 1487,8 37,6 977,1 376,8 2,2 198,9 116,2 36,4 459,5 14,6 66,8 35,6 82,2 215,2 309,2 0 4,5 33,5 1,1 91,2GABROVO 30,8 0 668,1 98 0 31,9 6,4 31,8 399,5 14,1 12,6 0 5,7 88,7 0 1,9 0 0 1,7 371,7RAZGRAD 1236,8 0 882,9 168,6 0 51,5 9,6 16,8 260 5 6,6 0 0 192,2 0 0 0 99,4 0 40,1RUSE 957,7 291,1 1297,6 256,5 0 300,7 139,3 285,5 533,3 2056,7 39,6 0 23 42,9 0 1,3 0 140 19 12,1SILISTRA 578,4 0 305,8 1 0 118,2 10,8 0 219,8 0 0 0 0 71,3 0 1,9 0 0 0 1,4VARNA 1748,9 39,8 8084,5 351,5 34,4 129,9 160,4 4906,9 2381,4 670,3 100,5 8,1 77,5 739,4 16 88,2 298,6 247,6 213 74DOBRICH 907,3 0 1086,6 466,1 0 33,4 201,9 0 130,4 18,6 8,6 0 2,8 55,9 0 4 8,5 0 0 0TARGOVISHTE 590,7 0 1916,2 250,6 0 0 6,9 0 163,5 5,6 44,9 0 0 142,9 0 0 0 403,7 0 0SHUMEN 443,5 1,6 3663,9 87,8 0 82 31 31,7 956,9 53,8 52,2 0 0 38,7 0 5,5 0 134 4,3 0BURGAS 722 80 4967,3 178,5 0 68,9 621,2 38,5 1468,6 954 9,3 8,4 13,5 1753,9 0 62,7 12,3 6,3 38,9 83,8SLIVEN 349,5 0 471,2 131,8 44,5 75,1 11,6 0 255,4 22,7 0 0,2 0 64 0 0,5 0 32,8 0 169,2STARA ZAGORA 726,1 207,8 3823,7 436,5 6,5 939,6 373,6 16 437,5 85,7 38,5 68,2 34,4 222,7 8,7 0 0 13,2 14,2 62,1YAMBOL 244,1 0 1936,7 9,6 5,9 0 0,2 13 203,2 108,2 40,3 0 47,1 5,3 0 0 0 0 0 3,2BLAGOEVGRAD 565 0 1465,2 362,2 0 50,2 134,8 1,1 490,4 36 0,6 0 0 244,2 133,4 56,1 0 13,4 171,4 47,7KJUSTENDIL 31,9 0 1334,5 9,7 0 43,8 0 18,4 38,1 0 9,2 0 0 183,8 0 0 0 0 0 0PERNIK 65,8 274,3 513,5 34,5 0 6,3 3,2 0 296,1 60,9 21,6 0 0 200,6 0 0 0 153 0 20,9SOFIA 297,1 649,4 4954,8 724,6 0 74,3 33,3 54 306,8 169,2 17,4 18,7 0 167,1 0 8,6 0 311,6 0 27,5SOFIA (CITY) 201,6 0 2074,5 2417,1 60,1 638,7 837,2 424,3 1735,5 304,6 237,6 172,8 32 699,5 969,5 111,2 11,3 1068,9 20,5 23,4KARDJALI 52,7 0 934,6 1,4 0 0 0 1,7 350,7 0 8,7 0 0 28 0 3,8 0 0 0 8,7PAZARDJIK 158,2 0 1680,1 355,6 3,3 207,9 9,9 34,6 131,2 19,1 108,8 3,3 15,2 269,4 15,1 0 20,2 33,3 0 33,3PLOVDIV 373,4 40,5 3671,5 1296,6 21,1 133,2 260,2 149,8 684,2 671,8 586,5 0,4 48,5 546,9 24,4 26,8 23,6 134,9 50,1 82,2SMOLYAN 419,5 0 892,1 135,1 9,5 6,8 0 0 188,3 1,2 3,3 0 0 10,1 0 5,7 9 0 43,6 3,2HASKOVO 207,2 0 5329 294,8 3,9 17,6 6,7 190,5 170,4 6,5 0 24,5 13,2 562,5 2,2 24,1 0 0 0 0
TYPE OF FREIGHT
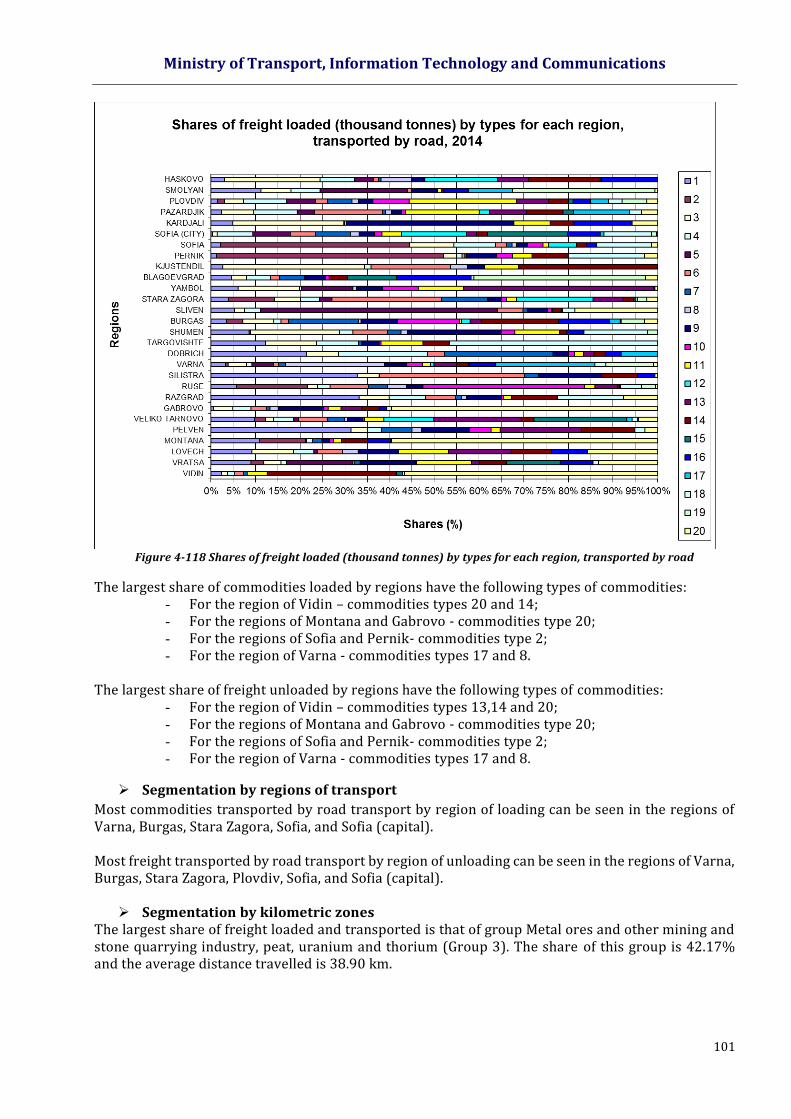
Ministry of Transport, Information Technology and Communications
101
Figure 4-118 Shares of freight loaded (thousand tonnes) by types for each region, transported by road
The largest share of commodities loaded by regions have the following types of commodities: - For the region of Vidin – commodities types 20 and 14; - For the regions of Montana and Gabrovo - commodities type 20; - For the regions of Sofia and Pernik- commodities type 2; - For the region of Varna - commodities types 17 and 8.
The largest share of freight unloaded by regions have the following types of commodities:
- For the region of Vidin – commodities types 13,14 and 20; - For the regions of Montana and Gabrovo - commodities type 20; - For the regions of Sofia and Pernik- commodities type 2; - For the region of Varna - commodities types 17 and 8.
Segmentation by regions of transport
Most commodities transported by road transport by region of loading can be seen in the regions of Varna, Burgas, Stara Zagora, Sofia, and Sofia (capital). Most freight transported by road transport by region of unloading can be seen in the regions of Varna, Burgas, Stara Zagora, Plovdiv, Sofia, and Sofia (capital).
Segmentation by kilometric zones The largest share of freight loaded and transported is that of group Metal ores and other mining and stone quarrying industry, peat, uranium and thorium (Group 3). The share of this group is 42.17% and the average distance travelled is 38.90 km.
Ministry of Transport, Information Technology and Communications
102
Segmentation by type of vehicles
Road freight transport presented by the freight transported in thousand tonnes and the performance in million tonne-km - domestic and international, for hire or reward or for own account - are segmented by types of vehicles depending on their load capacities. The share structure of the so designated segments is also presented. Of the freight transported for own account in domestic transport in 2014, 42.15% of the freight are transported by freight vehicle over 25 tons, 26.85% of the freight are transported by freight vehicle from 17 to 25 tons. Of the freight transported for hire or reward in domestic transport, 53.92% are transported by trailers, 35.20 % of the freight are transported by freight vehicle over 25 tons, 7.66 % of the freight are transported by freight vehicle from 17 to 25 tons. Of the total freight transported in domestic transport, 32.31% of the freight are transported by trailers, 39.21% of the freight are transported by freight vehicle over 25 tons, 18.73 % of the freight are transported by freight vehicle from 17 to 25 tons. Of the freight transported for own account in international transport in 2014, 79.50% of the freight are transported by trailers, 8.61% of the freight are transported by freight vehicle over 25 tons, 2.73% of the freight are transported by freight vehicle from 17 to 25 tons. Of the freight transported for hire or reward in international transport, 92.16% are transported by trailers, 6.66% of the freight is transported by freight vehicle over 25 tons, 0.91% of the freight is transported by freight vehicle from 17 to 25 tons. Of the total freight transported in international transport in 2014, 91.66% of the freight are transported by trailers, 6.73% of the freight are transported by freight vehicle over 25 tons, 0.98% of the freight is transported by freight vehicle from 17 to 25 tons. The structure of the performance by domestic road transport in 2014 for own account and for hire or reward by type of vehicles is as follows:
- Freight vehicle up to 7.5 tons - 1.79%; - Freight vehicle from 7.5 up to 15 tons - 3.04%; - Freight vehicle from 15 up to 17 tons - 1.60%; - Freight vehicle from 17 up to 25 tons - 6.95%; - Freight vehicle over 25 tons - 26.54%; - Trailers - 60.08%;
The structure of the performance by domestic road transport in 2014 for hire or reward by type of vehicles is as follows:
- Freight vehicle up to 7.5 tons -0.31%; - Freight vehicle from 7.5 up to 15 tons - 0.97%; - Freight vehicle from 15 up to 17 tons - 1.04%; - Freight vehicle from 17 up to 25 tons - 3.28%; - Freight vehicle over 25 tons - 19.24%%; - Trailers - 75.17%;
The structure of the performance by international road transport in 2014 for own account and for hire or reward by type of vehicles is as follows:
- Freight vehicle up to 7.5 tons - 0.41%; - Freight vehicle from 7.5 up to 15 tons - 0.15%; - Freight vehicle from 15 up to 17 tons - 0.02%;
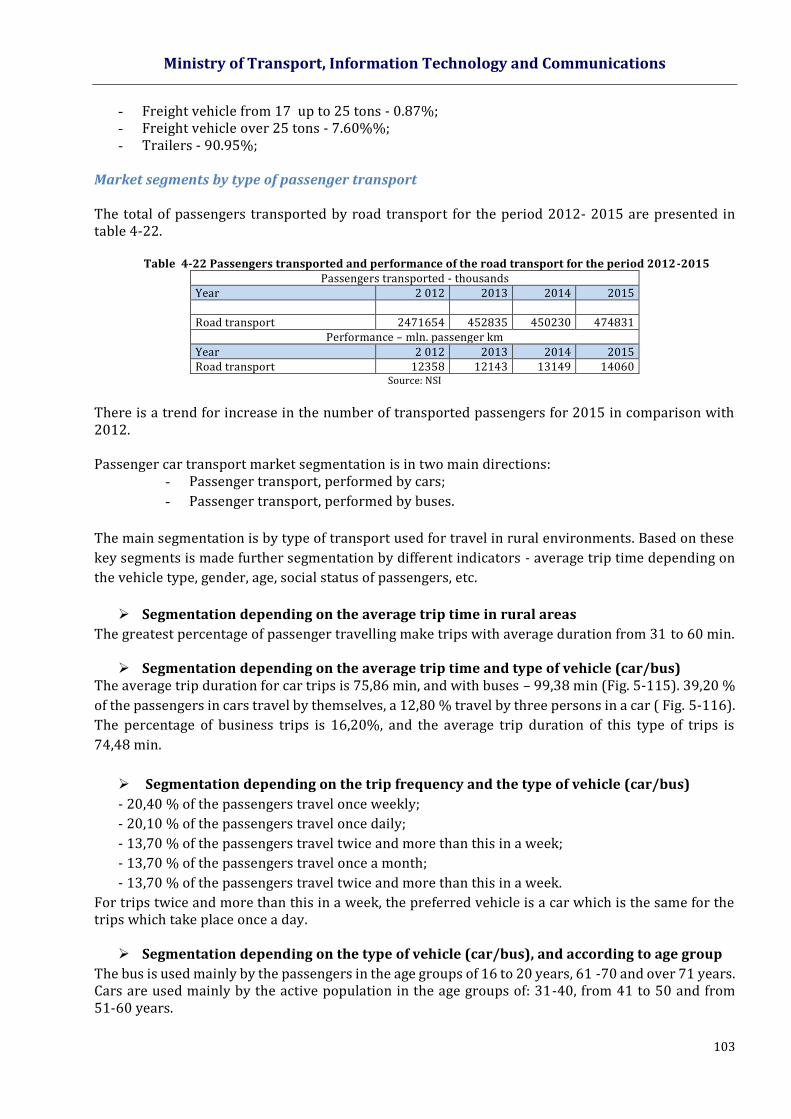
Ministry of Transport, Information Technology and Communications
103
- Freight vehicle from 17 up to 25 tons - 0.87%; - Freight vehicle over 25 tons - 7.60%%; - Trailers - 90.95%;
Market segments by type of passenger transport The total of passengers transported by road transport for the period 2012- 2015 are presented in table 4-22.
Table 4-22 Passengers transported and performance of the road transport for the period 2012-2015 Passengers transported - thousands
Year 2 012 2013 2014 2015 Road transport 2471654 452835 450230 474831
Performance – mln. passenger km Year 2 012 2013 2014 2015 Road transport 12358 12143 13149 14060
Source: NSI
There is a trend for increase in the number of transported passengers for 2015 in comparison with 2012. Passenger car transport market segmentation is in two main directions:
- Passenger transport, performed by cars;
- Passenger transport, performed by buses.
The main segmentation is by type of transport used for travel in rural environments. Based on these
key segments is made further segmentation by different indicators - average trip time depending on
the vehicle type, gender, age, social status of passengers, etc.
Segmentation depending on the average trip time in rural areas
The greatest percentage of passenger travelling make trips with average duration from 31 to 60 min.
Segmentation depending on the average trip time and type of vehicle (car/bus) The average trip duration for car trips is 75,86 min, and with buses – 99,38 min (Fig. 5-115). 39,20 %
of the passengers in cars travel by themselves, а 12,80 % travel by three persons in a car ( Fig. 5-116).
The percentage of business trips is 16,20%, and the average trip duration of this type of trips is
74,48 min.
Segmentation depending on the trip frequency and the type of vehicle (car/bus)
- 20,40 % of the passengers travel once weekly;
- 20,10 % of the passengers travel once daily;
- 13,70 % of the passengers travel twice and more than this in a week;
- 13,70 % of the passengers travel once a month;
- 13,70 % of the passengers travel twice and more than this in a week.
For trips twice and more than this in a week, the preferred vehicle is a car which is the same for the trips which take place once a day.
Segmentation depending on the type of vehicle (car/bus), and according to age group
The bus is used mainly by the passengers in the age groups of 16 to 20 years, 61 -70 and over 71 years. Cars are used mainly by the active population in the age groups of: 31-40, from 41 to 50 and from 51-60 years.
Ministry of Transport, Information Technology and Communications
104
Segmentation depending on the gender of passengers and the type of vehicle (car/bus) The vehicle preferred by men is the car. Greater percentage of women choose to travel by bus than by car.
Segmentation depending on the income of the passengers and type of vehicle (car/bus) The percentage distribution of trips by type of vehicle is as follows: - - for passengers with the highest income (1500-2000 BGN) – 81,20 % - traveling by car, 12,50
% by bus and 6,30% by train; - - for passengers with monthly income from 1000-1500 BGN – 62,00 % traveling by car, 22,80
% by bus and 15,20% by train; - - for passengers with monthly income from 700-1000 BGN – 50,30 % traveling by car, 23,30
% by bus and 26,40 % by train; - - for passengers with monthly income from 500-700 BGN – 50,00 % traveling by car, 17,30 %
by bus and 32,70 % by train; - - for passengers with monthly income from 300-500 BGN – 37,90 % traveling by car, 26,50 %
by bus and 35,60 % by train; - - for passengers with monthly income by 300 BGN – 29,50 % traveling by car, 29,50 % by bus
and 38,90 % by train. The total percentage of this category is not 100, because it has categories of passengers without income (unemployed, university students).
The category of passengers having the highest monthly income travels by cars. Buses are used mostly by passengers with monthly income between 300-500 BGN and under 300 BGN.
Segmentation depending on the employment status of the passengers and the type of vehicle (car/bus)
The percentage distribution of trips by car depending on the employment status of the passengers is as follows:
- Employed with permanent contract - 50,10% - Employed with temporary labour contract or civil contract -41,90% - Pupils / Students - 17,10% - Unemployed - 54,70% - Non-working retired persons -28,40% - Working retired persons -41,00% - Housewives -70,40% - Self-employed - 75,00%
The percentage distribution of trips by bus depending on the employment status of the passengers is as follows:
- Employed with permanent contract -22,90% - Employed with temporary labour contract or civil contract -25,75% - Pupils / Students – 26,70 % - Unemployed – 25,30 % - Non-working retired persons -26,20 % - Working retired persons -15,40 %
Buses are used by most of the following categories of passengers: pupils/students, non-working pensioners and persons employed on temporary contracts. Cars are used mainly by the self-employed, housewives and the persons employed on a permanent employment contract.
Segmentation depending on the degree of education of the passengers and the type of vehicle (car/bus)
The percentage distribution of trips by car depending on the degree of education of the passengers is as follows:
- Higher education - 49,70% - Secondary school education - 34,00%
Ministry of Transport, Information Technology and Communications
105
- Secondary school vocational education – 56,50% - Primary school education – 33,60%.
The percentage distribution of trips by bus depending on the degree of education of the passengers is as follows:
- Higher education -23,10% - Secondary school education -33,00% - Primary school education – 26,40%.
The greater percentage of persons traveling by buses, have secondary school education, and the persons having secondary vocations and higher education use cars. (fig. 5-123). Conclusions:
For the highest percentage of the passengers (32,60 %) the average duration of trips in rural areas is between 31 and 60 minutes, which is barely 1,50 % making trips with duration longer than 480 minutes;
Trips made by bus have an average duration from 99,38 minutes, and those by car – 75,86 minutes.;
The greater percentage of men travel by cars, while the greater percentage of trips made by buses are made by women;
Persons with the highest income travel by cars. Persons having monthly income between 300 and 500 BGN travel by bus and these with income under 300 BGN;
Most of the self-employed and the housewives travel by car, and the pupils/students and those employed on temporary labour contract travel by bus;
Most of the persons with secondary vocational school and higher education travel by cars, while the persons with secondary school travel by bus.
Competitive structure of the transport market Access to the transport market of the road transport is fully liberalized. Any operator who meets the conditions described for the obtainment of a License to perform transport activity has equal access to the market. This is confirmed by the large number of carriers that are licensed to perform passenger and cargo transport.
Internal license for passenger transport as of 25/01/2016 was granted to 551 nos. of carriers from different regions of Bulgaria.
Community license for passenger transport as of 25/01/2016 was granted to 1027 nos. of carriers from different regions of Bulgaria.
Internal license for freight transport as of 25.1.2016 was granted to 4128 nos. of carriers from different regions of Bulgaria.
Community license for freight transport as of 25/01/2016 was granted to 11 279 nos. of carriers from different regions of Bulgaria.
4.4.3 ROAD INFRASTRUCTURE
NRN LENGTH The NRN total length as of 31.12.2015 was 19,853 km. In Table 4-23 data on the NRN distribution by
road classes is presented.
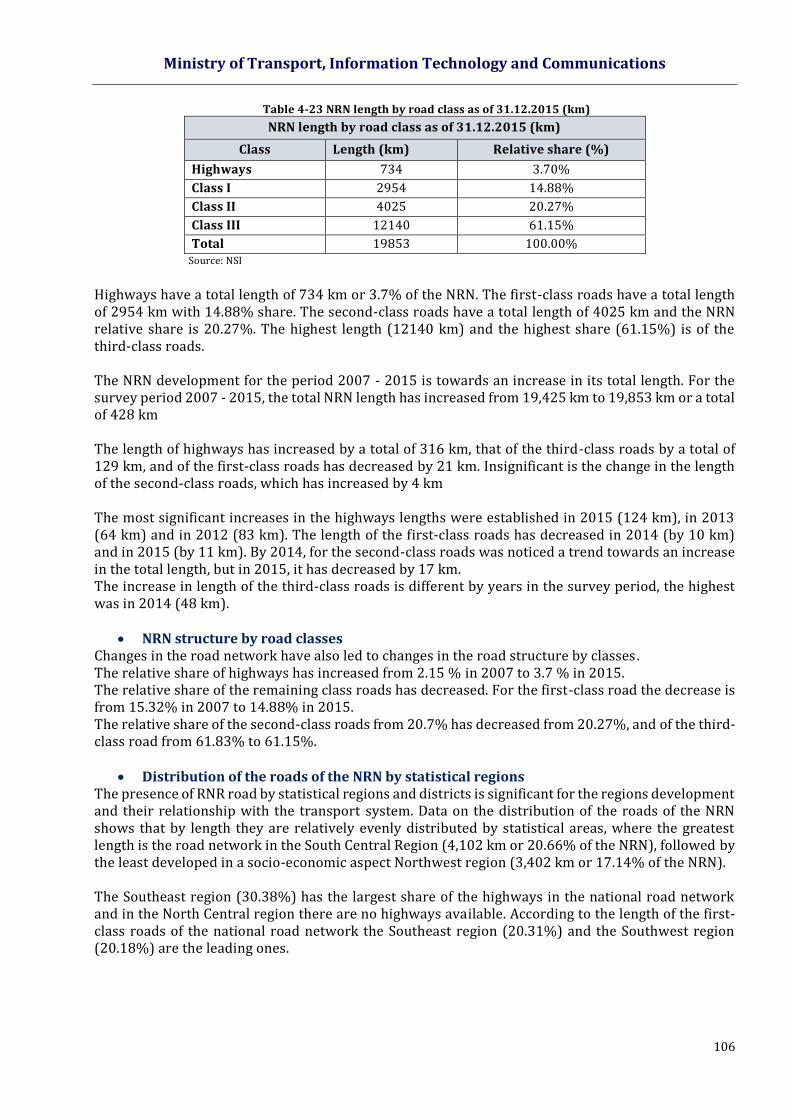
Ministry of Transport, Information Technology and Communications
106
Table 4-23 NRN length by road class as of 31.12.2015 (km)
NRN length by road class as of 31.12.2015 (km)
Class Length (km) Relative share (%)
Highways 734 3.70%
Class I 2954 14.88%
Class II 4025 20.27%
Class III 12140 61.15%
Total 19853 100.00% Source: NSI
Highways have a total length of 734 km or 3.7% of the NRN. The first-class roads have a total length of 2954 km with 14.88% share. The second-class roads have a total length of 4025 km and the NRN relative share is 20.27%. The highest length (12140 km) and the highest share (61.15%) is of the third-class roads. The NRN development for the period 2007 - 2015 is towards an increase in its total length. For the survey period 2007 - 2015, the total NRN length has increased from 19,425 km to 19,853 km or a total of 428 km The length of highways has increased by a total of 316 km, that of the third-class roads by a total of 129 km, and of the first-class roads has decreased by 21 km. Insignificant is the change in the length of the second-class roads, which has increased by 4 km
The most significant increases in the highways lengths were established in 2015 (124 km), in 2013 (64 km) and in 2012 (83 km). The length of the first-class roads has decreased in 2014 (by 10 km) and in 2015 (by 11 km). By 2014, for the second-class roads was noticed a trend towards an increase in the total length, but in 2015, it has decreased by 17 km. The increase in length of the third-class roads is different by years in the survey period, the highest was in 2014 (48 km).
NRN structure by road classes
Changes in the road network have also led to changes in the road structure by classes. The relative share of highways has increased from 2.15 % in 2007 to 3.7 % in 2015. The relative share of the remaining class roads has decreased. For the first-class road the decrease is from 15.32% in 2007 to 14.88% in 2015. The relative share of the second-class roads from 20.7% has decreased from 20.27%, and of the third-class road from 61.83% to 61.15%.
Distribution of the roads of the NRN by statistical regions The presence of RNR road by statistical regions and districts is significant for the regions development and their relationship with the transport system. Data on the distribution of the roads of the NRN shows that by length they are relatively evenly distributed by statistical areas, where the greatest length is the road network in the South Central Region (4,102 km or 20.66% of the NRN), followed by the least developed in a socio-economic aspect Northwest region (3,402 km or 17.14% of the NRN). The Southeast region (30.38%) has the largest share of the highways in the national road network and in the North Central region there are no highways available. According to the length of the first-class roads of the national road network the Southeast region (20.31%) and the Southwest region (20.18%) are the leading ones.
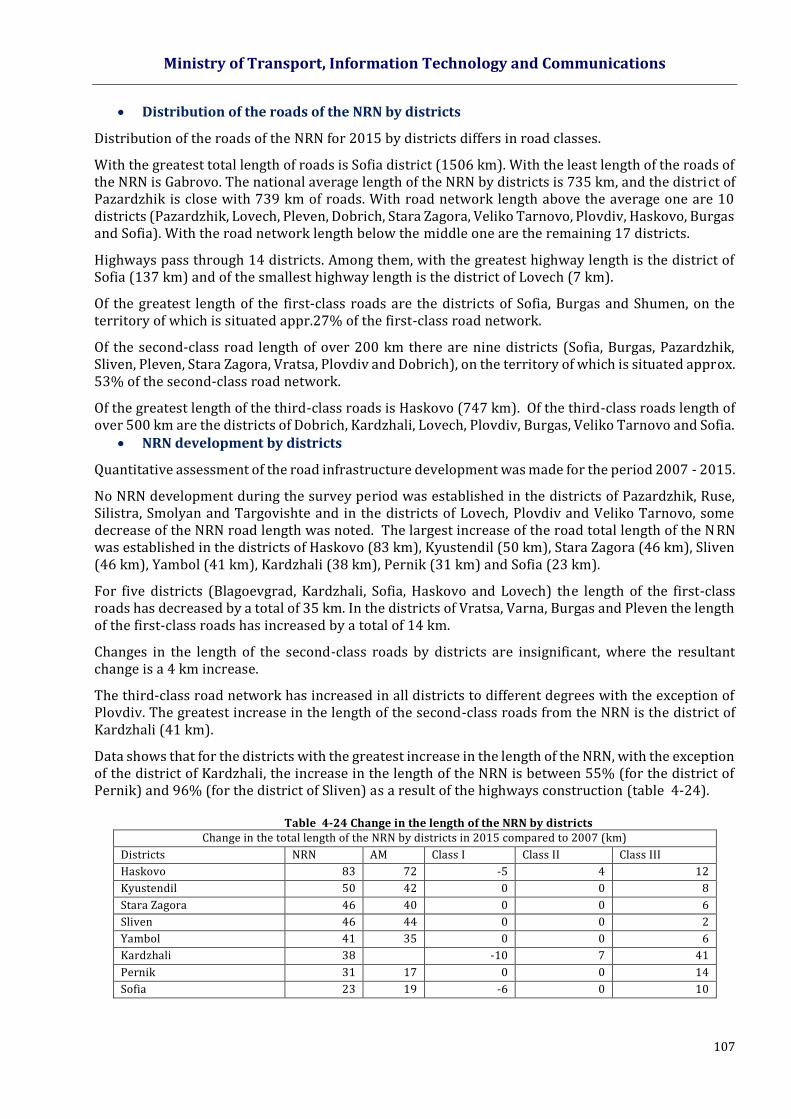
Ministry of Transport, Information Technology and Communications
107
Distribution of the roads of the NRN by districts
Distribution of the roads of the NRN for 2015 by districts differs in road classes.
With the greatest total length of roads is Sofia district (1506 km). With the least length of the roads of the NRN is Gabrovo. The national average length of the NRN by districts is 735 km, and the district of Pazardzhik is close with 739 km of roads. With road network length above the average one are 10 districts (Pazardzhik, Lovech, Pleven, Dobrich, Stara Zagora, Veliko Tarnovo, Plovdiv, Haskovo, Burgas and Sofia). With the road network length below the middle one are the remaining 17 districts.
Highways pass through 14 districts. Among them, with the greatest highway length is the district of Sofia (137 km) and of the smallest highway length is the district of Lovech (7 km).
Of the greatest length of the first-class roads are the districts of Sofia, Burgas and Shumen, on the territory of which is situated appr.27% of the first-class road network.
Of the second-class road length of over 200 km there are nine districts (Sofia, Burgas, Pazardzhik, Sliven, Pleven, Stara Zagora, Vratsa, Plovdiv and Dobrich), on the territory of which is situated approx. 53% of the second-class road network.
Of the greatest length of the third-class roads is Haskovo (747 km). Of the third-class roads length of over 500 km are the districts of Dobrich, Kardzhali, Lovech, Plovdiv, Burgas, Veliko Tarnovo and Sofia.
NRN development by districts
Quantitative assessment of the road infrastructure development was made for the period 2007 - 2015.
No NRN development during the survey period was established in the districts of Pazardzhik, Ruse, Silistra, Smolyan and Targovishte and in the districts of Lovech, Plovdiv and Veliko Tarnovo, some decrease of the NRN road length was noted. The largest increase of the road total length of the NRN was established in the districts of Haskovo (83 km), Kyustendil (50 km), Stara Zagora (46 km), Sliven (46 km), Yambol (41 km), Kardzhali (38 km), Pernik (31 km) and Sofia (23 km).
For five districts (Blagoevgrad, Kardzhali, Sofia, Haskovo and Lovech) the length of the first-class roads has decreased by a total of 35 km. In the districts of Vratsa, Varna, Burgas and Pleven the length of the first-class roads has increased by a total of 14 km.
Changes in the length of the second-class roads by districts are insignificant, where the resultant change is a 4 km increase.
The third-class road network has increased in all districts to different degrees with the exception of Plovdiv. The greatest increase in the length of the second-class roads from the NRN is the district of Kardzhali (41 km).
Data shows that for the districts with the greatest increase in the length of the NRN, with the exception of the district of Kardzhali, the increase in the length of the NRN is between 55% (for the district of Pernik) and 96% (for the district of Sliven) as a result of the highways construction (table 4-24).
Table 4-24 Change in the length of the NRN by districts Change in the total length of the NRN by districts in 2015 compared to 2007 (km)
Districts NRN АМ Class I Class II Class III
Haskovo 83 72 -5 4 12
Kyustendil 50 42 0 0 8
Stara Zagora 46 40 0 0 6
Sliven 46 44 0 0 2
Yambol 41 35 0 0 6
Kardzhali 38 -10 7 41
Pernik 31 17 0 0 14
Sofia 23 19 -6 0 10
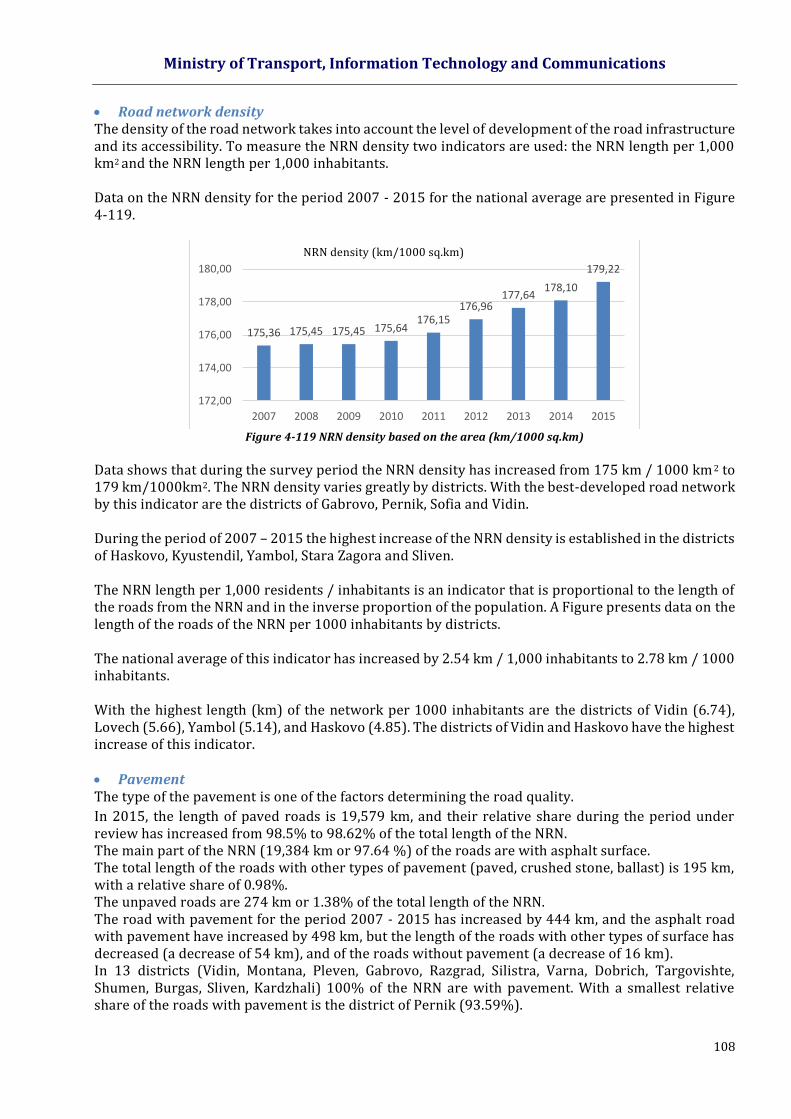
Ministry of Transport, Information Technology and Communications
108
Road network density The density of the road network takes into account the level of development of the road infrastructure and its accessibility. To measure the NRN density two indicators are used: the NRN length per 1,000 km2 and the NRN length per 1,000 inhabitants. Data on the NRN density for the period 2007 - 2015 for the national average are presented in Figure 4-119.
Figure 4-119 NRN density based on the area (km/1000 sq.km)
Data shows that during the survey period the NRN density has increased from 175 km / 1000 km 2 to 179 km/1000km2. The NRN density varies greatly by districts. With the best-developed road network by this indicator are the districts of Gabrovo, Pernik, Sofia and Vidin. During the period of 2007 – 2015 the highest increase of the NRN density is established in the districts of Haskovo, Kyustendil, Yambol, Stara Zagora and Sliven. The NRN length per 1,000 residents / inhabitants is an indicator that is proportional to the length of the roads from the NRN and in the inverse proportion of the population. A Figure presents data on the length of the roads of the NRN per 1000 inhabitants by districts. The national average of this indicator has increased by 2.54 km / 1,000 inhabitants to 2.78 km / 1000 inhabitants. With the highest length (km) of the network per 1000 inhabitants are the districts of Vidin (6.74), Lovech (5.66), Yambol (5.14), and Haskovo (4.85). The districts of Vidin and Haskovo have the highest increase of this indicator.
Pavement The type of the pavement is one of the factors determining the road quality.
In 2015, the length of paved roads is 19,579 km, and their relative share during the period under review has increased from 98.5% to 98.62% of the total length of the NRN. The main part of the NRN (19,384 km or 97.64 %) of the roads are with asphalt surface. The total length of the roads with other types of pavement (paved, crushed stone, ballast) is 195 km, with a relative share of 0.98%. The unpaved roads are 274 km or 1.38% of the total length of the NRN. The road with pavement for the period 2007 - 2015 has increased by 444 km, and the asphalt road with pavement have increased by 498 km, but the length of the roads with other types of surface has decreased (a decrease of 54 km), and of the roads without pavement (a decrease of 16 km). In 13 districts (Vidin, Montana, Pleven, Gabrovo, Razgrad, Silistra, Varna, Dobrich, Targovishte, Shumen, Burgas, Sliven, Kardzhali) 100% of the NRN are with pavement. With a smallest relative share of the roads with pavement is the district of Pernik (93.59%).
175,36 175,45 175,45 175,64176,15
176,96177,64
178,10
179,22
172,00
174,00
176,00
178,00
180,00
2007 2008 2009 2010 2011 2012 2013 2014 2015
Гъстота на РПМ (км/1000 кв.км)NRN density (km/1000 sq.km)
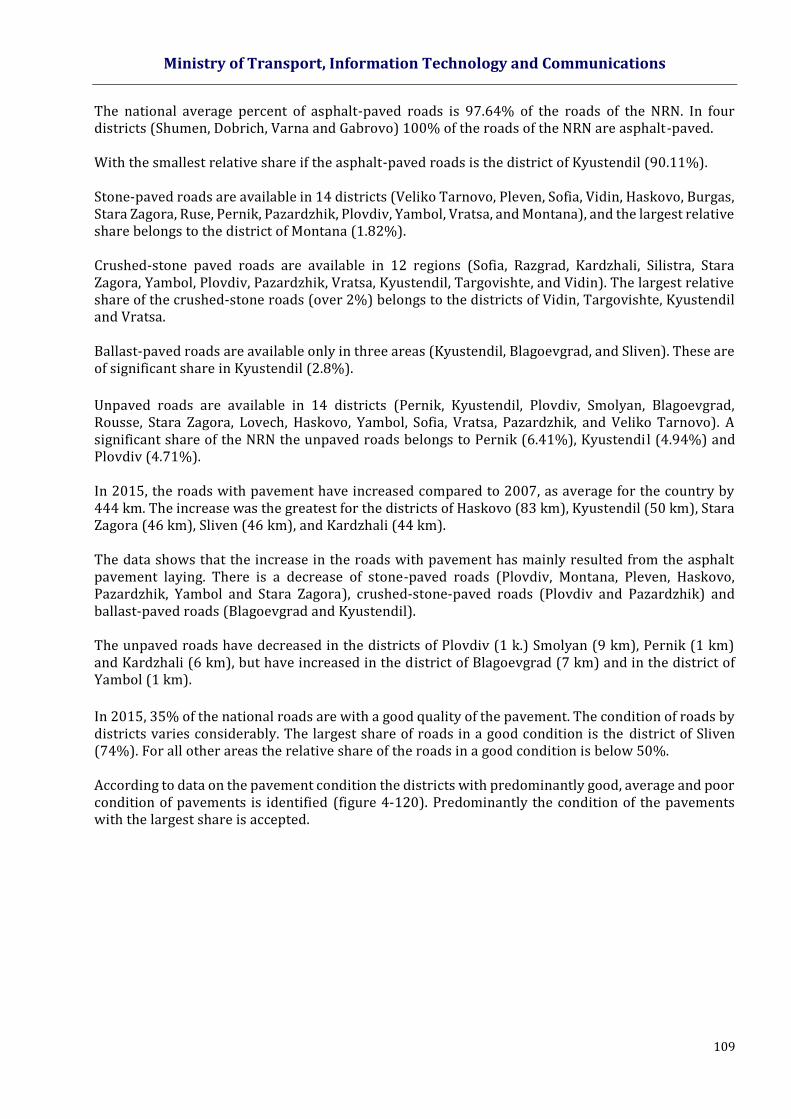
Ministry of Transport, Information Technology and Communications
109
The national average percent of asphalt-paved roads is 97.64% of the roads of the NRN. In four districts (Shumen, Dobrich, Varna and Gabrovo) 100% of the roads of the NRN are asphalt-paved. With the smallest relative share if the asphalt-paved roads is the district of Kyustendil (90.11%). Stone-paved roads are available in 14 districts (Veliko Tarnovo, Pleven, Sofia, Vidin, Haskovo, Burgas, Stara Zagora, Ruse, Pernik, Pazardzhik, Plovdiv, Yambol, Vratsa, and Montana), and the largest relative share belongs to the district of Montana (1.82%). Crushed-stone paved roads are available in 12 regions (Sofia, Razgrad, Kardzhali, Silistra, Stara Zagora, Yambol, Plovdiv, Pazardzhik, Vratsa, Kyustendil, Targovishte, and Vidin). The largest relative share of the crushed-stone roads (over 2%) belongs to the districts of Vidin, Targovishte, Kyustendil and Vratsa. Ballast-paved roads are available only in three areas (Kyustendil, Blagoevgrad, and Sliven). These are of significant share in Kyustendil (2.8%).
Unpaved roads are available in 14 districts (Pernik, Kyustendil, Plovdiv, Smolyan, Blagoevgrad, Rousse, Stara Zagora, Lovech, Haskovo, Yambol, Sofia, Vratsa, Pazardzhik, and Veliko Tarnovo). A significant share of the NRN the unpaved roads belongs to Pernik (6.41%), Kyustendil (4.94%) and Plovdiv (4.71%). In 2015, the roads with pavement have increased compared to 2007, as average for the country by 444 km. The increase was the greatest for the districts of Haskovo (83 km), Kyustendil (50 km), Stara Zagora (46 km), Sliven (46 km), and Kardzhali (44 km). The data shows that the increase in the roads with pavement has mainly resulted from the asphalt pavement laying. There is a decrease of stone-paved roads (Plovdiv, Montana, Pleven, Haskovo, Pazardzhik, Yambol and Stara Zagora), crushed-stone-paved roads (Plovdiv and Pazardzhik) and ballast-paved roads (Blagoevgrad and Kyustendil). The unpaved roads have decreased in the districts of Plovdiv (1 k.) Smolyan (9 km), Pernik (1 km) and Kardzhali (6 km), but have increased in the district of Blagoevgrad (7 km) and in the district of Yambol (1 km).
In 2015, 35% of the national roads are with a good quality of the pavement. The condition of roads by districts varies considerably. The largest share of roads in a good condition is the district of Sliven (74%). For all other areas the relative share of the roads in a good condition is below 50%. According to data on the pavement condition the districts with predominantly good, average and poor condition of pavements is identified (figure 4-120). Predominantly the condition of the pavements with the largest share is accepted.
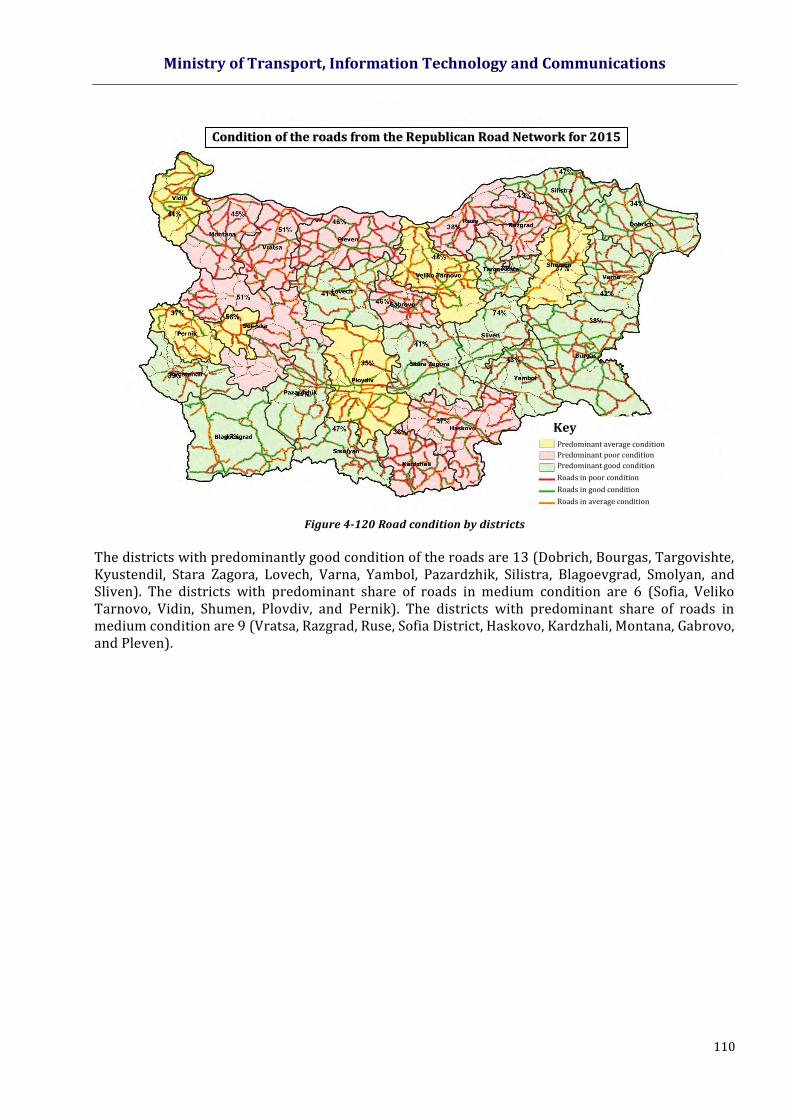
Ministry of Transport, Information Technology and Communications
110
Figure 4-120 Road condition by districts
The districts with predominantly good condition of the roads are 13 (Dobrich, Bourgas, Targovishte, Kyustendil, Stara Zagora, Lovech, Varna, Yambol, Pazardzhik, Silistra, Blagoevgrad, Smolyan, and Sliven). The districts with predominant share of roads in medium condition are 6 (Sofia, Veliko Tarnovo, Vidin, Shumen, Plovdiv, and Pernik). The districts with predominant share of roads in medium condition are 9 (Vratsa, Razgrad, Ruse, Sofia District, Haskovo, Kardzhali, Montana, Gabrovo, and Pleven).
Condition of the roads from the Republican Road Network for 2015
Key Predominant average condition
Predominant poor condition
Predominant good condition
Roads in poor condition
Roads in good condition
Roads in average condition
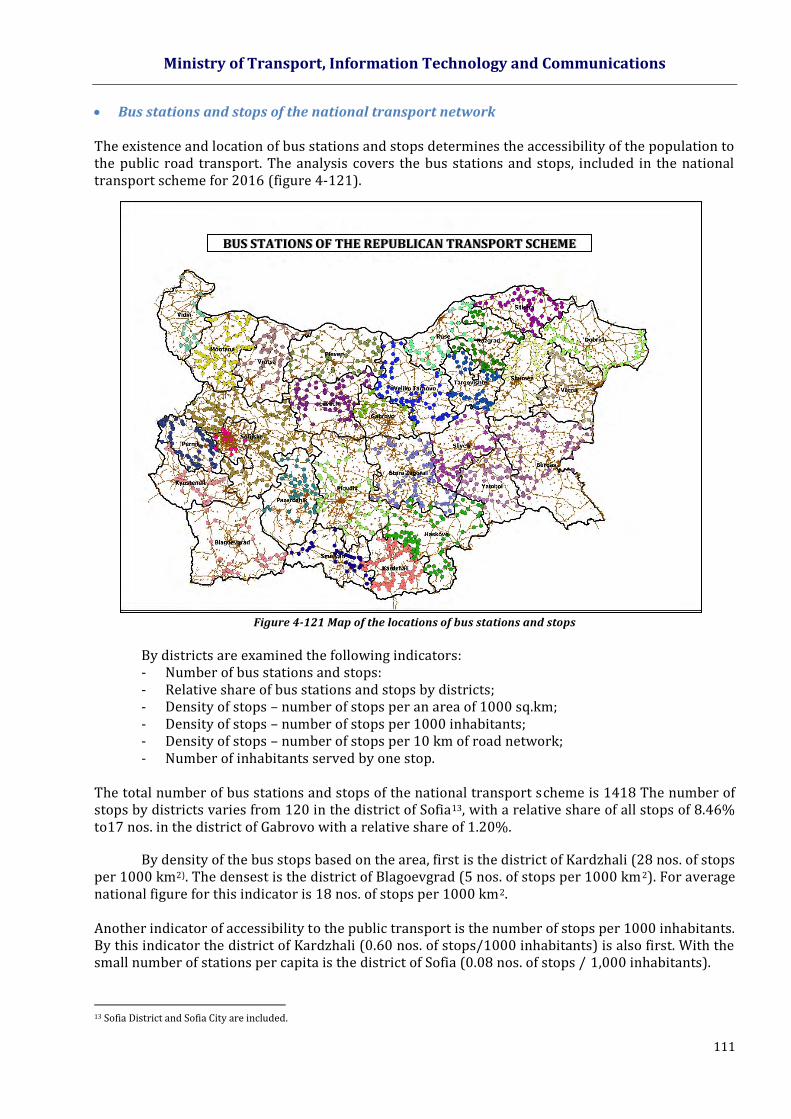
Ministry of Transport, Information Technology and Communications
111
Bus stations and stops of the national transport network The existence and location of bus stations and stops determines the accessibility of the population to the public road transport. The analysis covers the bus stations and stops, included in the national transport scheme for 2016 (figure 4-121).
Figure 4-121 Map of the locations of bus stations and stops
By districts are examined the following indicators: - Number of bus stations and stops: - Relative share of bus stations and stops by districts; - Density of stops – number of stops per an area of 1000 sq.km; - Density of stops – number of stops per 1000 inhabitants; - Density of stops – number of stops per 10 km of road network; - Number of inhabitants served by one stop.
The total number of bus stations and stops of the national transport scheme is 1418 The number of stops by districts varies from 120 in the district of Sofia13, with a relative share of all stops of 8.46% to17 nos. in the district of Gabrovo with a relative share of 1.20%.
By density of the bus stops based on the area, first is the district of Kardzhali (28 nos. of stops per 1000 km2). The densest is the district of Blagoevgrad (5 nos. of stops per 1000 km2). For average national figure for this indicator is 18 nos. of stops per 1000 km2.
Another indicator of accessibility to the public transport is the number of stops per 1000 inhabitants. By this indicator the district of Kardzhali (0.60 nos. of stops/1000 inhabitants) is also first. With the small number of stations per capita is the district of Sofia (0.08 nos. of stops / 1,000 inhabitants).
13 Sofia District and Sofia City are included.
BUS STATIONS OF THE REPUBLICAN TRANSPORT SCHEME
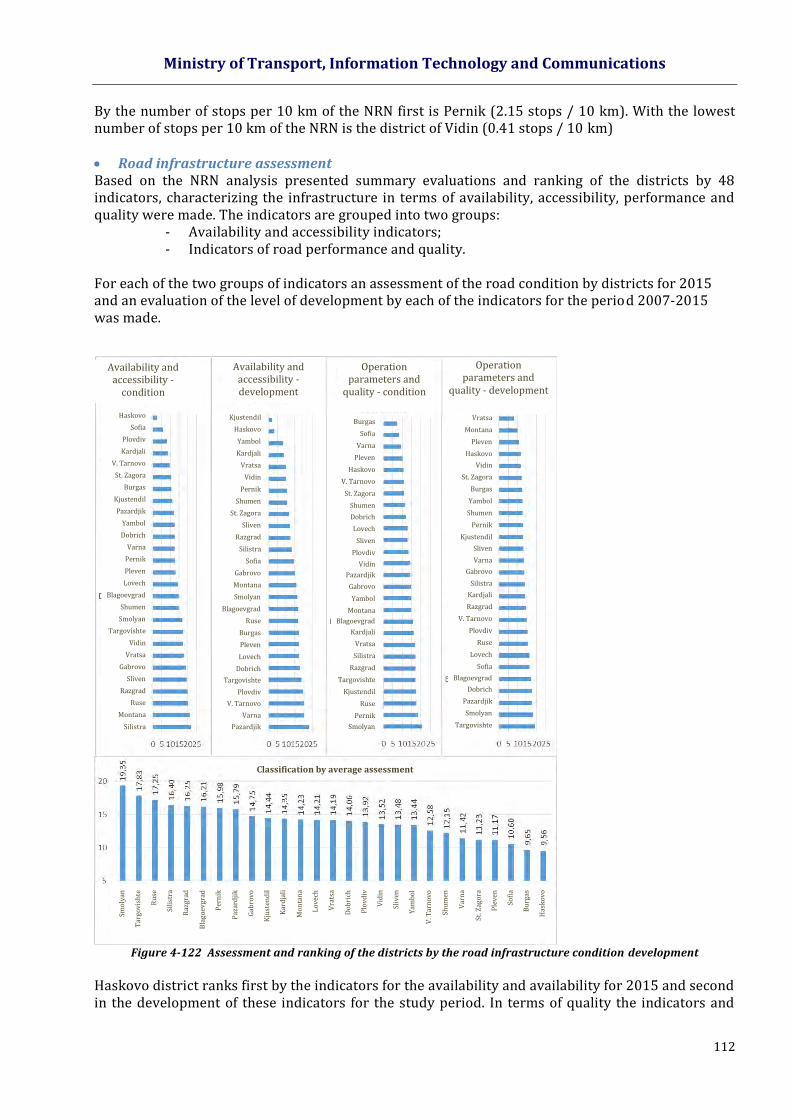
Ministry of Transport, Information Technology and Communications
112
By the number of stops per 10 km of the NRN first is Pernik (2.15 stops / 10 km). With the lowest number of stops per 10 km of the NRN is the district of Vidin (0.41 stops / 10 km)
Road infrastructure assessment Based on the NRN analysis presented summary evaluations and ranking of the districts by 48 indicators, characterizing the infrastructure in terms of availability, accessibility, performance and quality were made. The indicators are grouped into two groups:
- Availability and accessibility indicators; - Indicators of road performance and quality.
For each of the two groups of indicators an assessment of the road condition by districts for 2015 and an evaluation of the level of development by each of the indicators for the period 2007-2015 was made.
Figure 4-122 Assessment and ranking of the districts by the road infrastructure condition development
Haskovo district ranks first by the indicators for the availability and availability for 2015 and second in the development of these indicators for the study period. In terms of quality the indicators and
Availability and accessibility -
condition
Availability and accessibility -
condition
Availability and accessibility - development
Operation parameters and
quality - condition
Operation parameters and
quality - development
Haskovo
Sofia
Plovdiv
Kardjali
V. Tarnovo
St. Zagora
Burgas
Kjustendil
Pazardjik
Yambol
Dobrich
Varna
Pernik
Pleven
Lovech
Blagoevgrad
Shumen
Smolyan
Targovishte
Vidin
Vratsa
Gabrovo
Sliven
Razgrad
Ruse
Montana
Silistra
Kjustendil
Haskovo
Yambol
Kardjali
Vratsa
Vidin
Pernik
Shumen
St. Zagora
Sliven
Razgrad
Silistra
Sofia
Gabrovo
Montana
Smolyan
Blagoevgrad
Ruse
Burgas
Pleven
Lovech
Dobrich
Targovishte
Plovdiv
V. Tarnovo
Varna
Pazardjik
Burgas
Sofia
Varna
Pleven
Haskovo
V. Tarnovo
St. Zagora
Shumen
Dobrich
Lovech
Sliven
Plovdiv
Vidin
Pazardjik
Gabrovo
Yambol
Montana
Blagoevgrad
Kardjali
Vratsa
Silistra
Razgrad
Targovishte
Kjustendil
Ruse
Pernik
Smolyan
Vratsa
Montana
Pleven
Haskovo
Vidin
St. Zagora
Burgas
Yambol
Shumen
Pernik
Kjustendil
Sliven
Varna
Gabrovo
Silistra
Kardjali
Razgrad
V. Tarnovo
Plovdiv
Ruse
Lovech
Sofia
Blagoevgrad
Dobrich
Pazardjik
Smolyan
Targovishte
Classification by average assessment
Smo
lyan
Tar
govi
shte
Ru
se
Sili
stra
Raz
gra
d
Bla
goev
grad
Per
nik
Paz
ard
jik
Gab
rovo
Kju
sten
dil
Kar
dja
li
Mo
nta
na
Lo
vech
Vra
tsa
Do
bri
ch
Plo
vdiv
Vid
in
Sliv
en
Yam
bo
l
V. T
arn
ovo
Shu
men
Var
na
St. Z
ago
ra
Ple
ven
Sofi
a
Bu
rgas
Has
ko
vo
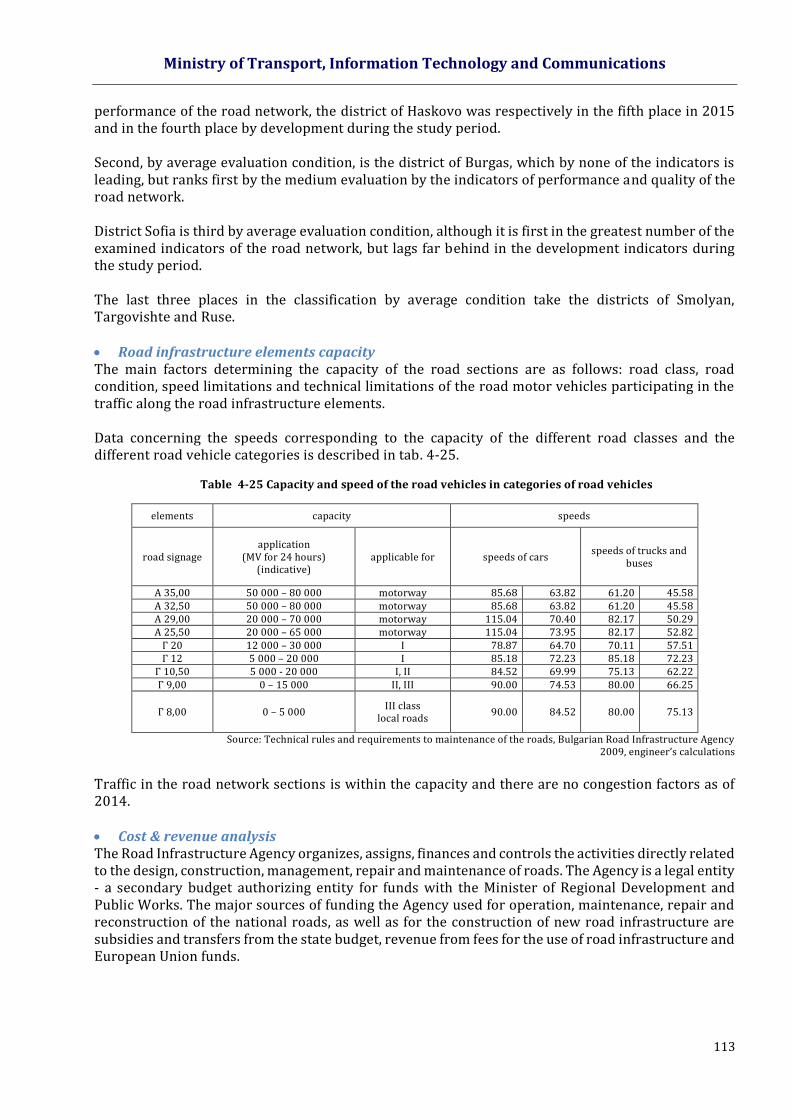
Ministry of Transport, Information Technology and Communications
113
performance of the road network, the district of Haskovo was respectively in the fifth place in 2015 and in the fourth place by development during the study period. Second, by average evaluation condition, is the district of Burgas, which by none of the indicators is leading, but ranks first by the medium evaluation by the indicators of performance and quality of the road network. District Sofia is third by average evaluation condition, although it is first in the greatest number of the examined indicators of the road network, but lags far behind in the development indicators during the study period. The last three places in the classification by average condition take the districts of Smolyan, Targovishte and Ruse.
Road infrastructure elements capacity The main factors determining the capacity of the road sections are as follows: road class, road condition, speed limitations and technical limitations of the road motor vehicles participating in the traffic along the road infrastructure elements. Data concerning the speeds corresponding to the capacity of the different road classes and the different road vehicle categories is described in tab. 4-25.
Table 4-25 Capacity and speed of the road vehicles in categories of road vehicles
elements capacity speeds
road signage application
(MV for 24 hours) (indicative)
applicable for speeds of cars speeds of trucks and
buses
А 35,00 50 000 – 80 000 motorway 85.68 63.82 61.20 45.58 А 32,50 50 000 – 80 000 motorway 85.68 63.82 61.20 45.58 А 29,00 20 000 – 70 000 motorway 115.04 70.40 82.17 50.29 А 25,50 20 000 – 65 000 motorway 115.04 73.95 82.17 52.82
Г 20 12 000 – 30 000 І 78.87 64.70 70.11 57.51 Г 12 5 000 – 20 000 І 85.18 72.23 85.18 72.23
Г 10,50 5 000 - 20 000 І, ІІ 84.52 69.99 75.13 62.22 Г 9,00 0 – 15 000 ІІ, ІІІ 90.00 74.53 80.00 66.25
Г 8,00 0 – 5 000 ІІІ class
local roads 90.00 84.52 80.00 75.13
Source: Technical rules and requirements to maintenance of the roads, Bulgarian Road Infrastructure Agency 2009, engineer’s calculations
Traffic in the road network sections is within the capacity and there are no congestion factors as of 2014.
Cost & revenue analysis The Road Infrastructure Agency organizes, assigns, finances and controls the activities directly related to the design, construction, management, repair and maintenance of roads. The Agency is a legal entity - a secondary budget authorizing entity for funds with the Minister of Regional Development and Public Works. The major sources of funding the Agency used for operation, maintenance, repair and reconstruction of the national roads, as well as for the construction of new road infrastructure are subsidies and transfers from the state budget, revenue from fees for the use of road infrastructure and European Union funds.
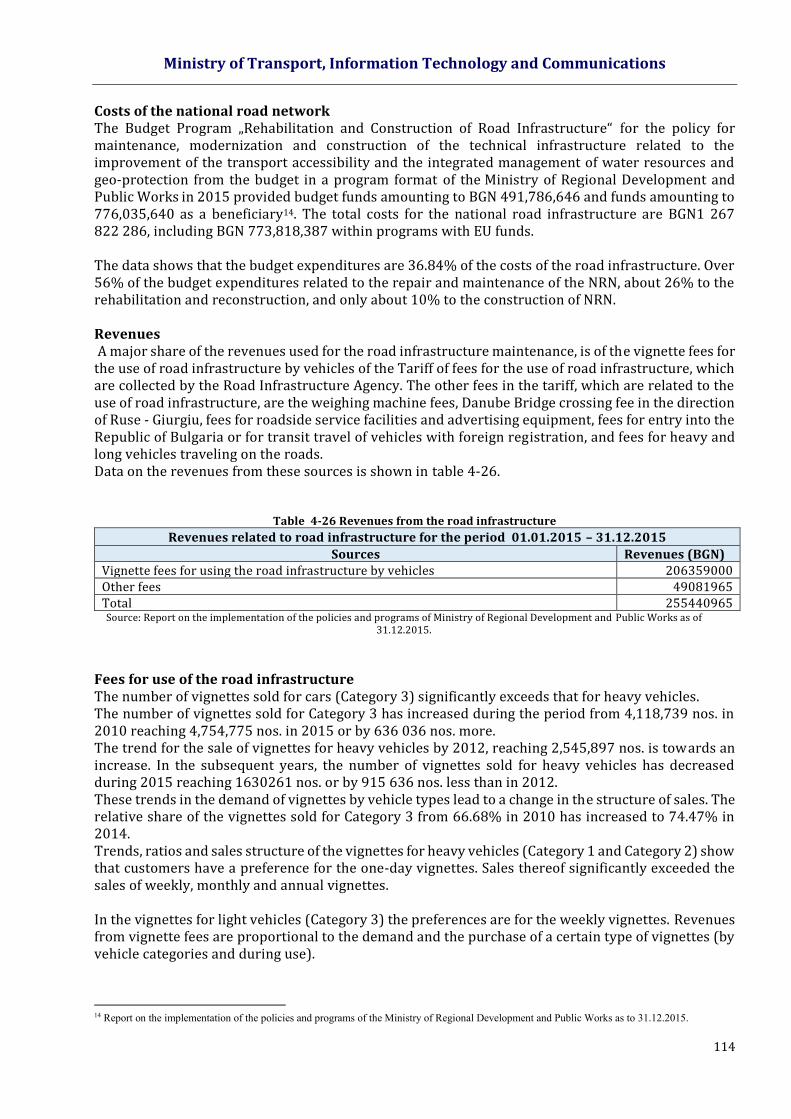
Ministry of Transport, Information Technology and Communications
114
Costs of the national road network The Budget Program „Rehabilitation and Construction of Road Infrastructure“ for the policy for maintenance, modernization and construction of the technical infrastructure related to the improvement of the transport accessibility and the integrated management of water resources and geo-protection from the budget in a program format of the Ministry of Regional Development and Public Works in 2015 provided budget funds amounting to BGN 491,786,646 and funds amounting to 776,035,640 as a beneficiary14. The total costs for the national road infrastructure are BGN1 267 822 286, including BGN 773,818,387 within programs with EU funds. The data shows that the budget expenditures are 36.84% of the costs of the road infrastructure. Over 56% of the budget expenditures related to the repair and maintenance of the NRN, about 26% to the rehabilitation and reconstruction, and only about 10% to the construction of NRN. Revenues A major share of the revenues used for the road infrastructure maintenance, is of the vignette fees for the use of road infrastructure by vehicles of the Tariff of fees for the use of road infrastructure, which are collected by the Road Infrastructure Agency. The other fees in the tariff, which are related to the use of road infrastructure, are the weighing machine fees, Danube Bridge crossing fee in the direction of Ruse - Giurgiu, fees for roadside service facilities and advertising equipment, fees for entry into the Republic of Bulgaria or for transit travel of vehicles with foreign registration, and fees for heavy and long vehicles traveling on the roads. Data on the revenues from these sources is shown in table 4-26.
Table 4-26 Revenues from the road infrastructure
Revenues related to road infrastructure for the period 01.01.2015 – 31.12.2015
Sources Revenues (BGN) Vignette fees for using the road infrastructure by vehicles 206359000 Other fees 49081965 Total 255440965 Source: Report on the implementation of the policies and programs of Ministry of Regional Development and Public Works as of
31.12.2015.
Fees for use of the road infrastructure The number of vignettes sold for cars (Category 3) significantly exceeds that for heavy vehicles. The number of vignettes sold for Category 3 has increased during the period from 4,118,739 nos. in 2010 reaching 4,754,775 nos. in 2015 or by 636 036 nos. more. The trend for the sale of vignettes for heavy vehicles by 2012, reaching 2,545,897 nos. is towards an increase. In the subsequent years, the number of vignettes sold for heavy vehicles has decreased during 2015 reaching 1630261 nos. or by 915 636 nos. less than in 2012. These trends in the demand of vignettes by vehicle types lead to a change in the structure of sales. The relative share of the vignettes sold for Category 3 from 66.68% in 2010 has increased to 74.47% in 2014. Trends, ratios and sales structure of the vignettes for heavy vehicles (Category 1 and Category 2) show that customers have a preference for the one-day vignettes. Sales thereof significantly exceeded the sales of weekly, monthly and annual vignettes. In the vignettes for light vehicles (Category 3) the preferences are for the weekly vignettes. Revenues from vignette fees are proportional to the demand and the purchase of a certain type of vignettes (by vehicle categories and during use).
14 Report on the implementation of the policies and programs of the Ministry of Regional Development and Public Works as to 31.12.2015.

Ministry of Transport, Information Technology and Communications
115
The price level determines the structure of revenues that differs from the structure of sales. For the vehicles of Category 1, EURO 0-II, the highest number of monthly vignettes was sold, followed by the annual vignettes. The trends are towards a sharp increase of the monthly vignettes sold after the year 2012. Revenues in this category of vehicles are highest of the annual vignettes, but with a trend towards reduction for account of the revenues from monthly vignettes. For vehicles of Category 1, EURO III-V+ in 2013 the number of sold monthly and annual vignettes has sharply increased, which determines the increase of the related revenues. Similar to the trends typical for Category 1 are the trends for Category 2, which show that the demand for certain vignettes depends not only on the prices, but on the fleet structure and the transport structure. Overall, the funds required for maintaining the condition of the road network exceed greatly the current funding. In order to bring the entire network in good condition over the next five years there should be about 1.1 billion BGN invested annually in the Republican Road Network (RRN). In comparison, currently there are less than 300 million BGN invested for the RRN. The costs for road rehabilitation should be at least doubled in order to reach 75% of sustainable road network by 2022. This means that maintaining the existing budgetary allocations of funds for maintenance and rehabilitation would lead to deterioration of the network. 15 The required expenses for maintaining sustainable infrastructure are 1,365,563,950 BGN annually. These costs include routine and winter maintenance, rehabilitation at every seven years and structural changes every 14 years. The shortage of funds is 428 859 522 BGN per year. If we exclude the funds for projects from the EU, the shortage of funds for maintenance, rehabilitation and investment will be 696 489 358 BGN.
4.4.4 SAFETY AND SECURITY The total number of deceased persons from RTA for the country for 2014 has increased by 59 nos.,
and the number of injured persons has decreased by 134 nos. compared to the previous year 2013; For the period 2010-2014, a decrease was noticed in the number of severely injured persons from
RTA for the country, but also an increase of the total number of the occurred RTA. The number of slightly injured has increased for 2014 compared to 2010;
In 2014 the distribution of RTA by types is reduced to the following three main structure determining groups where the deceased 91,97% are recorded:
- Impact between vehicles: there are 2236 RTA reported where 210 persons have passed away and 3318 persons have been injured;
- RTA with single vehicles: there are 1870 RTA reported where 247 persons have passed away and 2428 persons have been injured;
- Hitting a pedestrian: there are 2111 RTA reported where 150 persons have passed away and 2053 persons have been injured;
Regarding the distribution of the RTA occurring by days of the week for 2014, it is evident that the highest number of RTA have been registered on Friday, and the smallest number – on Sunday;
The highest number of RTA have occurred in the hourly intervals between 17-17.59 PM and 18 -18.59 PM;
With the smallest number of registered occurred RTA are the hourly intervals between 2-2.59 AM and 3-3.59 AM;
For 0,2% of the RTA, the main cause is related to poor road conditions; The highest number of RTA for 2013 and 2014 has occurred on first-class roads. These are followed
by the number of the accidents which have occurred on first-class and second-class roads; The lowest number of RTA have occurred on the highways; In 2014, due to poor road conditions 13 nos. of RTA have occurred with deceased and injured
persons; In 2014, no accidents have occurred due to lack of measures for removal of the snow and ice from
the road;
15 Strategy for development of the road infrastructure of the Republic of Bulgaria 2016-2022
Ministry of Transport, Information Technology and Communications
116
The highest number of road traffic accidents for 2014 has occurred due to unevenness in the pavement, other features of the road and damage to the pavement;
In 2014, no accidents have occurred due to poor visibility on the road from roadside objects; In 2014, outside the settlements have occurred 1862 nos. of road traffic accidents on a road section,
94 nos. on a crossing, 74 nos. on a junction, and 8 nos. on a bridge. Significantly lower is the number of road traffic accidents occurred at level crossings and overpasses.
4.4.5 ANALYSIS OF THE ROAD VEHICLES STRUCTURE AND CONDITION
Quantity and quality of the rolling stock by categories Registered road vehicles The largest share is of the vehicles above 20 years – 1,475,443, whereas the total number of the vehicles registered by July 2014 is 3,769,117. The vehicles aged 15 – 20 years in the country are 1 104 166, and those of age 11 - 15 years – 652,346. The road vehicles of age below 5 years are 133,941 for 2014 and those of age 6 – 10 years – 403,191. The age structure of the fleet of vehicles shows that the largest share - 39% - is for the existing vehicles of age exceeding 20 years, which confirms the trend of excessive ageing of the vehicles fleet; The lowest share, only 4% is of motorised road vehicles below 5 years; Concerning is also the share of vehicles of age 15-20 years - 30% of all existing road vehicles; The share of the new registered motor vehicles, including cars for the reporting period shows a decrease. This fact results in ageing of the motor fleet in Bulgaria. The disadvantageous age structure has a negative environmental impact.
Environmental categories of the road vehicles The age of most of the vehicles is above 20 years and that determines their existence at a lower environmental category. Only 4.20% of the vehicles comply with Euro standard 5. The largest share is of vehicles without Euro standard – 33.40%. This is due to the great number of registered vehicles of more than 20 year age. 24.40% of the vehicles have Euro 1. Operational problems related to the rolling stock Due to the large number of vehicles registered whose age is above 20 years, the probability or road accidents resulting from technical failure of the vehicle is increased. In 2014 technical failures had caused 18 road accidents, where two persons had died and 28 had been injured.
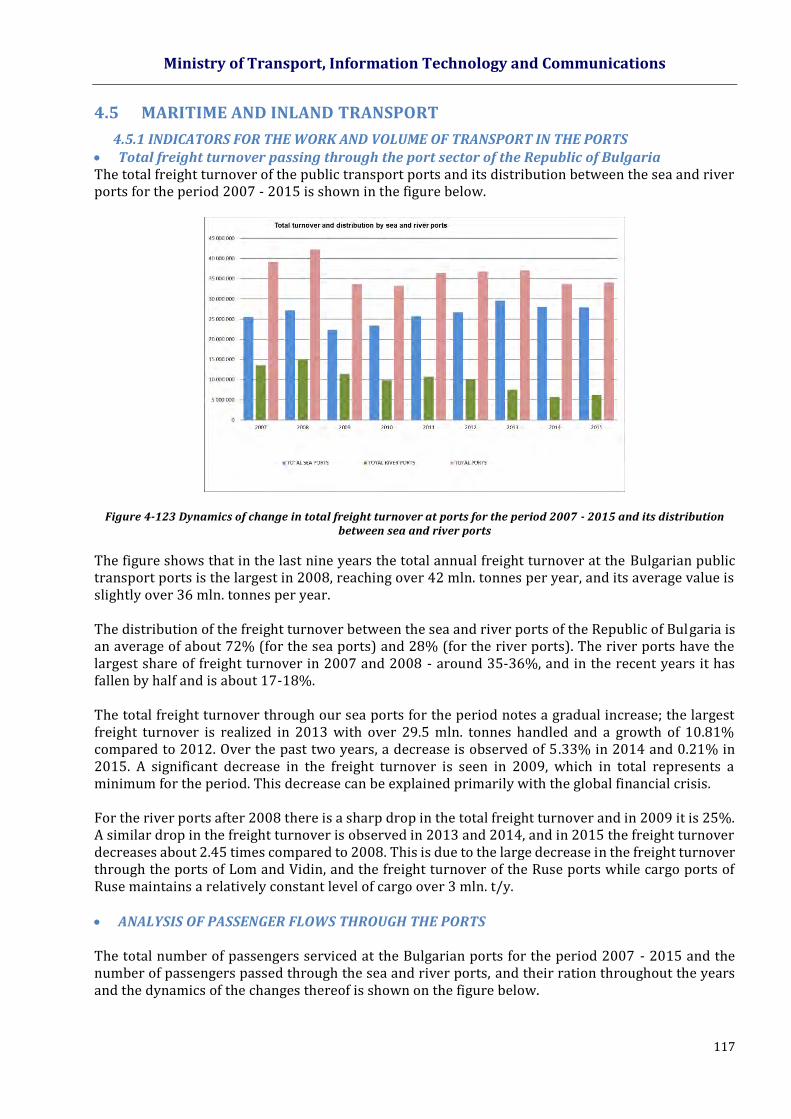
Ministry of Transport, Information Technology and Communications
117
4.5 MARITIME AND INLAND TRANSPORT
4.5.1 INDICATORS FOR THE WORK AND VOLUME OF TRANSPORT IN THE PORTS Total freight turnover passing through the port sector of the Republic of Bulgaria The total freight turnover of the public transport ports and its distribution between the sea and river ports for the period 2007 - 2015 is shown in the figure below.
Figure 4-123 Dynamics of change in total freight turnover at ports for the period 2007 - 2015 and its distribution between sea and river ports
The figure shows that in the last nine years the total annual freight turnover at the Bulgarian public transport ports is the largest in 2008, reaching over 42 mln. tonnes per year, and its average value is slightly over 36 mln. tonnes per year. The distribution of the freight turnover between the sea and river ports of the Republic of Bulgaria is an average of about 72% (for the sea ports) and 28% (for the river ports). The river ports have the largest share of freight turnover in 2007 and 2008 - around 35-36%, and in the recent years it has fallen by half and is about 17-18%. The total freight turnover through our sea ports for the period notes a gradual increase; the largest freight turnover is realized in 2013 with over 29.5 mln. tonnes handled and a growth of 10.81% compared to 2012. Over the past two years, a decrease is observed of 5.33% in 2014 and 0.21% in 2015. A significant decrease in the freight turnover is seen in 2009, which in total represents a minimum for the period. This decrease can be explained primarily with the global financial crisis. For the river ports after 2008 there is a sharp drop in the total freight turnover and in 2009 it is 25%. A similar drop in the freight turnover is observed in 2013 and 2014, and in 2015 the freight turnover decreases about 2.45 times compared to 2008. This is due to the large decrease in the freight turnover through the ports of Lom and Vidin, and the freight turnover of the Ruse ports while cargo ports of Ruse maintains a relatively constant level of cargo over 3 mln. t/y. ANALYSIS OF PASSENGER FLOWS THROUGH THE PORTS The total number of passengers serviced at the Bulgarian ports for the period 2007 - 2015 and the number of passengers passed through the sea and river ports, and their ration throughout the years and the dynamics of the changes thereof is shown on the figure below.
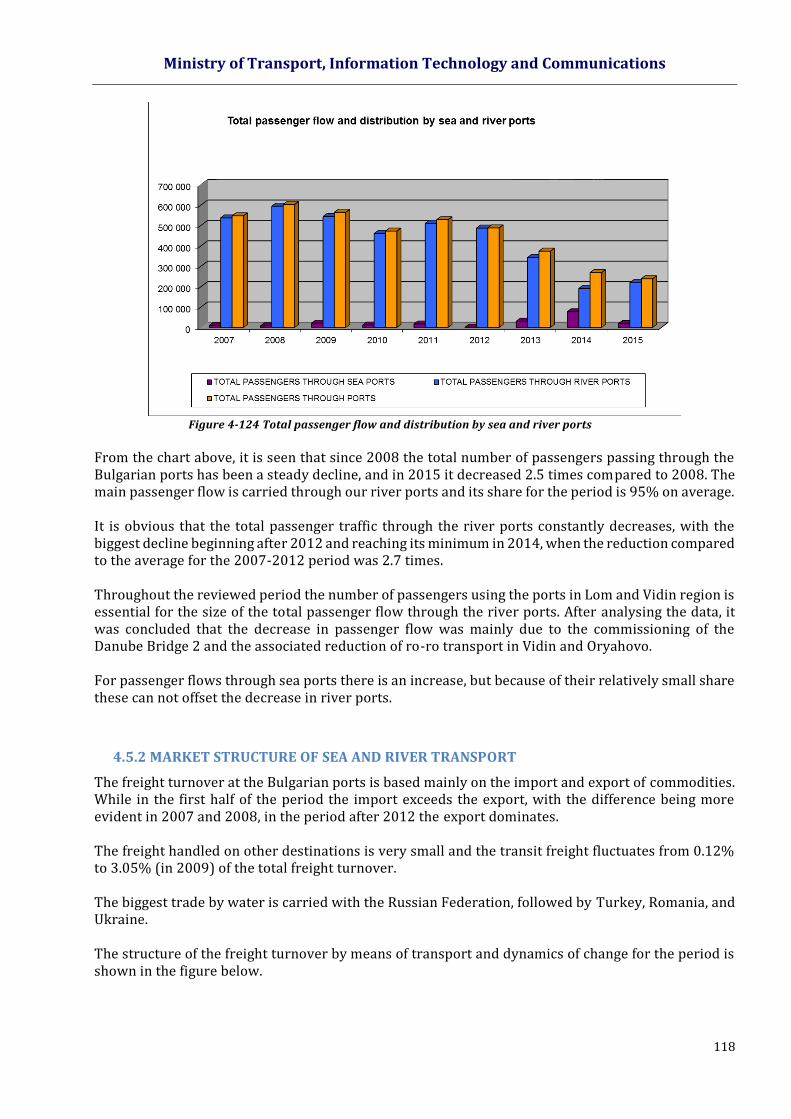
Ministry of Transport, Information Technology and Communications
118
Figure 4-124 Total passenger flow and distribution by sea and river ports
From the chart above, it is seen that since 2008 the total number of passengers passing through the Bulgarian ports has been a steady decline, and in 2015 it decreased 2.5 times compared to 2008. The main passenger flow is carried through our river ports and its share for the period is 95% on average. It is obvious that the total passenger traffic through the river ports constantly decreases, with the biggest decline beginning after 2012 and reaching its minimum in 2014, when the reduction compared to the average for the 2007-2012 period was 2.7 times. Throughout the reviewed period the number of passengers using the ports in Lom and Vidin region is essential for the size of the total passenger flow through the river ports. After analysing the data, it was concluded that the decrease in passenger flow was mainly due to the commissioning of the Danube Bridge 2 and the associated reduction of ro-ro transport in Vidin and Oryahovo. For passenger flows through sea ports there is an increase, but because of their relatively small share these can not offset the decrease in river ports.
4.5.2 MARKET STRUCTURE OF SEA AND RIVER TRANSPORT
The freight turnover at the Bulgarian ports is based mainly on the import and export of commodities. While in the first half of the period the import exceeds the export, with the difference being more evident in 2007 and 2008, in the period after 2012 the export dominates. The freight handled on other destinations is very small and the transit freight fluctuates from 0.12% to 3.05% (in 2009) of the total freight turnover. The biggest trade by water is carried with the Russian Federation, followed by Turkey, Romania, and Ukraine. The structure of the freight turnover by means of transport and dynamics of change for the period is shown in the figure below.
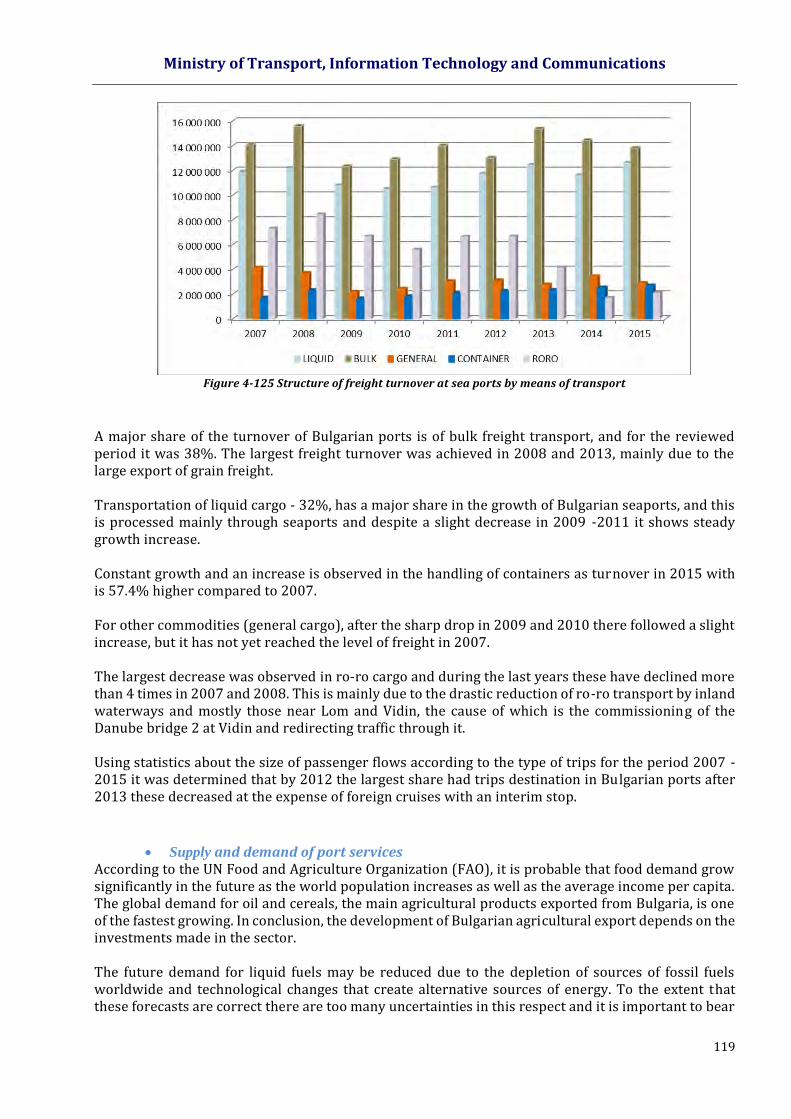
Ministry of Transport, Information Technology and Communications
119
Figure 4-125 Structure of freight turnover at sea ports by means of transport
A major share of the turnover of Bulgarian ports is of bulk freight transport, and for the reviewed period it was 38%. The largest freight turnover was achieved in 2008 and 2013, mainly due to the large export of grain freight. Transportation of liquid cargo - 32%, has a major share in the growth of Bulgarian seaports, and this is processed mainly through seaports and despite a slight decrease in 2009 -2011 it shows steady growth increase. Constant growth and an increase is observed in the handling of containers as turnover in 2015 with is 57.4% higher compared to 2007. For other commodities (general cargo), after the sharp drop in 2009 and 2010 there followed a slight increase, but it has not yet reached the level of freight in 2007. The largest decrease was observed in ro-ro cargo and during the last years these have declined more than 4 times in 2007 and 2008. This is mainly due to the drastic reduction of ro-ro transport by inland waterways and mostly those near Lom and Vidin, the cause of which is the commissioning of the Danube bridge 2 at Vidin and redirecting traffic through it. Using statistics about the size of passenger flows according to the type of trips for the period 2007 - 2015 it was determined that by 2012 the largest share had trips destination in Bulgarian ports after 2013 these decreased at the expense of foreign cruises with an interim stop.
Supply and demand of port services According to the UN Food and Agriculture Organization (FAO), it is probable that food demand grow significantly in the future as the world population increases as well as the average income per capita. The global demand for oil and cereals, the main agricultural products exported from Bulgaria, is one of the fastest growing. In conclusion, the development of Bulgarian agricultural export depends on the investments made in the sector. The future demand for liquid fuels may be reduced due to the depletion of sources of fossil fuels worldwide and technological changes that create alternative sources of energy. To the extent that these forecasts are correct there are too many uncertainties in this respect and it is important to bear
Ministry of Transport, Information Technology and Communications
120
in mind the same to achieve a reasonable estimate of the quantity of hydrocarbons, as the relations currently applicable can fail in the near future. The range of freight, which is transported in containers, however, is rising continuously since now even products that represent bulk freight and cars are sometimes transported in containers. The worldwide market for cruises is growing rapidly at an average annual rate of 6.5%. At the moment, the Black Sea is still a relatively small market for the cruise sector. An important growing market in Europe are the river cruises that already generate a large number of passengers for the river ports of Vidin / Lom and Ruse. Rhine / Main / Danube, allowing vessels to sail all the way from Amsterdam / Rotterdam in the Netherlands to Bulgaria, Romania, and even Ukraine are clearly the most important waterways for river cruises.
4.5.3 PORT INFRASTRUCTURE
The port system of the Republic of Bulgaria consists of two port types - sea and river ports: • The seaports are situated on the Black Sea coast, representing the eastern border of Bulgaria respectively. • The river ports are situated along the Bulgarian section of the Danube, representing the northern border of the country. In compliance with the Law on the Maritime Spaces, Inland Waterways and Ports of the
Republic of Bulgaria (LMSIWPRB), the National port system includes: Public transport ports of national importance Public transport ports of regional importance Yacht ports – pursuant to art. 108 of LMSIWPRB Fishing ports - pursuant to art. 107 of LMSIWPRB Specialized ports - pursuant to art. 109 of LMSIWPRB
As of now, the national port system of the Republic of Bulgaria has 14 628 m total length of the quay front in the public transport sea ports and 13 964 m in the public transport river ports. The quay front of the sea ports for public transport of national importance is 13 081 m, where 69 freight, 8 passenger and 11 berths for business purposes have been separated. The quay front of the sea ports for public transport of regional importance is 1748 m, along which 13 freight and 6 passenger berths are separated. The quay front of the river public transport ports of national importance has a total length of 9 080 m, where 44 freight, 5 RO-RO transport, 14 passenger and 3 berths for business purposes are separated. The quay front of the river public transport ports of regional importance has a total length of 4 964 m, where 30 freight, 2 Ro-Ro transport, 3 passenger and 12 berths for business purposes are separated.
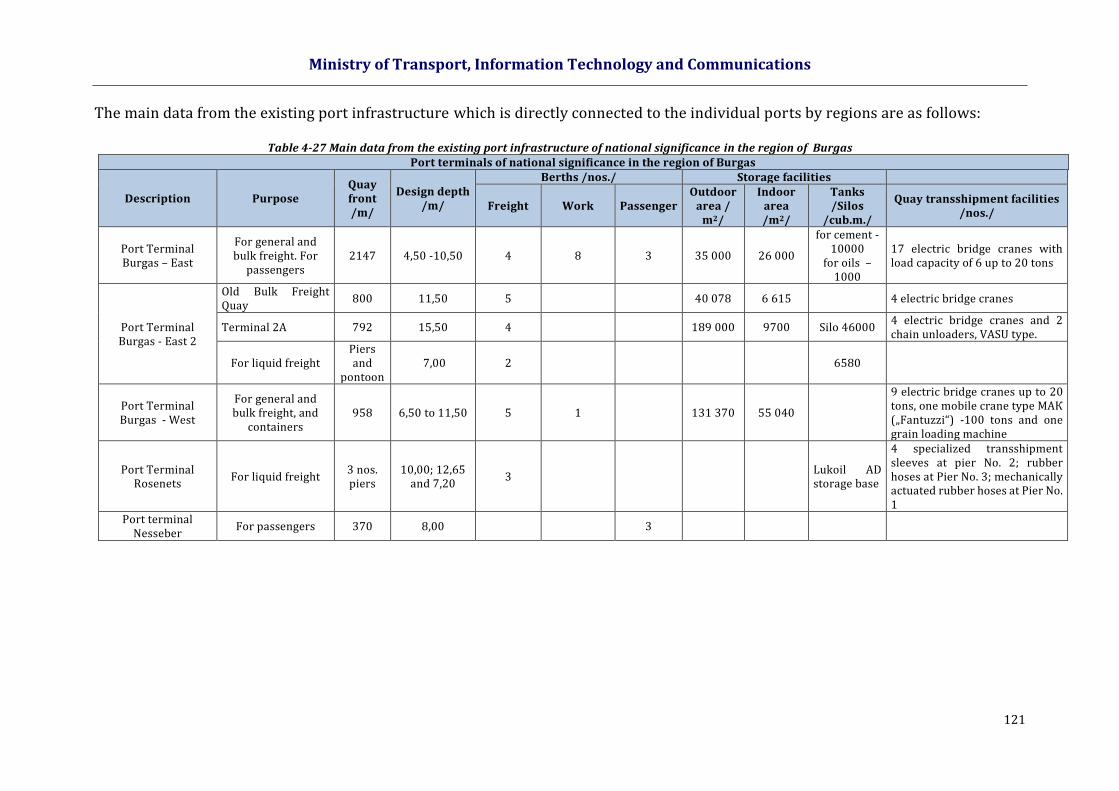
Ministry of Transport, Information Technology and Communications
121
The main data from the existing port infrastructure which is directly connected to the individual ports by regions are as follows:
Table 4-27 Main data from the existing port infrastructure of national significance in the region of Burgas Port terminals of national significance in the region of Burgas
Description Purpose Quay front /m/
Design depth /m/
Berths /nos./ Storage facilities
Freight Work Passenger Outdoor
area / m2/
Indoor area /m2/
Tanks /Silos
/cub.m./
Quay transshipment facilities /nos./
Port Terminal Burgas – East
For general and bulk freight. For
passengers 2147 4,50 -10,50 4 8 3 35 000 26 000
for cement -10000
for oils – 1000
17 electric bridge cranes with load capacity of 6 up to 20 tons
Port Terminal Burgas - East 2
Old Bulk Freight Quay
800 11,50 5 40 078 6 615 4 electric bridge cranes
Terminal 2А 792 15,50 4 189 000 9700 Silo 46000 4 electric bridge cranes and 2 chain unloaders, VASU type.
For liquid freight Piers and
pontoon 7,00 2 6580
Port Terminal Burgas - West
For general and bulk freight, and
containers 958 6,50 to 11,50 5 1 131 370 55 040
9 electric bridge cranes up to 20 tons, one mobile crane type МАК („Fantuzzi“) -100 tons and one grain loading machine
Port Terminal Rosenets
For liquid freight 3 nos. piers
10,00; 12,65 and 7,20
3 Lukoil AD storage base
4 specialized transshipment sleeves at pier No. 2; rubber hoses at Pier No. 3; mechanically actuated rubber hoses at Pier No. 1
Port terminal Nesseber
For passengers 370 8,00 3
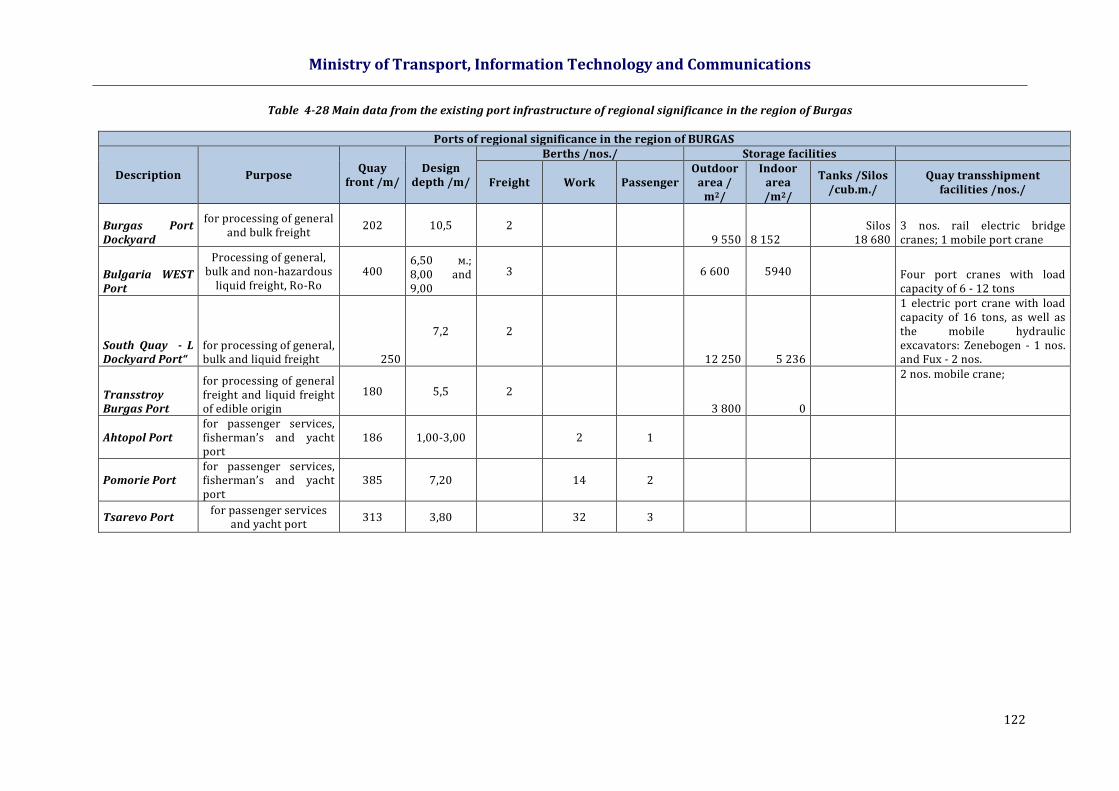
Ministry of Transport, Information Technology and Communications
122
Table 4-28 Main data from the existing port infrastructure of regional significance in the region of Burgas
Ports of regional significance in the region of BURGAS
Description Purpose Quay
front /m/ Design
depth /m/
Berths /nos./ Storage facilities
Freight Work Passenger Outdoor
area / m2/
Indoor area /m2/
Tanks /Silos /cub.m./
Quay transshipment facilities /nos./
Burgas Port Dockyard
for processing of general and bulk freight
202 10,5 2 9 550 8 152
Silos 18 680
3 nos. rail electric bridge cranes; 1 mobile port crane
Bulgaria WEST Port
Processing of general, bulk and non-hazardous
liquid freight, Ro-Ro 400
6,50 м.; 8,00 and 9,00
3 6 600 5940
Four port cranes with load capacity of 6 - 12 tons
South Quay - L Dockyard Port“
for processing of general, bulk and liquid freight 250
7,2 2
12 250 5 236
1 electric port crane with load capacity of 16 tons, as well as the mobile hydraulic excavators: Zenebogen - 1 nos. and Fux - 2 nos.
Transstroy Burgas Port
for processing of general freight and liquid freight of edible origin
180 5,5 2
3 800 0
2 nos. mobile crane;
Ahtopol Port for passenger services, fisherman’s and yacht port
186 1,00-3,00 2 1
Pomorie Port for passenger services, fisherman’s and yacht port
385 7,20 14 2
Tsarevo Port for passenger services
and yacht port 313 3,80 32 3
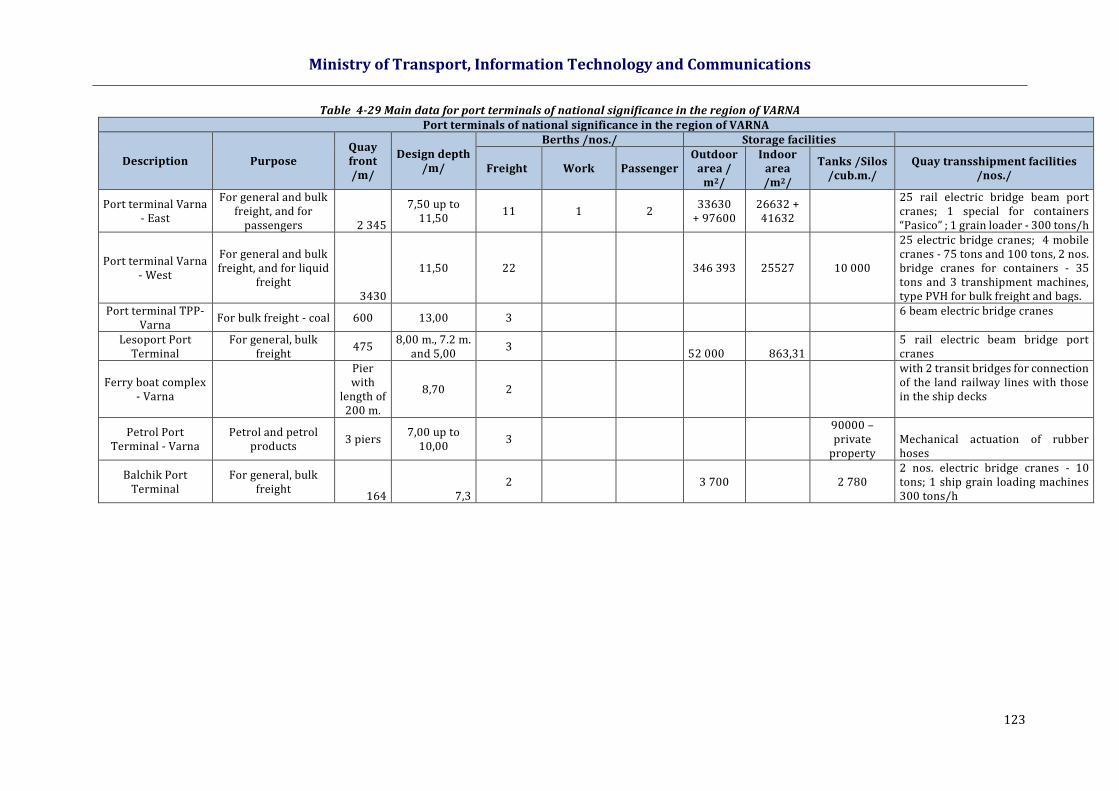
Ministry of Transport, Information Technology and Communications
123
Table 4-29 Main data for port terminals of national significance in the region of VARNA Port terminals of national significance in the region of VARNA
Description Purpose Quay front /m/
Design depth /m/
Berths /nos./ Storage facilities
Freight Work Passenger Outdoor
area / m2/
Indoor area /m2/
Tanks /Silos /cub.m./
Quay transshipment facilities /nos./
Port terminal Varna - East
For general and bulk freight, and for
passengers 2 345
7,50 up to 11,50
11 1 2 33630
+ 97600 26632 + 41632
25 rail electric bridge beam port cranes; 1 special for containers “Pasico” ; 1 grain loader - 300 tons/h
Port terminal Varna - West
For general and bulk freight, and for liquid
freight 3430
11,50 22 346 393 25527 10 000
25 electric bridge cranes; 4 mobile cranes - 75 tons and 100 tons, 2 nos. bridge cranes for containers - 35 tons and 3 transhipment machines, type PVH for bulk freight and bags.
Port terminal TPP-Varna
For bulk freight - coal 600 13,00 3 6 beam electric bridge cranes
Lesoport Port Terminal
For general, bulk freight
475 8,00 m., 7.2 m.
and 5,00 3
52 000 863,31
5 rail electric beam bridge port cranes
Ferry boat complex - Varna
Pier with
length of 200 m.
8,70 2
with 2 transit bridges for connection of the land railway lines with those in the ship decks
Petrol Port Terminal - Varna
Petrol and petrol products
3 piers 7,00 up to
10,00 3
90000 – private
property Mechanical actuation of rubber hoses
Balchik Port Terminal
For general, bulk freight
164 7,3 2 3 700 2 780
2 nos. electric bridge cranes - 10 tons; 1 ship grain loading machines 300 tons/h
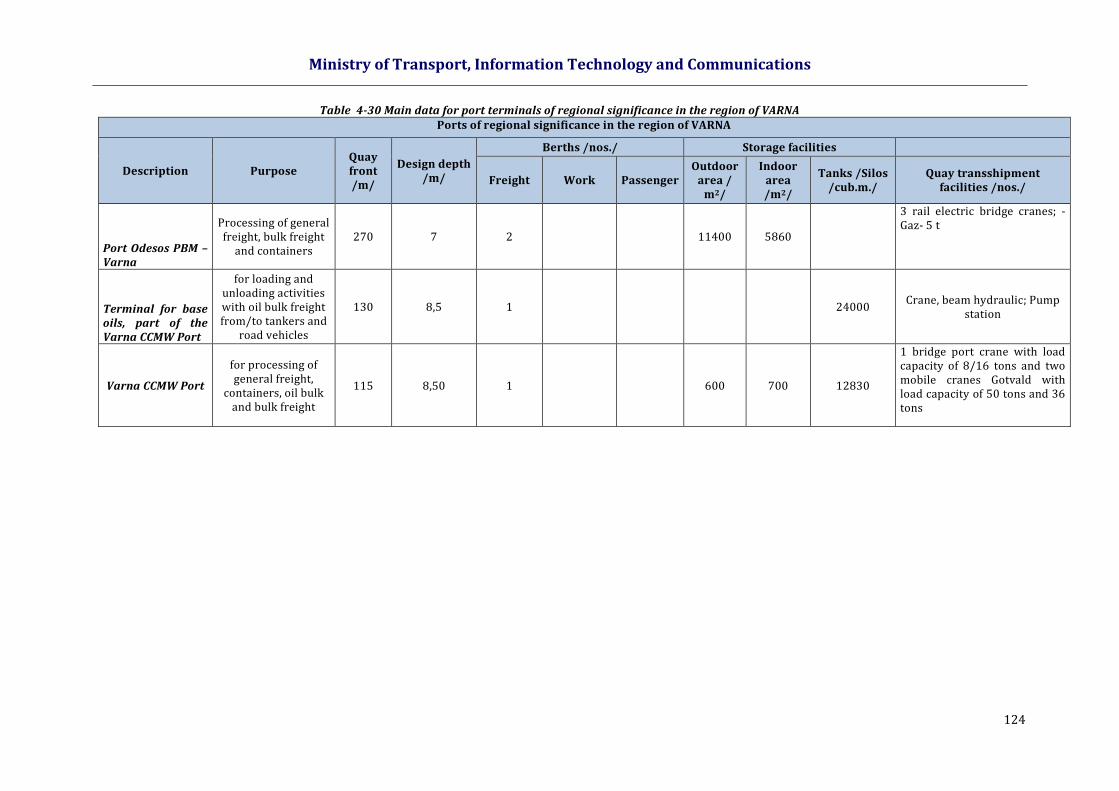
Ministry of Transport, Information Technology and Communications
124
Table 4-30 Main data for port terminals of regional significance in the region of VARNA Ports of regional significance in the region of VARNA
Description Purpose Quay front /m/
Design depth /m/
Berths /nos./ Storage facilities
Freight Work Passenger Outdoor
area / m2/
Indoor area /m2/
Tanks /Silos /cub.m./
Quay transshipment facilities /nos./
Port Odesos PBM – Varna
Processing of general freight, bulk freight
and containers 270 7 2
11400 5860
3 rail electric bridge cranes; - Gaz- 5 t
Terminal for base oils, part of the Varna CCMW Port
for loading and unloading activities with oil bulk freight from/to tankers and
road vehicles
130 8,5 1 24000 Crane, beam hydraulic; Pump
station
Varna CCMW Port
for processing of general freight,
containers, oil bulk and bulk freight
115 8,50 1 600 700 12830
1 bridge port crane with load capacity of 8/16 tons and two mobile cranes Gotvald with load capacity of 50 tons and 36 tons
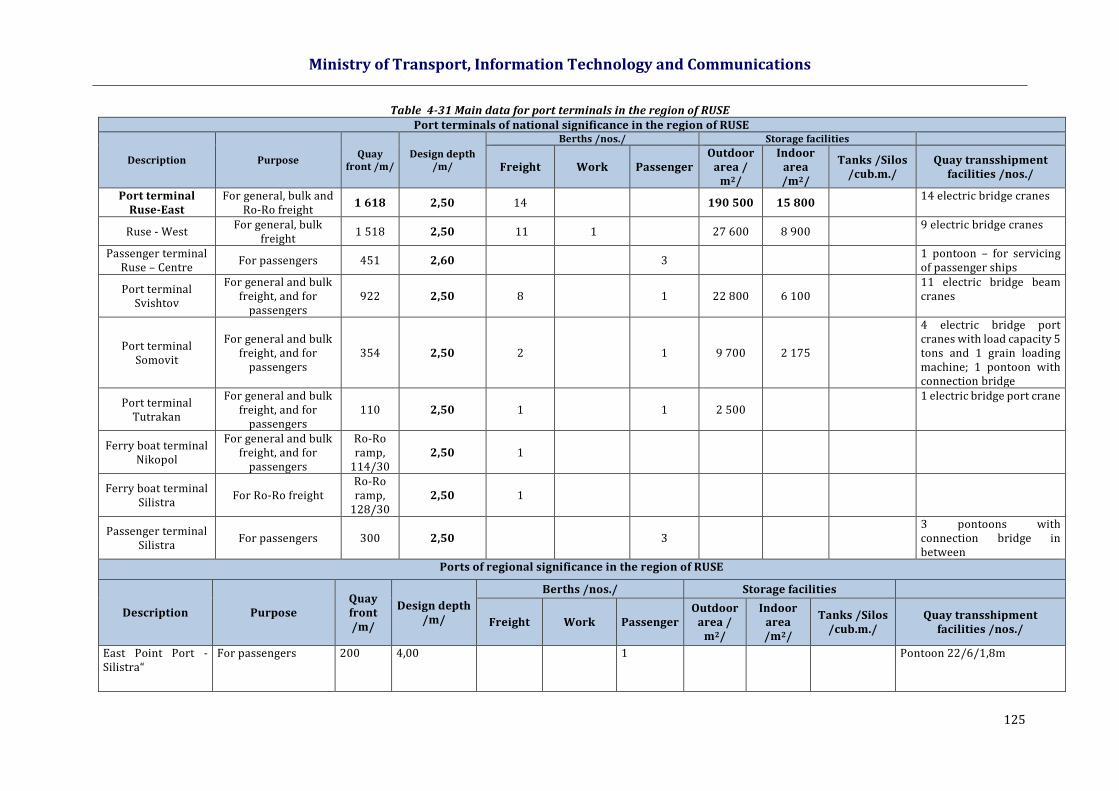
Ministry of Transport, Information Technology and Communications
125
Table 4-31 Main data for port terminals in the region of RUSE Port terminals of national significance in the region of RUSE
Description Purpose Quay
front /m/ Design depth
/m/
Berths /nos./ Storage facilities
Freight Work Passenger Outdoor
area / m2/
Indoor area /m2/
Tanks /Silos /cub.m./
Quay transshipment facilities /nos./
Port terminal Ruse-East
For general, bulk and Ro-Ro freight
1 618 2,50 14 190 500 15 800 14 electric bridge cranes
Ruse - West For general, bulk
freight 1 518 2,50 11 1 27 600 8 900
9 electric bridge cranes
Passenger terminal Ruse – Centre
For passengers 451 2,60 3 1 pontoon – for servicing of passenger ships
Port terminal Svishtov
For general and bulk freight, and for
passengers 922 2,50 8 1 22 800 6 100
11 electric bridge beam cranes
Port terminal Somovit
For general and bulk freight, and for
passengers 354 2,50 2 1 9 700 2 175
4 electric bridge port cranes with load capacity 5 tons and 1 grain loading machine; 1 pontoon with connection bridge
Port terminal Tutrakan
For general and bulk freight, and for
passengers 110 2,50 1 1 2 500
1 electric bridge port crane
Ferry boat terminal Nikopol
For general and bulk freight, and for
passengers
Ro-Ro ramp,
114/30 2,50 1
Ferry boat terminal Silistra
For Ro-Ro freight Ro-Ro ramp,
128/30 2,50 1
Passenger terminal Silistra
For passengers 300 2,50 3 3 pontoons with connection bridge in between
Ports of regional significance in the region of RUSE
Description Purpose Quay front /m/
Design depth /m/
Berths /nos./ Storage facilities
Freight Work Passenger Outdoor
area / m2/
Indoor area /m2/
Tanks /Silos /cub.m./
Quay transshipment facilities /nos./
East Point Port - Silistra“
For passengers 200 4,00 1 Pontoon 22/6/1,8m
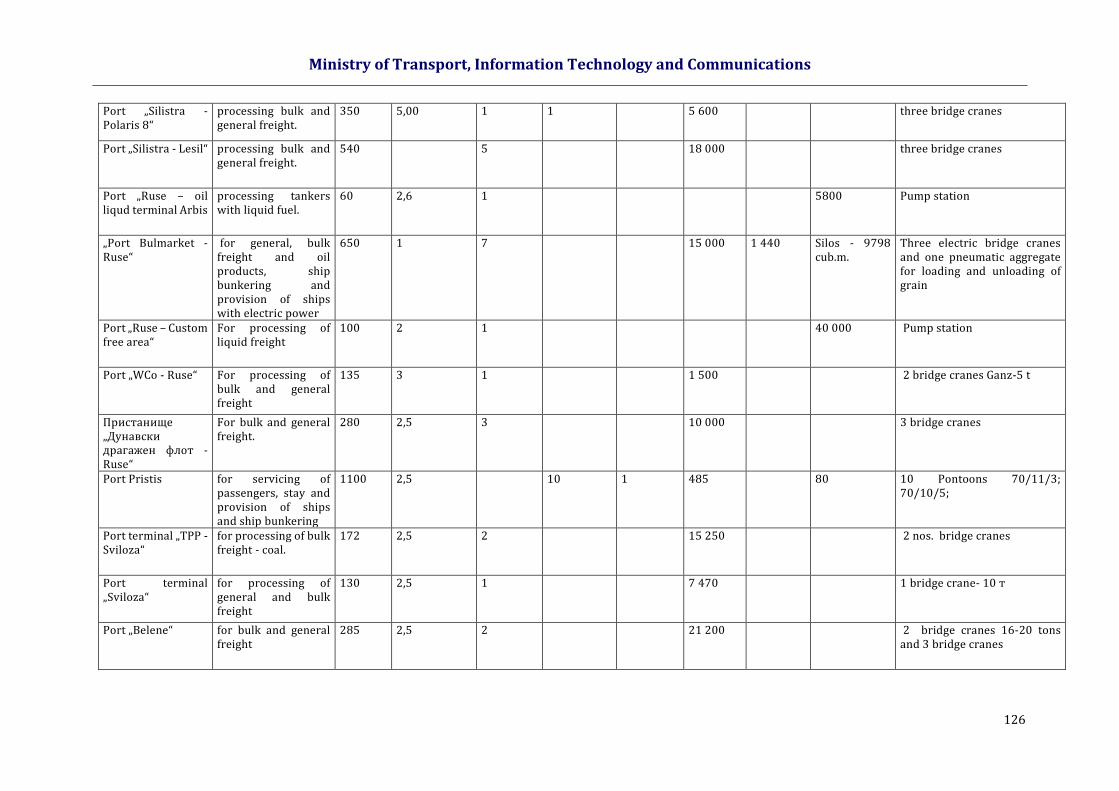
Ministry of Transport, Information Technology and Communications
126
Port „Silistra - Polaris 8“
processing bulk and general freight.
350 5,00 1 1 5 600 three bridge cranes
Port „Silistra - Lesil“ processing bulk and general freight.
540 5 18 000 three bridge cranes
Port „Ruse – oil liqud terminal Arbis
processing tankers with liquid fuel.
60 2,6 1 5800 Pump station
„Port Bulmarket - Ruse“
for general, bulk freight and oil products, ship bunkering and provision of ships with electric power
650 1 7 15 000 1 440 Silos - 9798 cub.m.
Three electric bridge cranes and one pneumatic aggregate for loading and unloading of grain
Port „Ruse – Custom free area“
For processing of liquid freight
100 2 1 40 000 Pump station
Port „WCo - Ruse“ For processing of bulk and general freight
135 3 1 1 500 2 bridge cranes Ganz-5 t
Пристанище „Дунавски драгажен флот - Ruse“
For bulk and general freight.
280 2,5 3 10 000 3 bridge cranes
Port Pristis for servicing of passengers, stay and provision of ships and ship bunkering
1100 2,5 10 1 485 80 10 Pontoons 70/11/3; 70/10/5;
Port terminal „TPP - Sviloza“
for processing of bulk freight - coal.
172 2,5 2 15 250 2 nos. bridge cranes
Port terminal „Sviloza“
for processing of general and bulk freight
130 2,5 1 7 470 1 bridge crane- 10 т
Port „Belene“ for bulk and general freight
285 2,5 2 21 200 2 bridge cranes 16-20 tons and 3 bridge cranes

Ministry of Transport, Information Technology and Communications
127
Port „Nikopol“ Passenger port 135 4,4 1 Pontoon 22/8m
Port „Petrol - Somovit“
For unloading and bunkers of oil products.
75,8 2,5 1 Floating unit with length of 75,80 m
Table 4-32 Port terminals of national significance in the region of LOM and VIDIN
Port terminals of national significance in the region of LOM and VIDIN
Description Purpose Quay front /m/
Design depth /m/
Berths /nos./ Storage facilities
Freight Work Passenger Outdoor
area / m2/
Indoor area /m2/
Tanks /Silos /cub.m./
Quay transshipment facilities /nos./
Port terminal Lom For general and bulk
freight, 1 422 2,50 13 117 921 8 343
16 electric bridge cranes
Port terminal Oryahovo
For general and bulk freight, and for
passengers 323 2,00 2 1 4 400 962
3 electric bridge beam cranes with load capacity 5 up to 10 tons
Port terminal Vidin-North
For general and bulk freight
320 2,40 4 10000 3131
2 electric bridge crane type „Kirovets” with load capacity 16 – 20 tons and one grain loading machine with capacity of 200 tons grain/hour
Ferry Boat Complex Vidin
For Ro-Ro freight 50 2,50 1
Ro-Ro ramp, with width of 30-50 m.
Port terminal Vidin- South
For general and bulk freight
200 2,50 2
18 000
2 electric bridge cranes
Port terminal Vidin - Centre
For passenger 1440 2,50 3 4 18 000 Seven pontoons for berthing of vessels
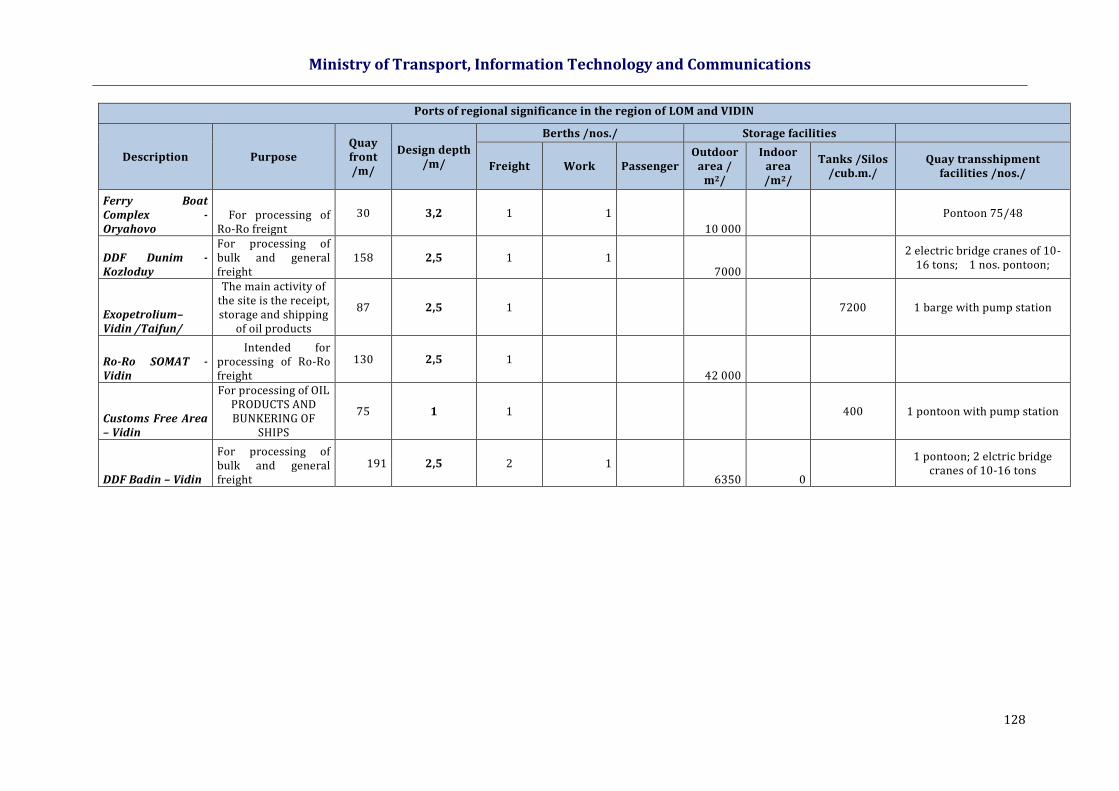
Ministry of Transport, Information Technology and Communications
128
Ports of regional significance in the region of LOM and VIDIN
Description Purpose Quay front /m/
Design depth /m/
Berths /nos./ Storage facilities
Freight Work Passenger Outdoor
area / m2/
Indoor area /m2/
Tanks /Silos /cub.m./
Quay transshipment facilities /nos./
Ferry Boat Complex - Oryahovo
For processing of Ro-Ro freignt
30 3,2 1 1
10 000
Pontoon 75/48
DDF Dunim - Kozloduy
For processing of bulk and general freight
158 2,5 1 1 7000
2 electric bridge cranes of 10-
16 tons; 1 nos. pontoon;
Exopetrolium– Vidin /Taifun/
The main activity of the site is the receipt, storage and shipping
of oil products
87 2,5 1 7200 1 barge with pump station
Ro-Ro SOMAT - Vidin
Intended for processing of Ro-Ro freight
130 2,5 1
42 000
Customs Free Area – Vidin
For processing of OIL PRODUCTS AND BUNKERING OF
SHIPS
75 1 1 400 1 pontoon with pump station
DDF Badin – Vidin
For processing of bulk and general freight
191 2,5 2 1
6350 0
1 pontoon; 2 elctric bridge
cranes of 10-16 tons
Ministry of Transport, Information Technology and Communications
129
The foregoing description of the quantitative parameters and the condition of the Bulgarian ports demonstrates that the National Ports System of the Republic of Bulgaria currently has a pretty dense network of Black Sea and Danube River ports. However, for a large part of the public transport ports there are a number of factors that limit their functionality, namely: The existing features of the majority of the port infrastructure (quay and logistics transhipment
handling and storage facilities) do not comply with the characteristics of individual vehicles, types of freight and demands on technology in their processing and storage.
The depth before the quays of many ports /terminals are insufficient and have limited draft/size of ships entering the port. Deepening in front of the pier over the design values of the existing structures of the piers is impossible and practically requires new construction;
For some of the older ports and especially those with regional significance, the parameters of individual port areas - storage, logistics transshipment fronts, and road links and their situational layout in relation to the quay and entrance output areas do not comply with the sizes and routes of cargo flows that are typical for commercial ports.
The port facilities built in the early part of last century in Varna (port terminal Varna - East), Burgas (port terminal Burgas - East, but also the port terminals in Ruse, Svishtov, Lom, Oryahovo and Tutracan are within the limits of the central part of the towns which creates certain problems, from environmental issues and also from architectural - construction nature. Finding the right formula and balance of state and municipal interests with the public need for new and greener urban environment requires rethinking the concept of forms for use of these territories.
The different ownership of port infrastructure for some port terminals (TPP-Varna, Petrol-Varna and Rosenets) - buildings, storage facilities, transhipment and transportation facilities raises serious dependency on their functions on the interests of the individual owners.
This leads to the low degree of reliability regarding the requirements for the existence of modern and highly efficient ports to ensure meeting the needs of port facilities and water areas with parameters corresponding to the trend for increasing size of ships.
Capacity of elements of the port infrastructure. Assessment of the level of provision of the transport services.
The main parameter for availability of services for one port (port terminal) is its capacity. The capacity of a port terminal (port) is a complex indicator and depends both on the technical and technological characteristics and capacities of all structural units composing the technological scheme for processing, as well as on so many other objective and subjective factors and conditions. The transshipment capacity under the existing conditions, the technical resources and the existing technologies are estimated at:
62,728 mln. tons freight in the sea ports and 22,472 mln. tons – for the river ports.
The capacity of ports of national and regional significance in various port areas are as follows:
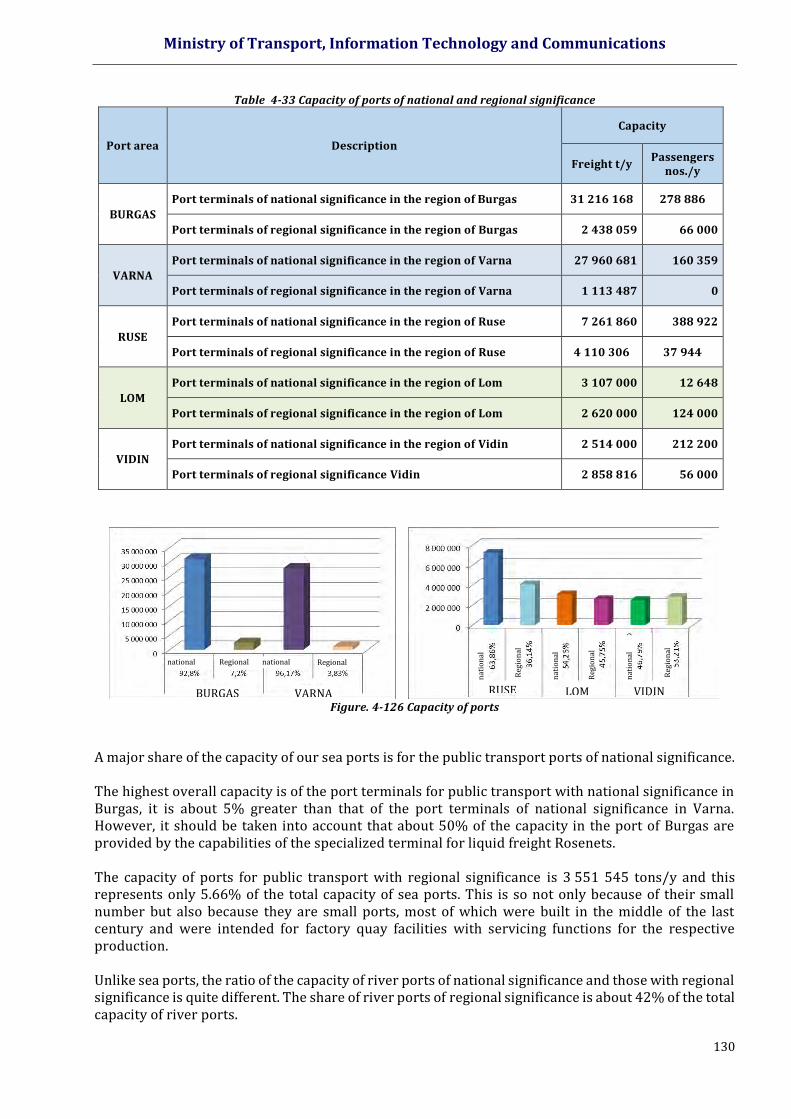
Ministry of Transport, Information Technology and Communications
130
Table 4-33 Capacity of ports of national and regional significance
Port area Description
Capacity
Freight t/y Passengers
nos./y
BURGAS
Port terminals of national significance in the region of Burgas 31 216 168 278 886
Port terminals of regional significance in the region of Burgas 2 438 059 66 000
VARNA
Port terminals of national significance in the region of Varna 27 960 681 160 359
Port terminals of regional significance in the region of Varna 1 113 487 0
RUSE
Port terminals of national significance in the region of Ruse 7 261 860 388 922
Port terminals of regional significance in the region of Ruse 4 110 306 37 944
LOM
Port terminals of national significance in the region of Lom 3 107 000 12 648
Port terminals of regional significance in the region of Lom 2 620 000 124 000
VIDIN
Port terminals of national significance in the region of Vidin 2 514 000 212 200
Port terminals of regional significance Vidin 2 858 816 56 000
Figure. 4-126 Capacity of ports
A major share of the capacity of our sea ports is for the public transport ports of national significance. The highest overall capacity is of the port terminals for public transport with national significance in Burgas, it is about 5% greater than that of the port terminals of national significance in Varna. However, it should be taken into account that about 50% of the capacity in the port of Burgas are provided by the capabilities of the specialized terminal for liquid freight Rosenets. The capacity of ports for public transport with regional significance is 3 551 545 tons/y and this represents only 5.66% of the total capacity of sea ports. This is so not only because of their small number but also because they are small ports, most of which were built in the middle of the last century and were intended for factory quay facilities with servicing functions for the respective production. Unlike sea ports, the ratio of the capacity of river ports of national significance and those with regional significance is quite different. The share of river ports of regional significance is about 42% of the total capacity of river ports.
national
Regional
national
Regional
nat
ion
al
nat
ion
al
nat
ion
al
Reg
ion
al
Reg
ion
al
Reg
ion
al
BURGAS
VARNA
RUSE
VIDIN
LOM
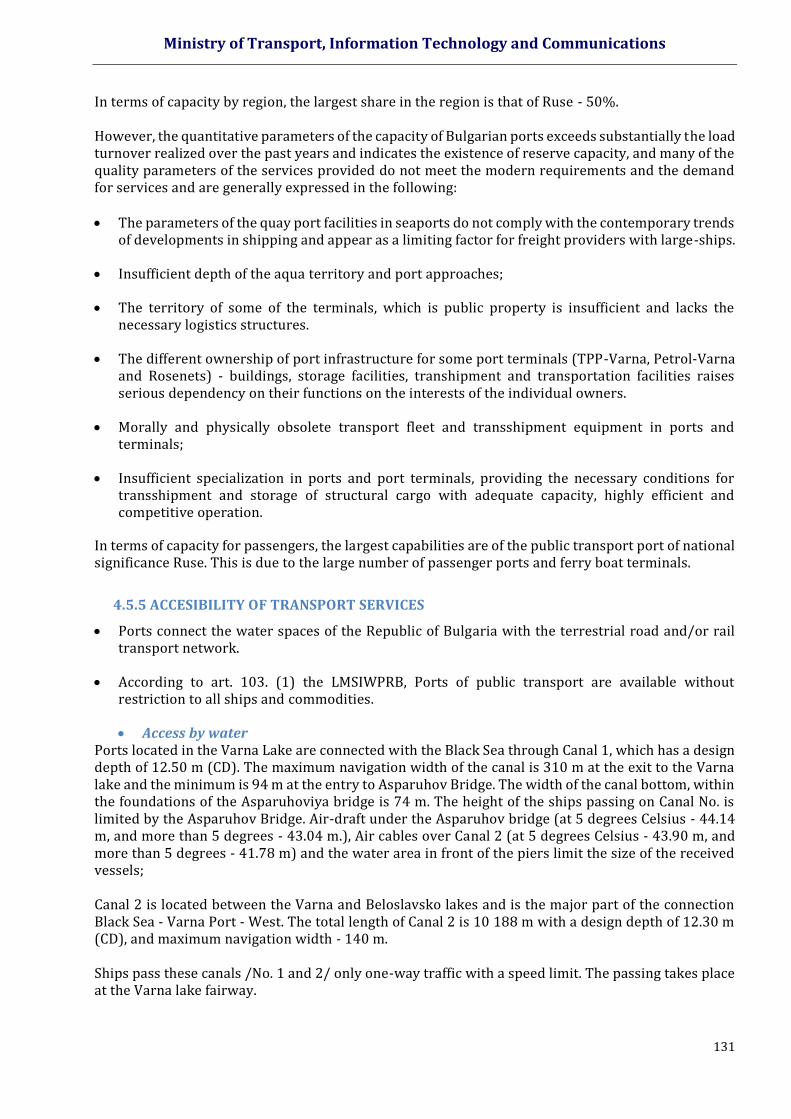
Ministry of Transport, Information Technology and Communications
131
In terms of capacity by region, the largest share in the region is that of Ruse - 50%. However, the quantitative parameters of the capacity of Bulgarian ports exceeds substantially the load turnover realized over the past years and indicates the existence of reserve capacity, and many of the quality parameters of the services provided do not meet the modern requirements and the demand for services and are generally expressed in the following: The parameters of the quay port facilities in seaports do not comply with the contemporary trends
of developments in shipping and appear as a limiting factor for freight providers with large-ships.
Insufficient depth of the aqua territory and port approaches;
The territory of some of the terminals, which is public property is insufficient and lacks the necessary logistics structures.
The different ownership of port infrastructure for some port terminals (TPP-Varna, Petrol-Varna and Rosenets) - buildings, storage facilities, transhipment and transportation facilities raises serious dependency on their functions on the interests of the individual owners.
Morally and physically obsolete transport fleet and transshipment equipment in ports and terminals;
Insufficient specialization in ports and port terminals, providing the necessary conditions for transshipment and storage of structural cargo with adequate capacity, highly efficient and competitive operation.
In terms of capacity for passengers, the largest capabilities are of the public transport port of national significance Ruse. This is due to the large number of passenger ports and ferry boat terminals.
4.5.5 ACCESIBILITY OF TRANSPORT SERVICES
Ports connect the water spaces of the Republic of Bulgaria with the terrestrial road and/or rail transport network.
According to art. 103. (1) the LMSIWPRB, Ports of public transport are available without restriction to all ships and commodities.
Access by water Ports located in the Varna Lake are connected with the Black Sea through Canal 1, which has a design depth of 12.50 m (CD). The maximum navigation width of the canal is 310 m at the exit to the Varna lake and the minimum is 94 m at the entry to Asparuhov Bridge. The width of the canal bottom, within the foundations of the Asparuhoviya bridge is 74 m. The height of the ships passing on Canal No. is limited by the Asparuhov Bridge. Air-draft under the Asparuhov bridge (at 5 degrees Celsius - 44.14 m, and more than 5 degrees - 43.04 m.), Air cables over Canal 2 (at 5 degrees Celsius - 43.90 m, and more than 5 degrees - 41.78 m) and the water area in front of the piers limit the size of the received vessels; Canal 2 is located between the Varna and Beloslavsko lakes and is the major part of the connection Black Sea - Varna Port - West. The total length of Canal 2 is 10 188 m with a design depth of 12.30 m (CD), and maximum navigation width - 140 m. Ships pass these canals /No. 1 and 2/ only one-way traffic with a speed limit. The passing takes place at the Varna lake fairway.
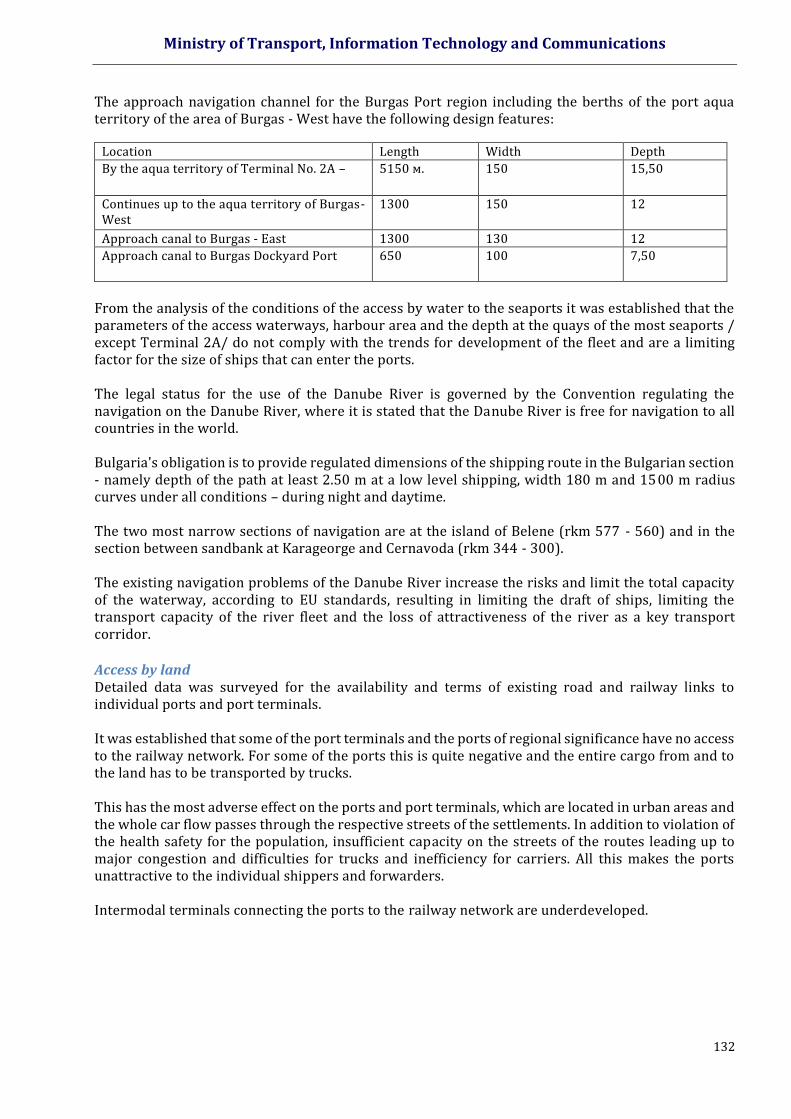
Ministry of Transport, Information Technology and Communications
132
The approach navigation channel for the Burgas Port region including the berths of the port aqua territory of the area of Burgas - West have the following design features:
Location Length Width Depth
By the aqua territory of Terminal No. 2А – 5150 м. 150 15,50
Continues up to the aqua territory of Burgas-West
1300 150 12
Approach canal to Burgas - East 1300 130 12
Approach canal to Burgas Dockyard Port 650 100 7,50
From the analysis of the conditions of the access by water to the seaports it was established that the parameters of the access waterways, harbour area and the depth at the quays of the most seaports / except Terminal 2A/ do not comply with the trends for development of the fleet and are a limiting factor for the size of ships that can enter the ports. The legal status for the use of the Danube River is governed by the Convention regulating the navigation on the Danube River, where it is stated that the Danube River is free for navigation to all countries in the world. Bulgaria's obligation is to provide regulated dimensions of the shipping route in the Bulgarian section - namely depth of the path at least 2.50 m at a low level shipping, width 180 m and 1500 m radius curves under all conditions – during night and daytime. The two most narrow sections of navigation are at the island of Belene (rkm 577 - 560) and in the section between sandbank at Karageorge and Cernavoda (rkm 344 - 300). The existing navigation problems of the Danube River increase the risks and limit the total capacity of the waterway, according to EU standards, resulting in limiting the draft of ships, limiting the transport capacity of the river fleet and the loss of attractiveness of the river as a key transport corridor.
Access by land Detailed data was surveyed for the availability and terms of existing road and railway links to individual ports and port terminals. It was established that some of the port terminals and the ports of regional significance have no access to the railway network. For some of the ports this is quite negative and the entire cargo from and to the land has to be transported by trucks. This has the most adverse effect on the ports and port terminals, which are located in urban areas and the whole car flow passes through the respective streets of the settlements. In addition to violation of the health safety for the population, insufficient capacity on the streets of the routes leading up to major congestion and difficulties for trucks and inefficiency for carriers. All this makes the ports unattractive to the individual shippers and forwarders. Intermodal terminals connecting the ports to the railway network are underdeveloped.

Ministry of Transport, Information Technology and Communications
133
4.5.6 SAFETY AND SECURITY
Resolving the problems faced by the Bulgarian port system directly or indirectly will be positive in
terms of safety and security. Investing in new projects for the development of port infrastructure, new
technology and port equipment will lead to improved security and safety for access and processing of
vehicles and the freight transported thereby, will reduce the harmful influences upon environmental
components from dust, gases and spillage of cargo (bulk, liquid and others) as well as the likelihood
of accidents.
The territorial extension and complementing of the functions of the management information system
of vessel traffic will ensure efficient and safe navigation in the sea areas. This will contribute to
achieving a sustainable transport system, increased capacity for pollution response and overall
facilitation of maritime transport. Upgrading and maintaining a system of vessel traffic management
and information services to maritime transport (VTMIS), as part of the Community system for vessel
traffic monitoring and information services (SafeSeaNet), will contribute to enhancing the safety,
security and efficiency of maritime traffic, and reduce environmental effects of pollution caused by
ships in the sea areas of the Community.
By adapting the relevant European and international practices (MarNIS, D4.1.H-Port Assesment Tool,
UK Port Safety Marine Code and others.) for performing quantitative risk assessment for Bulgarian
ports for public transport (in terms of safety environmental efficiency of port activities - processing,
waiting, administrative and logical procedures, etc.) including to maritime transport over short
distances - Short Sea Shipping, crisis management - safety and security. Based on the results of the
implementation of formalized risk assessment an opportunity to prioritize measures and planning
improvements and corresponding investments will be sought.
The main port quay machinery currently operating includes electric jib gantry cranes, which are old
(30-50 years old). There are very few modern cranes purchased. Even in the handling of container
ships mainly used jib port cranes instead of gentry specialized cranes.
In a number of ports for many years there is no purchased new quay mechanization. The main
objectives and tasks that must be met in the development of future design solutions for the
development of transport schemes and technologies in port terminals should be directed towards
technological equipment which shall be state of the art level, to meet the conditions and workload,
which in turn ensures high reliability and safety for staff and the environment, and preserving
commercial and consumer qualities of freight handling.
The negative impact on the safety and security of shipments is not only due to the poor state of
infrastructure, but also the violations of operating rules in accordance with the technical norms and
standards. The responsibility of each user, operator of transport infrastructure in terms of strict
compliance with the requirements of conformity with technical regulations and standards for its use
has great influence for the enhancement of the safety and security of the transport process.
It is necessary to have continuous monitoring of the state of the port infrastructure and its operation
- loading of stored materials and mechanization of individual storage and handling areas should not
exceed the maximum allowable values and also taking swift and adequate measures to establish the
violations that would provide a secure transport infrastructure guaranteeing the security and safety
of the transport process. Moreover, it is undisputed that a better managed strategic ports nationwide
Ministry of Transport, Information Technology and Communications
134
network has the potential to lead to savings for the processing time of cargo and passengers,
contributing and for greater economic efficiency of investments (timely performance of investments
and as a result generally optimizing the use of the network).
Maintaining the design depths in ports is crucial for the commercial use, but it is also the basis for
transport safety, avoiding emergency as "touching the bottom of the ship" or even worse "jamming".
Incidents of this kind can lead to serious consequences both for the ship itself, and for the port and
the state as a whole. In addition to the risk of damage to the hull and possible environmental damage
from pollution also it shall be taken into account the effect on the reputation of the safety of Bulgarian
ports. The damage from impaired reputation are indirect, but can be far in excess of the damage from
a particular emergency case. Part of these damages will be measured with higher insurance of visiting
ships respectively higher freight rates and general - loss of competitiveness and reduced cargo ports.
The improved navigation safety will reduce the risk of damage to the hull of the ship, accompanied by
major environmental pollution damage.
Some of the port terminals and ports of regional significance have access to the railway network. For
some of the ports is quite negative and have the entire cargo from and to the land has to be transported
by trucks. The most negative effect is for the ports and port terminals, which are located in urban
areas and around road flow passes through the respective streets of settlements that have insufficient
capacity lead up to huge traffic jams, risk of accidents and difficulties for trucks and respectively,
inefficiency for carriers.

Ministry of Transport, Information Technology and Communications
135
4.6 AIR TRANSPORT
4.6.1 PERFORMANCE AND VOLUME INDICATORS OF AIR TRANSPORT
KEY INDICATORS FOR AIR PASSENGER TRANSPORT Air transport has increasingly growing importance for travels to and from the country. The total number of passengers carried to and from the country varies between 2 200 thousand and 2 700 thousand during the period 2007 - 2015.
Table 4-34 Volume of international passenger transport carried by Bulgarian air carriers
Indicators 2007 2008 2009 2010 2011 2012 2013 2014 2015
Number of passengers carried, thousand
2237 2636 2184 2327 2693 2211 2269 2375 2240
Passenger transport operations, mln. pkm
3892 4467 3713 4275 4496 3528 3738 4023 3644
Average distance travelled per 1 passenger, km
1740 1695 1700 1837 1670 1596 1647 1694 1627
Source: NSI
The relative share of air transport in the total number of passengers transported on the national transport market remains low (about 0.3% average per year) due to the limited airport capacity and the fact that this mode of transport is applicable mainly in the segments of tourist and business travels, which are not characterized by a high frequency compared to car, bus and urban transport.
Source: NSI
Figure 4-127 Relative share of air transport in the total number of transported passengers by Bulgarian carriers
Passenger transport operations carried by air transport is characterized by minor fluctuations from year to year during the analysed period while maintaining relatively constant volumes. There is an increase in transport operations in passenger kilometres until 2011, followed by a tendency of decline and reaching levels lower than the ones in 2007. The relative share of air transport in the total volume of passenger transport, measured in passenger kilometres is a key indicator for analysing the development of this sector and its effectiveness. The data from the analysis show that this share also remains relatively constant during the period as there is an increase of 6% from 2007 to 2011, followed by a decline when in 2015 it reached back the levels of 2007.
0,350,42 0,38 0,42
0,520,42
0,50
0,34 0,31
0,00
0,20
0,40
0,60
2007 2008 2009 2010 2011 2012 2013 2014 2015
%
Relative share of air transport in the total number of transported passengers
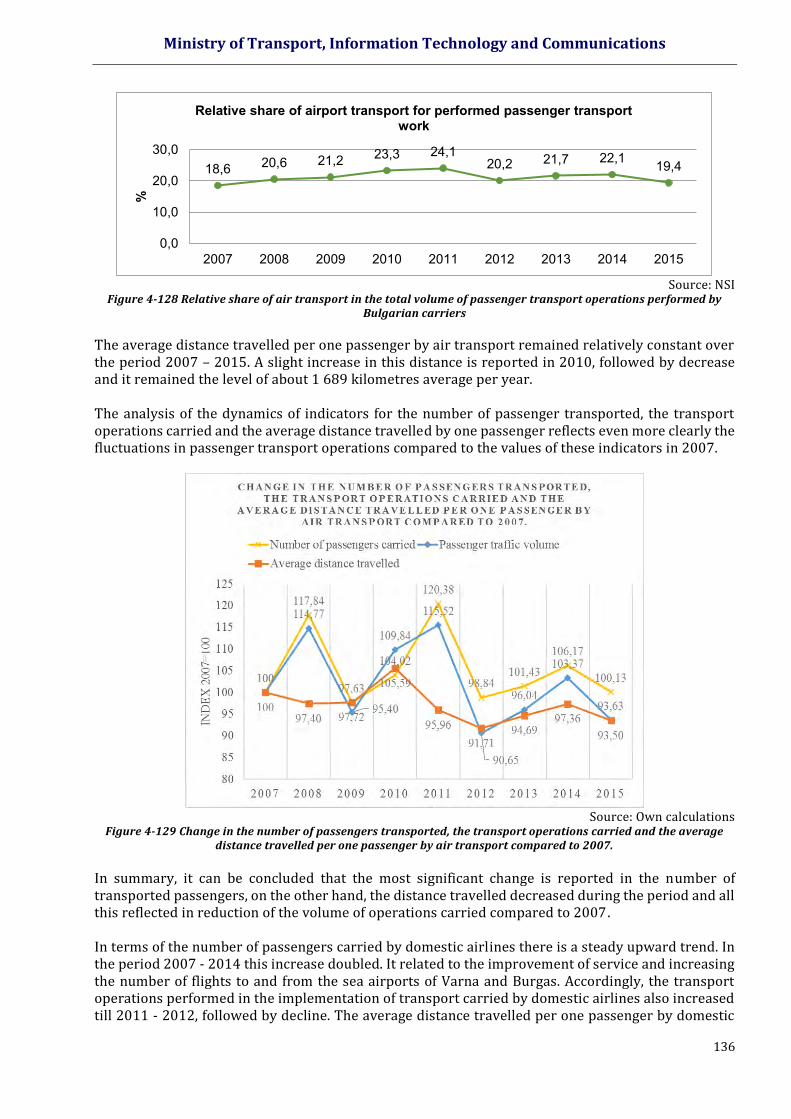
Ministry of Transport, Information Technology and Communications
136
Source: NSI
Figure 4-128 Relative share of air transport in the total volume of passenger transport operations performed by Bulgarian carriers
The average distance travelled per one passenger by air transport remained relatively constant over the period 2007 – 2015. A slight increase in this distance is reported in 2010, followed by decrease and it remained the level of about 1 689 kilometres average per year. The analysis of the dynamics of indicators for the number of passenger transported, the transport operations carried and the average distance travelled by one passenger reflects even more clearly the fluctuations in passenger transport operations compared to the values of these indicators in 2007.
Source: Own calculations
Figure 4-129 Change in the number of passengers transported, the transport operations carried and the average distance travelled per one passenger by air transport compared to 2007.
In summary, it can be concluded that the most significant change is reported in the number of transported passengers, on the other hand, the distance travelled decreased during the period and all this reflected in reduction of the volume of operations carried compared to 2007. In terms of the number of passengers carried by domestic airlines there is a steady upward trend. In the period 2007 - 2014 this increase doubled. It related to the improvement of service and increasing the number of flights to and from the sea airports of Varna and Burgas. Accordingly, the transport operations performed in the implementation of transport carried by domestic airlines also increased till 2011 - 2012, followed by decline. The average distance travelled per one passenger by domestic
18,6 20,6 21,2 23,3 24,120,2 21,7 22,1 19,4
0,0
10,0
20,0
30,0
2007 2008 2009 2010 2011 2012 2013 2014 2015
%
Relative share of airport transport for performed passenger transport work
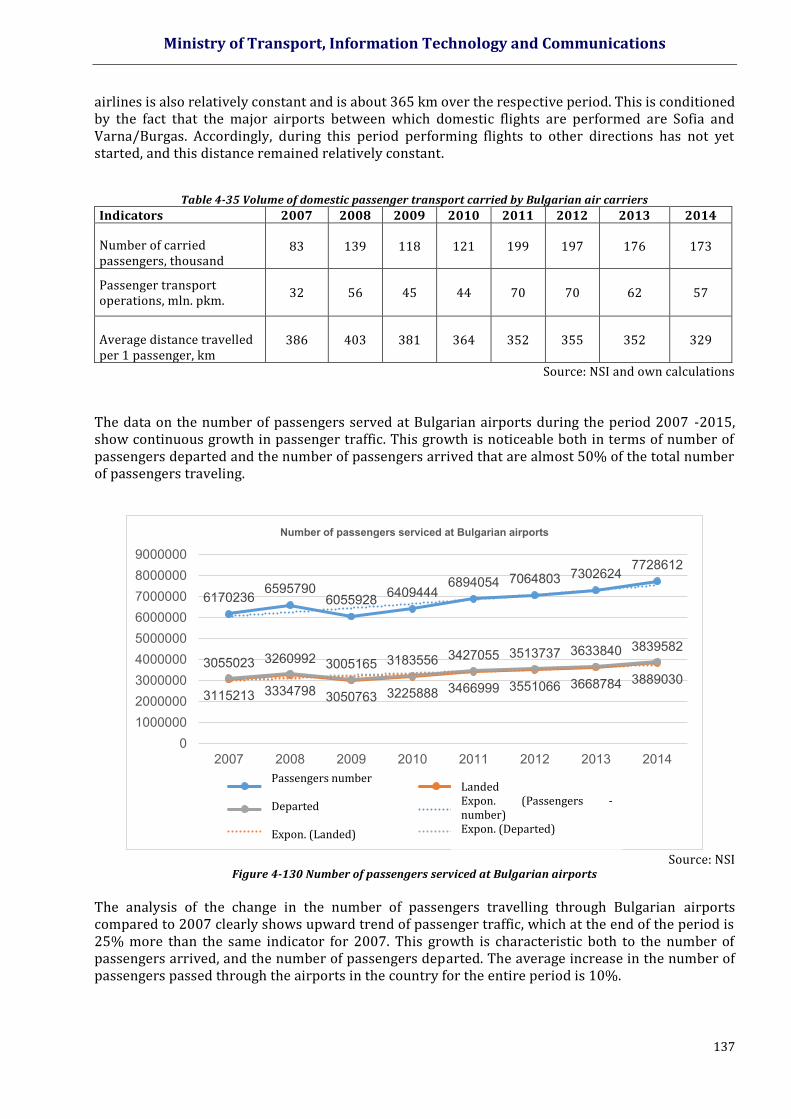
Ministry of Transport, Information Technology and Communications
137
airlines is also relatively constant and is about 365 km over the respective period. This is conditioned by the fact that the major airports between which domestic flights are performed are Sofia and Varna/Burgas. Accordingly, during this period performing flights to other directions has not yet started, and this distance remained relatively constant.
Table 4-35 Volume of domestic passenger transport carried by Bulgarian air carriers
Indicators 2007 2008 2009 2010 2011 2012 2013 2014
Number of carried passengers, thousand
83 139 118 121 199 197 176 173
Passenger transport operations, mln. pkm.
32 56 45 44 70 70 62 57
Average distance travelled per 1 passenger, km
386 403 381 364 352 355 352 329
Source: NSI and own calculations
The data on the number of passengers served at Bulgarian airports during the period 2007 -2015, show continuous growth in passenger traffic. This growth is noticeable both in terms of number of passengers departed and the number of passengers arrived that are almost 50% of the total number of passengers traveling.
Source: NSI
Figure 4-130 Number of passengers serviced at Bulgarian airports
The analysis of the change in the number of passengers travelling through Bulgarian airports compared to 2007 clearly shows upward trend of passenger traffic, which at the end of the period is 25% more than the same indicator for 2007. This growth is characteristic both to the number of passengers arrived, and the number of passengers departed. The average increase in the number of passengers passed through the airports in the country for the entire period is 10%.
6170236 65957906055928 6409444
6894054 7064803 7302624 7728612
3055023 3260992 3005165 3183556 3427055 3513737 3633840 3839582
3115213 3334798 3050763 3225888 3466999 3551066 3668784 3889030
0100000020000003000000400000050000006000000700000080000009000000
2007 2008 2009 2010 2011 2012 2013 2014
Number of passengers serviced at Bulgarian airports
Пътници - брой Кацнали
Излетели Expon. (Пътници - брой)
Expon. (Кацнали) Expon. (Излетели)
Passengers number Departed Expon. (Landed)
Landed Expon. (Passengers - number) Expon. (Departed)
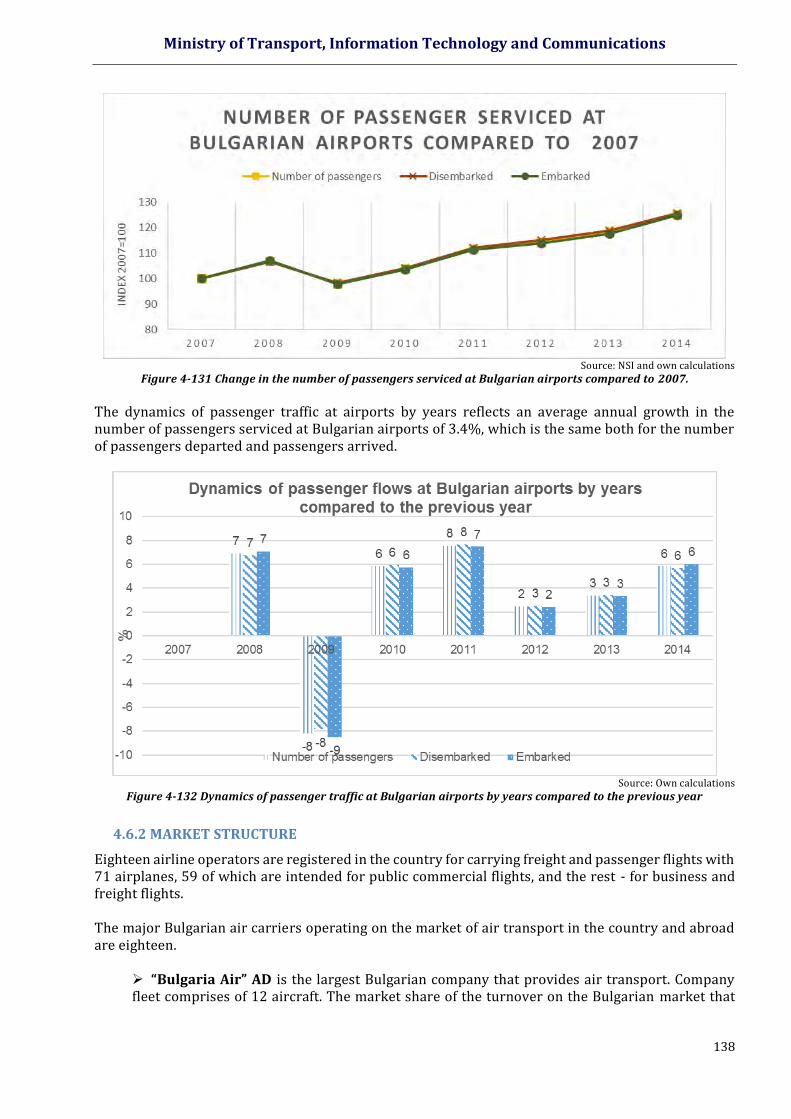
Ministry of Transport, Information Technology and Communications
138
Source: NSI and own calculations
Figure 4-131 Change in the number of passengers serviced at Bulgarian airports compared to 2007.
The dynamics of passenger traffic at airports by years reflects an average annual growth in the number of passengers serviced at Bulgarian airports of 3.4%, which is the same both for the number of passengers departed and passengers arrived.
Source: Own calculations
Figure 4-132 Dynamics of passenger traffic at Bulgarian airports by years compared to the previous year
4.6.2 MARKET STRUCTURE
Eighteen airline operators are registered in the country for carrying freight and passenger flights with 71 airplanes, 59 of which are intended for public commercial flights, and the rest - for business and freight flights. The major Bulgarian air carriers operating on the market of air transport in the country and abroad are eighteen.
“Bulgaria Air” AD is the largest Bulgarian company that provides air transport. Company fleet comprises of 12 aircraft. The market share of the turnover on the Bulgarian market that
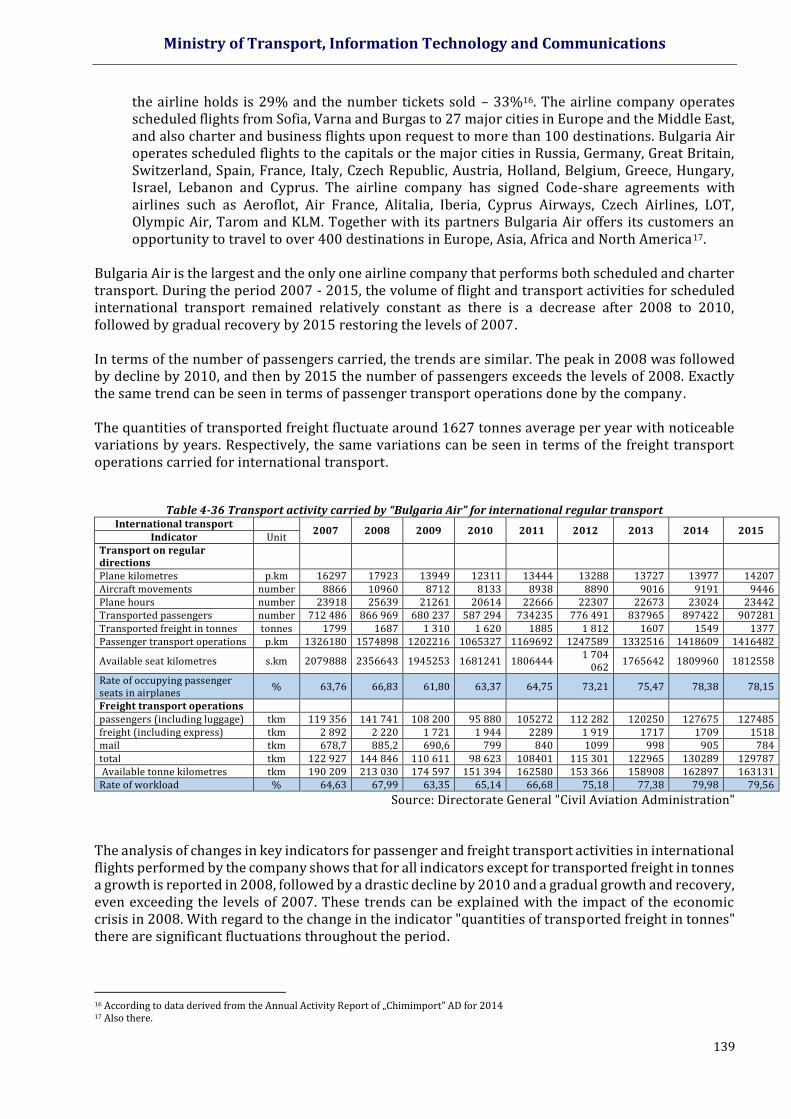
Ministry of Transport, Information Technology and Communications
139
the airline holds is 29% and the number tickets sold – 33%16. The airline company operates scheduled flights from Sofia, Varna and Burgas to 27 major cities in Europe and the Middle East, and also charter and business flights upon request to more than 100 destinations. Bulgaria Air operates scheduled flights to the capitals or the major cities in Russia, Germany, Great Britain, Switzerland, Spain, France, Italy, Czech Republic, Austria, Holland, Belgium, Greece, Hungary, Israel, Lebanon and Cyprus. The airline company has signed Code-share agreements with airlines such as Aeroflot, Air France, Alitalia, Iberia, Cyprus Airways, Czech Airlines, LOT, Olympic Air, Tarom and KLM. Together with its partners Bulgaria Air offers its customers an opportunity to travel to over 400 destinations in Europe, Asia, Africa and North America17.
Bulgaria Air is the largest and the only one airline company that performs both scheduled and charter transport. During the period 2007 - 2015, the volume of flight and transport activities for scheduled international transport remained relatively constant as there is a decrease after 2008 to 2010, followed by gradual recovery by 2015 restoring the levels of 2007. In terms of the number of passengers carried, the trends are similar. The peak in 2008 was followed by decline by 2010, and then by 2015 the number of passengers exceeds the levels of 2008. Exactly the same trend can be seen in terms of passenger transport operations done by the company. The quantities of transported freight fluctuate around 1627 tonnes average per year with noticeable variations by years. Respectively, the same variations can be seen in terms of the freight transport operations carried for international transport.
Table 4-36 Transport activity carried by “Bulgaria Air” for international regular transport
International transport 2007 2008 2009 2010 2011 2012 2013 2014 2015
Indicator Unit Transport on regular directions
Plane kilometres p.km 16297 17923 13949 12311 13444 13288 13727 13977 14207 Aircraft movements number 8866 10960 8712 8133 8938 8890 9016 9191 9446 Plane hours number 23918 25639 21261 20614 22666 22307 22673 23024 23442 Transported passengers number 712 486 866 969 680 237 587 294 734235 776 491 837965 897422 907281 Transported freight in tonnes tonnes 1799 1687 1 310 1 620 1885 1 812 1607 1549 1377 Passenger transport operations p.km 1326180 1574898 1202216 1065327 1169692 1247589 1332516 1418609 1416482
Available seat kilometres s.km 2079888 2356643 1945253 1681241 1806444 1 704
062 1765642 1809960 1812558
Rate of occupying passenger seats in airplanes
% 63,76 66,83 61,80 63,37 64,75 73,21 75,47 78,38 78,15
Freight transport operations passengers (including luggage) tkm 119 356 141 741 108 200 95 880 105272 112 282 120250 127675 127485 freight (including express) tkm 2 892 2 220 1 721 1 944 2289 1 919 1717 1709 1518 mail tkm 678,7 885,2 690,6 799 840 1099 998 905 784 total tkm 122 927 144 846 110 611 98 623 108401 115 301 122965 130289 129787 Available tonne kilometres tkm 190 209 213 030 174 597 151 394 162580 153 366 158908 162897 163131 Rate of workload % 64,63 67,99 63,35 65,14 66,68 75,18 77,38 79,98 79,56
Source: Directorate General "Civil Aviation Administration"
The analysis of changes in key indicators for passenger and freight transport activities in international flights performed by the company shows that for all indicators except for transported freight in tonnes a growth is reported in 2008, followed by a drastic decline by 2010 and a gradual growth and recovery, even exceeding the levels of 2007. These trends can be explained with the impact of the economic crisis in 2008. With regard to the change in the indicator "quantities of transported freight in tonnes" there are significant fluctuations throughout the period.
16 According to data derived from the Annual Activity Report of „Chimimport” AD for 2014 17 Also there.
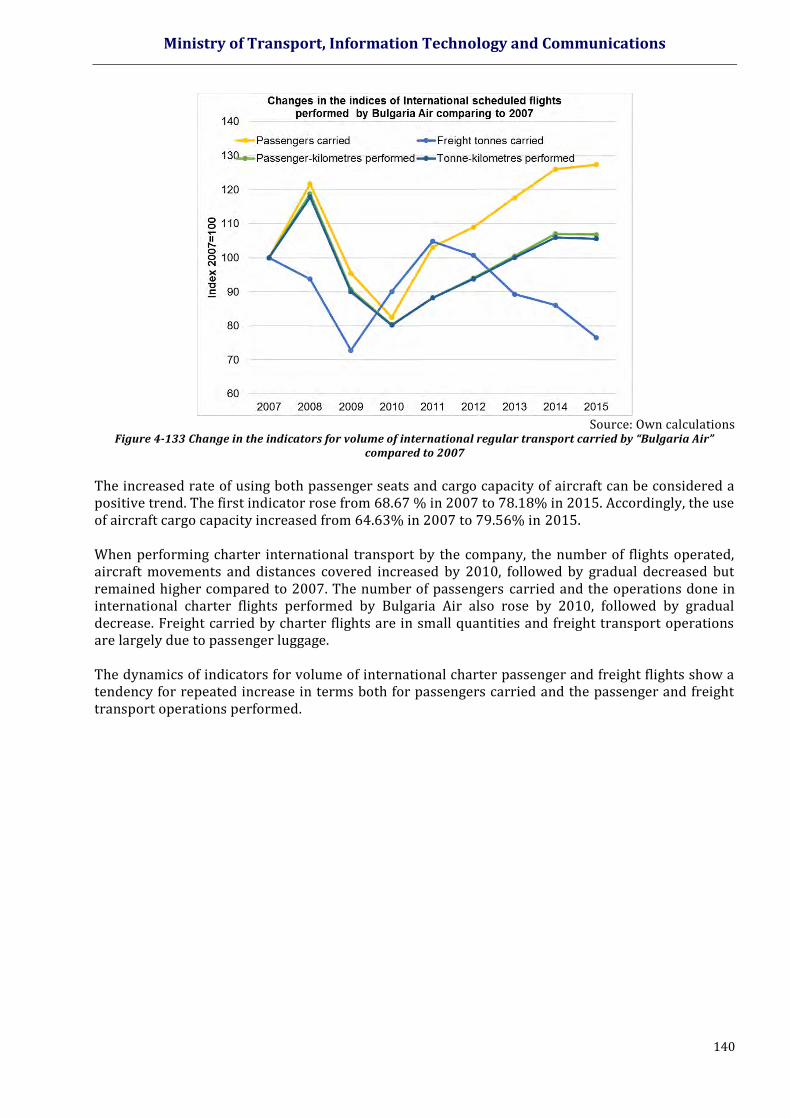
Ministry of Transport, Information Technology and Communications
140
Source: Own calculations
Figure 4-133 Change in the indicators for volume of international regular transport carried by “Bulgaria Air” compared to 2007
The increased rate of using both passenger seats and cargo capacity of aircraft can be considered a positive trend. The first indicator rose from 68.67 % in 2007 to 78.18% in 2015. Accordingly, the use of aircraft cargo capacity increased from 64.63% in 2007 to 79.56% in 2015. When performing charter international transport by the company, the number of flights operated, aircraft movements and distances covered increased by 2010, followed by gradual decreased but remained higher compared to 2007. The number of passengers carried and the operations done in international charter flights performed by Bulgaria Air also rose by 2010, followed by gradual decrease. Freight carried by charter flights are in small quantities and freight transport operations are largely due to passenger luggage. The dynamics of indicators for volume of international charter passenger and freight flights show a tendency for repeated increase in terms both for passengers carried and the passenger and freight transport operations performed.
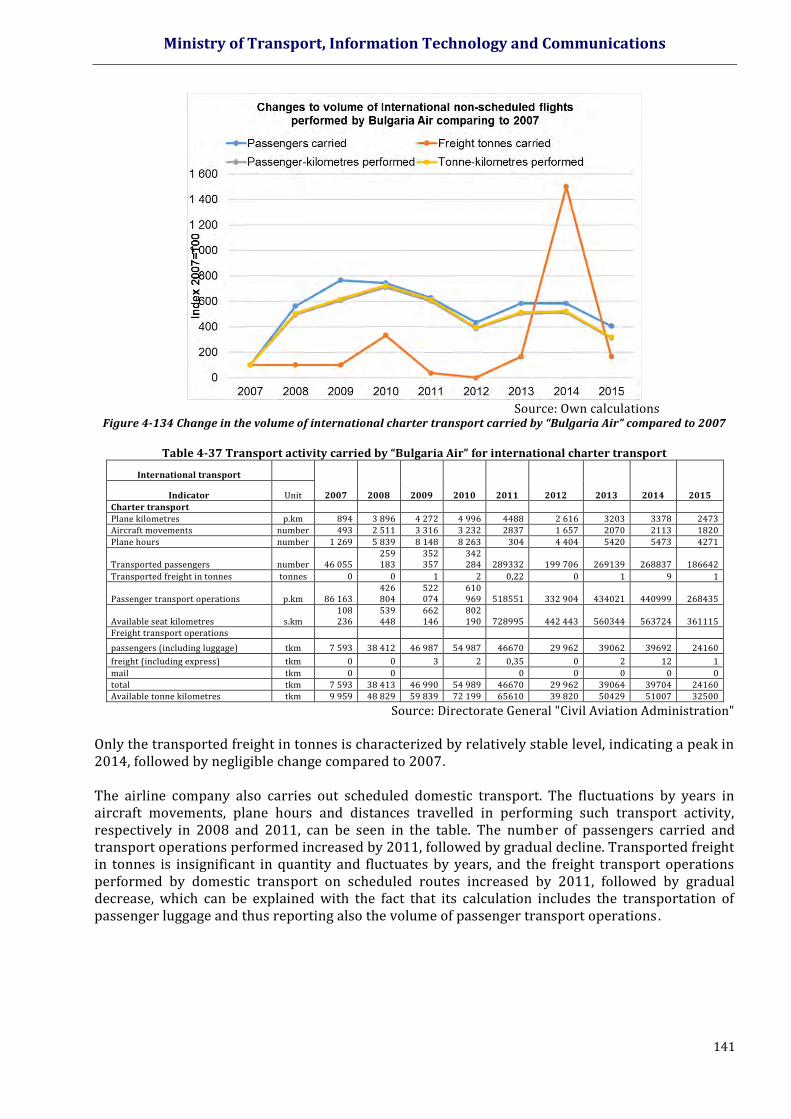
Ministry of Transport, Information Technology and Communications
141
Source: Own calculations
Figure 4-134 Change in the volume of international charter transport carried by “Bulgaria Air” compared to 2007
Table 4-37 Transport activity carried by “Bulgaria Air” for international charter transport
International transport
2007 2008 2009 2010 2011 2012 2013 2014 2015 Indicator Unit
Charter transport
Plane kilometres p.km 894 3 896 4 272 4 996 4488 2 616 3203 3378 2473 Aircraft movements number 493 2 511 3 316 3 232 2837 1 657 2070 2113 1820
Plane hours number 1 269 5 839 8 148 8 263 304 4 404 5420 5473 4271
Transported passengers number 46 055 259 183
352 357
342 284 289332 199 706 269139 268837 186642
Transported freight in tonnes tonnes 0 0 1 2 0,22 0 1 9 1
Passenger transport operations p.km 86 163 426 804
522 074
610 969 518551 332 904 434021 440999 268435
Available seat kilometres s.km 108 236
539 448
662 146
802 190 728995 442 443 560344 563724 361115
Freight transport operations
passengers (including luggage) tkm 7 593 38 412 46 987 54 987 46670 29 962 39062 39692 24160
freight (including express) tkm 0 0 3 2 0,35 0 2 12 1
mail tkm 0 0 0 0 0 0 0
total tkm 7 593 38 413 46 990 54 989 46670 29 962 39064 39704 24160 Available tonne kilometres tkm 9 959 48 829 59 839 72 199 65610 39 820 50429 51007 32500
Source: Directorate General "Civil Aviation Administration"
Only the transported freight in tonnes is characterized by relatively stable level, indicating a peak in 2014, followed by negligible change compared to 2007. The airline company also carries out scheduled domestic transport. The fluctuations by years in aircraft movements, plane hours and distances travelled in performing such transport activity, respectively in 2008 and 2011, can be seen in the table. The number of passengers carried and transport operations performed increased by 2011, followed by gradual decline. Transported freight in tonnes is insignificant in quantity and fluctuates by years, and the freight transport operations performed by domestic transport on scheduled routes increased by 2011, followed by gradual decrease, which can be explained with the fact that its calculation includes the transportation of passenger luggage and thus reporting also the volume of passenger transport operations.
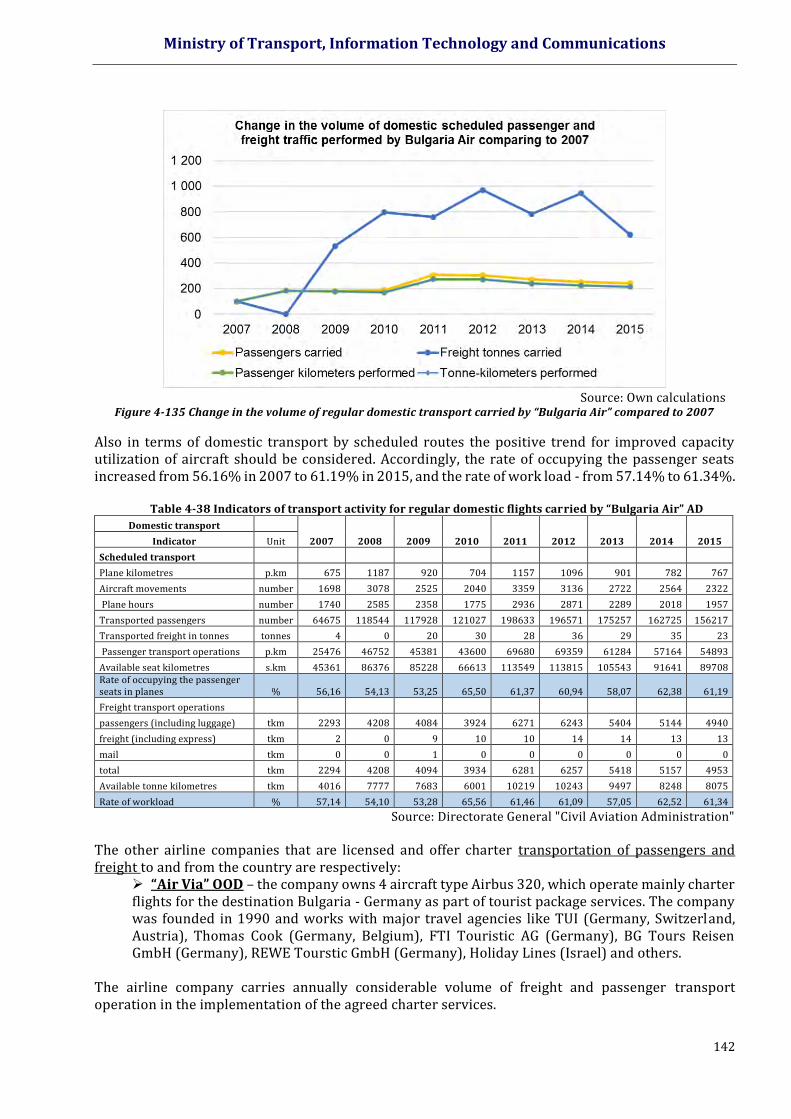
Ministry of Transport, Information Technology and Communications
142
Source: Own calculations
Figure 4-135 Change in the volume of regular domestic transport carried by “Bulgaria Air” compared to 2007
Also in terms of domestic transport by scheduled routes the positive trend for improved capacity utilization of aircraft should be considered. Accordingly, the rate of occupying the passenger seats increased from 56.16% in 2007 to 61.19% in 2015, and the rate of work load - from 57.14% to 61.34%.
Table 4-38 Indicators of transport activity for regular domestic flights carried by “Bulgaria Air” AD
Domestic transport
2007 2008 2009 2010 2011 2012 2013 2014 2015 Indicator Unit
Scheduled transport
Plane kilometres p.km 675 1187 920 704 1157 1096 901 782 767
Aircraft movements number 1698 3078 2525 2040 3359 3136 2722 2564 2322
Plane hours number 1740 2585 2358 1775 2936 2871 2289 2018 1957
Transported passengers number 64675 118544 117928 121027 198633 196571 175257 162725 156217
Transported freight in tonnes tonnes 4 0 20 30 28 36 29 35 23
Passenger transport operations p.km 25476 46752 45381 43600 69680 69359 61284 57164 54893
Available seat kilometres s.km 45361 86376 85228 66613 113549 113815 105543 91641 89708 Rate of occupying the passenger seats in planes % 56,16 54,13 53,25 65,50 61,37 60,94 58,07 62,38 61,19
Freight transport operations
passengers (including luggage) tkm 2293 4208 4084 3924 6271 6243 5404 5144 4940
freight (including express) tkm 2 0 9 10 10 14 14 13 13
mail tkm 0 0 1 0 0 0 0 0 0
total tkm 2294 4208 4094 3934 6281 6257 5418 5157 4953
Available tonne kilometres tkm 4016 7777 7683 6001 10219 10243 9497 8248 8075
Rate of workload % 57,14 54,10 53,28 65,56 61,46 61,09 57,05 62,52 61,34
Source: Directorate General "Civil Aviation Administration"
The other airline companies that are licensed and offer charter transportation of passengers and freight to and from the country are respectively:
“Air Via” OOD – the company owns 4 aircraft type Airbus 320, which operate mainly charter flights for the destination Bulgaria - Germany as part of tourist package services. The company was founded in 1990 and works with major travel agencies like TUI (Germany, Switzerland, Austria), Thomas Cook (Germany, Belgium), FTI Touristic AG (Germany), BG Tours Reisen GmbH (Germany), REWE Tourstic GmbH (Germany), Holiday Lines (Israel) and others.
The airline company carries annually considerable volume of freight and passenger transport operation in the implementation of the agreed charter services.
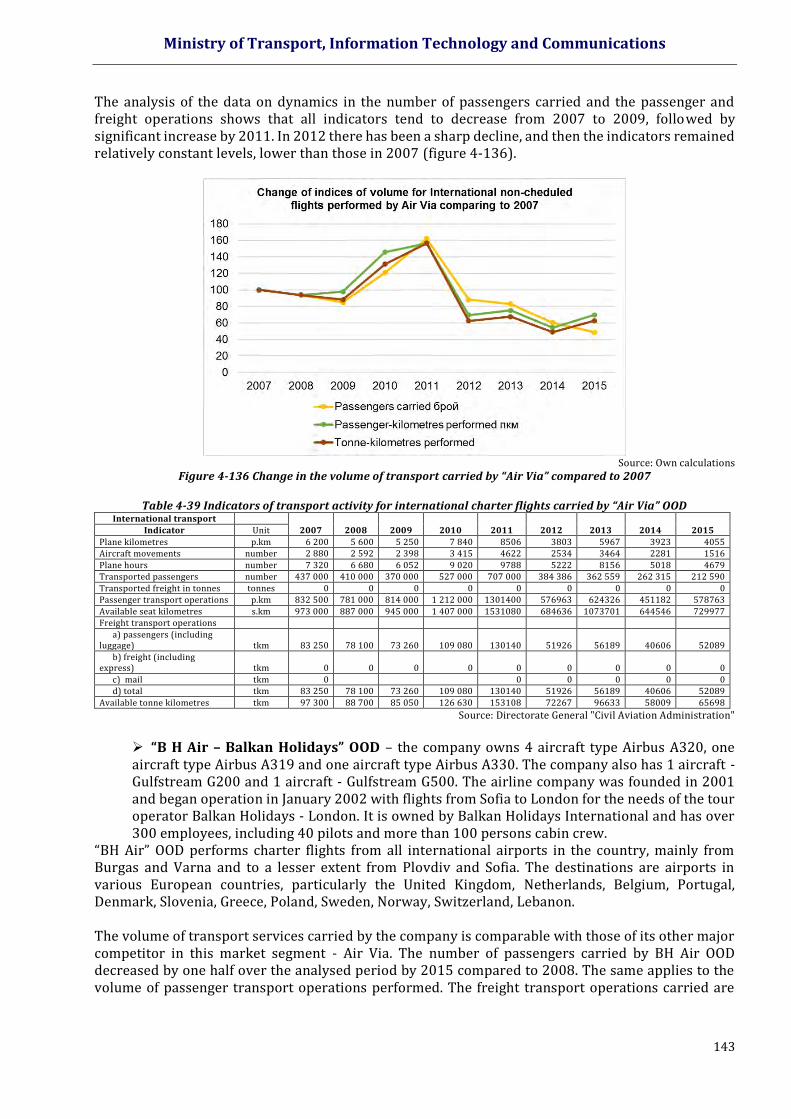
Ministry of Transport, Information Technology and Communications
143
The analysis of the data on dynamics in the number of passengers carried and the passenger and freight operations shows that all indicators tend to decrease from 2007 to 2009, followed by significant increase by 2011. In 2012 there has been a sharp decline, and then the indicators remained relatively constant levels, lower than those in 2007 (figure 4-136).
Source: Own calculations
Figure 4-136 Change in the volume of transport carried by “Air Via” compared to 2007
Table 4-39 Indicators of transport activity for international charter flights carried by “Air Via” OOD
International transport
2007 2008 2009 2010 2011 2012 2013 2014 2015 Indicator Unit
Plane kilometres p.km 6 200 5 600 5 250 7 840 8506 3803 5967 3923 4055 Aircraft movements number 2 880 2 592 2 398 3 415 4622 2534 3464 2281 1516
Plane hours number 7 320 6 680 6 052 9 020 9788 5222 8156 5018 4679 Transported passengers number 437 000 410 000 370 000 527 000 707 000 384 386 362 559 262 315 212 590
Transported freight in tonnes tonnes 0 0 0 0 0 0 0 0 0 Passenger transport operations p.km 832 500 781 000 814 000 1 212 000 1301400 576963 624326 451182 578763
Available seat kilometres s.km 973 000 887 000 945 000 1 407 000 1531080 684636 1073701 644546 729977 Freight transport operations
a) passengers (including luggage) tkm 83 250 78 100 73 260 109 080 130140 51926 56189 40606 52089
b) freight (including express) tkm 0 0 0 0 0 0 0 0 0
c) mail tkm 0 0 0 0 0 0 d) total tkm 83 250 78 100 73 260 109 080 130140 51926 56189 40606 52089
Available tonne kilometres tkm 97 300 88 700 85 050 126 630 153108 72267 96633 58009 65698
Source: Directorate General "Civil Aviation Administration"
“B H Air – Balkan Holidays” ООD – the company owns 4 aircraft type Airbus A320, one aircraft type Airbus A319 and one aircraft type Airbus A330. The company also has 1 aircraft - Gulfstream G200 and 1 aircraft - Gulfstream G500. The airline company was founded in 2001 and began operation in January 2002 with flights from Sofia to London for the needs of the tour operator Balkan Holidays - London. It is owned by Balkan Holidays International and has over 300 employees, including 40 pilots and more than 100 persons cabin crew.
“BH Air” OOD performs charter flights from all international airports in the country, mainly from Burgas and Varna and to a lesser extent from Plovdiv and Sofia. The destinations are airports in various European countries, particularly the United Kingdom, Netherlands, Belgium, Portugal, Denmark, Slovenia, Greece, Poland, Sweden, Norway, Switzerland, Lebanon. The volume of transport services carried by the company is comparable with those of its other major competitor in this market segment - Air Via. The number of passengers carried by BH Air OOD decreased by one half over the analysed period by 2015 compared to 2008. The same applies to the volume of passenger transport operations performed. The freight transport operations carried are
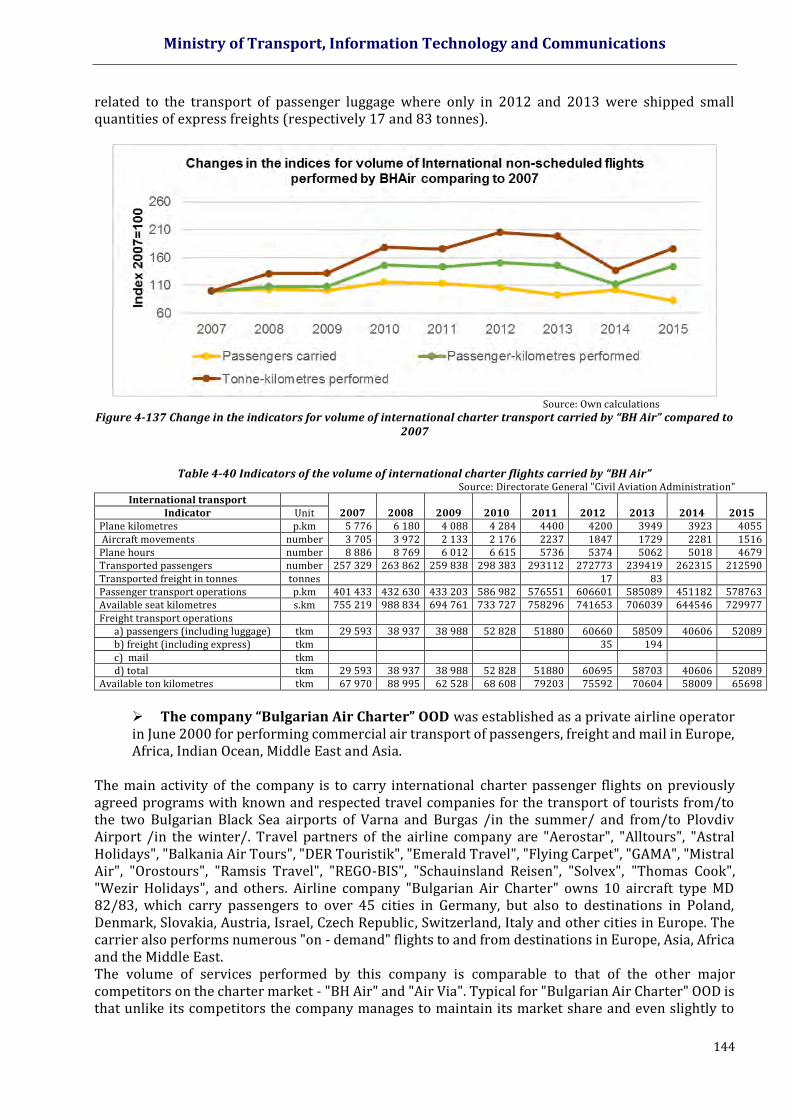
Ministry of Transport, Information Technology and Communications
144
related to the transport of passenger luggage where only in 2012 and 2013 were shipped small quantities of express freights (respectively 17 and 83 tonnes).
Source: Own calculations
Figure 4-137 Change in the indicators for volume of international charter transport carried by “BH Air” compared to 2007
Table 4-40 Indicators of the volume of international charter flights carried by “BH Air” Source: Directorate General "Civil Aviation Administration"
International transport 2007 2008 2009 2010 2011 2012 2013 2014 2015 Indicator Unit
Plane kilometres p.km 5 776 6 180 4 088 4 284 4400 4200 3949 3923 4055 Aircraft movements number 3 705 3 972 2 133 2 176 2237 1847 1729 2281 1516 Plane hours number 8 886 8 769 6 012 6 615 5736 5374 5062 5018 4679 Transported passengers number 257 329 263 862 259 838 298 383 293112 272773 239419 262315 212590 Transported freight in tonnes tonnes 17 83 Passenger transport operations p.km 401 433 432 630 433 203 586 982 576551 606601 585089 451182 578763 Available seat kilometres s.km 755 219 988 834 694 761 733 727 758296 741653 706039 644546 729977 Freight transport operations a) passengers (including luggage) tkm 29 593 38 937 38 988 52 828 51880 60660 58509 40606 52089 b) freight (including express) tkm 35 194 c) mail tkm d) total tkm 29 593 38 937 38 988 52 828 51880 60695 58703 40606 52089 Available ton kilometres tkm 67 970 88 995 62 528 68 608 79203 75592 70604 58009 65698
The company “Bulgarian Air Charter” OOD was established as a private airline operator in June 2000 for performing commercial air transport of passengers, freight and mail in Europe, Africa, Indian Ocean, Middle East and Asia.
The main activity of the company is to carry international charter passenger flights on previously agreed programs with known and respected travel companies for the transport of tourists from/to the two Bulgarian Black Sea airports of Varna and Burgas /in the summer/ and from/to Plovdiv Airport /in the winter/. Travel partners of the airline company are "Aerostar", "Alltours", "Astral Holidays", "Balkania Air Tours", "DER Touristik", "Emerald Travel", "Flying Carpet", "GAMA", "Mistral Air", "Orostours", "Ramsis Travel", "REGO-BIS", "Schauinsland Reisen", "Solvex", "Thomas Cook", "Wezir Holidays", and others. Airline company "Bulgarian Air Charter" owns 10 aircraft type MD 82/83, which carry passengers to over 45 cities in Germany, but also to destinations in Poland, Denmark, Slovakia, Austria, Israel, Czech Republic, Switzerland, Italy and other cities in Europe. The carrier also performs numerous "on - demand" flights to and from destinations in Europe, Asia, Africa and the Middle East. The volume of services performed by this company is comparable to that of the other major competitors on the charter market - "BH Air" and "Air Via". Typical for "Bulgarian Air Charter" OOD is that unlike its competitors the company manages to maintain its market share and even slightly to
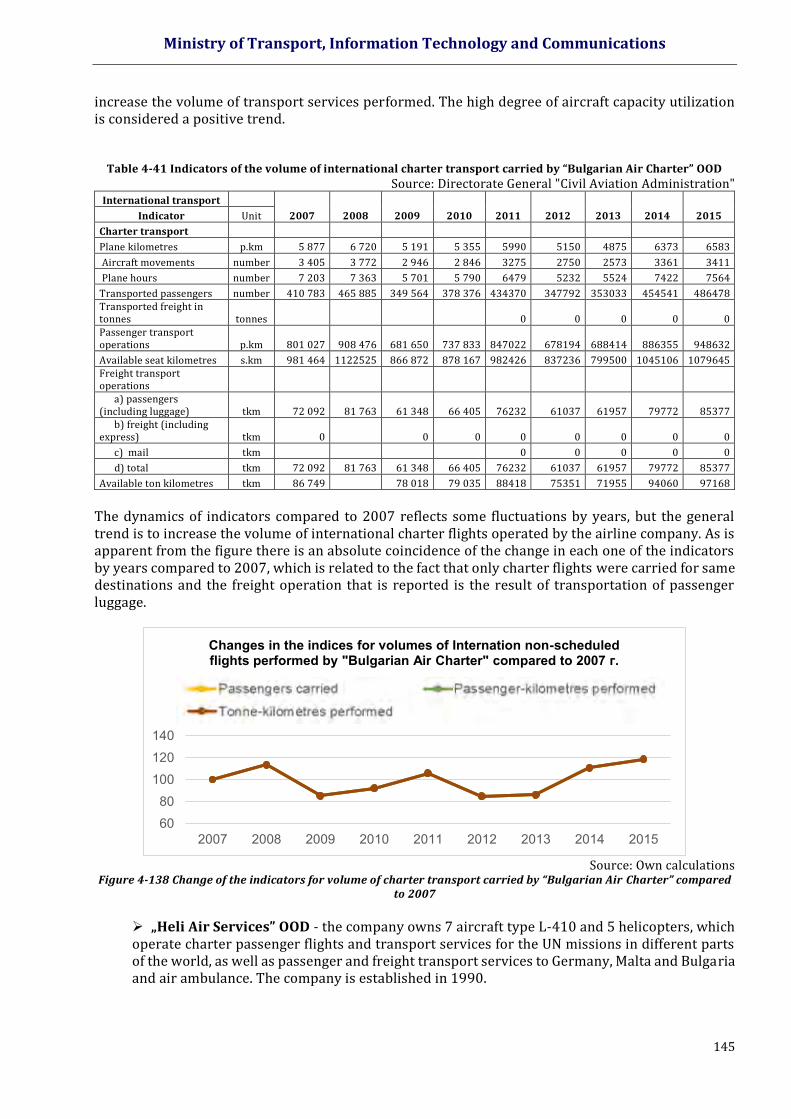
Ministry of Transport, Information Technology and Communications
145
increase the volume of transport services performed. The high degree of aircraft capacity utilization is considered a positive trend.
Table 4-41 Indicators of the volume of international charter transport carried by “Bulgarian Air Charter” OOD
Source: Directorate General "Civil Aviation Administration" International transport
2007 2008 2009 2010 2011 2012 2013 2014 2015 Indicator Unit
Charter transport
Plane kilometres p.km 5 877 6 720 5 191 5 355 5990 5150 4875 6373 6583
Aircraft movements number 3 405 3 772 2 946 2 846 3275 2750 2573 3361 3411
Plane hours number 7 203 7 363 5 701 5 790 6479 5232 5524 7422 7564
Transported passengers number 410 783 465 885 349 564 378 376 434370 347792 353033 454541 486478 Transported freight in tonnes tonnes 0 0 0 0 0 Passenger transport operations p.km 801 027 908 476 681 650 737 833 847022 678194 688414 886355 948632
Available seat kilometres s.km 981 464 1122525 866 872 878 167 982426 837236 799500 1045106 1079645 Freight transport operations a) passengers (including luggage) tkm 72 092 81 763 61 348 66 405 76232 61037 61957 79772 85377 b) freight (including express) tkm 0 0 0 0 0 0 0 0
c) mail tkm 0 0 0 0 0
d) total tkm 72 092 81 763 61 348 66 405 76232 61037 61957 79772 85377
Available ton kilometres tkm 86 749 78 018 79 035 88418 75351 71955 94060 97168
The dynamics of indicators compared to 2007 reflects some fluctuations by years, but the general trend is to increase the volume of international charter flights operated by the airline company. As is apparent from the figure there is an absolute coincidence of the change in each one of the indicators by years compared to 2007, which is related to the fact that only charter flights were carried for same destinations and the freight operation that is reported is the result of transportation of passenger luggage.
Source: Own calculations
Figure 4-138 Change of the indicators for volume of charter transport carried by “Bulgarian Air Charter” compared to 2007
„Heli Air Services” OOD - the company owns 7 aircraft type L-410 and 5 helicopters, which operate charter passenger flights and transport services for the UN missions in different parts of the world, as well as passenger and freight transport services to Germany, Malta and Bulgaria and air ambulance. The company is established in 1990.
6080
100120140
2007 2008 2009 2010 2011 2012 2013 2014 2015
Changes in the indices for volumes of Internation non-scheduled flights performed by "Bulgarian Air Charter" compared to 2007 г.
Превозени пътници брой Пътническа превозна работа пкм
Товарна превозна работа
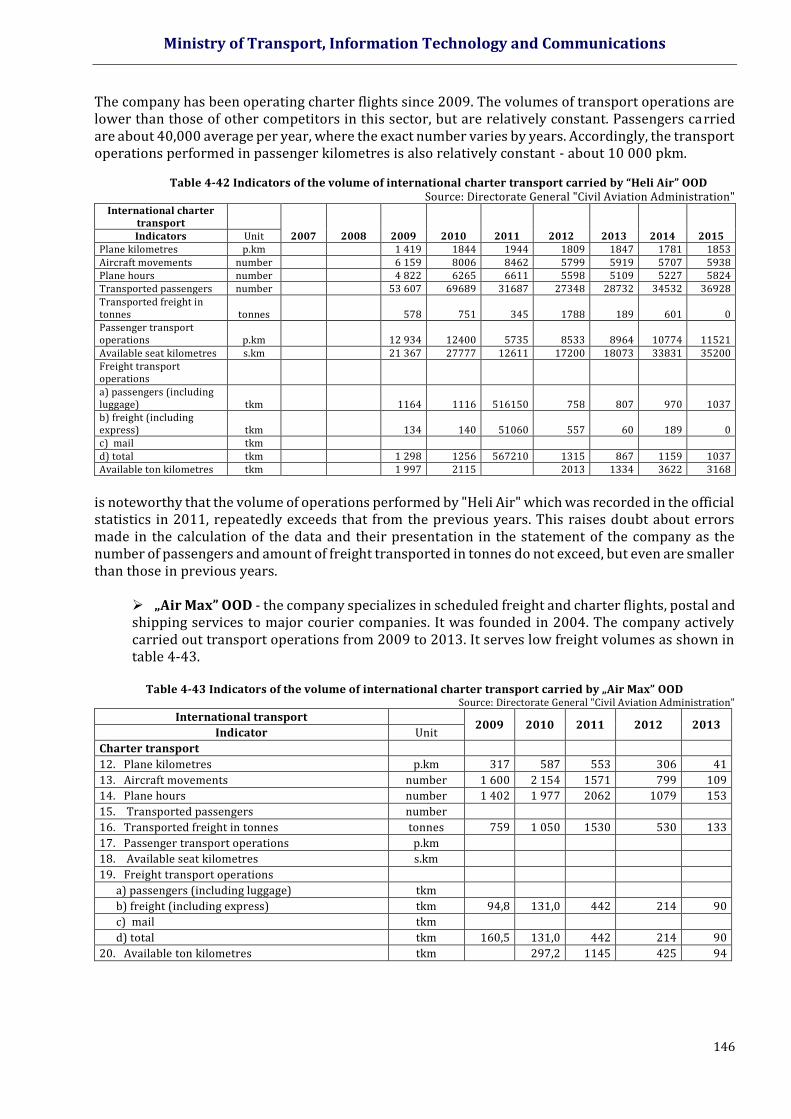
Ministry of Transport, Information Technology and Communications
146
The company has been operating charter flights since 2009. The volumes of transport operations are lower than those of other competitors in this sector, but are relatively constant. Passengers carried are about 40,000 average per year, where the exact number varies by years. Accordingly, the transport operations performed in passenger kilometres is also relatively constant - about 10 000 pkm.
Table 4-42 Indicators of the volume of international charter transport carried by “Heli Air” ООD
Source: Directorate General "Civil Aviation Administration" International charter
transport 2007 2008 2009 2010 2011 2012 2013 2014 2015 Indicators Unit
Plane kilometres p.km 1 419 1844 1944 1809 1847 1781 1853 Aircraft movements number 6 159 8006 8462 5799 5919 5707 5938 Plane hours number 4 822 6265 6611 5598 5109 5227 5824 Transported passengers number 53 607 69689 31687 27348 28732 34532 36928 Transported freight in tonnes tonnes 578 751 345 1788 189 601 0 Passenger transport operations p.km 12 934 12400 5735 8533 8964 10774 11521 Available seat kilometres s.km 21 367 27777 12611 17200 18073 33831 35200 Freight transport operations a) passengers (including luggage) tkm 1164 1116 516150 758 807 970 1037 b) freight (including express) tkm 134 140 51060 557 60 189 0 c) mail tkm d) total tkm 1 298 1256 567210 1315 867 1159 1037 Available ton kilometres tkm 1 997 2115 2013 1334 3622 3168
is noteworthy that the volume of operations performed by "Heli Air" which was recorded in the official statistics in 2011, repeatedly exceeds that from the previous years. This raises doubt about errors made in the calculation of the data and their presentation in the statement of the company as the number of passengers and amount of freight transported in tonnes do not exceed, but even are smaller than those in previous years.
„Air Max” OOD - the company specializes in scheduled freight and charter flights, postal and shipping services to major courier companies. It was founded in 2004. The company actively carried out transport operations from 2009 to 2013. It serves low freight volumes as shown in table 4-43.
Table 4-43 Indicators of the volume of international charter transport carried by „Air Max” ООD
Source: Directorate General "Civil Aviation Administration"
International transport 2009 2010 2011 2012 2013
Indicator Unit
Charter transport
12. Plane kilometres p.km 317 587 553 306 41
13. Aircraft movements number 1 600 2 154 1571 799 109
14. Plane hours number 1 402 1 977 2062 1079 153
15. Transported passengers number
16. Transported freight in tonnes tonnes 759 1 050 1530 530 133
17. Passenger transport operations p.km
18. Available seat kilometres s.km
19. Freight transport operations
a) passengers (including luggage) tkm
b) freight (including express) tkm 94,8 131,0 442 214 90
c) mail tkm
d) total tkm 160,5 131,0 442 214 90
20. Available ton kilometres tkm 297,2 1145 425 94
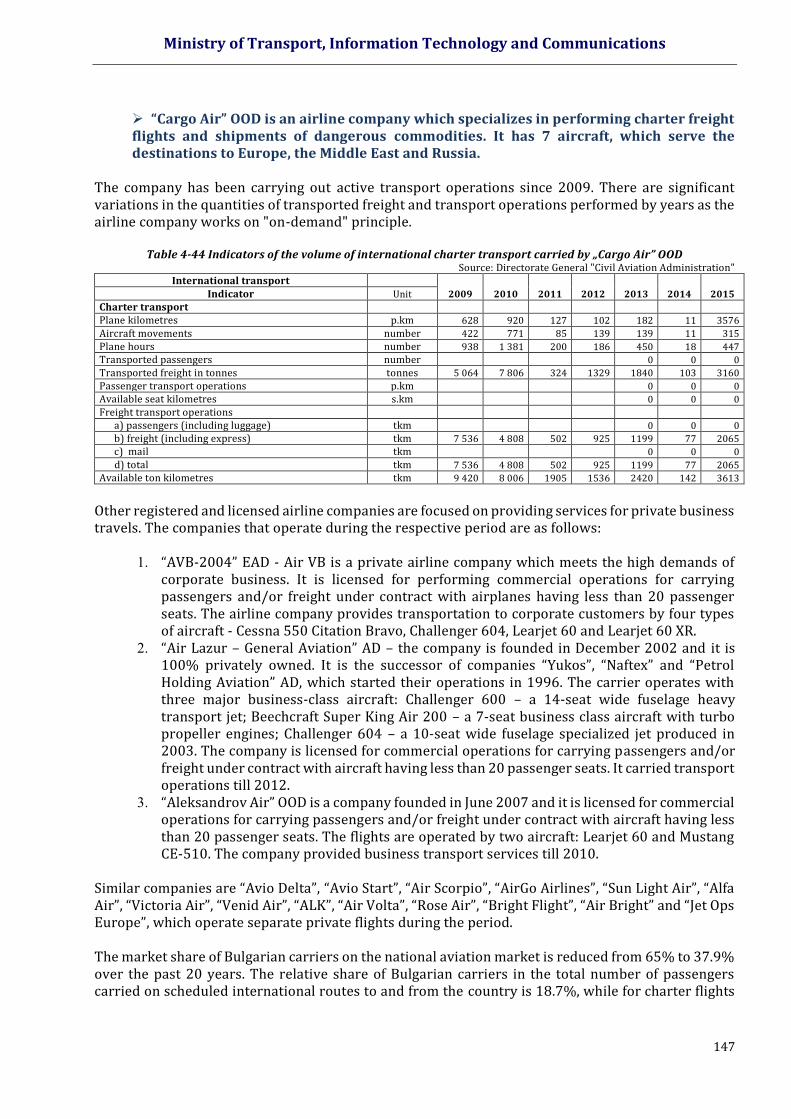
Ministry of Transport, Information Technology and Communications
147
“Cargo Air” OOD is an airline company which specializes in performing charter freight flights and shipments of dangerous commodities. It has 7 aircraft, which serve the destinations to Europe, the Middle East and Russia.
The company has been carrying out active transport operations since 2009. There are significant variations in the quantities of transported freight and transport operations performed by years as the airline company works on "on-demand" principle.
Table 4-44 Indicators of the volume of international charter transport carried by „Cargo Air” ООD Source: Directorate General "Civil Aviation Administration"
International transport
2009 2010 2011 2012 2013 2014 2015 Indicator Unit
Charter transport
Plane kilometres p.km 628 920 127 102 182 11 3576
Aircraft movements number 422 771 85 139 139 11 315
Plane hours number 938 1 381 200 186 450 18 447
Transported passengers number 0 0 0
Transported freight in tonnes tonnes 5 064 7 806 324 1329 1840 103 3160
Passenger transport operations p.km 0 0 0
Available seat kilometres s.km 0 0 0
Freight transport operations
a) passengers (including luggage) tkm 0 0 0
b) freight (including express) tkm 7 536 4 808 502 925 1199 77 2065
c) mail tkm 0 0 0
d) total tkm 7 536 4 808 502 925 1199 77 2065
Available ton kilometres tkm 9 420 8 006 1905 1536 2420 142 3613
Other registered and licensed airline companies are focused on providing services for private business travels. The companies that operate during the respective period are as follows:
1. “AVB-2004” EAD - Air VB is a private airline company which meets the high demands of corporate business. It is licensed for performing commercial operations for carrying passengers and/or freight under contract with airplanes having less than 20 passenger seats. The airline company provides transportation to corporate customers by four types of aircraft - Cessna 550 Citation Bravo, Challenger 604, Learjet 60 and Learjet 60 XR.
2. “Air Lazur – General Aviation” AD – the company is founded in December 2002 and it is 100% privately owned. It is the successor of companies “Yukos”, “Naftex” and “Petrol Holding Aviation” AD, which started their operations in 1996. The carrier operates with three major business-class aircraft: Challenger 600 – a 14-seat wide fuselage heavy transport jet; Beechcraft Super King Air 200 – a 7-seat business class aircraft with turbo propeller engines; Challenger 604 – a 10-seat wide fuselage specialized jet produced in 2003. The company is licensed for commercial operations for carrying passengers and/or freight under contract with aircraft having less than 20 passenger seats. It carried transport operations till 2012.
3. “Aleksandrov Air” OOD is a company founded in June 2007 and it is licensed for commercial operations for carrying passengers and/or freight under contract with aircraft having less than 20 passenger seats. The flights are operated by two aircraft: Learjet 60 and Mustang CE-510. The company provided business transport services till 2010.
Similar companies are “Avio Delta”, “Avio Start”, “Air Scorpio”, “AirGo Airlines”, “Sun Light Air”, “Alfa Air”, “Victoria Air”, “Venid Air”, “ALK”, “Air Volta”, “Rose Air”, “Bright Flight”, “Air Bright” and “Jet Ops Europe”, which operate separate private flights during the period. The market share of Bulgarian carriers on the national aviation market is reduced from 65% to 37.9% over the past 20 years. The relative share of Bulgarian carriers in the total number of passengers carried on scheduled international routes to and from the country is 18.7%, while for charter flights
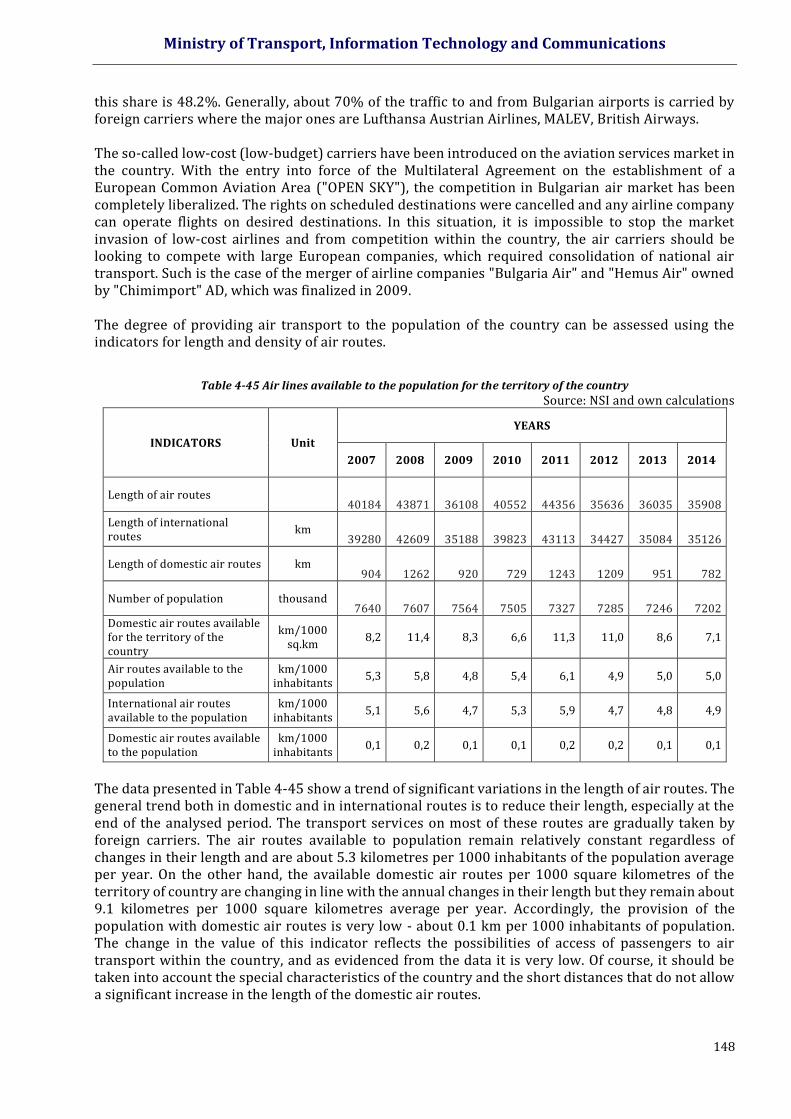
Ministry of Transport, Information Technology and Communications
148
this share is 48.2%. Generally, about 70% of the traffic to and from Bulgarian airports is carried by foreign carriers where the major ones are Lufthansa Austrian Airlines, MALEV, British Airways. The so-called low-cost (low-budget) carriers have been introduced on the aviation services market in the country. With the entry into force of the Multilateral Agreement on the establishment of a European Common Aviation Area ("OPEN SKY"), the competition in Bulgarian air market has been completely liberalized. The rights on scheduled destinations were cancelled and any airline company can operate flights on desired destinations. In this situation, it is impossible to stop the market invasion of low-cost airlines and from competition within the country, the air carriers should be looking to compete with large European companies, which required consolidation of national air transport. Such is the case of the merger of airline companies "Bulgaria Air" and "Hemus Air" owned by "Chimimport" AD, which was finalized in 2009. The degree of providing air transport to the population of the country can be assessed using the indicators for length and density of air routes.
Table 4-45 Air lines available to the population for the territory of the country
Source: NSI and own calculations
INDICATORS Unit
YEARS
2007 2008 2009 2010 2011 2012 2013 2014
Length of air routes 40184 43871 36108 40552 44356 35636 36035 35908
Length of international routes
km 39280 42609 35188 39823 43113 34427 35084 35126
Length of domestic air routes km 904 1262 920 729 1243 1209 951 782
Number of population thousand 7640 7607 7564 7505 7327 7285 7246 7202
Domestic air routes available for the territory of the country
km/1000 sq.km
8,2 11,4 8,3 6,6 11,3 11,0 8,6 7,1
Air routes available to the population
km/1000 inhabitants
5,3 5,8 4,8 5,4 6,1 4,9 5,0 5,0
International air routes available to the population
km/1000 inhabitants
5,1 5,6 4,7 5,3 5,9 4,7 4,8 4,9
Domestic air routes available to the population
km/1000 inhabitants
0,1 0,2 0,1 0,1 0,2 0,2 0,1 0,1
The data presented in Table 4-45 show a trend of significant variations in the length of air routes. The general trend both in domestic and in international routes is to reduce their length, especially at the end of the analysed period. The transport services on most of these routes are gradually taken by foreign carriers. The air routes available to population remain relatively constant regardless of changes in their length and are about 5.3 kilometres per 1000 inhabitants of the population average per year. On the other hand, the available domestic air routes per 1000 square kilometres of the territory of country are changing in line with the annual changes in their length but they remain about 9.1 kilometres per 1000 square kilometres average per year. Accordingly, the provision of the population with domestic air routes is very low - about 0.1 km per 1000 inhabitants of population. The change in the value of this indicator reflects the possibilities of access of passengers to air transport within the country, and as evidenced from the data it is very low. Of course, it should be taken into account the special characteristics of the country and the short distances that do not allow a significant increase in the length of the domestic air routes.
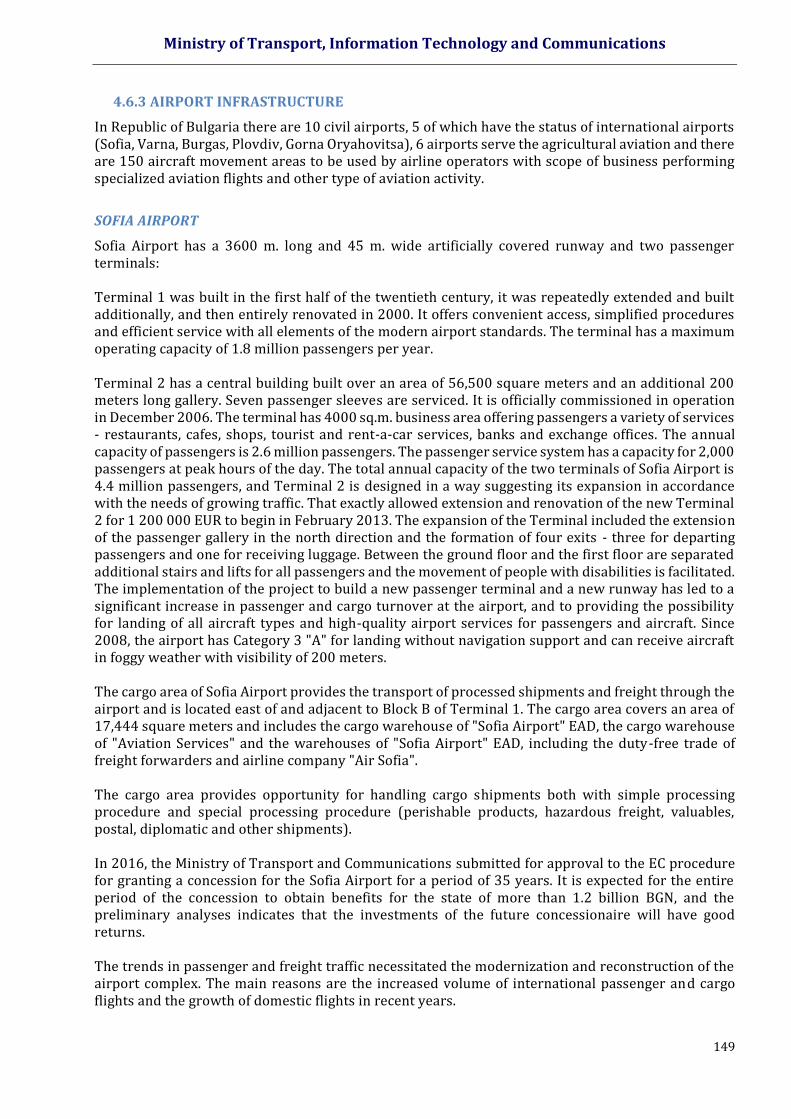
Ministry of Transport, Information Technology and Communications
149
4.6.3 AIRPORT INFRASTRUCTURE
In Republic of Bulgaria there are 10 civil airports, 5 of which have the status of international airports (Sofia, Varna, Burgas, Plovdiv, Gorna Oryahovitsa), 6 airports serve the agricultural aviation and there are 150 aircraft movement areas to be used by airline operators with scope of business performing specialized aviation flights and other type of aviation activity.
SOFIA AIRPORT
Sofia Airport has a 3600 m. long and 45 m. wide artificially covered runway and two passenger terminals: Terminal 1 was built in the first half of the twentieth century, it was repeatedly extended and built additionally, and then entirely renovated in 2000. It offers convenient access, simplified procedures and efficient service with all elements of the modern airport standards. The terminal has a maximum operating capacity of 1.8 million passengers per year. Terminal 2 has a central building built over an area of 56,500 square meters and an additional 200 meters long gallery. Seven passenger sleeves are serviced. It is officially commissioned in operation in December 2006. The terminal has 4000 sq.m. business area offering passengers a variety of services - restaurants, cafes, shops, tourist and rent-a-car services, banks and exchange offices. The annual capacity of passengers is 2.6 million passengers. The passenger service system has a capacity for 2,000 passengers at peak hours of the day. The total annual capacity of the two terminals of Sofia Airport is 4.4 million passengers, and Terminal 2 is designed in a way suggesting its expansion in accordance with the needs of growing traffic. That exactly allowed extension and renovation of the new Terminal 2 for 1 200 000 EUR to begin in February 2013. The expansion of the Terminal included the extension of the passenger gallery in the north direction and the formation of four exits - three for departing passengers and one for receiving luggage. Between the ground floor and the first floor are separated additional stairs and lifts for all passengers and the movement of people with disabilities is facilitated. The implementation of the project to build a new passenger terminal and a new runway has led to a significant increase in passenger and cargo turnover at the airport, and to providing the possibility for landing of all aircraft types and high-quality airport services for passengers and aircraft. Since 2008, the airport has Category 3 "A" for landing without navigation support and can receive aircraft in foggy weather with visibility of 200 meters. The cargo area of Sofia Airport provides the transport of processed shipments and freight through the airport and is located east of and adjacent to Block B of Terminal 1. The cargo area covers an area of 17,444 square meters and includes the cargo warehouse of "Sofia Airport" EAD, the cargo warehouse of "Aviation Services" and the warehouses of "Sofia Airport" EAD, including the duty-free trade of freight forwarders and airline company "Air Sofia". The cargo area provides opportunity for handling cargo shipments both with simple processing procedure and special processing procedure (perishable products, hazardous freight, valuables, postal, diplomatic and other shipments). In 2016, the Ministry of Transport and Communications submitted for approval to the EC procedure for granting a concession for the Sofia Airport for a period of 35 years. It is expected for the entire period of the concession to obtain benefits for the state of more than 1.2 billion BGN, and the preliminary analyses indicates that the investments of the future concessionaire will have good returns. The trends in passenger and freight traffic necessitated the modernization and reconstruction of the airport complex. The main reasons are the increased volume of international passenger and cargo flights and the growth of domestic flights in recent years.

Ministry of Transport, Information Technology and Communications
150
Table 4-46 Information on the traffic at Sofia Airport Source: Directorate General "Civil Aviation Administration"
Indicators 2007 2008 2009 2010 2011 2012 2013 2014 2015
1.Aircraft movements*, number, including 43005 48626 45698 47061 47153 43862 40526 42120 44416
International scheduled flights 30796 34870 33353 34321 34826 31289 29493 32015 33994
International charter flights 1162 1435 1261 4169 3402 6179 5548 4736 4832
Domestic flights (scheduled and charter) 2458 2954 2670 2422 3295 3413 3041 2657 2720
2.Passengers serviced*, number, including 2738222 3219911 3121838 3287529 3473088 3466535 3504220 3814868 4064755
on international scheduled flights 2482237 2880150 2782604 2959844 3141263 3139506 3198628 3526681 3797771
on international charter flights 150905 189385 165411 145460 124345 123212 117502 116403 103830 on domestic scheduled flights (scheduled and charter) 91900 137166 162313 172192 200085 198718 178506 164292 158712
3. Freight processed in tonnes 15768 16439 13288 13493 14103 14605 15340 15910 16740
loaded 6448 7036 6082 6210 6176 6445 6700 7813 8283
unloaded 9318 9403 7206 7283 7927 8160 8640 8097 8457
4. Processed mail, t 1624 1855 1805 1811 1780 1639 1699 1832 1900
* including non-commercial flights
During the period 2007 - 2015, the number of aircraft movements to and from Sofia Airport grew by only 3% as the number of movements related to carrying international flights grew by 10% and for domestic flights it decreased by 11%. The greatest is the increase in the number of charter flights, which increased threefold.
Source: Own calculations
Figure 4-139 Change in the number of aircraft movements at Sofia Airport compared to 2007.
In turn, the number of serviced passengers increased by 48%, respectively, on international flights
the increase is 53% and on domestic flights - by 73%. It is noteworthy that passengers served by charter flights decreased by 31% compared to 2007, with at an increased number of charter flights reflects reduced capacity utilization of aircraft and the service of a large number of business and non-commercial flights. Moreover, the highest growth is reported in the number of passengers served on domestic flights.
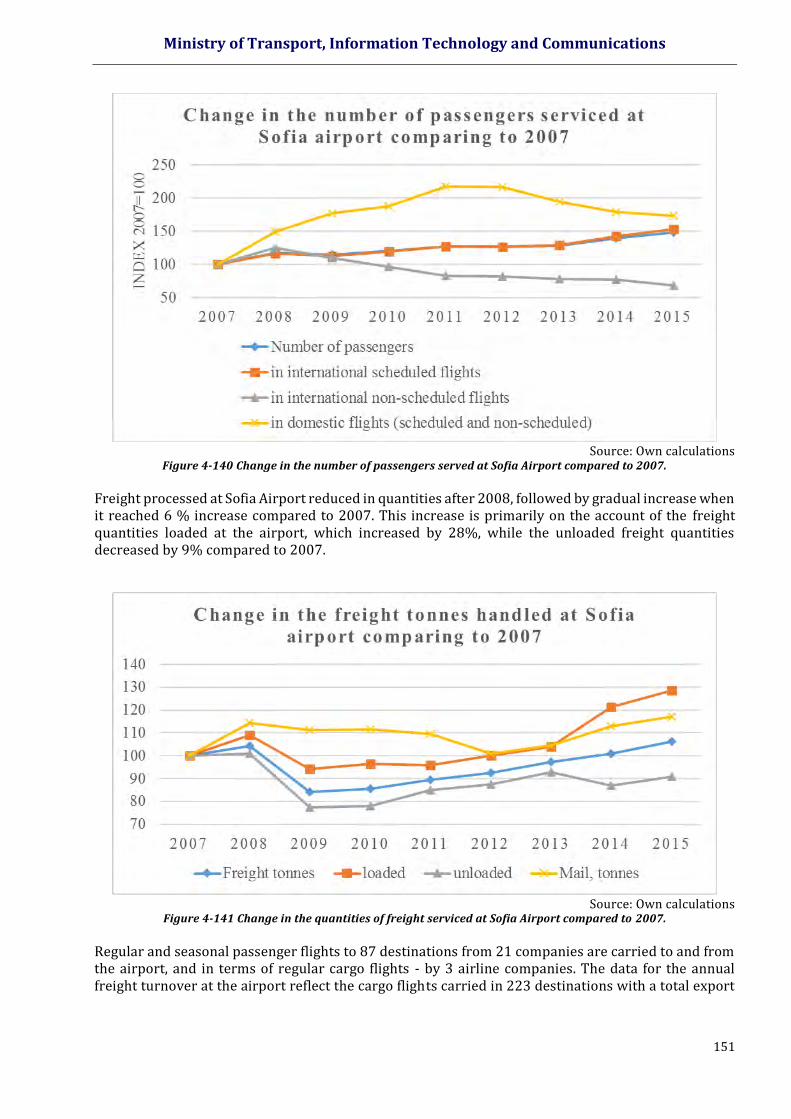
Ministry of Transport, Information Technology and Communications
151
Source: Own calculations
Figure 4-140 Change in the number of passengers served at Sofia Airport compared to 2007.
Freight processed at Sofia Airport reduced in quantities after 2008, followed by gradual increase when it reached 6 % increase compared to 2007. This increase is primarily on the account of the freight quantities loaded at the airport, which increased by 28%, while the unloaded freight quantities decreased by 9% compared to 2007.
Source: Own calculations
Figure 4-141 Change in the quantities of freight serviced at Sofia Airport compared to 2007.
Regular and seasonal passenger flights to 87 destinations from 21 companies are carried to and from the airport, and in terms of regular cargo flights - by 3 airline companies. The data for the annual freight turnover at the airport reflect the cargo flights carried in 223 destinations with a total export
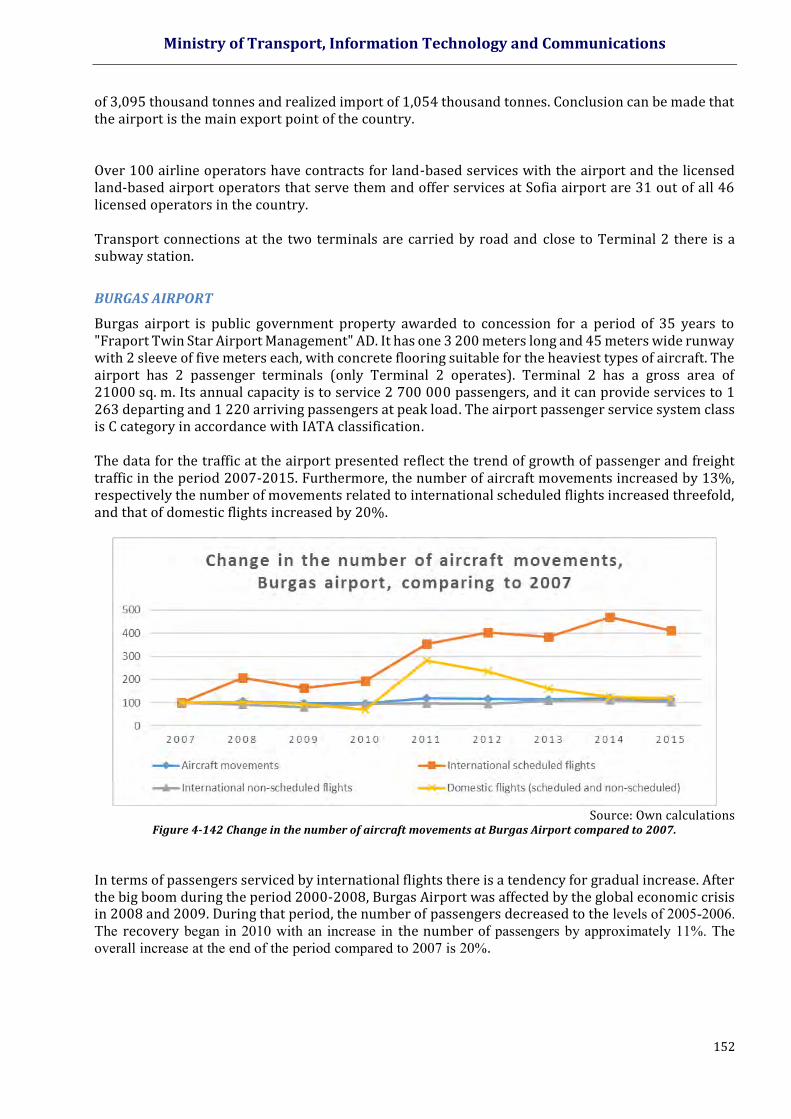
Ministry of Transport, Information Technology and Communications
152
of 3,095 thousand tonnes and realized import of 1,054 thousand tonnes. Conclusion can be made that the airport is the main export point of the country. Over 100 airline operators have contracts for land-based services with the airport and the licensed land-based airport operators that serve them and offer services at Sofia airport are 31 out of all 46 licensed operators in the country. Transport connections at the two terminals are carried by road and close to Terminal 2 there is a subway station.
BURGAS AIRPORT
Burgas airport is public government property awarded to concession for a period of 35 years to "Fraport Twin Star Airport Management" AD. It has one 3 200 meters long and 45 meters wide runway with 2 sleeve of five meters each, with concrete flooring suitable for the heaviest types of aircraft. The airport has 2 passenger terminals (only Terminal 2 operates). Terminal 2 has a gross area of 21000 sq. m. Its annual capacity is to service 2 700 000 passengers, and it can provide services to 1 263 departing and 1 220 arriving passengers at peak load. The airport passenger service system class is C category in accordance with IATA classification. The data for the traffic at the airport presented reflect the trend of growth of passenger and freight traffic in the period 2007-2015. Furthermore, the number of aircraft movements increased by 13%, respectively the number of movements related to international scheduled flights increased threefold, and that of domestic flights increased by 20%.
Source: Own calculations
Figure 4-142 Change in the number of aircraft movements at Burgas Airport compared to 2007.
In terms of passengers serviced by international flights there is a tendency for gradual increase. After the big boom during the period 2000-2008, Burgas Airport was affected by the global economic crisis in 2008 and 2009. During that period, the number of passengers decreased to the levels of 2005-2006. The recovery began in 2010 with an increase in the number of passengers by approximately 11%. The overall increase at the end of the period compared to 2007 is 20%.
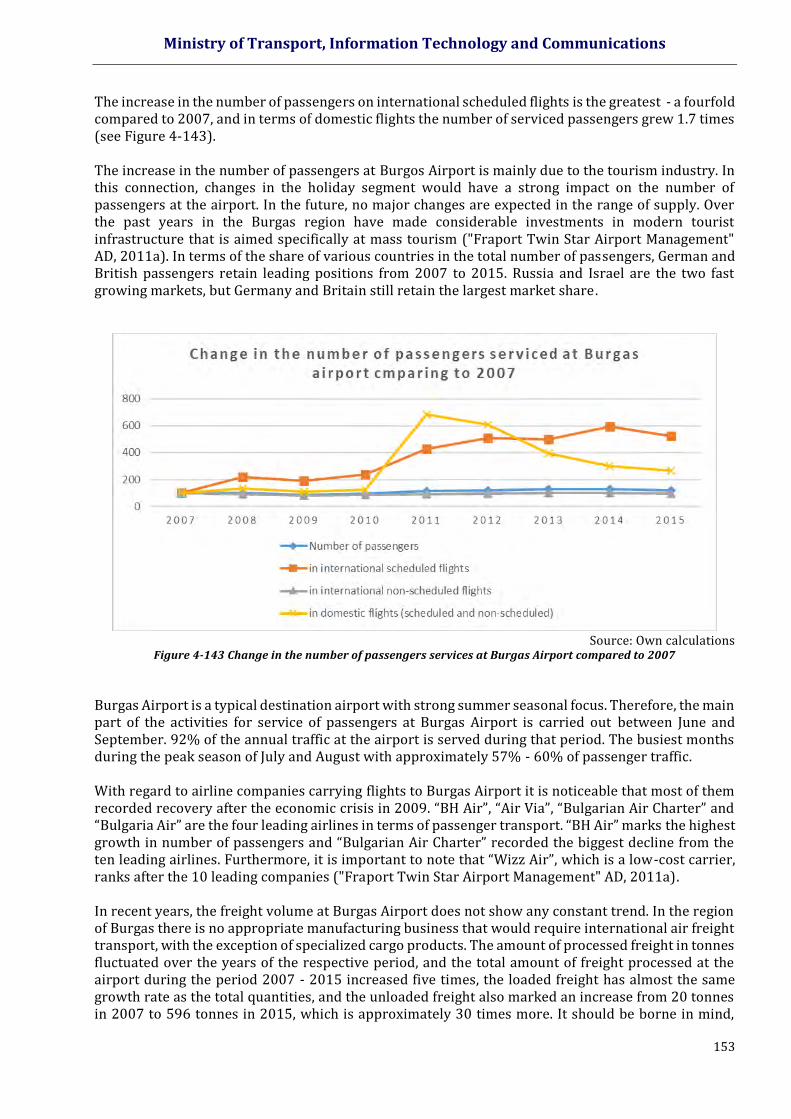
Ministry of Transport, Information Technology and Communications
153
The increase in the number of passengers on international scheduled flights is the greatest - a fourfold compared to 2007, and in terms of domestic flights the number of serviced passengers grew 1.7 times (see Figure 4-143). The increase in the number of passengers at Burgos Airport is mainly due to the tourism industry. In this connection, changes in the holiday segment would have a strong impact on the number of passengers at the airport. In the future, no major changes are expected in the range of supply. Over the past years in the Burgas region have made considerable investments in modern tourist infrastructure that is aimed specifically at mass tourism ("Fraport Twin Star Airport Management" AD, 2011a). In terms of the share of various countries in the total number of passengers, German and British passengers retain leading positions from 2007 to 2015. Russia and Israel are the two fast growing markets, but Germany and Britain still retain the largest market share.
Source: Own calculations
Figure 4-143 Change in the number of passengers services at Burgas Airport compared to 2007
Burgas Airport is a typical destination airport with strong summer seasonal focus. Therefore, the main part of the activities for service of passengers at Burgas Airport is carried out between June and September. 92% of the annual traffic at the airport is served during that period. The busiest months during the peak season of July and August with approximately 57% - 60% of passenger traffic. With regard to airline companies carrying flights to Burgas Airport it is noticeable that most of them recorded recovery after the economic crisis in 2009. “BH Air”, “Air Via”, “Bulgarian Air Charter” and “Bulgaria Air” are the four leading airlines in terms of passenger transport. “BH Air” marks the highest growth in number of passengers and “Bulgarian Air Charter” recorded the biggest decline from the ten leading airlines. Furthermore, it is important to note that “Wizz Air”, which is a low-cost carrier, ranks after the 10 leading companies ("Fraport Twin Star Airport Management" AD, 2011a). In recent years, the freight volume at Burgas Airport does not show any constant trend. In the region of Burgas there is no appropriate manufacturing business that would require international air freight transport, with the exception of specialized cargo products. The amount of processed freight in tonnes fluctuated over the years of the respective period, and the total amount of freight processed at the airport during the period 2007 - 2015 increased five times, the loaded freight has almost the same growth rate as the total quantities, and the unloaded freight also marked an increase from 20 tonnes in 2007 to 596 tonnes in 2015, which is approximately 30 times more. It should be borne in mind,
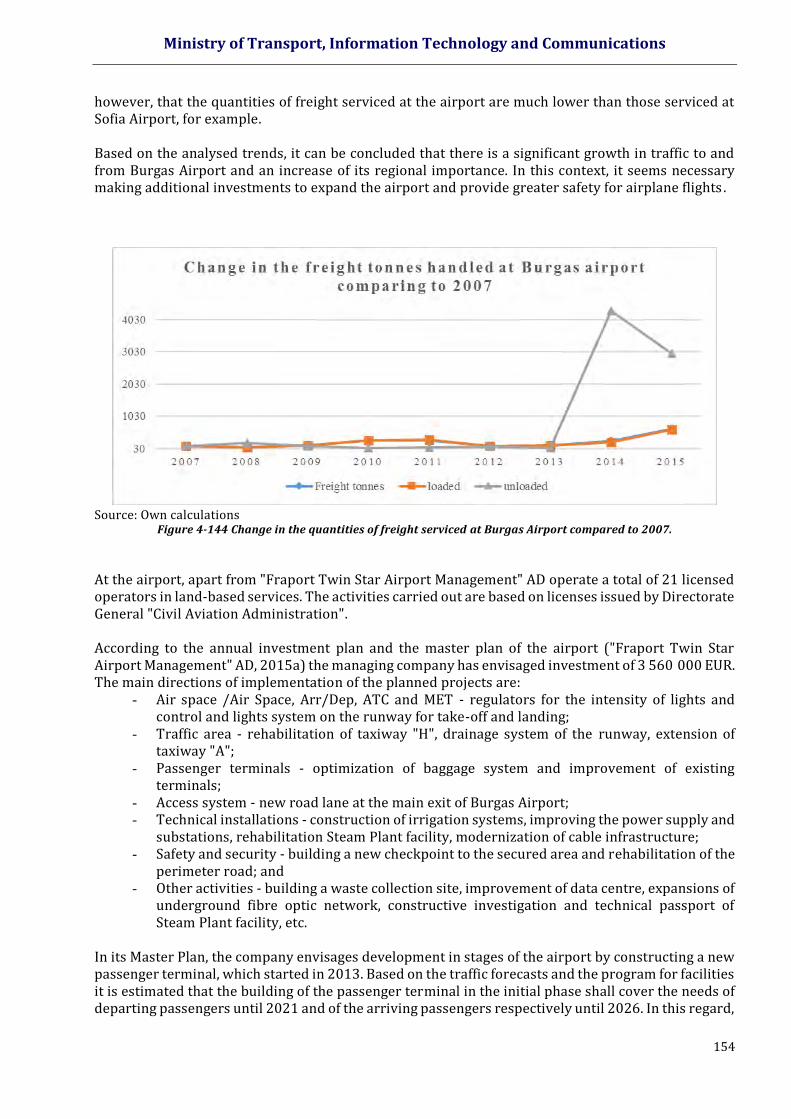
Ministry of Transport, Information Technology and Communications
154
however, that the quantities of freight serviced at the airport are much lower than those serviced at Sofia Airport, for example. Based on the analysed trends, it can be concluded that there is a significant growth in traffic to and from Burgas Airport and an increase of its regional importance. In this context, it seems necessary making additional investments to expand the airport and provide greater safety for airplane flights .
Source: Own calculations
Figure 4-144 Change in the quantities of freight serviced at Burgas Airport compared to 2007.
At the airport, apart from "Fraport Twin Star Airport Management" AD operate a total of 21 licensed operators in land-based services. The activities carried out are based on licenses issued by Directorate General "Civil Aviation Administration". According to the annual investment plan and the master plan of the airport ("Fraport Twin Star Airport Management" AD, 2015a) the managing company has envisaged investment of 3 560 000 EUR. The main directions of implementation of the planned projects are:
- Air space /Air Space, Arr/Dep, ATC and MET - regulators for the intensity of lights and control and lights system on the runway for take-off and landing;
- Traffic area - rehabilitation of taxiway "H", drainage system of the runway, extension of taxiway "A";
- Passenger terminals - optimization of baggage system and improvement of existing terminals;
- Access system - new road lane at the main exit of Burgas Airport; - Technical installations - construction of irrigation systems, improving the power supply and
substations, rehabilitation Steam Plant facility, modernization of cable infrastructure; - Safety and security - building a new checkpoint to the secured area and rehabilitation of the
perimeter road; and - Other activities - building a waste collection site, improvement of data centre, expansions of
underground fibre optic network, constructive investigation and technical passport of Steam Plant facility, etc.
In its Master Plan, the company envisages development in stages of the airport by constructing a new passenger terminal, which started in 2013. Based on the traffic forecasts and the program for facilities it is estimated that the building of the passenger terminal in the initial phase shall cover the needs of departing passengers until 2021 and of the arriving passengers respectively until 2026. In this regard,
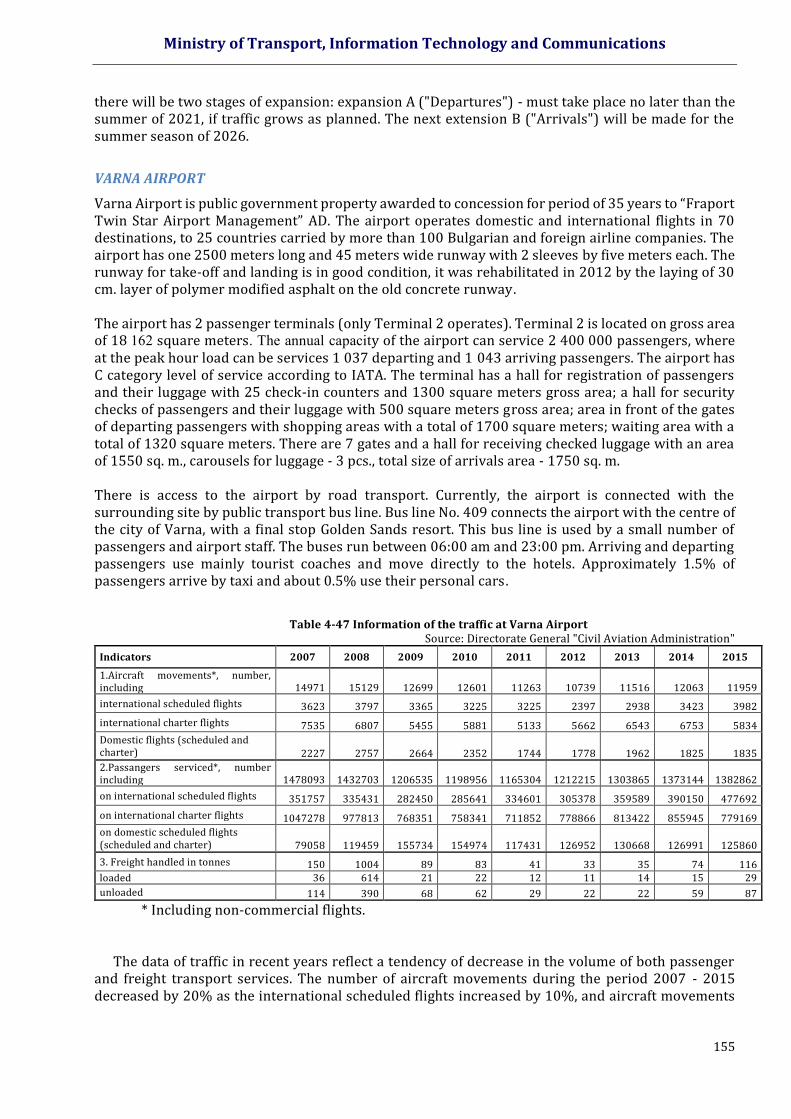
Ministry of Transport, Information Technology and Communications
155
there will be two stages of expansion: expansion A ("Departures") - must take place no later than the summer of 2021, if traffic grows as planned. The next extension B ("Arrivals") will be made for the summer season of 2026.
VARNA AIRPORT
Varna Airport is public government property awarded to concession for period of 35 years to “Fraport Twin Star Airport Management” AD. The airport operates domestic and international flights in 70 destinations, to 25 countries carried by more than 100 Bulgarian and foreign airline companies. The airport has one 2500 meters long and 45 meters wide runway with 2 sleeves by five meters each. The runway for take-off and landing is in good condition, it was rehabilitated in 2012 by the laying of 30 cm. layer of polymer modified asphalt on the old concrete runway. The airport has 2 passenger terminals (only Terminal 2 operates). Terminal 2 is located on gross area of 18 162 square meters. The annual capacity of the airport can service 2 400 000 passengers, where at the peak hour load can be services 1 037 departing and 1 043 arriving passengers. The airport has C category level of service according to IATA. The terminal has a hall for registration of passengers and their luggage with 25 check-in counters and 1300 square meters gross area; a hall for security checks of passengers and their luggage with 500 square meters gross area; area in front of the gates of departing passengers with shopping areas with a total of 1700 square meters; waiting area with a total of 1320 square meters. There are 7 gates and a hall for receiving checked luggage with an area of 1550 sq. m., carousels for luggage - 3 pcs., total size of arrivals area - 1750 sq. m. There is access to the airport by road transport. Currently, the airport is connected with the surrounding site by public transport bus line. Bus line No. 409 connects the airport with the centre of the city of Varna, with a final stop Golden Sands resort. This bus line is used by a small number of passengers and airport staff. The buses run between 06:00 am and 23:00 pm. Arriving and departing passengers use mainly tourist coaches and move directly to the hotels. Approximately 1.5% of passengers arrive by taxi and about 0.5% use their personal cars.
Table 4-47 Information of the traffic at Varna Airport Source: Directorate General "Civil Aviation Administration"
Indicators 2007 2008 2009 2010 2011 2012 2013 2014 2015
1.Aircraft movements*, number, including 14971 15129 12699 12601 11263 10739 11516 12063 11959
international scheduled flights 3623 3797 3365 3225 3225 2397 2938 3423 3982
international charter flights 7535 6807 5455 5881 5133 5662 6543 6753 5834
Domestic flights (scheduled and charter) 2227 2757 2664 2352 1744 1778 1962 1825 1835
2.Passangers serviced*, number including 1478093 1432703 1206535 1198956 1165304 1212215 1303865 1373144 1382862
on international scheduled flights 351757 335431 282450 285641 334601 305378 359589 390150 477692
on international charter flights 1047278 977813 768351 758341 711852 778866 813422 855945 779169
on domestic scheduled flights (scheduled and charter) 79058 119459 155734 154974 117431 126952 130668 126991 125860
3. Freight handled in tonnes 150 1004 89 83 41 33 35 74 116 loaded 36 614 21 22 12 11 14 15 29
unloaded 114 390 68 62 29 22 22 59 87
* Including non-commercial flights.
The data of traffic in recent years reflect a tendency of decrease in the volume of both passenger and freight transport services. The number of aircraft movements during the period 2007 - 2015 decreased by 20% as the international scheduled flights increased by 10%, and aircraft movements
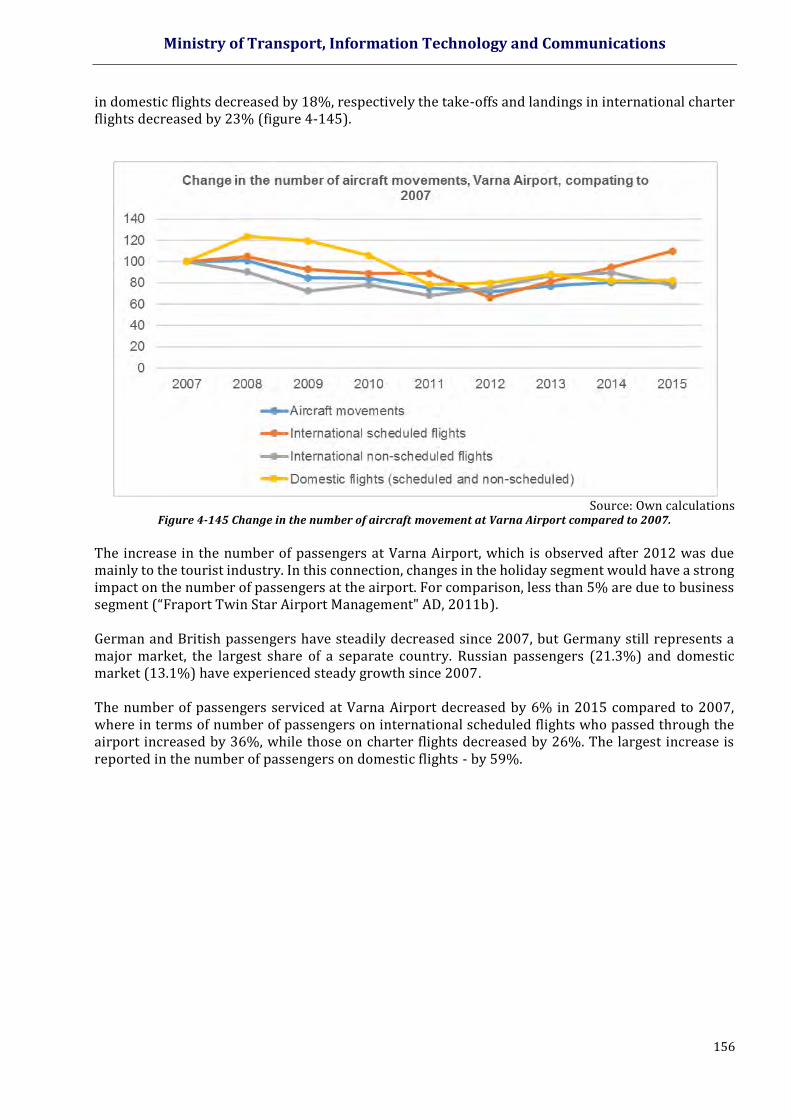
Ministry of Transport, Information Technology and Communications
156
in domestic flights decreased by 18%, respectively the take-offs and landings in international charter flights decreased by 23% (figure 4-145).
Source: Own calculations
Figure 4-145 Change in the number of aircraft movement at Varna Airport compared to 2007.
The increase in the number of passengers at Varna Airport, which is observed after 2012 was due mainly to the tourist industry. In this connection, changes in the holiday segment would have a strong impact on the number of passengers at the airport. For comparison, less than 5% are due to business segment (“Fraport Twin Star Airport Management" AD, 2011b). German and British passengers have steadily decreased since 2007, but Germany still represents a major market, the largest share of a separate country. Russian passengers (21.3%) and domestic market (13.1%) have experienced steady growth since 2007. The number of passengers serviced at Varna Airport decreased by 6% in 2015 compared to 2007, where in terms of number of passengers on international scheduled flights who passed through the airport increased by 36%, while those on charter flights decreased by 26%. The largest increase is reported in the number of passengers on domestic flights - by 59%.
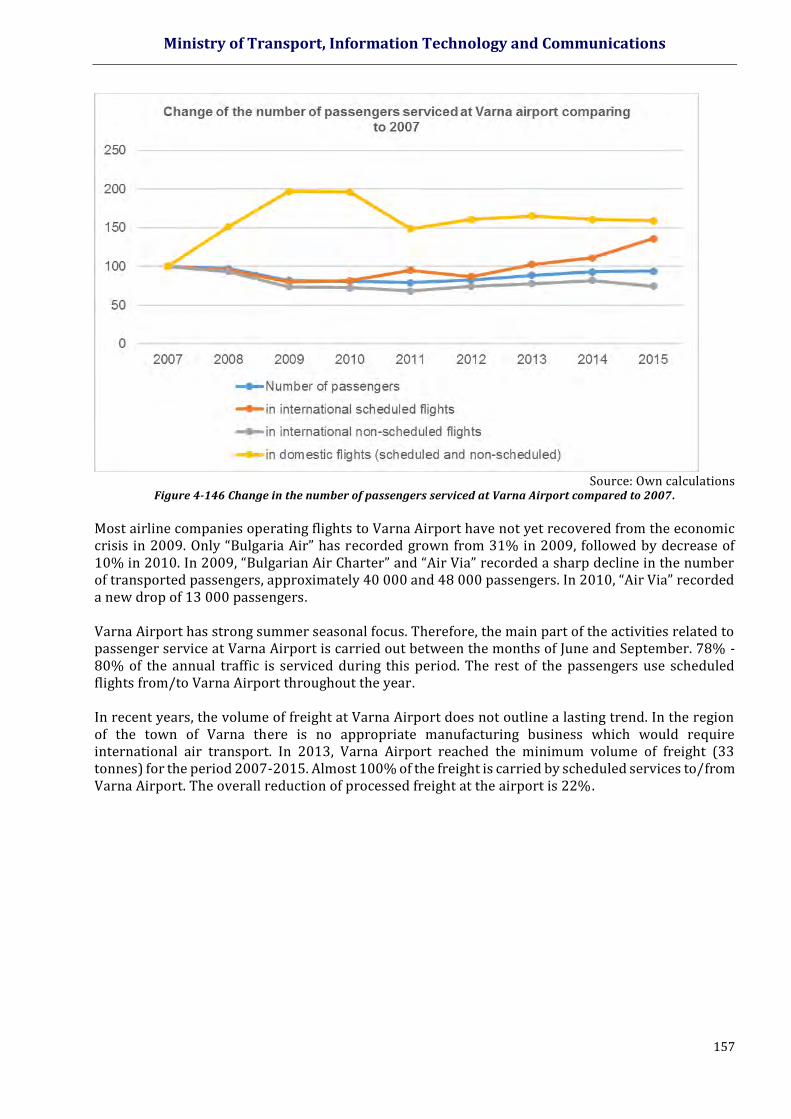
Ministry of Transport, Information Technology and Communications
157
Source: Own calculations
Figure 4-146 Change in the number of passengers serviced at Varna Airport compared to 2007.
Most airline companies operating flights to Varna Airport have not yet recovered from the economic crisis in 2009. Only “Bulgaria Air” has recorded grown from 31% in 2009, followed by decrease of 10% in 2010. In 2009, “Bulgarian Air Charter” and “Air Via” recorded a sharp decline in the number of transported passengers, approximately 40 000 and 48 000 passengers. In 2010, “Air Via” recorded a new drop of 13 000 passengers. Varna Airport has strong summer seasonal focus. Therefore, the main part of the activities related to passenger service at Varna Airport is carried out between the months of June and September. 78% - 80% of the annual traffic is serviced during this period. The rest of the passengers use scheduled flights from/to Varna Airport throughout the year. In recent years, the volume of freight at Varna Airport does not outline a lasting trend. In the region of the town of Varna there is no appropriate manufacturing business which would require international air transport. In 2013, Varna Airport reached the minimum volume of freight (33 tonnes) for the period 2007-2015. Almost 100% of the freight is carried by scheduled services to/from Varna Airport. The overall reduction of processed freight at the airport is 22%.
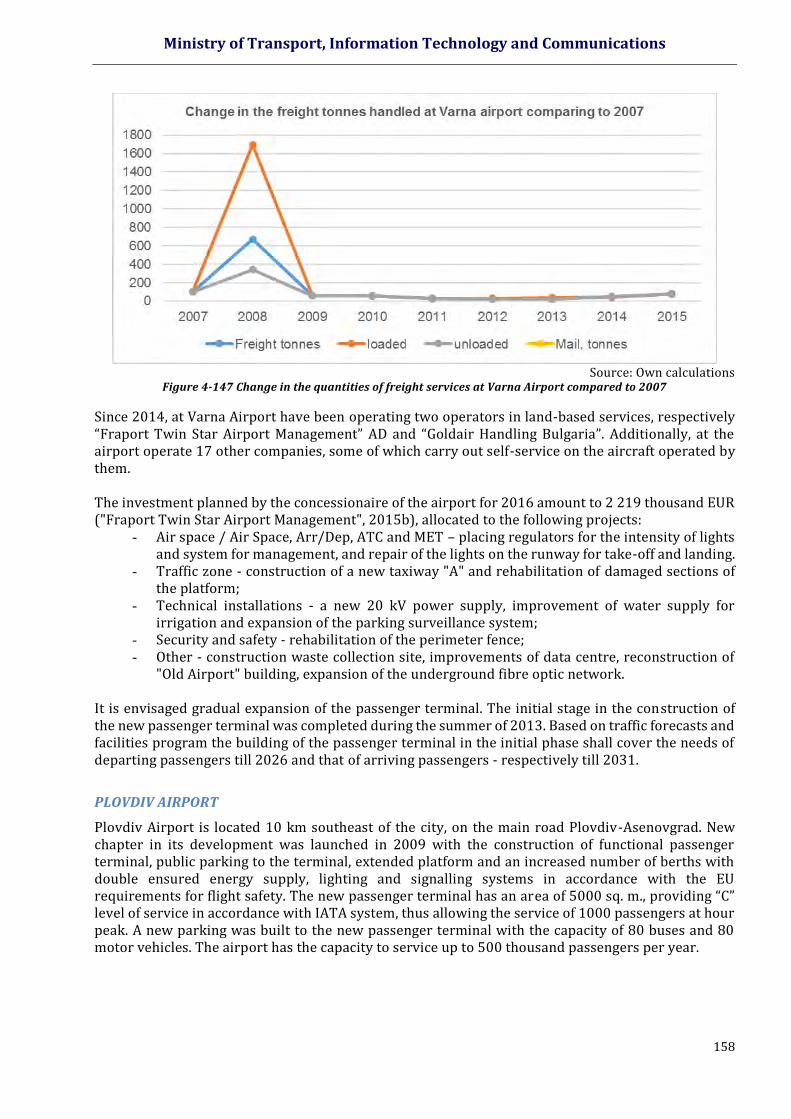
Ministry of Transport, Information Technology and Communications
158
Source: Own calculations
Figure 4-147 Change in the quantities of freight services at Varna Airport compared to 2007
Since 2014, at Varna Airport have been operating two operators in land-based services, respectively “Fraport Twin Star Airport Management” AD and “Goldair Handling Bulgaria”. Additionally, at the airport operate 17 other companies, some of which carry out self-service on the aircraft operated by them. The investment planned by the concessionaire of the airport for 2016 amount to 2 219 thousand EUR ("Fraport Twin Star Airport Management", 2015b), allocated to the following projects:
- Air space / Air Space, Arr/Dep, ATC and MET – placing regulators for the intensity of lights and system for management, and repair of the lights on the runway for take-off and landing.
- Traffic zone - construction of a new taxiway "A" and rehabilitation of damaged sections of the platform;
- Technical installations - a new 20 kV power supply, improvement of water supply for irrigation and expansion of the parking surveillance system;
- Security and safety - rehabilitation of the perimeter fence; - Other - construction waste collection site, improvements of data centre, reconstruction of
"Old Airport" building, expansion of the underground fibre optic network. It is envisaged gradual expansion of the passenger terminal. The initial stage in the construction of the new passenger terminal was completed during the summer of 2013. Based on traffic forecasts and facilities program the building of the passenger terminal in the initial phase shall cover the needs of departing passengers till 2026 and that of arriving passengers - respectively till 2031.
PLOVDIV AIRPORT
Plovdiv Airport is located 10 km southeast of the city, on the main road Plovdiv-Asenovgrad. New chapter in its development was launched in 2009 with the construction of functional passenger terminal, public parking to the terminal, extended platform and an increased number of berths with double ensured energy supply, lighting and signalling systems in accordance with the EU requirements for flight safety. The new passenger terminal has an area of 5000 sq. m., providing “C” level of service in accordance with IATA system, thus allowing the service of 1000 passengers at hour peak. A new parking was built to the new passenger terminal with the capacity of 80 buses and 80 motor vehicles. The airport has the capacity to service up to 500 thousand passengers per year.

Ministry of Transport, Information Technology and Communications
159
The available length of runway for take-off and landing is 2500 m. and allows the operation of medium and heavy type aircraft. The existing platform has the capacity to service eight aircraft simultaneously, which in peak hours is highly insufficient and reduces the revenues of the airport. Plovdiv Airport is declared as a backup airport to Sofia Airport. It accepts the traffic of Sofia Airport in periods of closure due to low visibility or other reasons. Plovdiv Airport serves passenger, cargo and business flights. Presently, Plovdiv Airport has no scheduled passenger flights. During winter the airport services daily tourist charter flights to Bulgarian ski resorts in Bansko, Pamporovo and Borovets. At the same time, Plovdiv Airport is used jointly with the Ministry of Defence – Bulgarian Air Force. There are 12 licensed operators of land-based activities, incl. those who carry out self-service 18. The data for the traffic at the airport show significant fluctuations in the volume of transport services per year.
Table 4-48 Information on the traffic at Plovdiv Airport
Source: Directorate General "Civil Aviation Administration" Indicators 2007 2008 2009 2010 2011 2012 2013 2014 2015
1.Aircraft movements*, number, including 1990 1702 6 138 4983 5805 4193 3657 2643 3243 international scheduled flights 60 29 9 97 426 493 506 537 549
international charter flights 775 434 195 182 152 747 435 490 544
Domestic flights (scheduled and charter) 3 19 1 6 10 183 346 229 275
2.Passangers serviced*, number including 104130 61276 24919 26547 76835 88704 92097 103292 103300
on international scheduled flights 4087 1715 395 9907 59776 74217 85511 95091 92365
on international charter flights 97837 55819 22492 13061 13625 13091 5710 6486 9968 on domestic scheduled flights (scheduled and charter) 12 633 2 20 156 218 97 87 67
3. Freight handled in tonnes 1867,26 666,30 472,14 368,87 380,13 564,02 182,32 554,14 821,43
loaded 1709,75 562,99 388,32 258,76 265,40 417,41 96,45 327,65 276,88
unloaded 157,51 103,31 83,82 110,12 114,73 146,61 85,87 226,49 380,19
* Including non-commercial flights. When analysing the data in table 4-48 it was found that during the period 2007-2015, there has been an increase in the number of aircraft movements from 1990 in 2007 to 6138 in 2009, after which take-offs and landings of aircraft reduced to 3243 in 2015.
Source: Own calculations
Figure 4-148 Change in the number of aircraft movements at Plovdiv Airport compared to 2007
18 According to data of Directorate General "Civil Aviation Administration".
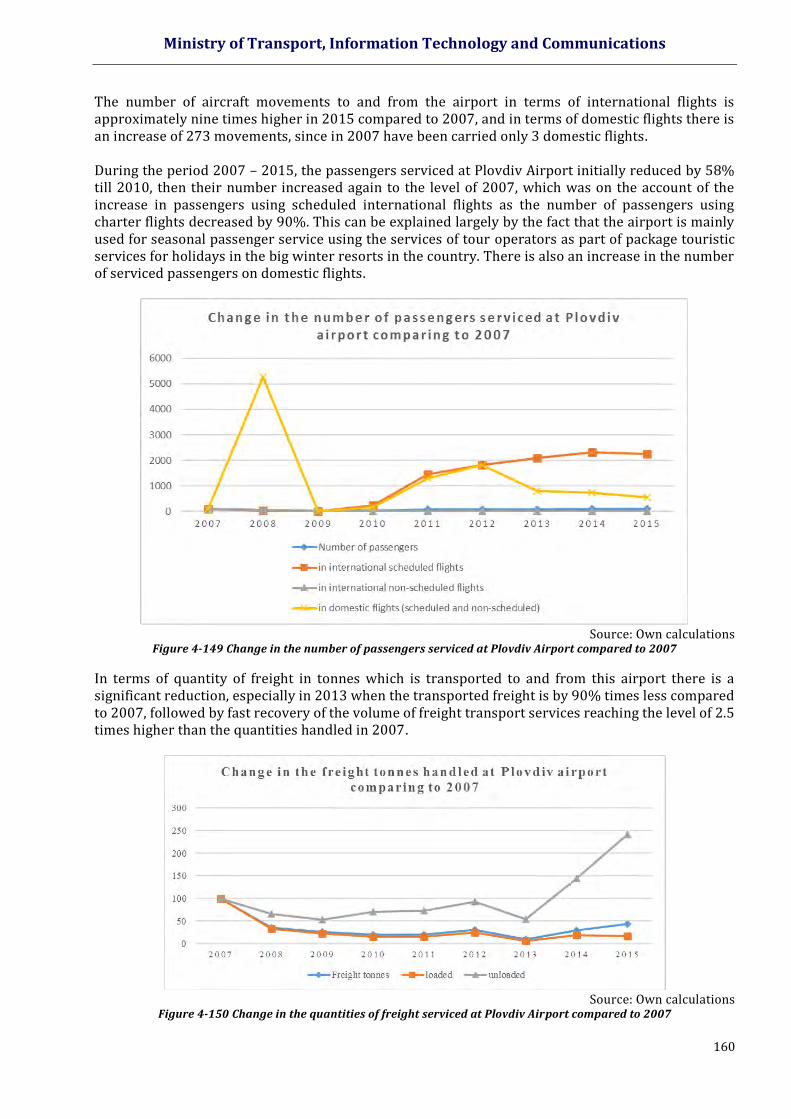
Ministry of Transport, Information Technology and Communications
160
The number of aircraft movements to and from the airport in terms of international flights is approximately nine times higher in 2015 compared to 2007, and in terms of domestic flights there is an increase of 273 movements, since in 2007 have been carried only 3 domestic flights. During the period 2007 – 2015, the passengers serviced at Plovdiv Airport initially reduced by 58% till 2010, then their number increased again to the level of 2007, which was on the account of the increase in passengers using scheduled international flights as the number of passengers using charter flights decreased by 90%. This can be explained largely by the fact that the airport is mainly used for seasonal passenger service using the services of tour operators as part of package touristic services for holidays in the big winter resorts in the country. There is also an increase in the number of serviced passengers on domestic flights.
Source: Own calculations
Figure 4-149 Change in the number of passengers serviced at Plovdiv Airport compared to 2007
In terms of quantity of freight in tonnes which is transported to and from this airport there is a significant reduction, especially in 2013 when the transported freight is by 90% times less compared to 2007, followed by fast recovery of the volume of freight transport services reaching the level of 2.5 times higher than the quantities handled in 2007.
Source: Own calculations
Figure 4-150 Change in the quantities of freight serviced at Plovdiv Airport compared to 2007
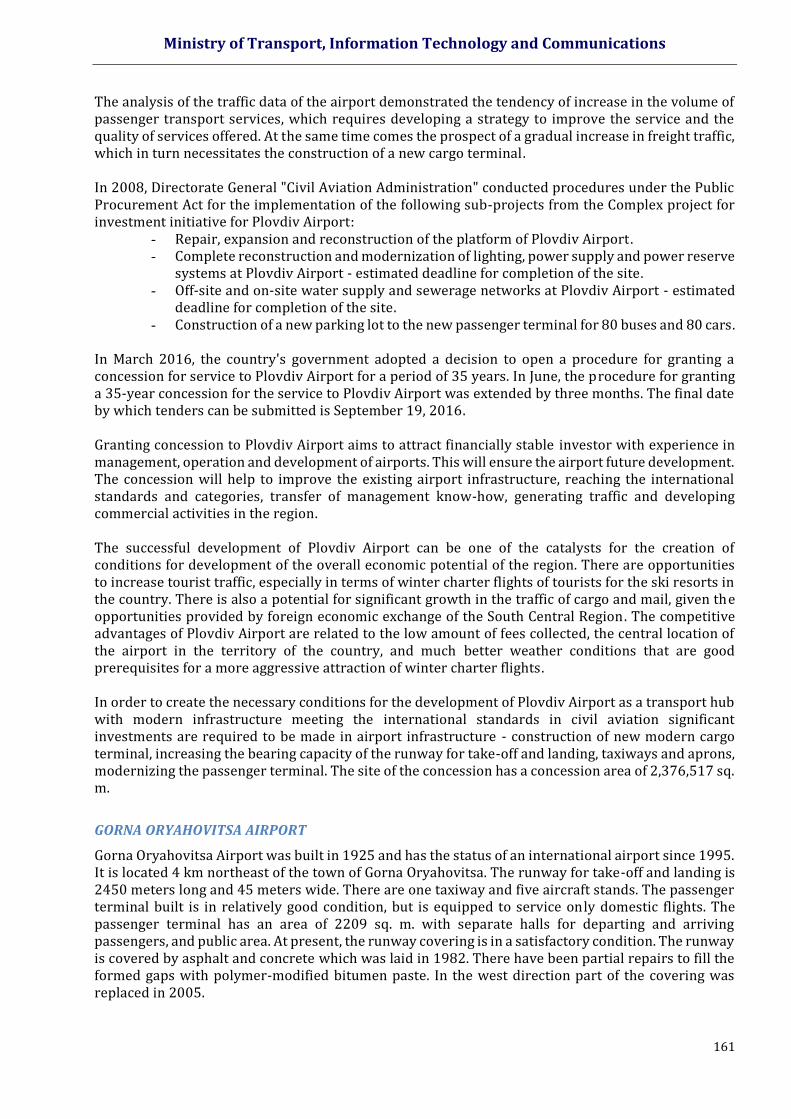
Ministry of Transport, Information Technology and Communications
161
The analysis of the traffic data of the airport demonstrated the tendency of increase in the volume of passenger transport services, which requires developing a strategy to improve the service and the quality of services offered. At the same time comes the prospect of a gradual increase in freight traffic, which in turn necessitates the construction of a new cargo terminal. In 2008, Directorate General "Civil Aviation Administration" conducted procedures under the Public Procurement Act for the implementation of the following sub-projects from the Complex project for investment initiative for Plovdiv Airport:
- Repair, expansion and reconstruction of the platform of Plovdiv Airport. - Complete reconstruction and modernization of lighting, power supply and power reserve
systems at Plovdiv Airport - estimated deadline for completion of the site. - Off-site and on-site water supply and sewerage networks at Plovdiv Airport - estimated
deadline for completion of the site. - Construction of a new parking lot to the new passenger terminal for 80 buses and 80 cars.
In March 2016, the country's government adopted a decision to open a procedure for granting a concession for service to Plovdiv Airport for a period of 35 years. In June, the procedure for granting a 35-year concession for the service to Plovdiv Airport was extended by three months. The final date by which tenders can be submitted is September 19, 2016. Granting concession to Plovdiv Airport aims to attract financially stable investor with experience in management, operation and development of airports. This will ensure the airport future development. The concession will help to improve the existing airport infrastructure, reaching the international standards and categories, transfer of management know-how, generating traffic and developing commercial activities in the region. The successful development of Plovdiv Airport can be one of the catalysts for the creation of conditions for development of the overall economic potential of the region. There are opportunities to increase tourist traffic, especially in terms of winter charter flights of tourists for the ski resorts in the country. There is also a potential for significant growth in the traffic of cargo and mail, given the opportunities provided by foreign economic exchange of the South Central Region. The competitive advantages of Plovdiv Airport are related to the low amount of fees collected, the central location of the airport in the territory of the country, and much better weather conditions that are good prerequisites for a more aggressive attraction of winter charter flights. In order to create the necessary conditions for the development of Plovdiv Airport as a transport hub with modern infrastructure meeting the international standards in civil aviation significant investments are required to be made in airport infrastructure - construction of new modern cargo terminal, increasing the bearing capacity of the runway for take-off and landing, taxiways and aprons, modernizing the passenger terminal. The site of the concession has a concession area of 2,376,517 sq. m.
GORNA ORYAHOVITSA AIRPORT
Gorna Oryahovitsa Airport was built in 1925 and has the status of an international airport since 1995. It is located 4 km northeast of the town of Gorna Oryahovitsa. The runway for take-off and landing is 2450 meters long and 45 meters wide. There are one taxiway and five aircraft stands. The passenger terminal built is in relatively good condition, but is equipped to service only domestic flights. The passenger terminal has an area of 2209 sq. m. with separate halls for departing and arriving passengers, and public area. At present, the runway covering is in a satisfactory condition. The runway is covered by asphalt and concrete which was laid in 1982. There have been partial repairs to fill the formed gaps with polymer-modified bitumen paste. In the west direction part of the covering was replaced in 2005.
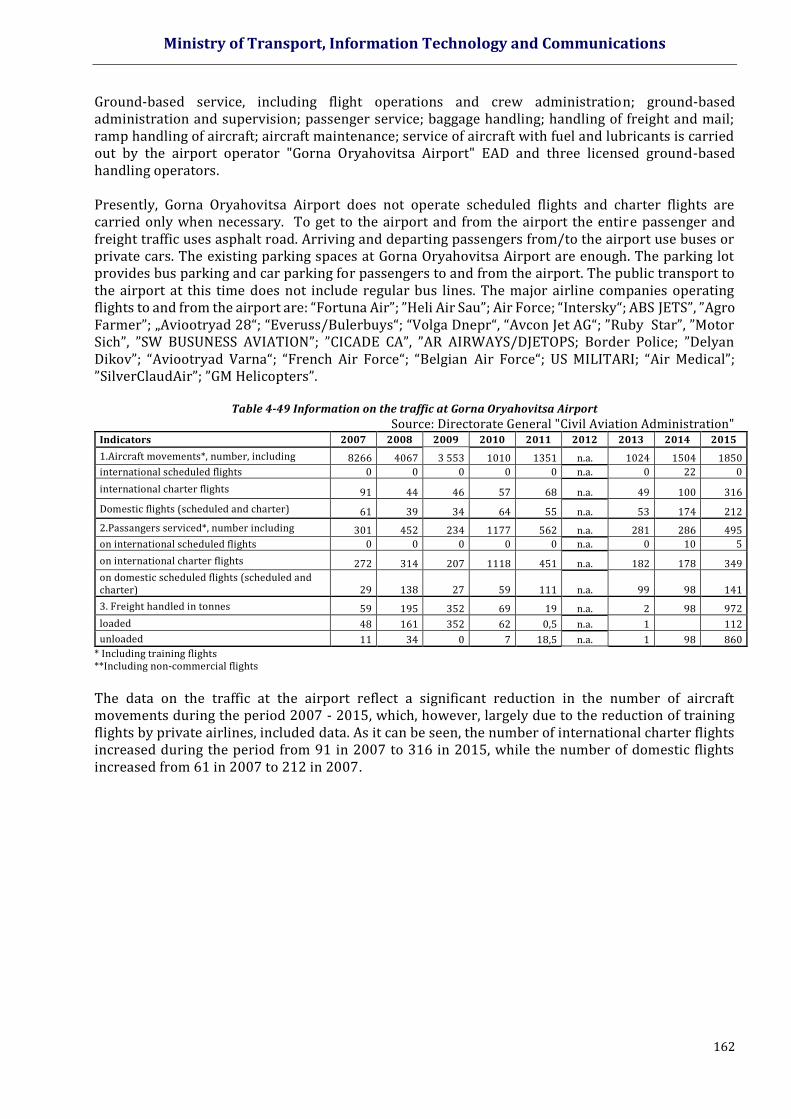
Ministry of Transport, Information Technology and Communications
162
Ground-based service, including flight operations and crew administration; ground-based administration and supervision; passenger service; baggage handling; handling of freight and mail; ramp handling of aircraft; aircraft maintenance; service of aircraft with fuel and lubricants is carried out by the airport operator "Gorna Oryahovitsa Airport" EAD and three licensed ground-based handling operators. Presently, Gorna Oryahovitsa Airport does not operate scheduled flights and charter flights are carried only when necessary. To get to the airport and from the airport the entire passenger and freight traffic uses asphalt road. Arriving and departing passengers from/to the airport use buses or private cars. The existing parking spaces at Gorna Oryahovitsa Airport are enough. The parking lot provides bus parking and car parking for passengers to and from the airport. The public transport to the airport at this time does not include regular bus lines. The major airline companies operating flights to and from the airport are: “Fortuna Air”; ”Heli Air Sau”; Air Force; “Intersky“; ABS JETS”, ”Agro Farmer”; „Aviootryad 28“; “Everuss/Bulerbuys“; “Volga Dnepr“, “Avcon Jet AG“; ”Ruby Star”, ”Motor Sich”, ”SW BUSUNESS AVIATION”; ”CICADE CA”, ”AR AIRWAYS/DJETOPS; Border Police; ”Delyan Dikov”; “Aviootryad Varna“; “French Air Force“; “Belgian Air Force“; US MILITARI; “Air Medical”; ”SilverClaudAir”; ”GM Helicopters”.
Table 4-49 Information on the traffic at Gorna Oryahovitsa Airport Source: Directorate General "Civil Aviation Administration"
Indicators 2007 2008 2009 2010 2011 2012 2013 2014 2015
1.Aircraft movements*, number, including 8266 4067 3 553 1010 1351 n.a. 1024 1504 1850
international scheduled flights 0 0 0 0 0 n.a. 0 22 0
international charter flights 91 44 46 57 68 n.a. 49 100 316
Domestic flights (scheduled and charter) 61 39 34 64 55 n.a. 53 174 212
2.Passangers serviced*, number including 301 452 234 1177 562 n.a. 281 286 495
on international scheduled flights 0 0 0 0 0 n.a. 0 10 5
on international charter flights 272 314 207 1118 451 n.a. 182 178 349
on domestic scheduled flights (scheduled and charter) 29 138 27 59 111 n.a. 99 98 141
3. Freight handled in tonnes 59 195 352 69 19 n.a. 2 98 972
loaded 48 161 352 62 0,5 n.a. 1 112
unloaded 11 34 0 7 18,5 n.a. 1 98 860
* Including training flights **Including non-commercial flights
The data on the traffic at the airport reflect a significant reduction in the number of aircraft movements during the period 2007 - 2015, which, however, largely due to the reduction of training flights by private airlines, included data. As it can be seen, the number of international charter flights increased during the period from 91 in 2007 to 316 in 2015, while the number of domestic flights increased from 61 in 2007 to 212 in 2007.
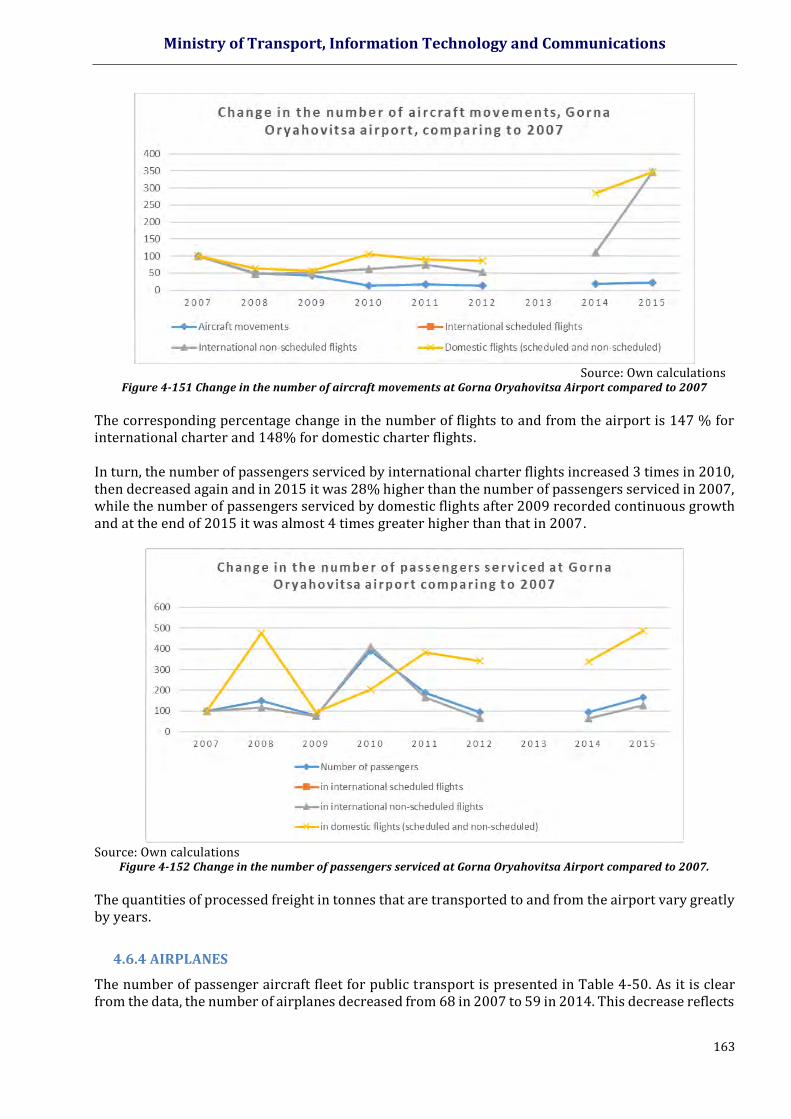
Ministry of Transport, Information Technology and Communications
163
Source: Own calculations
Figure 4-151 Change in the number of aircraft movements at Gorna Oryahovitsa Airport compared to 2007
The corresponding percentage change in the number of flights to and from the airport is 147 % for international charter and 148% for domestic charter flights. In turn, the number of passengers serviced by international charter flights increased 3 times in 2010, then decreased again and in 2015 it was 28% higher than the number of passengers serviced in 2007, while the number of passengers serviced by domestic flights after 2009 recorded continuous growth and at the end of 2015 it was almost 4 times greater higher than that in 2007.
Source: Own calculations
Figure 4-152 Change in the number of passengers serviced at Gorna Oryahovitsa Airport compared to 2007.
The quantities of processed freight in tonnes that are transported to and from the airport vary greatly by years.
4.6.4 AIRPLANES
The number of passenger aircraft fleet for public transport is presented in Table 4-50. As it is clear from the data, the number of airplanes decreased from 68 in 2007 to 59 in 2014. This decrease reflects
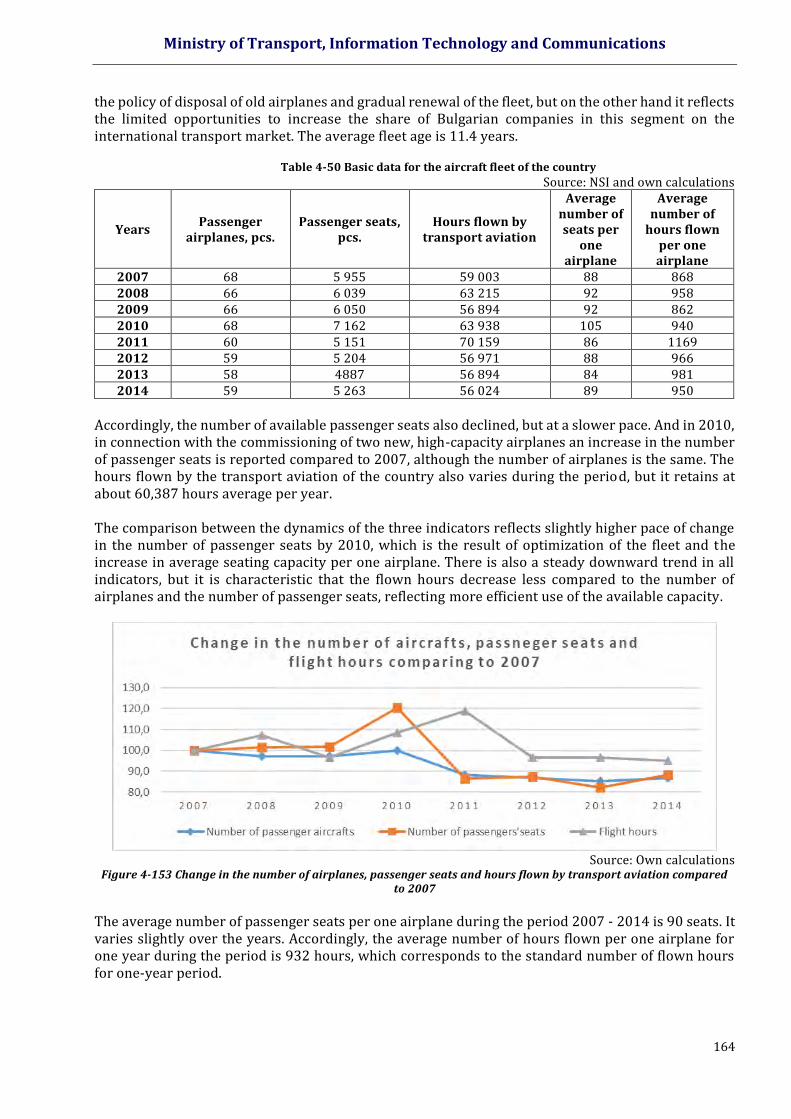
Ministry of Transport, Information Technology and Communications
164
the policy of disposal of old airplanes and gradual renewal of the fleet, but on the other hand it reflects the limited opportunities to increase the share of Bulgarian companies in this segment on the international transport market. The average fleet age is 11.4 years.
Table 4-50 Basic data for the aircraft fleet of the country
Source: NSI and own calculations
Years Passenger
airplanes, pcs. Passenger seats,
pcs. Hours flown by
transport aviation
Average number of seats per
one airplane
Average number of
hours flown per one airplane
2007 68 5 955 59 003 88 868 2008 66 6 039 63 215 92 958 2009 66 6 050 56 894 92 862 2010 68 7 162 63 938 105 940 2011 60 5 151 70 159 86 1169 2012 59 5 204 56 971 88 966 2013 58 4887 56 894 84 981 2014 59 5 263 56 024 89 950
Accordingly, the number of available passenger seats also declined, but at a slower pace. And in 2010, in connection with the commissioning of two new, high-capacity airplanes an increase in the number of passenger seats is reported compared to 2007, although the number of airplanes is the same. The hours flown by the transport aviation of the country also varies during the period, but it retains at about 60,387 hours average per year. The comparison between the dynamics of the three indicators reflects slightly higher pace of change in the number of passenger seats by 2010, which is the result of optimization of the fleet and the increase in average seating capacity per one airplane. There is also a steady downward trend in all indicators, but it is characteristic that the flown hours decrease less compared to the number of airplanes and the number of passenger seats, reflecting more efficient use of the available capacity.
Source: Own calculations
Figure 4-153 Change in the number of airplanes, passenger seats and hours flown by transport aviation compared to 2007
The average number of passenger seats per one airplane during the period 2007 - 2014 is 90 seats. It varies slightly over the years. Accordingly, the average number of hours flown per one airplane for one year during the period is 932 hours, which corresponds to the standard number of flown hours for one-year period.
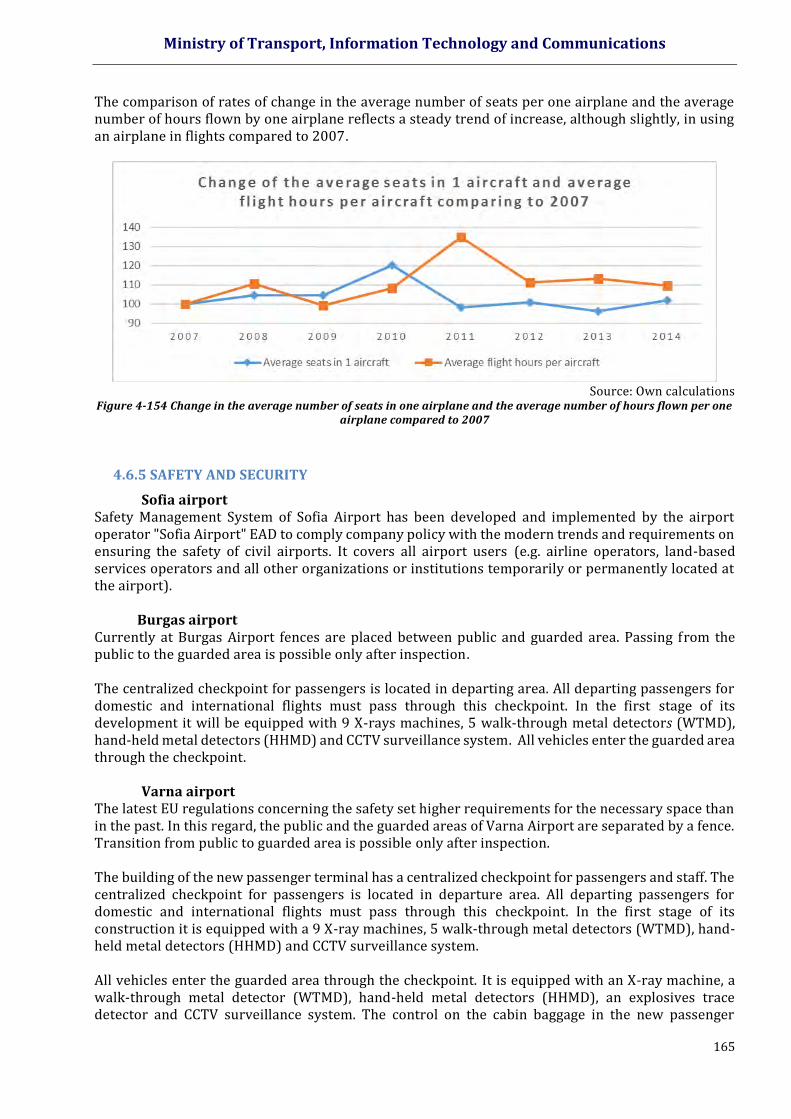
Ministry of Transport, Information Technology and Communications
165
The comparison of rates of change in the average number of seats per one airplane and the average number of hours flown by one airplane reflects a steady trend of increase, although slightly, in using an airplane in flights compared to 2007.
Source: Own calculations
Figure 4-154 Change in the average number of seats in one airplane and the average number of hours flown per one airplane compared to 2007
4.6.5 SAFETY AND SECURITY
Sofia airport Safety Management System of Sofia Airport has been developed and implemented by the airport operator "Sofia Airport" EAD to comply company policy with the modern trends and requirements on ensuring the safety of civil airports. It covers all airport users (e.g. airline operators, land-based services operators and all other organizations or institutions temporarily or permanently located at the airport).
Burgas airport Currently at Burgas Airport fences are placed between public and guarded area. Passing from the public to the guarded area is possible only after inspection. The centralized checkpoint for passengers is located in departing area. All departing passengers for domestic and international flights must pass through this checkpoint. In the first stage of its development it will be equipped with 9 X-rays machines, 5 walk-through metal detectors (WTMD), hand-held metal detectors (HHMD) and CCTV surveillance system. All vehicles enter the guarded area through the checkpoint.
Varna airport The latest EU regulations concerning the safety set higher requirements for the necessary space than in the past. In this regard, the public and the guarded areas of Varna Airport are separated by a fence. Transition from public to guarded area is possible only after inspection. The building of the new passenger terminal has a centralized checkpoint for passengers and staff. The centralized checkpoint for passengers is located in departure area. All departing passengers for domestic and international flights must pass through this checkpoint. In the first stage of its construction it is equipped with a 9 X-ray machines, 5 walk-through metal detectors (WTMD), hand-held metal detectors (HHMD) and CCTV surveillance system. All vehicles enter the guarded area through the checkpoint. It is equipped with an X-ray machine, a walk-through metal detector (WTMD), hand-held metal detectors (HHMD), an explosives trace detector and CCTV surveillance system. The control on the cabin baggage in the new passenger
Ministry of Transport, Information Technology and Communications
166
terminal is carried out by two automatic X-ray machines and is located behind the registration area. The new system has an explosives trace detector (ETD). The existing perimeter fence and road network fully comply with the regulations.
Gorna Oryahovitsa airport There is established a Safety management system. The responsibilities of personnel in the performance of their duties (management, employees, contractors) have been determined and duly specified. The safety provisions are implemented according to regulations in civil aviation. For this purpose were developed plans, instructions and manuals which specify the duties of staff to comply with the regulated levels of flight safety. A safety group is established with members from all entities (airport, air traffic control, aviation operators), which periodically identifies measures to revise the activities and documents in order to improve flight safety.
4.6.6 INTELLIGENT TRANSPORT SYSTEMS IN AIR TRANSPORT
The European air traffic management system (ATM) is an extremely complex process. In Europe there is no established single ATM system through which air traffic is managed at European level. Daily in the skies over Europe there are 33,000 flights, which makes its airspace one of the busiest in the world. The Single European Sky (SES) is an ambitious initiative launched by the European Commission in 2004 with the aim of reforming the structure of the European ATM network. SES offers, through legal approach, to meet the future needs for capacity and safety in the provision of air navigation services rather at European level, and not just nationwide. The key objectives of the SES are as follows19:
- Restructuring of the European airspace as a function of the air traffic flow; - Creation of additional capacity; - Increasing the overall efficiency of the ATM management. - In order to meet the key objectives, in 2012 the Commission set high level objectives for SES to be achieving by 2020 and beyond: - Increasing the capacity three times, thus reducing delays on the ground and in the air; - Improve safety by a factor of 10; - Reduce by 10% the environmental impact; - Reduction of air navigation charges by 50%.
The main intent of the implementation of intelligent transport systems in air transport is related to air traffic control and in this respect, at European level, a program of modernization of the infrastructure for air traffic control with the EU - SESAR (Single European Sky ATM Research) has been developed and implemented. The project to modernize air traffic management in Europe (SESAR) is the technological pillar of the Single European Sky. Its objective is to develop unique and innovative technology solutions to support the achievement of the SES. SESAR is the mechanism which aims to coordinate and concentrate all research activities in ATM uniting the efforts of a wide range of experts for the development of ATM systems of new generation. The results of this project will ensure the safety and fluidity in air transport worldwide over the next 30 years. The total funding allocated for its implementation amounts to 2.1 bln. Euro20. The main objectives of the air traffic control are related to air traffic control and traffic management of aircraft; with airspace management and its organization in a way that allows maintenance of
19 Source: SESAR JU - http://www.sesarju.eu/ 20 Source: SESAR JU - http://www.sesarju.eu/
Ministry of Transport, Information Technology and Communications
167
various aircraft types, different volumes of traffic and different needs than resources; with capacity and flow management and prioritization of aircraft to ensure order in take-offs and landings. On the other hand, the main trends in the air traffic management (ATM) are related to:
Application of outdated ATM technologies;
Fragmentation of European airspace;
Continuous growth in air traffic, which causes delays and congestion at airports;
Higher requirements for environmental protection;
Need for greater cost efficiency. All of the above are the main reasons for the need for fundamental change in this area. The development of the SESAR project is in response to the identified needs. It is implemented at European level in three stages:
1 stage, Definition – implemented during the period 2004-2008 Within this stage, a master plan for air traffic management has been developed. Work on the project is managed by EUROCONTROL and is funded by the European Commission through the TEN-T program. It is performed by a consortium of representatives of various organizations in air transport, and it is open to those outside the EU. Over 70 organizations participate in the consortium, including: - Airport operators (AENA and SEAC) – consortium of the operators of BAA Airports Ltd., Flughafen München GmbH, Fraport AG, Schiphol Nederland B.V., Aéroports de Paris and Flughafen Zürich AG; - Operators of air navigation services (DFS, DSNA, ENAV NATS and NORACON) – consortium of Austro Control (Austria), AVINOR (Norway), EANS (Estonia), Finavia (Finland), IAA (Irland), ISAVIA (Island), LFV (Sweden) and Naviair (Denmark); - Equipment manufacturers (Frequentis, Honeywell, Indra, NATMIG, the SELEX Consortium and Thales) and - Aircraft manufacturers (Airbus, Alenia Aeronautica). The EU Council extended the duration of the SESAR Joint Undertaking – SJU, until 31 December 2024. This is a unique public-private partnership to develop ATM systems of a new generation to take over the increasing traffic in accordance with the safest, most cost-effective and environmental conditions. SJU is the body responsible for the European ATM Master Plan, which is a roadmap for all activities of the SJU and their future deployment.
2 stage, Development – implemented during the period 2008 -2013 A new generation of technological systems and components for the air traffic control, defined at the first stage, was created at the end of this stage. Following the model of the GALILEO project, a joint venture was established, which brings together public and private funds (EU, EUROCONTROL, air transport enterprises and third parties). This ensures a unified management structure of the project and consideration of the interests of all stakeholders.
3 stage, Deployment and Implementation - 2014 -2020 It is planned to build new infrastructure, both in Europe and in partner countries for air transport. This process will be implemented by air transport enterprises without further public funding. The objectives set by the SESAR program by 2020 are as follows:
Ministry of Transport, Information Technology and Communications
168
- Provide threefold increase in ATM capacity in the EU;
- Improve safety 10 times;
- Reduce by 50% the cost of ATM;
- Reduce pollution by 10%. The SESAR 2020 Research and Innovation Program will demonstrate the feasibility of technological and operational solutions that have already been developed within the first SESAR 2008-2016 program to bigger and more operationally integrated environments. At the same time SESAR 2020 will prioritize research and innovation in a number of areas such as air traffic management, airport capacity, network maintenance and distribution of ATM infrastructure. SESAR 2020 will retain its core members: the EU and Eurocontrol. The current members of the industry have already expressed their intention to continue their participation and new members and associates are expected to join as a result of calls for expressions of interest launched in 2014 BULATSA also expressed interest to participate in SESAR 2020 as part of a group led by the air navigation service provider for Italy - ENAV SpA21. Air navigation data and information quality are required in order to ensure safety and support for the new concepts of operation within the European Air Traffic Management Network (EATMN). The components of the systems and procedures used for the operation of the EATMN, must be interoperable with the systems used by other service providers. This can be achieved by building new systems and automated means. The requirements of Regulation (EU) 73/2010 apply to the systems of EATMN, to their parts and the procedures involved in the creation, production, storage, handling, processing, transfer and distribution of aeronautical data and air navigation information. This will improve the quality of air navigation data and information - accuracy, resolution and integrity in accordance with the European ATM Master Plan under the SESAR program, the task ITY-ADQ for quality of air navigation data and information to the European plan for the European Single Sky ImPlementation (ESSIP) and Regulation (EU) 73/2010. The requirements are applicable to airport operators and organizations related to the creation and provision of geodetic and cartographic materials and data. By improving the quality of aeronautical data and information will improve the management of civil aviation. In connection with the foregoing, OPTTI 2014-2020 has provided opportunities to ensure funding for measures to improve safety and air traffic management for the construction of new systems and management tools.
Deployment of SESAR The SESAR Deployment Manager – (SDM) is the organization that coordinates and synchronizes the modernization of the European ATM system under the political guidance of the European Commission (EC). The SESAR Deployment Alliance was appointed by the Commission to fulfil this role. The main task of the SESAR Deployment Manager is to develop and then submit to the EC for approval and implementation a Program for deployment under a Pilot Common Project, established by Commission Regulation (EU) No. 716/2014 and any other future joint projects in forthcoming regulations. Through the deployment program, the SESAR Deployment Manager will ensure effective synchronization and coordination of implementation projects requiring the introduction of PCP, and the related investment. The tasks of the SESAR Deployment Manager are described in Art. 9 of Regulation (EU) №409 / 201322. The SESAR Deployment Manager will coordinate the introduction of new technologies and solutions that have passed through the stages of testing and validation by the SESAR Joint Undertaking, providing significant benefits to airspace users and the environment. The SESAR Deployment Alliance, composed of Alliance A6, Alliance A4 and SDAG (the SESAR-related Deployment Airport Operators
21 Source: European Commission http://ec.europa.eu/transport/modes/air/ и SESAR JU – http://www.sesarju.eu/ 22 Source: SESAR Deployment Manager http://www.sesardeploymentmanager.eu/
Ministry of Transport, Information Technology and Communications
169
Group) will coordinate and synchronize for an initial period of six years work on increasing the competitiveness of European ATM system. BULATSA is part of the implementation level of deployment of SESAR and aims to contribute to the timely and synchronized introduction of the respective ATM functionalities of the Pilot Joint Project.
Realization of implementation projects for intelligent transport systems for the air transport in Bulgaria
Nearly 3,000 aircraft fly over Bulgaria for one day in peak periods. The trend is that this number of planes to become daily routine with the opening of the newly built airport in Istanbul. This is why an increase by 40 to 60 % for jobs for air traffic managers by 2017 is planned. A key moment in the development of one of the priority projects for our country – the DANUBE FAB, a successful introduction in late 2014 of two cross-border sectors between Bulgaria and Romania. This is the first establishment of cross-border sectors within the functional blocks of airspace in Europe. This initiative further optimizes the network of air routes, delivers real fuel savings, save flight time and reduces harmful effects on the environment. The introduction of these sectors is a demonstration of the excellent cooperation between the partners in the DANUBE FAB. Within the project, the state enterprise "Air Traffic Control" (BULATSA) continues with the deployment of elements of the airspace free route planning and service lines for data transmission between the pilots and the ground as part of an interim program for SESAR deployment. The SESAR project is the technological pillar of the Single European Sky. Its purpose is to provide the EU with high-quality infrastructure for air traffic control, which will enable the safe and environmentally sound development of air transport. BULATSA will continue to be an active part of the executive level of SESAR deployment program, and a series of meetings have already been conducted, outlining possibilities for future cooperation.
Projects for Single European Sky (SES) Functional airspace block (FAB) between The Republic of Bulgaria and Romania The establishment of FAB is an essential element of the legislative package of the Single European Sky (SES), which creates a system of measures to ensure sufficient capacity to serve the growing number of flights over Europe to reduce delays, enhance safety and cost efficiency of air navigation services and limit the impact on the environment (Grant Thornton, 2014). DANUBE FAB was established with the signing of an interstate agreement of the Ministers of Transport of the Republic of Bulgaria and Romania on 12 December 2011, effective as of 16 November 2012, following a ratification by the parliaments of Bulgaria and Romania within the period specified by the European Commission for the establishment of FAB in Europe – 4 December 2012. In order to achieve an optimal level of interaction within the DANUBE FAB, cooperation agreements were signed at the level of air navigation service providers (BULATSA and ROMATSA) and at the level of the national supervisory authorities (NSAs). The establishment of DANUBE FAB is co-financed with funds allocated by the TEN-T program of the European Commission. A key achievement for the DANUBE FAB 2014 is the establishment of two cross-sector air traffic services, it is the first such step in the functional airspace block in Europe. The two border sectors were introduced on the basis of operational requirements for optimal use of the airspace regardless of national borders. The introduction of border sections between Bulgaria and
Ministry of Transport, Information Technology and Communications
170
Romania is a further step towards the defragmentation of European airspace – this is a major objective of SES. Improving the organization of airspace with the help of the DANUBE FAB is an ongoing task and priority to the Bulgarian-Romanian management team of the activities in the functional block. For this purpose, large-scale simulations and studies are carried out in order to assess and compare the various options for the organization of airspace and routes in the DANUBE FAB, in view of indicators such as flight efficiency, safety, capacity, etc. Since November 2013 Free Route Airspace has been implemented during the night and at a national level. Phased full implementation of Free Route Airspace is planned in accordance with European legislation. In June 2014 Bulgaria and Romania presented a joint effectiveness plan for the second reference period (2015-2019) in accordance with Regulation (EU) No. 390/2013 to determine the performance scheme for air navigation services and network functions. In the DANUBE FAB there is active work on establishing a greater cooperation with neighbouring functional blocks. Within the functional block there is an organization created to conduct joint procurement for the purpose of streamlining the technical infrastructure and improving cost efficiency through economies of scale. There is also a Social Consultative Forum of the DANUBE FAB, which is a mechanism for cooperation with the social partners in BULATSA and ROMATSA.
Projects under the SESAR Program BULATSA is part of the implementation level of the SESAR deployment and aims to contribute to the timely and synchronized introduction of the respective ATM functionalities of the joint pilot project. The undertaking is in the process of modernization of the SATCAS automated air traffic management system. The system continuously monitors the flight path giving warning of deviations from the flight plan and automated coordination of the conditions of a particular flight between working sites. It supports automated civil - military coordination in real time in accordance with the concept of EUROCONTROL for flexible airspace use. SATCAS allows for automatic prediction of conflicts in the mid-long term (up to 20 min in advance) and provides warnings for near collision situations for aircraft with another aircraft with the ground, and dangerous and no fly zones. The modernization will allow the introduction of new functionalities, improving system performance and increase of the level of safety in air traffic services. Automated ATM system is designed for collecting, processing and display of radar and flight information to assist air traffic controllers and others at operating positions with automated tools. The modernization meets the requirements of the National Programme for the introduction of the Single European Sky and EU regulations. The system has the following main functions:
- SDPS (Surveillance Data Processing System); - FDPS (Flight Data Processing System); - ODS (Operational Display System); - TMCS (Technical Monitoring and Control System); - RPB (Recording and Playback System); - TRS (Time Reference System); - SN (Safety Nets). - GTW (Provision of entry-exit connectivity with remote centres).
- The ATM automated system provides the following work places: - 12 sectors for control of flyover traffic; - 2 sectors for traffic control in the area of the Sofia Airport; - 2 work places for military air traffic;
Ministry of Transport, Information Technology and Communications
171
- 2 work places for Sofia - Kulata; - 1 sector for traffic control in the region of the Varna Airport; - 1 sector for traffic control in the area of the Burgas Airport; - 2 work places for Varna - Tower; - 2 work places for Burgas - Tower; - 3 work places for servicing low flight aviation (airspace of Class G by the ICAO
classification); - Work places for planning centre and allocation of airspace flow management of air
traffic, air traffic - shift head and air traffic manager assistant; - Work places to provide a 24 hour monitoring of both the entire system of duty
engineer, and the duty engineers by subsystems and remote centres.
The basic principle, observed in the process of the design and construction of the system, is double-backing for all servers, communication lines and power supply. The SATCAS system uses only electronic stripmarks. SATCAS functionalities enable automatic exchange of flight information with neighbouring ACC and display of hazardous events. The system carries out simultaneous processing of 15 radar stations and it can cover an area measuring 1024 x 1024 sea miles. An important feature of the SATCAS system is the inclusion of remote centres - ACS and ACT Varna and ACS and ACT Burgas. Characteristic of this system architecture is the main processing of the multi-radar information, the system flight data and supporting information is done centrally by the ACC Sofia and the remote centres are essentially clients of the centralized system.
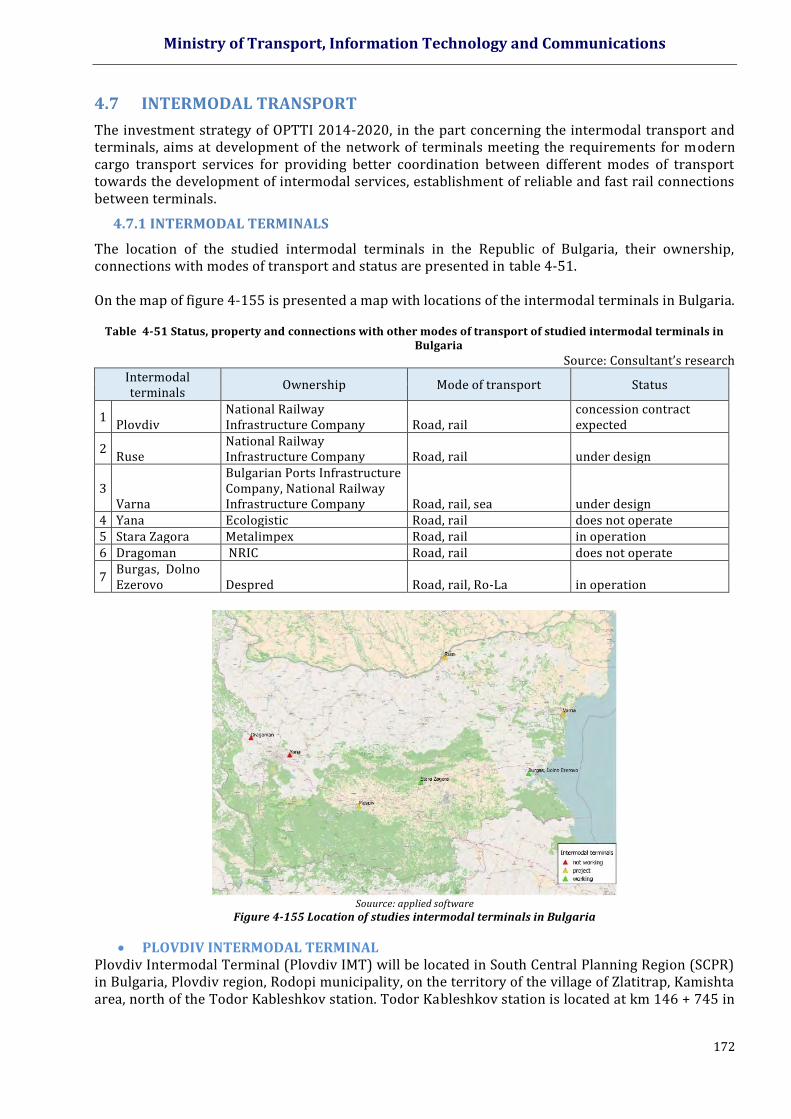
Ministry of Transport, Information Technology and Communications
172
4.7 INTERMODAL TRANSPORT
The investment strategy of OPTTI 2014-2020, in the part concerning the intermodal transport and terminals, aims at development of the network of terminals meeting the requirements for modern cargo transport services for providing better coordination between different modes of transport towards the development of intermodal services, establishment of reliable and fast rail connections between terminals.
4.7.1 INTERMODAL TERMINALS
The location of the studied intermodal terminals in the Republic of Bulgaria, their ownership, connections with modes of transport and status are presented in table 4-51.
On the map of figure 4-155 is presented a map with locations of the intermodal terminals in Bulgaria.
Table 4-51 Status, property and connections with other modes of transport of studied intermodal terminals in
Bulgaria
Source: Consultant’s research
Intermodal terminals
Ownership Mode of transport Status
1 Plovdiv
National Railway Infrastructure Company Road, rail
concession contract expected
2 Ruse
National Railway Infrastructure Company Road, rail under design
3 Varna
Bulgarian Ports Infrastructure Company, National Railway Infrastructure Company Road, rail, sea under design
4 Yana Ecologistic Road, rail does not operate 5 Stara Zagora Metalimpex Road, rail in operation 6 Dragoman NRIC Road, rail does not operate
7 Burgas, Dolno Ezerovo Despred Road, rail, Ro-La in operation
Souurce: applied software
Figure 4-155 Location of studies intermodal terminals in Bulgaria
PLOVDIV INTERMODAL TERMINAL Plovdiv Intermodal Terminal (Plovdiv IMT) will be located in South Central Planning Region (SCPR) in Bulgaria, Plovdiv region, Rodopi municipality, on the territory of the village of Zlatitrap, Kamishta area, north of the Todor Kableshkov station. Todor Kableshkov station is located at km 146 + 745 in
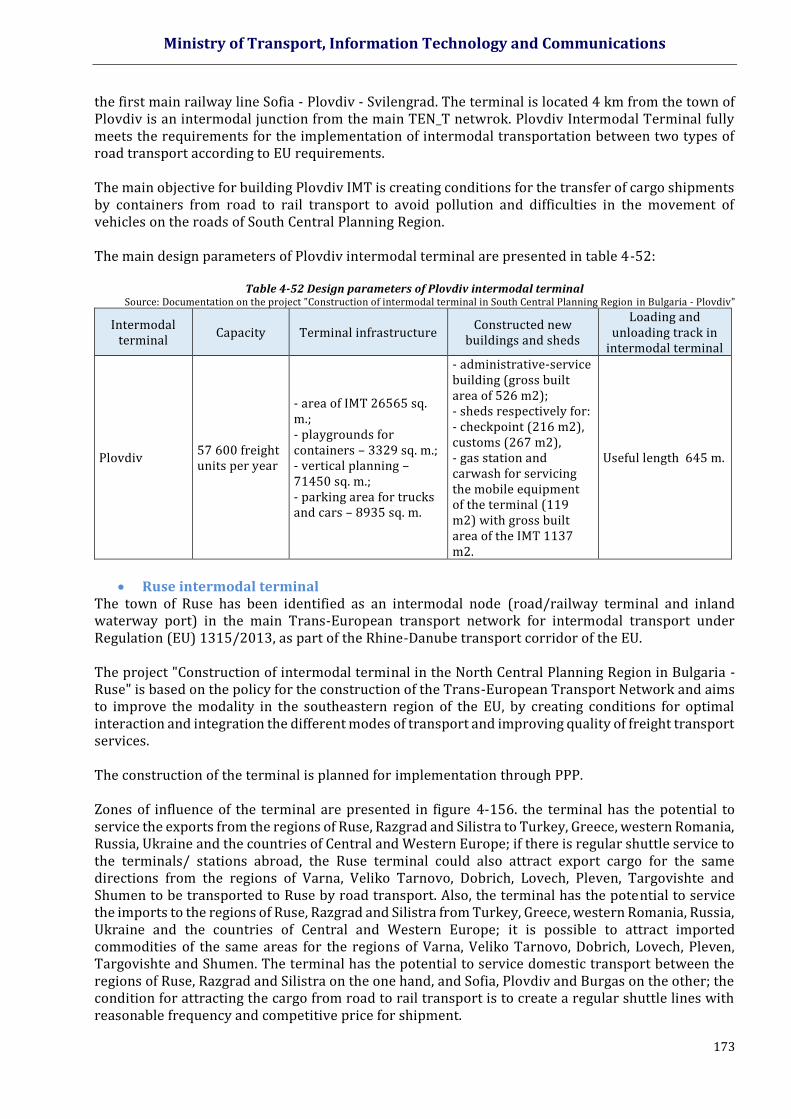
Ministry of Transport, Information Technology and Communications
173
the first main railway line Sofia - Plovdiv - Svilengrad. The terminal is located 4 km from the town of Plovdiv is an intermodal junction from the main TEN_T netwrok. Plovdiv Intermodal Terminal fully meets the requirements for the implementation of intermodal transportation between two types of road transport according to EU requirements. The main objective for building Plovdiv IMT is creating conditions for the transfer of cargo shipments by containers from road to rail transport to avoid pollution and difficulties in the movement of vehicles on the roads of South Central Planning Region. The main design parameters of Plovdiv intermodal terminal are presented in table 4-52:
Table 4-52 Design parameters of Plovdiv intermodal terminal
Source: Documentation on the project "Construction of intermodal terminal in South Central Planning Region in Bulgaria - Plovdiv"
Intermodal terminal
Capacity Terminal infrastructure Constructed new
buildings and sheds
Loading and unloading track in
intermodal terminal
Plovdiv 57 600 freight units per year
- area of IMT 26565 sq. m.; - playgrounds for containers – 3329 sq. m.; - vertical planning – 71450 sq. m.; - parking area for trucks and cars – 8935 sq. m.
- administrative-service building (gross built area of 526 m2); - sheds respectively for: - checkpoint (216 m2), customs (267 m2), - gas station and carwash for servicing the mobile equipment of the terminal (119 m2) with gross built area of the IMT 1137 m2.
Useful length 645 m.
Ruse intermodal terminal
The town of Ruse has been identified as an intermodal node (road/railway terminal and inland waterway port) in the main Trans-European transport network for intermodal transport under Regulation (EU) 1315/2013, as part of the Rhine-Danube transport corridor of the EU. The project "Construction of intermodal terminal in the North Central Planning Region in Bulgaria - Ruse" is based on the policy for the construction of the Trans-European Transport Network and aims to improve the modality in the southeastern region of the EU, by creating conditions for optimal interaction and integration the different modes of transport and improving quality of freight transport services. The construction of the terminal is planned for implementation through PPP. Zones of influence of the terminal are presented in figure 4-156. the terminal has the potential to service the exports from the regions of Ruse, Razgrad and Silistra to Turkey, Greece, western Romania, Russia, Ukraine and the countries of Central and Western Europe; if there is regular shuttle service to the terminals/ stations abroad, the Ruse terminal could also attract export cargo for the same directions from the regions of Varna, Veliko Tarnovo, Dobrich, Lovech, Pleven, Targovishte and Shumen to be transported to Ruse by road transport. Also, the terminal has the potential to service the imports to the regions of Ruse, Razgrad and Silistra from Turkey, Greece, western Romania, Russia, Ukraine and the countries of Central and Western Europe; it is possible to attract imported commodities of the same areas for the regions of Varna, Veliko Tarnovo, Dobrich, Lovech, Pleven, Targovishte and Shumen. The terminal has the potential to service domestic transport between the regions of Ruse, Razgrad and Silistra on the one hand, and Sofia, Plovdiv and Burgas on the other; the condition for attracting the cargo from road to rail transport is to create a regular shuttle lines with reasonable frequency and competitive price for shipment.
Ministry of Transport, Information Technology and Communications
174
Source: Report on the implementation of Stage 1 (Feasibility studies) of project "Construction of intermodal terminal in Nort h Central
Planning Region in Bulgaria - Ruse"
Legend: Areas located at road distance of 150 kilometres (dark green) and 200 km (light green) from Ruse
Figure 4-156 Zones of influence of Ruse IMT
Container traffic in the zone of influence of Ruse IMT is presented in table 4-53:
Table 4-53 Container traffic (forecast) within the zone of influence of Ruse IMT
Source: Report on the implementation of Stage 1 (Feasibility studies) of project "Construction of intermodal terminal in North Central Planning Region in Bulgaria - Ruse"
2020 2030 2040 2045
tonnes 362928 441554 536780 597380
domestic 38524 42226 47315 49045
exports 199790 237566 281622 312115
imports 124613 161762 207844 236219
TEU/full TEU 20981 27449 34488 39236
domestic 2903 3181 3564 3691
exports 12406 15685 18986 21416
imports 5672 8583 11938 14129
Varna intermodal terminal
The city of Varna is located along VIII Pan-European Transport Corridor, which connects the Adriatic Sea with the Black Sea through Albania, Macedonia and Bulgaria and TRACECA, connecting Central Europe with the countries of Transcaucasia, Central Asia and China. The Ruse Varna railway line is providing connection with the largest river port on the Danube River - Ruse belonging to the VII Trans-European corridor and is a junction on the TEN-T network. The purpose of the construction of an intermodal terminal in the region of the town of Varna is the improvement of the intermodality in the south-eastern region of the EU, by creating conditions for the optimal interaction and integration of the various transport modes. As a result of the project completion it is expected to provide an opportunity for effective transportation of large freight volumes from the Black Sea to Central Europe and the EU transport hubs. The construction of Varna IMT aims to ensure opportunities for better transport links in the following directions: -Varna - Sofia and vice versa; -Varna - Ruse with the ability to communicate effectively with Constanta and vice versa;
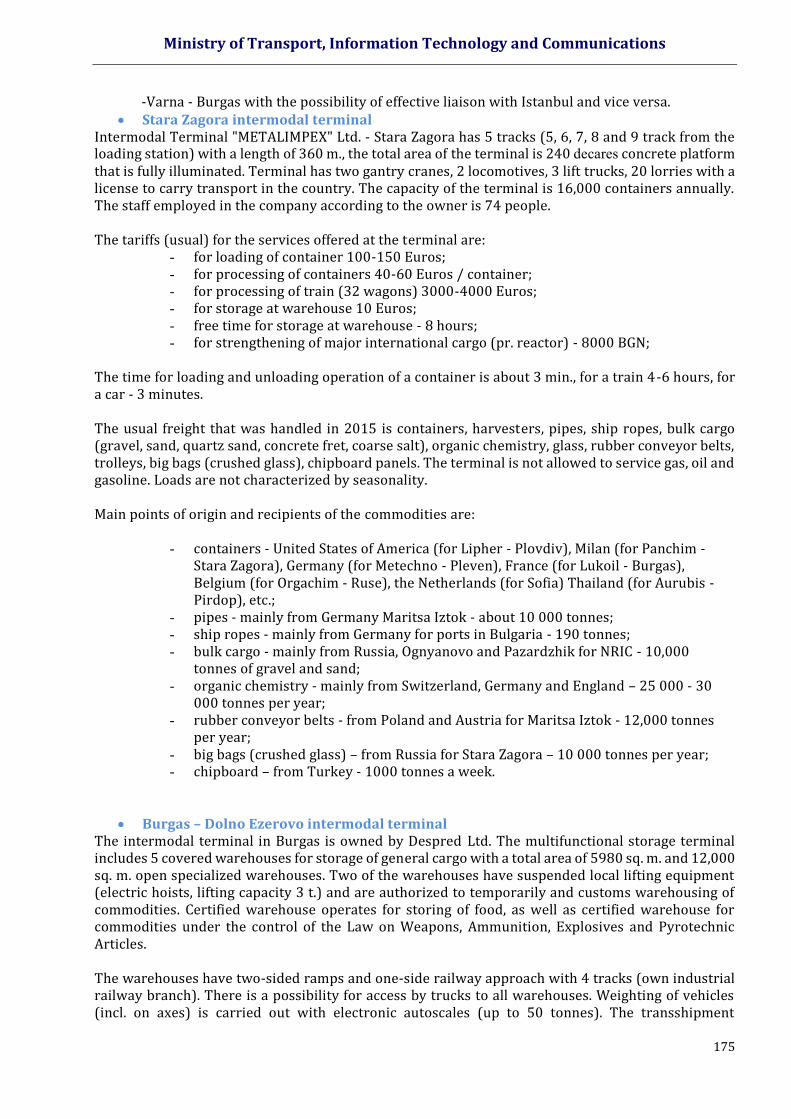
Ministry of Transport, Information Technology and Communications
175
-Varna - Burgas with the possibility of effective liaison with Istanbul and vice versa. Stara Zagora intermodal terminal
Intermodal Terminal "METALIMPEX" Ltd. - Stara Zagora has 5 tracks (5, 6, 7, 8 and 9 track from the loading station) with a length of 360 m., the total area of the terminal is 240 decares concrete platform that is fully illuminated. Terminal has two gantry cranes, 2 locomotives, 3 lift trucks, 20 lorries with a license to carry transport in the country. The capacity of the terminal is 16,000 containers annually. The staff employed in the company according to the owner is 74 people.
The tariffs (usual) for the services offered at the terminal are:
- for loading of container 100-150 Euros; - for processing of containers 40-60 Euros / container; - for processing of train (32 wagons) 3000-4000 Euros; - for storage at warehouse 10 Euros; - free time for storage at warehouse - 8 hours; - for strengthening of major international cargo (pr. reactor) - 8000 BGN;
The time for loading and unloading operation of a container is about 3 min., for a train 4-6 hours, for a car - 3 minutes. The usual freight that was handled in 2015 is containers, harvesters, pipes, ship ropes, bulk cargo (gravel, sand, quartz sand, concrete fret, coarse salt), organic chemistry, glass, rubber conveyor belts, trolleys, big bags (crushed glass), chipboard panels. The terminal is not allowed to service gas, oil and gasoline. Loads are not characterized by seasonality. Main points of origin and recipients of the commodities are:
- containers - United States of America (for Lipher - Plovdiv), Milan (for Panchim - Stara Zagora), Germany (for Metechno - Pleven), France (for Lukoil - Burgas), Belgium (for Orgachim - Ruse), the Netherlands (for Sofia) Thailand (for Aurubis - Pirdop), etc.;
- pipes - mainly from Germany Maritsa Iztok - about 10 000 tonnes; - ship ropes - mainly from Germany for ports in Bulgaria - 190 tonnes; - bulk cargo - mainly from Russia, Ognyanovo and Pazardzhik for NRIC - 10,000
tonnes of gravel and sand; - organic chemistry - mainly from Switzerland, Germany and England – 25 000 - 30
000 tonnes per year; - rubber conveyor belts - from Poland and Austria for Maritsa Iztok - 12,000 tonnes
per year; - big bags (crushed glass) – from Russia for Stara Zagora – 10 000 tonnes per year; - chipboard – from Turkey - 1000 tonnes a week.
Burgas – Dolno Ezerovo intermodal terminal The intermodal terminal in Burgas is owned by Despred Ltd. The multifunctional storage terminal includes 5 covered warehouses for storage of general cargo with a total area of 5980 sq. m. and 12,000 sq. m. open specialized warehouses. Two of the warehouses have suspended local lifting equipment (electric hoists, lifting capacity 3 t.) and are authorized to temporarily and customs warehousing of commodities. Certified warehouse operates for storing of food, as well as certified warehouse for commodities under the control of the Law on Weapons, Ammunition, Explosives and Pyrotechnic Articles. The warehouses have two-sided ramps and one-side railway approach with 4 tracks (own industrial railway branch). There is a possibility for access by trucks to all warehouses. Weighting of vehicles (incl. on axes) is carried out with electronic autoscales (up to 50 tonnes). The transshipment
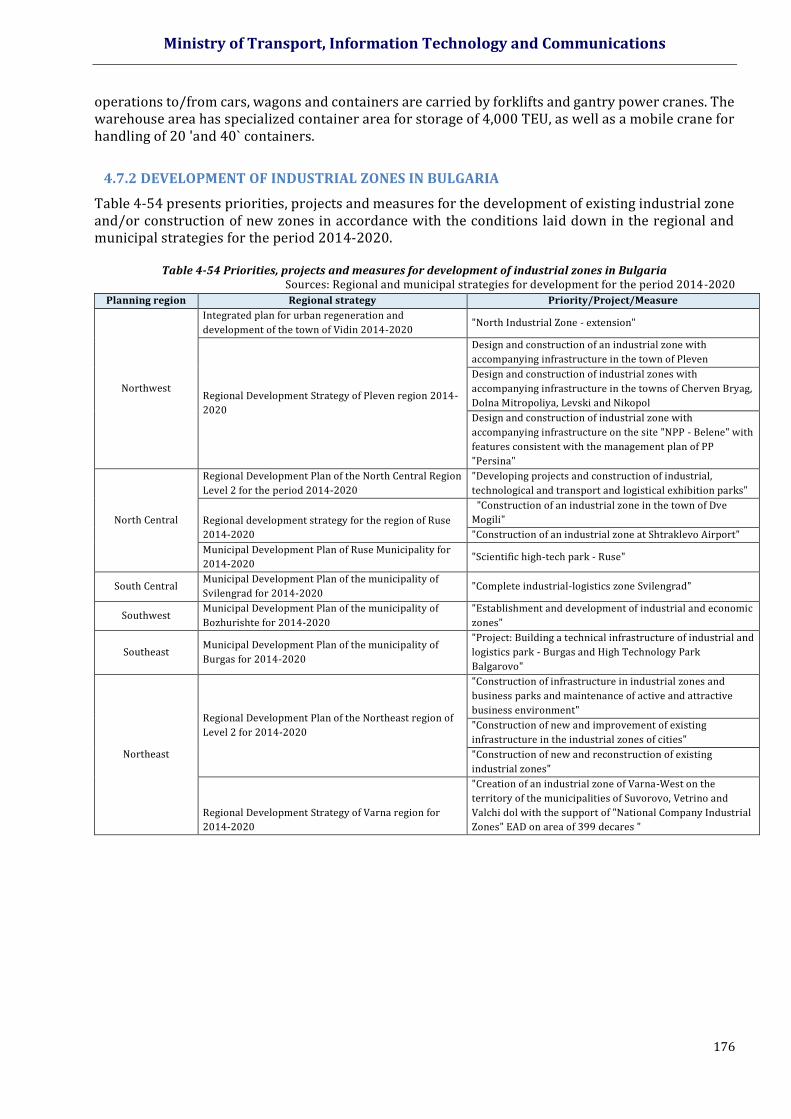
Ministry of Transport, Information Technology and Communications
176
operations to/from cars, wagons and containers are carried by forklifts and gantry power cranes. The warehouse area has specialized container area for storage of 4,000 TEU, as well as a mobile crane for handling of 20 'and 40` containers.
4.7.2 DEVELOPMENT OF INDUSTRIAL ZONES IN BULGARIA
Table 4-54 presents priorities, projects and measures for the development of existing industrial zone and/or construction of new zones in accordance with the conditions laid down in the regional and municipal strategies for the period 2014-2020.
Table 4-54 Priorities, projects and measures for development of industrial zones in Bulgaria
Sources: Regional and municipal strategies for development for the period 2014-2020
Planning region Regional strategy Priority/Project/Measure
Northwest
Integrated plan for urban regeneration and
development of the town of Vidin 2014-2020 "North Industrial Zone - extension"
Regional Development Strategy of Pleven region 2014-
2020
Design and construction of an industrial zone with
accompanying infrastructure in the town of Pleven
Design and construction of industrial zones with
accompanying infrastructure in the towns of Cherven Bryag,
Dolna Mitropoliya, Levski and Nikopol
Design and construction of industrial zone with
accompanying infrastructure on the site "NPP - Belene" with
features consistent with the management plan of PP
"Persina"
North Central
Regional Development Plan of the North Central Region
Level 2 for the period 2014-2020
"Developing projects and construction of industrial,
technological and transport and logistical exhibition parks"
Regional development strategy for the region of Ruse
2014-2020
"Construction of an industrial zone in the town of Dve
Mogili"
"Construction of an industrial zone at Shtraklevo Airport"
Municipal Development Plan of Ruse Municipality for
2014-2020 "Scientific high-tech park - Ruse"
South Central Municipal Development Plan of the municipality of
Svilengrad for 2014-2020 "Complete industrial-logistics zone Svilengrad"
Southwest Municipal Development Plan of the municipality of
Bozhurishte for 2014-2020
"Establishment and development of industrial and economic
zones"
Southeast Municipal Development Plan of the municipality of
Burgas for 2014-2020
"Project: Building a technical infrastructure of industrial and
logistics park - Burgas and High Technology Park
Balgarovo"
Northeast
Regional Development Plan of the Northeast region of
Level 2 for 2014-2020
"Construction of infrastructure in industrial zones and
business parks and maintenance of active and attractive
business environment"
"Construction of new and improvement of existing
infrastructure in the industrial zones of cities"
"Construction of new and reconstruction of existing
industrial zones"
Regional Development Strategy of Varna region for
2014-2020
"Creation of an industrial zone of Varna-West on the
territory of the municipalities of Suvorovo, Vetrino and
Valchi dol with the support of "National Company Industrial
Zones" EAD on area of 399 decares "
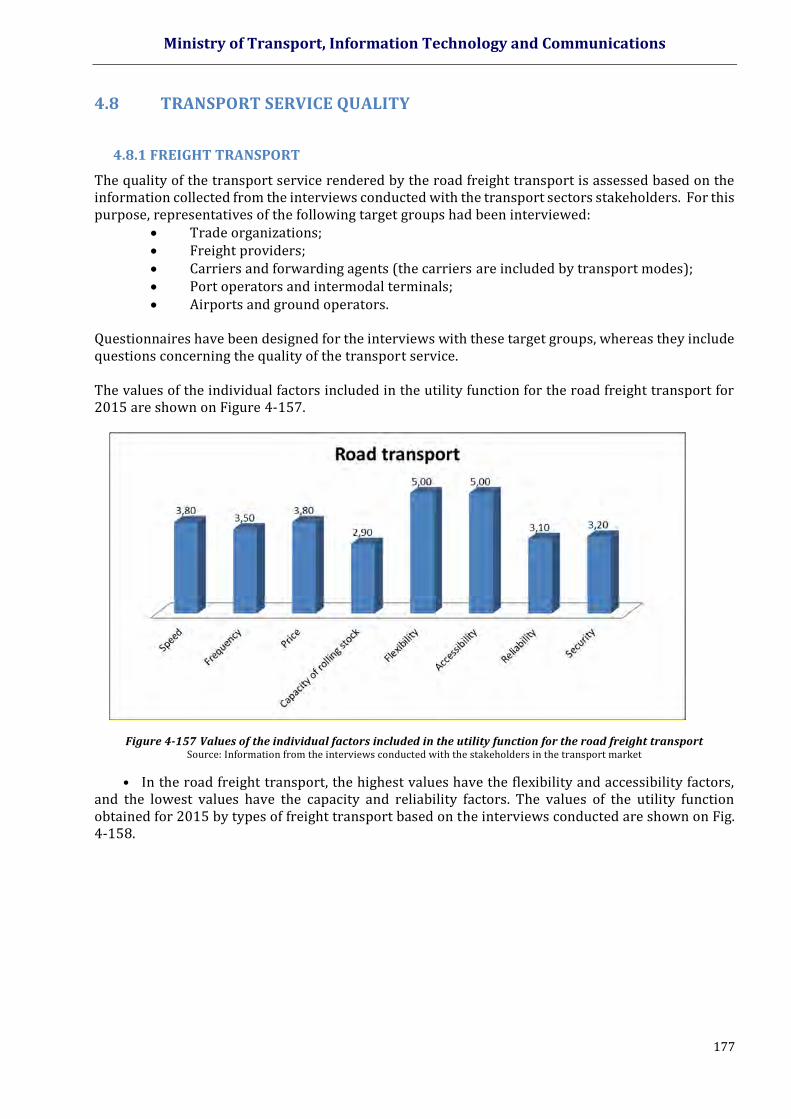
Ministry of Transport, Information Technology and Communications
177
4.8 TRANSPORT SERVICE QUALITY
4.8.1 FREIGHT TRANSPORT
The quality of the transport service rendered by the road freight transport is assessed based on the information collected from the interviews conducted with the transport sectors stakeholders. For this purpose, representatives of the following target groups had been interviewed:
Trade organizations; Freight providers; Carriers and forwarding agents (the carriers are included by transport modes); Port operators and intermodal terminals; Airports and ground operators.
Questionnaires have been designed for the interviews with these target groups, whereas they include questions concerning the quality of the transport service. The values of the individual factors included in the utility function for the road freight transport for 2015 are shown on Figure 4-157.
Figure 4-157 Values of the individual factors included in the utility function for the road freight transport Source: Information from the interviews conducted with the stakeholders in the transport market
• In the road freight transport, the highest values have the flexibility and accessibility factors, and the lowest values have the capacity and reliability factors. The values of the utility function obtained for 2015 by types of freight transport based on the interviews conducted are shown on Fig. 4-158.
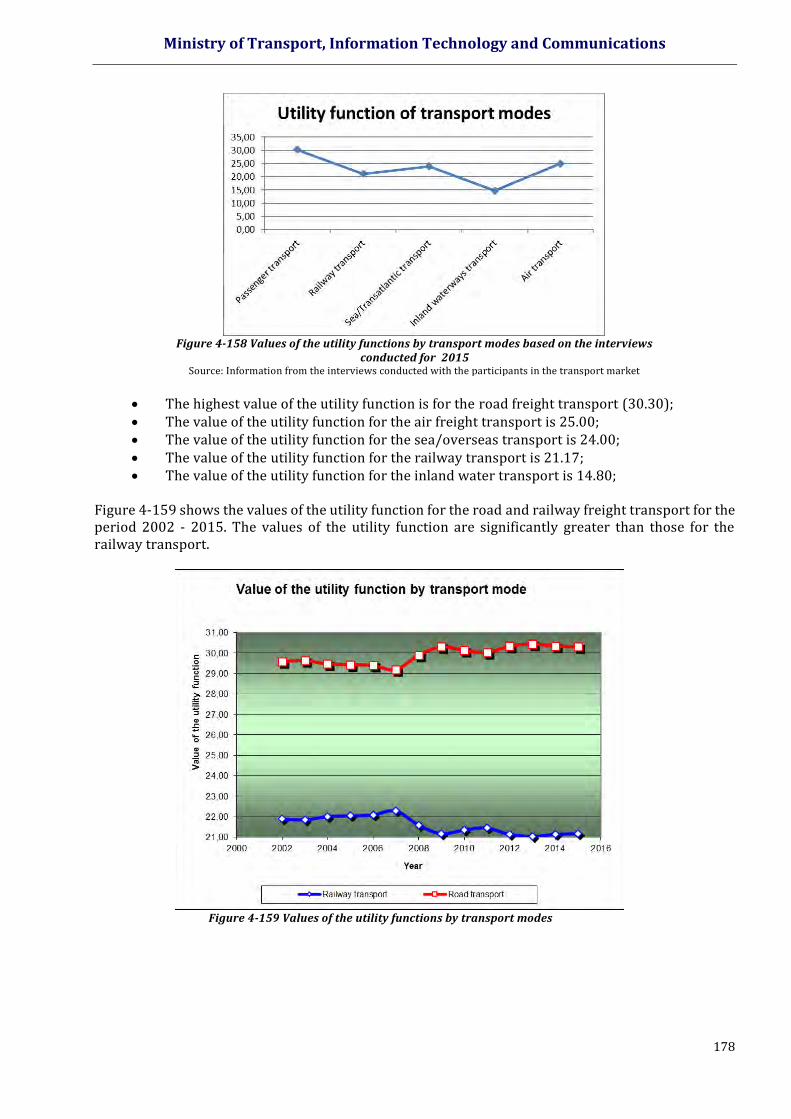
Ministry of Transport, Information Technology and Communications
178
Figure 4-158 Values of the utility functions by transport modes based on the interviews
conducted for 2015 Source: Information from the interviews conducted with the participants in the transport market
The highest value of the utility function is for the road freight transport (30.30); The value of the utility function for the air freight transport is 25.00; The value of the utility function for the sea/overseas transport is 24.00; The value of the utility function for the railway transport is 21.17; The value of the utility function for the inland water transport is 14.80;
Figure 4-159 shows the values of the utility function for the road and railway freight transport for the period 2002 - 2015. The values of the utility function are significantly greater than those for the railway transport.
Figure 4-159 Values of the utility functions by transport modes

Ministry of Transport, Information Technology and Communications
179
4.8.2 PASSENGER TRANSPORT
On the indicators included in the utility function of the road passenger transport, the following conclusions can be drawn23:
72,60 % of the persons interviewed consider that the passenger road transport is the most convenient;
61,50 % of the persons interviewed consider that the road transport is the most reliable; 78,50 % of the persons interviewed consider that the road transport is the fastest; 13,10 % of the persons interviewed consider that the bus transport is the most convenient; 13,10 % of the persons interviewed consider that the bus transport is the most-reliable; 13,90 % of the persons interviewed consider that the bus transport is the fastest;
The highest are the values of the indicators included in the utility function for the road passenger transport. Lower are values of the factors for the bus and railway transport. The values of the utility function for the passenger road transport (cars / buses) for the period 2010-2015 are presented in Table 4-55. For both surface transport - rail and bus transport, the market shares decrease for account of the car transport. For most people, the utility function has the highest value when using cars irrespective of the higher travel price.
Table 4-55 Utility function values
Year 2010 2011 2012 2013 2014 2015
Road transport 29 29.04 29.06 29.07 29.08 29.09
Bus transport 22.04 21.74 21.44 21.18 20.97 20.79
Railway transport
19.29 18.98 18.82 18.68 18.53 18.39
The highest value of the utility function is for road passenger transport, followed by bus and railway transport. The result of the analysis conducted shows that the quality of the rendered passenger bus services decreases leading to a reduced value of the utility function. The value of the utility function for passengers using cars increases. For 2014, the function value was 29.08, which according to the assessment scale means that the rendered services are of "excellent" quality. The value of the utility function for passengers using buses for 2014 is 20.97 and corresponds to "very good quality". CUSTOMERS’ MOTIVATION AND PREFERENCES Most of the passengers expressed their preference to travel outside the urban environment by road transport (cars). The next preference is given to the rail and finally to the bus transport. The most preferred vehicle is the car, followed by bus and train.
Most of the passengers prefer the road transport as travel means outside the urban environment –56.70 % men and 35.00 % women;
18.20 % men and 28.20 % women prefer to travel by bus; 25.10 % men and 36.80 % women prefer to travel by train.
23 Data are obtained from a national survey for determining the cost of time. Sources: http://www.bgregio.eu/media/files/integriran_gradski_transport/Nacionalno%20prouchvane.rar
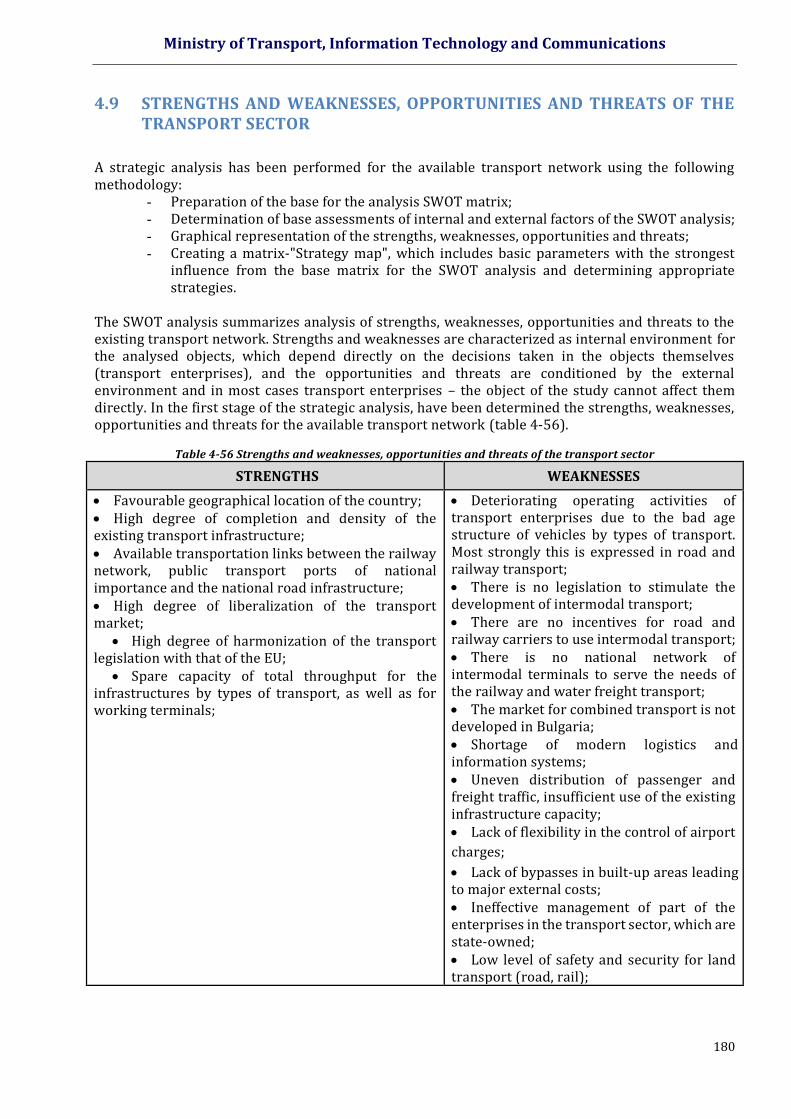
Ministry of Transport, Information Technology and Communications
180
4.9 STRENGTHS AND WEAKNESSES, OPPORTUNITIES AND THREATS OF THE TRANSPORT SECTOR
A strategic analysis has been performed for the available transport network using the following methodology:
- Preparation of the base for the analysis SWOT matrix; - Determination of base assessments of internal and external factors of the SWOT analysis; - Graphical representation of the strengths, weaknesses, opportunities and threats; - Creating a matrix-"Strategy map", which includes basic parameters with the strongest
influence from the base matrix for the SWOT analysis and determining appropriate strategies.
The SWOT analysis summarizes analysis of strengths, weaknesses, opportunities and threats to the existing transport network. Strengths and weaknesses are characterized as internal environment for the analysed objects, which depend directly on the decisions taken in the objects themselves (transport enterprises), and the opportunities and threats are conditioned by the external environment and in most cases transport enterprises – the object of the study cannot affect them directly. In the first stage of the strategic analysis, have been determined the strengths, weaknesses, opportunities and threats for the available transport network (table 4-56).
Table 4-56 Strengths and weaknesses, opportunities and threats of the transport sector
STRENGTHS WEAKNESSES
Favourable geographical location of the country; High degree of completion and density of the existing transport infrastructure; Available transportation links between the railway network, public transport ports of national importance and the national road infrastructure; High degree of liberalization of the transport market;
High degree of harmonization of the transport legislation with that of the EU;
Spare capacity of total throughput for the infrastructures by types of transport, as well as for working terminals;
Deteriorating operating activities of transport enterprises due to the bad age structure of vehicles by types of transport. Most strongly this is expressed in road and railway transport; There is no legislation to stimulate the development of intermodal transport; There are no incentives for road and railway carriers to use intermodal transport; There is no national network of intermodal terminals to serve the needs of the railway and water freight transport; The market for combined transport is not developed in Bulgaria; Shortage of modern logistics and information systems; Uneven distribution of passenger and freight traffic, insufficient use of the existing infrastructure capacity; Lack of flexibility in the control of airport
charges;
Lack of bypasses in built-up areas leading to major external costs; Ineffective management of part of the enterprises in the transport sector, which are state-owned; Low level of safety and security for land transport (road, rail);
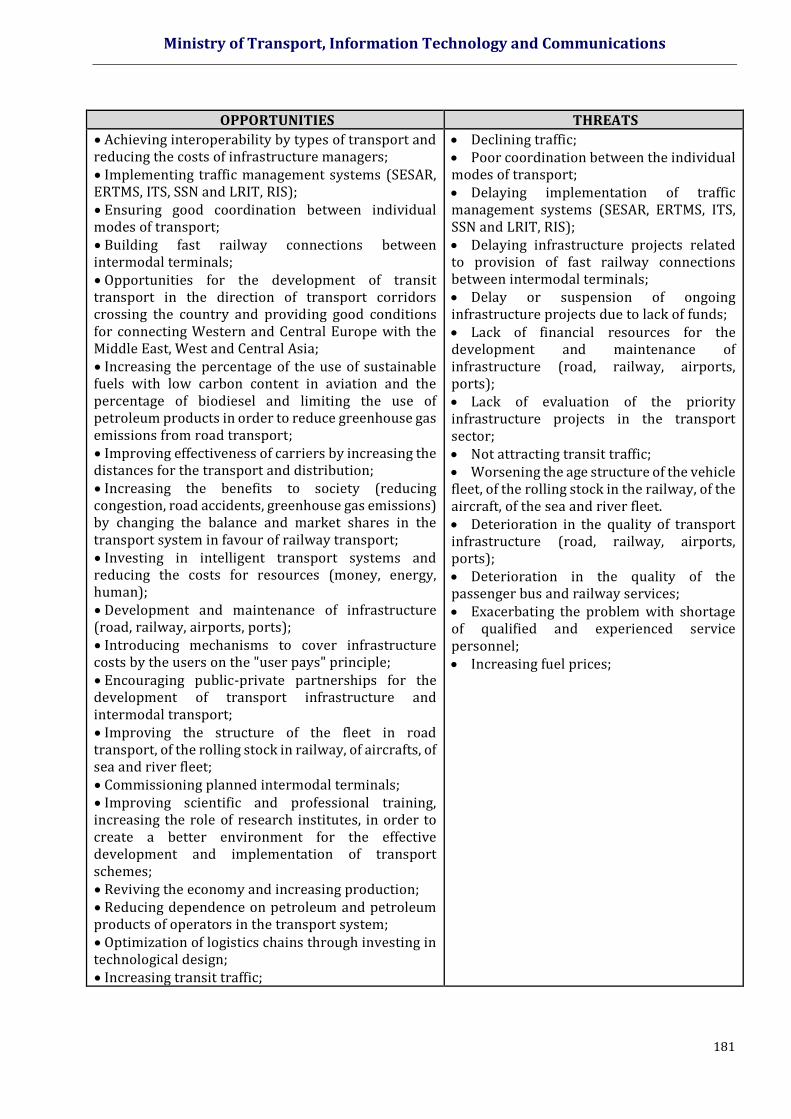
Ministry of Transport, Information Technology and Communications
181
OPPORTUNITIES THREATS
Achieving interoperability by types of transport and reducing the costs of infrastructure managers; Implementing traffic management systems (SESAR, ERTMS, ITS, SSN and LRIT, RIS); Ensuring good coordination between individual modes of transport; Building fast railway connections between intermodal terminals; Opportunities for the development of transit transport in the direction of transport corridors crossing the country and providing good conditions for connecting Western and Central Europe with the Middle East, West and Central Asia; Increasing the percentage of the use of sustainable fuels with low carbon content in aviation and the percentage of biodiesel and limiting the use of petroleum products in order to reduce greenhouse gas emissions from road transport; Improving effectiveness of carriers by increasing the distances for the transport and distribution; Increasing the benefits to society (reducing congestion, road accidents, greenhouse gas emissions) by changing the balance and market shares in the transport system in favour of railway transport; Investing in intelligent transport systems and reducing the costs for resources (money, energy, human); Development and maintenance of infrastructure (road, railway, airports, ports); Introducing mechanisms to cover infrastructure costs by the users on the "user pays" principle; Encouraging public-private partnerships for the development of transport infrastructure and intermodal transport; Improving the structure of the fleet in road transport, of the rolling stock in railway, of aircrafts, of sea and river fleet; Commissioning planned intermodal terminals; Improving scientific and professional training, increasing the role of research institutes, in order to create a better environment for the effective development and implementation of transport schemes; Reviving the economy and increasing production; Reducing dependence on petroleum and petroleum products of operators in the transport system; Optimization of logistics chains through investing in technological design; Increasing transit traffic;
Declining traffic; Poor coordination between the individual modes of transport; Delaying implementation of traffic management systems (SESAR, ERTMS, ITS, SSN and LRIT, RIS); Delaying infrastructure projects related to provision of fast railway connections between intermodal terminals; Delay or suspension of ongoing infrastructure projects due to lack of funds; Lack of financial resources for the development and maintenance of infrastructure (road, railway, airports, ports); Lack of evaluation of the priority infrastructure projects in the transport sector; Not attracting transit traffic; Worsening the age structure of the vehicle fleet, of the rolling stock in the railway, of the aircraft, of the sea and river fleet. Deterioration in the quality of transport infrastructure (road, railway, airports, ports); Deterioration in the quality of the passenger bus and railway services; Exacerbating the problem with shortage of qualified and experienced service personnel; Increasing fuel prices;
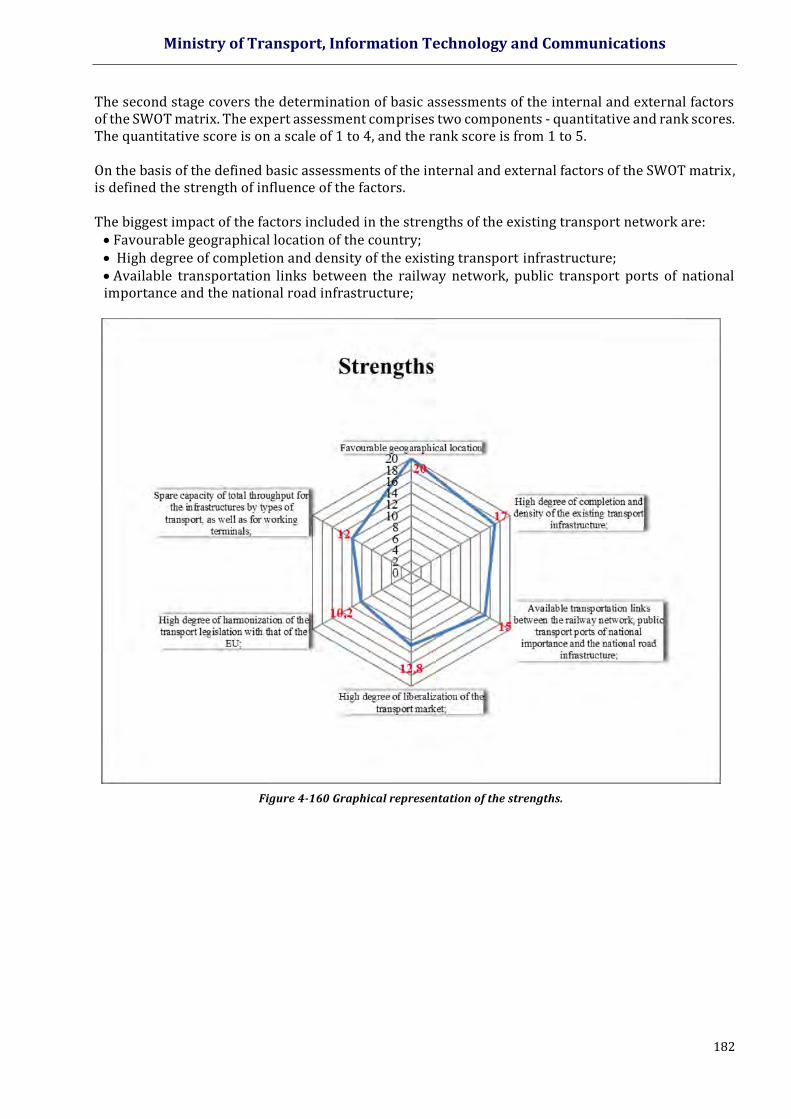
Ministry of Transport, Information Technology and Communications
182
The second stage covers the determination of basic assessments of the internal and external factors of the SWOT matrix. The expert assessment comprises two components - quantitative and rank scores. The quantitative score is on a scale of 1 to 4, and the rank score is from 1 to 5. On the basis of the defined basic assessments of the internal and external factors of the SWOT matrix, is defined the strength of influence of the factors. The biggest impact of the factors included in the strengths of the existing transport network are: Favourable geographical location of the country; High degree of completion and density of the existing transport infrastructure; Available transportation links between the railway network, public transport ports of national importance and the national road infrastructure;
Figure 4-160 Graphical representation of the strengths.
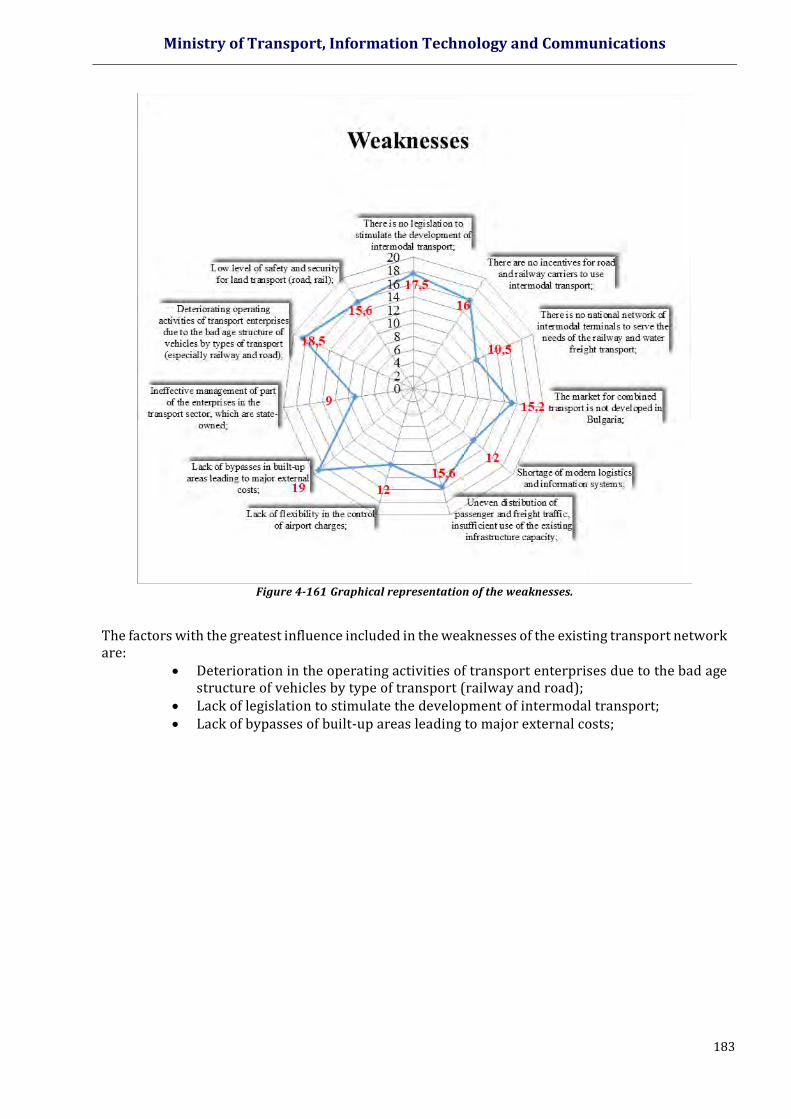
Ministry of Transport, Information Technology and Communications
183
Figure 4-161 Graphical representation of the weaknesses.
The factors with the greatest influence included in the weaknesses of the existing transport network are:
Deterioration in the operating activities of transport enterprises due to the bad age structure of vehicles by type of transport (railway and road);
Lack of legislation to stimulate the development of intermodal transport; Lack of bypasses of built-up areas leading to major external costs;
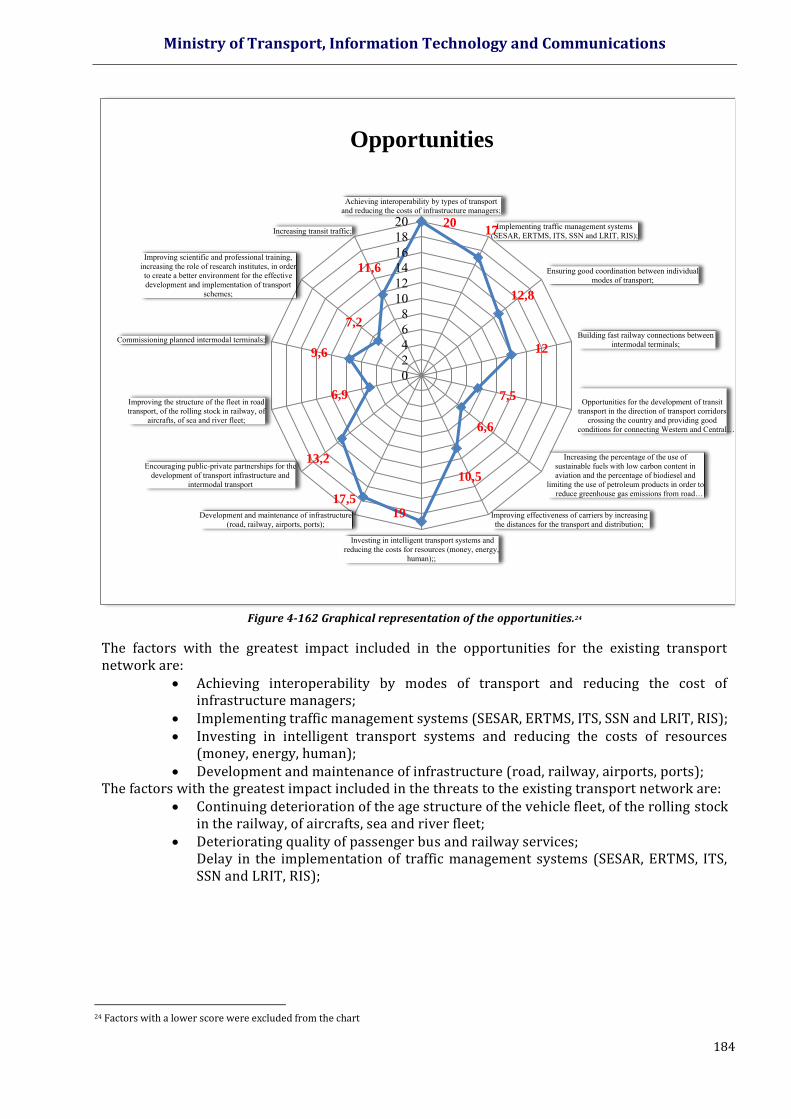
Ministry of Transport, Information Technology and Communications
184
Figure 4-162 Graphical representation of the opportunities.24
The factors with the greatest impact included in the opportunities for the existing transport network are:
Achieving interoperability by modes of transport and reducing the cost of infrastructure managers;
Implementing traffic management systems (SESAR, ERTMS, ITS, SSN and LRIT, RIS); Investing in intelligent transport systems and reducing the costs of resources
(money, energy, human); Development and maintenance of infrastructure (road, railway, airports, ports);
The factors with the greatest impact included in the threats to the existing transport network are: Continuing deterioration of the age structure of the vehicle fleet, of the rolling stock
in the railway, of aircrafts, sea and river fleet; Deteriorating quality of passenger bus and railway services;
Delay in the implementation of traffic management systems (SESAR, ERTMS, ITS, SSN and LRIT, RIS);
24 Factors with a lower score were excluded from the chart
2017
12,8
12
7,5
6,6
10,5
1917,5
13,2
6,9
9,6
7,2
11,6
02468
101214161820
Achieving interoperability by types of transportand reducing the costs of infrastructure managers;
Implementing traffic management systems(SESAR, ERTMS, ITS, SSN and LRIT, RIS);
Ensuring good coordination between individualmodes of transport;
Building fast railway connections betweenintermodal terminals;
Opportunities for the development of transittransport in the direction of transport corridors
crossing the country and providing goodconditions for connecting Western and Central…
Increasing the percentage of the use ofsustainable fuels with low carbon content inaviation and the percentage of biodiesel and
limiting the use of petroleum products in order toreduce greenhouse gas emissions from road…
Improving effectiveness of carriers by increasingthe distances for the transport and distribution;
Investing in intelligent transport systems andreducing the costs for resources (money, energy,
human);;
Development and maintenance of infrastructure(road, railway, airports, ports);
Encouraging public-private partnerships for thedevelopment of transport infrastructure and
intermodal transport
Improving the structure of the fleet in roadtransport, of the rolling stock in railway, of
aircrafts, of sea and river fleet;
Commissioning planned intermodal terminals;
Improving scientific and professional training,increasing the role of research institutes, in orderto create a better environment for the effectivedevelopment and implementation of transport
schemes;
Increasing transit traffic;
Opportunities
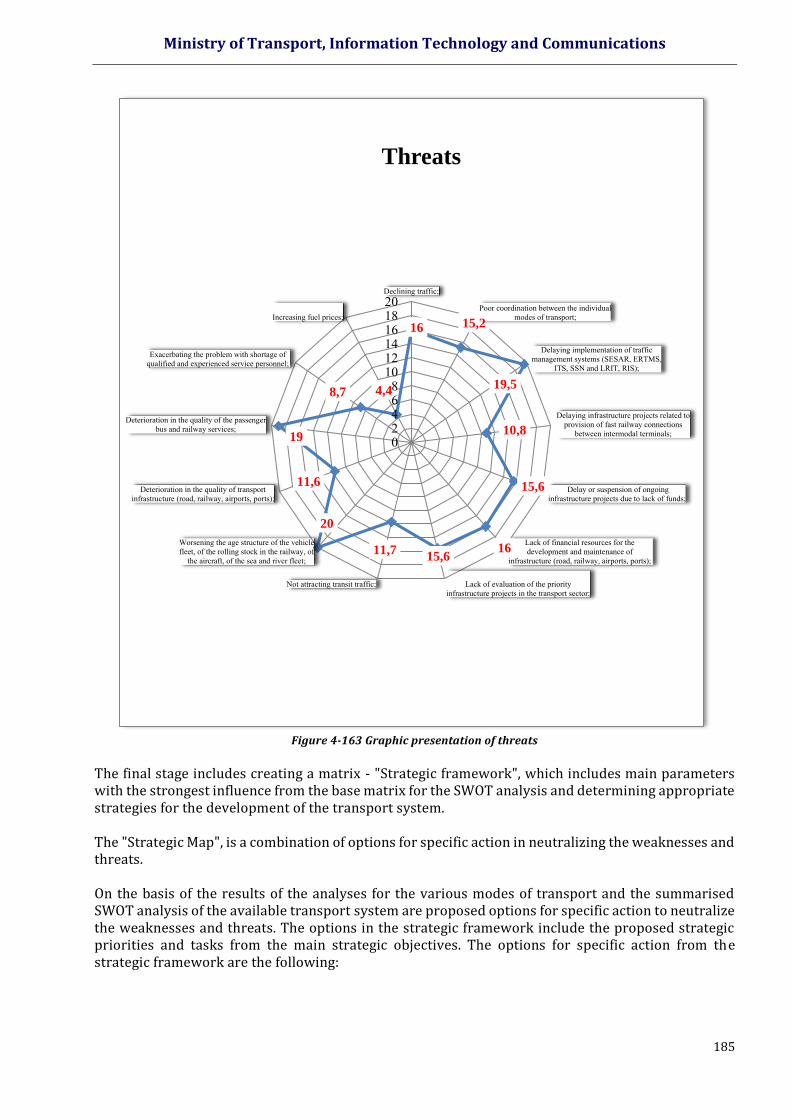
Ministry of Transport, Information Technology and Communications
185
Figure 4-163 Graphic presentation of threats
The final stage includes creating a matrix - "Strategic framework", which includes main parameters with the strongest influence from the base matrix for the SWOT analysis and determining appropriate strategies for the development of the transport system. The "Strategic Map", is a combination of options for specific action in neutralizing the weaknesses and threats. On the basis of the results of the analyses for the various modes of transport and the summarised SWOT analysis of the available transport system are proposed options for specific action to neutralize the weaknesses and threats. The options in the strategic framework include the proposed strategic priorities and tasks from the main strategic objectives. The options for specific action from the strategic framework are the following:
16 15,2
19,5
10,8
15,6
1615,6
11,7
20
11,6
19
8,7 4,4
02468
101214161820Declining traffic;
Poor coordination between the individualmodes of transport;
Delaying implementation of trafficmanagement systems (SESAR, ERTMS,
ITS, SSN and LRIT, RIS);
Delaying infrastructure projects related toprovision of fast railway connections
between intermodal terminals;
Delay or suspension of ongoinginfrastructure projects due to lack of funds;
Lack of financial resources for thedevelopment and maintenance of
infrastructure (road, railway, airports, ports);
Lack of evaluation of the priorityinfrastructure projects in the transport sector;
Not attracting transit traffic;
Worsening the age structure of the vehiclefleet, of the rolling stock in the railway, of
the aircraft, of the sea and river fleet;
Deterioration in the quality of transportinfrastructure (road, railway, airports, ports);
Deterioration in the quality of the passengerbus and railway services;
Exacerbating the problem with shortage ofqualified and experienced service personnel;
Increasing fuel prices;
Threats
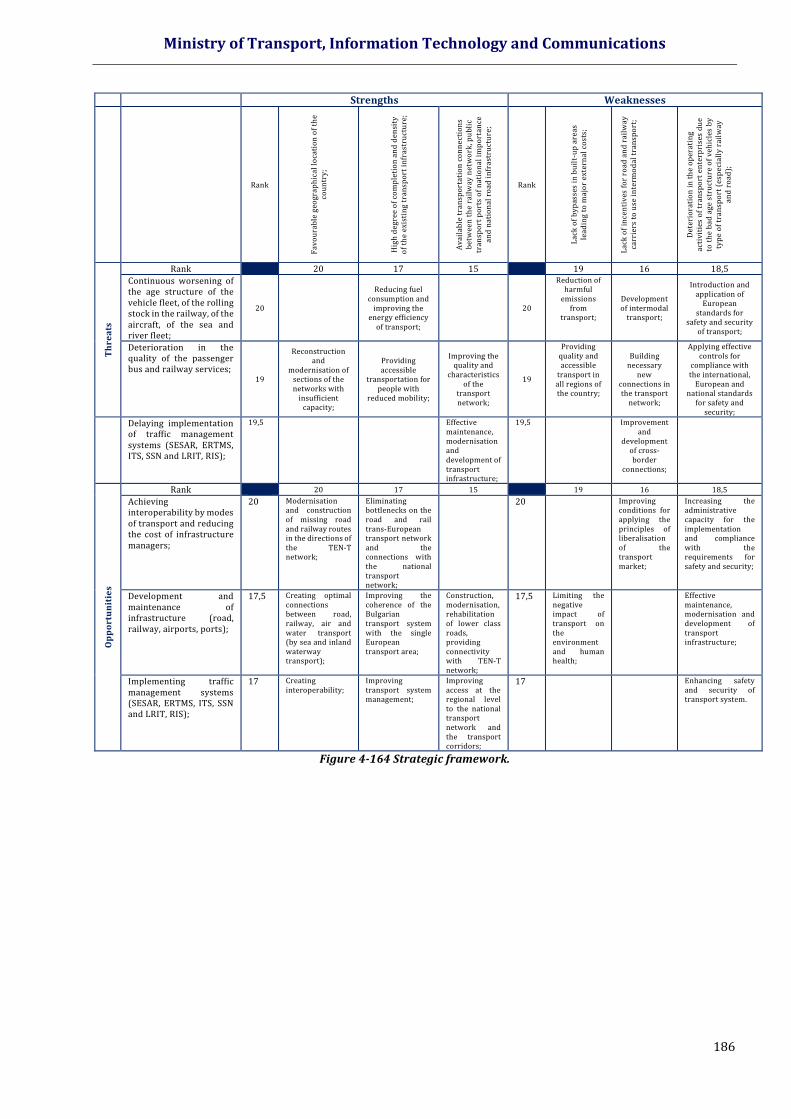
Ministry of Transport, Information Technology and Communications
186
Strengths Weaknesses
Rank
Fav
ou
rab
le g
eogr
aph
ical
lo
cati
on
of
the
cou
ntr
y;
Hig
h d
egre
e o
f co
mp
leti
on
an
d d
ensi
ty
of
the
exis
tin
g t
ran
spo
rt i
nfr
astr
uct
ure
;
Av
aila
ble
tra
nsp
ort
atio
n c
on
nec
tio
ns
bet
wee
n t
he
rail
way
net
wo
rk, p
ub
lic
tran
spo
rt p
ort
s o
f n
atio
nal
im
po
rtan
ce
and
nat
ion
al r
oad
in
fras
tru
ctu
re;
Rank
Lac
k o
f b
yp
asse
s in
bu
ilt-
up
are
as
lead
ing
to
maj
or
exte
rnal
co
sts;
Lac
k o
f in
cen
tiv
es f
or
road
an
d r
ailw
ay
carr
iers
to
use
in
term
od
al t
ran
spo
rt;
Det
erio
rati
on
in
th
e o
per
atin
g
acti
vit
ies
of
tran
spo
rt e
nte
rpri
ses
du
e to
th
e b
ad a
ge
stru
ctu
re o
f v
ehic
les
by
ty
pe
of
tran
spo
rt (
esp
ecia
lly
rai
lway
an
d r
oad
);
Th
rea
ts
Rank 20 17 15 19 16 18,5
Continuous worsening of the age structure of the vehicle fleet, of the rolling stock in the railway, of the aircraft, of the sea and river fleet;
20
Reducing fuel consumption and
improving the energy efficiency
of transport;
20
Reduction of harmful
emissions from
transport;
Development of intermodal
transport;
Introduction and application of
European standards for
safety and security of transport;
Deterioration in the quality of the passenger bus and railway services;
19
Reconstruction and
modernisation of sections of the networks with
insufficient capacity;
Providing accessible
transportation for people with
reduced mobility;
Improving the quality and
characteristics of the
transport network;
19
Providing quality and accessible
transport in all regions of the country;
Building necessary
new connections in the transport
network;
Applying effective controls for
compliance with the international,
European and national standards
for safety and security;
Delaying implementation of traffic management systems (SESAR, ERTMS, ITS, SSN and LRIT, RIS);
19,5 Effective maintenance, modernisation and development of transport infrastructure;
19,5 Improvement and
development of cross-border
connections;
Op
po
rtu
nit
ies
Rank 20 17 15 19 16 18,5
Achieving interoperability by modes of transport and reducing the cost of infrastructure managers;
20 Modernisation and construction of missing road and railway routes in the directions of the TEN-T network;
Eliminating bottlenecks on the road and rail trans-European transport network and the connections with the national transport network;
20 Improving conditions for applying the principles of liberalisation of the transport market;
Increasing the administrative capacity for the implementation and compliance with the requirements for safety and security;
Development and maintenance of infrastructure (road, railway, airports, ports);
17,5 Creating optimal connections between road, railway, air and water transport (by sea and inland waterway transport);
Improving the coherence of the Bulgarian transport system with the single European transport area;
Construction, modernisation, rehabilitation of lower class roads, providing connectivity with TEN-T network;
17,5 Limiting the negative impact of transport on the environment and human health;
Effective maintenance, modernisation and development of transport infrastructure;
Implementing traffic management systems (SESAR, ERTMS, ITS, SSN and LRIT, RIS);
17 Creating interoperability;
Improving transport system management;
Improving access at the regional level to the national transport network and the transport corridors;
17 Enhancing safety and security of transport system.
Figure 4-164 Strategic framework.
Ministry of Transport, Information Technology and Communications
187
V. FORECASTS OF THE DEMAND FOR TRANSPORT SERVICES The main approach used for forecasting the future demand for transport services is based on:
traffic patterns of the base year (2014) and future years, and forecasts of the development of the main socioeconomic and commercial factors
affecting transport. This shall mean that this approach uses the growth models. The methodology comprises the following steps:
Modelling of the railway network to the base year - 2014. Modelling of the traffic for Bulgaria and its assignment to the transport systems. Forecasting the socioeconomic factors (chapter II), affecting the demand for transport
services and determining the growth factors for the passenger and freight transport. Forecasting the demand for transport services. Modelling of the networks for future time horizons. Assignment of the forecast demand to the model of the future networks.
The models are developed on the basis of the software package PTV VISUM containing a detailed system for transport planning, modelling of the transport demand and management of network data bases, which can be used for planning at local, regional and national level.
5.1. ASSESSMENT OF THE CURRENT DEMAND FOR TRANSPORT SERVICES The assessment of the current demand for passenger and freight transport services is based on statistical data. To identify the growth factors of the passengers and commodities carried and the work done by the passenger and freight transport, are identified the trends and factors that they depend on.
Assessment of the current demand for transport services The current transport demand is assessed on the basis of the work done by the passenger transport measured in passenger-km, number of passengers transported and the average distances travelled in kilometres. The land transport is analysed, which consists of road transport and public transport, where the public transport on its part consists of bus transport and railway transport. The shares of the different types of transport are obtained, determined in accordance with the above classification. The data of the work done shows a growth in the land and road transport and a drop in the bus and railway transport (public transport). The main trend in the passengers transported is of decrease for all types of land passenger transport.
Assessment of the current demand for freight transport services
The current demand for freight transport services is presented separately for the domestic and international transport services. The commodities transported by the land domestic transport as total decrease until 2010, then they start growing and reach the levels of 2009. This trend has its origin in the financial and economic crisis. The same is the trend in the road freight transport, while the general trend in the railway transport is of decrease. The trends in the work done by the freight transport indicate a moderate increase in the land transport as a whole, a more rapid increase in the road transport and a moderate decrease in the railway transport The trends show a tangible growth in the road transport and general land transport and a moderate growth in the railway transport. The trends show a potential for future growth in this segment of the freight transport.

Ministry of Transport, Information Technology and Communications
188
The trends and the volumes of commodities transported are the same. The total of the work done by the international land transport shows a trend of tangible growth (the increase in 2015 compared to 2002 is 4.65 times). The same applies to the road transport (the increase in 2015 compared to 2002 is 5.17 times). The work in the railway transport fluctuates between 789 mln. tonne-km and 1,136 mln. tonne-km. In formal terms, we can detect a slight increase of 1.44 times in 2015 compared to 2002. This confirms the trend of a more rapid growth in this segment of the freight transport services.
5.2 ASSESSMENT OF THE FUTURE DEMAND FOR TRANSPORT SERVICES In accordance with the forecast methodology presented in the previous item, the growth of transport demand is a function of the forecast for the socioeconomic development of the country. For forecasting the work done, the following data were used:
- data and forecasts about the socioeconomic development of the country - real GDP growth, GDP per capita and motorisation;
- trends and tendencies of factors, which determine the forecasts for the commodities transported and work done;
- strategic documents; - other projects and studies.
5.2.1 IDENTIFICATION OF THE FUTURE PASSENGER TRANSPORT NEEDS, WHICH WOULD OCCUR IN A FUTURE "DO NOTHING” SITUATION
The main factors affecting the work done by the land passenger transport are the GDP per capita and the degree of motorisation of the population measured by the number of cars per 1000 population. Both factors have a tendency of growth. The coefficient of linear correlation of the work of the land transport compared with the GDP per capita is 0,986, and compared to the motorisation it is 0,694. These coefficients are obtained on the basis of data for the period 2002 - 2014.
For the work of the land transport, the following forecast dependence is obtained:
638,62 428,461.Car-0,241206. own2,1
pcGDPTotPax , where:
pcGDP is GDP per capita for the respective forecast year;
ownCar is the motorisation for the respective forecast year and
TotPax is the work in mln. passenger-km carried out by the land transport for the respective forecast year.
The coefficient of linear correlation of the work of the road transport compared with the GDP per capita is 0,985, and compared to the motorisation it is 0,726. The work done by the road transport is forecast in the same way as the work of the land passenger transport. The structure of the forecast dependence is the same, only the coefficients are different. It looks like this:
377,87 173,2235.Car24,1277. own0,759718
pcGDPCarPax , where pcGDP and ownCar have the
same meaning as in the previous dependence and CarPax is the work done by the road transport (transport services with passenger cars) in mln. passenger-km. The forecast of the work done by the rail transport is based on the trend dependence. It is obtained on the basis of data for the period 1997 - 2014. The trend is decreasing. The forecast dependence looks like this:
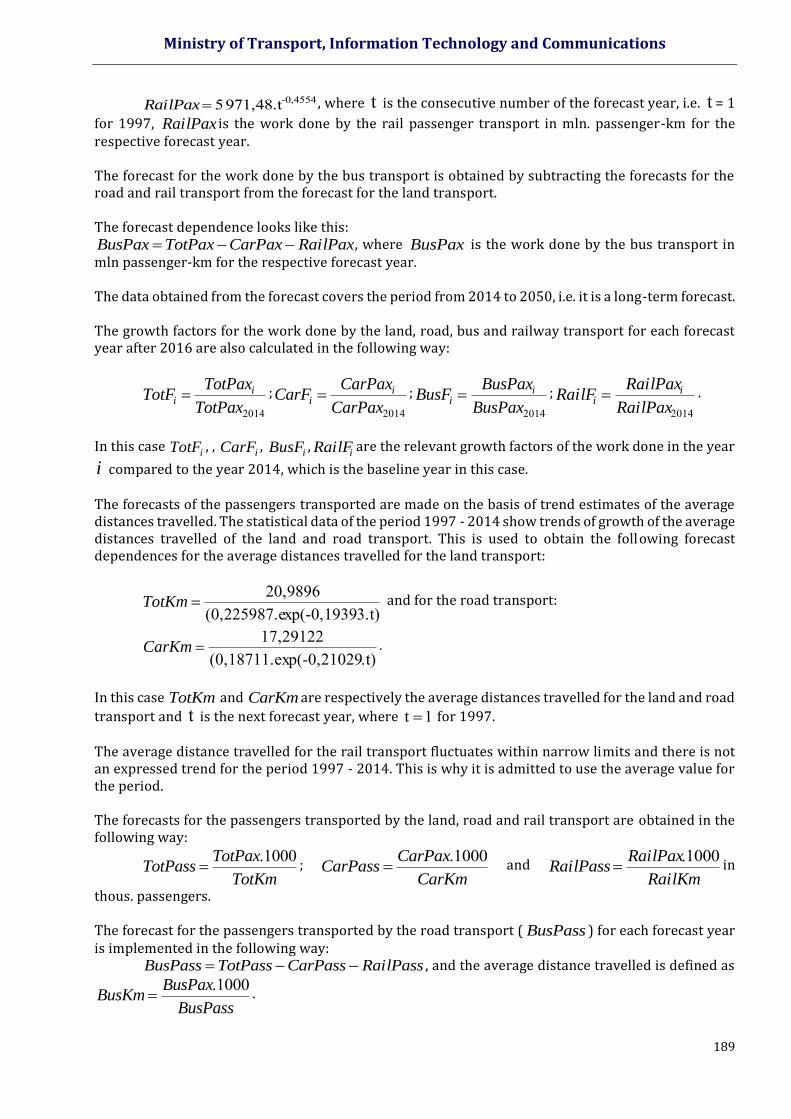
Ministry of Transport, Information Technology and Communications
189
-0,4554971,48.t 5RailPax , where t is the consecutive number of the forecast year, i.e. t = 1
for 1997, RailPax is the work done by the rail passenger transport in mln. passenger-km for the respective forecast year. The forecast for the work done by the bus transport is obtained by subtracting the forecasts for the road and rail transport from the forecast for the land transport. The forecast dependence looks like this:
RailPaxCarPaxTotPaxBusPax , where BusPax is the work done by the bus transport in mln passenger-km for the respective forecast year. The data obtained from the forecast covers the period from 2014 to 2050, i.e. it is a long-term forecast. The growth factors for the work done by the land, road, bus and railway transport for each forecast year after 2016 are also calculated in the following way:
2014TotPax
TotPaxTotF i
i ;
2014CarPax
CarPaxCarF i
i ;
2014BusPax
BusPaxBusF i
i ;
2014RailPax
RailPaxRailF i
i .
In this case
iTotF , , iCarF ,
iBusF ,iRailF are the relevant growth factors of the work done in the year
i compared to the year 2014, which is the baseline year in this case. The forecasts of the passengers transported are made on the basis of trend estimates of the average distances travelled. The statistical data of the period 1997 - 2014 show trends of growth of the average distances travelled of the land and road transport. This is used to obtain the following forecast dependences for the average distances travelled for the land transport:
3.t)xp(-0,19390,225987.e(20,9896
TotKm and for the road transport:
.t)p(-0,210290,18711.ex(17,29122
CarKm .
In this case TotKm and CarKm are respectively the average distances travelled for the land and road
transport and t is the next forecast year, where 1t for 1997. The average distance travelled for the rail transport fluctuates within narrow limits and there is not an expressed trend for the period 1997 - 2014. This is why it is admitted to use the average value for the period. The forecasts for the passengers transported by the land, road and rail transport are obtained in the following way:
TotKm
TotPaxTotPass
1000. ;
CarKm
CarPaxCarPass
1000. and
RailKm
RailPaxRailPass
1000. in
thous. passengers. The forecast for the passengers transported by the road transport ( BusPass ) for each forecast year is implemented in the following way:
RailPassCarPassTotPassBusPass , and the average distance travelled is defined as
BusPass
BusPaxBusKm
1000. .
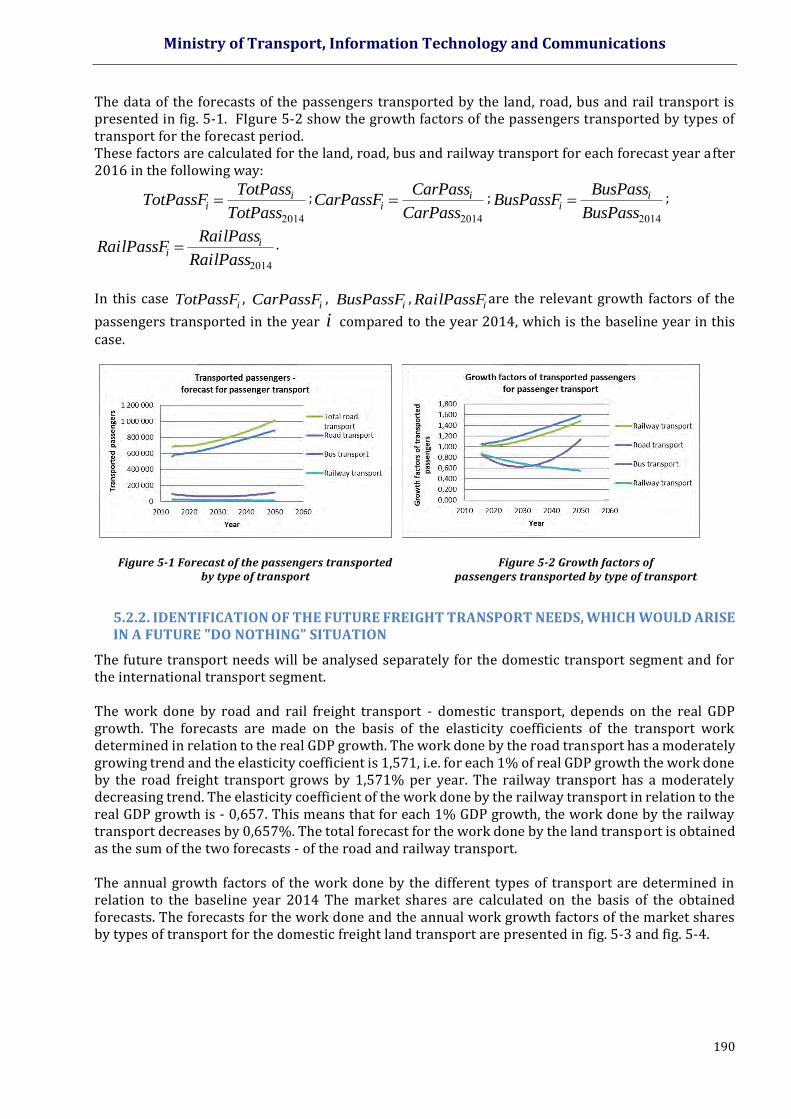
Ministry of Transport, Information Technology and Communications
190
The data of the forecasts of the passengers transported by the land, road, bus and rail transport is presented in fig. 5-1. FIgure 5-2 show the growth factors of the passengers transported by types of transport for the forecast period. These factors are calculated for the land, road, bus and railway transport for each forecast year after 2016 in the following way:
2014TotPass
TotPassTotPassF i
i ;
2014CarPass
CarPassCarPassF i
i ;
2014BusPass
BusPassBusPassF i
i ;
2014RailPass
RailPassRailPassF i
i .
In this case
iTotPassF , iCarPassF ,
iBusPassF ,iRailPassF are the relevant growth factors of the
passengers transported in the year i compared to the year 2014, which is the baseline year in this case.
Figure 5-1 Forecast of the passengers transported by type of transport
Figure 5-2 Growth factors of passengers transported by type of transport
5.2.2. IDENTIFICATION OF THE FUTURE FREIGHT TRANSPORT NEEDS, WHICH WOULD ARISE IN A FUTURE "DO NOTHING” SITUATION
The future transport needs will be analysed separately for the domestic transport segment and for the international transport segment. The work done by road and rail freight transport - domestic transport, depends on the real GDP growth. The forecasts are made on the basis of the elasticity coefficients of the transport work determined in relation to the real GDP growth. The work done by the road transport has a moderately growing trend and the elasticity coefficient is 1,571, i.e. for each 1% of real GDP growth the work done by the road freight transport grows by 1,571% per year. The railway transport has a moderately decreasing trend. The elasticity coefficient of the work done by the railway transport in relation to the real GDP growth is - 0,657. This means that for each 1% GDP growth, the work done by the railway transport decreases by 0,657%. The total forecast for the work done by the land transport is obtained as the sum of the two forecasts - of the road and railway transport. The annual growth factors of the work done by the different types of transport are determined in relation to the baseline year 2014 The market shares are calculated on the basis of the obtained forecasts. The forecasts for the work done and the annual work growth factors of the market shares by types of transport for the domestic freight land transport are presented in fig. 5-3 and fig. 5-4.

Ministry of Transport, Information Technology and Communications
191
Figure 5-3 Forecast of the transport work for the domestic land freight transport
Figure 5-4 Growth factors of the transport work by type of transport
Figure 5-5 Forecast of the commodities transported for the domestic land freight transport
Figure 5-6 Growth factors of commodities transported by type of transport
The forecasts for the commodities transported per year by the road, railway and road domestic freight transport and the respective market shares are obtained by taking into account the trends of growth of the average distance travelled of the road transport and the moderate minimum decrease of the average distance travelled of the railway transport. The forecast are presented in fig. .5-7. The obtained growth factors of the commodities transported by types and in general for the road transport are shown in fig. 5-8. The growth factors of commodities transported by the type of commodities have been defined. 20 types of commodities are included. The values of the growth factors of commodities transported are obtained taking into account: the percentage of the commodities transported by road transport by types of commodities; percentage of commodities transported by the rail transport by types of commodities and the market shares of the road and railway transport by types of commodities.
Figure 5-7 Forecast of the transport work for the international land freight transport
Figure 5-8 Growth factors of the transport work by type of transport
Тран
спо
ртн
а р
або
та
Year
Transport work – forecast
Общо сухоземен транспорт
Автомобилен транспорт
Железопътен транспорт 0
1
1
2
2
3
2010 2020 2030 2040 2050 2060Фак
тор
на
нар
аств
ане
н
а р
або
тата
Година
Фактори на нарастване на работата
Общо сухоземен транспорт
Автомобилен транспорт
Железопътен транспорт
Tra
nsp
ort
wo
rk
Gro
wth
fac
tors
of
wo
rk
Growth factors of work
Total road transport Road transport Railway transport
Total road transport Road transport Railway transport

Ministry of Transport, Information Technology and Communications
192
Figure 5-9 Forecast of the transport work for the international land freight transport
Figure 5-10 Growth factors of the transport work by type of transport
The work for the land freight transport - international transport, has a trend of intense growth, on average 13,43 % per year for the period 2002 - 2015. It is assumed that by 2020 this growth will be preserved and after 2020 it will start to decrease and it will be 4,48% by the year 2025, 2,24% by 2030 and 1,12% by the end of the forecast period. The reason for this forecast is that at the moment the existing potential for the transport in international traffic is being implemented and utilised, which will lead to a saturation after 2020. The same applies to the railway transport, but on a smaller scale. The trend is for a growth of the work done in the international transport, where for the period 2002 - 2015 the average growth is 4.05% per year. It is assumed that this rate of growth will be preserved until 2030, and after that - by the end of the forecast period, it will be 2,02%. The forecasts carried out on this basis of the commodities transported (thous. tonnes) and work done (mln. tonne-km), the average distances travelled (km) and market shares (%) are presented in fig. 5-9 and fig. 5-11 for the work done for the land, road and railway transport. The annual growth factors of the work done and commodities transported in international traffic by the separate types of transport are determined in relation to the baseline year 2014.
5.3 FORECASTS OF FREIGHT TURNOVER AND PASSENGERS TRANSPORTED IN PORTS
The forecasts of freight turnover and passengers transported by sea (sea cruise) and river transport (river cruises) are made with the basic "do nothing" assumption in the field of transport. The basic economic and demographic indicators such as population, motorisation, GDP, real GDP growth, GDP per capita and other specific parameters such as production of wheat, sunflower, extraction of copper ore etc. per one hectare have a major impact on the forecasts. The conditions of the land infrastructure and land carriers (road and railway) are determined on the basis of the "do nothing" approach. These conditions are evaluated using the generalised costs of the sea and river ports to each area or region, as in this way the zones of influence and their market shares for each type of the commodities transported are determined.
Forecasting of the handling of containers and packaged commodities, which can be transported in containers
Methodology
The forecast for the turnover of containers and packaged loads that can be carried by containers is made taking into account the following: the development of the transit freight from the Bulgarian ports to the neighbouring countries of Bulgaria is not expected; Bulgarian ports are not logistically efficient options for commodities arriving from outside the Black Sea region; the freight
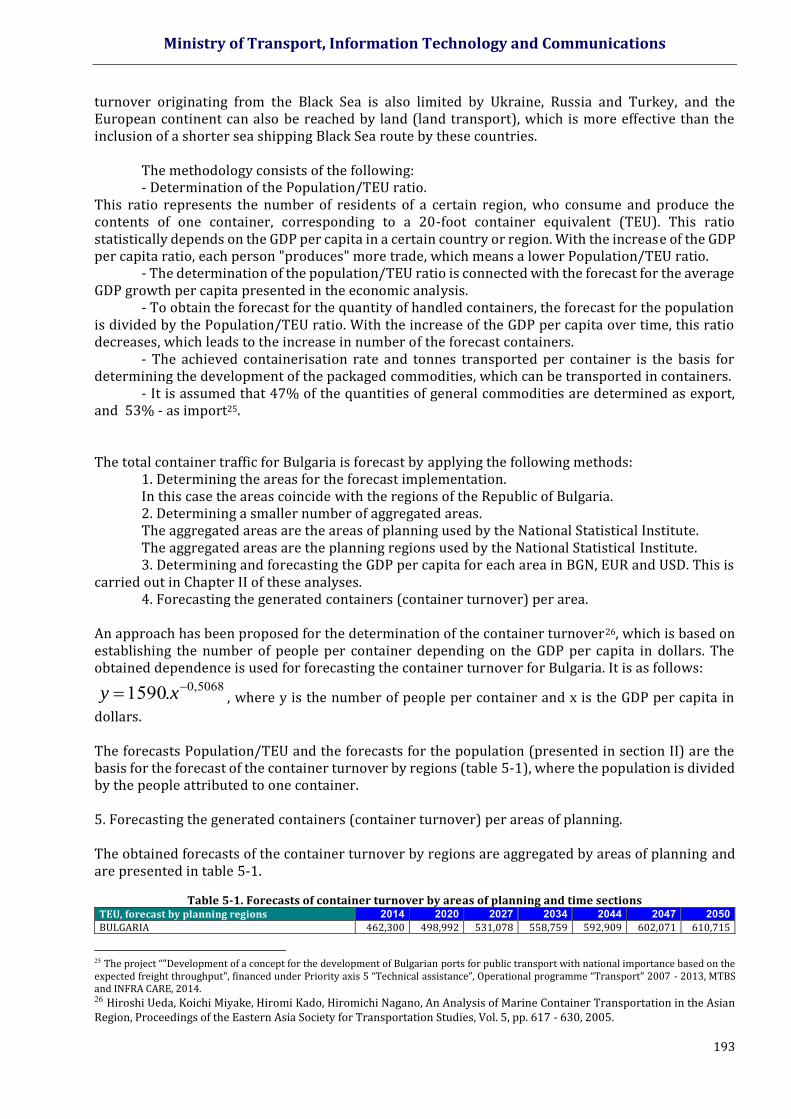
Ministry of Transport, Information Technology and Communications
193
turnover originating from the Black Sea is also limited by Ukraine, Russia and Turkey, and the European continent can also be reached by land (land transport), which is more effective than the inclusion of a shorter sea shipping Black Sea route by these countries.
The methodology consists of the following: - Determination of the Population/TEU ratio.
This ratio represents the number of residents of a certain region, who consume and produce the contents of one container, corresponding to a 20-foot container equivalent (TEU). This ratio statistically depends on the GDP per capita in a certain country or region. With the increase of the GDP per capita ratio, each person "produces" more trade, which means a lower Population/TEU ratio.
- The determination of the population/TEU ratio is connected with the forecast for the average GDP growth per capita presented in the economic analysis.
- To obtain the forecast for the quantity of handled containers, the forecast for the population is divided by the Population/TEU ratio. With the increase of the GDP per capita over time, this ratio decreases, which leads to the increase in number of the forecast containers.
- The achieved containerisation rate and tonnes transported per container is the basis for determining the development of the packaged commodities, which can be transported in containers.
- It is assumed that 47% of the quantities of general commodities are determined as export, and 53% - as import25. The total container traffic for Bulgaria is forecast by applying the following methods:
1. Determining the areas for the forecast implementation. In this case the areas coincide with the regions of the Republic of Bulgaria. 2. Determining a smaller number of aggregated areas. The aggregated areas are the areas of planning used by the National Statistical Institute. The aggregated areas are the planning regions used by the National Statistical Institute. 3. Determining and forecasting the GDP per capita for each area in BGN, EUR and USD. This is
carried out in Chapter II of these analyses. 4. Forecasting the generated containers (container turnover) per area.
An approach has been proposed for the determination of the container turnover26, which is based on establishing the number of people per container depending on the GDP per capita in dollars. The obtained dependence is used for forecasting the container turnover for Bulgaria. It is as follows:
5068,0.1590 xy , where y is the number of people per container and x is the GDP per capita in
dollars. The forecasts Population/TEU and the forecasts for the population (presented in section II) are the basis for the forecast of the container turnover by regions (table 5-1), where the population is divided by the people attributed to one container. 5. Forecasting the generated containers (container turnover) per areas of planning. The obtained forecasts of the container turnover by regions are aggregated by areas of planning and are presented in table 5-1.
Table 5-1. Forecasts of container turnover by areas of planning and time sections
TEU, forecast by planning regions 2014 2020 2027 2034 2044 2047 2050 BULGARIA 462,300 498,992 531,078 558,759 592,909 602,071 610,715
25 The project “"Development of a concept for the development of Bulgarian ports for public transport with national importance based on the expected freight throughput", financed under Priority axis 5 “Technical assistance”, Operational programme “Transport” 2007 - 2013, MTBS and INFRA CARE, 2014. 26 Hiroshi Ueda, Koichi Miyake, Hiromi Kado, Hiromichi Nagano, An Analysis of Marine Container Transportation in the Asian Region, Proceedings of the Eastern Asia Society for Transportation Studies, Vol. 5, pp. 617 - 630, 2005.

Ministry of Transport, Information Technology and Communications
194
South-West Planning Region (SWPR) 173,555 193,079 211,989 229,645 253,358 260,093 266,657 South Central Planning Region (SCPR) 80,058 85,199 89,287 92,492 95,897 96,682 97,357 South-East Planning Region (SEPR) 63,016 68,475 73,204 77,244 82,106 83,395 84,608 North-East Planning Region (NWPR) 56,680 61,053 64,635 67,545 70,839 71,648 72,381 North Central Planning Region (NCPR) 45,883 47,722 48,777 49,276 49,404 49,364 49,275 North-West Planning Region (NWPR) 43,108 43,464 43,186 42,557 41,304 40,889 40,437
The forecasts of packaged commodities, which can be transported in containers, are made based on the assumptions that the level of containerisation, which is 48% in 2013, will become 60% in 2030 and will remain at that level until the end of the forecast period and the share of packaged commodities, which can be transported in containers, handled in sea ports, is 33.5%. The forecasts of the packaged commodities, which can be transported in containers, are shown in table .5-2.
Table 5-2. Forecasts for the packaged commodities, which can be transported in containers. Source: Project “Development of a concept for the development of Bulgarian ports for public transport with national importanc e based
on the expected freight throughput”, MTBS and INFRA CARE, 2014, and own calculations. 2009 2014 2020 2027 2034 2044 2047 2050 422 887 453 587 497 884 496 163 532 276 548 819 551 342 553 865 Burgas 308 825 365 038 398 201 393 822 419 077 429 778 431 142 432 506 Varna 28 638 18 018 18 731 17 403 17 236 18 197 18 484 18 772 Ruse 21 238 16 435 19 254 20 652 23 818 24 051 23 921 23 790 Lom/Vidin 781 588 853 078 934 069 928 040 992 407 1 020 845 1 024 889 1 028 934
Bulk cereals
The methodology used for forecasting the freight turnover of bulk cereals handled in the Bulgarian ports is the following:
- the quantities of bulk cereals handled in the Bulgarian ports only include export of Bulgarian production.
- The demand worldwide of cereals and oil seeds increases. These are also the basic Bulgarian exports. The export rate depends primarily on the quantities that Bulgaria manages to produce and the local consumption of these products.
- The total export growth is determined by subtracting the growth of domestic consumption from the yield of the agricultural products. According to the statistics of the Food and Agriculture Organization, the Bulgarian exports of bulk agricultural products include mainly cereals (wheat, barley, maize) and oil seeds (sunflower seed and rape seed). The exports of other bulk agricultural products are negligible, therefore the forecast for freight turnover is made only for cereals and oil seeds. Most of the products, which are imported, are of the type normally transported as packaged commodities or in containers (rice, dairy products, fruit etc.). It is assumed that the total land use for a type of crop will be the same in the future. Land use has been obtained by dividing the reported statistical data for the production of the Food and Agriculture Organization to the values of the yield of the one hectar, as specified in the same source. The domestic demand for bulk cereals and oilseeds is fully satisfied by the local production. This includes both the consumption for food of the population and for other purposes such as the production of fodder for animals and the production of biofuels.
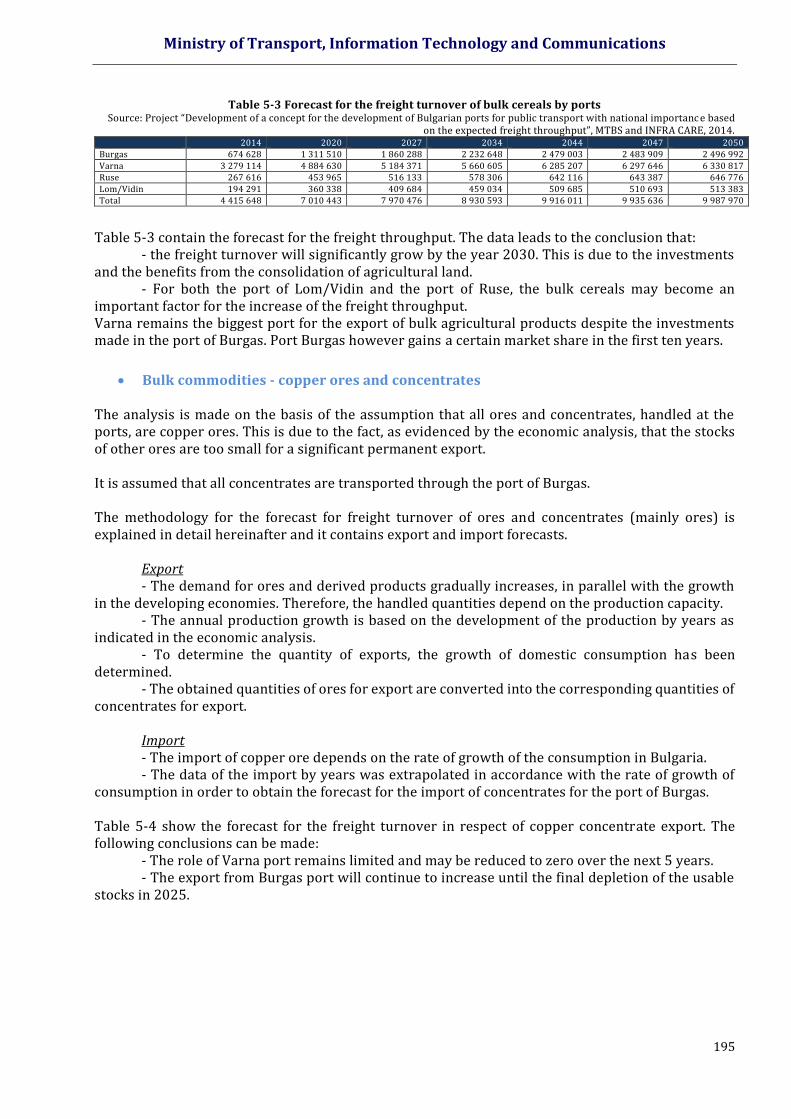
Ministry of Transport, Information Technology and Communications
195
Table 5-3 Forecast for the freight turnover of bulk cereals by ports Source: Project “Development of a concept for the development of Bulgarian ports for public transport with national importanc e based
on the expected freight throughput”, MTBS and INFRA CARE, 2014. 2014 2020 2027 2034 2044 2047 2050 Burgas 674 628 1 311 510 1 860 288 2 232 648 2 479 003 2 483 909 2 496 992
Varna 3 279 114 4 884 630 5 184 371 5 660 605 6 285 207 6 297 646 6 330 817 Ruse 267 616 453 965 516 133 578 306 642 116 643 387 646 776
Lom/Vidin 194 291 360 338 409 684 459 034 509 685 510 693 513 383 Total 4 415 648 7 010 443 7 970 476 8 930 593 9 916 011 9 935 636 9 987 970
Table 5-3 contain the forecast for the freight throughput. The data leads to the conclusion that:
- the freight turnover will significantly grow by the year 2030. This is due to the investments and the benefits from the consolidation of agricultural land.
- For both the port of Lom/Vidin and the port of Ruse, the bulk cereals may become an important factor for the increase of the freight throughput. Varna remains the biggest port for the export of bulk agricultural products despite the investments made in the port of Burgas. Port Burgas however gains a certain market share in the first ten years.
Bulk commodities - copper ores and concentrates
The analysis is made on the basis of the assumption that all ores and concentrates, handled at the ports, are copper ores. This is due to the fact, as evidenced by the economic analysis, that the stocks of other ores are too small for a significant permanent export. It is assumed that all concentrates are transported through the port of Burgas. The methodology for the forecast for freight turnover of ores and concentrates (mainly ores) is explained in detail hereinafter and it contains export and import forecasts.
Export - The demand for ores and derived products gradually increases, in parallel with the growth
in the developing economies. Therefore, the handled quantities depend on the production capacity. - The annual production growth is based on the development of the production by years as
indicated in the economic analysis. - To determine the quantity of exports, the growth of domestic consumption has been
determined. - The obtained quantities of ores for export are converted into the corresponding quantities of
concentrates for export. Import - The import of copper ore depends on the rate of growth of the consumption in Bulgaria. - The data of the import by years was extrapolated in accordance with the rate of growth of
consumption in order to obtain the forecast for the import of concentrates for the port of Burgas. Table 5-4 show the forecast for the freight turnover in respect of copper concentrate export. The following conclusions can be made:
- The role of Varna port remains limited and may be reduced to zero over the next 5 years. - The export from Burgas port will continue to increase until the final depletion of the usable
stocks in 2025.
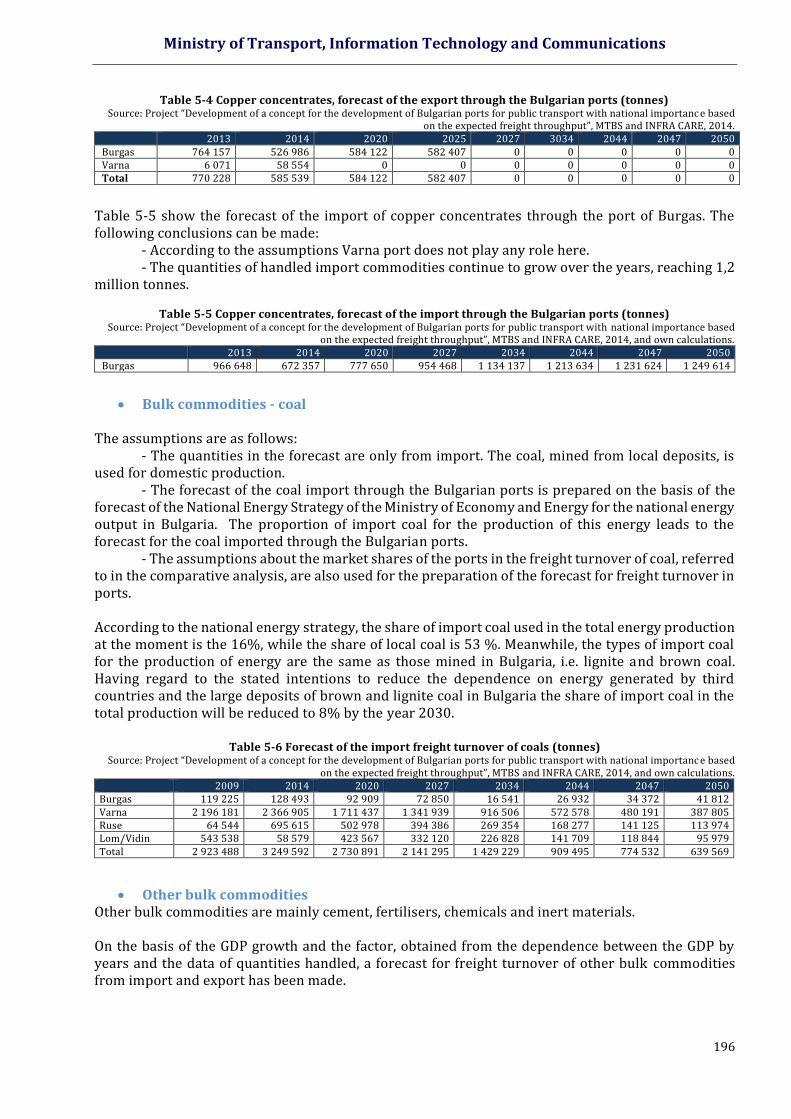
Ministry of Transport, Information Technology and Communications
196
Table 5-4 Copper concentrates, forecast of the export through the Bulgarian ports (tonnes) Source: Project “Development of a concept for the development of Bulgarian ports for public transport with national importanc e based
on the expected freight throughput”, MTBS and INFRA CARE, 2014. 2013 2014 2020 2025 2027 3034 2044 2047 2050 Burgas 764 157 526 986 584 122 582 407 0 0 0 0 0 Varna 6 071 58 554 0 0 0 0 0 0 0 Total 770 228 585 539 584 122 582 407 0 0 0 0 0
Table 5-5 show the forecast of the import of copper concentrates through the port of Burgas. The following conclusions can be made:
- According to the assumptions Varna port does not play any role here. - The quantities of handled import commodities continue to grow over the years, reaching 1,2
million tonnes.
Table 5-5 Copper concentrates, forecast of the import through the Bulgarian ports (tonnes) Source: Project “Development of a concept for the development of Bulgarian ports for public transport with national importance based
on the expected freight throughput”, MTBS and INFRA CARE, 2014, and own calculations. 2013 2014 2020 2027 2034 2044 2047 2050 Burgas 966 648 672 357 777 650 954 468 1 134 137 1 213 634 1 231 624 1 249 614
Bulk commodities - coal
The assumptions are as follows:
- The quantities in the forecast are only from import. The coal, mined from local deposits, is used for domestic production.
- The forecast of the coal import through the Bulgarian ports is prepared on the basis of the forecast of the National Energy Strategy of the Ministry of Economy and Energy for the national energy output in Bulgaria. The proportion of import coal for the production of this energy leads to the forecast for the coal imported through the Bulgarian ports.
- The assumptions about the market shares of the ports in the freight turnover of coal, referred to in the comparative analysis, are also used for the preparation of the forecast for freight turnover in ports. According to the national energy strategy, the share of import coal used in the total energy production at the moment is the 16%, while the share of local coal is 53 %. Meanwhile, the types of import coal for the production of energy are the same as those mined in Bulgaria, i.e. lignite and brown coal. Having regard to the stated intentions to reduce the dependence on energy generated by third countries and the large deposits of brown and lignite coal in Bulgaria the share of import coal in the total production will be reduced to 8% by the year 2030.
Table 5-6 Forecast of the import freight turnover of coals (tonnes)
Source: Project “Development of a concept for the development of Bulgarian ports for public transport with national importanc e based on the expected freight throughput”, MTBS and INFRA CARE, 2014, and own calculations.
2009 2014 2020 2027 2034 2044 2047 2050 Burgas 119 225 128 493 92 909 72 850 16 541 26 932 34 372 41 812 Varna 2 196 181 2 366 905 1 711 437 1 341 939 916 506 572 578 480 191 387 805 Ruse 64 544 695 615 502 978 394 386 269 354 168 277 141 125 113 974 Lom/Vidin 543 538 58 579 423 567 332 120 226 828 141 709 118 844 95 979 Total 2 923 488 3 249 592 2 730 891 2 141 295 1 429 229 909 495 774 532 639 569
Other bulk commodities
Other bulk commodities are mainly cement, fertilisers, chemicals and inert materials. On the basis of the GDP growth and the factor, obtained from the dependence between the GDP by years and the data of quantities handled, a forecast for freight turnover of other bulk commodities from import and export has been made.
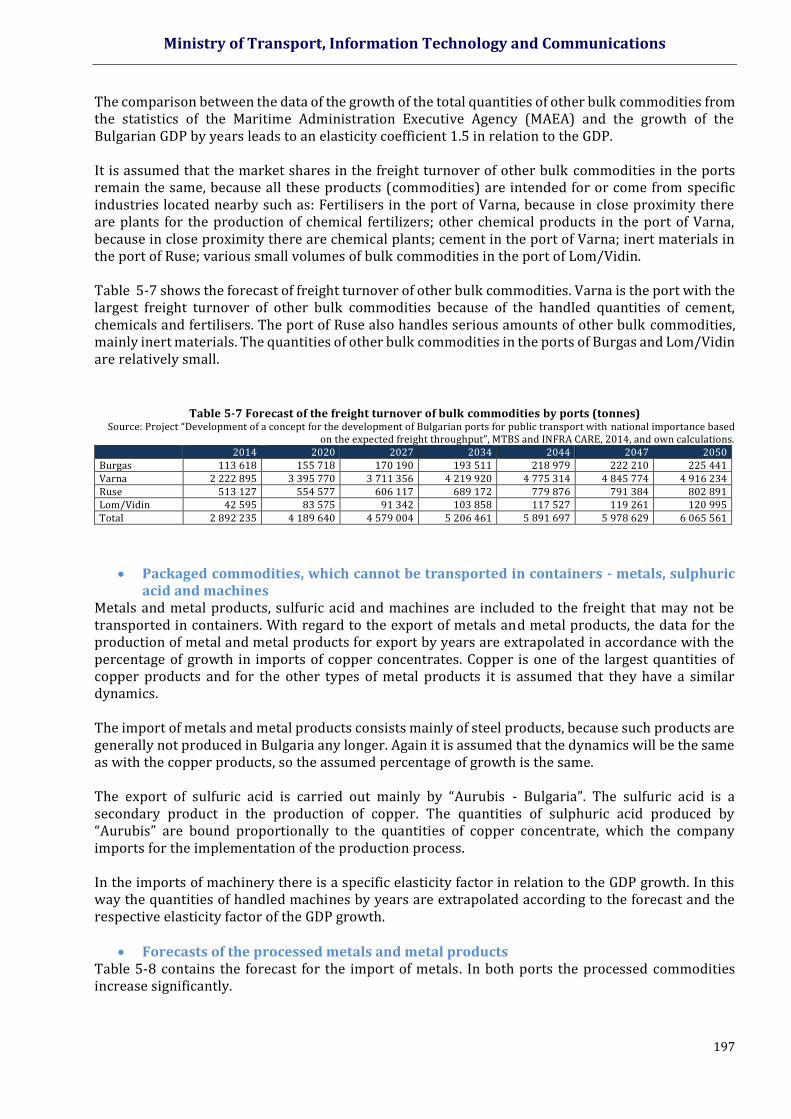
Ministry of Transport, Information Technology and Communications
197
The comparison between the data of the growth of the total quantities of other bulk commodities from the statistics of the Maritime Administration Executive Agency (MAEA) and the growth of the Bulgarian GDP by years leads to an elasticity coefficient 1.5 in relation to the GDP. It is assumed that the market shares in the freight turnover of other bulk commodities in the ports remain the same, because all these products (commodities) are intended for or come from specific industries located nearby such as: Fertilisers in the port of Varna, because in close proximity there are plants for the production of chemical fertilizers; other chemical products in the port of Varna, because in close proximity there are chemical plants; cement in the port of Varna; inert materials in the port of Ruse; various small volumes of bulk commodities in the port of Lom/Vidin. Table 5-7 shows the forecast of freight turnover of other bulk commodities. Varna is the port with the largest freight turnover of other bulk commodities because of the handled quantities of cement, chemicals and fertilisers. The port of Ruse also handles serious amounts of other bulk commodities, mainly inert materials. The quantities of other bulk commodities in the ports of Burgas and Lom/Vidin are relatively small.
Table 5-7 Forecast of the freight turnover of bulk commodities by ports (tonnes) Source: Project “Development of a concept for the development of Bulgarian ports for public transport with national importance based
on the expected freight throughput”, MTBS and INFRA CARE, 2014, and own calculations. 2014 2020 2027 2034 2044 2047 2050 Burgas 113 618 155 718 170 190 193 511 218 979 222 210 225 441 Varna 2 222 895 3 395 770 3 711 356 4 219 920 4 775 314 4 845 774 4 916 234 Ruse 513 127 554 577 606 117 689 172 779 876 791 384 802 891 Lom/Vidin 42 595 83 575 91 342 103 858 117 527 119 261 120 995 Total 2 892 235 4 189 640 4 579 004 5 206 461 5 891 697 5 978 629 6 065 561
Packaged commodities, which cannot be transported in containers - metals, sulphuric acid and machines
Metals and metal products, sulfuric acid and machines are included to the freight that may not be transported in containers. With regard to the export of metals and metal products, the data for the production of metal and metal products for export by years are extrapolated in accordance with the percentage of growth in imports of copper concentrates. Copper is one of the largest quantities of copper products and for the other types of metal products it is assumed that they have a similar dynamics. The import of metals and metal products consists mainly of steel products, because such products are generally not produced in Bulgaria any longer. Again it is assumed that the dynamics will be the same as with the copper products, so the assumed percentage of growth is the same. The export of sulfuric acid is carried out mainly by “Aurubis - Bulgaria”. The sulfuric acid is a secondary product in the production of copper. The quantities of sulphuric acid produced by “Aurubis” are bound proportionally to the quantities of copper concentrate, which the company imports for the implementation of the production process. In the imports of machinery there is a specific elasticity factor in relation to the GDP growth. In this way the quantities of handled machines by years are extrapolated according to the forecast and the respective elasticity factor of the GDP growth.
Forecasts of the processed metals and metal products Table 5-8 contains the forecast for the import of metals. In both ports the processed commodities increase significantly.
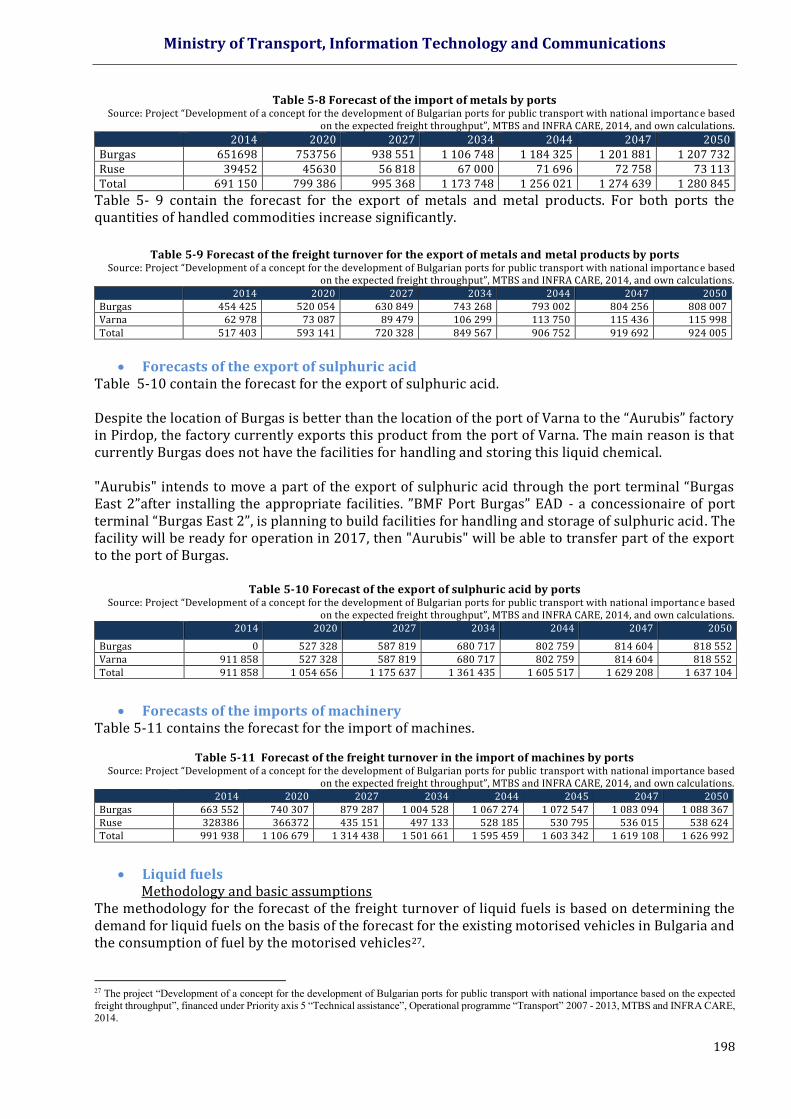
Ministry of Transport, Information Technology and Communications
198
Table 5-8 Forecast of the import of metals by ports Source: Project “Development of a concept for the development of Bulgarian ports for public transport with national importanc e based
on the expected freight throughput”, MTBS and INFRA CARE, 2014, and own calculations.
2014 2020 2027 2034 2044 2047 2050 Burgas 651698 753756 938 551 1 106 748 1 184 325 1 201 881 1 207 732 Ruse 39452 45630 56 818 67 000 71 696 72 758 73 113 Total 691 150 799 386 995 368 1 173 748 1 256 021 1 274 639 1 280 845
Table 5- 9 contain the forecast for the export of metals and metal products. For both ports the quantities of handled commodities increase significantly.
Table 5-9 Forecast of the freight turnover for the export of metals and metal products by ports Source: Project “Development of a concept for the development of Bulgarian ports for public transport with national importanc e based
on the expected freight throughput”, MTBS and INFRA CARE, 2014, and own calculations. 2014 2020 2027 2034 2044 2047 2050 Burgas 454 425 520 054 630 849 743 268 793 002 804 256 808 007 Varna 62 978 73 087 89 479 106 299 113 750 115 436 115 998 Total 517 403 593 141 720 328 849 567 906 752 919 692 924 005
Forecasts of the export of sulphuric acid
Table 5-10 contain the forecast for the export of sulphuric acid. Despite the location of Burgas is better than the location of the port of Varna to the “Aurubis” factory in Pirdop, the factory currently exports this product from the port of Varna. The main reason is that currently Burgas does not have the facilities for handling and storing this liquid chemical. "Aurubis" intends to move a part of the export of sulphuric acid through the port terminal “Burgas East 2”after installing the appropriate facilities. ”BMF Port Burgas” EAD - a concessionaire of port terminal “Burgas East 2”, is planning to build facilities for handling and storage of sulphuric acid . The facility will be ready for operation in 2017, then "Aurubis" will be able to transfer part of the export to the port of Burgas.
Table 5-10 Forecast of the export of sulphuric acid by ports
Source: Project “Development of a concept for the development of Bulgarian ports for public transport with national importanc e based on the expected freight throughput”, MTBS and INFRA CARE, 2014, and own calculations.
2014 2020 2027 2034 2044 2047 2050
Burgas 0 527 328 587 819 680 717 802 759 814 604 818 552 Varna 911 858 527 328 587 819 680 717 802 759 814 604 818 552 Total 911 858 1 054 656 1 175 637 1 361 435 1 605 517 1 629 208 1 637 104
Forecasts of the imports of machinery
Table 5-11 contains the forecast for the import of machines.
Table 5-11 Forecast of the freight turnover in the import of machines by ports
Source: Project “Development of a concept for the development of Bulgarian ports for public transport with national importance based on the expected freight throughput”, MTBS and INFRA CARE, 2014, and own calculations.
2014 2020 2027 2034 2044 2045 2047 2050 Burgas 663 552 740 307 879 287 1 004 528 1 067 274 1 072 547 1 083 094 1 088 367 Ruse 328386 366372 435 151 497 133 528 185 530 795 536 015 538 624 Total 991 938 1 106 679 1 314 438 1 501 661 1 595 459 1 603 342 1 619 108 1 626 992
Liquid fuels
Methodology and basic assumptions The methodology for the forecast of the freight turnover of liquid fuels is based on determining the demand for liquid fuels on the basis of the forecast for the existing motorised vehicles in Bulgaria and the consumption of fuel by the motorised vehicles27.
27 The project “Development of a concept for the development of Bulgarian ports for public transport with national importance based on the expected freight throughput”, financed under Priority axis 5 “Technical assistance”, Operational programme “Transport” 2007 - 2013, MTBS and INFRA CARE, 2014.
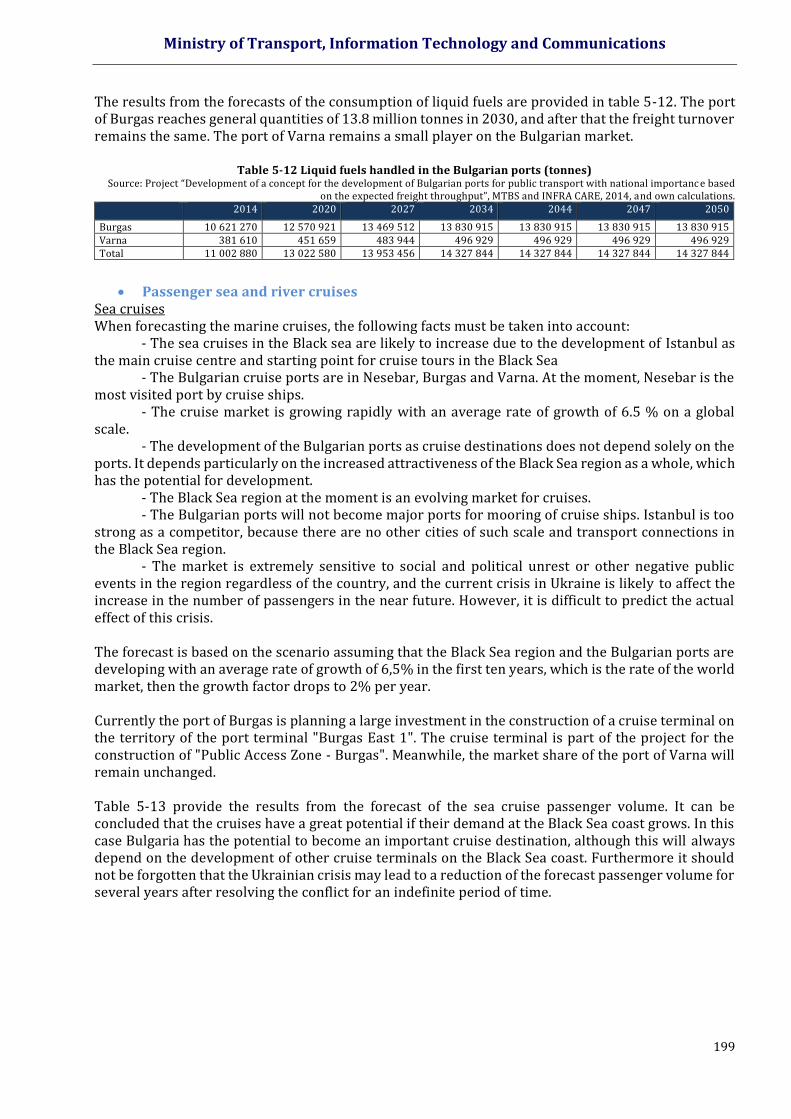
Ministry of Transport, Information Technology and Communications
199
The results from the forecasts of the consumption of liquid fuels are provided in table 5-12. The port of Burgas reaches general quantities of 13.8 million tonnes in 2030, and after that the freight turnover remains the same. The port of Varna remains a small player on the Bulgarian market.
Table 5-12 Liquid fuels handled in the Bulgarian ports (tonnes)
Source: Project “Development of a concept for the development of Bulgarian ports for public transport with national importanc e based on the expected freight throughput”, MTBS and INFRA CARE, 2014, and own calculations.
2014 2020 2027 2034 2044 2047 2050
Burgas 10 621 270 12 570 921 13 469 512 13 830 915 13 830 915 13 830 915 13 830 915 Varna 381 610 451 659 483 944 496 929 496 929 496 929 496 929 Total 11 002 880 13 022 580 13 953 456 14 327 844 14 327 844 14 327 844 14 327 844
Passenger sea and river cruises
Sea cruises When forecasting the marine cruises, the following facts must be taken into account:
- The sea cruises in the Black sea are likely to increase due to the development of Istanbul as the main cruise centre and starting point for cruise tours in the Black Sea
- The Bulgarian cruise ports are in Nesebar, Burgas and Varna. At the moment, Nesebar is the most visited port by cruise ships.
- The cruise market is growing rapidly with an average rate of growth of 6.5 % on a global scale.
- The development of the Bulgarian ports as cruise destinations does not depend solely on the ports. It depends particularly on the increased attractiveness of the Black Sea region as a whole, which has the potential for development.
- The Black Sea region at the moment is an evolving market for cruises. - The Bulgarian ports will not become major ports for mooring of cruise ships. Istanbul is too
strong as a competitor, because there are no other cities of such scale and transport connections in the Black Sea region.
- The market is extremely sensitive to social and political unrest or other negative public events in the region regardless of the country, and the current crisis in Ukraine is likely to affect the increase in the number of passengers in the near future. However, it is difficult to predict the actual effect of this crisis. The forecast is based on the scenario assuming that the Black Sea region and the Bulgarian ports are developing with an average rate of growth of 6,5% in the first ten years, which is the rate of the world market, then the growth factor drops to 2% per year. Currently the port of Burgas is planning a large investment in the construction of a cruise terminal on the territory of the port terminal "Burgas East 1". The cruise terminal is part of the project for the construction of "Public Access Zone - Burgas". Meanwhile, the market share of the port of Varna will remain unchanged. Table 5-13 provide the results from the forecast of the sea cruise passenger volume. It can be concluded that the cruises have a great potential if their demand at the Black Sea coast grows. In this case Bulgaria has the potential to become an important cruise destination, although this will always depend on the development of other cruise terminals on the Black Sea coast. Furthermore it should not be forgotten that the Ukrainian crisis may lead to a reduction of the forecast passenger volume for several years after resolving the conflict for an indefinite period of time.

Ministry of Transport, Information Technology and Communications
200
Table 5-13 Forecast of the development of sea cruises (passengers) Source: Project “Development of a concept for the development of Bulgarian ports for public transport with national importanc e based
on the expected freight throughput”, MTBS and INFRA CARE, 2014, and own calculations. 2009 2014 2020 2027 2034 2044 2047 2050 Burgas 263 6 035 9 468 19 851 25 698 27 246 27 695 27 845 Nesebar 7 957 22 683 33 098 44 126 49 324 55 960 58 339 57 132 Varna 2 504 8 701 12 696 22 425 24 296 24 844 24 067 24 264 Total 10 724 37 419 55 262 86 401 99 318 108 051 110 102 109 241
River cruises
The assumptions in respect of river cruises are almost the same as for the marine cruises. When forecasting the river cruises, the following facts must be taken into account:
- The market for river cruises in Europe has increased by 10% per year in the last 5 years. The most popular river cruise destinations are the Rhine, the Main and the Danube due to the large number of attractive and easily accessible locations along the coast.
- Bulgaria currently has a good connection with the river cruises, including with the largest operator - Viking River Cruises.
- The incomes of the population in Southeast Europe may increase, which may increase the domestic market for cruises.
- The Bulgarian river ports will not become main ports, because of the absence of large cities, airports or convenient transport infrastructure in proximity.
The forecast scenario provides for the Bulgarian river cruise ports a growth of 5% per year in the next ten years, then the increase will drop to 1% per year.
Table 5-14 provide the results from the forecast of the river cruise passenger volume. The results lead to the conclusion that the river cruises may become an important market for the Bulgarian river ports, since this sector is rapidly growing in Europe. The Rhine, Main and Danube appear to be the most attractive sailing rivers in Europe, so this scenario is highly probable.
Table 5-14 Forecast of the development of river cruises (passengers) Source: Project “Development of a concept for the development of Bulgarian ports for public transport with national importanc e based
on the expected freight throughput”, MTBS and INFRA CARE, 2014, and own calculations. 2009 2014 2020 2027 2034 2044 2047 2050
Ruse/Svishtov 9 244 8 624 11 557 13 946 16 012 17 853 18 378 18 553 Vidin/Lom 16 393 17 213 23 067 26 723 29 504 34 237 35 983 35 983
Total 25 637 25 837 34 624 40 669 45 516 52 090 54 361 54 536
5.4 FORECASTS FOR GOODS AND PASSENGERS TRANSPORTED BY AIR
The forecasts of the passengers handled by the Bulgarian airports are made on the basis of the current demand for air transport services for the period 2007 - 2014. Trend forecast dependencies are used, because the airports handle Bulgarian and foreign air carriers as well as Bulgarian and foreign citizens, so it is not correct to use elasticity coefficients in relation to the Bulgarian GDP or the Bulgarian GDP per capita. The total number of passengers handled in airports have a linear trend. On this basis, the following forecast dependency is established:
96,5815862.54,213738 tAirPass , where AirPass is the number of passengers handled in
airports, and t is the consecutive year of the forecast period, 1t for 2007.
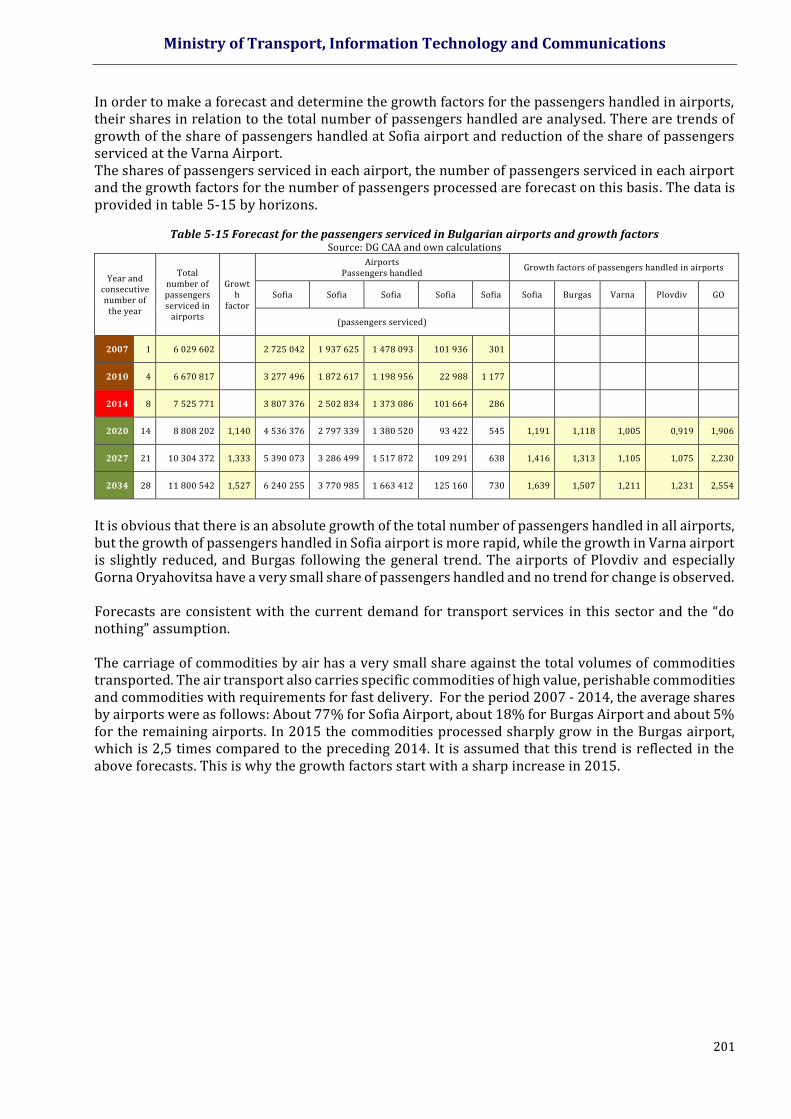
Ministry of Transport, Information Technology and Communications
201
In order to make a forecast and determine the growth factors for the passengers handled in airports, their shares in relation to the total number of passengers handled are analysed. There are trends of growth of the share of passengers handled at Sofia airport and reduction of the share of passengers serviced at the Varna Airport. The shares of passengers serviced in each airport, the number of passengers serviced in each airport and the growth factors for the number of passengers processed are forecast on this basis. The data is provided in table 5-15 by horizons.
Table 5-15 Forecast for the passengers serviced in Bulgarian airports and growth factors
Source: DG CAA and own calculations
Year and consecutive number of
the year
Total number of passengers serviced in
airports
Growth
factor
Airports Passengers handled
Growth factors of passengers handled in airports
Sofia Sofia Sofia Sofia Sofia Sofia Burgas Varna Plovdiv GO
(passengers serviced)
2007 1 6 029 602 2 725 042 1 937 625 1 478 093 101 936 301
2010 4 6 670 817 3 277 496 1 872 617 1 198 956 22 988 1 177
2014 8 7 525 771 3 807 376 2 502 834 1 373 086 101 664 286
2020 14 8 808 202 1,140 4 536 376 2 797 339 1 380 520 93 422 545 1,191 1,118 1,005 0,919 1,906
2027 21 10 304 372 1,333 5 390 073 3 286 499 1 517 872 109 291 638 1,416 1,313 1,105 1,075 2,230
2034 28 11 800 542 1,527 6 240 255 3 770 985 1 663 412 125 160 730 1,639 1,507 1,211 1,231 2,554
It is obvious that there is an absolute growth of the total number of passengers handled in all airports, but the growth of passengers handled in Sofia airport is more rapid, while the growth in Varna airport is slightly reduced, and Burgas following the general trend. The airports of Plovdiv and especially Gorna Oryahovitsa have a very small share of passengers handled and no trend for change is observed. Forecasts are consistent with the current demand for transport services in this sector and the “do nothing” assumption. The carriage of commodities by air has a very small share against the total volumes of commodities transported. The air transport also carries specific commodities of high value, perishable commodities and commodities with requirements for fast delivery. For the period 2007 - 2014, the average shares by airports were as follows: About 77% for Sofia Airport, about 18% for Burgas Airport and about 5% for the remaining airports. In 2015 the commodities processed sharply grow in the Burgas airport, which is 2,5 times compared to the preceding 2014. It is assumed that this trend is reflected in the above forecasts. This is why the growth factors start with a sharp increase in 2015.

Ministry of Transport, Information Technology and Communications
202
V. ASSESSMENT OF THE ADMINISTRATIVE CAPACITY 6.1 SCOPE AND METHODOLOGY OF THE ASSESSMENT OF THE
ADMINISTRATIVE CAPACITY The main objective of the assessment of the administrative capacity is to identify measures for enhancing the capacity of the beneficiaries for the implementation and management of the projects, identified on the basis of the Integrated Transport Strategy for the period until 2030. The scope of the assessment of the administrative capacity is presented in Table 6-1.
Table 6-1. Scope of the assessment of the administrative capacity
1. TARGET BENEFICIARIES Requirement of the Contracting
Authority Extended scope in Report No. 4 Review of the administrative capacity of:
1. MTITC
2. NRIC
3. RIA
4. NCSIP
5. EAEMDR
6. BPIC
7. Metropoliten EAD
Performed assessment of the administrative capacity of:
1. MTITC
2. NRIC
3. RIA
4. NCSIP28
5. EAEMDR
6. BPIC
7. Metropoliten EAD
8. DG CAA
9. EAMA 2. AREAS OF ASSESSMENT
Requirement of the Contracting Authority
Extended scope in Report No. 4
1. Project identification, preparation and programming;
2. Project implementation;
3. Project and programme monitoring and assessment;
4. Financial management and control of project implementation.
1. Project identification, preparation and programming;
2. Project implementation;
3. Project and programme monitoring and assessment;
4. Financial management and control of project implementation.
5. Strategies and measures for human resource development in the units of each beneficiary associated with project implementation and management;
6. Policies, plans and projects in the field of training and exchange of experience for employees working on projects;
7. Policies and instruments for assessment of professional performance, payment and personnel motivation, related to the project cycle;
8. Managerial practices and human resources management involved in the project cycle.
3. TIME SCOPE OF THE ASSESSMENT Requirement of the Contracting
Authority Extended scope in Report No. 4
Preparation of a schedule of activities for the enhancement of the administrative capacity of the respective beneficiaries for the 2014 - 2020 programming period
For each of the target beneficiaries a schedule for the period until 2030 is prepared with 3 time periods (short-term, mid-term and long-term) involving a different set of specifically identified measures, areas and activities for enhancement of administrative capacity.
Methodological tools, including the following methods, stages and related activities have been used for the assessment of the administrative capacity (AC):
28 In connection with the amendment adopted on 7 April 2016 by the National Assembly to the Law on Roads in regard to the termination of the activitiy of NCSIP that came into effect with its publication on 15.04.2016, in issue No. 30 of the State Gazette, in Report No. 4, an assessment of the administrative capacity of RIA for the management and implementation of projects by NCSIP, transferred in compliance with the Agreement between the MA of OPTTI and RIA of 15.06.2016.
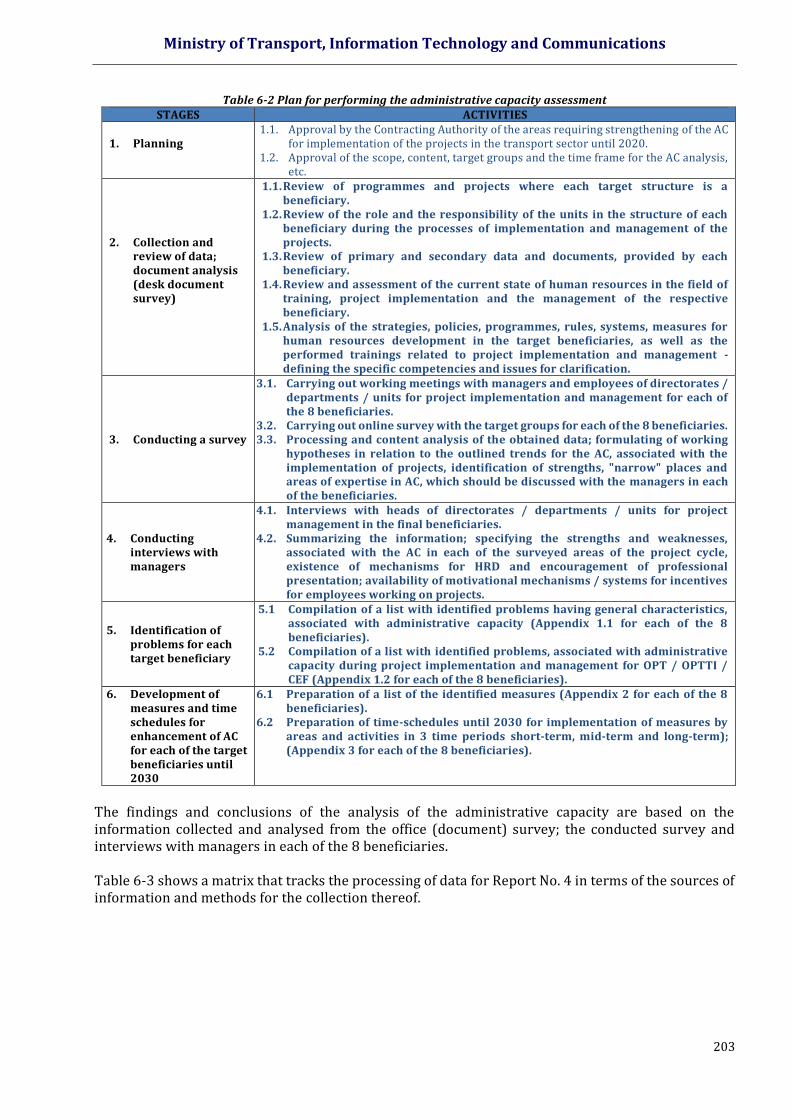
Ministry of Transport, Information Technology and Communications
203
Table 6-2 Plan for performing the administrative capacity assessment STAGES ACTIVITIES
1. Planning
1.1. Approval by the Contracting Authority of the areas requiring strengthening of the AC for implementation of the projects in the transport sector until 2020.
1.2. Approval of the scope, content, target groups and the time frame for the AC analysis, etc.
2. Collection and review of data; document analysis (desk document survey)
1.1. Review of programmes and projects where each target structure is a beneficiary.
1.2. Review of the role and the responsibility of the units in the structure of each beneficiary during the processes of implementation and management of the projects.
1.3. Review of primary and secondary data and documents, provided by each beneficiary.
1.4. Review and assessment of the current state of human resources in the field of training, project implementation and the management of the respective beneficiary.
1.5. Analysis of the strategies, policies, programmes, rules, systems, measures for human resources development in the target beneficiaries, as well as the performed trainings related to project implementation and management - defining the specific competencies and issues for clarification.
3. Conducting a survey
3.1. Carrying out working meetings with managers and employees of directorates / departments / units for project implementation and management for each of the 8 beneficiaries.
3.2. Carrying out online survey with the target groups for each of the 8 beneficiaries. 3.3. Processing and content analysis of the obtained data; formulating of working
hypotheses in relation to the outlined trends for the AC, associated with the implementation of projects, identification of strengths, "narrow" places and areas of expertise in AC, which should be discussed with the managers in each of the beneficiaries.
4. Conducting interviews with managers
4.1. Interviews with heads of directorates / departments / units for project management in the final beneficiaries.
4.2. Summarizing the information; specifying the strengths and weaknesses, associated with the AC in each of the surveyed areas of the project cycle, existence of mechanisms for HRD and encouragement of professional presentation; availability of motivational mechanisms / systems for incentives for employees working on projects.
5. Identification of problems for each target beneficiary
5.1 Compilation of a list with identified problems having general characteristics, associated with administrative capacity (Appendix 1.1 for each of the 8 beneficiaries).
5.2 Compilation of a list with identified problems, associated with administrative capacity during project implementation and management for OPT / OPTTI / CEF (Appendix 1.2 for each of the 8 beneficiaries).
6. Development of measures and time schedules for enhancement of AC for each of the target beneficiaries until 2030
6.1 Preparation of a list of the identified measures (Appendix 2 for each of the 8 beneficiaries).
6.2 Preparation of time-schedules until 2030 for implementation of measures by areas and activities in 3 time periods short-term, mid-term and long-term); (Appendix 3 for each of the 8 beneficiaries).
The findings and conclusions of the analysis of the administrative capacity are based on the information collected and analysed from the office (document) survey; the conducted survey and interviews with managers in each of the 8 beneficiaries. Table 6-3 shows a matrix that tracks the processing of data for Report No. 4 in terms of the sources of information and methods for the collection thereof.
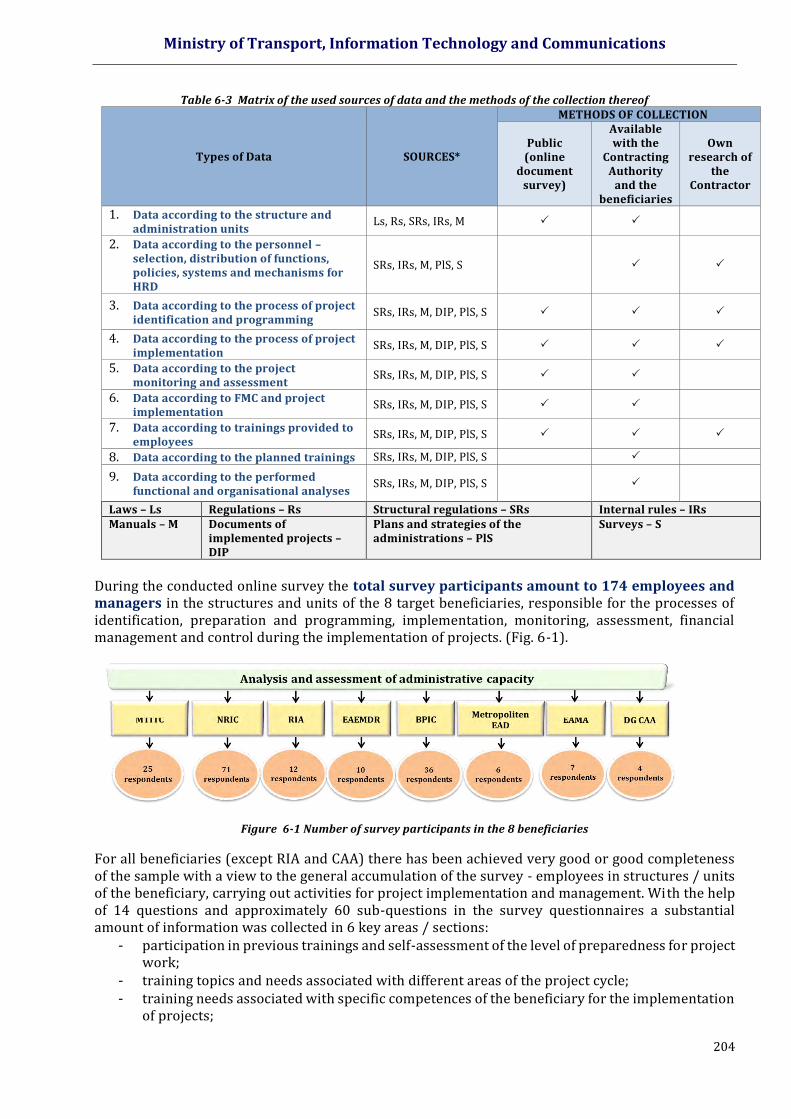
Ministry of Transport, Information Technology and Communications
204
Table 6-3 Matrix of the used sources of data and the methods of the collection thereof
Types of Data SOURCES*
METHODS OF COLLECTION
Public (online
document survey)
Available with the
Contracting Authority
and the beneficiaries
Own research of
the Contractor
1. Data according to the structure and administration units
Ls, Rs, SRs, IRs, M
2. Data according to the personnel – selection, distribution of functions, policies, systems and mechanisms for HRD
SRs, IRs, M, PlS, S
3. Data according to the process of project identification and programming
SRs, IRs, M, DIP, PlS, S
4. Data according to the process of project implementation
SRs, IRs, M, DIP, PlS, S
5. Data according to the project monitoring and assessment
SRs, IRs, M, DIP, PlS, S
6. Data according to FMC and project implementation
SRs, IRs, M, DIP, PlS, S
7. Data according to trainings provided to employees
SRs, IRs, M, DIP, PlS, S
8. Data according to the planned trainings SRs, IRs, M, DIP, PlS, S
9. Data according to the performed functional and organisational analyses
SRs, IRs, M, DIP, PlS, S
Laws – Ls Regulations – Rs Structural regulations – SRs Internal rules – IRs Manuals – M Documents of
implemented projects – DIP
Plans and strategies of the administrations – PlS
Surveys – S
During the conducted online survey the total survey participants amount to 174 employees and managers in the structures and units of the 8 target beneficiaries, responsible for the processes of identification, preparation and programming, implementation, monitoring, assessment, financial management and control during the implementation of projects. (Fig. 6-1).
Figure 6-1 Number of survey participants in the 8 beneficiaries
For all beneficiaries (except RIA and CAA) there has been achieved very good or good completeness of the sample with a view to the general accumulation of the survey - employees in structures / units of the beneficiary, carrying out activities for project implementation and management. With the help of 14 questions and approximately 60 sub-questions in the survey questionnaires a substantial amount of information was collected in 6 key areas / sections:
- participation in previous trainings and self-assessment of the level of preparedness for project work;
- training topics and needs associated with different areas of the project cycle; - training needs associated with specific competences of the beneficiary for the implementation
of projects;
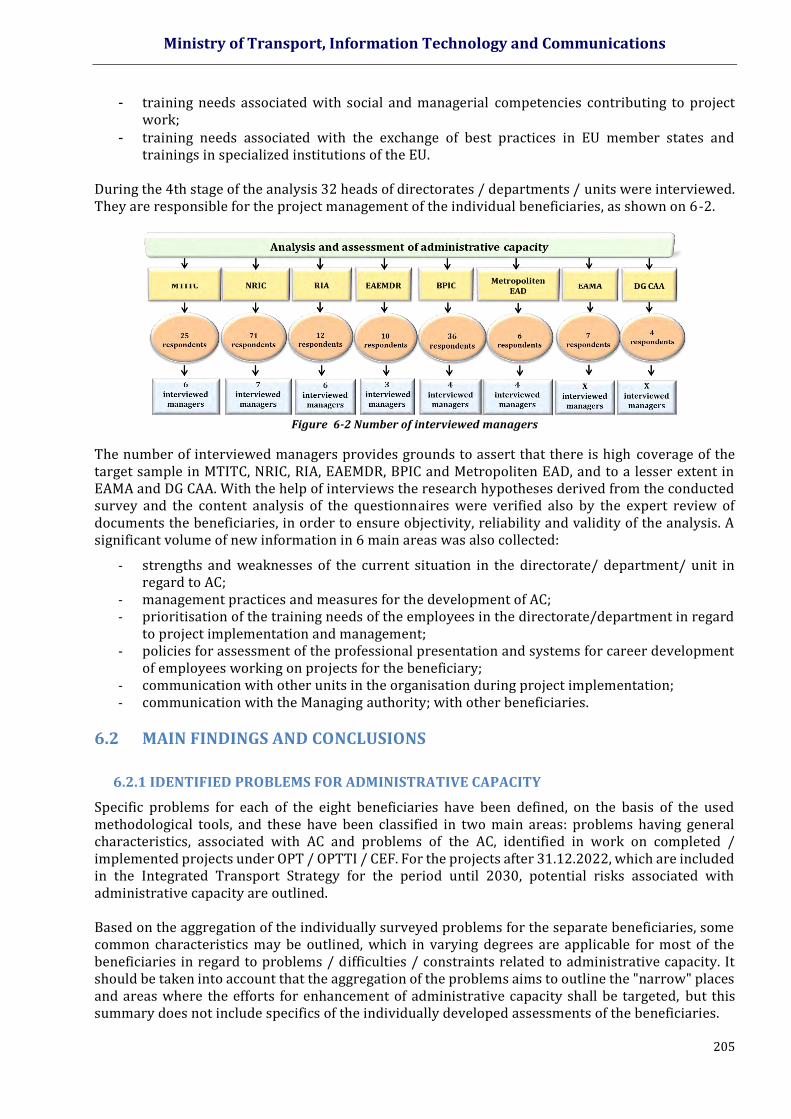
Ministry of Transport, Information Technology and Communications
205
- training needs associated with social and managerial competencies contributing to project work;
- training needs associated with the exchange of best practices in EU member states and trainings in specialized institutions of the EU.
During the 4th stage of the analysis 32 heads of directorates / departments / units were interviewed. They are responsible for the project management of the individual beneficiaries, as shown on 6-2.
Figure 6-2 Number of interviewed managers
The number of interviewed managers provides grounds to assert that there is high coverage of the target sample in MTITC, NRIC, RIA, EAEMDR, BPIC and Metropoliten EAD, and to a lesser extent in EAMA and DG CAA. With the help of interviews the research hypotheses derived from the conducted survey and the content analysis of the questionnaires were verified also by the expert review of documents the beneficiaries, in order to ensure objectivity, reliability and validity of the analysis. A significant volume of new information in 6 main areas was also collected:
- strengths and weaknesses of the current situation in the directorate/ department/ unit in regard to AC;
- management practices and measures for the development of AC; - prioritisation of the training needs of the employees in the directorate/department in regard
to project implementation and management; - policies for assessment of the professional presentation and systems for career development
of employees working on projects for the beneficiary; - communication with other units in the organisation during project implementation; - communication with the Managing authority; with other beneficiaries.
6.2 MAIN FINDINGS AND CONCLUSIONS
6.2.1 IDENTIFIED PROBLEMS FOR ADMINISTRATIVE CAPACITY
Specific problems for each of the eight beneficiaries have been defined, on the basis of the used methodological tools, and these have been classified in two main areas: problems having general characteristics, associated with AC and problems of the AC, identified in work on completed / implemented projects under OPT / OPTTI / CEF. For the projects after 31.12.2022, which are included in the Integrated Transport Strategy for the period until 2030, potential risks associated with administrative capacity are outlined. Based on the aggregation of the individually surveyed problems for the separate beneficiaries, some common characteristics may be outlined, which in varying degrees are applicable for most of the beneficiaries in regard to problems / difficulties / constraints related to administrative capacity. It should be taken into account that the aggregation of the problems aims to outline the "narrow" places and areas where the efforts for enhancement of administrative capacity shall be targeted, but this summary does not include specifics of the individually developed assessments of the beneficiaries.
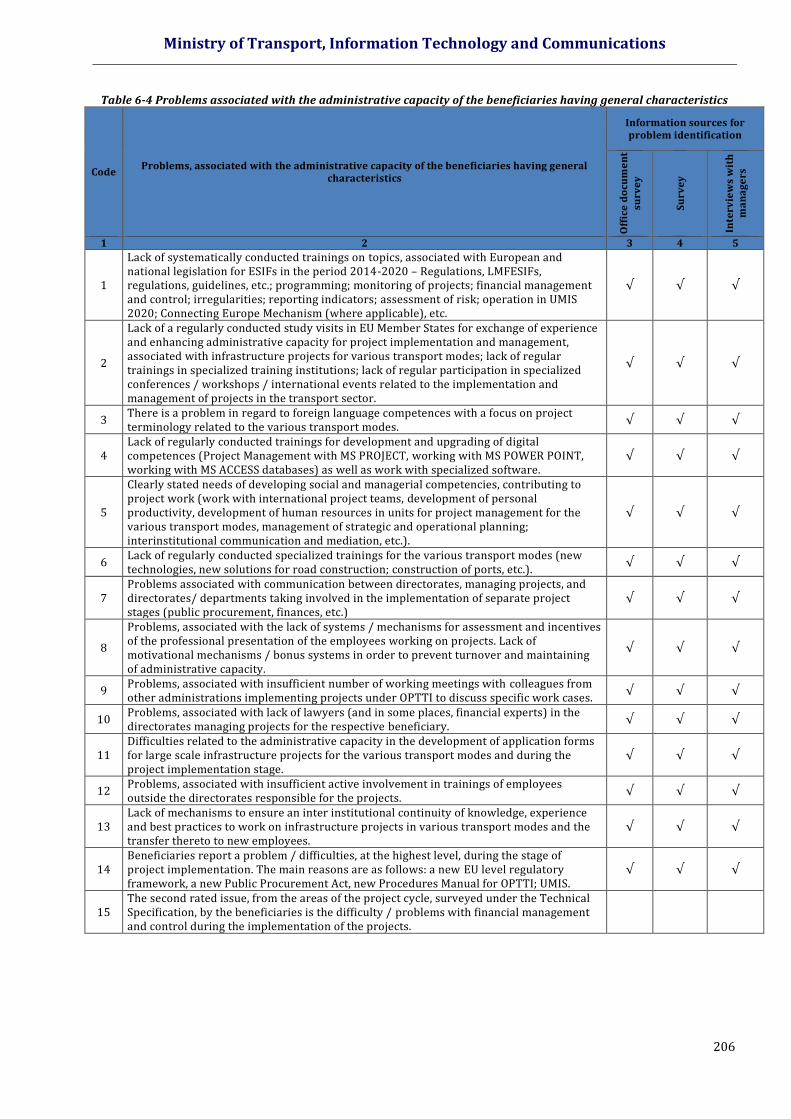
Ministry of Transport, Information Technology and Communications
206
Table 6-4 Problems associated with the administrative capacity of the beneficiaries having general characteristics
Code Problems, associated with the administrative capacity of the beneficiaries having general
characteristics
Information sources for problem identification
Off
ice
do
cum
en
t su
rve
y
Su
rve
y
Inte
rvie
ws
wit
h
ma
na
ge
rs
1 2 3 4 5
1
Lack of systematically conducted trainings on topics, associated with European and national legislation for ESIFs in the period 2014-2020 – Regulations, LMFESIFs, regulations, guidelines, etc.; programming; monitoring of projects; financial management and control; irregularities; reporting indicators; assessment of risk; operation in UMIS 2020; Connecting Europe Mechanism (where applicable), etc.
√ √ √
2
Lack of a regularly conducted study visits in EU Member States for exchange of experience and enhancing administrative capacity for project implementation and management, associated with infrastructure projects for various transport modes; lack of regular trainings in specialized training institutions; lack of regular participation in specialized conferences / workshops / international events related to the implementation and management of projects in the transport sector.
√ √ √
3 There is a problem in regard to foreign language competences with a focus on project terminology related to the various transport modes.
√ √ √
4 Lack of regularly conducted trainings for development and upgrading of digital competences (Project Management with MS PROJECT, working with MS POWER POINT, working with MS ACCESS databases) as well as work with specialized software.
√ √ √
5
Clearly stated needs of developing social and managerial competencies, contributing to project work (work with international project teams, development of personal productivity, development of human resources in units for project management for the various transport modes, management of strategic and operational planning; interinstitutional communication and mediation, etc.).
√ √ √
6 Lack of regularly conducted specialized trainings for the various transport modes (new technologies, new solutions for road construction; construction of ports, etc.).
√ √ √
7 Problems associated with communication between directorates, managing projects, and directorates/ departments taking involved in the implementation of separate project stages (public procurement, finances, etc.)
√ √ √
8
Problems, associated with the lack of systems / mechanisms for assessment and incentives of the professional presentation of the employees working on projects. Lack of motivational mechanisms / bonus systems in order to prevent turnover and maintaining of administrative capacity.
√ √ √
9 Problems, associated with insufficient number of working meetings with colleagues from other administrations implementing projects under OPTTI to discuss specific work cases.
√ √ √
10 Problems, associated with lack of lawyers (and in some places, financial experts) in the directorates managing projects for the respective beneficiary.
√ √ √
11 Difficulties related to the administrative capacity in the development of application forms for large scale infrastructure projects for the various transport modes and during the project implementation stage.
√ √ √
12 Problems, associated with insufficient active involvement in trainings of employees outside the directorates responsible for the projects.
√ √ √
13 Lack of mechanisms to ensure an inter institutional continuity of knowledge, experience and best practices to work on infrastructure projects in various transport modes and the transfer thereto to new employees.
√ √ √
14 Beneficiaries report a problem / difficulties, at the highest level, during the stage of project implementation. The main reasons are as follows: a new EU level regulatory framework, a new Public Procurement Act, new Procedures Manual for OPTTI; UMIS.
√ √ √
15 The second rated issue, from the areas of the project cycle, surveyed under the Technical Specification, by the beneficiaries is the difficulty / problems with financial management and control during the implementation of the projects.
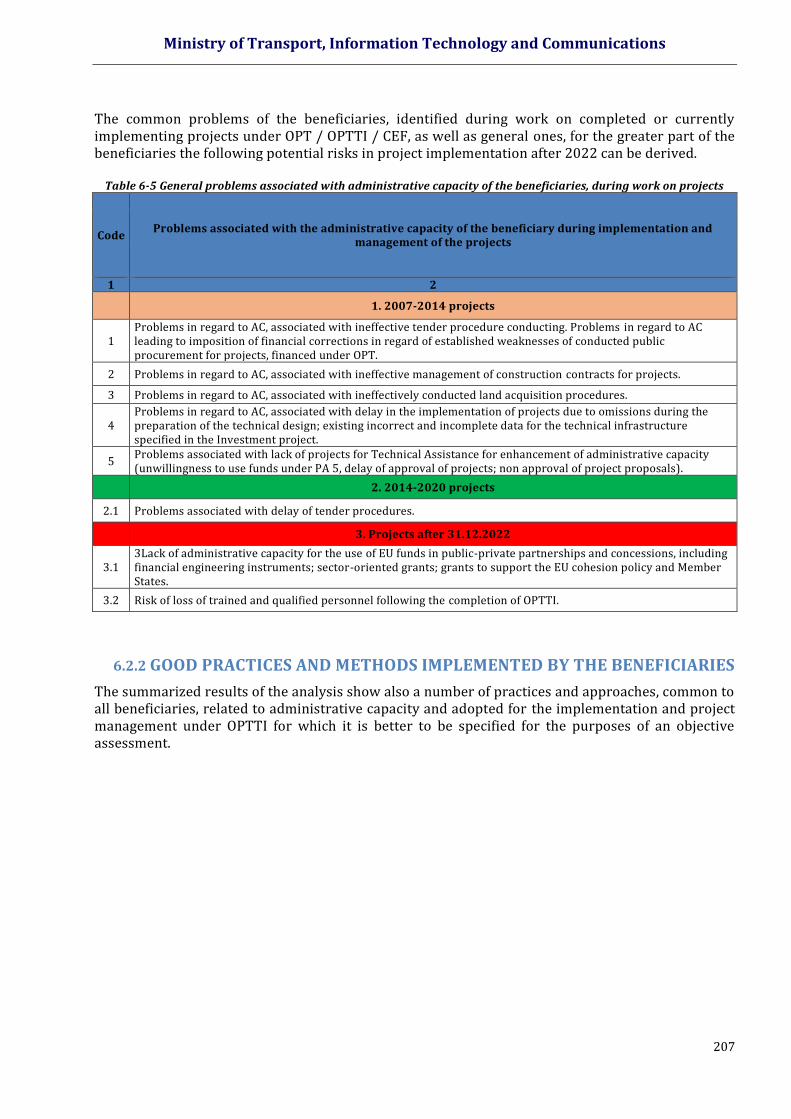
Ministry of Transport, Information Technology and Communications
207
The common problems of the beneficiaries, identified during work on completed or currently implementing projects under OPT / OPTTI / CEF, as well as general ones, for the greater part of the beneficiaries the following potential risks in project implementation after 2022 can be derived.
Table 6-5 General problems associated with administrative capacity of the beneficiaries, during work on projects
Code Problems associated with the administrative capacity of the beneficiary during implementation and
management of the projects
1 2
1. 2007-2014 projects
1 Problems in regard to AC, associated with ineffective tender procedure conducting. Problems in regard to AC leading to imposition of financial corrections in regard of established weaknesses of conducted public procurement for projects, financed under OPT.
2 Problems in regard to AC, associated with ineffective management of construction contracts for projects.
3 Problems in regard to AC, associated with ineffectively conducted land acquisition procedures.
4 Problems in regard to AC, associated with delay in the implementation of projects due to omissions during the preparation of the technical design; existing incorrect and incomplete data for the technical infrastructure specified in the Investment project.
5 Problems associated with lack of projects for Technical Assistance for enhancement of administrative capacity (unwillingness to use funds under PA 5, delay of approval of projects; non approval of project proposals).
2. 2014-2020 projects
2.1 Problems associated with delay of tender procedures.
3. Projects after 31.12.2022
3.1 3Lack of administrative capacity for the use of EU funds in public-private partnerships and concessions, including financial engineering instruments; sector-oriented grants; grants to support the EU cohesion policy and Member States.
3.2 Risk of loss of trained and qualified personnel following the completion of OPTTI.
6.2.2 GOOD PRACTICES AND METHODS IMPLEMENTED BY THE BENEFICIARIES
The summarized results of the analysis show also a number of practices and approaches, common to all beneficiaries, related to administrative capacity and adopted for the implementation and project management under OPTTI for which it is better to be specified for the purposes of an objective assessment.
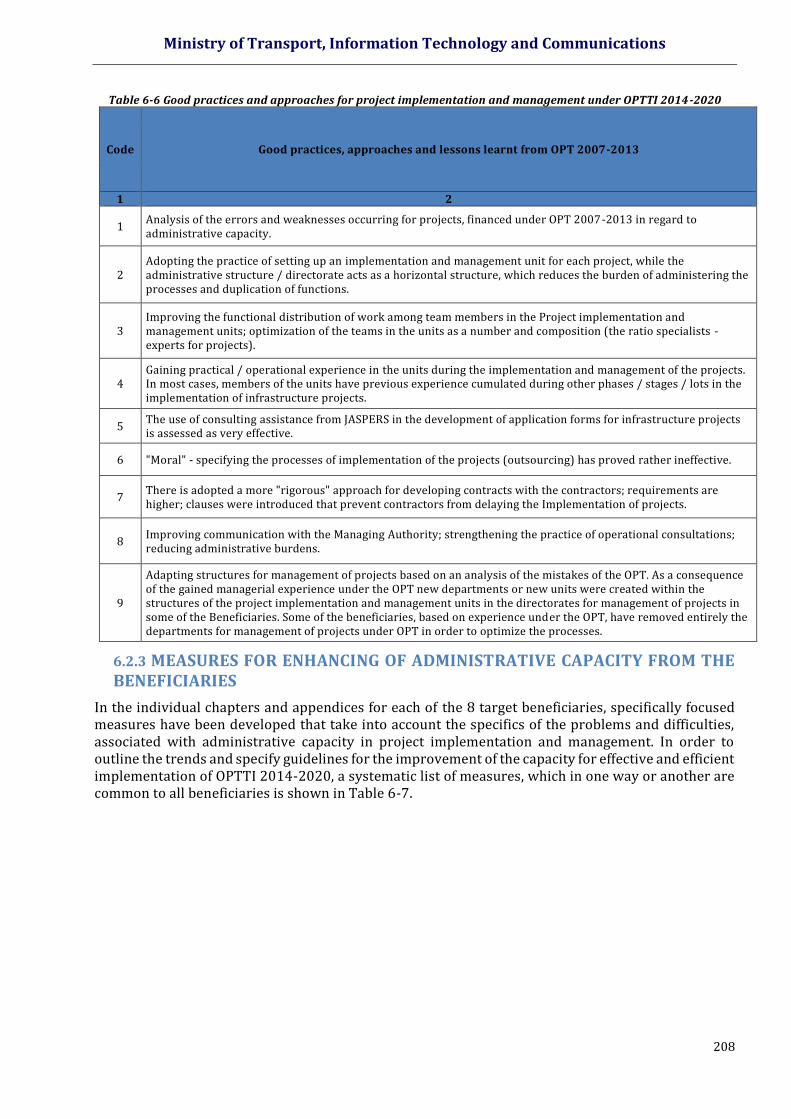
Ministry of Transport, Information Technology and Communications
208
Table 6-6 Good practices and approaches for project implementation and management under OPTTI 2014-2020
Code Good practices, approaches and lessons learnt from OPT 2007-2013
1 2
1 Analysis of the errors and weaknesses occurring for projects, financed under OPT 2007-2013 in regard to administrative capacity.
2 Adopting the practice of setting up an implementation and management unit for each project, while the administrative structure / directorate acts as a horizontal structure, which reduces the burden of administering the processes and duplication of functions.
3 Improving the functional distribution of work among team members in the Project implementation and management units; optimization of the teams in the units as a number and composition (the ratio specialists - experts for projects).
4 Gaining practical / operational experience in the units during the implementation and management of the projects. In most cases, members of the units have previous experience cumulated during other phases / stages / lots in the implementation of infrastructure projects.
5 The use of consulting assistance from JASPERS in the development of application forms for infrastructure projects is assessed as very effective.
6 "Moral" - specifying the processes of implementation of the projects (outsourcing) has proved rather ineffective.
7 There is adopted a more "rigorous" approach for developing contracts with the contractors; requirements are higher; clauses were introduced that prevent contractors from delaying the Implementation of projects.
8 Improving communication with the Managing Authority; strengthening the practice of operational consultations; reducing administrative burdens.
9
Adapting structures for management of projects based on an analysis of the mistakes of the OPT. As a consequence of the gained managerial experience under the OPT new departments or new units were created within the structures of the project implementation and management units in the directorates for management of projects in some of the Beneficiaries. Some of the beneficiaries, based on experience under the OPT, have removed entirely the departments for management of projects under OPT in order to optimize the processes.
6.2.3 MEASURES FOR ENHANCING OF ADMINISTRATIVE CAPACITY FROM THE BENEFICIARIES
In the individual chapters and appendices for each of the 8 target beneficiaries, specifically focused measures have been developed that take into account the specifics of the problems and difficulties, associated with administrative capacity in project implementation and management. In order to outline the trends and specify guidelines for the improvement of the capacity for effective and efficient implementation of OPTTI 2014-2020, a systematic list of measures, which in one way or another are common to all beneficiaries is shown in Table 6-7.

Ministry of Transport, Information Technology and Communications
209
Table 6-7 Measures for enhancing administrative capacity which are the same for all beneficiaries
Measures for enhancement of administrative capacity
1 2 SO 1. Increasing the effectiveness and competitiveness of the transport sector
SP Framework for
the specific objectives (Tasks)
Measures
Code
SP
1. E
ffe
ctiv
e m
ain
ten
an
ce, m
od
ern
iza
tio
n a
nd
de
ve
lop
me
nt
of
tra
nsp
ort
in
fra
stru
ctu
re.
2
Use of other resources of funding the transport
infrastructure. Effective use of European funds
resources.
1
Enhancing the administrative capacity of the beneficiary (directorate and units, directly involved in activities for projects) by starting regular long-term training program on topics associated with implementation and management of OPTTI 2014-2020.
2 Enhancing the administrative capacity of the beneficiary by regular training programme for upgrading and updating of digital competences and skills for working with specialized software.
3 Starting regular long-term training program on specialized topics related to programming, preparation and implementation of infrastructure projects in the respective transport mode.
4 Enhancing the administrative capacity in regard to foreign language competences with a focus on design terminology related to projects in the field of the respective transport mode.
5 Enhancing the administrative capacity of the beneficiaries on topics related to social and managerial skills, assisting project implementation.
6
Development and implementation of programmes for the exchange of experience and good practices in EU Member States, trainings in specialized training institutions, as well as specialized conferences / workshops / international events related to the implementation and management of projects under OPTTI.
7
Establishing a mechanism for introducing mandatory specialized training of new employees in the directorates and departments of the beneficiary, working for projects, and subsequent expert support through practices of coaching / mentoring / coaching by more experienced employees.
SP
2. I
mp
rov
em
en
t o
f th
e m
an
ag
em
en
t o
f th
e t
ran
spo
rt s
yst
em
.
7 Enhancement of
institutional capacity.
1
Enhancing administrative capacity and institutional sustainability of the beneficiary through the development and application of motivational mechanism / bonus system to prevent turnover and encouragement of professional presentation of the employees involved in activities for projects under OPTTI.
2 Ensuring institutional sustainability of the structures in beneficiary, responsible for the management of projects, by providing human resource of experts - mainly lawyers and financial experts.
3
Continuing the strengthening of the administrative capacity of the beneficiary through Technical Assistance and the use of consulting services under the JASPERS initiative; by attracting expertise from IFIs - the World Bank, EBRD, EIB, etc. for the preparation and implementation of transport infrastructure projects.
4 Ensuring institutional continuity and using the accumulated administrative capacity in the structures of the beneficiary for the project implementation and management after completion of the OPTTI.
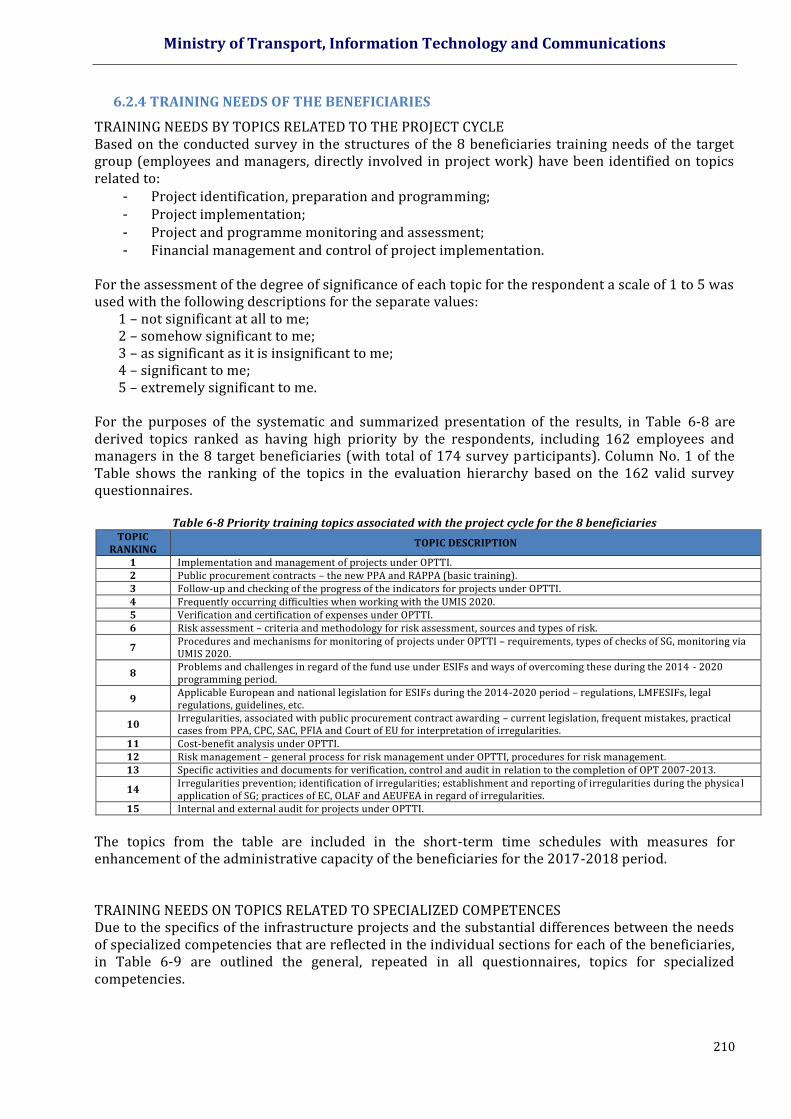
Ministry of Transport, Information Technology and Communications
210
6.2.4 TRAINING NEEDS OF THE BENEFICIARIES
TRAINING NEEDS BY TOPICS RELATED TO THE PROJECT CYCLE Based on the conducted survey in the structures of the 8 beneficiaries training needs of the target group (employees and managers, directly involved in project work) have been identified on topics related to:
- Project identification, preparation and programming; - Project implementation; - Project and programme monitoring and assessment; - Financial management and control of project implementation.
For the assessment of the degree of significance of each topic for the respondent a scale of 1 to 5 was used with the following descriptions for the separate values:
1 – not significant at all to me; 2 – somehow significant to me; 3 – as significant as it is insignificant to me; 4 – significant to me; 5 – extremely significant to me.
For the purposes of the systematic and summarized presentation of the results, in Table 6-8 are derived topics ranked as having high priority by the respondents, including 162 employees and managers in the 8 target beneficiaries (with total of 174 survey participants). Column No. 1 of the Table shows the ranking of the topics in the evaluation hierarchy based on the 162 valid survey questionnaires.
Table 6-8 Priority training topics associated with the project cycle for the 8 beneficiaries
TOPIC RANKING
TOPIC DESCRIPTION
1 Implementation and management of projects under OPTTI. 2 Public procurement contracts – the new PPA and RAPPA (basic training). 3 Follow-up and checking of the progress of the indicators for projects under OPTTI. 4 Frequently occurring difficulties when working with the UMIS 2020. 5 Verification and certification of expenses under OPTTI. 6 Risk assessment – criteria and methodology for risk assessment, sources and types of risk.
7 Procedures and mechanisms for monitoring of projects under OPTTI – requirements, types of checks of SG, monitoring via UMIS 2020.
8 Problems and challenges in regard of the fund use under ESIFs and ways of overcoming these during the 2014 - 2020 programming period.
9 Applicable European and national legislation for ESIFs during the 2014-2020 period – regulations, LMFESIFs, legal regulations, guidelines, etc.
10 Irregularities, associated with public procurement contract awarding – current legislation, frequent mistakes, practical cases from PPA, CPC, SAC, PFIA and Court of EU for interpretation of irregularities.
11 Cost-benefit analysis under OPTTI. 12 Risk management – general process for risk management under OPTTI, procedures for risk management. 13 Specific activities and documents for verification, control and audit in relation to the completion of OPT 2007-2013.
14 Irregularities prevention; identification of irregularities; establishment and reporting of irregularities during the physica l application of SG; practices of EC, OLAF and AEUFEA in regard of irregularities.
15 Internal and external audit for projects under OPTTI.
The topics from the table are included in the short-term time schedules with measures for enhancement of the administrative capacity of the beneficiaries for the 2017-2018 period. TRAINING NEEDS ON TOPICS RELATED TO SPECIALIZED COMPETENCES Due to the specifics of the infrastructure projects and the substantial differences between the needs of specialized competencies that are reflected in the individual sections for each of the beneficiaries, in Table 6-9 are outlined the general, repeated in all questionnaires, topics for specialized competencies.

Ministry of Transport, Information Technology and Communications
211
Table 6-9 Priority training topics for specialized competences for all beneficiaries
TOPIC RANKING
TOPIC DESCRIPTION
1 Development and upgrading of digital competences (management of projects with MS PROJECT, work with MS POWER POINT, work with MS ACCESS databases).
2 Specialized training in English language for project terminology related to projects in the area of the respective transport mode for which the beneficiary is responsible.
TRAINING NEEDS ON TOPICS RELATED TO SOCIAL AND MANAGERIAL COMPETENCES CONTRIBUTING TO PROJECT WORK With total of 158 employees and managers in 8 target beneficiaries, participating in topic ranking, the following 5 thematic areas were outlined as priority.
Table 6-10 Priority training topics for social and managerial competencies, contributing to project work TOPIC
RANKING TOPIC DESCRIPTION
1 Work on projects with international teams.
2 Development of personal productivity.
3 Prevention of the burn out syndrome.
4 Management of strategic and operational planning.
5 Mentoring, couching and tutoring – effective instruments for the preservation and continuity of internal institutional knowledge and skills related to the project cycle.
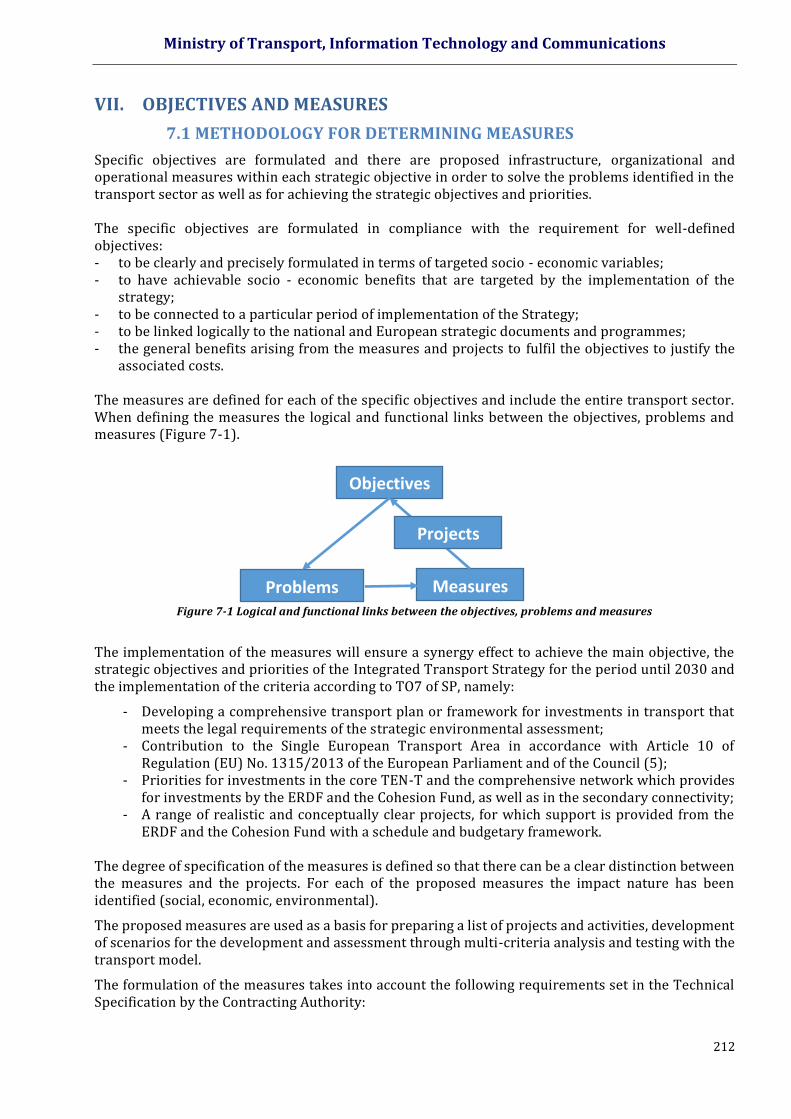
Ministry of Transport, Information Technology and Communications
212
VII. OBJECTIVES AND MEASURES
7.1 METHODOLOGY FOR DETERMINING MEASURES
Specific objectives are formulated and there are proposed infrastructure, organizational and operational measures within each strategic objective in order to solve the problems identified in the transport sector as well as for achieving the strategic objectives and priorities. The specific objectives are formulated in compliance with the requirement for well-defined objectives: - to be clearly and precisely formulated in terms of targeted socio - economic variables; - to have achievable socio - economic benefits that are targeted by the implementation of the
strategy; - to be connected to a particular period of implementation of the Strategy; - to be linked logically to the national and European strategic documents and programmes; - the general benefits arising from the measures and projects to fulfil the objectives to justify the
associated costs. The measures are defined for each of the specific objectives and include the entire transport sector. When defining the measures the logical and functional links between the objectives, problems and measures (Figure 7-1).
Figure 7-1 Logical and functional links between the objectives, problems and measures
The implementation of the measures will ensure a synergy effect to achieve the main objective, the strategic objectives and priorities of the Integrated Transport Strategy for the period until 2030 and the implementation of the criteria according to TO7 of SP, namely:
- Developing a comprehensive transport plan or framework for investments in transport that meets the legal requirements of the strategic environmental assessment;
- Contribution to the Single European Transport Area in accordance with Article 10 of Regulation (EU) No. 1315/2013 of the European Parliament and of the Council (5);
- Priorities for investments in the core TEN-T and the comprehensive network which provides for investments by the ERDF and the Cohesion Fund, as well as in the secondary connectivity;
- A range of realistic and conceptually clear projects, for which support is provided from the ERDF and the Cohesion Fund with a schedule and budgetary framework.
The degree of specification of the measures is defined so that there can be a clear distinction between the measures and the projects. For each of the proposed measures the impact nature has been identified (social, economic, environmental).
The proposed measures are used as a basis for preparing a list of projects and activities, development of scenarios for the development and assessment through multi-criteria analysis and testing with the transport model.
The formulation of the measures takes into account the following requirements set in the Technical Specification by the Contracting Authority:
Problems
Objectives
Measures
Projects
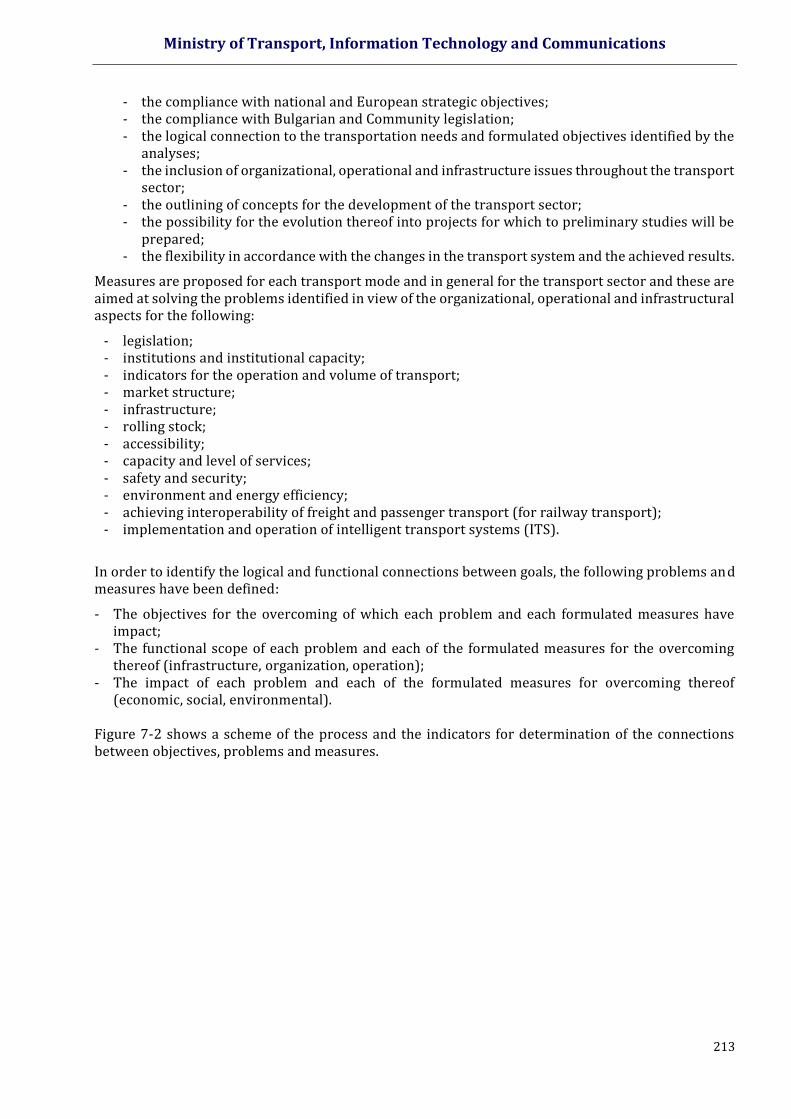
Ministry of Transport, Information Technology and Communications
213
- the compliance with national and European strategic objectives; - the compliance with Bulgarian and Community legislation; - the logical connection to the transportation needs and formulated objectives identified by the
analyses; - the inclusion of organizational, operational and infrastructure issues throughout the transport
sector; - the outlining of concepts for the development of the transport sector; - the possibility for the evolution thereof into projects for which to preliminary studies will be
prepared; - the flexibility in accordance with the changes in the transport system and the achieved results.
Measures are proposed for each transport mode and in general for the transport sector and these are aimed at solving the problems identified in view of the organizational, operational and infrastructural aspects for the following:
- legislation; - institutions and institutional capacity; - indicators for the operation and volume of transport; - market structure; - infrastructure; - rolling stock; - accessibility; - capacity and level of services; - safety and security; - environment and energy efficiency; - achieving interoperability of freight and passenger transport (for railway transport); - implementation and operation of intelligent transport systems (ITS).
In order to identify the logical and functional connections between goals, the following problems and measures have been defined:
- The objectives for the overcoming of which each problem and each formulated measures have impact;
- The functional scope of each problem and each of the formulated measures for the overcoming thereof (infrastructure, organization, operation);
- The impact of each problem and each of the formulated measures for overcoming thereof (economic, social, environmental).
Figure 7-2 shows a scheme of the process and the indicators for determination of the connections between objectives, problems and measures.
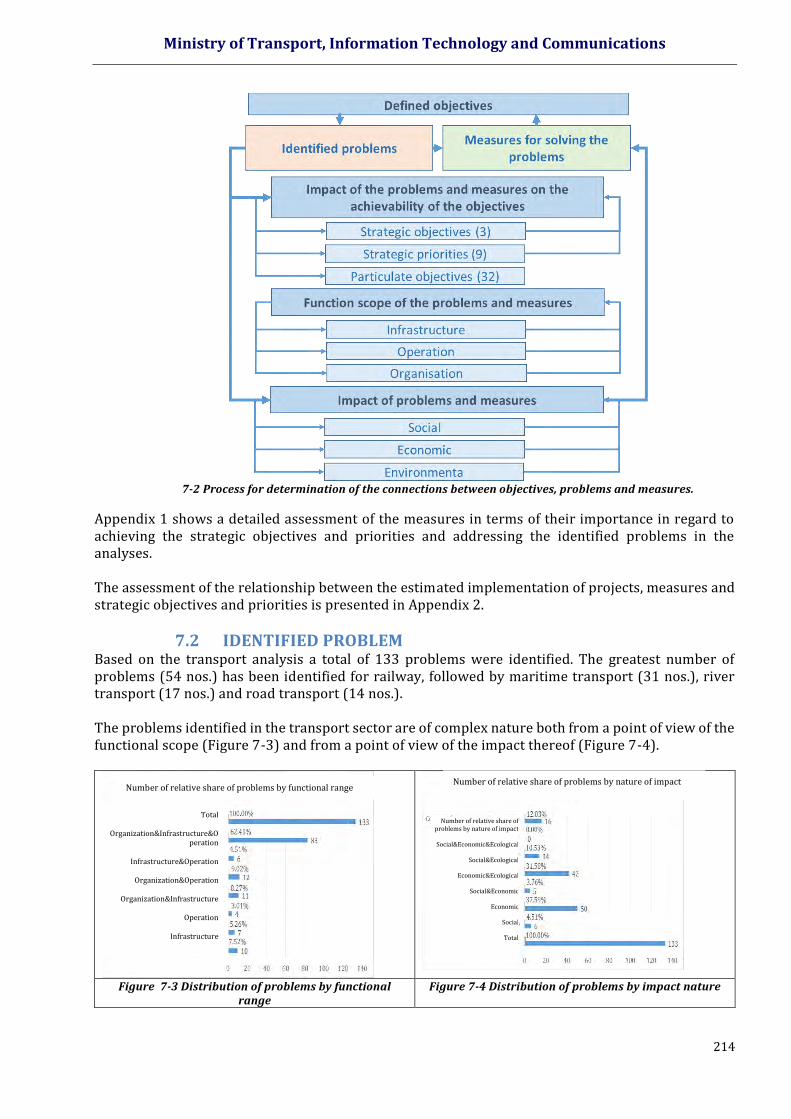
Ministry of Transport, Information Technology and Communications
214
7-2 Process for determination of the connections between objectives, problems and measures.
Appendix 1 shows a detailed assessment of the measures in terms of their importance in regard to achieving the strategic objectives and priorities and addressing the identified problems in the analyses. The assessment of the relationship between the estimated implementation of projects, measures and strategic objectives and priorities is presented in Appendix 2.
7.2 IDENTIFIED PROBLEM Based on the transport analysis a total of 133 problems were identified. The greatest number of problems (54 nos.) has been identified for railway, followed by maritime transport (31 nos.), river transport (17 nos.) and road transport (14 nos.). The problems identified in the transport sector are of complex nature both from a point of view of the functional scope (Figure 7-3) and from a point of view of the impact thereof (Figure 7-4).
Figure 7-3 Distribution of problems by functional range
Figure 7-4 Distribution of problems by impact nature
Total
Organization&Infrastructure&Operation
Infrastructure&Operation
Organization&Operation
Organization&Infrastructure
Operation
Infrastructure
Organization
Number of relative share of problems by nature of impact
Social&Economic&Ecological
Social&Ecological
Economic&Ecological
Social&Economic
Economic
Social
Total
Number of relative share of problems by functional range
Number of relative share of problems by nature of impact
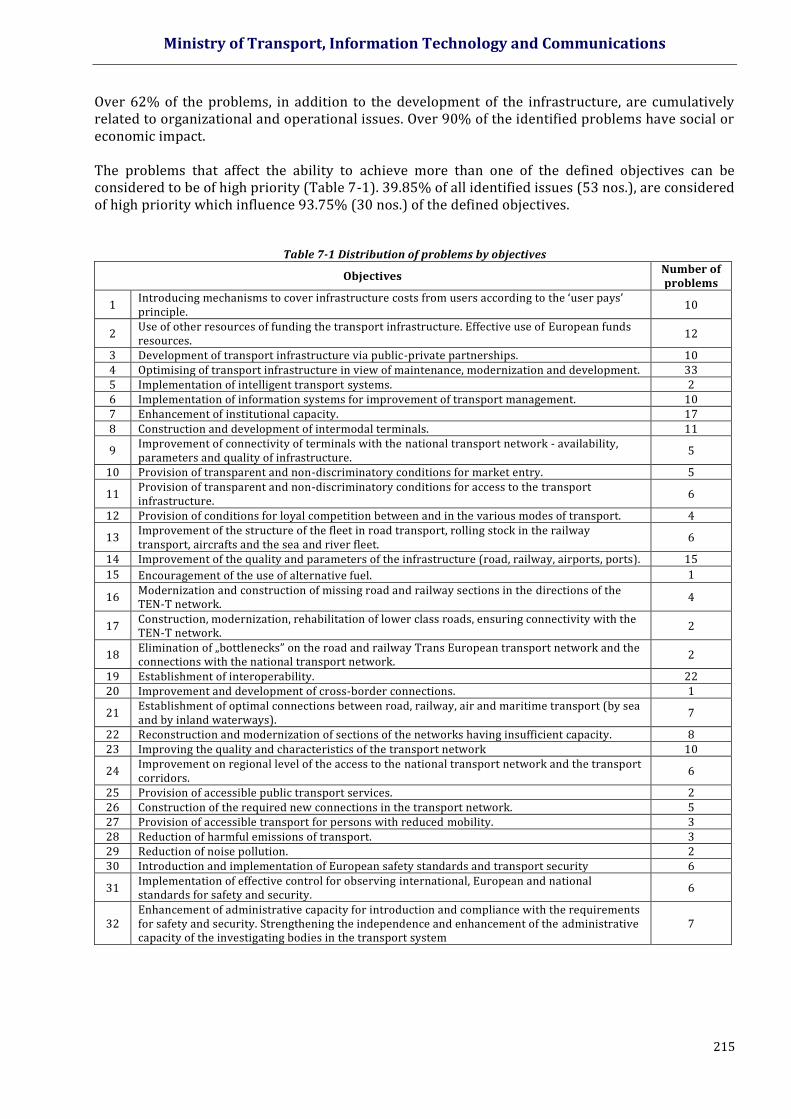
Ministry of Transport, Information Technology and Communications
215
Over 62% of the problems, in addition to the development of the infrastructure, are cumulatively related to organizational and operational issues. Over 90% of the identified problems have social or economic impact. The problems that affect the ability to achieve more than one of the defined objectives can be considered to be of high priority (Table 7-1). 39.85% of all identified issues (53 nos.), are considered of high priority which influence 93.75% (30 nos.) of the defined objectives.
Table 7-1 Distribution of problems by objectives
Objectives Number of problems
1 Introducing mechanisms to cover infrastructure costs from users according to the ‘user pays’ principle.
10
2 Use of other resources of funding the transport infrastructure. Effective use of European funds resources.
12
3 Development of transport infrastructure via public-private partnerships. 10 4 Optimising of transport infrastructure in view of maintenance, modernization and development. 33 5 Implementation of intelligent transport systems. 2 6 Implementation of information systems for improvement of transport management. 10 7 Enhancement of institutional capacity. 17 8 Construction and development of intermodal terminals. 11
9 Improvement of connectivity of terminals with the national transport network - availability, parameters and quality of infrastructure.
5
10 Provision of transparent and non-discriminatory conditions for market entry. 5
11 Provision of transparent and non-discriminatory conditions for access to the transport infrastructure.
6
12 Provision of conditions for loyal competition between and in the various modes of transport. 4
13 Improvement of the structure of the fleet in road transport, rolling stock in the railway transport, aircrafts and the sea and river fleet.
6
14 Improvement of the quality and parameters of the infrastructure (road, railway, airports, ports). 15
15 Encouragement of the use of alternative fuel. 1
16 Modernization and construction of missing road and railway sections in the directions of the ТEN-T network.
4
17 Construction, modernization, rehabilitation of lower class roads, ensuring connectivity with the TEN-T network.
2
18 Elimination of „bottlenecks” on the road and railway Trans European transport network and the connections with the national transport network.
2
19 Establishment of interoperability. 22 20 Improvement and development of cross-border connections. 1
21 Establishment of optimal connections between road, railway, air and maritime transport (by sea and by inland waterways).
7
22 Reconstruction and modernization of sections of the networks having insufficient capacity. 8 23 Improving the quality and characteristics of the transport network 10
24 Improvement on regional level of the access to the national transport network and the transport corridors.
6
25 Provision of accessible public transport services. 2 26 Construction of the required new connections in the transport network. 5 27 Provision of accessible transport for persons with reduced mobility. 3 28 Reduction of harmful emissions of transport. 3 29 Reduction of noise pollution. 2 30 Introduction and implementation of European safety standards and transport security 6
31 Implementation of effective control for observing international, European and national standards for safety and security.
6
32 Enhancement of administrative capacity for introduction and compliance with the requirements for safety and security. Strengthening the independence and enhancement of the administrative capacity of the investigating bodies in the transport system
7
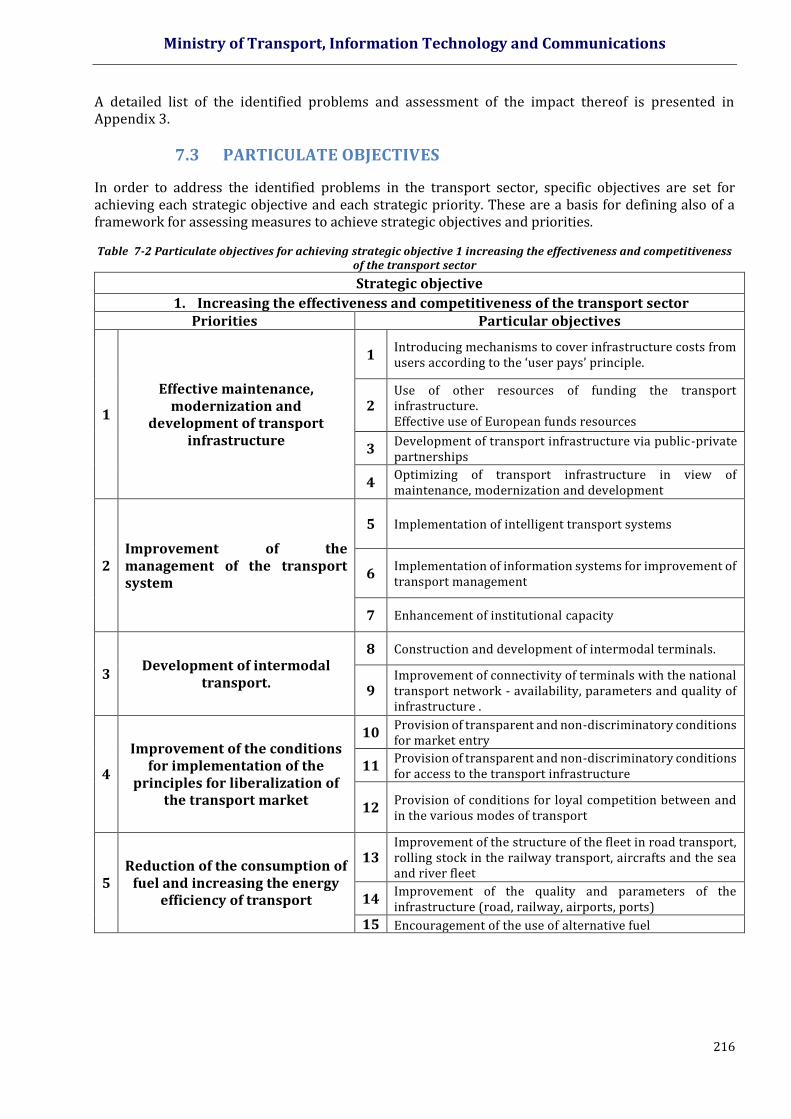
Ministry of Transport, Information Technology and Communications
216
A detailed list of the identified problems and assessment of the impact thereof is presented in Appendix 3.
7.3 PARTICULATE OBJECTIVES
In order to address the identified problems in the transport sector, specific objectives are set for achieving each strategic objective and each strategic priority. These are a basis for defining also of a framework for assessing measures to achieve strategic objectives and priorities.
Table 7-2 Particulate objectives for achieving strategic objective 1 increasing the effectiveness and competitiveness
of the transport sector
Strategic objective
1. Increasing the effectiveness and competitiveness of the transport sector Priorities Particular objectives
1
Effective maintenance, modernization and
development of transport infrastructure
1 Introducing mechanisms to cover infrastructure costs from users according to the ‘user pays’ principle.
2 Use of other resources of funding the transport infrastructure. Effective use of European funds resources
3 Development of transport infrastructure via public-private partnerships
4 Optimizing of transport infrastructure in view of maintenance, modernization and development
2 Improvement of the management of the transport system
5 Implementation of intelligent transport systems
6 Implementation of information systems for improvement of transport management
7 Enhancement of institutional capacity
3 Development of intermodal
transport.
8 Construction and development of intermodal terminals.
9 Improvement of connectivity of terminals with the national transport network - availability, parameters and quality of infrastructure .
4
Improvement of the conditions for implementation of the
principles for liberalization of the transport market
10 Provision of transparent and non-discriminatory conditions for market entry
11 Provision of transparent and non-discriminatory conditions for access to the transport infrastructure
12 Provision of conditions for loyal competition between and in the various modes of transport
5 Reduction of the consumption of
fuel and increasing the energy efficiency of transport
13 Improvement of the structure of the fleet in road transport, rolling stock in the railway transport, aircrafts and the sea and river fleet
14 Improvement of the quality and parameters of the infrastructure (road, railway, airports, ports)
15 Encouragement of the use of alternative fuel
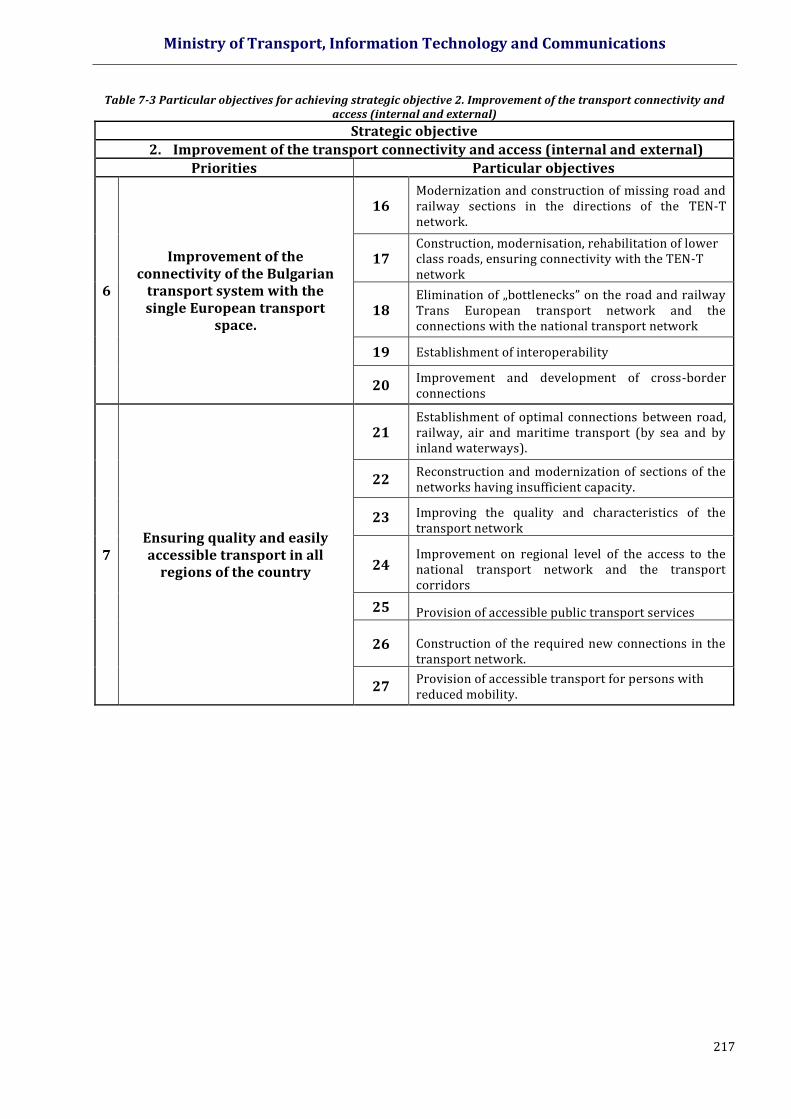
Ministry of Transport, Information Technology and Communications
217
Table 7-3 Particular objectives for achieving strategic objective 2. Improvement of the transport connectivity and access (internal and external)
Strategic objective
2. Improvement of the transport connectivity and access (internal and external)
Priorities Particular objectives
6
Improvement of the connectivity of the Bulgarian
transport system with the single European transport
space.
16 Modernization and construction of missing road and railway sections in the directions of the ТEN-T network.
17 Construction, modernisation, rehabilitation of lower class roads, ensuring connectivity with the TEN-T network
18 Elimination of „bottlenecks” on the road and railway Trans European transport network and the connections with the national transport network
19 Establishment of interoperability
20 Improvement and development of cross-border connections
7 Ensuring quality and easily accessible transport in all
regions of the country
21 Establishment of optimal connections between road, railway, air and maritime transport (by sea and by inland waterways).
22 Reconstruction and modernization of sections of the networks having insufficient capacity.
23 Improving the quality and characteristics of the transport network
24 Improvement on regional level of the access to the national transport network and the transport corridors
25 Provision of accessible public transport services
26 Construction of the required new connections in the transport network.
27 Provision of accessible transport for persons with reduced mobility.
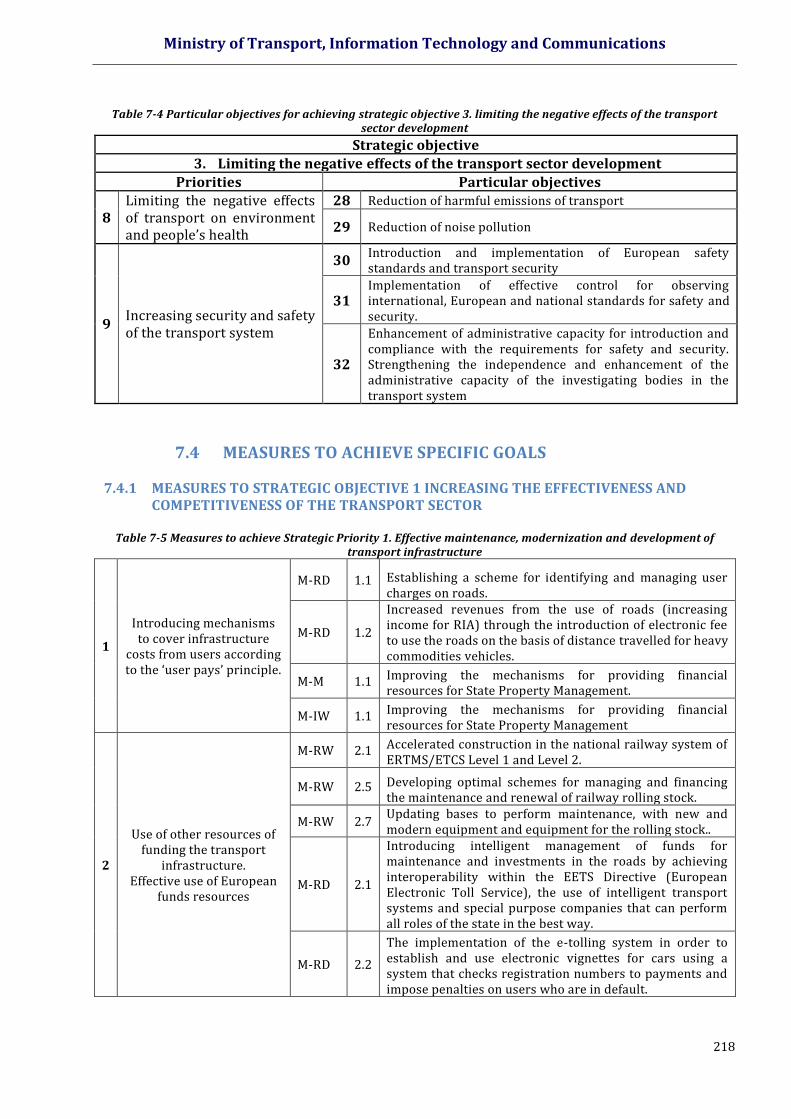
Ministry of Transport, Information Technology and Communications
218
Table 7-4 Particular objectives for achieving strategic objective 3. limiting the negative effects of the transport
sector development
Strategic objective
3. Limiting the negative effects of the transport sector development
Priorities Particular objectives
8 Limiting the negative effects of transport on environment and people’s health
28 Reduction of harmful emissions of transport
29 Reduction of noise pollution
9 Increasing security and safety of the transport system
30 Introduction and implementation of European safety standards and transport security
31 Implementation of effective control for observing international, European and national standards for safety and security.
32
Enhancement of administrative capacity for introduction and compliance with the requirements for safety and security. Strengthening the independence and enhancement of the administrative capacity of the investigating bodies in the transport system
7.4 MEASURES TO ACHIEVE SPECIFIC GOALS
7.4.1 MEASURES TO STRATEGIC OBJECTIVE 1 INCREASING THE EFFECTIVENESS AND
COMPETITIVENESS OF THE TRANSPORT SECTOR
Table 7-5 Measures to achieve Strategic Priority 1. Effective maintenance, modernization and development of transport infrastructure
1
Introducing mechanisms to cover infrastructure
costs from users according to the ‘user pays’ principle.
М-RD 1.1 Establishing a scheme for identifying and managing user charges on roads.
М-RD 1.2
Increased revenues from the use of roads (increasing income for RIA) through the introduction of electronic fee to use the roads on the basis of distance travelled for heavy commodities vehicles.
М-М 1.1 Improving the mechanisms for providing financial resources for State Property Management.
М-IW 1.1 Improving the mechanisms for providing financial resources for State Property Management
2
Use of other resources of funding the transport
infrastructure. Effective use of European
funds resources
М-RW 2.1 Accelerated construction in the national railway system of ERTMS/ETCS Level 1 and Level 2.
М-RW 2.5 Developing optimal schemes for managing and financing the maintenance and renewal of railway rolling stock.
М-RW 2.7 Updating bases to perform maintenance, with new and modern equipment and equipment for the rolling stock..
М-RD 2.1
Introducing intelligent management of funds for maintenance and investments in the roads by achieving interoperability within the EETS Directive (European Electronic Toll Service), the use of intelligent transport systems and special purpose companies that can perform all roles of the state in the best way.
М-RD 2.2
The implementation of the e-tolling system in order to establish and use electronic vignettes for cars using a system that checks registration numbers to payments and impose penalties on users who are in default.
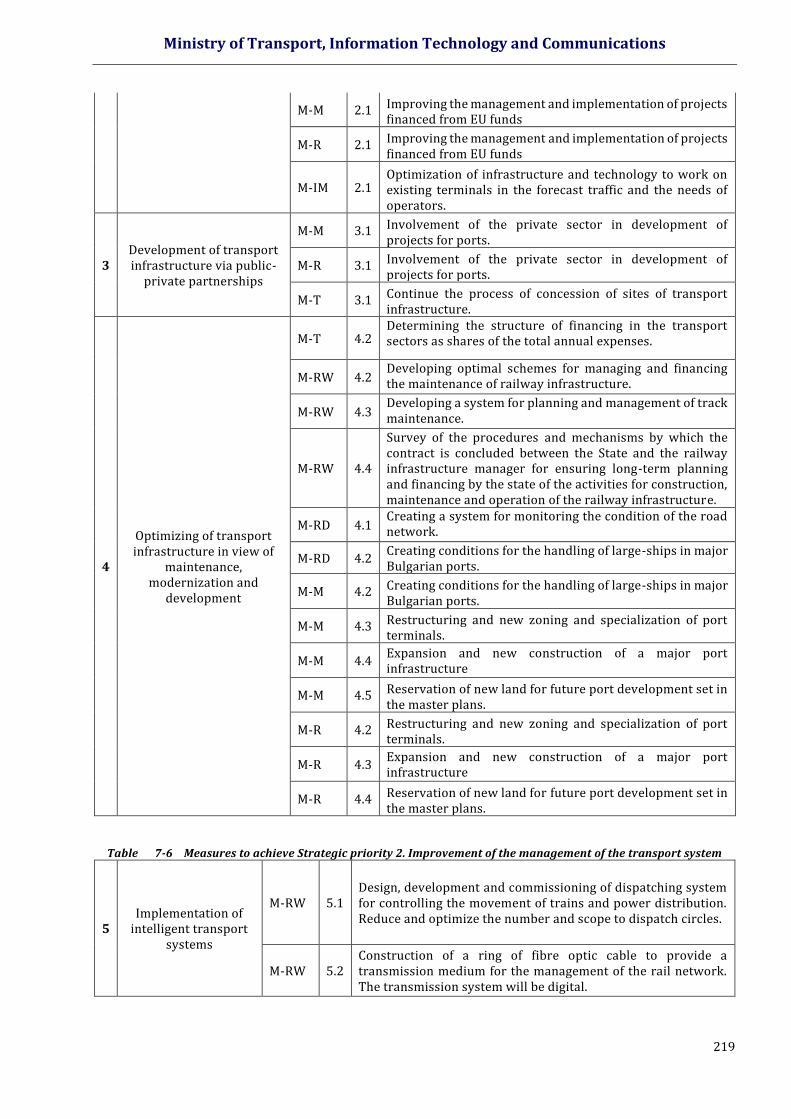
Ministry of Transport, Information Technology and Communications
219
М-М 2.1 Improving the management and implementation of projects financed from EU funds
М-R 2.1 Improving the management and implementation of projects financed from EU funds
М-IM 2.1 Optimization of infrastructure and technology to work on existing terminals in the forecast traffic and the needs of operators.
3 Development of transport infrastructure via public-
private partnerships
М-М 3.1 Involvement of the private sector in development of projects for ports.
М-R 3.1 Involvement of the private sector in development of projects for ports.
М-Т 3.1 Continue the process of concession of sites of transport infrastructure.
4
Optimizing of transport infrastructure in view of
maintenance, modernization and
development
М-Т 4.2 Determining the structure of financing in the transport sectors as shares of the total annual expenses.
М-RW 4.2 Developing optimal schemes for managing and financing the maintenance of railway infrastructure.
М-RW 4.3 Developing a system for planning and management of track maintenance.
М-RW 4.4
Survey of the procedures and mechanisms by which the contract is concluded between the State and the railway infrastructure manager for ensuring long-term planning and financing by the state of the activities for construction, maintenance and operation of the railway infrastructure.
М-RD 4.1 Creating a system for monitoring the condition of the road network.
М-RD 4.2 Creating conditions for the handling of large-ships in major Bulgarian ports.
М-М 4.2 Creating conditions for the handling of large-ships in major Bulgarian ports.
М-М 4.3 Restructuring and new zoning and specialization of port terminals.
М-М 4.4 Expansion and new construction of a major port infrastructure
М-М 4.5 Reservation of new land for future port development set in the master plans.
М-R 4.2 Restructuring and new zoning and specialization of port terminals.
М-R 4.3 Expansion and new construction of a major port infrastructure
М-R 4.4 Reservation of new land for future port development set in the master plans.
Table 7-6 Measures to achieve Strategic priority 2. Improvement of the management of the transport system
5 Implementation of
intelligent transport systems
M-RW 5.1 Design, development and commissioning of dispatching system for controlling the movement of trains and power distribution. Reduce and optimize the number and scope to dispatch circles.
M-RW 5.2 Construction of a ring of fibre optic cable to provide a transmission medium for the management of the rail network. The transmission system will be digital.
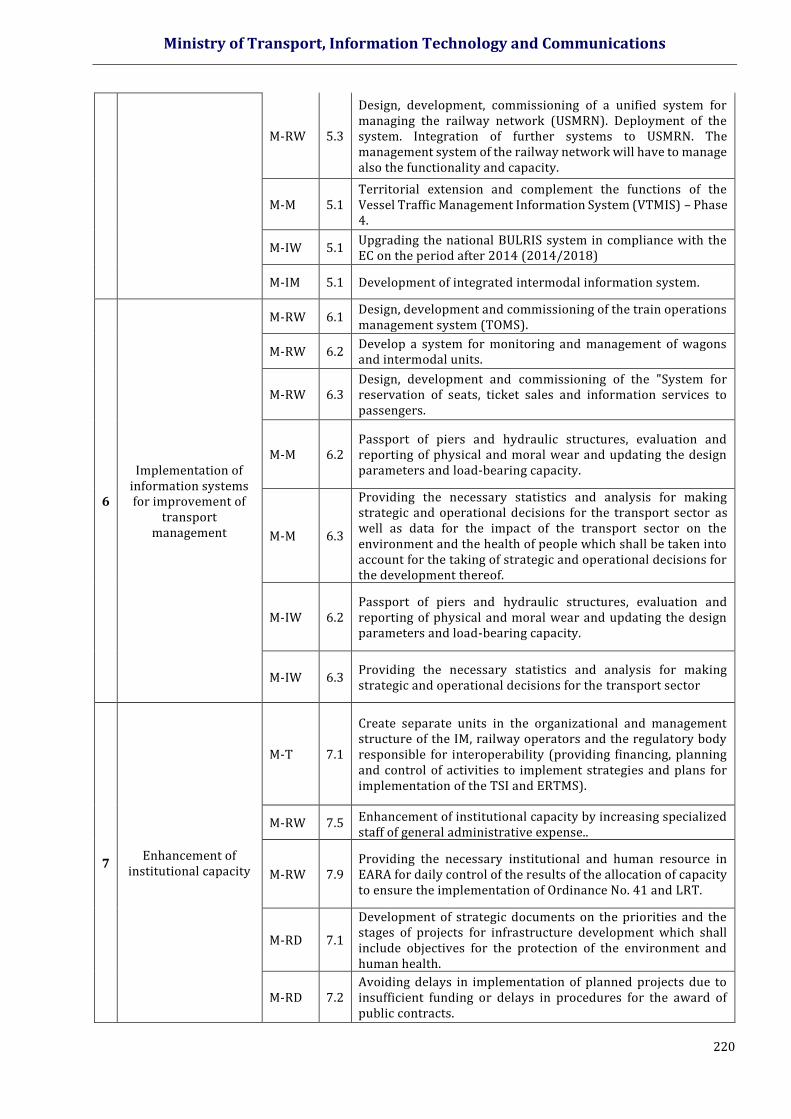
Ministry of Transport, Information Technology and Communications
220
M-RW 5.3
Design, development, commissioning of a unified system for managing the railway network (USMRN). Deployment of the system. Integration of further systems to USMRN. The management system of the railway network will have to manage also the functionality and capacity.
M-M 5.1 Territorial extension and complement the functions of the Vessel Traffic Management Information System (VTMIS) – Phase 4.
M-IW 5.1 Upgrading the national BULRIS system in compliance with the EC on the period after 2014 (2014/2018)
M-IM 5.1 Development of integrated intermodal information system.
6
Implementation of information systems for improvement of
transport management
M-RW 6.1 Design, development and commissioning of the train operations management system (TOMS).
M-RW 6.2 Develop a system for monitoring and management of wagons and intermodal units.
M-RW 6.3 Design, development and commissioning of the "System for reservation of seats, ticket sales and information services to passengers.
M-M 6.2 Passport of piers and hydraulic structures, evaluation and reporting of physical and moral wear and updating the design parameters and load-bearing capacity.
M-M 6.3
Providing the necessary statistics and analysis for making strategic and operational decisions for the transport sector as well as data for the impact of the transport sector on the environment and the health of people which shall be taken into account for the taking of strategic and operational decisions for the development thereof.
M-IW 6.2 Passport of piers and hydraulic structures, evaluation and reporting of physical and moral wear and updating the design parameters and load-bearing capacity.
M-IW 6.3 Providing the necessary statistics and analysis for making strategic and operational decisions for the transport sector
7 Enhancement of
institutional capacity
М-Т 7.1
Create separate units in the organizational and management structure of the IM, railway operators and the regulatory body responsible for interoperability (providing financing, planning and control of activities to implement strategies and plans for implementation of the TSI and ERTMS).
М-RW 7.5 Enhancement of institutional capacity by increasing specialized staff of general administrative expense..
M-RW 7.9 Providing the necessary institutional and human resource in EARA for daily control of the results of the allocation of capacity to ensure the implementation of Ordinance No. 41 and LRT.
M-RD 7.1
Development of strategic documents on the priorities and the stages of projects for infrastructure development which shall include objectives for the protection of the environment and human health.
M-RD 7.2 Avoiding delays in implementation of planned projects due to insufficient funding or delays in procedures for the award of public contracts.

Ministry of Transport, Information Technology and Communications
221
M-RD 7.3
Implementation of a package of measures to increase the capacity of RIA as an end/a specific beneficiary under OP Transport 2007-2013, 2014-2020 OPTTI and the Connecting Europe Mechanism.
M-RD 7.4
Development and implementation of internal agenda in RIA in order to ensure institutional continuity for effective administration of projects and contracts in CCD of OPTTI transferred from NCSIP.
M-RD 7.5 Review of academic and professional qualifications and the role of research institutes in order to enhance administrative capacity
M-M 7.1 Amendments to existing legislation to simplify the regime for the development and construction of new ports and port terminals in the aquatic environment.
M-IW 7.1 Amendments to existing legislation to simplify the regime for the development and construction of new ports and port terminals in the aquatic environment.
M-IM 7.1 Create an administrative structure to MTITC and legislation for the management, organization and coordination of multimodal transport.
Table 7-7 Measures to achieve Strategic priority 3. Development of intermodal transport.
8 Construction and development of
intermodal terminals.
M-RW 8.1
Construction of intermodal terminals by NRIC, managed by intermodal operators. Use of public-private partnership and providing them a concession.
M-M 8.1 Implementation of projects for intermodal terminals that connect the ports to the railway network.
M-M 8.2 Development of logistics infrastructure
M-IW 8.1 Implementation of projects for intermodal terminals that connect the ports to the railway network.
M-IW 8.2 Development of logistics infrastructure
M-IM 8.1 Creating an appropriate legal basis for regulating the interaction between transport modes and participants of the transport market.
M-IM 8.2 Specialization and/or completion of the terminals in the direction of European transport corridors and construct new ones.
M-IM 8.3 Examining the need to increase the capacity of existing terminals.
9
Improvement of connectivity of terminals with the national
transport network - availability, parameters and quality of
infrastructure .
M-RW 9.1 Assisting the recovery of unsupported and construction of new industrial branches. Use of public-private partnership for this purpose.
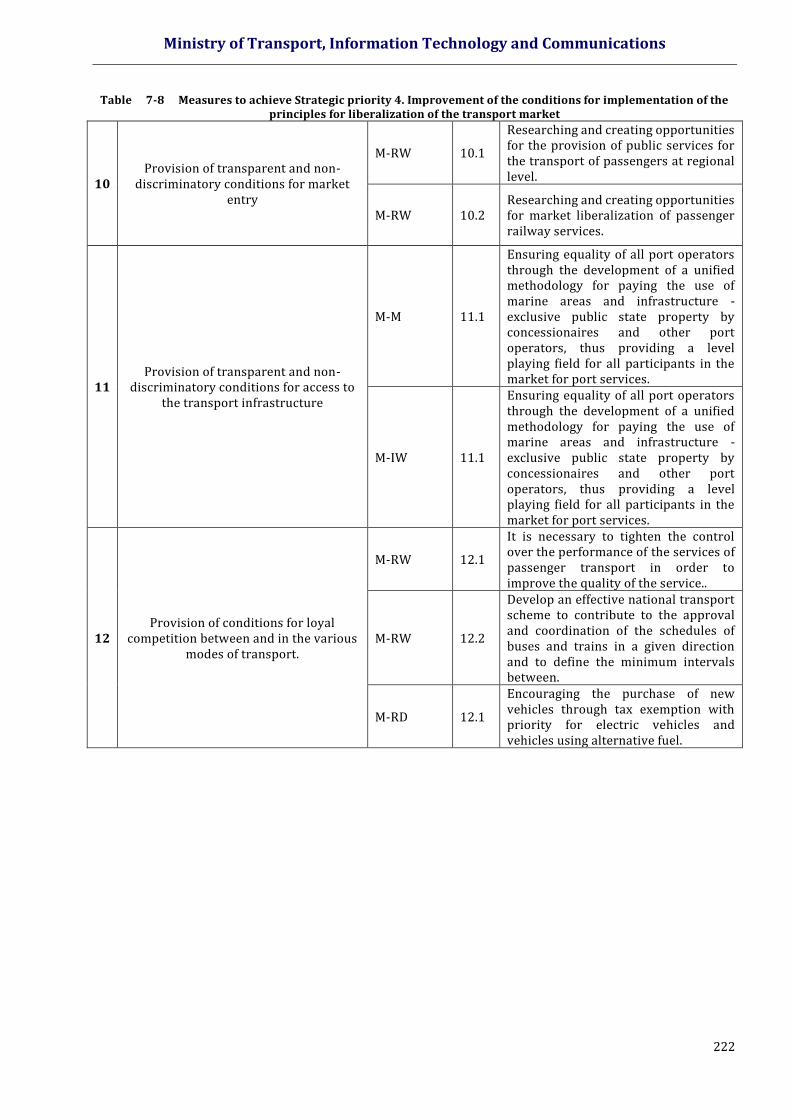
Ministry of Transport, Information Technology and Communications
222
Table 7-8 Measures to achieve Strategic priority 4. Improvement of the conditions for implementation of the principles for liberalization of the transport market
10 Provision of transparent and non-
discriminatory conditions for market entry
M-RW 10.1
Researching and creating opportunities for the provision of public services for the transport of passengers at regional level.
M-RW 10.2 Researching and creating opportunities for market liberalization of passenger railway services.
11 Provision of transparent and non-
discriminatory conditions for access to the transport infrastructure
M-M 11.1
Ensuring equality of all port operators through the development of a unified methodology for paying the use of marine areas and infrastructure - exclusive public state property by concessionaires and other port operators, thus providing a level playing field for all participants in the market for port services.
M-IW 11.1
Ensuring equality of all port operators through the development of a unified methodology for paying the use of marine areas and infrastructure - exclusive public state property by concessionaires and other port operators, thus providing a level playing field for all participants in the market for port services.
12 Provision of conditions for loyal
competition between and in the various modes of transport.
M-RW 12.1
It is necessary to tighten the control over the performance of the services of passenger transport in order to improve the quality of the service..
M-RW 12.2
Develop an effective national transport scheme to contribute to the approval and coordination of the schedules of buses and trains in a given direction and to define the minimum intervals between.
M-RD 12.1
Encouraging the purchase of new vehicles through tax exemption with priority for electric vehicles and vehicles using alternative fuel.
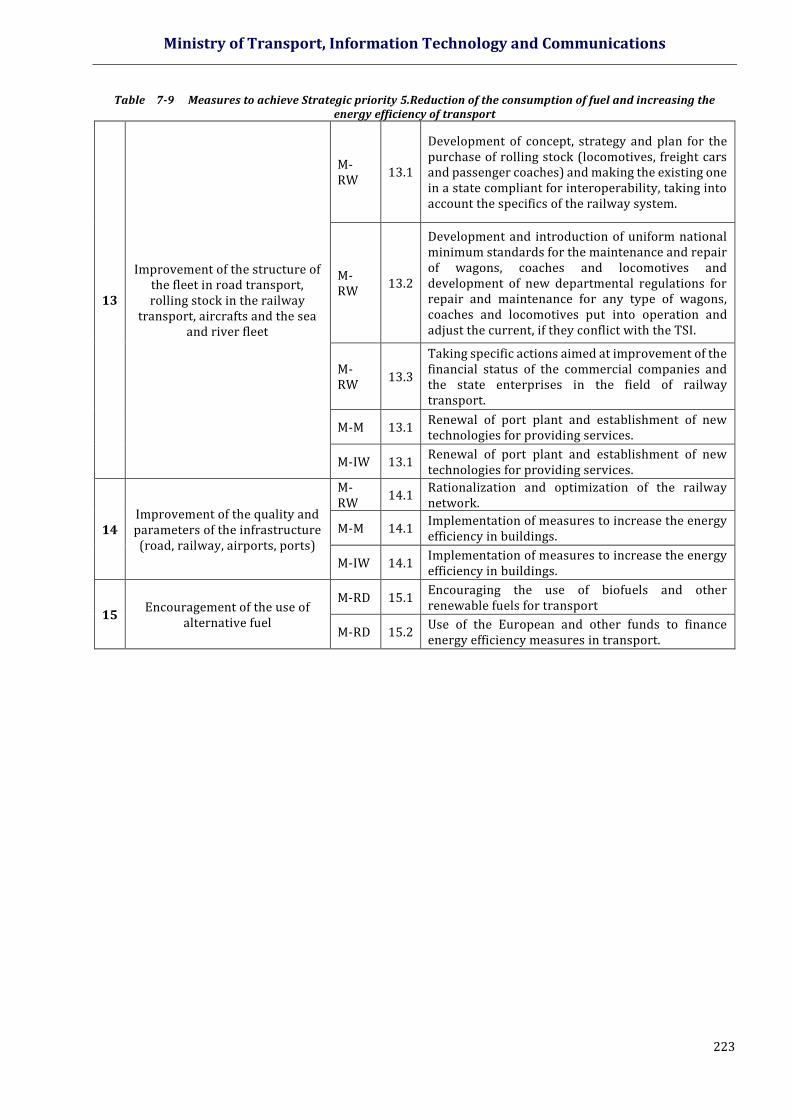
Ministry of Transport, Information Technology and Communications
223
Table 7-9 Measures to achieve Strategic priority 5.Reduction of the consumption of fuel and increasing the energy efficiency of transport
13
Improvement of the structure of the fleet in road transport, rolling stock in the railway
transport, aircrafts and the sea and river fleet
M-RW
13.1
Development of concept, strategy and plan for the purchase of rolling stock (locomotives, freight cars and passenger coaches) and making the existing one in a state compliant for interoperability, taking into account the specifics of the railway system.
M-RW
13.2
Development and introduction of uniform national minimum standards for the maintenance and repair of wagons, coaches and locomotives and development of new departmental regulations for repair and maintenance for any type of wagons, coaches and locomotives put into operation and adjust the current, if they conflict with the TSI.
M-RW
13.3
Taking specific actions aimed at improvement of the financial status of the commercial companies and the state enterprises in the field of railway transport.
M-M 13.1 Renewal of port plant and establishment of new technologies for providing services.
M-IW 13.1 Renewal of port plant and establishment of new technologies for providing services.
14 Improvement of the quality and parameters of the infrastructure (road, railway, airports, ports)
M-RW
14.1 Rationalization and optimization of the railway network.
M-M 14.1 Implementation of measures to increase the energy efficiency in buildings.
M-IW 14.1 Implementation of measures to increase the energy efficiency in buildings.
15 Encouragement of the use of
alternative fuel
M-RD 15.1 Encouraging the use of biofuels and other renewable fuels for transport
M-RD 15.2 Use of the European and other funds to finance energy efficiency measures in transport.
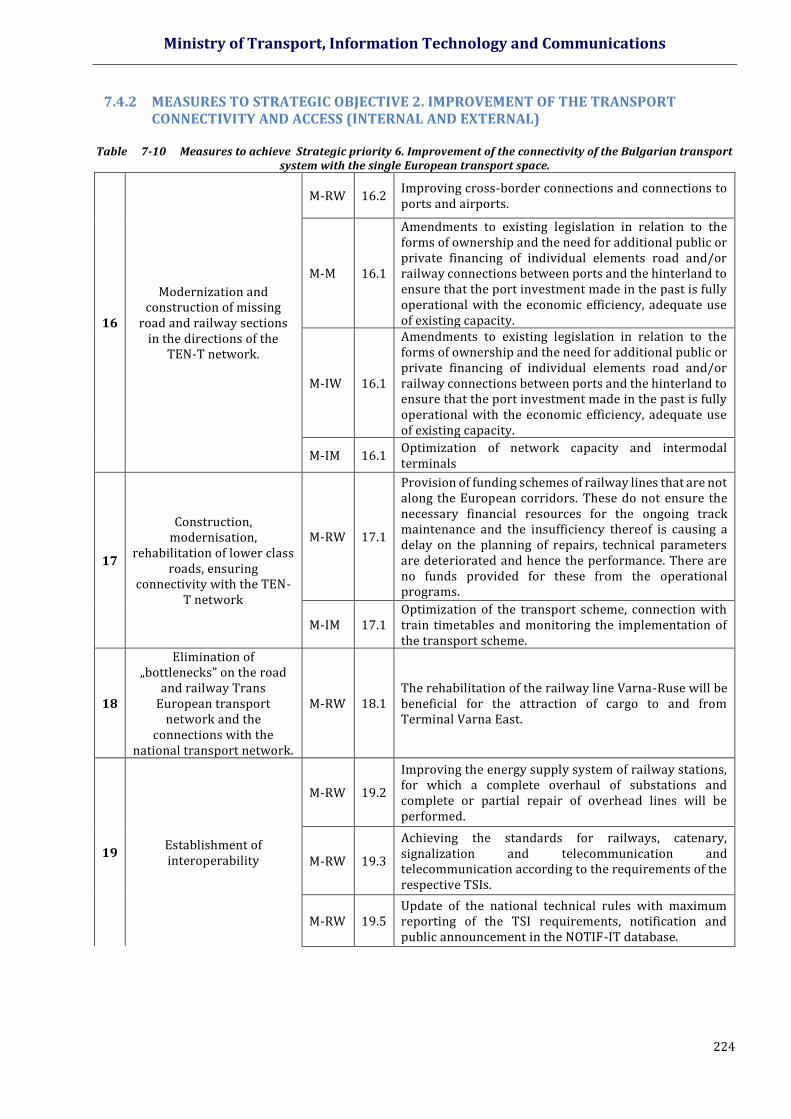
Ministry of Transport, Information Technology and Communications
224
7.4.2 MEASURES TO STRATEGIC OBJECTIVE 2. IMPROVEMENT OF THE TRANSPORT CONNECTIVITY AND ACCESS (INTERNAL AND EXTERNAL)
Table 7-10 Measures to achieve Strategic priority 6. Improvement of the connectivity of the Bulgarian transport
system with the single European transport space.
16
Modernization and construction of missing
road and railway sections in the directions of the
ТEN-T network.
M-RW 16.2 Improving cross-border connections and connections to ports and airports.
M-M 16.1
Amendments to existing legislation in relation to the forms of ownership and the need for additional public or private financing of individual elements road and/or railway connections between ports and the hinterland to ensure that the port investment made in the past is fully operational with the economic efficiency, adequate use of existing capacity.
M-IW 16.1
Amendments to existing legislation in relation to the forms of ownership and the need for additional public or private financing of individual elements road and/or railway connections between ports and the hinterland to ensure that the port investment made in the past is fully operational with the economic efficiency, adequate use of existing capacity.
M-IM 16.1 Optimization of network capacity and intermodal terminals
17
Construction, modernisation,
rehabilitation of lower class roads, ensuring
connectivity with the TEN-T network
M-RW 17.1
Provision of funding schemes of railway lines that are not along the European corridors. These do not ensure the necessary financial resources for the ongoing track maintenance and the insufficiency thereof is causing a delay on the planning of repairs, technical parameters are deteriorated and hence the performance. There are no funds provided for these from the operational programs.
M-IM 17.1 Optimization of the transport scheme, connection with train timetables and monitoring the implementation of the transport scheme.
18
Elimination of „bottlenecks” on the road
and railway Trans European transport
network and the connections with the
national transport network.
M-RW 18.1 The rehabilitation of the railway line Varna-Ruse will be beneficial for the attraction of cargo to and from Terminal Varna East.
19 Establishment of interoperability
M-RW 19.2
Improving the energy supply system of railway stations, for which a complete overhaul of substations and complete or partial repair of overhead lines will be performed.
M-RW 19.3
Achieving the standards for railways, catenary, signalization and telecommunication and telecommunication according to the requirements of the respective TSIs.
M-RW 19.5 Update of the national technical rules with maximum reporting of the TSI requirements, notification and public announcement in the NOTIF-IT database.
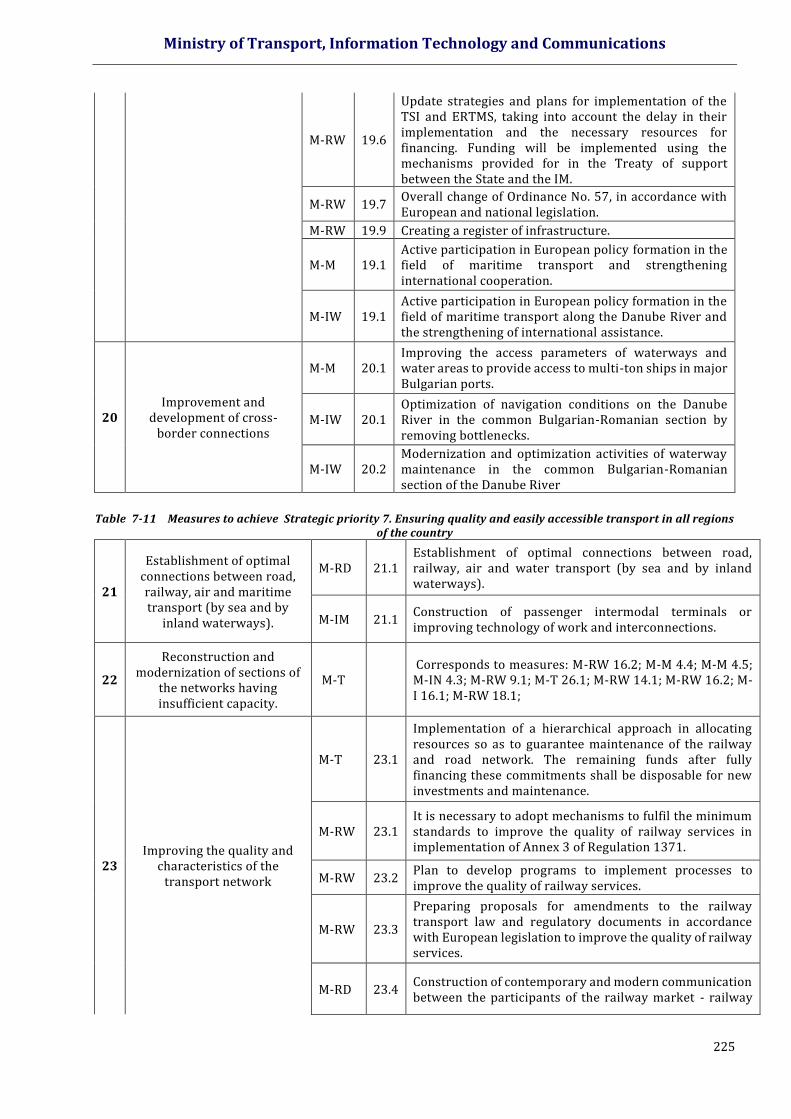
Ministry of Transport, Information Technology and Communications
225
M-RW 19.6
Update strategies and plans for implementation of the TSI and ERTMS, taking into account the delay in their implementation and the necessary resources for financing. Funding will be implemented using the mechanisms provided for in the Treaty of support between the State and the IM.
M-RW 19.7 Overall change of Ordinance No. 57, in accordance with European and national legislation.
M-RW 19.9 Creating a register of infrastructure.
M-M 19.1 Active participation in European policy formation in the field of maritime transport and strengthening international cooperation.
M-IW 19.1 Active participation in European policy formation in the field of maritime transport along the Danube River and the strengthening of international assistance.
20 Improvement and
development of cross-border connections
M-M 20.1 Improving the access parameters of waterways and water areas to provide access to multi-ton ships in major Bulgarian ports.
M-IW 20.1 Optimization of navigation conditions on the Danube River in the common Bulgarian-Romanian section by removing bottlenecks.
M-IW 20.2 Modernization and optimization activities of waterway maintenance in the common Bulgarian-Romanian section of the Danube River
Table 7-11 Measures to achieve Strategic priority 7. Ensuring quality and easily accessible transport in all regions
of the country
21
Establishment of optimal connections between road, railway, air and maritime transport (by sea and by
inland waterways).
M-RD 21.1 Establishment of optimal connections between road, railway, air and water transport (by sea and by inland waterways).
M-IM 21.1 Construction of passenger intermodal terminals or improving technology of work and interconnections.
22
Reconstruction and modernization of sections of
the networks having insufficient capacity.
М-Т Corresponds to measures: М-RW 16.2; М-М 4.4; М-М 4.5; М-IN 4.3; М-RW 9.1; М-Т 26.1; М-RW 14.1; М-RW 16.2; М-I 16.1; М-RW 18.1;
23 Improving the quality and
characteristics of the transport network
М-Т 23.1
Implementation of a hierarchical approach in allocating resources so as to guarantee maintenance of the railway and road network. The remaining funds after fully financing these commitments shall be disposable for new investments and maintenance.
M-RW 23.1 It is necessary to adopt mechanisms to fulfil the minimum standards to improve the quality of railway services in implementation of Annex 3 of Regulation 1371.
M-RW 23.2 Plan to develop programs to implement processes to improve the quality of railway services.
M-RW 23.3
Preparing proposals for amendments to the railway transport law and regulatory documents in accordance with European legislation to improve the quality of railway services.
M-RD 23.4 Construction of contemporary and modern communication between the participants of the railway market - railway
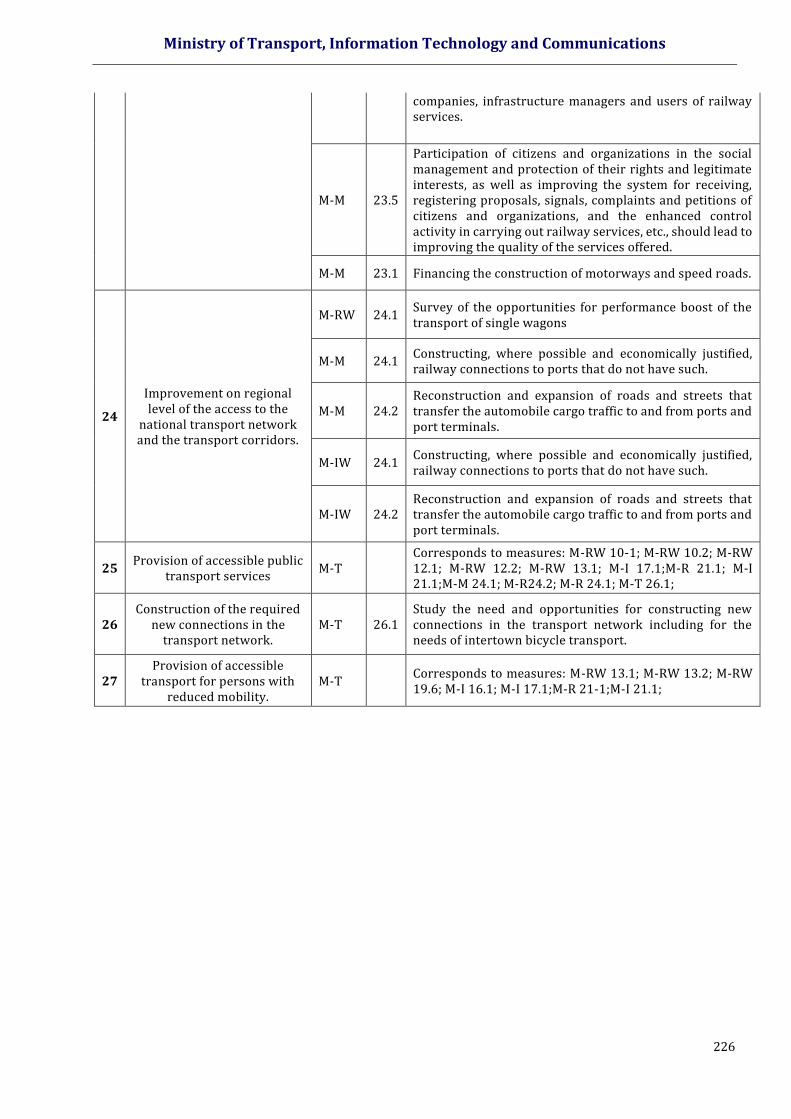
Ministry of Transport, Information Technology and Communications
226
companies, infrastructure managers and users of railway services.
M-M 23.5
Participation of citizens and organizations in the social management and protection of their rights and legitimate interests, as well as improving the system for receiving, registering proposals, signals, complaints and petitions of citizens and organizations, and the enhanced control activity in carrying out railway services, etc., should lead to improving the quality of the services offered.
M-M 23.1 Financing the construction of motorways and speed roads.
24
Improvement on regional level of the access to the
national transport network and the transport corridors.
M-RW 24.1 Survey of the opportunities for performance boost of the transport of single wagons
M-M 24.1 Constructing, where possible and economically justified, railway connections to ports that do not have such.
M-M 24.2 Reconstruction and expansion of roads and streets that transfer the automobile cargo traffic to and from ports and port terminals.
M-IW 24.1 Constructing, where possible and economically justified, railway connections to ports that do not have such.
M-IW 24.2 Reconstruction and expansion of roads and streets that transfer the automobile cargo traffic to and from ports and port terminals.
25 Provision of accessible public
transport services М-Т
Corresponds to measures: М-RW 10-1; М-RW 10.2; М-RW 12.1; М-RW 12.2; М-RW 13.1; М-I 17.1;М-R 21.1; М-I 21.1;М-М 24.1; М-R24.2; М-R 24.1; М-Т 26.1;
26 Construction of the required
new connections in the transport network.
М-Т 26.1 Study the need and opportunities for constructing new connections in the transport network including for the needs of intertown bicycle transport.
27 Provision of accessible
transport for persons with reduced mobility.
М-Т Corresponds to measures: М-RW 13.1; М-RW 13.2; М-RW 19.6; М-I 16.1; М-I 17.1;М-R 21-1;М-I 21.1;
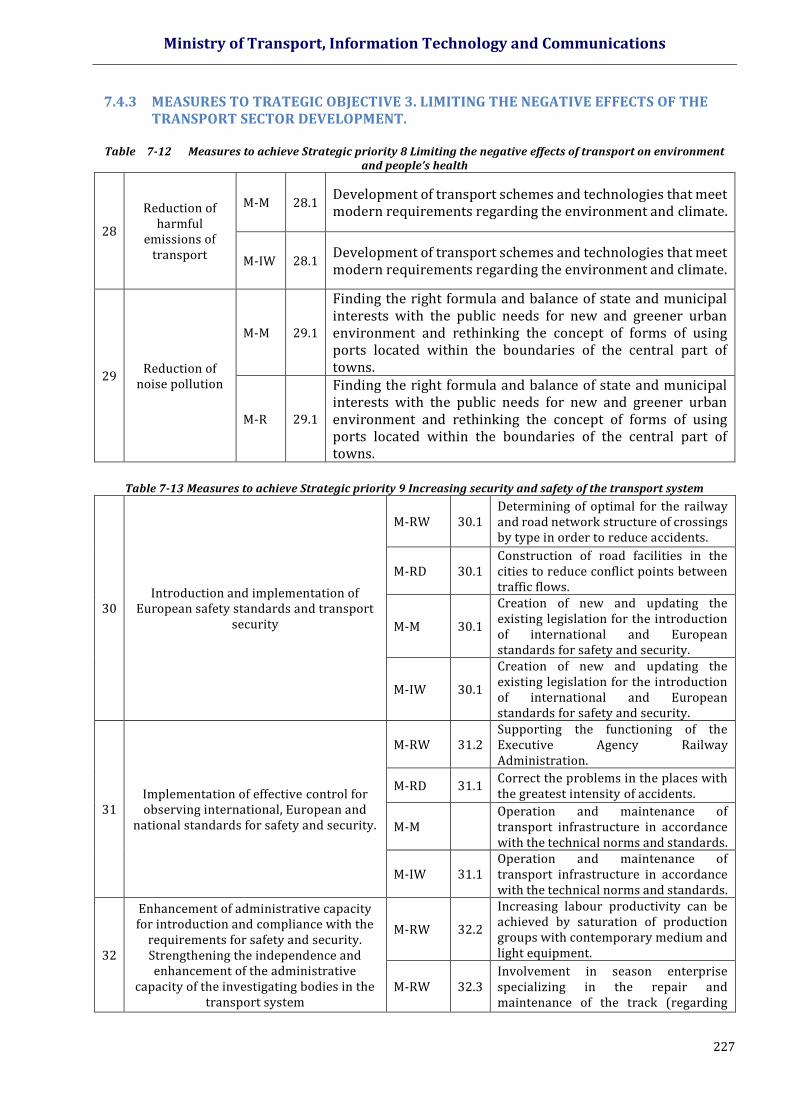
Ministry of Transport, Information Technology and Communications
227
7.4.3 MEASURES TO TRATEGIC OBJECTIVE 3. LIMITING THE NEGATIVE EFFECTS OF THE TRANSPORT SECTOR DEVELOPMENT.
Table 7-12 Measures to achieve Strategic priority 8 Limiting the negative effects of transport on environment
and people’s health
28
Reduction of harmful
emissions of transport
М-М 28.1 Development of transport schemes and technologies that meet modern requirements regarding the environment and climate.
М-IW 28.1 Development of transport schemes and technologies that meet modern requirements regarding the environment and climate.
29 Reduction of
noise pollution
М-М 29.1
Finding the right formula and balance of state and municipal interests with the public needs for new and greener urban environment and rethinking the concept of forms of using ports located within the boundaries of the central part of towns.
М-R 29.1
Finding the right formula and balance of state and municipal interests with the public needs for new and greener urban environment and rethinking the concept of forms of using ports located within the boundaries of the central part of towns.
Table 7-13 Measures to achieve Strategic priority 9 Increasing security and safety of the transport system
30 Introduction and implementation of
European safety standards and transport security
M-RW 30.1 Determining of optimal for the railway and road network structure of crossings by type in order to reduce accidents.
M-RD 30.1 Construction of road facilities in the cities to reduce conflict points between traffic flows.
M-M 30.1
Creation of new and updating the existing legislation for the introduction of international and European standards for safety and security.
M-IW 30.1
Creation of new and updating the existing legislation for the introduction of international and European standards for safety and security.
31 Implementation of effective control for observing international, European and
national standards for safety and security.
M-RW 31.2 Supporting the functioning of the Executive Agency Railway Administration.
M-RD 31.1 Correct the problems in the places with the greatest intensity of accidents.
M-M Operation and maintenance of transport infrastructure in accordance with the technical norms and standards.
M-IW 31.1 Operation and maintenance of transport infrastructure in accordance with the technical norms and standards.
32
Enhancement of administrative capacity for introduction and compliance with the
requirements for safety and security. Strengthening the independence and enhancement of the administrative
capacity of the investigating bodies in the transport system
M-RW 32.2
Increasing labour productivity can be achieved by saturation of production groups with contemporary medium and light equipment.
M-RW 32.3 Involvement in season enterprise specializing in the repair and maintenance of the track (regarding
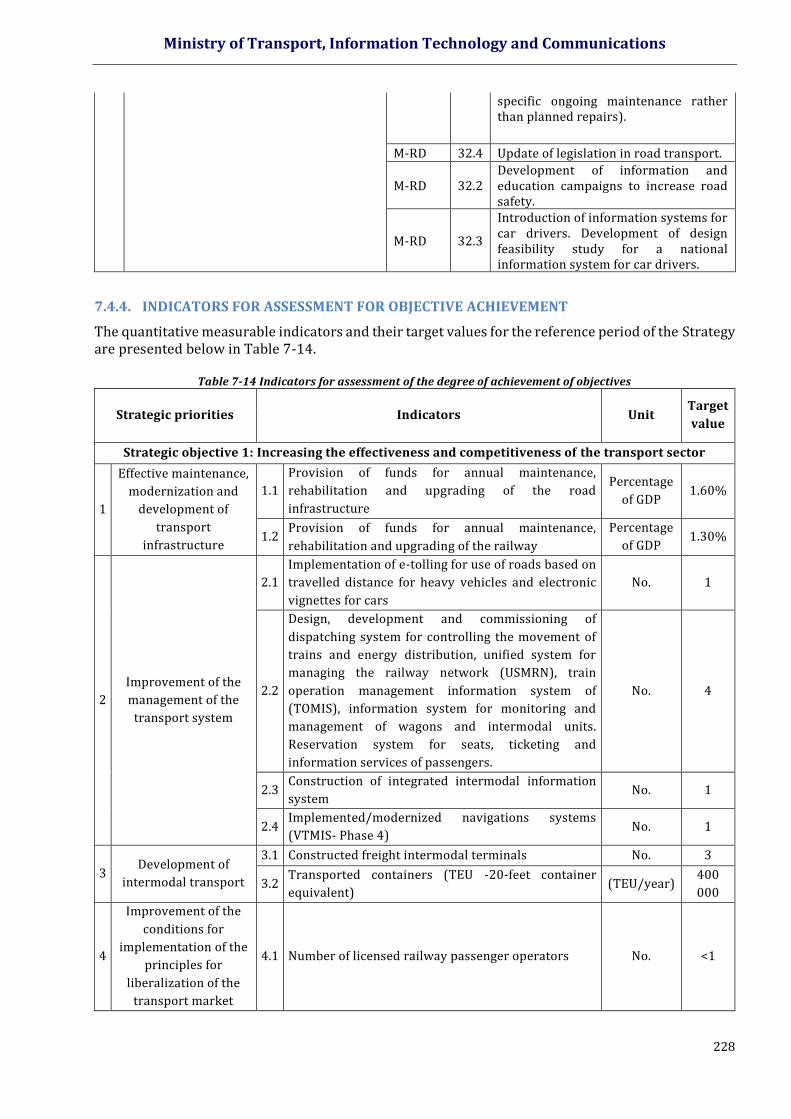
Ministry of Transport, Information Technology and Communications
228
specific ongoing maintenance rather than planned repairs).
M-RD 32.4 Update of legislation in road transport.
M-RD 32.2 Development of information and education campaigns to increase road safety.
M-RD 32.3
Introduction of information systems for car drivers. Development of design feasibility study for a national information system for car drivers.
7.4.4. INDICATORS FOR ASSESSMENT FOR OBJECTIVE ACHIEVEMENT
The quantitative measurable indicators and their target values for the reference period of the Strategy are presented below in Table 7-14.
Table 7-14 Indicators for assessment of the degree of achievement of objectives
Strategic priorities Indicators Unit Target
value
Strategic objective 1: Increasing the effectiveness and competitiveness of the transport sector
1
Effective maintenance,
modernization and
development of
transport
infrastructure
1.1
Provision of funds for annual maintenance,
rehabilitation and upgrading of the road
infrastructure
Percentage
of GDP 1.60%
1.2 Provision of funds for annual maintenance,
rehabilitation and upgrading of the railway
Percentage
of GDP 1.30%
2
Improvement of the
management of the
transport system
2.1
Implementation of e-tolling for use of roads based on
travelled distance for heavy vehicles and electronic
vignettes for cars
No. 1
2.2
Design, development and commissioning of
dispatching system for controlling the movement of
trains and energy distribution, unified system for
managing the railway network (USMRN), train
operation management information system of
(TOMIS), information system for monitoring and
management of wagons and intermodal units.
Reservation system for seats, ticketing and
information services of passengers.
No. 4
2.3 Construction of integrated intermodal information
system No. 1
2.4 Implemented/modernized navigations systems
(VTMIS- Phase 4) No. 1
3 Development of
intermodal transport
3.1 Constructed freight intermodal terminals No. 3
3.2 Transported containers (TEU -20-feet container
equivalent) (TEU/year)
400
000
4
Improvement of the
conditions for
implementation of the
principles for
liberalization of the
transport market
4.1 Number of licensed railway passenger operators No. <1
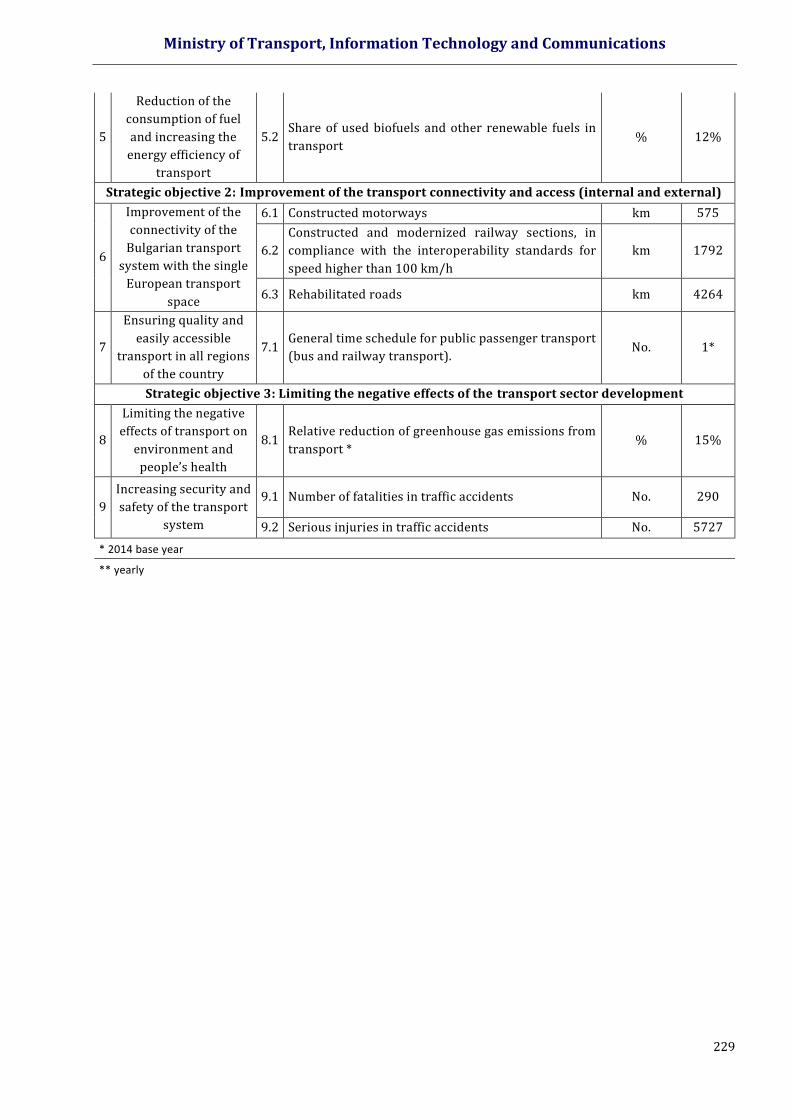
Ministry of Transport, Information Technology and Communications
229
5
Reduction of the
consumption of fuel
and increasing the
energy efficiency of
transport
5.2 Share of used biofuels and other renewable fuels in
transport % 12%
Strategic objective 2: Improvement of the transport connectivity and access (internal and external)
6
Improvement of the
connectivity of the
Bulgarian transport
system with the single
European transport
space
6.1 Constructed motorways km 575
6.2
Constructed and modernized railway sections, in
compliance with the interoperability standards for
speed higher than 100 km/h
km 1792
6.3 Rehabilitated roads km 4264
7
Ensuring quality and
easily accessible
transport in all regions
of the country
7.1 General time schedule for public passenger transport
(bus and railway transport). No. 1*
Strategic objective 3: Limiting the negative effects of the transport sector development
8
Limiting the negative
effects of transport on
environment and
people’s health
8.1 Relative reduction of greenhouse gas emissions from
transport * % 15%
9
Increasing security and
safety of the transport
system
9.1 Number of fatalities in traffic accidents No. 290
9.2 Serious injuries in traffic accidents No. 5727
* 2014 base year
** yearly
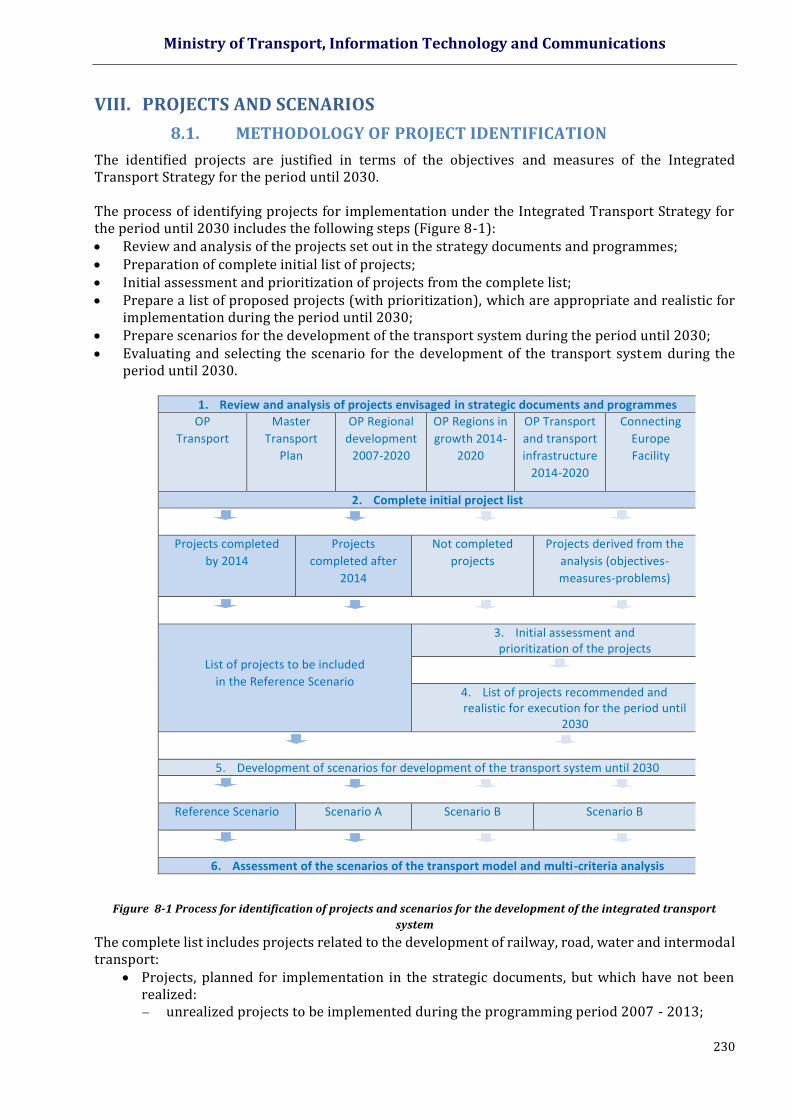
Ministry of Transport, Information Technology and Communications
230
VIII. PROJECTS AND SCENARIOS
8.1. METHODOLOGY OF PROJECT IDENTIFICATION
The identified projects are justified in terms of the objectives and measures of the Integrated Transport Strategy for the period until 2030. The process of identifying projects for implementation under the Integrated Transport Strategy for the period until 2030 includes the following steps (Figure 8-1): Review and analysis of the projects set out in the strategy documents and programmes; Preparation of complete initial list of projects; Initial assessment and prioritization of projects from the complete list; Prepare a list of proposed projects (with prioritization), which are appropriate and realistic for
implementation during the period until 2030; Prepare scenarios for the development of the transport system during the period until 2030; Evaluating and selecting the scenario for the development of the transport system during the
period until 2030.
Figure 8-1 Process for identification of projects and scenarios for the development of the integrated transport
system
The complete list includes projects related to the development of railway, road, water and intermodal transport:
Projects, planned for implementation in the strategic documents, but which have not been realized: unrealized projects to be implemented during the programming period 2007 - 2013;
1. Review and analysis of projects envisaged in strategic documents and programmes
OP
Transport
Master
Transport
Plan
OP Regional
development
2007-2020
OP Regions in
growth 2014-
2020
OP Transport
and transport
infrastructure
2014-2020
Connecting
Europe
Facility
2. Complete initial project list
Projects completed
by 2014
Projects
completed after
2014
Not completed
projects
Projects derived from the
analysis (objectives-
measures-problems)
List of projects to be included
in the Reference Scenario
3. Initial assessment and prioritization of the projects
4. List of projects recommended and realistic for execution for the period until
2030
5. Development of scenarios for development of the transport system until 2030
Reference Scenario Scenario A Scenario B Scenario B
6. Assessment of the scenarios of the transport model and multi-criteria analysis
Ministry of Transport, Information Technology and Communications
231
projects for which the preparation or execution has already began; New project proposals arising from the analysis of the transport sector and aimed at achieving
the objectives and measures of the Integrated Transport Strategy for the period until 2030. A review and analysis of the projects envisaged in the following documents and programs was done for the preparation of the initial list of projects:
Master Transport Plan of Bulgaria; Operational Programme Transport (2007 - 2013); Operational Programme Regional Development 2007-2013 Operational Programme Transport and Transport Infrastructure 2014 - 2020; Operational Programme Regions in Growth 2014-2020; The Connecting Europe Facility.
Projects of the complete list undergo initial assessment and grouping of the projects of the complete list to include these in scenarios for the development of the transport system. During the initial assessment of the projects of the complete list are grouped and arranged by the following criteria:
Period of implementation: - Projects from the previous programming period completed after the base year 2014; - Projects planned for implementation under OPTTI 2014 - 2020 and CEF;
These projects could be completed by 2023. The programming period ends in 2020, but the payments follow the principle of reimbursement of eligible costs. They can be completed by 2022 (period T + 2) and in exceptional cases - until 2023.
- Projects planned for implementation under national funding and/or government loans from IFI by 2022;
- Projects planned for implementation after 2022. Project maturity degree:
- Available conceptual design; - Finished technical design; - Finished EIA report; - Completed land acquisition; - Kilometres of TEN-T network.
Connection of the project with the TEN-T network: - core TEN-T Network; - comprehensive TEN-T Network; - connections with the TEN-T network.
Provided funding: - under OPTTI 2014 – 2020; - under CEM; - under OPRG 2014 – 2020.
Funding structure: - VAT of investments is also financed as a deductible expense; - The beneficiary does not participate in the financing of the project; - The beneficiary participates with minimal project financing.
Reduction of external effects of transport activity: - Development of intermodal transport; - Priority development of railway transport; - Construction of bypass roads around towns.
Based on the assessment projects are divided in three groups:
Projects planned for implementation under OPTTI 2014 – 2020 and CEM; Projects planned for implementation under national funding and/or government loans
from IFI by 2022; Indicative projects for implementation after 2022 by 2030.
Ministry of Transport, Information Technology and Communications
232
The first group includes projects that can be defined as "realistic and mature" and there are identified potential funding sources. Based on the criteria for grouping and sorting, a reference scenario and three scenarios of development (implementation of projects) have been defined, and assessed using the transport model and multi-criteria analysis. There is a detailed presentation of the methodology and the results of the grouping and the multicriteria analysis of the projects in the Appendix to Report Identification of projects and planning process. When developing scenarios, there was compliance with the objectives and technical requirements, specified in Regulation (EU) No. 1315/2013 of the European Parliament and of the Council of 11 December 2013 on Union guidelines for the development of trans-European transport network and repealing Decision No. 661/2010/EC in regard to the completion of the core and comprehensive TEN-T network in the time horizon from 2030 to 2050 on the territory of the Republic of Bulgaria, as well as the connectivity of nodes (ports, airports, border crossing points to neighbouring countries; railway - road terminals) with the core and comprehensive network in compliance with the national concept of spatial development for the period 2013 - 2025. During the assessment of alternatives the following methodology was used:
• Defining and outlining the appropriate basic criteria and sub-criteria for assessment. • Defining appropriate indicators to assess the criteria. • Description of indicators such as key objectives and content. • Assessment of alternative scenarios for each indicator and sub criterion. • Synthesize and summarize the assessment at the level of basic criteria. • Outlining the results of the application of the multi-criteria analysis for the different
alternative scenarios. • Selection of the most appropriate scenario for inclusion in the Integrated Transport Strategy.
For the purposes of the MCA the following groups were used:
Strategic, political and legal requirements; Socio - economic criteria and contribution to regional development; Effectiveness of users of the transport infrastructure; Costs for realization of the scenarios and the measures and their financial applicability; Financial and economic efficiency of a given scenario; Influence of a scenario on the environment and security.
For each main criterion there are sub-criterion and indicators defined which indicate the impact thereof. The system of indicators for assessment of the infrastructural projects and measures is presented in Table 8-1.
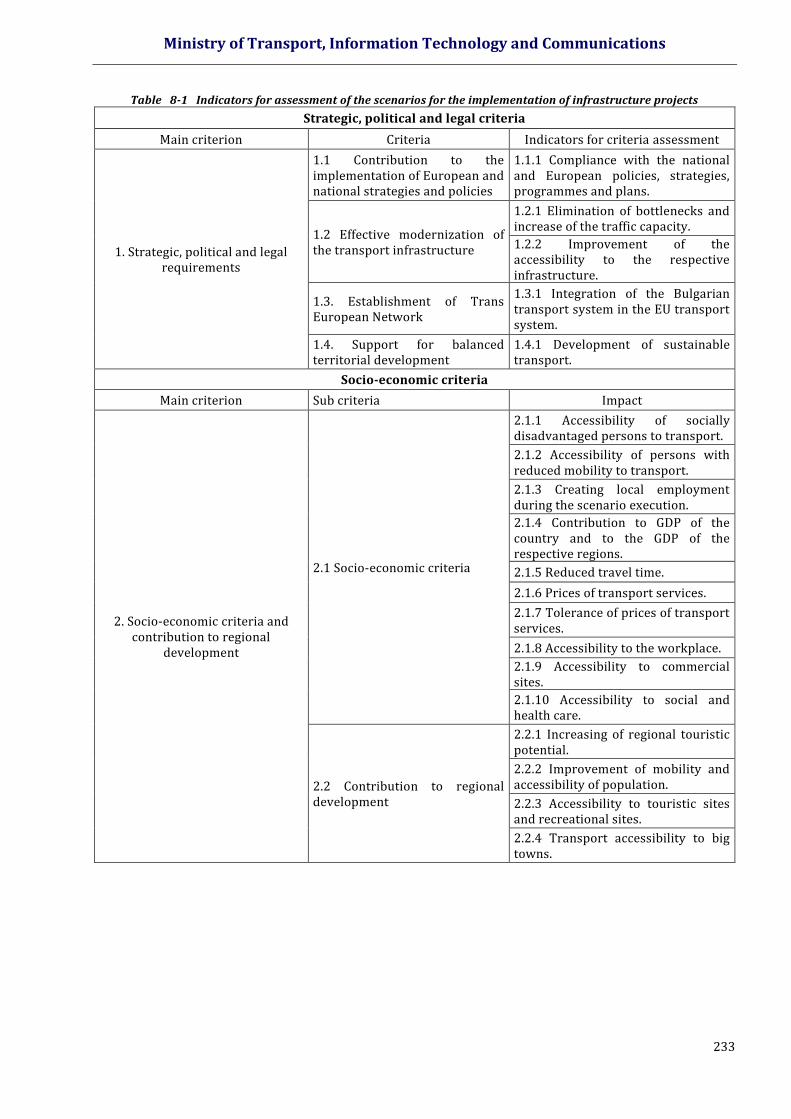
Ministry of Transport, Information Technology and Communications
233
Table 8-1 Indicators for assessment of the scenarios for the implementation of infrastructure projects
Strategic, political and legal criteria
Main criterion Criteria Indicators for criteria assessment
1. Strategic, political and legal requirements
1.1 Contribution to the implementation of European and national strategies and policies
1.1.1 Compliance with the national and European policies, strategies, programmes and plans.
1.2 Effective modernization of the transport infrastructure
1.2.1 Elimination of bottlenecks and increase of the traffic capacity.
1.2.2 Improvement of the accessibility to the respective infrastructure.
1.3. Establishment of Trans European Network
1.3.1 Integration of the Bulgarian transport system in the EU transport system.
1.4. Support for balanced territorial development
1.4.1 Development of sustainable transport.
Socio-economic criteria
Main criterion Sub criteria Impact
2. Socio-economic criteria and contribution to regional
development
2.1 Socio-economic criteria
2.1.1 Accessibility of socially disadvantaged persons to transport.
2.1.2 Accessibility of persons with reduced mobility to transport.
2.1.3 Creating local employment during the scenario execution.
2.1.4 Contribution to GDP of the country and to the GDP of the respective regions.
2.1.5 Reduced travel time.
2.1.6 Prices of transport services.
2.1.7 Tolerance of prices of transport services.
2.1.8 Accessibility to the workplace.
2.1.9 Accessibility to commercial sites.
2.1.10 Accessibility to social and health care.
2.2 Contribution to regional development
2.2.1 Increasing of regional touristic potential.
2.2.2 Improvement of mobility and accessibility of population.
2.2.3 Accessibility to touristic sites and recreational sites.
2.2.4 Transport accessibility to big towns.

Ministry of Transport, Information Technology and Communications
234
Efficiency of users of the transport infrastructure
Main criterion Sub criteria Impact
3. Economic effectiveness of operators
3.1 Used energy 3.1.1 Consumed fuel quantity.
3.1.2 Consumed traction electricity.
3.2 Operation costs and maintenance of transport vehicles
3.2.1 Operation costs and maintenance of vehicles.
3.2.2 Operation costs and maintenance of wagons and locomotives.
Costs for project and measure implementation
Main criterion Sub criteria Impact
4. Costs for project and measure implementation
4.1 Total investment value
4.1.1 Investment costs.
4.1.2 Investment structure.
4.1.3 Costs for land acquisition.
4.2 Operation costs and maintenance
4.2.1 Costs for operation.
4.2.2 Costs for maintenance.
4.3 Financial applicability 4.3.1 Provided financing.
4.3.2 Financial stability.
4.4 Asset life cycle at the end of the forecast period
4.4.1 Depreciation and depreciation policy.
4.4.2 Remaining asset value.
4.3.3 Reinvestment and renewal of assets.
4.5. Efficiency of costs
4.5.1 NPV of the total investments and costs for operation and maintenance.
4.5.2 Part of NPV of the total investments and costs for operation and maintenance for each unit of transport work.
Financial and economic effectiveness of a given scenario
Main criterion Sub criteria Impact
5. Financial and economic benefits of the project
5.1 Financial analysis
5.1.1 Financial internal rate of return of the investment.
5.1.2 Community contribution.
5.1.3 Financial internal rate of return of the capital.
5.2 Economic analysis
5.2.1 Economic internal rate of return.
5.2.2 Benefit coefficient – costs.

Ministry of Transport, Information Technology and Communications
235
Environment and security
Main criterion Sub criteria Impact
6. Environment
6.1 Population
6.1.1 Vibration noise.
6.1.2 Greenhouse gas emissions.
6.1.3 Air pollution.
6.1.4 Accidents, fatalities, serious and light injuries.
6.1.5 Bypass routes for big towns.
6.2 Modal split 6.2.1 Share of public transport.
6.2.2 Share of railway transport.
6.3 Biodiversity
6.3.1 Impact on Protected areas with international significance.
6.3.2 Impact on Protected areas with national significance.
6.3.3 Effects on biodiversity, flora, fauna and water.
6.4 Landscape 6.4.1 Visible landscape.
6.5 Cultural and historical heritage.
6.5.1 Impacted areas and sites of cultural and historical heritage
On the basis of the performed valuation of indicators for each scenario and justified weighting of criteria rankings of the scenarios was obtained for this strategy and these are presented in Table 8-2.
Table 8-2 Final ranking of scenarios
Criteria Reference scenario
Scenario А
Scenario B
Scenario C
Strategic, political and legal criteria 1,00 3,07 4,50 4,95
Socio-economic criteria 2,00 4,33 5,45 6,56
Efficiency of users of the transport infrastructure 0,39 0,46 0,75 0,73 Costs for project and measure implementation 12,00 9,86 7,94 5,35 Financial and economic effectiveness of a given scenario 0,50 2,50 1,50 1,00 Environment and security 11,10 11,25 14,61 10,03
Total rank taking into account the criteria weighting
26,99 31,48 34,74 28,62
8.2 LIST OF PROJECTS Scenario B has been selected after application of the multi-criteria analysis based on the system of assessment indicators of infrastructure projects and measures, show in Table 8-3. Scenario B, as a structure, phases of implementation, implementation periods and indicative values of the included projects, is presented in Fig. 8-3.
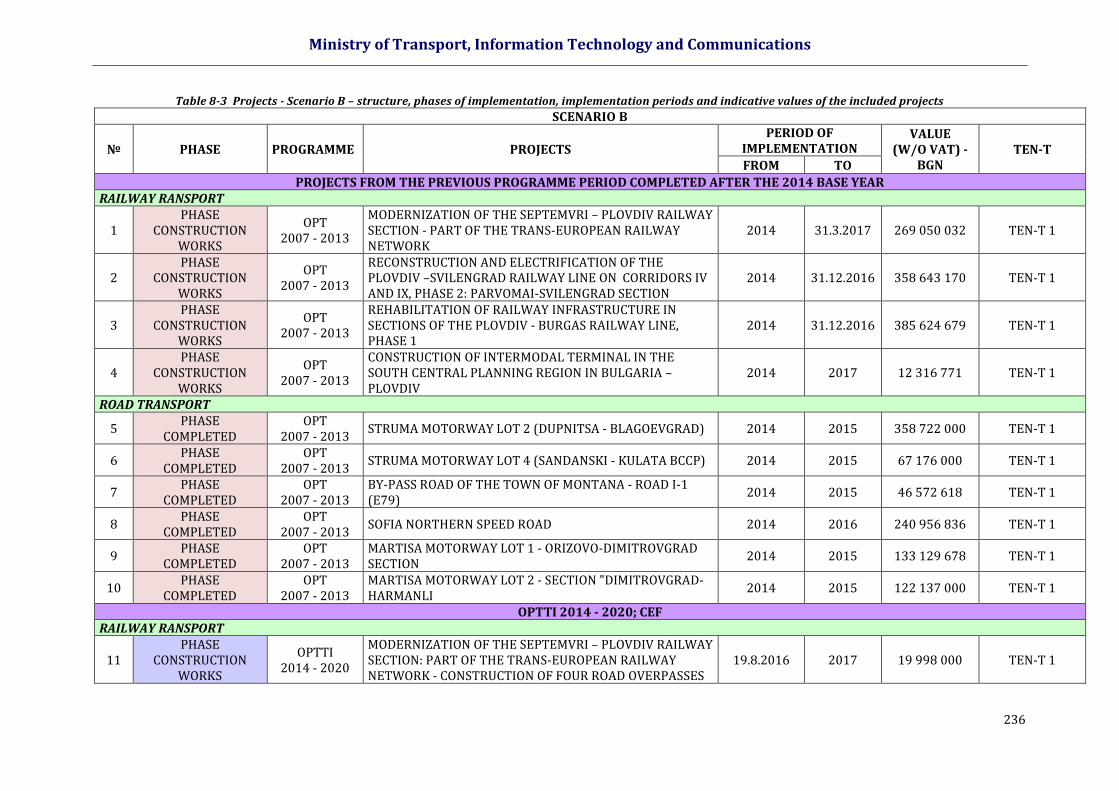
Ministry of Transport, Information Technology and Communications
236
Table 8-3 Projects - Scenario B – structure, phases of implementation, implementation periods and indicative values of the included projects
SCENARIO B
№ PHASE PROGRAMME PROJECTS
PERIOD OF IMPLEMENTATION
VALUE (W/O VAT) -
BGN TEN-T
FROM TO
PROJECTS FROM THE PREVIOUS PROGRAMME PERIOD COMPLETED AFTER THE 2014 BASE YEAR RAILWAY RANSPORT
1 PHASE
CONSTRUCTION WORKS
OPT 2007 - 2013
MODERNIZATION OF THE SEPTEMVRI – PLOVDIV RAILWAY SECTION - PART OF THE TRANS-EUROPEAN RAILWAY NETWORK
2014 31.3.2017 269 050 032 TEN-T 1
2 PHASE
CONSTRUCTION WORKS
OPT 2007 - 2013
RECONSTRUCTION AND ELECTRIFICATION OF THE PLOVDIV –SVILENGRAD RAILWAY LINE ON CORRIDORS IV AND IX, PHASE 2: PARVOMAI-SVILENGRAD SECTION
2014 31.12.2016 358 643 170 TEN-T 1
3 PHASE
CONSTRUCTION WORKS
OPT 2007 - 2013
REHABILITATION OF RAILWAY INFRASTRUCTURE IN SECTIONS OF THE PLOVDIV - BURGAS RAILWAY LINE, PHASE 1
2014 31.12.2016 385 624 679 TEN-T 1
4 PHASE
CONSTRUCTION WORKS
OPT 2007 - 2013
CONSTRUCTION OF INTERMODAL TERMINAL IN THE SOUTH CENTRAL PLANNING REGION IN BULGARIA – PLOVDIV
2014 2017 12 316 771 TEN-T 1
ROAD TRANSPORT
5 PHASE
COMPLETED OPT
2007 - 2013 STRUMA MOTORWAY LOT 2 (DUPNITSA - BLAGOEVGRAD) 2014 2015 358 722 000 TEN-T 1
6 PHASE
COMPLETED OPT
2007 - 2013 STRUMA MOTORWAY LOT 4 (SANDANSKI - KULATA BCCP) 2014 2015 67 176 000 TEN-T 1
7 PHASE
COMPLETED OPT
2007 - 2013 BY-PASS ROAD OF THE TOWN OF MONTANA - ROAD I-1 (Е79)
2014 2015 46 572 618 TEN-T 1
8 PHASE
COMPLETED OPT
2007 - 2013 SOFIA NORTHERN SPEED ROAD 2014 2016 240 956 836 TEN-T 1
9 PHASE
COMPLETED OPT
2007 - 2013 MARTISA MOTORWAY LOT 1 - ORIZOVO-DIMITROVGRAD SECTION
2014 2015 133 129 678 TEN-T 1
10 PHASE
COMPLETED OPT
2007 - 2013 MARTISA MOTORWAY LOT 2 - SECTION "DIMITROVGRAD-HARMANLI
2014 2015 122 137 000 TEN-T 1
OPTTI 2014 - 2020; CEF RAILWAY RANSPORT
11 PHASE
CONSTRUCTION WORKS
OPTTI 2014 - 2020
MODERNIZATION OF THE SEPTEMVRI – PLOVDIV RAILWAY SECTION: PART OF THE TRANS-EUROPEAN RAILWAY NETWORK - CONSTRUCTION OF FOUR ROAD OVERPASSES
19.8.2016 2017 19 998 000 TEN-T 1
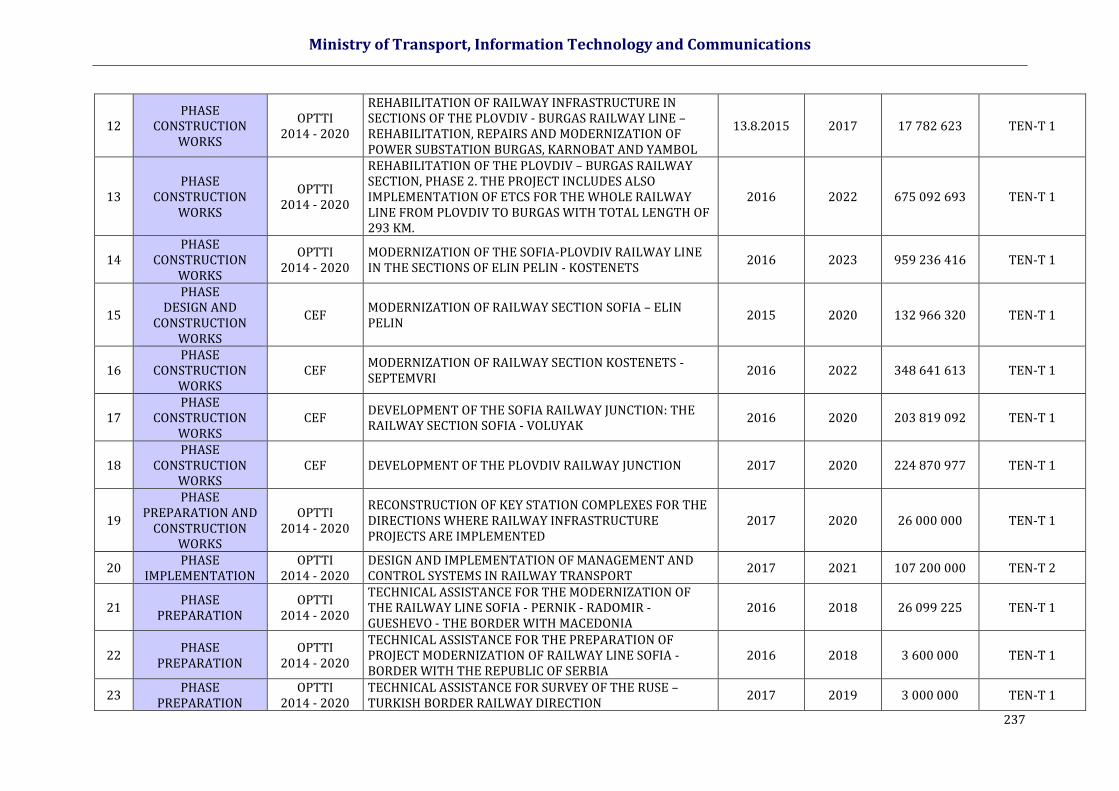
Ministry of Transport, Information Technology and Communications
237
12 PHASE
CONSTRUCTION WORKS
OPTTI 2014 - 2020
REHABILITATION OF RAILWAY INFRASTRUCTURE IN SECTIONS OF THE PLOVDIV - BURGAS RAILWAY LINE – REHABILITATION, REPAIRS AND MODERNIZATION OF POWER SUBSTATION BURGAS, KARNOBAT AND YAMBOL
13.8.2015 2017 17 782 623 TEN-T 1
13 PHASE
CONSTRUCTION WORKS
OPTTI 2014 - 2020
REHABILITATION OF THE PLOVDIV – BURGAS RAILWAY SECTION, PHASE 2. THE PROJECT INCLUDES ALSO IMPLEMENTATION OF ETCS FOR THE WHOLE RAILWAY LINE FROM PLOVDIV TO BURGAS WITH TOTAL LENGTH OF 293 KM.
2016 2022 675 092 693 TEN-T 1
14 PHASE
CONSTRUCTION WORKS
OPTTI 2014 - 2020
MODERNIZATION OF THE SOFIA-PLOVDIV RAILWAY LINE IN THE SECTIONS OF ELIN PELIN - KOSTENETS
2016 2023 959 236 416 TEN-T 1
15
PHASE DESIGN AND
CONSTRUCTION WORKS
CEF MODERNIZATION OF RAILWAY SECTION SOFIA – ELIN PELIN
2015 2020 132 966 320 TEN-T 1
16 PHASE
CONSTRUCTION WORKS
CEF MODERNIZATION OF RAILWAY SECTION KOSTENETS - SEPTEMVRI
2016 2022 348 641 613 TEN-T 1
17 PHASE
CONSTRUCTION WORKS
CEF DEVELOPMENT OF THE SOFIA RAILWAY JUNCTION: THE RAILWAY SECTION SOFIA - VOLUYAK
2016 2020 203 819 092 TEN-T 1
18 PHASE
CONSTRUCTION WORKS
CEF DEVELOPMENT OF THE PLOVDIV RAILWAY JUNCTION 2017 2020 224 870 977 TEN-T 1
19
PHASE PREPARATION AND
CONSTRUCTION WORKS
OPTTI 2014 - 2020
RECONSTRUCTION OF KEY STATION COMPLEXES FOR THE DIRECTIONS WHERE RAILWAY INFRASTRUCTURE PROJECTS ARE IMPLEMENTED
2017 2020 26 000 000 TEN-T 1
20 PHASE
IMPLEMENTATION OPTTI
2014 - 2020 DESIGN AND IMPLEMENTATION OF MANAGEMENT AND CONTROL SYSTEMS IN RAILWAY TRANSPORT
2017 2021 107 200 000 TEN-T 2
21 PHASE
PREPARATION OPTTI
2014 - 2020
TECHNICAL ASSISTANCE FOR THE MODERNIZATION OF THE RAILWAY LINE SOFIA - PERNIK - RADOMIR - GUESHEVO - THE BORDER WITH MACEDONIA
2016 2018 26 099 225 TEN-T 1
22 PHASE
PREPARATION OPTTI
2014 - 2020
TECHNICAL ASSISTANCE FOR THE PREPARATION OF PROJECT MODERNIZATION OF RAILWAY LINE SOFIA - BORDER WITH THE REPUBLIC OF SERBIA
2016 2018 3 600 000 TEN-T 1
23 PHASE
PREPARATION OPTTI
2014 - 2020 TECHNICAL ASSISTANCE FOR SURVEY OF THE RUSE – TURKISH BORDER RAILWAY DIRECTION
2017 2019 3 000 000 TEN-T 1
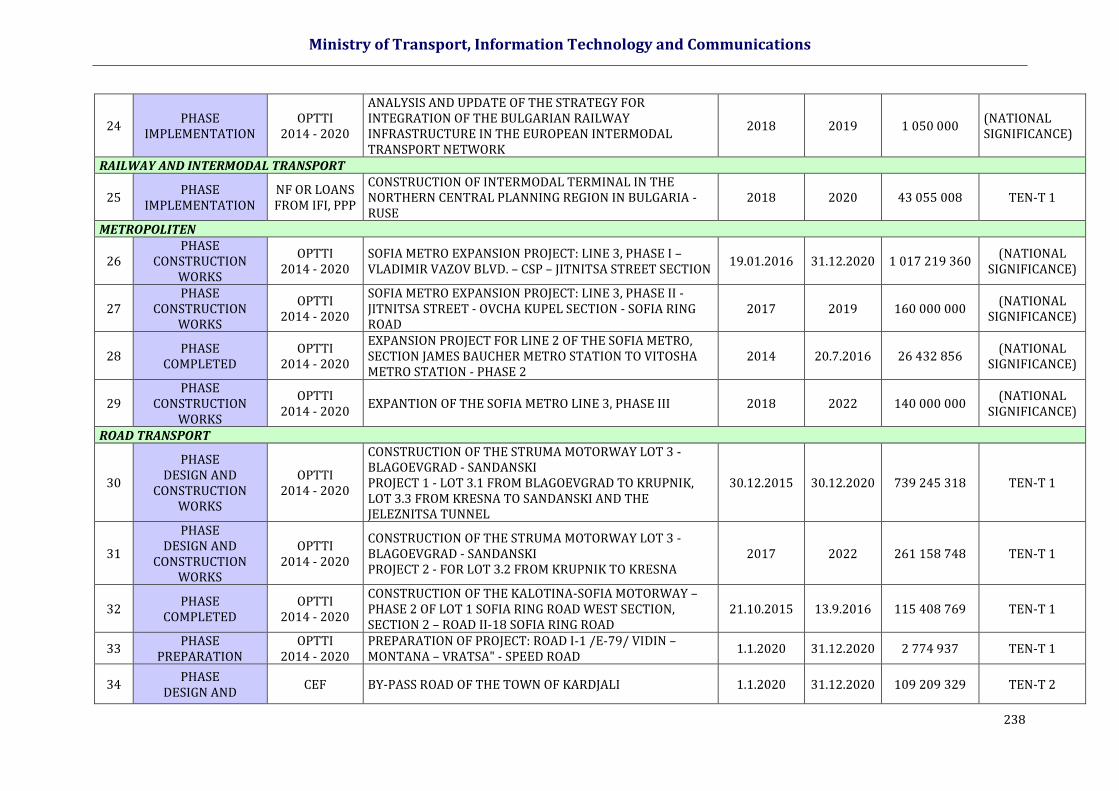
Ministry of Transport, Information Technology and Communications
238
24 PHASE
IMPLEMENTATION OPTTI
2014 - 2020
ANALYSIS AND UPDATE OF THE STRATEGY FOR INTEGRATION OF THE BULGARIAN RAILWAY INFRASTRUCTURE IN THE EUROPEAN INTERMODAL TRANSPORT NETWORK
2018 2019 1 050 000 (NATIONAL SIGNIFICANCE)
RAILWAY AND INTERMODAL TRANSPORT
25 PHASE
IMPLEMENTATION NF OR LOANS FROM IFI, PPP
CONSTRUCTION OF INTERMODAL TERMINAL IN THE NORTHERN CENTRAL PLANNING REGION IN BULGARIA - RUSE
2018 2020 43 055 008 TEN-T 1
METROPOLITEN
26 PHASE
CONSTRUCTION WORKS
OPTTI 2014 - 2020
SOFIA METRO EXPANSION PROJECT: LINE 3, PHASE I – VLADIMIR VAZOV BLVD. – CSP – JITNITSA STREET SECTION
19.01.2016 31.12.2020 1 017 219 360 (NATIONAL
SIGNIFICANCE)
27 PHASE
CONSTRUCTION WORKS
OPTTI 2014 - 2020
SOFIA METRO EXPANSION PROJECT: LINE 3, PHASE IІ - JITNITSA STREET - OVCHA KUPEL SECTION - SOFIA RING ROAD
2017 2019 160 000 000 (NATIONAL
SIGNIFICANCE)
28 PHASE
COMPLETED OPTTI
2014 - 2020
EXPANSION PROJECT FOR LINE 2 OF THE SOFIA METRO, SECTION JAMES BAUCHER METRO STATION TO VITOSHA METRO STATION - PHASE 2
2014 20.7.2016 26 432 856 (NATIONAL
SIGNIFICANCE)
29 PHASE
CONSTRUCTION WORKS
OPTTI 2014 - 2020
EXPANTION OF THE SOFIA METRO LINE 3, PHASE III 2018 2022 140 000 000 (NATIONAL
SIGNIFICANCE)
ROAD TRANSPORT
30
PHASE DESIGN AND
CONSTRUCTION WORKS
OPTTI 2014 - 2020
CONSTRUCTION OF THE STRUMA MOTORWAY LOT 3 - BLAGOEVGRAD - SANDANSKI PROJECT 1 - LOT 3.1 FROM BLAGOEVGRAD TO KRUPNIK, LOT 3.3 FROM KRESNA TO SANDANSKI AND THE JELEZNITSA TUNNEL
30.12.2015 30.12.2020 739 245 318 TEN-T 1
31
PHASE DESIGN AND
CONSTRUCTION WORKS
OPTTI 2014 - 2020
CONSTRUCTION OF THE STRUMA MOTORWAY LOT 3 - BLAGOEVGRAD - SANDANSKI PROJECT 2 - FOR LOT 3.2 FROM KRUPNIK TO KRESNA
2017 2022 261 158 748 TEN-T 1
32 PHASE
COMPLETED OPTTI
2014 - 2020
CONSTRUCTION OF THE KALOTINA-SOFIA MOTORWAY – PHASE 2 OF LOT 1 SOFIA RING ROAD WEST SECTION, SECTION 2 – ROAD ІІ-18 SOFIA RING ROAD
21.10.2015 13.9.2016 115 408 769 TEN-T 1
33 PHASE
PREPARATION OPTTI
2014 - 2020 PREPARATION OF PROJECT: ROAD I-1 /E-79/ VIDIN – MONTANA – VRATSA" - SPEED ROAD
1.1.2020 31.12.2020 2 774 937 TEN-T 1
34 PHASE
DESIGN AND CEF BY-PASS ROAD OF THE TOWN OF KARDJALI 1.1.2020 31.12.2020 109 209 329 TEN-T 2
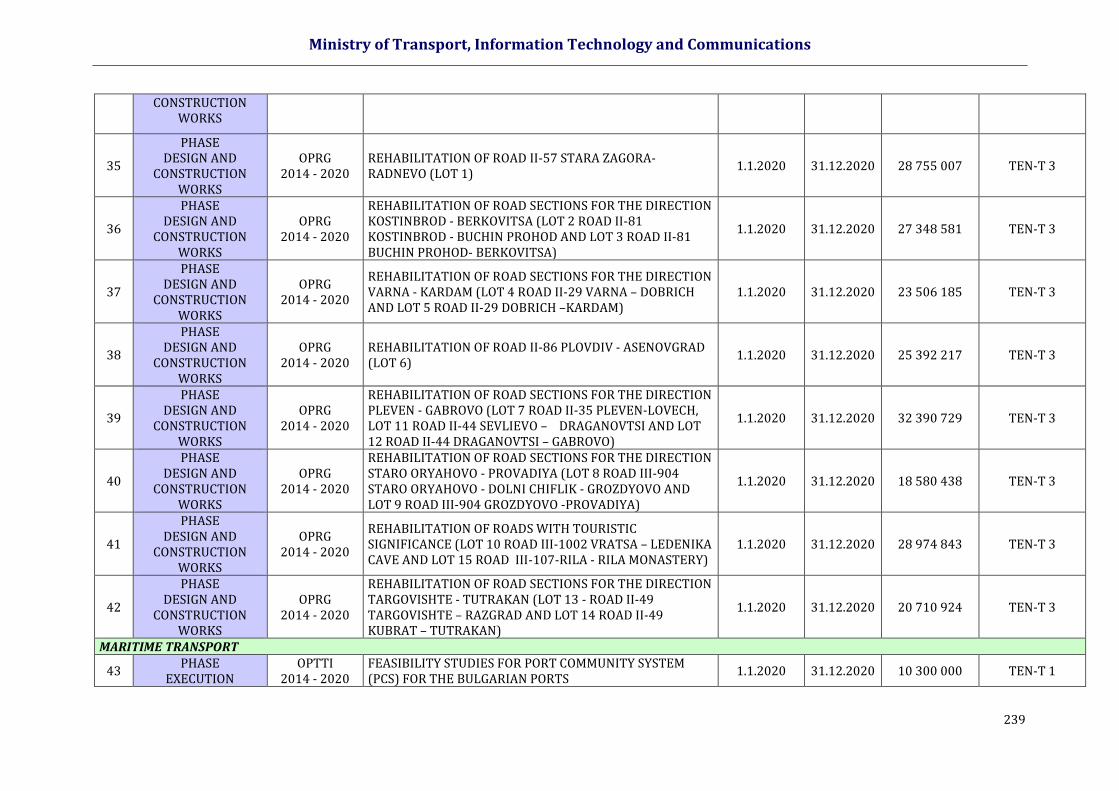
Ministry of Transport, Information Technology and Communications
239
CONSTRUCTION WORKS
35
PHASE DESIGN AND
CONSTRUCTION WORKS
OPRG 2014 - 2020
REHABILITATION OF ROAD ІІ-57 STARA ZAGORA-RADNEVO (LOT 1)
1.1.2020 31.12.2020 28 755 007 TEN-T 3
36
PHASE DESIGN AND
CONSTRUCTION WORKS
OPRG 2014 - 2020
REHABILITATION OF ROAD SECTIONS FOR THE DIRECTION KOSTINBROD - BERKOVITSA (LOT 2 ROAD ІІ-81 KOSTINBROD - BUCHIN PROHOD AND LOT 3 ROAD ІІ-81 BUCHIN PROHOD- BERKOVITSA)
1.1.2020 31.12.2020 27 348 581 TEN-T 3
37
PHASE DESIGN AND
CONSTRUCTION WORKS
OPRG 2014 - 2020
REHABILITATION OF ROAD SECTIONS FOR THE DIRECTION VARNA - KARDAM (LOT 4 ROAD ІІ-29 VARNA – DOBRICH AND LOT 5 ROAD ІІ-29 DOBRICH –KARDAM)
1.1.2020 31.12.2020 23 506 185 TEN-T 3
38
PHASE DESIGN AND
CONSTRUCTION WORKS
OPRG 2014 - 2020
REHABILITATION OF ROAD II-86 PLOVDIV - ASENOVGRAD (LOT 6)
1.1.2020 31.12.2020 25 392 217 TEN-T 3
39
PHASE DESIGN AND
CONSTRUCTION WORKS
OPRG 2014 - 2020
REHABILITATION OF ROAD SECTIONS FOR THE DIRECTION PLEVEN - GABROVO (LOT 7 ROAD II-35 PLEVEN-LOVECH, LOT 11 ROAD II-44 SEVLIEVO – DRAGANOVTSI AND LOT 12 ROAD II-44 DRAGANOVTSI – GABROVO)
1.1.2020 31.12.2020 32 390 729 TEN-T 3
40
PHASE DESIGN AND
CONSTRUCTION WORKS
OPRG 2014 - 2020
REHABILITATION OF ROAD SECTIONS FOR THE DIRECTION STARO ORYAHOVO - PROVADIYA (LOT 8 ROAD IІІ-904 STARO ORYAHOVO - DOLNI CHIFLIK - GROZDYOVO AND LOT 9 ROAD IІІ-904 GROZDYOVO -PROVADIYA)
1.1.2020 31.12.2020 18 580 438 TEN-T 3
41
PHASE DESIGN AND
CONSTRUCTION WORKS
OPRG 2014 - 2020
REHABILITATION OF ROADS WITH TOURISTIC SIGNIFICANCE (LOT 10 ROAD ІІІ-1002 VRATSA – LEDENIKA CAVE AND LOT 15 ROAD III-107-RILA - RILA MONASTERY)
1.1.2020 31.12.2020 28 974 843 TEN-T 3
42
PHASE DESIGN AND
CONSTRUCTION WORKS
OPRG 2014 - 2020
REHABILITATION OF ROAD SECTIONS FOR THE DIRECTION TARGOVISHTE - TUTRAKAN (LOT 13 - ROAD ІІ-49 TARGOVISHTE – RAZGRAD AND LOT 14 ROAD ІІ-49 KUBRAT – TUTRAKAN)
1.1.2020 31.12.2020 20 710 924 TEN-T 3
MARITIME TRANSPORT
43 PHASE
EXECUTION OPTTI
2014 - 2020 FEASIBILITY STUDIES FOR PORT COMMUNITY SYSTEM (PCS) FOR THE BULGARIAN PORTS
1.1.2020 31.12.2020 10 300 000 TEN-T 1
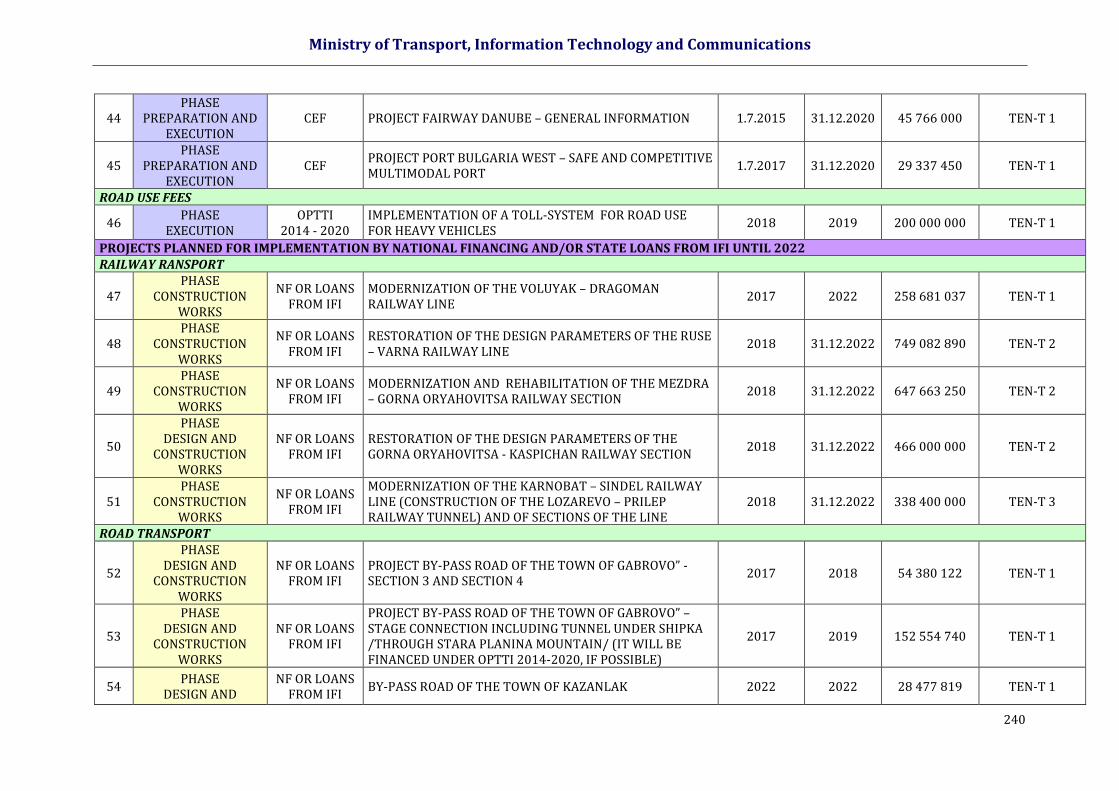
Ministry of Transport, Information Technology and Communications
240
44 PHASE
PREPARATION AND EXECUTION
CEF PROJECT FAIRWAY DANUBE – GENERAL INFORMATION 1.7.2015 31.12.2020 45 766 000 TEN-T 1
45 PHASE
PREPARATION AND EXECUTION
CEF PROJECT PORT BULGARIA WEST – SAFE AND COMPETITIVE MULTIMODAL PORT
1.7.2017 31.12.2020 29 337 450 TEN-T 1
ROAD USE FEES
46 PHASE
EXECUTION OPTTI
2014 - 2020 IMPLEMENTATION OF A TOLL-SYSTEM FOR ROAD USE FOR HEAVY VEHICLES
2018 2019 200 000 000 TEN-T 1
PROJECTS PLANNED FOR IMPLEMENTATION BY NATIONAL FINANCING AND/OR STATE LOANS FROM IFI UNTIL 2022 RAILWAY RANSPORT
47 PHASE
CONSTRUCTION WORKS
NF OR LOANS FROM IFI
MODERNIZATION OF THE VOLUYAK – DRAGOMAN RAILWAY LINE
2017 2022 258 681 037 TEN-T 1
48 PHASE
CONSTRUCTION WORKS
NF OR LOANS FROM IFI
RESTORATION OF THE DESIGN PARAMETERS OF THE RUSE – VARNA RAILWAY LINE
2018 31.12.2022 749 082 890 TEN-T 2
49 PHASE
CONSTRUCTION WORKS
NF OR LOANS FROM IFI
MODERNIZATION AND REHABILITATION OF THE MEZDRA – GORNA ORYAHOVITSA RAILWAY SECTION
2018 31.12.2022 647 663 250 TEN-T 2
50
PHASE DESIGN AND
CONSTRUCTION WORKS
NF OR LOANS FROM IFI
RESTORATION OF THE DESIGN PARAMETERS OF THE GORNA ORYAHOVITSA - KASPICHAN RAILWAY SECTION
2018 31.12.2022 466 000 000 TEN-T 2
51 PHASE
CONSTRUCTION WORKS
NF OR LOANS FROM IFI
MODERNIZATION OF THE KARNOBAT – SINDEL RAILWAY LINE (CONSTRUCTION OF THE LOZAREVO – PRILEP RAILWAY TUNNEL) AND OF SECTIONS OF THE LINE
2018 31.12.2022 338 400 000 TEN-T 3
ROAD TRANSPORT
52
PHASE DESIGN AND
CONSTRUCTION WORKS
NF OR LOANS FROM IFI
PROJECT BY-PASS ROAD OF THE TOWN OF GABROVO” - SECTION 3 AND SECTION 4
2017 2018 54 380 122 TEN-T 1
53
PHASE DESIGN AND
CONSTRUCTION WORKS
NF OR LOANS FROM IFI
PROJECT BY-PASS ROAD OF THE TOWN OF GABROVO” – STAGE CONNECTION INCLUDING TUNNEL UNDER SHIPKA /THROUGH STARA PLANINA MOUNTAIN/ (IT WILL BE FINANCED UNDER OPTTI 2014-2020, IF POSSIBLE)
2017 2019 152 554 740 TEN-T 1
54 PHASE
DESIGN AND NF OR LOANS
FROM IFI BY-PASS ROAD OF THE TOWN OF KAZANLAK 2022 2022 28 477 819 TEN-T 1
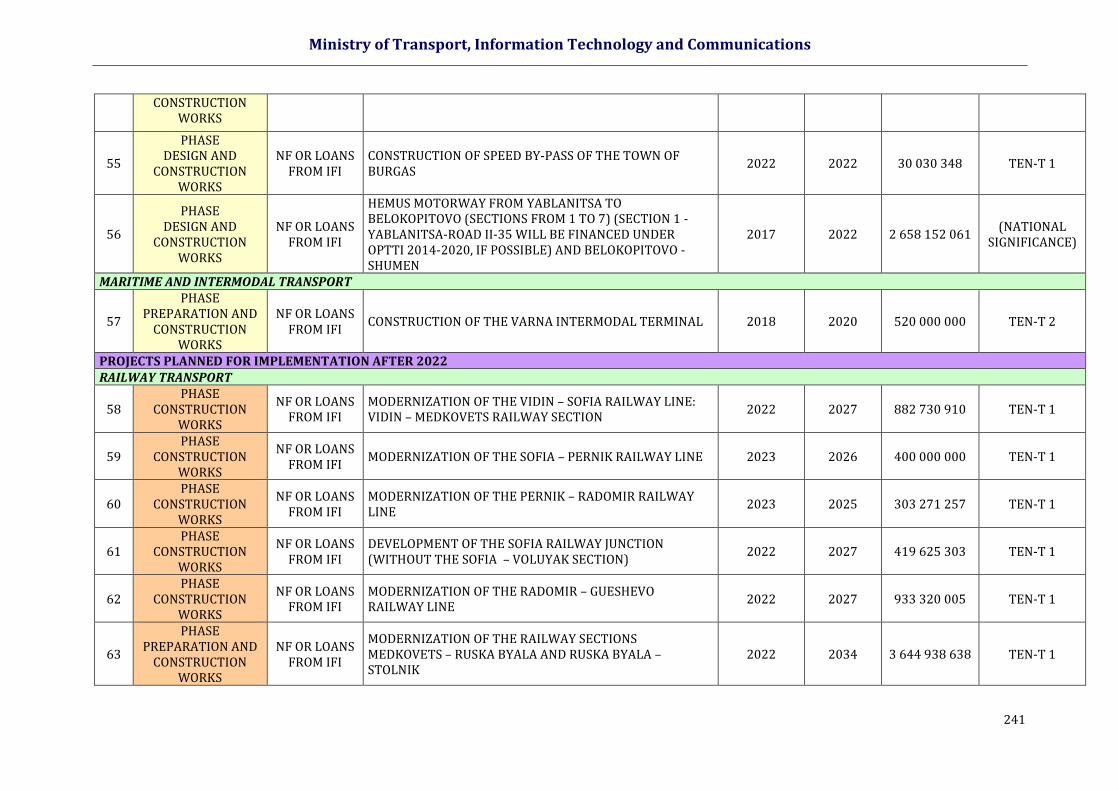
Ministry of Transport, Information Technology and Communications
241
CONSTRUCTION WORKS
55
PHASE DESIGN AND
CONSTRUCTION WORKS
NF OR LOANS FROM IFI
CONSTRUCTION OF SPEED BY-PASS OF THE TOWN OF BURGAS
2022 2022 30 030 348 TEN-T 1
56
PHASE DESIGN AND
CONSTRUCTION WORKS
NF OR LOANS FROM IFI
HEMUS MOTORWAY FROM YABLANITSA TO BELOKOPITOVO (SECTIONS FROM 1 TO 7) (SECTION 1 - YABLANITSA-ROAD II-35 WILL BE FINANCED UNDER OPTTI 2014-2020, IF POSSIBLE) AND BELOKOPITOVO - SHUMEN
2017 2022 2 658 152 061 (NATIONAL
SIGNIFICANCE)
MARITIME AND INTERMODAL TRANSPORT
57
PHASE PREPARATION AND
CONSTRUCTION WORKS
NF OR LOANS FROM IFI
CONSTRUCTION OF THE VARNA INTERMODAL TERMINAL 2018 2020 520 000 000 TEN-T 2
PROJECTS PLANNED FOR IMPLEMENTATION AFTER 2022 RAILWAY TRANSPORT
58 PHASE
CONSTRUCTION WORKS
NF OR LOANS FROM IFI
MODERNIZATION OF THE VIDIN – SOFIA RAILWAY LINE: VIDIN – MEDKOVETS RAILWAY SECTION
2022 2027 882 730 910 TEN-T 1
59 PHASE
CONSTRUCTION WORKS
NF OR LOANS FROM IFI
MODERNIZATION OF THE SOFIA – PERNIK RAILWAY LINE 2023 2026 400 000 000 TEN-T 1
60 PHASE
CONSTRUCTION WORKS
NF OR LOANS FROM IFI
MODERNIZATION OF THE PERNIK – RADOMIR RAILWAY LINE
2023 2025 303 271 257 TEN-T 1
61 PHASE
CONSTRUCTION WORKS
NF OR LOANS FROM IFI
DEVELOPMENT OF THE SOFIA RAILWAY JUNCTION (WITHOUT THE SOFIA – VOLUYAK SECTION)
2022 2027 419 625 303 TEN-T 1
62 PHASE
CONSTRUCTION WORKS
NF OR LOANS FROM IFI
MODERNIZATION OF THE RADOMIR – GUESHEVO RAILWAY LINE
2022 2027 933 320 005 TEN-T 1
63
PHASE PREPARATION AND
CONSTRUCTION WORKS
NF OR LOANS FROM IFI
MODERNIZATION OF THE RAILWAY SECTIONS MEDKOVETS – RUSKA BYALA AND RUSKA BYALA – STOLNIK
2022 2034 3 644 938 638 TEN-T 1

Ministry of Transport, Information Technology and Communications
242
64
PHASE PREPARATION AND
CONSTRUCTION WORKS
NF OR LOANS FROM IFI
MODERNIZATION OF THE RUSE – GORNA ORYAHOVITSA – DIMITROVGRAD RAILWAY LINE
2022 2027 1 985 049 330 TEN-T 1
65
PHASE PREPARATION AND
CONSTRUCTION WORKS
NF OR LOANS FROM IFI
MODERNIZATION OF THE RADOMIR - KULATA RAILWAY LINE
2022 2027 1 691 154 792 TEN-T 1
ROAD TRANSPORT
66
PHASE PREPARATION AND
CONSTRUCTION WORKS
NF OR LOANS FROM IFI
ORYAHOVO-BEKET BRIDGE /ON THE DANUBE RIVER/ 2029 2034 357 012 582 TEN-T 1
67
PHASE PREPARATION AND
CONSTRUCTION WORKS
NF OR LOANS FROM IFI
SILISTRA-CALARASI BRIDGE /ON THE DANUBE RIVER/ 2030 2034 267 759 437 TEN-T 1
68
PHASE PREPARATION AND
CONSTRUCTION WORKS
NF OR LOANS FROM IFI
NIKOPOL-TURNU-MAGURELE BRIDGE /ON THE DANUBE RIVER/
2029 2033 357 012 582 TEN-T 1
69
PHASE PREPARATION AND
CONSTRUCTION WORKS
NF OR LOANS FROM IFI
SECOND BRIDGE AT RUSE / ON THE DANUBE RIVER/ 2029 2033 267 759 437 TEN-T 1
MARITIME TRANSPORT
70
PHASE PREPARATION AND
CONSTRUCTION WORKS
NF OR LOANS FROM IFI, PPP
CONSTRUCTION OF THE MAIN INFRASTRUCTURE OF A LOGISTIC COMPLEX AT THE VARNA-WEST TERMINAL
2033 2034 220 000 000 TEN-T 1
8.3 BUDGET AND FINANCIAL PLAN FOR THE PROJECTS The budget for scenario B is shown in Fig.8-2, Fig.8-3, Fig. 8-4, Fig. 8-5, Fig. 8-6 and Table 8-4. It is presented by source of funding, by years and overheads to each current year (cumulative). It also shows a budget including only of the financing from the operational programs and CEF (Fig. 2-10, Fig. 2-11). Fig.2-12 of the budget is shown as investments divided into periods.
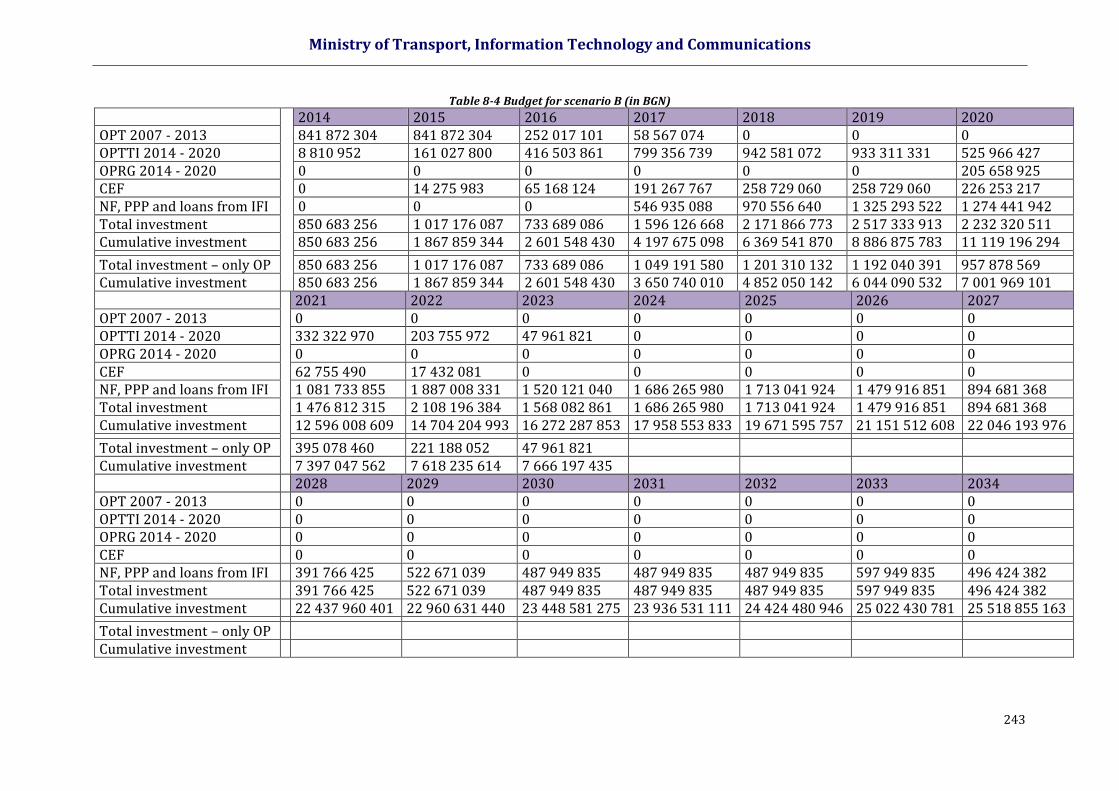
Ministry of Transport, Information Technology and Communications
243
Table 8-4 Budget for scenario В (in BGN)
2014 2015 2016 2017 2018 2019 2020 OPT 2007 - 2013 841 872 304 841 872 304 252 017 101 58 567 074 0 0 0 OPTTI 2014 - 2020 8 810 952 161 027 800 416 503 861 799 356 739 942 581 072 933 311 331 525 966 427 OPRG 2014 - 2020 0 0 0 0 0 0 205 658 925 CEF 0 14 275 983 65 168 124 191 267 767 258 729 060 258 729 060 226 253 217 NF, PPP and loans from IFI 0 0 0 546 935 088 970 556 640 1 325 293 522 1 274 441 942 Total investment 850 683 256 1 017 176 087 733 689 086 1 596 126 668 2 171 866 773 2 517 333 913 2 232 320 511 Cumulative investment 850 683 256 1 867 859 344 2 601 548 430 4 197 675 098 6 369 541 870 8 886 875 783 11 119 196 294
Total investment – only OP 850 683 256 1 017 176 087 733 689 086 1 049 191 580 1 201 310 132 1 192 040 391 957 878 569 Cumulative investment 850 683 256 1 867 859 344 2 601 548 430 3 650 740 010 4 852 050 142 6 044 090 532 7 001 969 101
2021 2022 2023 2024 2025 2026 2027 OPT 2007 - 2013 0 0 0 0 0 0 0 OPTTI 2014 - 2020 332 322 970 203 755 972 47 961 821 0 0 0 0 OPRG 2014 - 2020 0 0 0 0 0 0 0 CEF 62 755 490 17 432 081 0 0 0 0 0 NF, PPP and loans from IFI 1 081 733 855 1 887 008 331 1 520 121 040 1 686 265 980 1 713 041 924 1 479 916 851 894 681 368 Total investment 1 476 812 315 2 108 196 384 1 568 082 861 1 686 265 980 1 713 041 924 1 479 916 851 894 681 368 Cumulative investment 12 596 008 609 14 704 204 993 16 272 287 853 17 958 553 833 19 671 595 757 21 151 512 608 22 046 193 976
Total investment – only OP 395 078 460 221 188 052 47 961 821
Cumulative investment 7 397 047 562 7 618 235 614 7 666 197 435
2028 2029 2030 2031 2032 2033 2034 OPT 2007 - 2013 0 0 0 0 0 0 0 OPTTI 2014 - 2020 0 0 0 0 0 0 0 OPRG 2014 - 2020 0 0 0 0 0 0 0 CEF 0 0 0 0 0 0 0 NF, PPP and loans from IFI 391 766 425 522 671 039 487 949 835 487 949 835 487 949 835 597 949 835 496 424 382 Total investment 391 766 425 522 671 039 487 949 835 487 949 835 487 949 835 597 949 835 496 424 382 Cumulative investment 22 437 960 401 22 960 631 440 23 448 581 275 23 936 531 111 24 424 480 946 25 022 430 781 25 518 855 163
Total investment – only OP
Cumulative investment
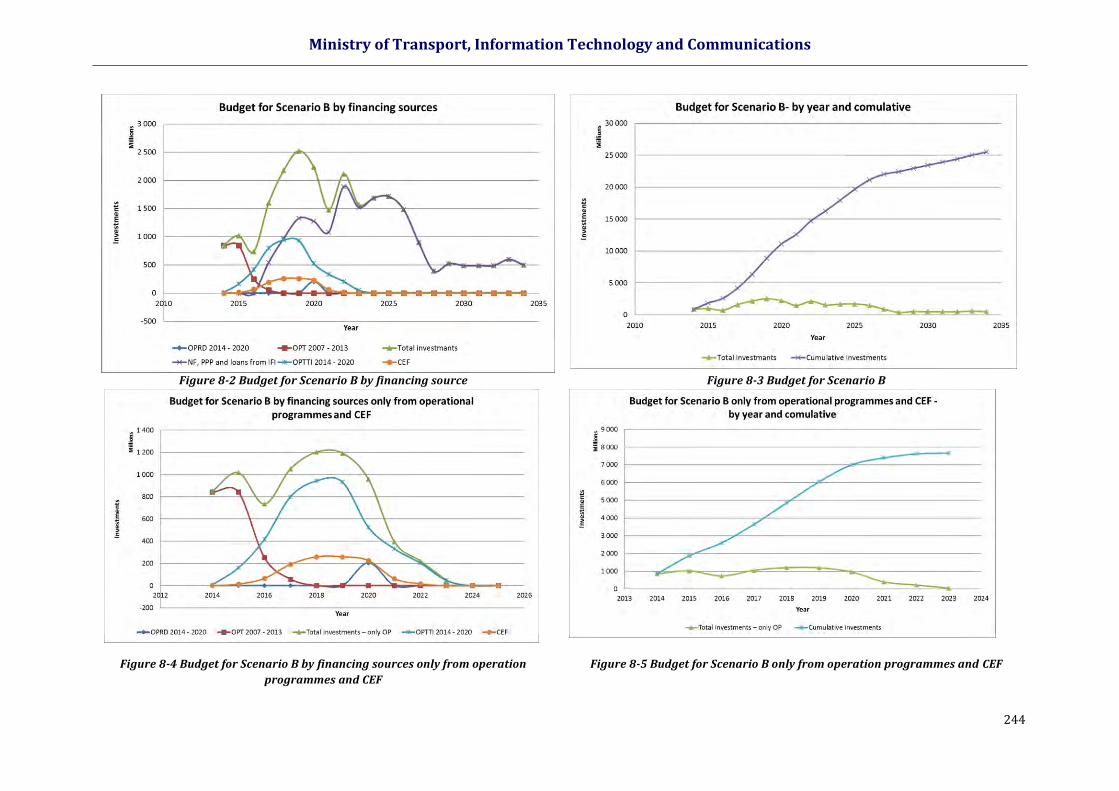
Ministry of Transport, Information Technology and Communications
244
Figure 8-2 Budget for Scenario B by financing source Figure 8-3 Budget for Scenario B
Figure 8-4 Budget for Scenario B by financing sources only from operation
programmes and CEF
Figure 8-5 Budget for Scenario B only from operation programmes and CEF
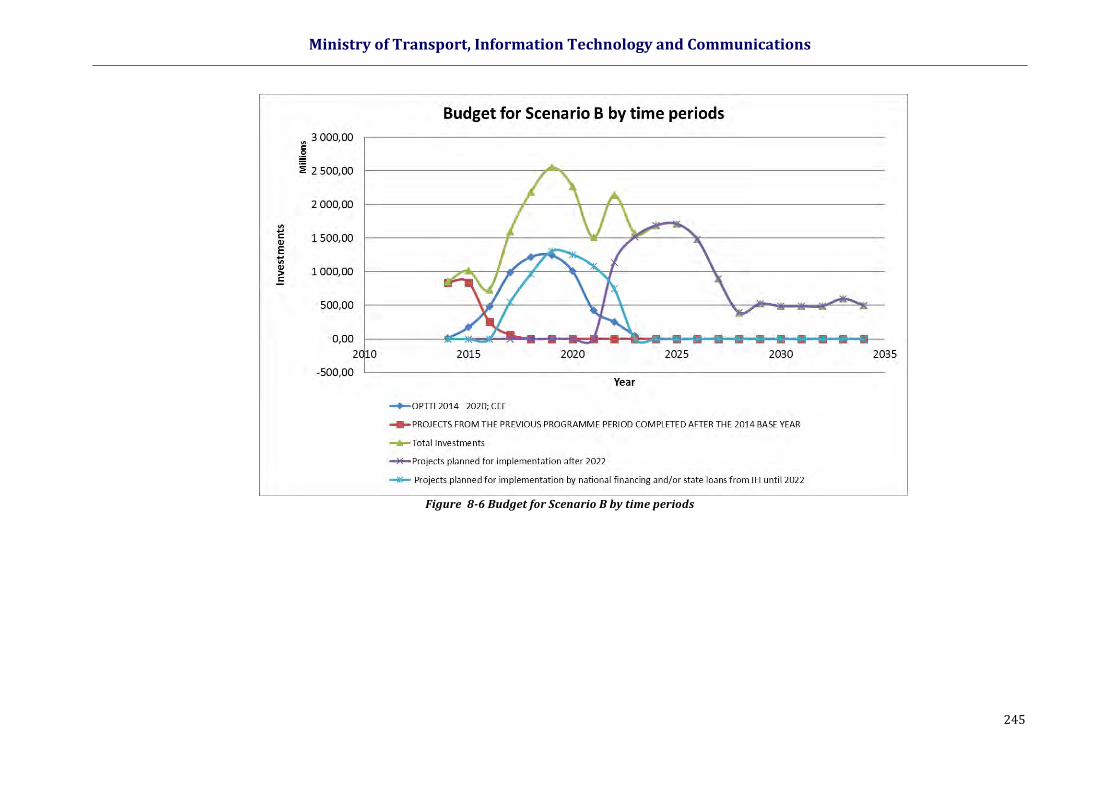
Ministry of Transport, Information Technology and Communications
245
Figure 8-6 Budget for Scenario B by time periods