integrating active traffic and - us department of ... · integrating active traffic and ... 7...
TRANSCRIPT
January 2011International Technology Scanning Program
In cooperatIon wIth:
American Association of State Highway and Transportation Officials
National Cooperative Highway Research Program
SponSored by:
Integrating Active Traffic and Travel Demand Management:
A Holistic Approach to Congestion Management

NOTICE
The Federal Highway Administration (FHWA) provides high-quality information to serve Government, industry, and the public in a manner that promotes public understanding. Standards and policies are used to ensure and maximize the quality, objectivity, utility, and integrity of its information. FHWA periodically reviews quality issues and adjusts its programs and processes to ensure continuous quality improvement.
Integrating Active Traffic and Travel Demand Management: A Holistic Approach to Congestion Management | 1
[ AT M | T D M ]
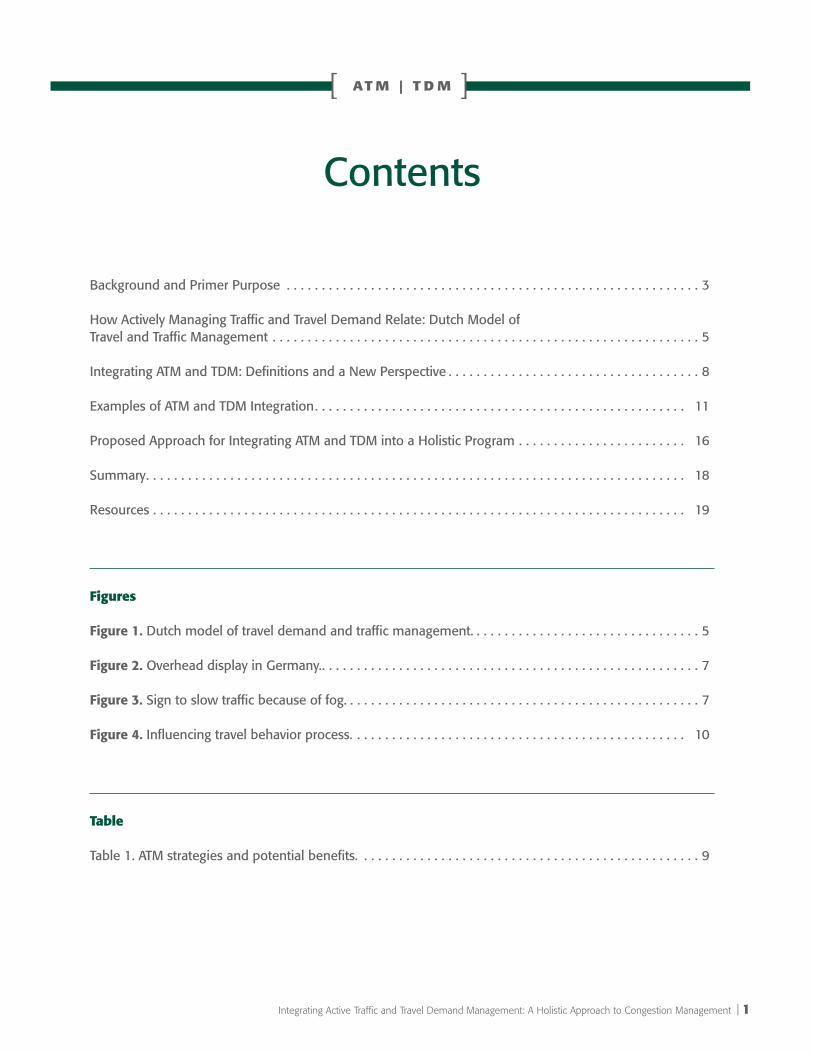
Contents
Background and Primer Purpose . . . . . . . . . . . . . . . . . . . . . . . . . . . . . . . . . . . . . . . . . . . . . . . . . . . . . . . . . . . 3
How Actively Managing Traffic and Travel Demand Relate: Dutch Model of Travel and Traffic Management . . . . . . . . . . . . . . . . . . . . . . . . . . . . . . . . . . . . . . . . . . . . . . . . . . . . . . . . . . . . . 5
Integrating ATM and TDM: Definitions and a New Perspective . . . . . . . . . . . . . . . . . . . . . . . . . . . . . . . . . . . . 8
Examples of ATM and TDM Integration . . . . . . . . . . . . . . . . . . . . . . . . . . . . . . . . . . . . . . . . . . . . . . . . . . . . . 11
Proposed Approach for Integrating ATM and TDM into a Holistic Program . . . . . . . . . . . . . . . . . . . . . . . . 16
Summary . . . . . . . . . . . . . . . . . . . . . . . . . . . . . . . . . . . . . . . . . . . . . . . . . . . . . . . . . . . . . . . . . . . . . . . . . . . . . 18
Resources . . . . . . . . . . . . . . . . . . . . . . . . . . . . . . . . . . . . . . . . . . . . . . . . . . . . . . . . . . . . . . . . . . . . . . . . . . . . 19
Figures
Figure 1. Dutch model of travel demand and traffic management. . . . . . . . . . . . . . . . . . . . . . . . . . . . . . . . . 5
Figure 2. Overhead display in Germany. . . . . . . . . . . . . . . . . . . . . . . . . . . . . . . . . . . . . . . . . . . . . . . . . . . . . . . 7
Figure 3. Sign to slow traffic because of fog. . . . . . . . . . . . . . . . . . . . . . . . . . . . . . . . . . . . . . . . . . . . . . . . . . . 7
Figure 4. Influencing travel behavior process. . . . . . . . . . . . . . . . . . . . . . . . . . . . . . . . . . . . . . . . . . . . . . . . 10
Table
Table 1. ATM strategies and potential benefits. . . . . . . . . . . . . . . . . . . . . . . . . . . . . . . . . . . . . . . . . . . . . . . . . 9
2
[ AT M | T D M ]
Acknowledgments
This primer was prepared by Eric N. Schreffler, transportation consultant at ESTC, for the Federal Highway Administration’s (FHWA) Offices of Transportation Management and International Programs. It draws information and inspiration from two international technology scanning reports on managing travel demand and active traffic management. The author would like to thank FHWA staff who oversaw and reviewed the primer, including Wayne Berman, Allen Greenberg, Greg Jones, Hana Maier, Jon Obenberger, Robert Sheehan, Jessie Yung, and Grant Zammit. Chuck Fuhs, Chris Wellander, and Liz Young of Parsons Brinkerhoff, working on a related report, also provided invaluable input. Organizations that provided information for the case studies in the primer include the California Center for Innovative Transportation, IVV Aachen, Puget Sound Regional Council, Organizational Coaching, United Kingdom Highways Agency, and Washington State Department of Transportation.
Integrating Active Traffic and Travel Demand Management: A Holistic Approach to Congestion Management | 3
[ AT M | T D M ]
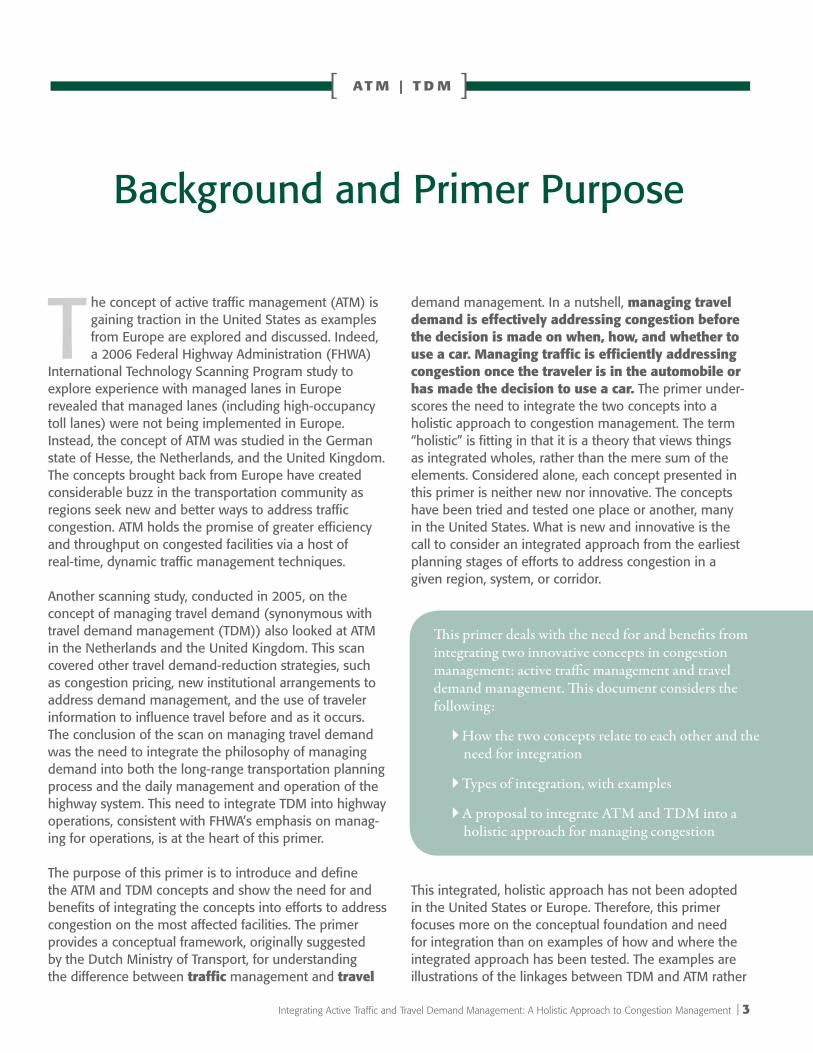
The concept of active traffic management (ATM) is gaining traction in the United States as examples from Europe are explored and discussed. Indeed, a 2006 Federal Highway Administration (FHWA)
International Technology Scanning Program study to explore experience with managed lanes in Europe revealed that managed lanes (including high-occupancy toll lanes) were not being implemented in Europe. Instead, the concept of ATM was studied in the German state of Hesse, the Netherlands, and the United Kingdom. The concepts brought back from Europe have created considerable buzz in the transportation community as regions seek new and better ways to address traffic congestion. ATM holds the promise of greater efficiency and throughput on congested facilities via a host of real-time, dynamic traffic management techniques.
Another scanning study, conducted in 2005, on the concept of managing travel demand (synonymous with travel demand management (TDM)) also looked at ATM in the Netherlands and the United Kingdom. This scan covered other travel demand-reduction strategies, such as congestion pricing, new institutional arrangements to address demand management, and the use of traveler information to influence travel before and as it occurs. The conclusion of the scan on managing travel demand was the need to integrate the philosophy of managing demand into both the long-range transportation planning process and the daily management and operation of the highway system. This need to integrate TDM into highway operations, consistent with FHWA’s emphasis on manag-ing for operations, is at the heart of this primer.
The purpose of this primer is to introduce and define the ATM and TDM concepts and show the need for and benefits of integrating the concepts into efforts to address congestion on the most affected facilities. The primer provides a conceptual framework, originally suggested by the Dutch Ministry of Transport, for understanding the difference between traffic management and travel
demand management. In a nutshell, managing travel demand is effectively addressing congestion before the decision is made on when, how, and whether to use a car. Managing traffic is efficiently addressing congestion once the traveler is in the automobile or has made the decision to use a car. The primer under-scores the need to integrate the two concepts into a holistic approach to congestion management. The term “holistic” is fitting in that it is a theory that views things as integrated wholes, rather than the mere sum of the elements. Considered alone, each concept presented in this primer is neither new nor innovative. The concepts have been tried and tested one place or another, many in the United States. What is new and innovative is the call to consider an integrated approach from the earliest planning stages of efforts to address congestion in a given region, system, or corridor.
This integrated, holistic approach has not been adopted in the United States or Europe. Therefore, this primer focuses more on the conceptual foundation and need for integration than on examples of how and where the integrated approach has been tested. The examples are illustrations of the linkages between TDM and ATM rather
Background and Primer Purpose
This primer deals with the need for and benefits from integrating two innovative concepts in congestion management: active traffic management and travel demand management. This document considers the following:
How the two concepts relate to each other and the `need for integration
Types of integration, with examples `
A proposal to integrate ATM and TDM into a `holistic approach for managing congestion
4
[ AT M | T D M ]
than full case studies on integrated, holistic approaches that have been planned, implemented, and evaluated. The primer does not include extensive discussion of perhaps the most effective demand management strat-egy: congestion pricing. While pricing needs to be a key consideration in any holistic treatment of congestion, it is covered in a more exhaustive manner in the FHWA Congestion Pricing Primer Series (see Resources). Ramp metering and other access controls are hybrid techniques that fall between managing demand and managing traffic. Ramp metering modulates the flow of traffic onto a congested facility, but in general it does not reduce overall demand for car travel during congested periods, which is the focus of TDM.
The primer describes five types of ATM and TDM integration and provides examples of each, drawn from the United States and Europe. The following are the five types of integration:
New partnerships for integrating ATM and TDM `
Enhanced travel alternatives in actively managed `corridors
Incentives to reduce traffic volumes on congested `facilities
Real-time, multimodal traveler information to `induce In-route mode shift
Promotion of TDM at major trip generators in `ATM corridors
Finally, an overall approach for integrating the two concepts is provided. It includes an overview of the integrated demand management under development in the United Kingdom.
Integrating Active Traffic and Travel Demand Management: A Holistic Approach to Congestion Management | 5
[ AT M | T D M ]
At first glance, ATM and TDM appear to be complementary but unrelated concepts. ATM is about efficiently moving vehicles during the most congested times and in the
most congested locations using a host of real-time management techniques, including ramp metering, variable message signs, speed harmonization, and even use of the hard shoulder as an auxiliary lane. TDM, at least traditionally, is about getting commuters to use alternatives to driving alone to work. ATM works with the congested facility to move vehicles most
efficiently. TDM works with employees, employers, and others to shift commute modes of commuters.
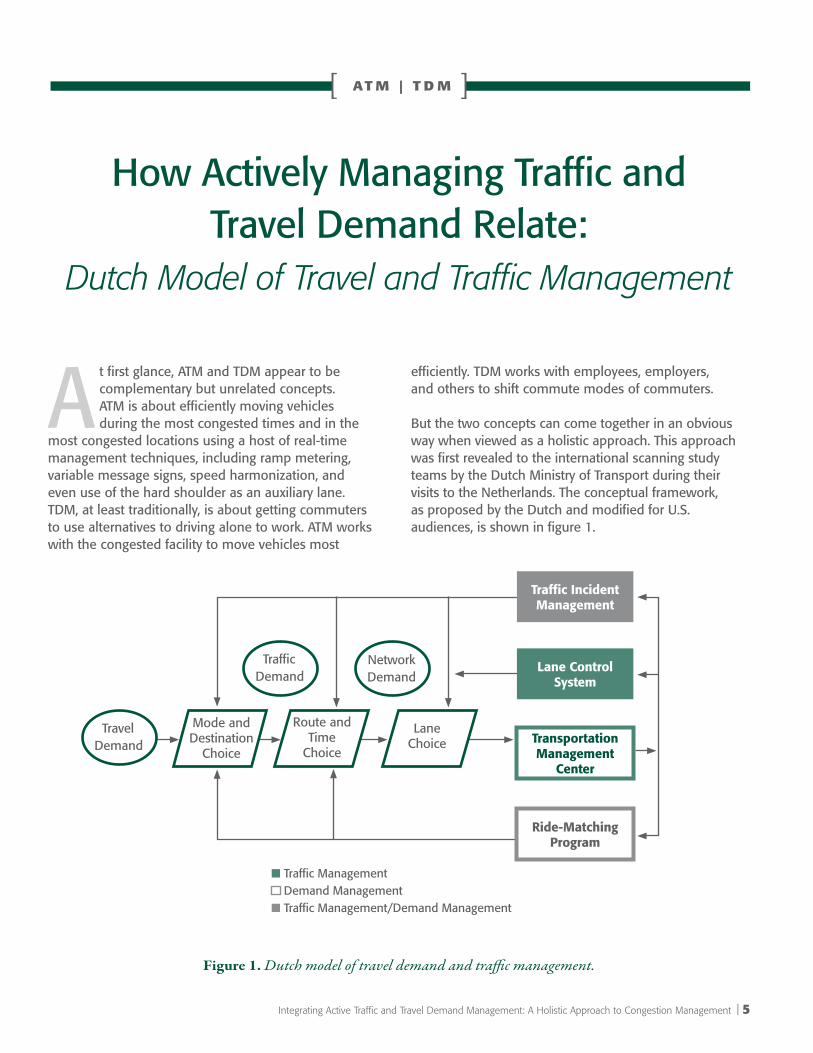
But the two concepts can come together in an obvious way when viewed as a holistic approach. This approach was first revealed to the international scanning study teams by the Dutch Ministry of Transport during their visits to the Netherlands. The conceptual framework, as proposed by the Dutch and modified for U.S. audiences, is shown in figure 1.
How Actively Managing Traffic and Travel Demand Relate:
Dutch Model of Travel and Traffic Management
Figure 1. Dutch model of travel demand and traffic management.
n Traffic Management Demand Management
n Traffic Management/Demand Management
traffic Incident Management
Lane control System
transportation Management
center
ride-Matching program
TravelDemand
TrafficDemand
NetworkDemand
Route and Time
Choice
Lane Choice
Mode and Destination
Choice
[ AT M | T D M ]
At the heart of the conceptual framework is the need to understand the difference between travel demand man-agement and traffic management. In its most rudimentary form, travel demand management seeks to influence travelers before the decision on whether and how to use the car is made and traffic management seeks to manage vehicles once these decisions are made.
Figure 1 shows the need to integrate travel demand and traffic management into a larger framework of travel choices and congestion-reduction techniques. These
choices begin with consideration of overall travel demand and work their way through traffic demand and network demand. The strategies shown on the right side of the figure are not exhaustive and are meant to illustrate the kinds of strategies that focus on traffic management, travel demand management, or both. The transportation management center often serves as the coordinator among strategies. However, the key to the illustration is that it shows differences between types of demand and how offering choices can influence these demands. Each set of demands and choices is discussed below.
STAgE ONE: Travel Demand and Mode and Location Choice
This overall demand can be modulated by influencing travelers’ choices on whether to travel, which mode to use (car or other mode), and where to travel (destina-tion). Many techniques can be applied at this stage of the framework to reduce overall travel demand by car. This might include incentives to use higher occupancy modes (e.g., carpool, vanpool, transit) or nonmotorized modes (bicycling, walking). It might include programs to encour-age working or shopping at home (addressing whether to travel) or to reduce trip lengths or overall vehicle miles of travel (by combining trips or shopping or working closer to home). Of course, congestion pricing has been proven as an effective means to reduce travel demand by inducing mode shift and reducing peak travel overall.
This stage involves influencing travel demand before the decision to drive (particularly alone) is made. Measures to influence travel mode and destination have the ability to reduce overall traffic volumes on the highway network and, when properly targeted, can reduce traffic volumes on key congested facilities during critical times of the day. The success of TDM initiatives, implemented during and as an integral part of highway reconstruction projects, provides solid evidence of the ability to manage traffic demand to reduce overall traffic volumes.
STAgE TwO: Traffic Demand and Route and Time Choice
Once the amount of vehicle traffic demand is known, traffic can be influenced before it impacts the congested
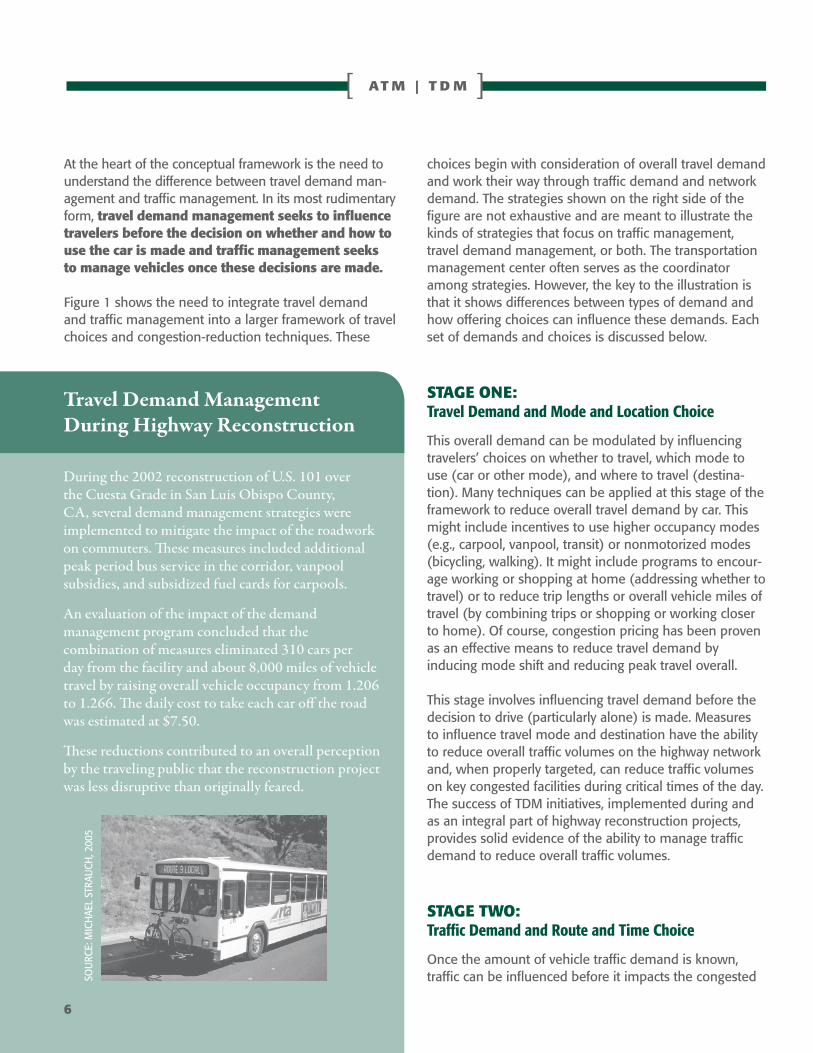
Travel Demand Management During Highway Reconstruction
During the 2002 reconstruction of U.S. 101 over the Cuesta Grade in San Luis Obispo County, CA, several demand management strategies were implemented to mitigate the impact of the roadwork on commuters. These measures included additional peak period bus service in the corridor, vanpool subsidies, and subsidized fuel cards for carpools.
An evaluation of the impact of the demand management program concluded that the combination of measures eliminated 310 cars per day from the facility and about 8,000 miles of vehicle travel by raising overall vehicle occupancy from 1.206 to 1.266. The daily cost to take each car off the road was estimated at $7.50.
These reductions contributed to an overall perception by the traveling public that the reconstruction project was less disruptive than originally feared.
6
SOU
RCE:
MIC
HAE
L ST
RAU
CH, 2
005
Integrating Active Traffic and Travel Demand Management: A Holistic Approach to Congestion Management | 7
[ AT M | T D M ]
corridor and/or time period. This is primarily via measures to influence time and route choice. In other words, once travelers have decided to use their cars, can they be influenced to change the time of day they travel to avoid the most congested period, or can they be encouraged to seek alternate routes that might be less congested? These choices can also reduce the volume of vehicles using and impacting congested facilities—those facilities that might be most ripe for active traffic management. Congestion pricing can also influence the time of day or route that a commuter or other traveler chooses. Most high- occupancy toll lane projects in the United States increase the price of using the facility based on time of day and/or congestion levels. This has the impact of moving travelers to the shoulders of the peak period or even creating a route or mode shift to parallel facilities or to public transit or other less costly modes, such as carpooling.
STAgE ThrEE: Network Demand and Lane Choice
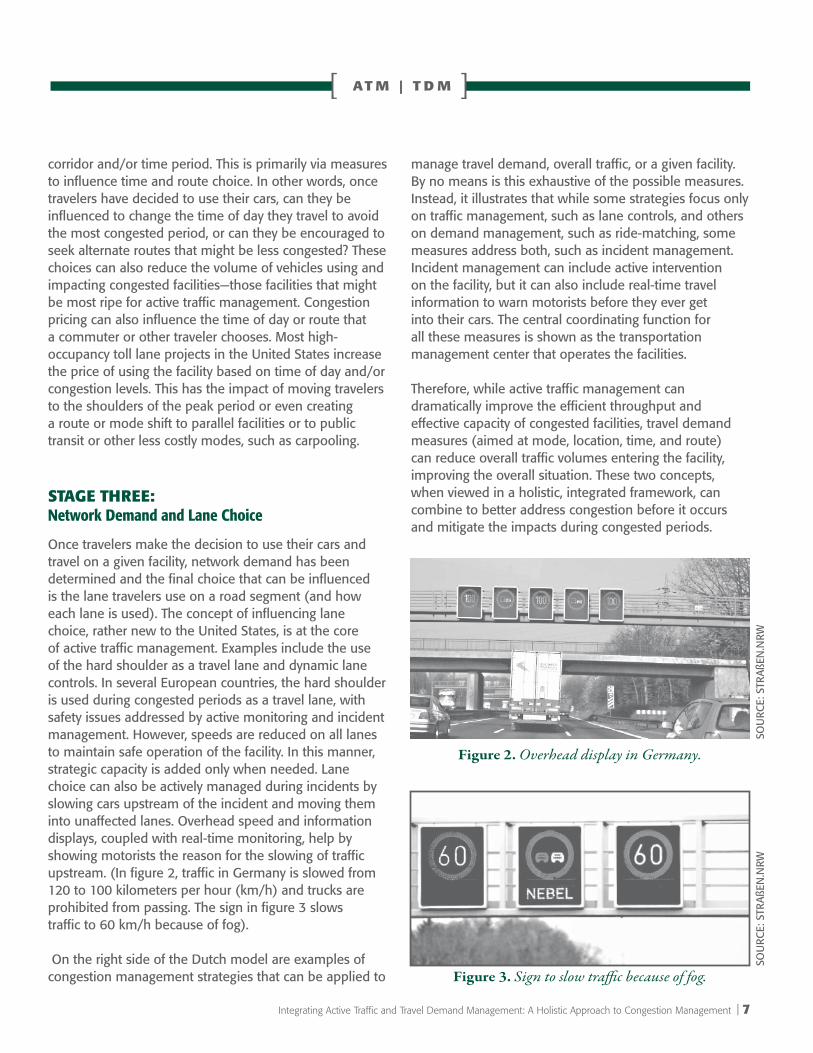
Once travelers make the decision to use their cars and travel on a given facility, network demand has been determined and the final choice that can be influenced is the lane travelers use on a road segment (and how each lane is used). The concept of influencing lane choice, rather new to the United States, is at the core of active traffic management. Examples include the use of the hard shoulder as a travel lane and dynamic lane controls. In several European countries, the hard shoulder is used during congested periods as a travel lane, with safety issues addressed by active monitoring and incident management. However, speeds are reduced on all lanes to maintain safe operation of the facility. In this manner, strategic capacity is added only when needed. Lane choice can also be actively managed during incidents by slowing cars upstream of the incident and moving them into unaffected lanes. Overhead speed and information displays, coupled with real-time monitoring, help by showing motorists the reason for the slowing of traffic upstream. (In figure 2, traffic in Germany is slowed from 120 to 100 kilometers per hour (km/h) and trucks are prohibited from passing. The sign in figure 3 slows traffic to 60 km/h because of fog).
On the right side of the Dutch model are examples of congestion management strategies that can be applied to
manage travel demand, overall traffic, or a given facility. By no means is this exhaustive of the possible measures. Instead, it illustrates that while some strategies focus only on traffic management, such as lane controls, and others on demand management, such as ride-matching, some measures address both, such as incident management. Incident management can include active intervention on the facility, but it can also include real-time travel information to warn motorists before they ever get into their cars. The central coordinating function for all these measures is shown as the transportation management center that operates the facilities.
Therefore, while active traffic management can dramatically improve the efficient throughput and effective capacity of congested facilities, travel demand measures (aimed at mode, location, time, and route) can reduce overall traffic volumes entering the facility, improving the overall situation. These two concepts, when viewed in a holistic, integrated framework, can combine to better address congestion before it occurs and mitigate the impacts during congested periods.
Figure 3. Sign to slow traffic because of fog.
Figure 2. Overhead display in Germany.SO
URC
E: S
TRAß
EN.N
RWSO
URC
E: S
TRAß
EN.N
RW
8
[ AT M | T D M ]
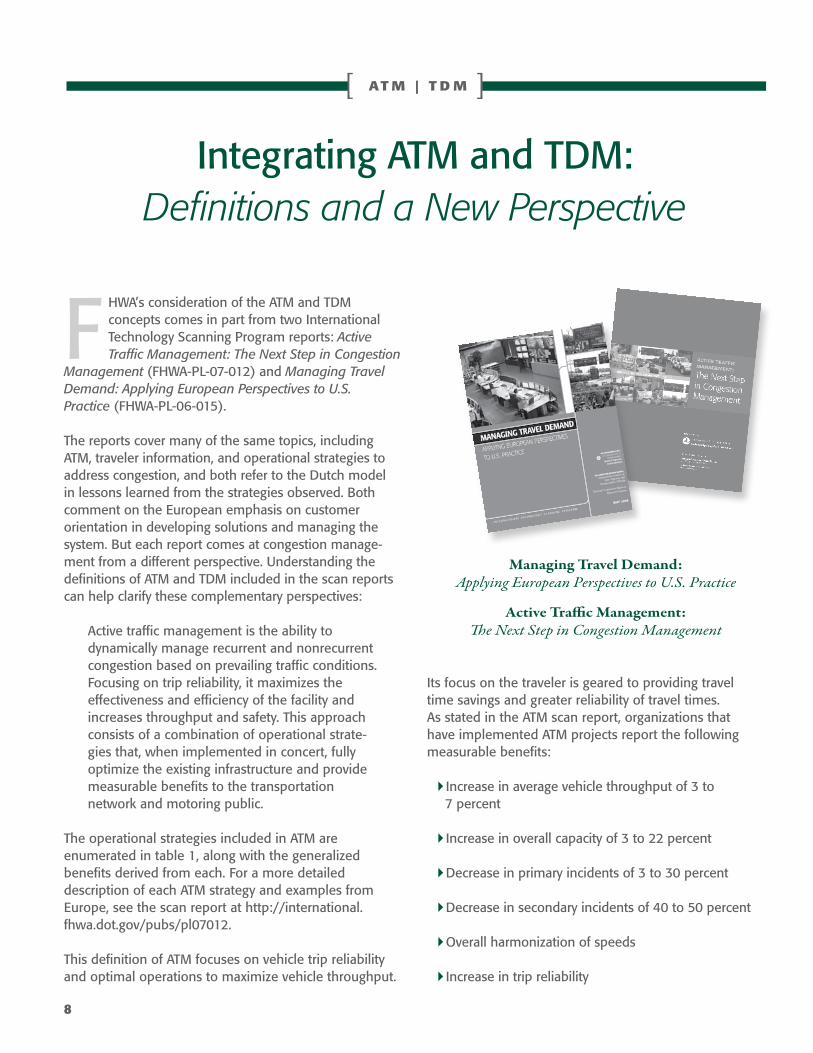
F HWA’s consideration of the ATM and TDM concepts comes in part from two International Technology Scanning Program reports: Active Traffic Management: The Next Step in Congestion
Management (FHWA-PL-07-012) and Managing Travel Demand: Applying European Perspectives to U.S. Practice (FHWA-PL-06-015).
The reports cover many of the same topics, including ATM, traveler information, and operational strategies to address congestion, and both refer to the Dutch model in lessons learned from the strategies observed. Both comment on the European emphasis on customer orientation in developing solutions and managing the system. But each report comes at congestion manage-ment from a different perspective. Understanding the definitions of ATM and TDM included in the scan reports can help clarify these complementary perspectives:
Active traffic management is the ability to dynamically manage recurrent and nonrecurrent congestion based on prevailing traffic conditions. Focusing on trip reliability, it maximizes the effectiveness and efficiency of the facility and increases throughput and safety. This approach consists of a combination of operational strate-gies that, when implemented in concert, fully optimize the existing infrastructure and provide measurable benefits to the transportation network and motoring public.
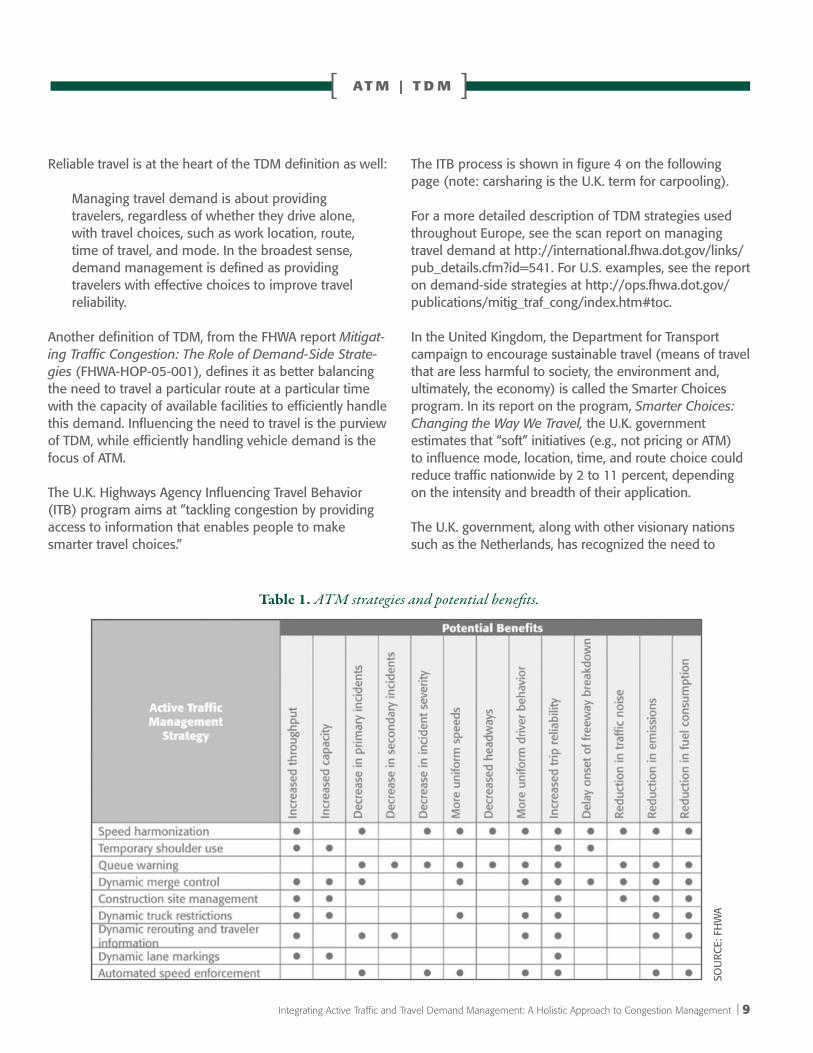
The operational strategies included in ATM are enumerated in table 1, along with the generalized benefits derived from each. For a more detailed description of each ATM strategy and examples from Europe, see the scan report at http://international. fhwa.dot.gov/pubs/pl07012.
This definition of ATM focuses on vehicle trip reliability and optimal operations to maximize vehicle throughput.
Its focus on the traveler is geared to providing travel time savings and greater reliability of travel times. As stated in the ATM scan report, organizations that have implemented ATM projects report the following measurable benefits:
Increase in average vehicle throughput of 3 to `7 percent
Increase in overall capacity of 3 to 22 percent `
Decrease in primary incidents of 3 to 30 percent `
Decrease in secondary incidents of 40 to 50 percent `
Overall harmonization of speeds `
Increase in trip reliability `
Integrating ATM and TDM: Definitions and a New Perspective
Managing Travel Demand: Applying European Perspectives to U.S. Practice
Active Traffic Management: The Next Step in Congestion Management
Integrating Active Traffic and Travel Demand Management: A Holistic Approach to Congestion Management | 9
[ AT M | T D M ]
Reliable travel is at the heart of the TDM definition as well:
Managing travel demand is about providing travelers, regardless of whether they drive alone, with travel choices, such as work location, route, time of travel, and mode. In the broadest sense, demand management is defined as providing travelers with effective choices to improve travel reliability.
Another definition of TDM, from the FHWA report Mitigat-ing Traffic Congestion: The Role of Demand-Side Strate-gies (FHWA-HOP-05-001), defines it as better balancing the need to travel a particular route at a particular time with the capacity of available facilities to efficiently handle this demand. Influencing the need to travel is the purview of TDM, while efficiently handling vehicle demand is the focus of ATM.
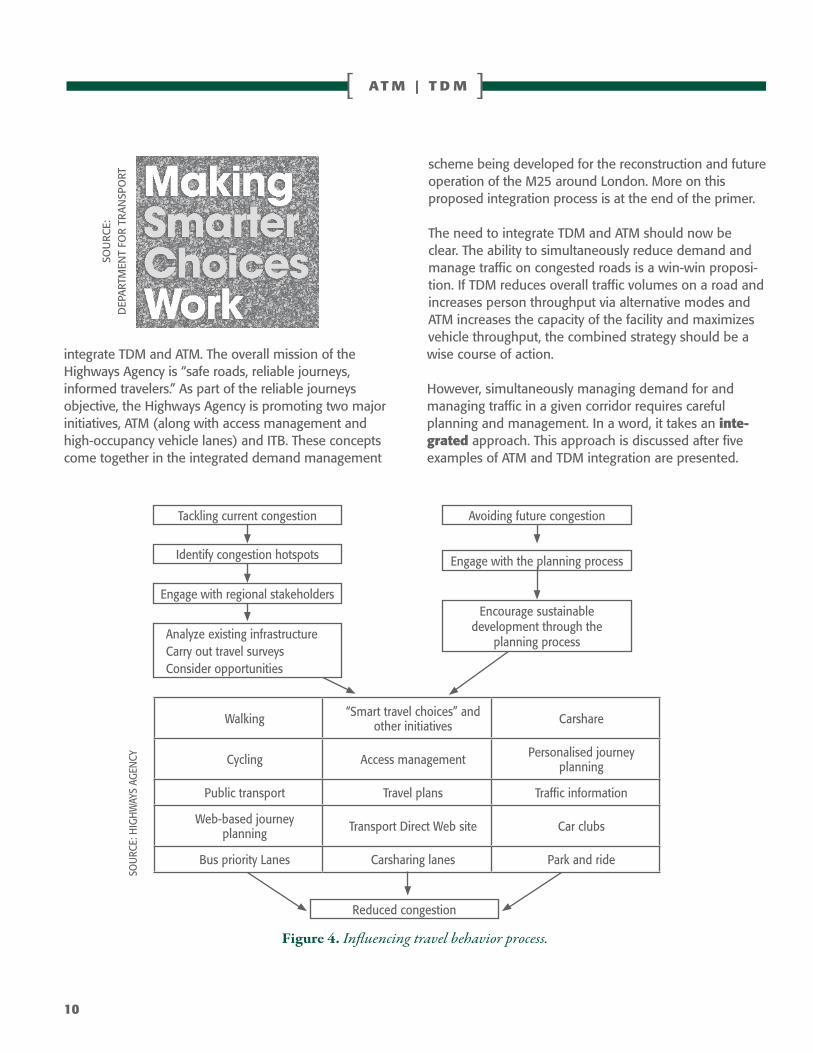
The U.K. Highways Agency Influencing Travel Behavior (ITB) program aims at ”tackling congestion by providing access to information that enables people to make smarter travel choices.”
The ITB process is shown in figure 4 on the following page (note: carsharing is the U.K. term for carpooling).
For a more detailed description of TDM strategies used throughout Europe, see the scan report on managing travel demand at http://international.fhwa.dot.gov/links/pub_details.cfm?id=541. For U.S. examples, see the report on demand-side strategies at http://ops.fhwa.dot.gov/publications/mitig_traf_cong/index.htm#toc.
In the United Kingdom, the Department for Transport campaign to encourage sustainable travel (means of travel that are less harmful to society, the environment and, ultimately, the economy) is called the Smarter Choices program. In its report on the program, Smarter Choices: Changing the Way We Travel, the U.K. government estimates that “soft” initiatives (e.g., not pricing or ATM) to influence mode, location, time, and route choice could reduce traffic nationwide by 2 to 11 percent, depending on the intensity and breadth of their application.
The U.K. government, along with other visionary nations such as the Netherlands, has recognized the need to
Table 1. ATM strategies and potential benefits.
SOU
RCE:
FH
WA
10
[ AT M | T D M ]
integrate TDM and ATM. The overall mission of the Highways Agency is “safe roads, reliable journeys, informed travelers.” As part of the reliable journeys objective, the Highways Agency is promoting two major initiatives, ATM (along with access management and high-occupancy vehicle lanes) and ITB. These concepts come together in the integrated demand management
scheme being developed for the reconstruction and future operation of the M25 around London. More on this proposed integration process is at the end of the primer.
The need to integrate TDM and ATM should now be clear. The ability to simultaneously reduce demand and manage traffic on congested roads is a win-win proposi-tion. If TDM reduces overall traffic volumes on a road and increases person throughput via alternative modes and ATM increases the capacity of the facility and maximizes vehicle throughput, the combined strategy should be a wise course of action.
However, simultaneously managing demand for and managing traffic in a given corridor requires careful planning and management. In a word, it takes an inte-grated approach. This approach is discussed after five examples of ATM and TDM integration are presented.
Figure 4. Influencing travel behavior process.
SOU
RCE:
HIG
HW
AYS
AGEN
CY
SOU
RCE:
D
EPAR
TMEN
T FO
R TR
ANSP
ORT
Avoiding future congestion
Engage with the planning process
Encourage sustainable development through the
planning process
Tackling current congestion
Identify congestion hotspots
Engage with regional stakeholders
Analyze existing infrastructureCarry out travel surveysConsider opportunities
Walking “Smart travel choices” and other initiatives Carshare
Cycling Access management Personalised journey planning
Public transport Travel plans Traffic information
Web-based journey planning Transport Direct Web site Car clubs
Bus priority Lanes Carsharing lanes Park and ride
Reduced congestion
Integrating Active Traffic and Travel Demand Management: A Holistic Approach to Congestion Management | 11
[ AT M | T D M ]
New Partnerships for Integrating ATM and TDM in Congested Areas
Because the organizations that plan and manage demand management strategies are often different from those that manage traffic in a given corridor or area, new partnerships—or at least a new coordination mechanism—may be needed to proactively integrate the concepts into one program. In the United States, it is often the metro-politan planning organizations, municipalities, or special purpose entities that manage TDM programs and initia-
tives. State departments of transportation operate the highway system, including managing day-to-day traffic. A third set of players is service providers, such as transit operators or traveler information vendors.
An example from the Netherlands shows an innovative partnership between government and business and among various components of government to maintain accessibility in The Hague/Rotterdam region, a congested area vital to the regional, national, and pan-European economy.
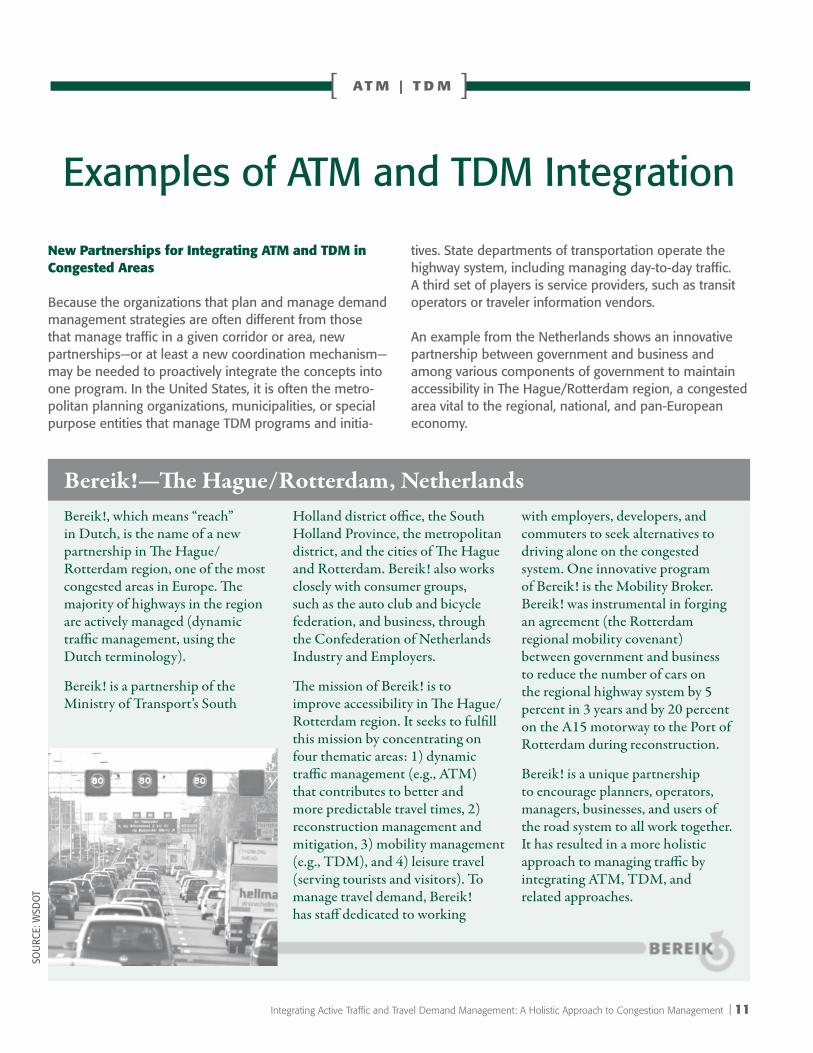
Bereik!, which means “reach” in Dutch, is the name of a new partnership in The Hague/Rotterdam region, one of the most congested areas in Europe. The majority of highways in the region are actively managed (dynamic traffic management, using the Dutch terminology).
Bereik! is a partnership of the Ministry of Transport’s South
Holland district office, the South Holland Province, the metropolitan district, and the cities of The Hague and Rotterdam. Bereik! also works closely with consumer groups, such as the auto club and bicycle federation, and business, through the Confederation of Netherlands Industry and Employers.
The mission of Bereik! is to improve accessibility in The Hague/Rotterdam region. It seeks to fulfill this mission by concentrating on four thematic areas: 1) dynamic traffic management (e.g., ATM) that contributes to better and more predictable travel times, 2) reconstruction management and mitigation, 3) mobility management (e.g., TDM), and 4) leisure travel (serving tourists and visitors). To manage travel demand, Bereik! has staff dedicated to working
with employers, developers, and commuters to seek alternatives to driving alone on the congested system. One innovative program of Bereik! is the Mobility Broker. Bereik! was instrumental in forging an agreement (the Rotterdam regional mobility covenant) between government and business to reduce the number of cars on the regional highway system by 5 percent in 3 years and by 20 percent on the A15 motorway to the Port of Rotterdam during reconstruction.
Bereik! is a unique partnership to encourage planners, operators, managers, businesses, and users of the road system to all work together. It has resulted in a more holistic approach to managing traffic by integrating ATM, TDM, and related approaches.
Examples of ATM and TDM Integration
Bereik!—The Hague/Rotterdam, Netherlands
SOU
RCE:
WSD
OT
12
[ AT M | T D M ]
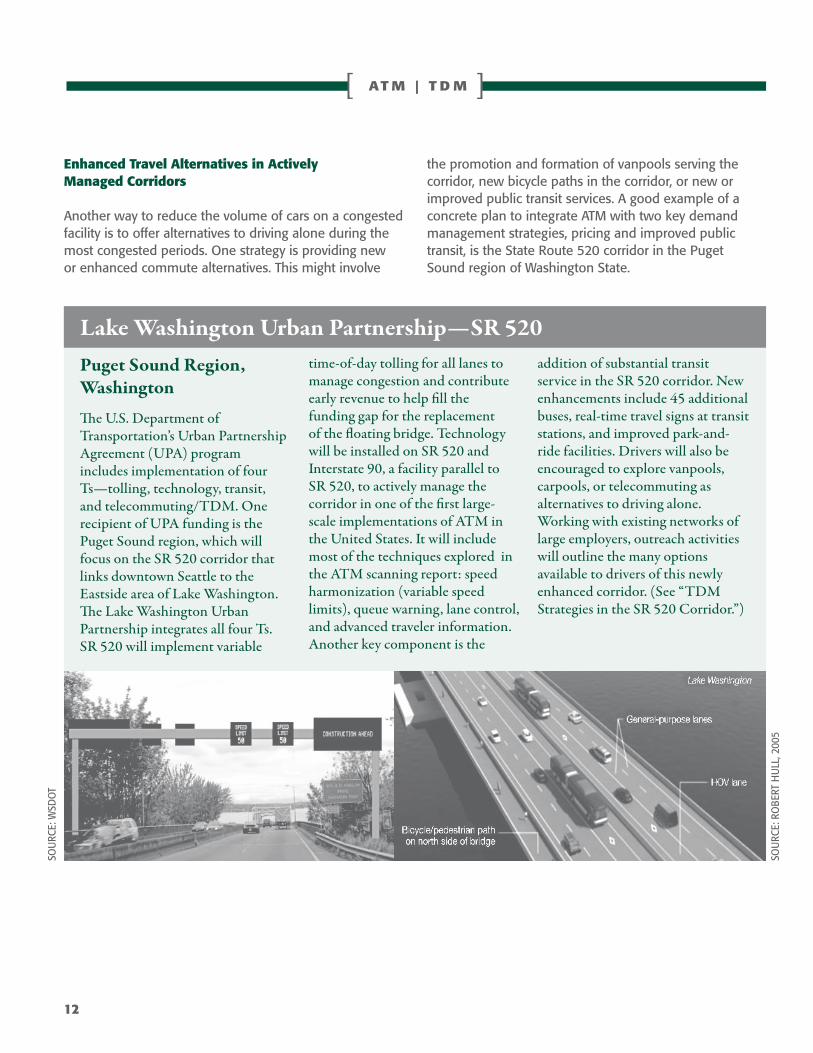
Enhanced Travel Alternatives in Actively Managed Corridors
Another way to reduce the volume of cars on a congested facility is to offer alternatives to driving alone during the most congested periods. One strategy is providing new or enhanced commute alternatives. This might involve
the promotion and formation of vanpools serving the corridor, new bicycle paths in the corridor, or new or improved public transit services. A good example of a concrete plan to integrate ATM with two key demand management strategies, pricing and improved public transit, is the State Route 520 corridor in the Puget Sound region of Washington State.
Puget Sound Region, Washington
The U.S. Department of Transportation’s Urban Partnership Agreement (UPA) program includes implementation of four Ts—tolling, technology, transit, and telecommuting/TDM. One recipient of UPA funding is the Puget Sound region, which will focus on the SR 520 corridor that links downtown Seattle to the Eastside area of Lake Washington. The Lake Washington Urban Partnership integrates all four Ts. SR 520 will implement variable
time-of-day tolling for all lanes to manage congestion and contribute early revenue to help fill the funding gap for the replacement of the floating bridge. Technology will be installed on SR 520 and Interstate 90, a facility parallel to SR 520, to actively manage the corridor in one of the first large-scale implementations of ATM in the United States. It will include most of the techniques explored in the ATM scanning report: speed harmonization (variable speed limits), queue warning, lane control, and advanced traveler information. Another key component is the
addition of substantial transit service in the SR 520 corridor. New enhancements include 45 additional buses, real-time travel signs at transit stations, and improved park-and-ride facilities. Drivers will also be encouraged to explore vanpools, carpools, or telecommuting as alternatives to driving alone. Working with existing networks of large employers, outreach activities will outline the many options available to drivers of this newly enhanced corridor. (See “TDM Strategies in the SR 520 Corridor.”)
SOU
RCE:
RO
BERT
HU
LL, 2
005
SOU
RCE:
WSD
OT
Lake Washington Urban Partnership—SR 520
Integrating Active Traffic and Travel Demand Management: A Holistic Approach to Congestion Management | 13
[ AT M | T D M ]
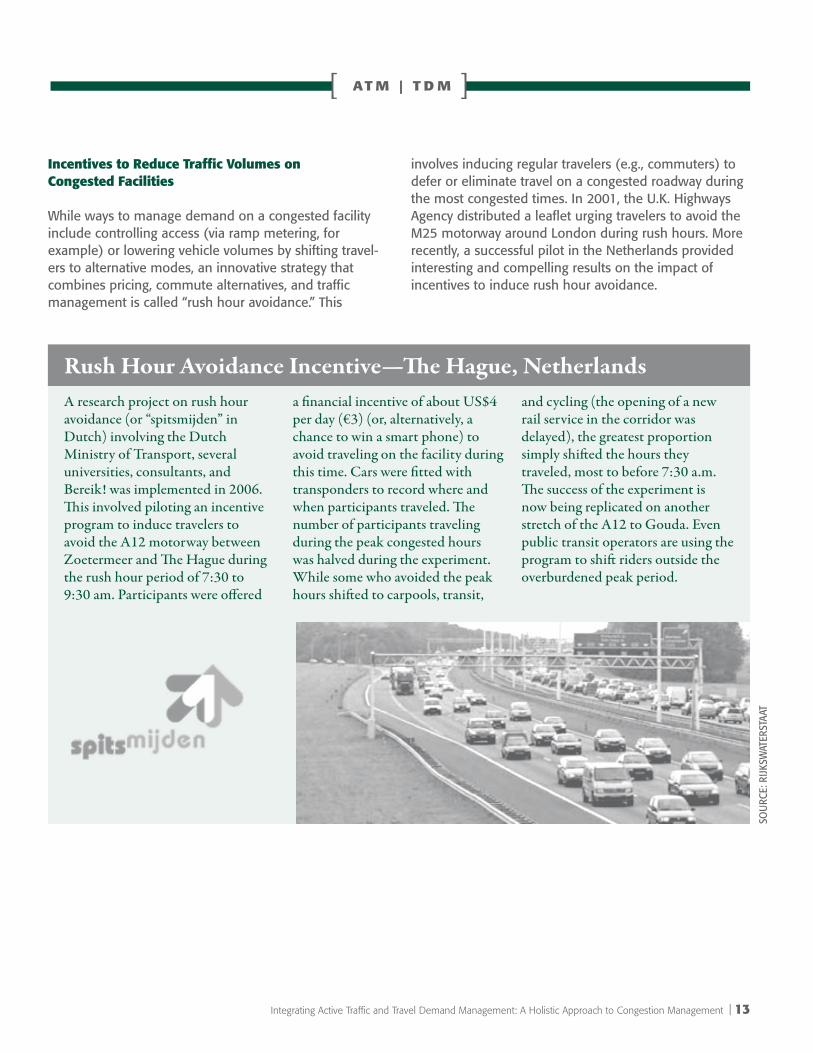
Incentives to reduce Traffic Volumes on Congested Facilities
While ways to manage demand on a congested facility include controlling access (via ramp metering, for example) or lowering vehicle volumes by shifting travel-ers to alternative modes, an innovative strategy that combines pricing, commute alternatives, and traffic management is called “rush hour avoidance.” This
involves inducing regular travelers (e.g., commuters) to defer or eliminate travel on a congested roadway during the most congested times. In 2001, the U.K. Highways Agency distributed a leaflet urging travelers to avoid the M25 motorway around London during rush hours. More recently, a successful pilot in the Netherlands provided interesting and compelling results on the impact of incentives to induce rush hour avoidance.
A research project on rush hour avoidance (or “spitsmijden” in Dutch) involving the Dutch Ministry of Transport, several universities, consultants, and Bereik! was implemented in 2006. This involved piloting an incentive program to induce travelers to avoid the A12 motorway between Zoetermeer and The Hague during the rush hour period of 7:30 to 9:30 am. Participants were offered
a financial incentive of about US$4 per day (€3) (or, alternatively, a chance to win a smart phone) to avoid traveling on the facility during this time. Cars were fitted with transponders to record where and when participants traveled. The number of participants traveling during the peak congested hours was halved during the experiment. While some who avoided the peak hours shifted to carpools, transit,
and cycling (the opening of a new rail service in the corridor was delayed), the greatest proportion simply shifted the hours they traveled, most to before 7:30 a.m. The success of the experiment is now being replicated on another stretch of the A12 to Gouda. Even public transit operators are using the program to shift riders outside the overburdened peak period.
Rush Hour Avoidance Incentive—The Hague, Netherlands
SOU
RCE:
RIJK
SWAT
ERST
AAT
14
[ AT M | T D M ]
real-Time Multimodal Traveler Information to Induce In-route Mode Shift
Good traveler information can have many impacts on travel decisions, including mode, location, route, and time choices. The FHWA primer Managing Demand Through Travel Information Services (FHWA-HOP-05-005) is a useful source for details and U.S. case studies. Traveler
information can be delivered pretrip, near-trip, or on-trip. Pretrip information can induce travelers to use transit or bicycles for a particular trip. Near-trip information can influence the time of travel or routing. Predicted travel times can help travelers schedule activities for less congested periods. On-trip (en route) information can influence travel route (diversion around incidents or backups) or even en route mode choice.
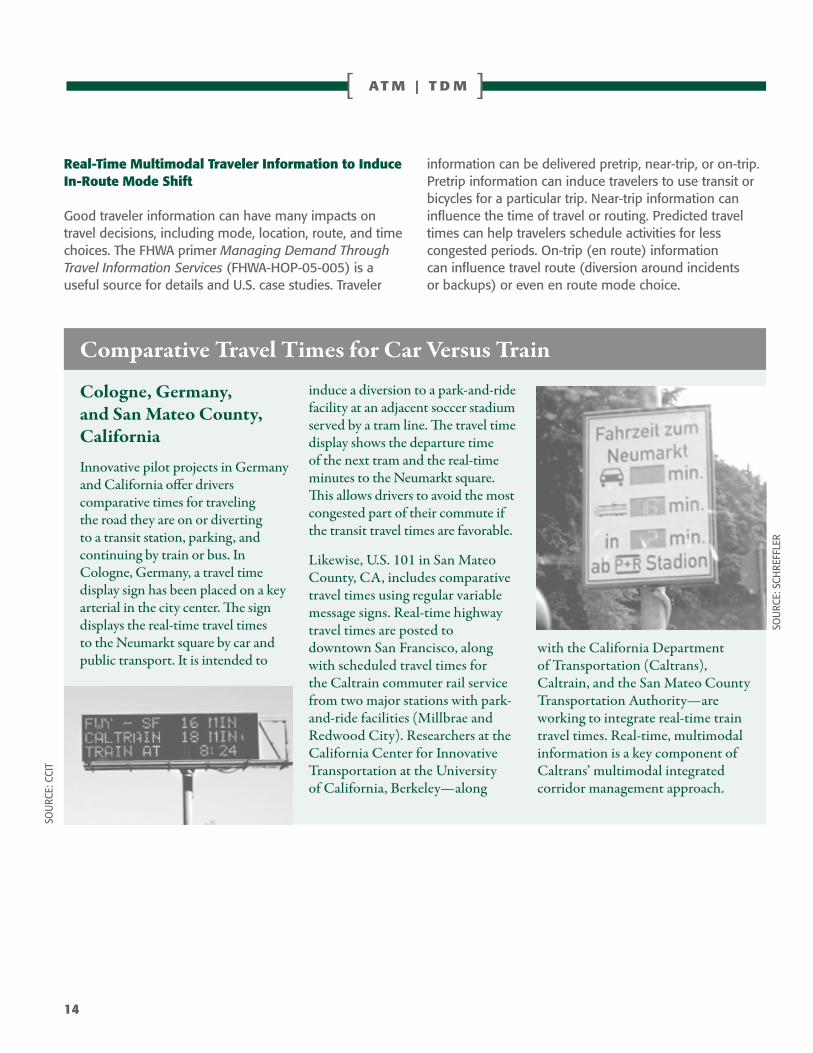
Cologne, Germany, and San Mateo County, California
Innovative pilot projects in Germany and California offer drivers comparative times for traveling the road they are on or diverting to a transit station, parking, and continuing by train or bus. In Cologne, Germany, a travel time display sign has been placed on a key arterial in the city center. The sign displays the real-time travel times to the Neumarkt square by car and public transport. It is intended to
induce a diversion to a park-and-ride facility at an adjacent soccer stadium served by a tram line. The travel time display shows the departure time of the next tram and the real-time minutes to the Neumarkt square. This allows drivers to avoid the most congested part of their commute if the transit travel times are favorable.
Likewise, U.S. 101 in San Mateo County, CA, includes comparative travel times using regular variable message signs. Real-time highway travel times are posted to downtown San Francisco, along with scheduled travel times for the Caltrain commuter rail service from two major stations with park-and-ride facilities (Millbrae and Redwood City). Researchers at the California Center for Innovative Transportation at the University of California, Berkeley—along
with the California Department of Transportation (Caltrans), Caltrain, and the San Mateo County Transportation Authority—are working to integrate real-time train travel times. Real-time, multimodal information is a key component of Caltrans’ multimodal integrated corridor management approach.
SOU
RCE:
CCI
T
SOU
RCE:
SCH
REFF
LER
Comparative Travel Times for Car Versus Train
Integrating Active Traffic and Travel Demand Management: A Holistic Approach to Congestion Management | 15
[ AT M | T D M ]
Promotion of TDM at Major Trip generators
Another way to reduce overall vehicle volumes on a congested facility is to work with large trip generators, such as large employers, business parks, sporting and entertainment venues, recreation sites, shopping centers, and even residential areas. These trip reduction programs can target employees and visitors of these sites who use the congested facility regularly.
The Lake Washington Urban Partnership, planned for SR 520 in the Puget Sound region, provides an example of a proposed integrated approach to managing demand at trip generators while actively managing traffic on the adjacent facility.
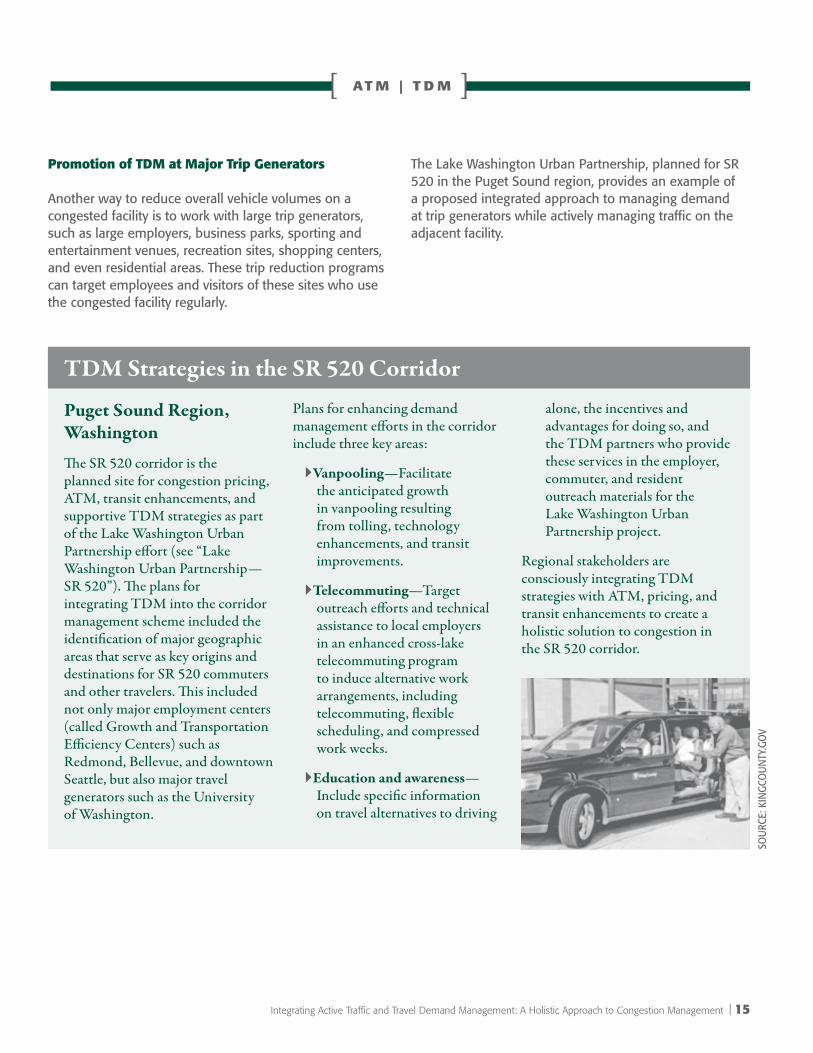
Puget Sound Region, Washington
The SR 520 corridor is the planned site for congestion pricing, ATM, transit enhancements, and supportive TDM strategies as part of the Lake Washington Urban Partnership effort (see “Lake Washington Urban Partnership—SR 520”). The plans for integrating TDM into the corridor management scheme included the identification of major geographic areas that serve as key origins and destinations for SR 520 commuters and other travelers. This included not only major employment centers (called Growth and Transportation Efficiency Centers) such as Redmond, Bellevue, and downtown Seattle, but also major travel generators such as the University of Washington.
Plans for enhancing demand management efforts in the corridor include three key areas:
`Vanpooling—Facilitate the anticipated growth in vanpooling resulting from tolling, technology enhancements, and transit improvements.
`Telecommuting—Target outreach efforts and technical assistance to local employers in an enhanced cross-lake telecommuting program to induce alternative work arrangements, including telecommuting, flexible scheduling, and compressed work weeks.
`Education and awareness—Include specific information on travel alternatives to driving
alone, the incentives and advantages for doing so, and the TDM partners who provide these services in the employer, commuter, and resident outreach materials for the Lake Washington Urban Partnership project.
Regional stakeholders are consciously integrating TDM strategies with ATM, pricing, and transit enhancements to create a holistic solution to congestion in the SR 520 corridor.
SOU
RCE:
KIN
GCO
UN
TY.G
OV
TDM Strategies in the SR 520 Corridor
[ AT M | T D M ]
As the introduction states, the United States and Europe currently have no examples of a truly integrated approach to ATM and TDM with
concrete results. This is largely because of the relative newness of ATM, the perceived lack of solid evidence on TDM, and the absence of comprehensive examples of integration. However, experience from the European scanning studies coupled with a review of the examples included in this primer suggest several components that should be present to effectively integrate ATM and TDM into a holistic solution to congestion on a given corridor:
A policy framework that equally embraces `both categories of strategies, ATM and TDM
A customer orientation that focuses on `travelers as much as their cars
Flexible funding and project selection `criteria that are not biased toward one solution or strategy
Forethought and planning on how to `integrate, fund, implement, operate, monitor, evaluate, and adjust the integrated program
A careful understanding of the varied `traveler markets that use the congested facility and that can be targeted by various TDM and ATM strategies
Specific but related performance targets `on realistic demand reduction and efficiency improvements
Proposed Approach for Integrating ATM and TDM Into a Holistic Program
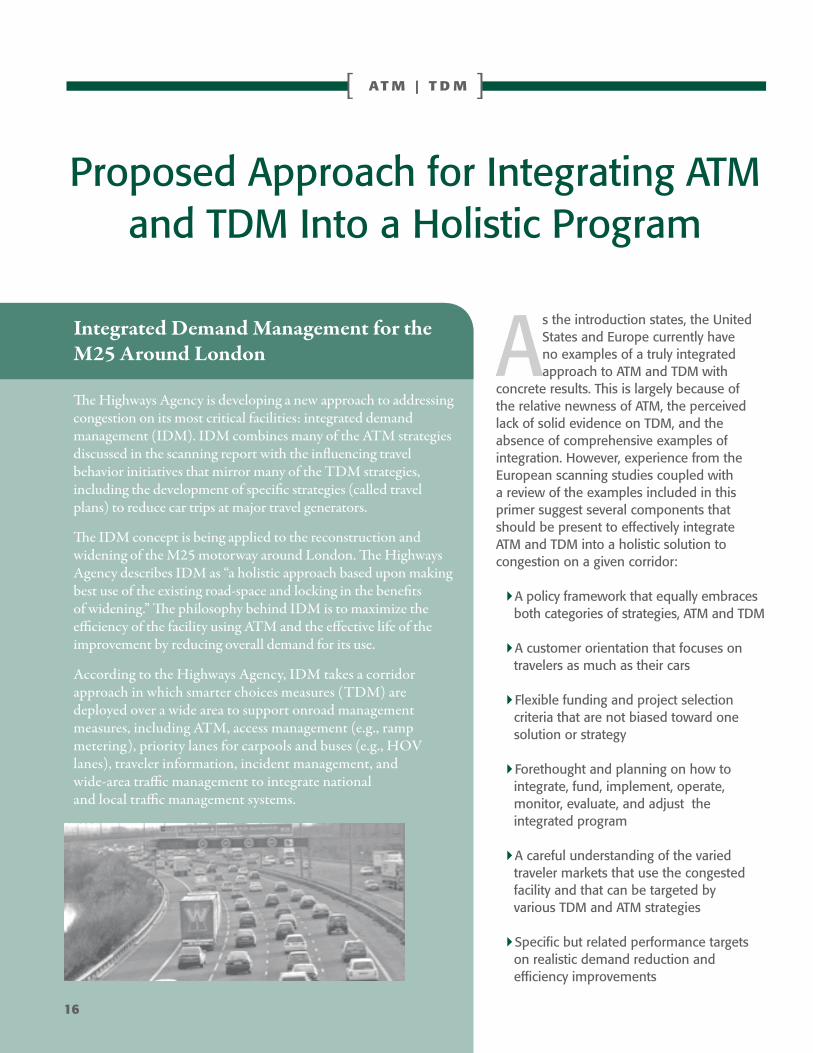
Integrated Demand Management for the M25 Around London
The Highways Agency is developing a new approach to addressing congestion on its most critical facilities: integrated demand management (IDM). IDM combines many of the ATM strategies discussed in the scanning report with the influencing travel behavior initiatives that mirror many of the TDM strategies, including the development of specific strategies (called travel plans) to reduce car trips at major travel generators.
The IDM concept is being applied to the reconstruction and widening of the M25 motorway around London. The Highways Agency describes IDM as “a holistic approach based upon making best use of the existing road-space and locking in the benefits of widening.” The philosophy behind IDM is to maximize the efficiency of the facility using ATM and the effective life of the improvement by reducing overall demand for its use.
According to the Highways Agency, IDM takes a corridor approach in which smarter choices measures (TDM) are deployed over a wide area to support onroad management measures, including ATM, access management (e.g., ramp metering), priority lanes for carpools and buses (e.g., HOV lanes), traveler information, incident management, and wide-area traffic management to integrate national and local traffic management systems.
16
Integrating Active Traffic and Travel Demand Management: A Holistic Approach to Congestion Management | 17
[ AT M | T D M ]
Transportation management centers that view their `charge as managing both traffic and travel demand
New partnerships to coordinate the implementation `of both ATM and TDM in a given corridor or subregion
If adopted by agencies responsible for congestion management, these recommendations could go far to create the foundation for this holistic approach to congestion mitigation, mobility, accessibility, and travel time reliability.
[ AT M | T D M ]
18
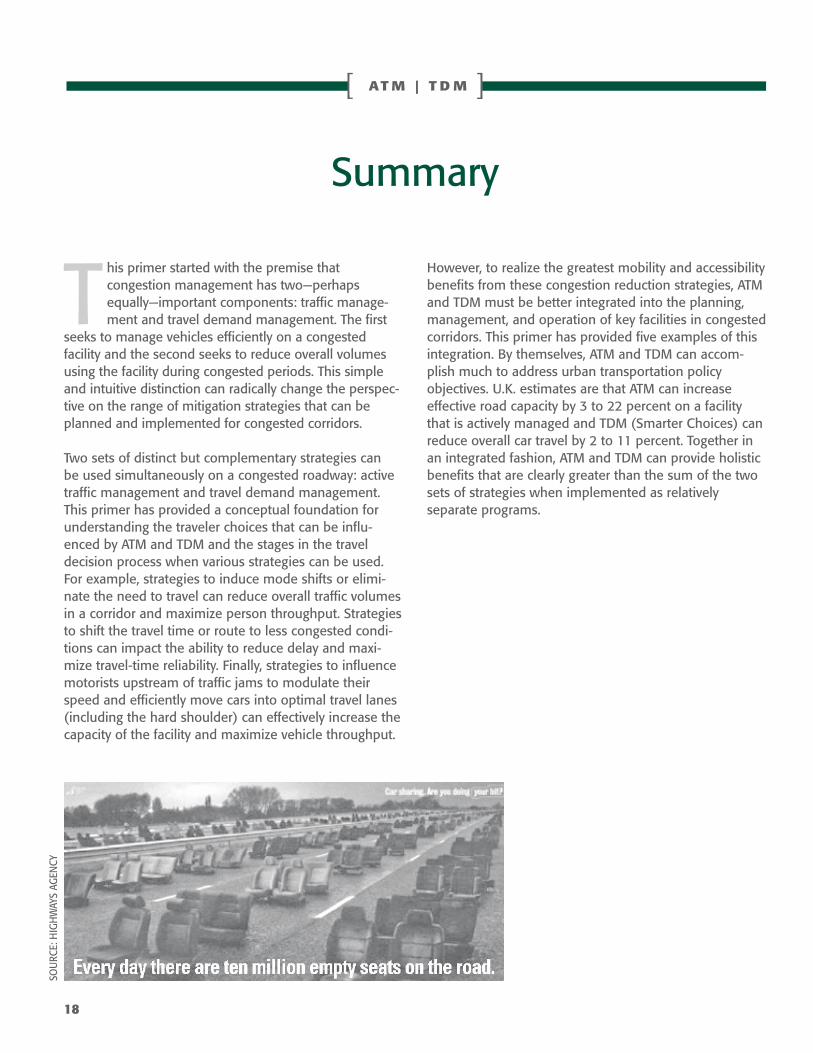
This primer started with the premise that congestion management has two—perhaps equally—important components: traffic manage-ment and travel demand management. The first
seeks to manage vehicles efficiently on a congested facility and the second seeks to reduce overall volumes using the facility during congested periods. This simple and intuitive distinction can radically change the perspec-tive on the range of mitigation strategies that can be planned and implemented for congested corridors.
Two sets of distinct but complementary strategies can be used simultaneously on a congested roadway: active traffic management and travel demand management. This primer has provided a conceptual foundation for understanding the traveler choices that can be influ-enced by ATM and TDM and the stages in the travel decision process when various strategies can be used. For example, strategies to induce mode shifts or elimi-nate the need to travel can reduce overall traffic volumes in a corridor and maximize person throughput. Strategies to shift the travel time or route to less congested condi-tions can impact the ability to reduce delay and maxi-mize travel-time reliability. Finally, strategies to influence motorists upstream of traffic jams to modulate their speed and efficiently move cars into optimal travel lanes (including the hard shoulder) can effectively increase the capacity of the facility and maximize vehicle throughput.
However, to realize the greatest mobility and accessibility benefits from these congestion reduction strategies, ATM and TDM must be better integrated into the planning, management, and operation of key facilities in congested corridors. This primer has provided five examples of this integration. By themselves, ATM and TDM can accom-plish much to address urban transportation policy objectives. U.K. estimates are that ATM can increase effective road capacity by 3 to 22 percent on a facility that is actively managed and TDM (Smarter Choices) can reduce overall car travel by 2 to 11 percent. Together in an integrated fashion, ATM and TDM can provide holistic benefits that are clearly greater than the sum of the two sets of strategies when implemented as relatively separate programs.
SOU
RCE:
HIG
HW
AYS
AGEN
CY
Summary
Integrating Active Traffic and Travel Demand Management: A Holistic Approach to Congestion Management | 19
[ AT M | T D M ]
California Department of Transportation, Multimodal Integrated Corridor Management Workshop—Summary of Findings, www.dot.ca.gov/newtech/modal/micm/summary_of_finding-micm_workshop-dec_2007.pdf.
Caltrain, “Caltrain Commute Times to Run on 101 Info Signs,” Caltrain News, July 2, 2007, www.caltrain.com/news_2007_07_02_101_info_signs.html.
Department for Transport, Smarter Choices: Changing the Way We Travel, June 2005, www.dft.gov.uk/pgr/sustainable/smarterchoices/ctwwt/.
ESTC, Cuesta Grade Transportation Demand Manage-ment Program Evaluation, prepared for the San Luis Obispo Council of Governments, Feb. 23, 2003.
Federal Highway Administration Congestion Pricing Primer Series:
Congestion Pricing—A Primer: Overview, FHWA-HOP-08-039.
Lessons Learned From International Experience in Congestion Pricing, FHWA-HOP-08-047.
Technologies That Complement Congestion Pricing— A Primer, FHWA-HOP-08-043.
Technologies That Enable Congestion Pricing— A Primer, FHWA-HOP-08-042.
Federal Highway Administration, Office of International Programs, Active Traffic Management: The Next Step in Congestion Management, FHWA-PL-07-012, March 2007.
Federal Highway Administration, Office of International Programs, Managing Travel Demand: Applying Euro-pean Perspectives to U.S. Practice, FHWA-PL-06-015, May 2006.
Federal Highway Administration, Office of Transportation Management, Mitigating Traffic Congestion: The Role of Demand-Side Strategies, FHWA-HOP-05-00, October 2004.
Frans Middelham, “Dynamic Traffic Management in the Netherlands,” Rijkswaterstaat Traffic Research Center (AVV), presentation to FHWA Managing Travel Demand Scanning Study Team, June 27, 2005.
Highways Agency, “Integrated Demand Management,” www.highways.gov.uk/knowledge/18297.aspx.
Highways Agency, “Tackling Congestion by Influencing Travel Behaviour,” www.highways.gov.uk/knowledge/ 9561/aspx.
National Audit Office, Tackling Congestion by Making Better Use of England’s Motorways and Trunk Roads, report by Comptroller and Auditor General, Nov. 26, 2004.
Puget Sound Regional Council, “Draft Methodology for Lake Washington Urban Partnership TDM Analysis,” Travel Demand Management Analysis Working Group, 2010.
Spitsmijden, Effects of Rewards: Spitsmijden Summary, April 2007, www.spitsmijden.nl/old/resultaten/ Rapport_publiek(ukdef).pdf.
U.S. Department of Transportation, Seattle (Lake Washington) Urban Partnership Agreement, www.upa.dot.gov/agreements/seattle.htm.
Resources


OFFICE OF INTErNATIONAL PrOgrAMSFhwA/US DOT (hPIP)
1200 New Jersey Ave., SE Washington, DC 20590
Tel: (202) 366-9636 Fax: (202) 366-9626
[email protected] www.international.fhwa.dot.gov
Publication No. FhwA-PL-11-011 hPIP/01-11(3.5)Ew