integrating biological monitoring data from diverse sources
TRANSCRIPT
Integrating Biological Integrating Biological Monitoring Data from Monitoring Data from
Diverse Sources:Diverse Sources:Challenges in Database & Challenges in Database &
Index Development for Index Development for the Potomac the Potomac BasinwideBasinwide
Assessments ProjectAssessments Project

Enhance state water quality monitoring & assessment programs with consistent,
watershed-wide assessments of stream health
Potomac River Potomac River BasinwideBasinwide AssessmentsAssessments“The ability to combine
datasets is desirable to make judgements on the condition
of the water resource.” (Barbour et al. 1999)
“Combining information from separate monitoring surveys
improves understanding of the biological integrity of riverine
systems.” (Handcock et al.)
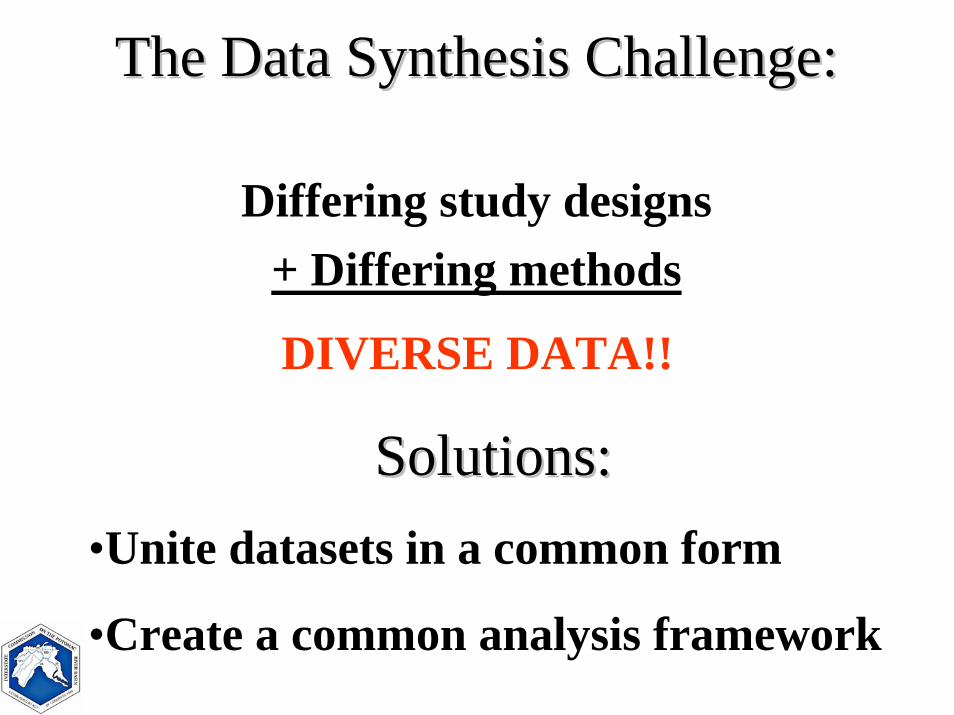
The Data Synthesis Challenge:The Data Synthesis Challenge:
Differing study designs+ Differing methods
DIVERSE DATA!!
Solutions:Solutions:•Unite datasets in a common form
•Create a common analysis framework
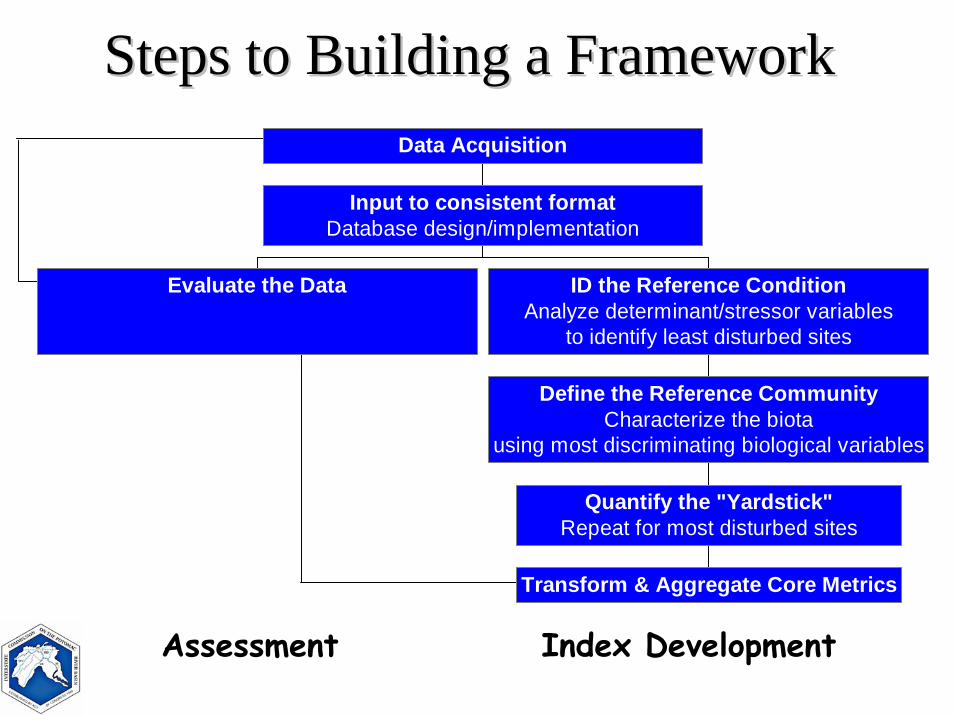
Steps to Building a FrameworkSteps to Building a Framework
Evaluate the Data
Transform & Aggregate Core Metrics
Quantify the "Yardstick"Repeat for most disturbed sites
Define the Reference CommunityCharacterize the biota
using most discriminating biological variables
ID the Reference ConditionAnalyze determinant/stressor variables
to identify least disturbed sites
Input to consistent formatDatabase design/implementation
Data Acquisition
Assessment Index Development

Data AcquisitionData Acquisition• Datasets (assessments + raw data)
provided by member jurisdictions (305b/303d)– Maryland MBSS 1995-1997– Pennsylvania Unassessed Waters 1997-2001– Virginia WQ Assessment/Surface Water
Monitoring 1994-2001– West Virginia WAP 1996- Spring 2001
• Assembled in a Microsoft Access database

Database Development ChallengesDatabase Development Challenges• Accommodating inherent differences among datasets
– forms & formats• manual entry of hardcopy files• importing/adapting electronic files
– accommodate ways datasets are customized (e.g. fieldnames, codes)
• Assuring data quality & database integrity– review sampling/processing/analysis/interpretation methods
(lack of metadata!)– assume “primary quality” of contributed data– QA/QC during data entry (“secondary quality”)– improve geographical references (e.g. catchments,
ecoregions, HUCs)

Entity Relationship DiagramEntity Relationship Diagram
StationsStudyCode
StationNumber
DatasetsStudyCodeSourceCode
EventsEventID
StudyCodeStationNumber
TaxaTSN
LatinName
HabitatEventID
ParamCode
WaterQualityEventID
ParamCode
SourcesSourceCode
BenthicCountsEventID
TSN
Assorted SecondaryLookup tables:
FIPS_CoFIPS_StateMetricsPAReachesPhysio_ProvincesEcoregionsPARelAbunCatsHUC8etc.
AllParamsParamCode

“Apples and oranges can be mixed if they are first converted to juice.” (Hale 2000)
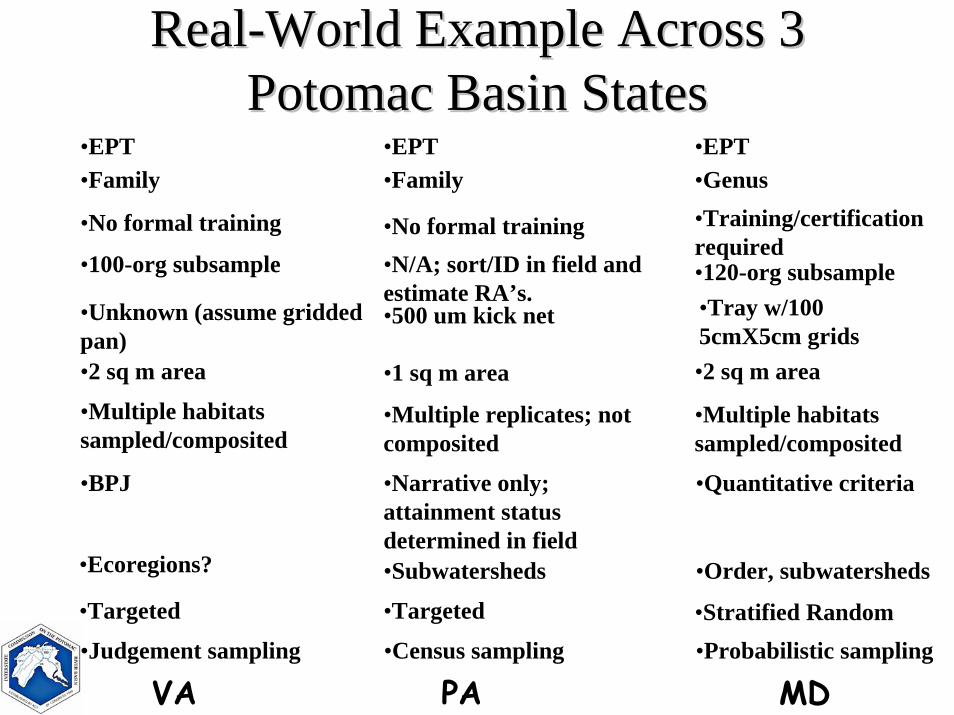
RealReal--World Example Across 3 World Example Across 3 Potomac Basin StatesPotomac Basin States
•Family •Family •Genus•EPT •EPT•EPT
•No formal training •No formal training •Training/certification required
•100-org subsample •N/A; sort/ID in field and estimate RA’s.
•120-org subsample
•Unknown (assume griddedpan)
•500 um kick net •Tray w/100 5cmX5cm grids
•2 sq m area •1 sq m area •2 sq m area
•Multiple habitats sampled/composited
•Multiple replicates; not composited
•Multiple habitats sampled/composited
•BPJ •Narrative only; attainment status determined in field
•Quantitative criteria
•Ecoregions? •Subwatersheds •Order, subwatersheds
•Targeted •Targeted •Stratified Random•Judgement sampling •Census sampling •Probabilistic sampling
VA PA MD

Data Synthesis ChallengesData Synthesis Challenges• Study designs/goals
– Solution: OK to combine for biological index development (e.g. MAIA)• Index periods
– Solution: seasonal differences negligible at Family-level ID• Sampling/subsampling methods & gears
– Solution: accept higher p-value• Subsample sizes
– Solution: differences in counts insignificant at Family ID• Habitat assessment protocols & classification criteria
– Solution: select common hab/WQ elements & equate to consistent scale • Levels of taxonomic resolution
– Solution: collapse IDs to Family where possible• Analytical approaches (mix of qualitative & semi-quantitative data)
– Solution: use minimum values associated with narrative categories as quantitative counts

Category Range LowestVal AvgVal HighestValRare <3 1 1.5 2
Present 3-9 3 6.5 9Common 10-24 10 17 24Abundant 25-100 25 62.5 100
Very Abundant >100 101 101 sky's the limit
PA Relative Abundance Categories and Value Ranges

Lower Potomac
Cacapon
South Fork
Shenandoah Rive
r
South Branch
Potomac
Opequon,Back
MonocacyCatoctin
ConococheagueAntietamWills, Evitts,
Town
Goose,Catoctin
Occoquon,AccotinkNorth
Fork
Shenandoah Rive
r
Seneca,Anacostia
North Branc
h
Potomac, Savage
River
Lower
Shenandoah
EcoregionCoastal PlainsNorthern PiedmontSouthEast PlainsBlue RidgeRidge & ValleyCentral Appalachian
State BoundaryMajor Watersheds
Pennsylvania
WestVirginia
Maryland
Virginia
D.C.
0 30 60 Kilometers
N
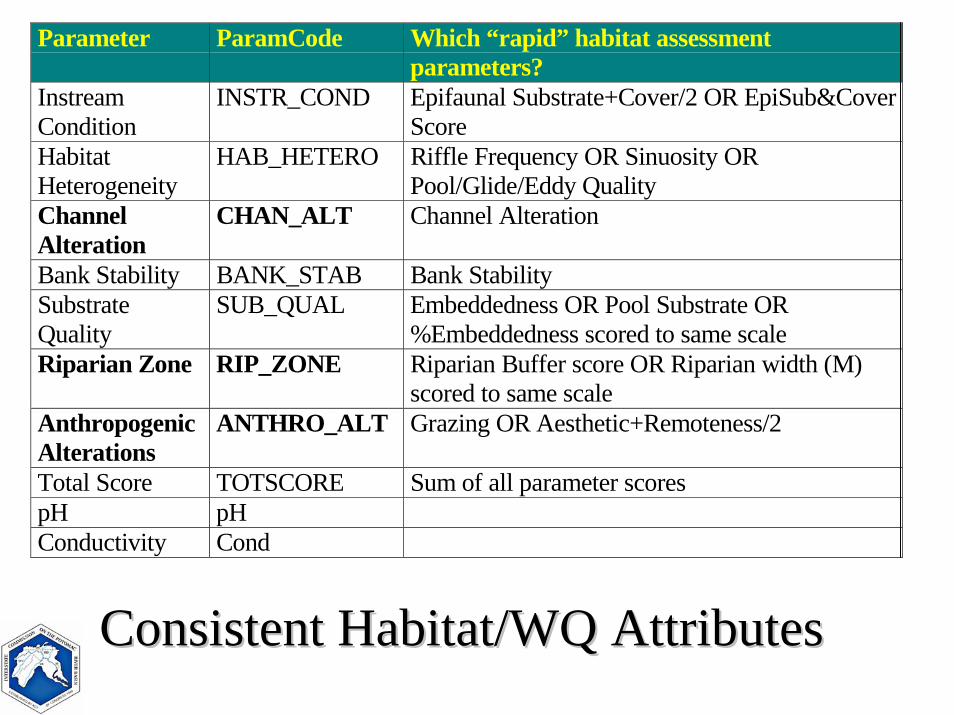
Parameter ParamCode Which “rapid” habitat assessmentparameters?
InstreamCondition
INSTR_COND Epifaunal Substrate+Cover/2 OR EpiSub&CoverScore
HabitatHeterogeneity
HAB_HETERO Riffle Frequency OR Sinuosity ORPool/Glide/Eddy Quality
ChannelAlteration
CHAN_ALT Channel Alteration
Bank Stability BANK_STAB Bank StabilitySubstrateQuality
SUB_QUAL Embeddedness OR Pool Substrate OR%Embeddedness scored to same scale
Riparian Zone RIP_ZONE Riparian Buffer score OR Riparian width (M)scored to same scale
AnthropogenicAlterations
ANTHRO_ALT Grazing OR Aesthetic+Remoteness/2
Total Score TOTSCORE Sum of all parameter scorespH pHConductivity Cond
Consistent Habitat/WQ AttributesConsistent Habitat/WQ Attributes

Reference Criteria (ALL of thefollowing):
Param 64 66 67 69ANTHRO_ALT >70% >70% >70% >70% BANK_STAB >70% >50% >70% >50% CHAN_ALT >70% >50% >50% >50%
HAB_HETERO >10% >10% >10% >10%INSTR_COND >30% >10% >10% >10%
SUB_QUAL >70% >70% >70% >70% RIP_ZONE >50% >70% >70% >70%
AND: (Both)pH Between 6 and 9
CON <500
Impairment Criteria (3 ormore of the following):Param 64 66 67 69
ANTHRO_ALT <10% <10% <10% <10%BANK_STAB <10% <10% <10% <10% CHAN_ALT <10% <10% <10% <10% HAB_HETERO <10% <10% <10% <10%INSTR_COND <10% <10% <10% <10%SUB_QUAL <10% <10% <10% <10% RIP_ZONE <10% <10% <10% <10%
OR: (Either)pH <4.5 CON >1000

ID Consistent Biological IndicatorsID Consistent Biological Indicators• Select potential metrics from the literature (60)
• Equalize level of taxonomic resolution (Family)
• Screen out ref & stressed sites w/both TaxRich & TotAbun > or < 2 SD’s from mean
• Range Test (can calculate for >90% of ref sites)
• Variability Test (C.V. <0.50 in ref sites)
• Discrimination Test - ID metrics that distinguish ref from stressed sites in each ecoregion
• Redundancy Test (Pearson Correlation coeff <0.75)

Metrics
Taxa RichnessEPT Taxa
Percent EPTIndex FBI
Percent Dom2 (except 69)Percent Dom5 (69 only)
Percent ClingersPercent Collectors (except 69)

Can Reference Data from Can Reference Data from Different Regions Be Combined?Different Regions Be Combined?• Increase the pool of available reference sites
available to any 1 region• Ensure that the best possible reference
conditions are captured by the final index• Test (t- and U-tests) to see if ecoregional
reference communities are distinctly different when comparing core metric values
• In this case, the preferred answer is “NO”

Ecoregion1 Ecoregion2 EPT ENH FBI %CL %CO %D1 %D5 %EPT TR64 66 ** ** SS SS * SS SS * SS64 67 ** ** SS SS ** SS * ** *64 69 ** ** SS SS SS SS * SS *66 67 SS SS * SS SS SS SS SS SS66 69 SS SS SS SS SS SS SS SS SS67 69 SS SS SS SS SS SS SS SS SS
SS=Significantly similar (p>0.05)
Reference communities in the Blue Ridge Mountain (66), Ridge & Valley (67), and Central Appalachian (69) ecoregions are almost indistinguishable
Northern Piedmont (64) reference communities are quite dissimilar from those in the “mountain” ecoregions (66, 67, 69)

What We Know (Summary)What We Know (Summary)• We have a uniform framework for identifying zones
of ecological distinctiveness & for defining biological potential of streams within ecoregions
• We have meaningful indicators for assessing community response to perturbation
• Reference data in certain ecoregions can be “pooled”• If underlying methodologies are sufficiently similar,
visual estimates of relative abundance are comparable to fixed-count subsampling
• Diverse data can be combined in a bioassessment framework if the synthesis is done with care

Want to Know More?Want to Know More?
Come to the “Innovative Indices” session tomorrow afternoon!

AcknowledgementsAcknowledgements
• Maryland Dept. of Natural Resources & Dept. of the Environment
• Pennsylvania Dept. of Environmental Protection
• Virginia Dept. of Environmental Quality
• West Virginia Dept. of Environmental Protection
• ICPRB staff