integrating climate - total.com · integrating climate into our strategy • 05 patrick pouyannÉ...
TRANSCRIPT
INTEGRATING CLIMATE INTO OUR STRATEGY • 1
Integrating
ClimateInto Our Strategy
SEPTEMBER 2018

INTEGRATING CLIMATE INTO OUR STRATEGY • 03
Foreword - Patrick Pouyanné, Chairman and Chief Executive Officer, Total 05
An Engaged and Attentive Board of Directors 10
_____________
SHAPING TOMORROW’S ENERGYReducing Carbon Emissions to Provide a Responsible Energy Mix 12
Toward Fair and Effective Carbon Pricing 14
Interview with Erik Solheim, Executive Director, UN Environment 16
Finding and Supporting Game-Changing Technology 17
Three Questions for Pratima Rangarajan, CEO, OGCI Climate Investments 19
Three Questions for Jason Bordoff, Professor of Professional Practice in International and Public Affairs, Columbia University 20
_____________
OUR INITIATIVES A Carbon Intensity Indicator to Curtail Emissions Related to Our Energy Products 22Avoided Emissions: Additional Actions 24Greenhouse Gas Emissions Down 30% Since 2010 26
Natural Gas, the Key Ingredient in the Future Energy Mix 27Switching to Natural Gas for Power Generation 29Investigating Methane Emissions to Take Effective Action 30Steering the Shipping Industry Through the Energy Transition 32
Electricity, Pivotal to Our Low-Carbon Strategy 33Acquisitions for Sustainable Growth in Low-Carbon Businesses 34The Rise of Renewable Energies 35
Supplying More Efficient Biofuels 37
Northern Lights, a Major Milestone in the Development of CCUS 38A Resilient Portfolio 41Energy Efficiency 42
The Future Holds Clean Energy for Everyone 43
_____________
FOCUS ON TRANSPORTATIONTransportation, an Array of Solutions from Total 45
______________
OUR FIGURES 49
CONTENTS
04 • INTEGRATING CLIMATE INTO OUR STRATEGY
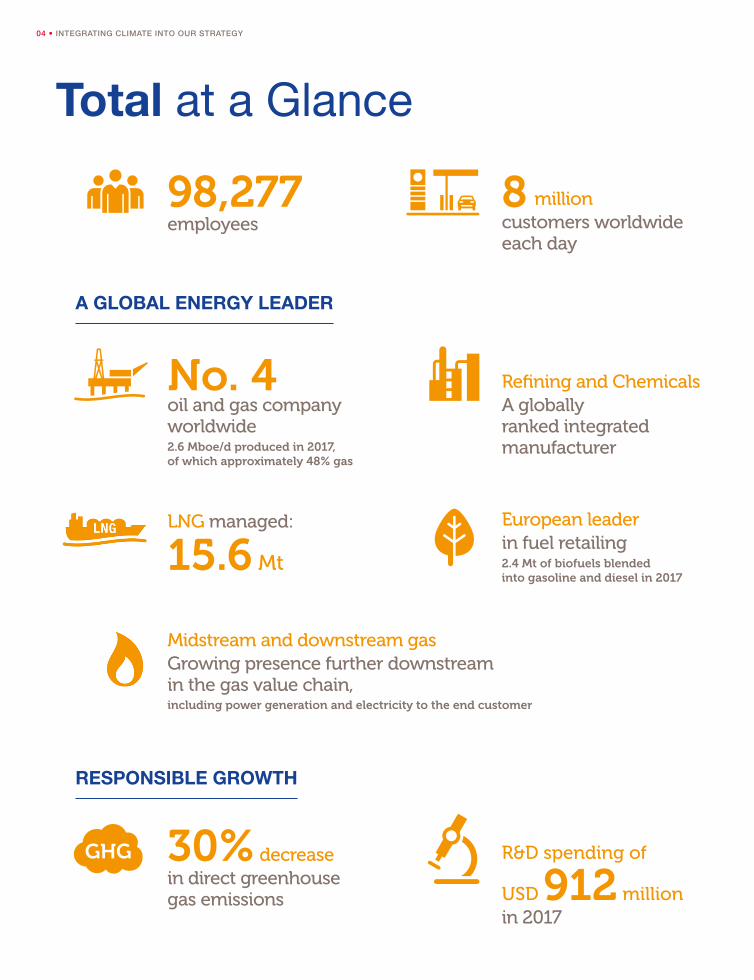
Total at a Glance
98,277 employees customers worldwide
each day
8 million
A globally ranked integrated manufacturer
Refining and Chemicalsoil and gas company worldwide
No. 4 2.6 Mboe/d produced in 2017, of which approximately 48% gas
A GLOBAL ENERGY LEADER
in fuel retailingEuropean leader
2.4 Mt of biofuels blended into gasoline and diesel in 2017
LNG managed:
15.6 Mt
Growing presence further downstream in the gas value chain,including power generation and electricity to the end customer
Midstream and downstream gas
30% decreasein direct greenhouse gas emissions
in 2017
R&D spending of
USD 912 million
RESPONSIBLE GROWTH
GHG
INTEGRATING CLIMATE INTO OUR STRATEGY • 05
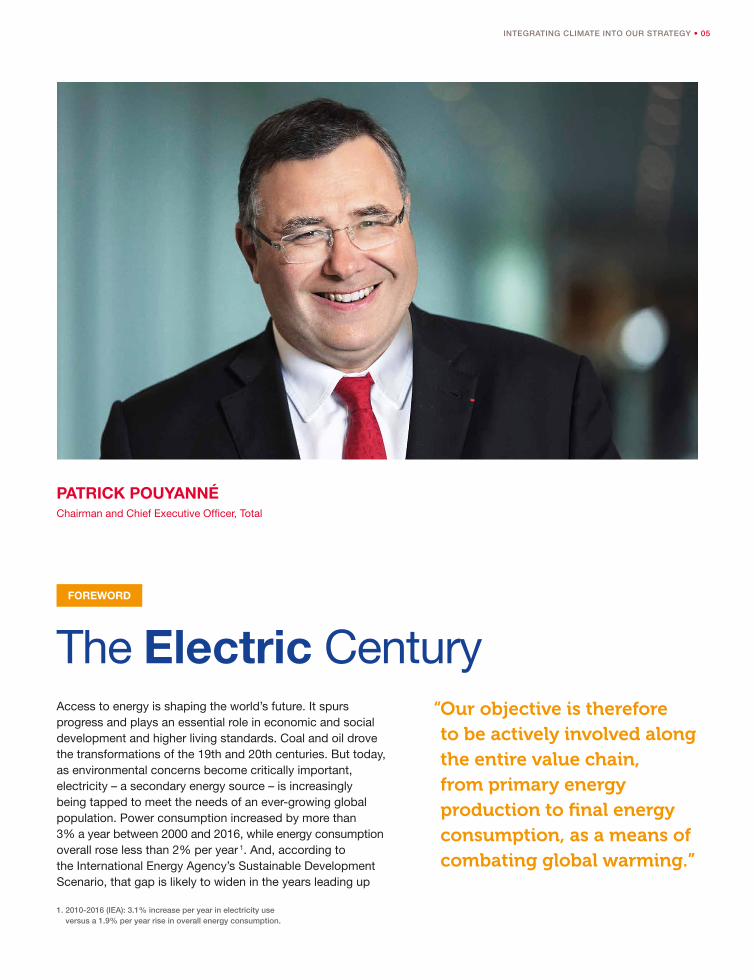
PATRICK POUYANNÉChairman and Chief Executive Officer, Total
The Electric Century FOREWORD
Access to energy is shaping the world’s future. It spurs progress and plays an essential role in economic and social development and higher living standards. Coal and oil drove the transformations of the 19th and 20th centuries. But today, as environmental concerns become critically important, electricity – a secondary energy source – is increasingly being tapped to meet the needs of an ever-growing global population. Power consumption increased by more than 3% a year between 2000 and 2016, while energy consumption overall rose less than 2% per year 1. And, according to the International Energy Agency’s Sustainable Development Scenario, that gap is likely to widen in the years leading up
“ Our objective is therefore to be actively involved along the entire value chain, from primary energy production to final energy consumption, as a means of combating global warming.”
1. 2010-2016 (IEA): 3.1% increase per year in electricity use versus a 1.9% per year rise in overall energy consumption.
06 • INTEGRATING CLIMATE INTO OUR STRATEGY
to 2040, as electricity use climbs steadily while total energy consumption plateaus 1. But power consumption cannot be separated from the power generation method. Our objective is therefore to be actively involved along the entire value chain, from primary energy production to final energy consumption, as a means of combating global warming.
Against this backdrop, Total is resolutely pursuing our ambition of becoming the responsible energy major. We are also committed to helping achieve the United Nations Sustainable Development Goals (SDGs), specifically with regard to climate change, access to energy and biodiversity. I was honored to be named a 2017 SDG Pioneer by the Global Compact, in recognition of Total’s pursuit of partnerships and investment in low-carbon energies.
As you will see in this report, our focus on climate concerns is integral to our strategy. We are positioned in fast-growing low-carbon markets, which means we offer an energy mix whose carbon intensity is steadily decreasing.
In support of this change, we have created a tool for measuring the carbon intensity of the energy products we make available to our customers. That metric indicates the average of our products’ greenhouse gas emissions, from the time they are produced in our facilities to their end use by the customer.
Total’s ambition is to reduce that carbon intensity by 15% between 2015 — the date of the Paris Agreement — and 2030.
In the longer term, beyond 2030, our ambition is to pursue these efforts, or possibly to accelerate as new technologies become available and public policies are put in place, and reach a reduction of 25 to 35% by 2040.
This trajectory constitutes Total’s responsible contribution on the road to the objectives set out in the Paris Agreement, while also allowing us to fulfill our mission of supplying affordable, reliable and clean energy to as many people as possible.
To do this, we will be focusing on five major drivers that this report describes in detail: improved operational efficiency, integrated expansion across the natural gas value chain, a strengthened presence in low-carbon electricity, fossil fuel decarbonization, and carbon storage.
The decisions we make in accordance with this strategy must be explained clearly and transparently. With that in mind, in July 2017 we announced our support for the recommendations issued by the Task Force on Climate-related Financial Disclosures (TCFD), which was established by the G20’s Financial Stability Board. More recently, in July 2018, the World Business Council for Sustainable Development (WBCSD) released a report on behalf of the TCFD’s Oil and Gas Preparer Forum — in which Total actively participates — that provides practical examples on implementing the TCFD recommendations.
That openness and transparency goes hand in hand with a genuine belief in the value of partnerships. Total is active in many joint initiatives, such as the Oil and Gas Climate Initiative (OGCI), with other energy majors. Moreover, we maintain a dialogue with national and regional governments, as well as provide support to start-ups through Total Energy Ventures. Only by mobilizing our collective energy can we tackle the full scale of the challenges posed by climate change.
We believe that oil and gas will continue to play an essential role in the coming decades, as reflected in all the IEA scenarios 2. We are therefore maintaining a policy of selective investment in our core businesses that will be critical for long-term performance. Our acquisition of Maersk Oil in 2017 — the Group’s largest such transaction since the merger with Elf — is an exemplar of that strategy. It provides Total with a portfolio of exploration and production assets with low technical costs, allowing us to further improve both our competitiveness and the value of our operations. In particular, the deal strengthens our presence in the North Sea, a key region for us, where we are now the second-largest operator. Additionally, the petroleum assets we have acquired will have a shorter life than our projects in natural gas (LNG especially), and low-carbon electricity (such as wind and solar power).
1. 2016-2040 (IEA SDS): 1.8% increase per year in electricity use versus a 0.3% per year rise in overall energy consumption.
2. In the IEA’s Sustainable Development Scenario (SDS), oil and gas will account for 48% of energy demand in 2040 versus 54% in 2016. The share of hydrocarbons in 2040 is higher under the other scenarios.
“ Total’s ambition is to reduce the carbon intensity of the energy products we make available to our customers by 15% between 2015 — the date of the Paris Agreement — and 2030.“
INTEGRATING CLIMATE INTO OUR STRATEGY • 07
ENERGY EFFICIENCY, A KEY DRIVER TO REDUCE EMISSIONS
The first driver to reduce our emissions is optimizing the energy usage of our facilities. Their energy efficiency is a cornerstone of our initiatives. We have set a target of an average 1% per year improvement in the energy efficiency of our facilities from 2010 to 2020, despite the increasingly complex operating environment. We recorded a decrease of more than 10% over the period from 2010 to 2017, reaching and exceeding our original target. We will obviously pursue these efforts at the same pace beyond 2020.
Beyond our walls, we also offer our customers energy efficiency consulting services to help them optimize their energy usage and reduce their greenhouse gas emissions. Our recent acquisition of GreenFlex is aligned with that goal.
THE STRENGTH OF AN INTEGRATED BUSINESS MODEL THAT EMPHASIZES NATURAL GAS
In pursuit of a responsible solution for addressing the sharp rise in electricity demand, we are maintaining our commitment to natural gas, which emits half as much carbon as coal when used for power generation.
The liquefied natural gas (LNG) market in particular grew by 10% in 2017 and promises future growth of more than 5% per year, led by Asian demand.
We aim to be present along the entire gas value chain, from production right to the end customer. We have carried out major projects and transactions to achieve that objective. In the upstream, we have an interest in the giant Yamal LNG development in northern Russia and we have also acquired Engie’s upstream LNG business. With these complementary portfolios, we will be managing nearly 40 million tons of LNG in 2020, making us the world’s second-largest operator in the sector, with a 10% market share.
In the downstream, one strategic acquisition was Direct Energie, a supplier of natural gas and power to the French and Belgian markets. Another was a 25% stake in Clean Energy, the leading distributor of natural gas fuel for heavy-duty trucks in the United States, reflecting our determination to advance the development of new natural gas applications. So does the agreement signed with CMA CGM, the first shipping company to equip its transcontinental container ships with LNG-powered engines.
Total believes in the future of natural gas as a transportation fuel and is investing in this area, thereby contributing to greener mobility.
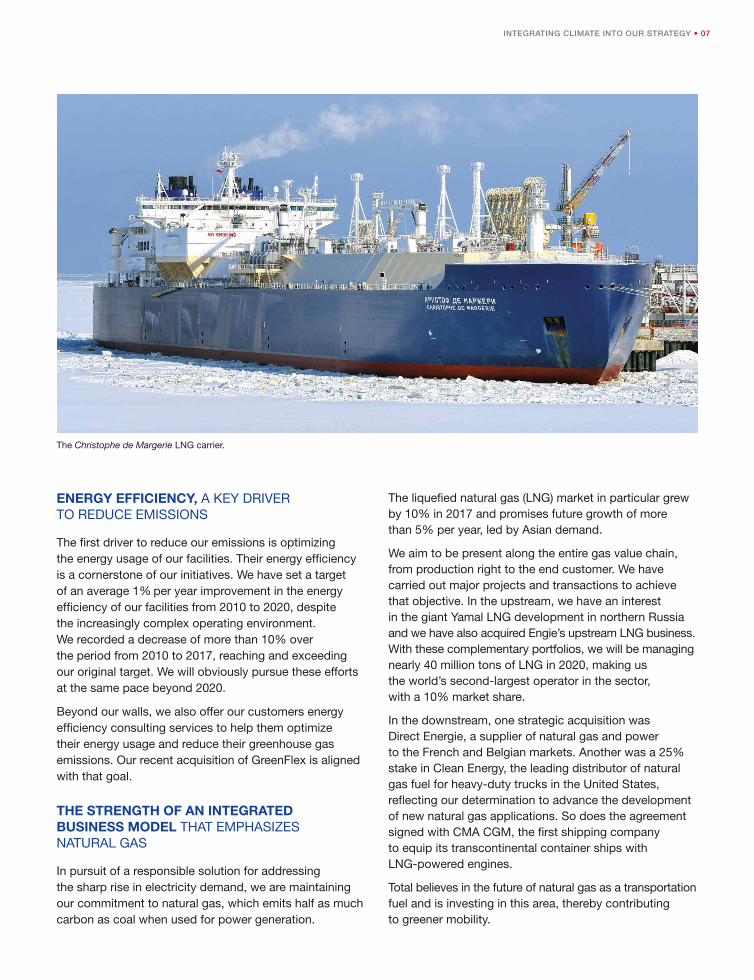
The Christophe de Margerie LNG carrier.

08 • INTEGRATING CLIMATE INTO OUR STRATEGY
AN EXPANDED PRESENCE IN LOW-CARBON ELECTRICITY
We are also expanding our positions along the entire low-carbon electricity value chain, from power generation to storage and sales to end customers.
One upstream illustration is our acquisition, currently in progress, of two combined cycle gas turbine (CCGT) power plants with an overall capacity of about 825 MW. This deal demonstrates the value of natural gas as a flexible partner for renewable energies.
We have strengthened our position as a solar energy producer, thanks both to SunPower’s state-of-the-art technologies and affiliate Total Solar’s ground-mounted solar plant projects and work to solarize production facilities. Through our recently acquired stake in EREN Renewable Energy, now renamed Total Eren, we are consolidating that strategy in renewable energies (especially in emerging economies) and staking out a position in the wind power market as well.
Our acquisition of Direct Energie 1 helps us achieve critical mass in France and Belgium, mainly in electricity distribution, but also in power generation from natural gas and renewable energies. This transaction will also generate multiple synergies with many of our existing offerings, such as Lampiris — Belgium’s third-largest supplier of power, natural gas and energy services — and Total Spring, which now sells natural gas and green power.
Alongside natural gas, electricity is making a growing contribution to new forms of mobility, as consumers, municipal fleets and mass transit increasingly turn to electric vehicles. In addition to investing in battery development through Saft, Total is devising a number of electric charging solutions for municipalities, businesses, consumers and service station networks.
Lastly, our affiliate Saft rounds out our offerings with energy storage technology, necessary to the future growth of renewable energies.
1. Total closed its acquisition of 73% of Direct Énergie’s share capital on July 6, 2018; a mandatory tender offer for the remaining shares is currently in progress.
INTEGRATING CLIMATE INTO OUR STRATEGY • 09
DECARBONIZING FOSSIL FUELS
Total is active in the biofuel segment and in developing various biomass conversion pathways. Renewable resources with low carbon emissions, biofuels are essential to decrease emissions caused by the use of oil and gas, especially in transportation.
A pioneer in biofuels for more than 20 years, Total is now the European leader, incorporating 2.4 million tons in gasoline and diesel in 2017. With the start-up in 2018 of La Mède, France’s first world-class biorefinery, we are confirming our ambition with a significant share of over 10% of the Europe market for hydrotreated vegetable oil (HVO) production.
Today, most biofuels are manufactured from vegetable oils or sugar. Our R&D teams have been preparing the future for more than a decade by developing technology to expand the range of resources that can be sustainably and competitively processed. The BioTfueL consortium, for example, is working on converting lignocellulose, a type of plant waste.
Lastly, Total is positioning itself in the biogas sector, for example by entering the NGV fuel for trucks market through our affiliate Clean Energy in the United States. In the hydrogen fuel sector, we have opened stations in Germany as part of the H2 Mobility Germany joint venture.
CARBON STORAGE THROUGH FORESTS AND CCUS
Carbon storage is a must for the planet to achieve carbon neutrality in the second half of the century. We are aiming to implement this storage in two forms: one is promoting carbon capture, utilization and storage (CCUS), and the other is preserving and restoring the ability of ecosystems — forests in particular — to act as carbon sinks.
We are allocating substantial resources to expand CCUS, an essential technology for the many industries — such as cement manufacturing or steelmaking — that emit huge amounts of carbon. In its Sustainable Development Scenario, the IEA predicts that more than 2 billion tons of carbon will be captured and stored in 2040. We have earmarked 10% of our R&D budget for CCUS research, and recent months have brought significant progress, including the Northern Lights initiative in Norway, developed in partnership with Equinor (formerly Statoil) and Shell. This project will yield technology that can subsequently be deployed at other sites, as well as
financial and contract models to ensure the long-term success of CCUS solutions, notably by enlisting the public sector as a participant.
Through Total Foundation, we have embarked on a large-scale global program that emphasizes preservation and restoration initiatives for forests, mangroves and wetlands, which are natural carbon repositories. It also includes projects to restore degraded soils so as to increase productive land available for agriculture, to meet food demand without thinning forest cover and also to combat deforestation. In addition, Total Foundation supports efforts to educate young people about the importance of preserving these ecosystems as part of climate action.
Beyond our own initiatives, one key success factor remains the introduction of carbon pricing that aligns energy prices more closely with carbon content, to ensure a more balanced mix that favors sources with lower emissions.
Putting a price on carbon is the most efficient financial mechanism to change the rules of the game quickly and hasten the switch to natural gas and renewables for low-carbon power generation.
As the term “energy mix” would suggest, Total is developing a blend of solutions. By improving the energy efficiency of our facilities, reinforcing our presence across the integrated natural gas and low-carbon electricity chains, from production to marketing to end customers, and developing carbon storage, we are building a comprehensive and diversified response that will deliver long-term growth.
10 • INTEGRATING CLIMATE INTO OUR STRATEGY
An Engaged and Attentive Board of Directors
Total’s ambition is to be the responsible energy major. This puts climate concerns at the heart of its strategy, consistent with the outlook described in the IEA’s Sustainable Development Scenario. The Board of Directors, on which I am honored to serve as the lead independent director, has been lending support for this vision over several years, and is taking steps to ensure that Total likewise leads the way in transparency on climate issues. The Board has contributed to each annual Climate Report since the first, in 2016, providing a genuine roadmap for Total’s tangible initiatives on climate. In addition, the Board approves Total’s annual management report, which includes environmental and social data. The 2017 report outlines the steps being planned in order to implement the recommendations issued by the Task Force on Climate-related Financial Disclosures.
In 2017, the Board reviewed several major transactions that demonstrate how Total is integrating the climate into its strategy. One example was Total’s acquisition of a stake in EREN RE, which is buttressing the Group’s expansion into renewable — solar and wind — power generation. Another highlight was the presentation on Total’s acquisition of Engie’s upstream LNG business, an important milestone in cementing the company’s expertise across the entire gas value chain.
To ensure these challenges are addressed effectively over time, the Board of Directors sets the Chairman and CEO’s compensation in part on the basis of ambitious objectives for health, safety and environment (HSE) and corporate social responsibility (CSR). In 2018, for example, nearly 20% of the CEO’s bonus will be determined by his performance in these areas.
In 2017, the HSE objective was met in full, especially with regard to TRIR performance (i.e., the total recordable injury rate per million hours worked) and the number of Tier 1 and 2 loss-of-containment events at oil and gas facilities. The CSR objective was also deemed fully met, given Total’s many investments to improve its environmental footprint and provide lower-carbon solutions to its customers. That CSR performance was then assessed in light of Total’s reputation for corporate social responsibility, illustrated in particular by the Group’s high ranking and scores from SRI rating agencies.
This performance requirement, reflected in both strategic vision and real-world initiatives, is a vital concern for Total’s Board of Directors.
CLIMATE GIVEN EVEN GREATER WEIGHT IN THE CHAIRMAN AND CEO’S COMPENSATION
In 2015, the portion relating to the HSE/CSR performance criteria used to calculate Patrick Pouyanné’s variable compensation was set at a maximum of 16% of his base salary. For 2016 and 2017, in a bid to give greater weight to HSE/CSR criteria, the Board of Directors increased this to 30%, with 20% tied to safety performance and 10% to CSR performance. The emphasis on these criteria was further reinforced in 2018, with the CSR portion increasing to 15% from 10%. CSR performance will be assessed on the basis of Total’s attention to climate issues in its strategy, as well as its reputation in the area of corporate social responsibility and its consideration of diversity in all its aspects.
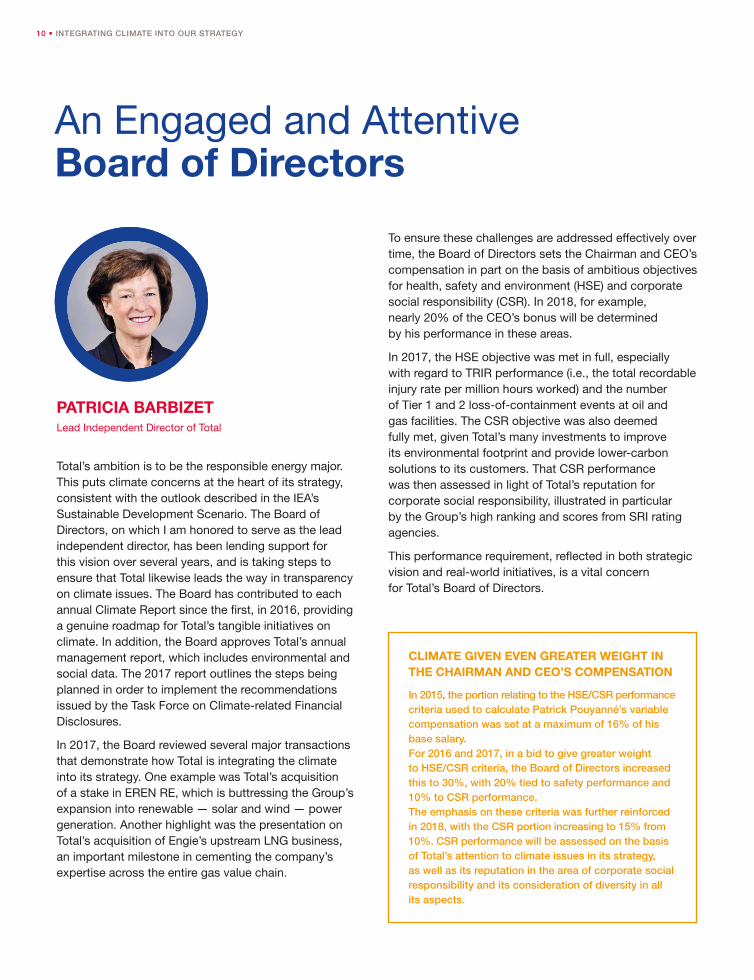
PATRICIA BARBIZETLead Independent Director of Total
Shaping Tomorrow’s Energy
Energy is at the heart of the challenges we face to keep the global average temperature rise below 2°C. What mechanisms can be put in place and what conditions favor success?
We are helping to effect this transformation and are actively involved, both within our industry and in the broader international community, in shaping tomorrow’s energy.
12 • INTEGRATING CLIMATE INTO OUR STRATEGY
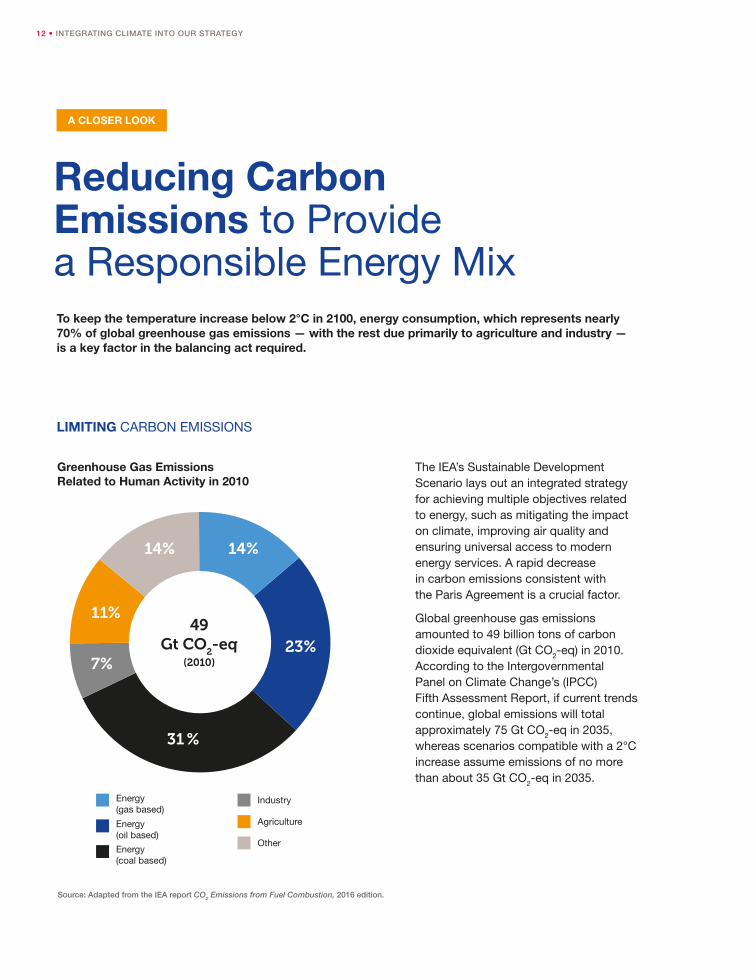
Reducing Carbon Emissions to Provide a Responsible Energy MixTo keep the temperature increase below 2°C in 2100, energy consumption, which represents nearly 70% of global greenhouse gas emissions — with the rest due primarily to agriculture and industry — is a key factor in the balancing act required.
Greenhouse Gas Emissions Related to Human Activity in 2010
The IEA’s Sustainable Development Scenario lays out an integrated strategy for achieving multiple objectives related to energy, such as mitigating the impact on climate, improving air quality and ensuring universal access to modern energy services. A rapid decrease in carbon emissions consistent with the Paris Agreement is a crucial factor.
Global greenhouse gas emissions amounted to 49 billion tons of carbon dioxide equivalent (Gt CO2-eq) in 2010. According to the Intergovernmental Panel on Climate Change’s (IPCC) Fifth Assessment Report, if current trends continue, global emissions will total approximately 75 Gt CO2-eq in 2035, whereas scenarios compatible with a 2°C increase assume emissions of no more than about 35 Gt CO2-eq in 2035.
LIMITING CARBON EMISSIONS
Pétrole
Gaz
14%14%
11%
7%
31 %
23%
Source: Adapted from the IEA report CO2 Emissions from Fuel Combustion, 2016 edition.
49Gt CO
2-eq
(2010)
Other
Agriculture
Industry
Energy(coal based)
Energy (gas based)
Energy (oil based)
A CLOSER LOOK
INTEGRATING CLIMATE INTO OUR STRATEGY • 13
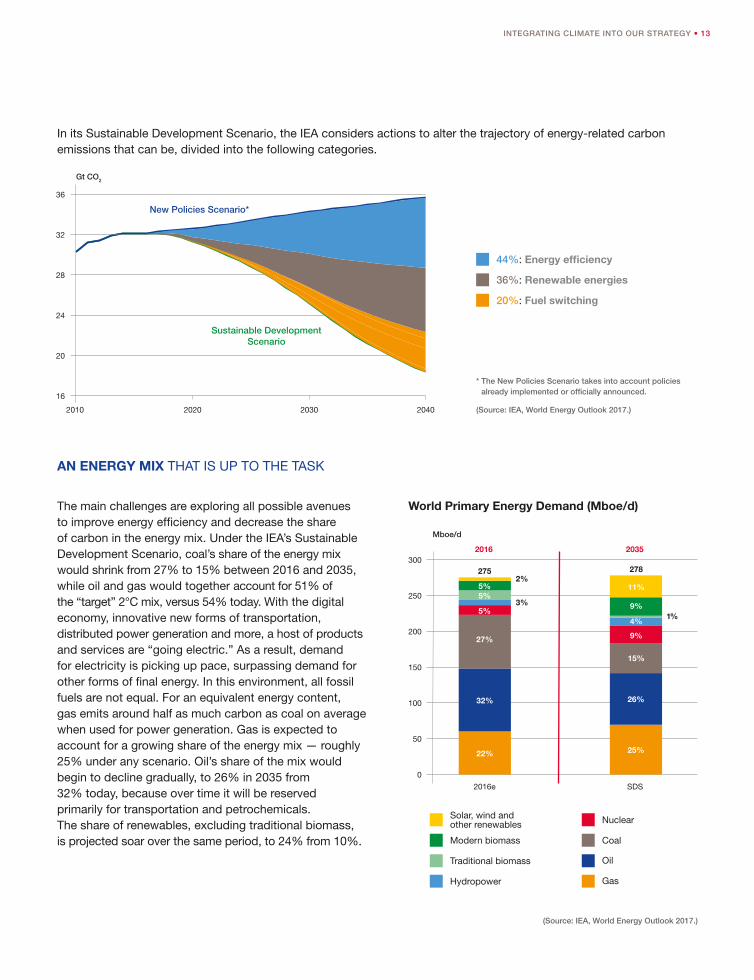
In its Sustainable Development Scenario, the IEA considers actions to alter the trajectory of energy-related carbon emissions that can be, divided into the following categories.
The main challenges are exploring all possible avenues to improve energy efficiency and decrease the share of carbon in the energy mix. Under the IEA’s Sustainable Development Scenario, coal’s share of the energy mix would shrink from 27% to 15% between 2016 and 2035, while oil and gas would together account for 51% of the “target” 2°C mix, versus 54% today. With the digital economy, innovative new forms of transportation, distributed power generation and more, a host of products and services are “going electric.” As a result, demand for electricity is picking up pace, surpassing demand for other forms of final energy. In this environment, all fossil fuels are not equal. For an equivalent energy content, gas emits around half as much carbon as coal on average when used for power generation. Gas is expected to account for a growing share of the energy mix — roughly 25% under any scenario. Oil’s share of the mix would begin to decline gradually, to 26% in 2035 from 32% today, because over time it will be reserved primarily for transportation and petrochemicals. The share of renewables, excluding traditional biomass, is projected soar over the same period, to 24% from 10%.
World Primary Energy Demand (Mboe/d)
AN ENERGY MIX THAT IS UP TO THE TASK
(Source: IEA, World Energy Outlook 2017.)
Solar, wind and other renewables
Modern biomass
Traditional biomass
Hydropower Gas
Coal
Nuclear
Oil
0
50
100
150
200
250
300
Mboe/d
2016 2035
27%
15%
5%4%
9%
5%9%
5% 11%
3%
2%
1%
2016e SDS
275 278
22% 25%
32% 26%
44%: Energy efficiency
36%: Renewable energies
20%: Fuel switching
* The New Policies Scenario takes into account policies already implemented or officially announced.
(Source: IEA, World Energy Outlook 2017.)2010 2020 2030 2040
16
20
24
28
32
36
Gt CO2
New Policies Scenario*
Sustainable Development Scenario
14 • INTEGRATING CLIMATE INTO OUR STRATEGY
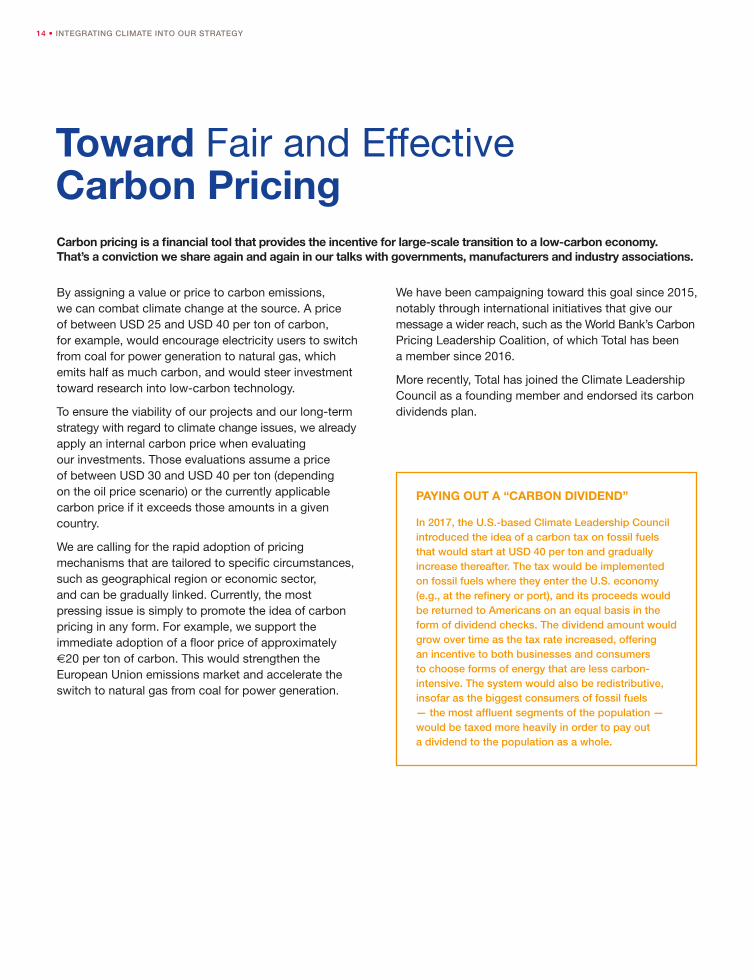
Toward Fair and Effective Carbon PricingCarbon pricing is a financial tool that provides the incentive for large-scale transition to a low-carbon economy. That’s a conviction we share again and again in our talks with governments, manufacturers and industry associations.
By assigning a value or price to carbon emissions, we can combat climate change at the source. A price of between USD 25 and USD 40 per ton of carbon, for example, would encourage electricity users to switch from coal for power generation to natural gas, which emits half as much carbon, and would steer investment toward research into low-carbon technology.
To ensure the viability of our projects and our long-term strategy with regard to climate change issues, we already apply an internal carbon price when evaluating our investments. Those evaluations assume a price of between USD 30 and USD 40 per ton (depending on the oil price scenario) or the currently applicable carbon price if it exceeds those amounts in a given country.
We are calling for the rapid adoption of pricing mechanisms that are tailored to specific circumstances, such as geographical region or economic sector, and can be gradually linked. Currently, the most pressing issue is simply to promote the idea of carbon pricing in any form. For example, we support the immediate adoption of a floor price of approximately €20 per ton of carbon. This would strengthen the European Union emissions market and accelerate the switch to natural gas from coal for power generation.
We have been campaigning toward this goal since 2015, notably through international initiatives that give our message a wider reach, such as the World Bank’s Carbon Pricing Leadership Coalition, of which Total has been a member since 2016.
More recently, Total has joined the Climate Leadership Council as a founding member and endorsed its carbon dividends plan.
PAYING OUT A “CARBON DIVIDEND”
In 2017, the U.S.-based Climate Leadership Council introduced the idea of a carbon tax on fossil fuels that would start at USD 40 per ton and gradually increase thereafter. The tax would be implemented on fossil fuels where they enter the U.S. economy (e.g., at the refinery or port), and its proceeds would be returned to Americans on an equal basis in the form of dividend checks. The dividend amount would grow over time as the tax rate increased, offering an incentive to both businesses and consumers to choose forms of energy that are less carbon-intensive. The system would also be redistributive, insofar as the biggest consumers of fossil fuels — the most affluent segments of the population — would be taxed more heavily in order to pay out a dividend to the population as a whole.
INTEGRATING CLIMATE INTO OUR STRATEGY • 15
OIL AND GAS COMPANIES CALL FOR CARBON PRICING
In May 2015, six global oil and gas companies — BG, BP, Eni, Equinor (then Statoil), Shell and Total — sent an open letter to the United Nations Framework Convention on Climate Change (UNFCCC) and the Presidency of COP21 calling for the introduction of carbon pricing mechanisms. Their goal was to reduce uncertainty and promote more economically efficient methods to decrease carbon emissions worldwide.
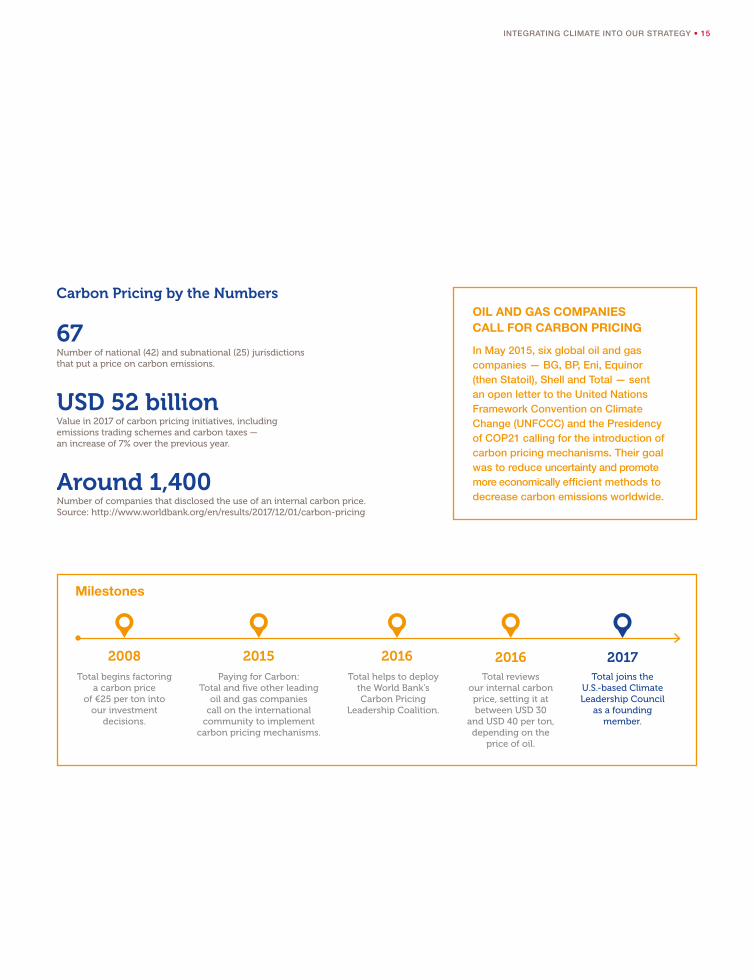
Total begins factoring a carbon price
of €25 per ton into our investment
decisions.
2008Paying for Carbon:
Total and five other leading oil and gas companies
call on the international community to implement
carbon pricing mechanisms.
2015Total helps to deploy
the World Bank’s Carbon Pricing
Leadership Coalition.
2016Total joins the
U.S.-based Climate Leadership Council
as a founding member.
2017Total reviews
our internal carbon price, setting it at between USD 30
and USD 40 per ton, depending on the
price of oil.
2016
Milestones
67 Number of national (42) and subnational (25) jurisdictions that put a price on carbon emissions.
Around 1,400Number of companies that disclosed the use of an internal carbon price.Source: http://www.worldbank.org/en/results/2017/12/01/carbon-pricing
USD 52 billion Value in 2017 of carbon pricing initiatives, including emissions trading schemes and carbon taxes — an increase of 7% over the previous year.
Carbon Pricing by the Numbers
16 • INTEGRATING CLIMATE INTO OUR STRATEGY
The past two years have seen significant efforts — among them the Oil and Gas Climate Initiative (OGCI) and IPIECA’s Methane Guiding Principles — to reduce methane emissions along the gas value chain. What should our main focus be?
The focus of course needs to remain on tackling emissions from the nine core sources1 of methane leakage [identified by the Oil & Gas Methane Partnership (OGMP)], and ensuring best practice is deployed across the entire geographical spread of installations.
A key issue, and one on which we all need to work concurrently, is that of a broader lack of good data. The Climate and Clean Air Coalition (CCAC), UN Environment and the Environmental Defense Fund are working with the 10 OGCI companies on this. It’s crucial that while we’re working on reducing known emissions that we continue to improve measurement and reporting.
Carbon capture, utilization and storage (CCUS) seems more and more crucial to achieve net zero emissions in the second half of the century. How can the private sector, governments, investors and civil society work together better to demonstrate the value of and pressing need for CCUS?
There is still huge progress that needs to be made, both on proof of concept and integrity of storage — as well as applications that truly reduce CO2 in the atmosphere rather than facilitate a business as usual approach — in other words provide a “get out of jail free” card for fossil fuel emissions.
“ We’re at a point where renewables can compete with fossil fuels.”
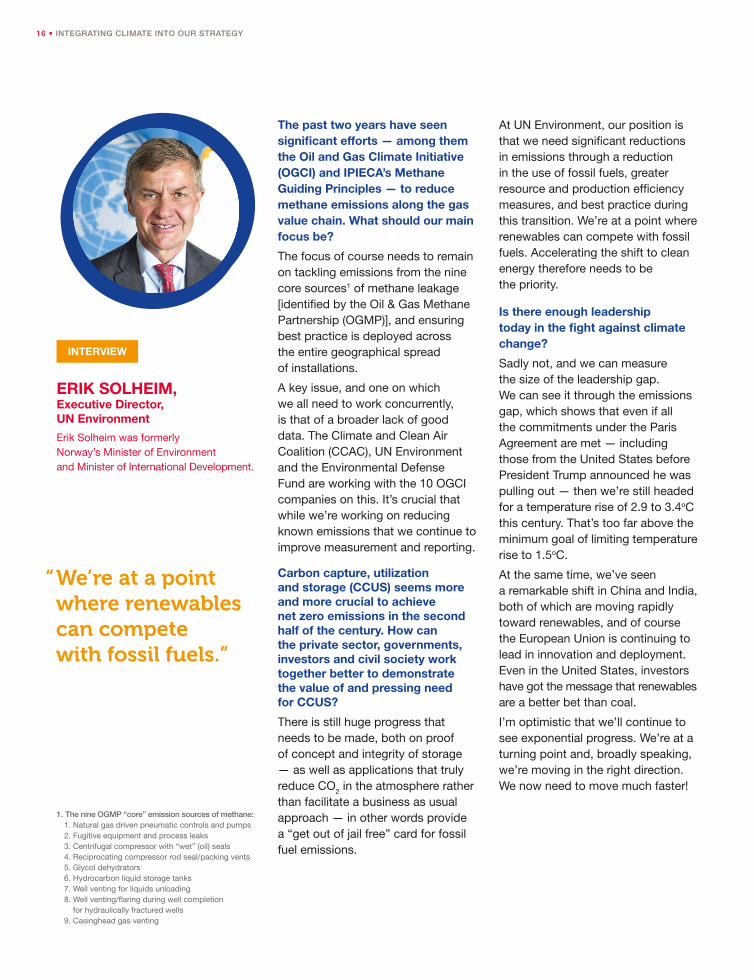
ERIK SOLHEIM, Executive Director, UN Environment
Erik Solheim was formerly Norway’s Minister of Environment and Minister of International Development.
At UN Environment, our position is that we need significant reductions in emissions through a reduction in the use of fossil fuels, greater resource and production efficiency measures, and best practice during this transition. We’re at a point where renewables can compete with fossil fuels. Accelerating the shift to clean energy therefore needs to be the priority.
Is there enough leadership today in the fight against climate change?
Sadly not, and we can measure the size of the leadership gap. We can see it through the emissions gap, which shows that even if all the commitments under the Paris Agreement are met — including those from the United States before President Trump announced he was pulling out — then we’re still headed for a temperature rise of 2.9 to 3.4oC this century. That’s too far above the minimum goal of limiting temperature rise to 1.5oC.
At the same time, we’ve seen a remarkable shift in China and India, both of which are moving rapidly toward renewables, and of course the European Union is continuing to lead in innovation and deployment. Even in the United States, investors have got the message that renewables are a better bet than coal.
I’m optimistic that we’ll continue to see exponential progress. We’re at a turning point and, broadly speaking, we’re moving in the right direction. We now need to move much faster!
INTERVIEW
1. The nine OGMP “core” emission sources of methane:1. Natural gas driven pneumatic controls and pumps2. Fugitive equipment and process leaks3. Centrifugal compressor with “wet” (oil) seals4. Reciprocating compressor rod seal/packing vents5. Glycol dehydrators6. Hydrocarbon liquid storage tanks7. Well venting for liquids unloading8. Well venting/flaring during well completion
for hydraulically fractured wells9. Casinghead gas venting
INTEGRATING CLIMATE INTO OUR STRATEGY • 17
Finding and Supporting Game-Changing Technology
1. Accelerated deployment of carbon capture, utilization and storage; managing methane emissions; improving energy efficiency in the industrial sector; and energy efficiency in transportation.
Climate change is an issue facing the entire planet, and the challenges raised in the IEA’s Sustainable Development (2°C) Scenario demand a united response as well. Through our participation in the Oil and Gas Climate Initiative (OGCI) and other international organizations and initiatives, we are sharing our commitment and technical expertise and supporting the rise of new and potentially game-changing technology.
Total is a founding member of the OGCI, which — with the addition of Petrobras in January 2018 — comprises 10 of the world’s largest oil and gas companies. Founded in 2014 to address the industry’s priority concerns1, the OGCI stepped up its activities in June 2017.
INITIAL INVESTMENTS
The OGCI’s billion-dollar Climate Investments fund invests in technology that has the potential to significantly reduce emissions from energy production and consumption. Among its initial investments:• A project aiming to design the world’s first commercial
gas plant using a full-scale carbon capture and storage facility with industrial CO2 sequestration capability (Clean Gas Project).
• A solution for lowering the carbon footprint of cement by using carbon dioxide instead of water to cure concrete (Solidia Technologies).
• A high-efficiency opposed-piston engine that reduces greenhouse gas emissions (Achates Power).
• A technology that uses CO2 as raw material for the manufacture of polyols, the base of polyurethanes, which are plastics with multiple applications (Econic Technologies).
PARTICIPATING IN INTERNATIONAL INITIATIVES
In addition to the group action we undertake through our participation in the OGCI, Total is lending active support to a variety of international initiatives involving both the public and private sectors, to:
• Introduce carbon pricing, as part of the World Bank’s Carbon Pricing Leadership Coalition, the U.N. Global Compact’s Caring for Climate initiative and the Paying for Carbon Coalition.
• Eliminate routine flaring, as part of the World Bank’s Zero Routine Flaring by 2030 initiative.
• Increase transparency, based on the recommendations of the G20 Financial Stability Board and those of the Task Force on Climate-related Financial Disclosures (TCFD).
• Develop new, cutting-edge companies in the field of energy, since 2017 as part of the Breakthrough Energy Coalition (BEC), a group of investors founded by Bill Gates in 2015, and since 2016 as part of the billion-dollar Breakthrough Energy Ventures fund, established by the BEC in 2016.
18 • INTEGRATING CLIMATE INTO OUR STRATEGY
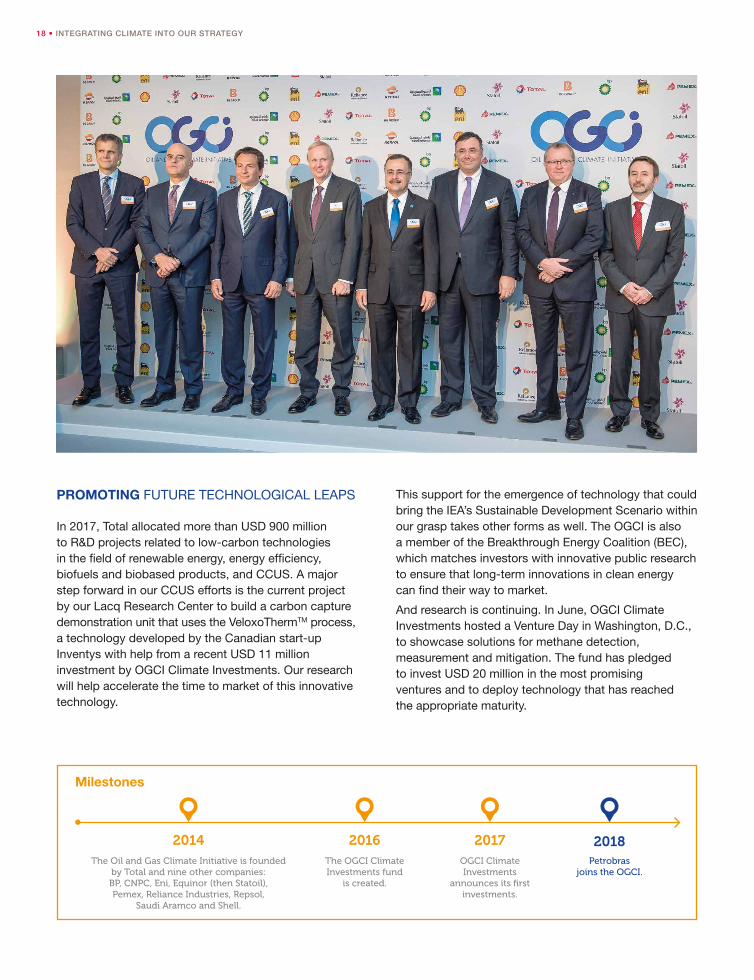
The Oil and Gas Climate Initiative is founded by Total and nine other companies: BP, CNPC, Eni, Equinor (then Statoil), Pemex, Reliance Industries, Repsol,
Saudi Aramco and Shell.
2014The OGCI Climate Investments fund
is created.
2016OGCI Climate Investments
announces its first investments.
2017Petrobras
joins the OGCI.
2018
Milestones
PROMOTING FUTURE TECHNOLOGICAL LEAPS
In 2017, Total allocated more than USD 900 million to R&D projects related to low-carbon technologies in the field of renewable energy, energy efficiency, biofuels and biobased products, and CCUS. A major step forward in our CCUS efforts is the current project by our Lacq Research Center to build a carbon capture demonstration unit that uses the VeloxoThermTM process, a technology developed by the Canadian start-up Inventys with help from a recent USD 11 million investment by OGCI Climate Investments. Our research will help accelerate the time to market of this innovative technology.
This support for the emergence of technology that could bring the IEA’s Sustainable Development Scenario within our grasp takes other forms as well. The OGCI is also a member of the Breakthrough Energy Coalition (BEC), which matches investors with innovative public research to ensure that long-term innovations in clean energy can find their way to market.
And research is continuing. In June, OGCI Climate Investments hosted a Venture Day in Washington, D.C., to showcase solutions for methane detection, measurement and mitigation. The fund has pledged to invest USD 20 million in the most promising ventures and to deploy technology that has reached the appropriate maturity.
INTEGRATING CLIMATE INTO OUR STRATEGY • 19
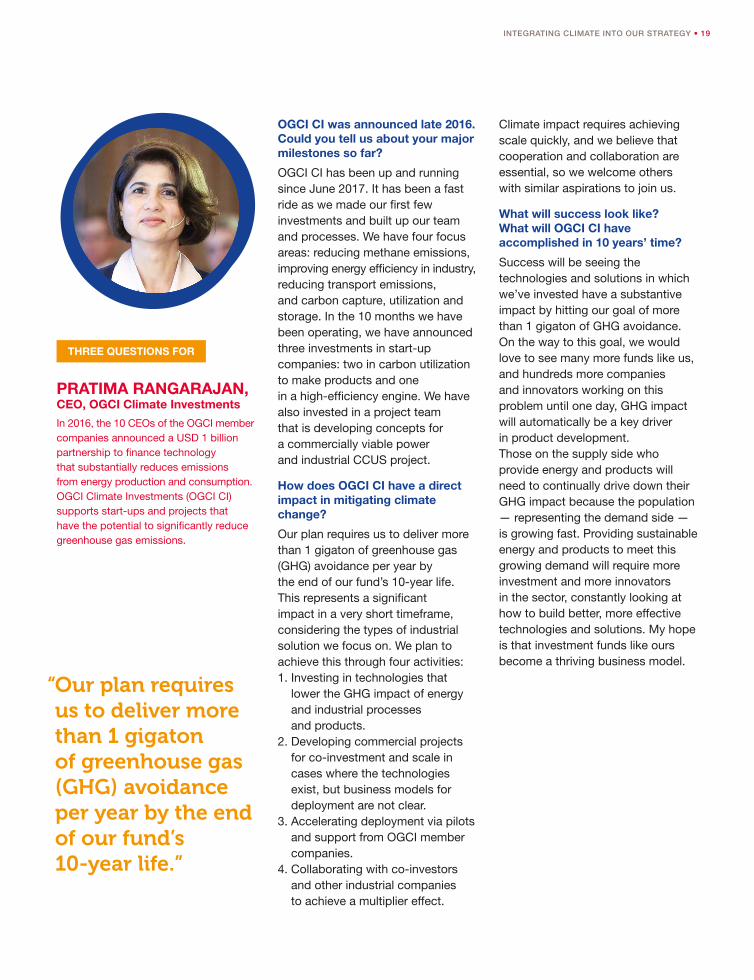
OGCI CI was announced late 2016. Could you tell us about your major milestones so far?
OGCI CI has been up and running since June 2017. It has been a fast ride as we made our first few investments and built up our team and processes. We have four focus areas: reducing methane emissions, improving energy efficiency in industry, reducing transport emissions, and carbon capture, utilization and storage. In the 10 months we have been operating, we have announced three investments in start-up companies: two in carbon utilization to make products and one in a high-efficiency engine. We have also invested in a project team that is developing concepts for a commercially viable power and industrial CCUS project.
How does OGCI CI have a direct impact in mitigating climate change?
Our plan requires us to deliver more than 1 gigaton of greenhouse gas (GHG) avoidance per year by the end of our fund’s 10-year life. This represents a significant impact in a very short timeframe, considering the types of industrial solution we focus on. We plan to achieve this through four activities: 1. Investing in technologies that
lower the GHG impact of energy and industrial processes and products.
2. Developing commercial projects for co-investment and scale in cases where the technologies exist, but business models for deployment are not clear.
3. Accelerating deployment via pilots and support from OGCI member companies.
4. Collaborating with co-investors and other industrial companies to achieve a multiplier effect.
“ Our plan requires us to deliver more than 1 gigaton of greenhouse gas (GHG) avoidance per year by the end of our fund’s 10-year life.”
PRATIMA RANGARAJAN, CEO, OGCI Climate Investments
In 2016, the 10 CEOs of the OGCI member companies announced a USD 1 billion partnership to finance technology that substantially reduces emissions from energy production and consumption. OGCI Climate Investments (OGCI CI) supports start-ups and projects that have the potential to significantly reduce greenhouse gas emissions.
Climate impact requires achieving scale quickly, and we believe that cooperation and collaboration are essential, so we welcome others with similar aspirations to join us.
What will success look like? What will OGCI CI have accomplished in 10 years’ time?
Success will be seeing the technologies and solutions in which we’ve invested have a substantive impact by hitting our goal of more than 1 gigaton of GHG avoidance. On the way to this goal, we would love to see many more funds like us, and hundreds more companies and innovators working on this problem until one day, GHG impact will automatically be a key driver in product development. Those on the supply side who provide energy and products will need to continually drive down their GHG impact because the population — representing the demand side — is growing fast. Providing sustainable energy and products to meet this growing demand will require more investment and more innovators in the sector, constantly looking at how to build better, more effective technologies and solutions. My hope is that investment funds like ours become a thriving business model.
THREE QUESTIONS FOR
20 • INTEGRATING CLIMATE INTO OUR STRATEGY
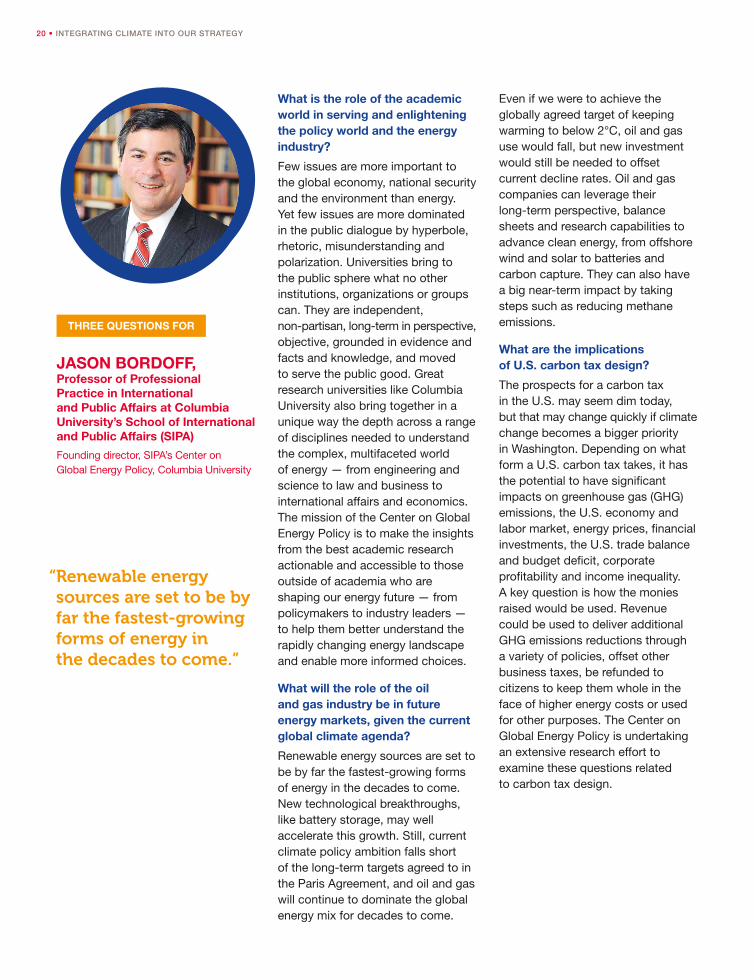
“ Renewable energy sources are set to be by far the fastest-growing forms of energy in the decades to come.”
JASON BORDOFF, Professor of Professional Practice in International and Public Affairs at Columbia University’s School of International and Public Affairs (SIPA)
Founding director, SIPA’s Center on Global Energy Policy, Columbia University
What is the role of the academic world in serving and enlightening the policy world and the energy industry?
Few issues are more important to the global economy, national security and the environment than energy. Yet few issues are more dominated in the public dialogue by hyperbole, rhetoric, misunderstanding and polarization. Universities bring to the public sphere what no other institutions, organizations or groups can. They are independent, non-partisan, long-term in perspective, objective, grounded in evidence and facts and knowledge, and moved to serve the public good. Great research universities like Columbia University also bring together in a unique way the depth across a range of disciplines needed to understand the complex, multifaceted world of energy — from engineering and science to law and business to international affairs and economics. The mission of the Center on Global Energy Policy is to make the insights from the best academic research actionable and accessible to those outside of academia who are shaping our energy future — from policymakers to industry leaders — to help them better understand the rapidly changing energy landscape and enable more informed choices.
What will the role of the oil and gas industry be in future energy markets, given the current global climate agenda?
Renewable energy sources are set to be by far the fastest-growing forms of energy in the decades to come. New technological breakthroughs, like battery storage, may well accelerate this growth. Still, current climate policy ambition falls short of the long-term targets agreed to in the Paris Agreement, and oil and gas will continue to dominate the global energy mix for decades to come.
Even if we were to achieve the globally agreed target of keeping warming to below 2°C, oil and gas use would fall, but new investment would still be needed to offset current decline rates. Oil and gas companies can leverage their long-term perspective, balance sheets and research capabilities to advance clean energy, from offshore wind and solar to batteries and carbon capture. They can also have a big near-term impact by taking steps such as reducing methane emissions.
What are the implications of U.S. carbon tax design?
The prospects for a carbon tax in the U.S. may seem dim today, but that may change quickly if climate change becomes a bigger priority in Washington. Depending on what form a U.S. carbon tax takes, it has the potential to have significant impacts on greenhouse gas (GHG) emissions, the U.S. economy and labor market, energy prices, financial investments, the U.S. trade balance and budget deficit, corporate profitability and income inequality. A key question is how the monies raised would be used. Revenue could be used to deliver additional GHG emissions reductions through a variety of policies, offset other business taxes, be refunded to citizens to keep them whole in the face of higher energy costs or used for other purposes. The Center on Global Energy Policy is undertaking an extensive research effort to examine these questions related to carbon tax design.
THREE QUESTIONS FOR
Our Initiatives
Mindful of the part we play, we take action across our value chain to reduce our impact on the climate and promote the responsible use of energy. What actions have we already implemented? Where do we stand in relation to our objectives? How are we taking into account the implications of the Sustainable Development (2°C) Scenario for the oil and gas market?
22 • INTEGRATING CLIMATE INTO OUR STRATEGY
A Carbon Intensity Indicator to Curtail Emissions Related to Our Energy Products
METHOD
Integrating climate issues into our strategy goes beyond simply reducing emissions at our industrial facilities. It also involves gradually decreasing the carbon intensity of the energy products we make available to our customers. With the aim of gaining a comprehensive perspective on the emissions from those products, we use a carbon intensity indicator to report on all of the emissions associated with the products we sell. This metric reflects the complete emissions from each energy product. For oil and gas, for example, that means everything from well to end use as a fuel; for solar power, from solar panel manufacturing to the sale of electricity.
Total already reports Scope 31 emissions from its sales of oil and gas based on the Petroleum Industry Guidelines for Reporting Greenhouse Gas Emissions published by IPIECA, which are consistent with the Greenhouse Gas Protocol. In our Registration Document, we report Category 11 of Scope 3 (Use of sold products), which is the most material.
Today our business goes well beyond the sale of products derived from oil and gas. We market solar panels, batteries and green power; we provide charging stations for use by our customers, and much more. These new low-carbon products help to provide the world with energy while reducing the emissions related to their use.
We wanted to develop a metric that shows the greenhouse gas emissions from all of our products. This metric, known as carbon intensity, is the ratio of the direct, lifetime emissions from the energy products we sell to the energy those products provide to our customers.
The data we use to calculate that ratio includes:
• For the numerator:- Scope 1 & 2 emissions from the energy products
we sell, based on Total’s average emission rates.- Scope 3 emissions from the products we sell.
For those sales we apply stoichiometric emissions factors by product to obtain a quantity of emissions 2. Non-fuel products (asphalt and bitumen, lubricants, plastics, etc.) are not accounted for.
- Negative emissions stored using CCUS and in natural carbon sinks.
• For the denominator:- The quantity of energy sold. Average load factor and
efficiency are used to obtain equivalents for electricity generated from fossil fuels and from other sources.
In accordance with IPIECA recommendations, when the nature of a value chain within an integrated company requires trade-offs, the maximum flows from that value chain are used for calculation purposes.
1. Scope 1: Direct emissions; Scope 2: Indirect emissions from energy consumption; Scope 3: Other indirect emissions.
2. CDP, “Guidance Methodology for Estimation of Scope 3 Category 11 Emissions for Oil and Gas Companies,” Climate Change Questionnaire, 2016.
INTEGRATING CLIMATE INTO OUR STRATEGY • 23
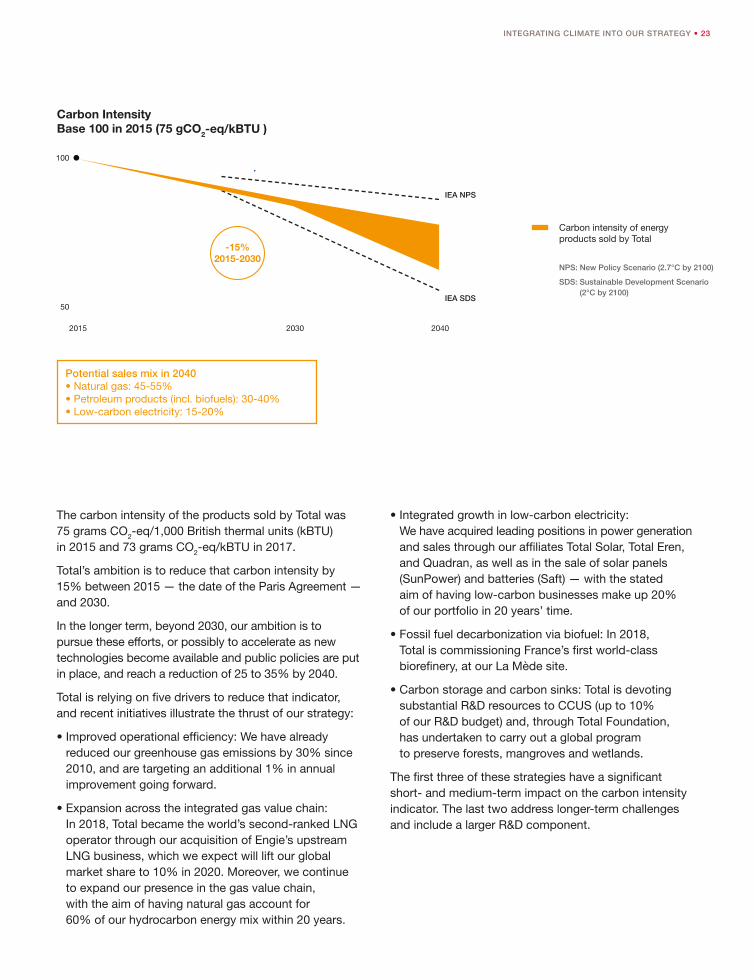
The carbon intensity of the products sold by Total was 75 grams CO2-eq/1,000 British thermal units (kBTU) in 2015 and 73 grams CO2-eq/kBTU in 2017.
Total’s ambition is to reduce that carbon intensity by 15% between 2015 — the date of the Paris Agreement — and 2030.
In the longer term, beyond 2030, our ambition is to pursue these efforts, or possibly to accelerate as new technologies become available and public policies are put in place, and reach a reduction of 25 to 35% by 2040.
Total is relying on five drivers to reduce that indicator, and recent initiatives illustrate the thrust of our strategy:
• Improved operational efficiency: We have already reduced our greenhouse gas emissions by 30% since 2010, and are targeting an additional 1% in annual improvement going forward.
• Expansion across the integrated gas value chain: In 2018, Total became the world’s second-ranked LNG operator through our acquisition of Engie’s upstream LNG business, which we expect will lift our global market share to 10% in 2020. Moreover, we continue to expand our presence in the gas value chain, with the aim of having natural gas account for 60% of our hydrocarbon energy mix within 20 years.
• Integrated growth in low-carbon electricity: We have acquired leading positions in power generation and sales through our affiliates Total Solar, Total Eren, and Quadran, as well as in the sale of solar panels (SunPower) and batteries (Saft) — with the stated aim of having low-carbon businesses make up 20% of our portfolio in 20 years’ time.
• Fossil fuel decarbonization via biofuel: In 2018, Total is commissioning France’s first world-class biorefinery, at our La Mède site.
• Carbon storage and carbon sinks: Total is devoting substantial R&D resources to CCUS (up to 10% of our R&D budget) and, through Total Foundation, has undertaken to carry out a global program to preserve forests, mangroves and wetlands.
The first three of these strategies have a significant short- and medium-term impact on the carbon intensity indicator. The last two address longer-term challenges and include a larger R&D component.
Carbon IntensityBase 100 in 2015 (75 gCO2-eq/kBTU )
IEA NPS
IEA SDS50
100
-15%2015-2030
2015 2030 2040
Potential sales mix in 2040• Natural gas: 45-55%• Petroleum products (incl. biofuels): 30-40%• Low-carbon electricity: 15-20%
Carbon intensity of energy products sold by Total
NPS: New Policy Scenario (2.7°C by 2100)
SDS: Sustainable Development Scenario (2°C by 2100)
24 • INTEGRATING CLIMATE INTO OUR STRATEGY
Avoided Emissions: Additional ActionsThe carbon intensity indicator for Total products measures average emission volumes per unit of energy sold. It does not reflect our development and consulting activities aimed at preventing greenhouse gas emissions.
Those activities complement our other operations and include: • The energy efficiency solutions offered by our affiliates
GreenFlex, BHC Energy and Tenag.• Product certification programs, such as Total Ecosolutions. • LNG import facilities (FSRUs1), such as our planned unit
in Côte d’Ivoire, which allow countries to import natural gas for their energy needs in place of coal.
• Carbon offsetting programs such as our Adilabad biogas project in India.
All these programs and services help to reduce greenhouse gas emissions.
Thanks to the Total Ecosolutions program launched in 2009, our customers can become smarter, more frugal consumers. The idea is to propose innovative solutions that significantly outperform the market standard in terms of environmental impact (including their impact on health) across their life cycle while offering an equivalent service. These solutions:• Reduce carbon emissions.• Use fewer non-renewable resources.• Cut water consumption.• Have a reduced impact on health.• Have a lower impact on ecosystems.
As of December 2017, 93 products and services had earned the Total Ecosolutions label, including SunPower solar panels, Excellium fuels and lubricants, and high-performance plastics.
More than 10 million tons of carbon emissions have been avoided since the program’s launch in 2009, including 1.85 million tons in 2017 alone — equivalent to the emissions from a European city with 196,000 inhabitants 2.
1. Floating Storage and Regasification Units.
2. Source: Eurostat, 2013 Greenhouse Gas Per Capita Emissions for EU-28 Member States.
What Exactly Are Avoided Emissions? 1
Businesses can facilitate the transition to a low-carbon economy by developing solutions that help reduce emissions in the downstream value chain compared to standard current technology.
Avoided emissions are calculated by identifying the total greenhouse gas emissions over the entire life cycle of the solution being assessed, under the assessment scenario conditions, versus the benchmark solution, under the benchmark scenario conditions.
For example, the methodological framework used for power generation is the UNFCCC Clean Development Mechanism (CDM). In most cases, the emissions factor in the benchmark solution is calculated using the “average electricity mix” for the countries being studied, unless it can be shown that the solution being assessed will replace a more carbon-intensive form of energy.
1. Reference: http://www.epe-asso.org/en/avoided-emissions-march-2018/
A CLOSER LOOK
INTEGRATING CLIMATE INTO OUR STRATEGY • 25
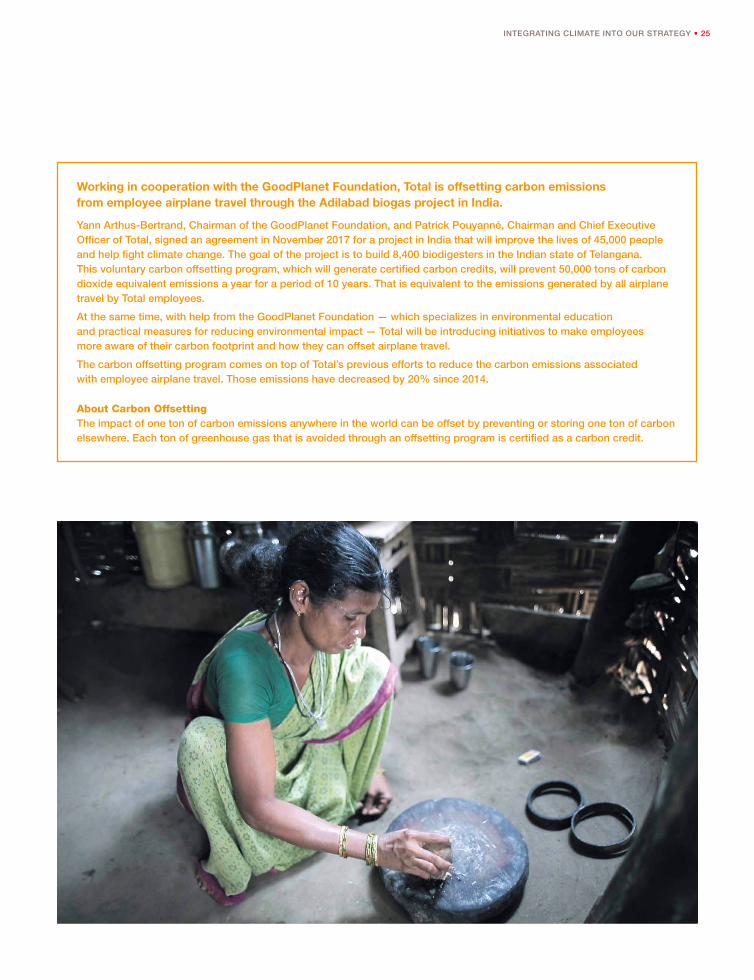
Working in cooperation with the GoodPlanet Foundation, Total is offsetting carbon emissions from employee airplane travel through the Adilabad biogas project in India.
Yann Arthus-Bertrand, Chairman of the GoodPlanet Foundation, and Patrick Pouyanné, Chairman and Chief Executive Officer of Total, signed an agreement in November 2017 for a project in India that will improve the lives of 45,000 people and help fight climate change. The goal of the project is to build 8,400 biodigesters in the Indian state of Telangana. This voluntary carbon offsetting program, which will generate certified carbon credits, will prevent 50,000 tons of carbon dioxide equivalent emissions a year for a period of 10 years. That is equivalent to the emissions generated by all airplane travel by Total employees.
At the same time, with help from the GoodPlanet Foundation — which specializes in environmental education and practical measures for reducing environmental impact — Total will be introducing initiatives to make employees more aware of their carbon footprint and how they can offset airplane travel.
The carbon offsetting program comes on top of Total’s previous efforts to reduce the carbon emissions associated with employee airplane travel. Those emissions have decreased by 20% since 2014.
About Carbon OffsettingThe impact of one ton of carbon emissions anywhere in the world can be offset by preventing or storing one ton of carbon elsewhere. Each ton of greenhouse gas that is avoided through an offsetting program is certified as a carbon credit.
26 • INTEGRATING CLIMATE INTO OUR STRATEGY
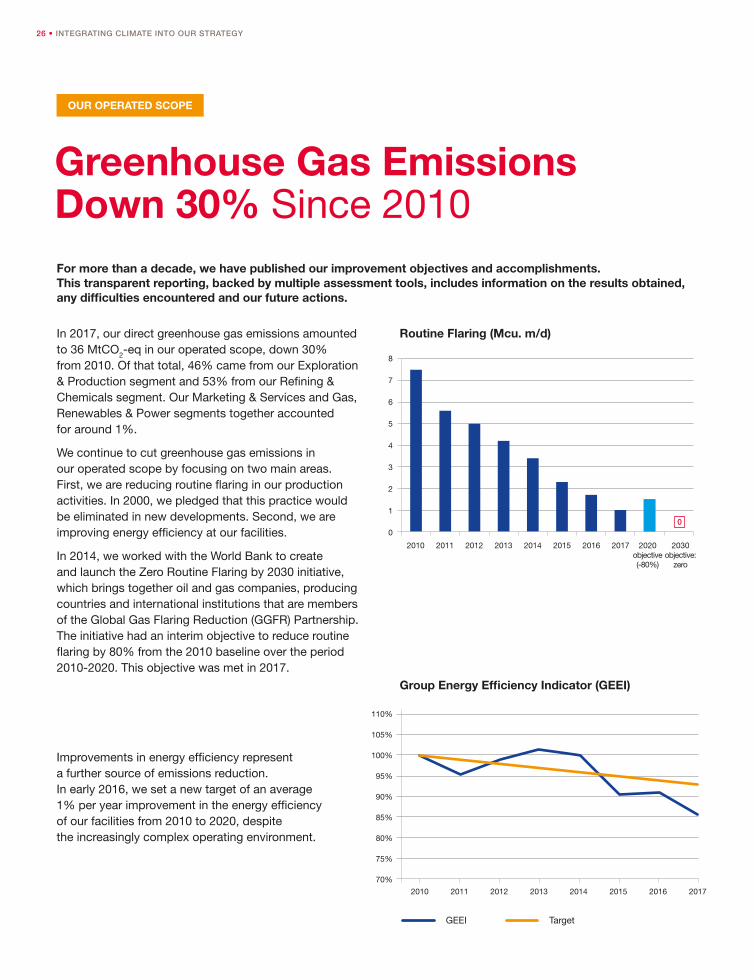
In 2017, our direct greenhouse gas emissions amounted to 36 MtCO2-eq in our operated scope, down 30% from 2010. Of that total, 46% came from our Exploration & Production segment and 53% from our Refining & Chemicals segment. Our Marketing & Services and Gas, Renewables & Power segments together accounted for around 1%.
We continue to cut greenhouse gas emissions in our operated scope by focusing on two main areas. First, we are reducing routine flaring in our production activities. In 2000, we pledged that this practice would be eliminated in new developments. Second, we are improving energy efficiency at our facilities.
In 2014, we worked with the World Bank to create and launch the Zero Routine Flaring by 2030 initiative, which brings together oil and gas companies, producing countries and international institutions that are members of the Global Gas Flaring Reduction (GGFR) Partnership. The initiative had an interim objective to reduce routine flaring by 80% from the 2010 baseline over the period 2010-2020. This objective was met in 2017.
Greenhouse Gas Emissions Down 30% Since 2010For more than a decade, we have published our improvement objectives and accomplishments. This transparent reporting, backed by multiple assessment tools, includes information on the results obtained, any difficulties encountered and our future actions.
Improvements in energy efficiency represent a further source of emissions reduction. In early 2016, we set a new target of an average 1% per year improvement in the energy efficiency of our facilities from 2010 to 2020, despite the increasingly complex operating environment.
Routine Flaring (Mcu. m/d)
2010 2012 2014 2016 2017 2020 objective (-80%)
2030 objective:
zero
2011 2013 2015
4
0
6
2
5
1
7
3
8
0
Group Energy Efficiency Indicator (GEEI)
2010 2012 2014 2016 20172011 2013 2015
110%
105%
100%
95%
90%
85%
80%
75%
70%
TargetGEEI
OUR OPERATED SCOPE
INTEGRATING CLIMATE INTO OUR STRATEGY • 27
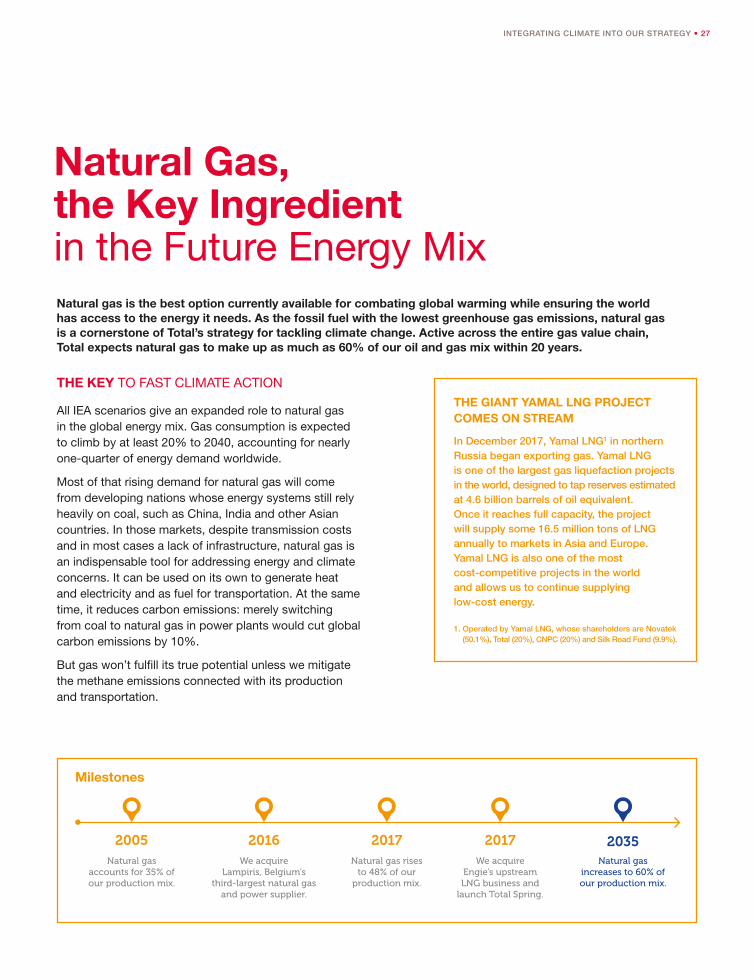
Natural Gas, the Key Ingredient in the Future Energy MixNatural gas is the best option currently available for combating global warming while ensuring the world has access to the energy it needs. As the fossil fuel with the lowest greenhouse gas emissions, natural gas is a cornerstone of Total’s strategy for tackling climate change. Active across the entire gas value chain, Total expects natural gas to make up as much as 60% of our oil and gas mix within 20 years.
THE KEY TO FAST CLIMATE ACTION
All IEA scenarios give an expanded role to natural gas in the global energy mix. Gas consumption is expected to climb by at least 20% to 2040, accounting for nearly one-quarter of energy demand worldwide.
Most of that rising demand for natural gas will come from developing nations whose energy systems still rely heavily on coal, such as China, India and other Asian countries. In those markets, despite transmission costs and in most cases a lack of infrastructure, natural gas is an indispensable tool for addressing energy and climate concerns. It can be used on its own to generate heat and electricity and as fuel for transportation. At the same time, it reduces carbon emissions: merely switching from coal to natural gas in power plants would cut global carbon emissions by 10%.
But gas won’t fulfill its true potential unless we mitigate the methane emissions connected with its production and transportation.
THE GIANT YAMAL LNG PROJECT COMES ON STREAM
In December 2017, Yamal LNG1 in northern Russia began exporting gas. Yamal LNG is one of the largest gas liquefaction projects in the world, designed to tap reserves estimated at 4.6 billion barrels of oil equivalent. Once it reaches full capacity, the project will supply some 16.5 million tons of LNG annually to markets in Asia and Europe. Yamal LNG is also one of the most cost-competitive projects in the world and allows us to continue supplying low-cost energy.
1. Operated by Yamal LNG, whose shareholders are Novatek (50.1%), Total (20%), CNPC (20%) and Silk Road Fund (9.9%).
Natural gas accounts for 35% of our production mix.
2005We acquire
Lampiris, Belgium’s third-largest natural gas
and power supplier.
2016Natural gas rises
to 48% of our production mix.
2017We acquire
Engie’s upstream LNG business and
launch Total Spring.
2017Natural gas
increases to 60% of our production mix.
2035
Milestones
28 • INTEGRATING CLIMATE INTO OUR STRATEGY
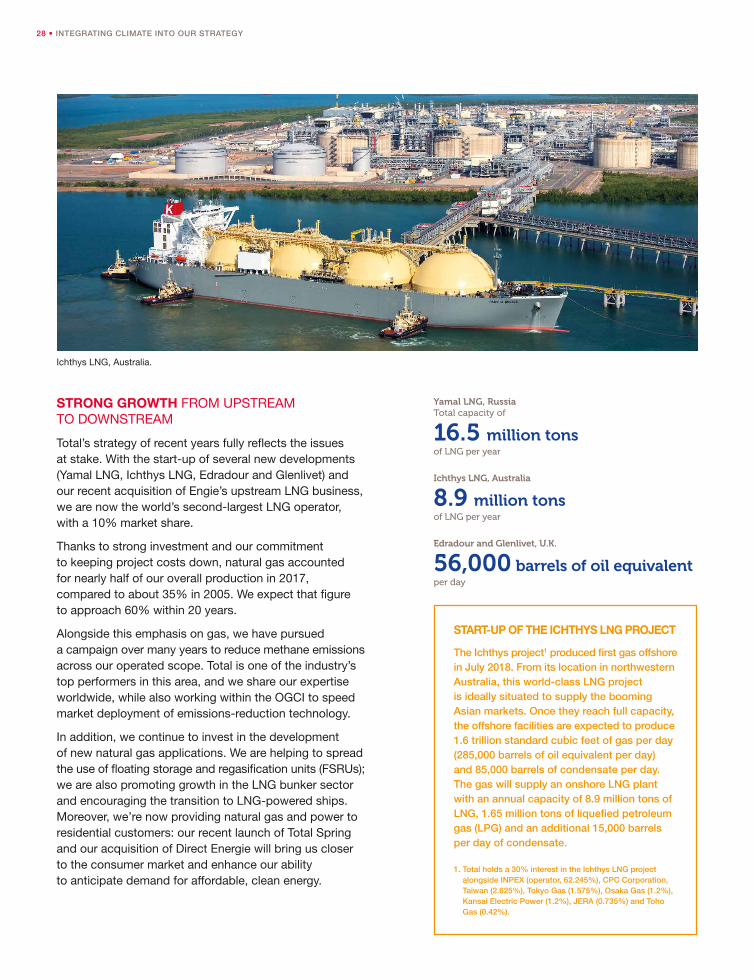
STRONG GROWTH FROM UPSTREAM TO DOWNSTREAM
Total’s strategy of recent years fully reflects the issues at stake. With the start-up of several new developments (Yamal LNG, Ichthys LNG, Edradour and Glenlivet) and our recent acquisition of Engie’s upstream LNG business, we are now the world’s second-largest LNG operator, with a 10% market share.
Thanks to strong investment and our commitment to keeping project costs down, natural gas accounted for nearly half of our overall production in 2017, compared to about 35% in 2005. We expect that figure to approach 60% within 20 years.
Alongside this emphasis on gas, we have pursued a campaign over many years to reduce methane emissions across our operated scope. Total is one of the industry’s top performers in this area, and we share our expertise worldwide, while also working within the OGCI to speed market deployment of emissions-reduction technology.
In addition, we continue to invest in the development of new natural gas applications. We are helping to spread the use of floating storage and regasification units (FSRUs); we are also promoting growth in the LNG bunker sector and encouraging the transition to LNG-powered ships. Moreover, we’re now providing natural gas and power to residential customers: our recent launch of Total Spring and our acquisition of Direct Energie will bring us closer to the consumer market and enhance our ability to anticipate demand for affordable, clean energy.
START-UP OF THE ICHTHYS LNG PROJECT
The Ichthys project1 produced first gas offshore in July 2018. From its location in northwestern Australia, this world-class LNG project is ideally situated to supply the booming Asian markets. Once they reach full capacity, the offshore facilities are expected to produce 1.6 trillion standard cubic feet of gas per day (285,000 barrels of oil equivalent per day) and 85,000 barrels of condensate per day. The gas will supply an onshore LNG plant with an annual capacity of 8.9 million tons of LNG, 1.65 million tons of liquefied petroleum gas (LPG) and an additional 15,000 barrels per day of condensate.
1. Total holds a 30% interest in the Ichthys LNG project alongside INPEX (operator, 62.245%), CPC Corporation, Taiwan (2.625%), Tokyo Gas (1.575%), Osaka Gas (1.2%), Kansai Electric Power (1.2%), JERA (0.735%) and Toho Gas (0.42%).
16.5 million tons
Yamal LNG, Russia Total capacity of
of LNG per year
56,000 barrels of oil equivalent
Edradour and Glenlivet, U.K.
per day
8.9 million tons
Ichthys LNG, Australia
of LNG per year
Ichthys LNG, Australia.
INTEGRATING CLIMATE INTO OUR STRATEGY • 29
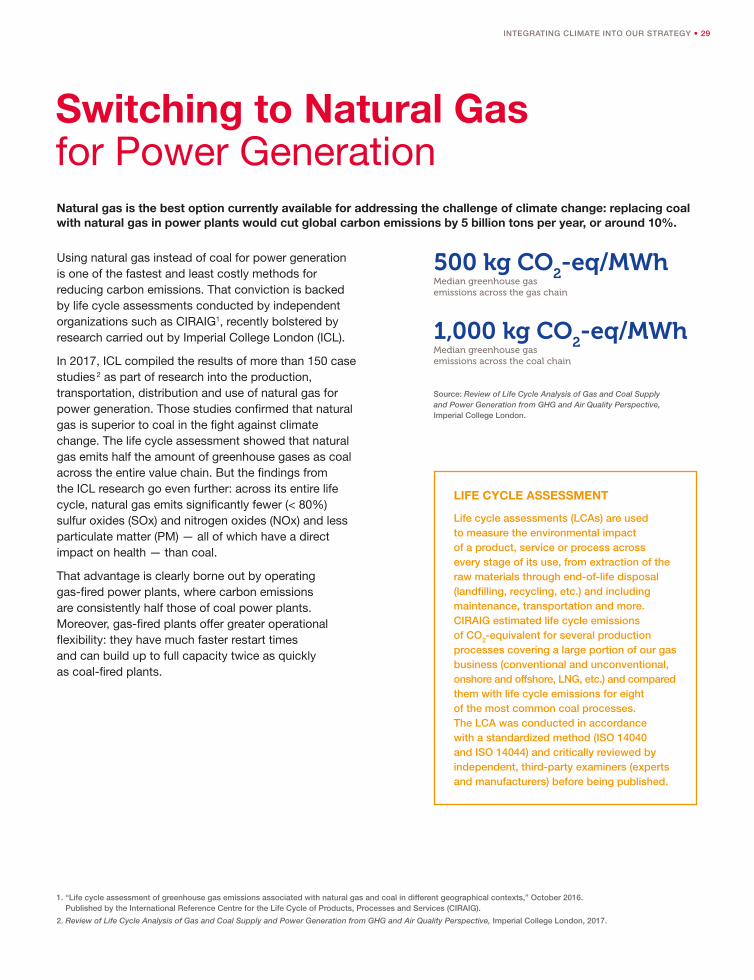
Switching to Natural Gas for Power GenerationNatural gas is the best option currently available for addressing the challenge of climate change: replacing coal with natural gas in power plants would cut global carbon emissions by 5 billion tons per year, or around 10%.
1. “Life cycle assessment of greenhouse gas emissions associated with natural gas and coal in different geographical contexts,” October 2016. Published by the International Reference Centre for the Life Cycle of Products, Processes and Services (CIRAIG).
2. Review of Life Cycle Analysis of Gas and Coal Supply and Power Generation from GHG and Air Quality Perspective, Imperial College London, 2017.
Using natural gas instead of coal for power generation is one of the fastest and least costly methods for reducing carbon emissions. That conviction is backed by life cycle assessments conducted by independent organizations such as CIRAIG1, recently bolstered by research carried out by Imperial College London (ICL).
In 2017, ICL compiled the results of more than 150 case studies 2 as part of research into the production, transportation, distribution and use of natural gas for power generation. Those studies confirmed that natural gas is superior to coal in the fight against climate change. The life cycle assessment showed that natural gas emits half the amount of greenhouse gases as coal across the entire value chain. But the findings from the ICL research go even further: across its entire life cycle, natural gas emits significantly fewer (< 80%) sulfur oxides (SOx) and nitrogen oxides (NOx) and less particulate matter (PM) — all of which have a direct impact on health — than coal.
That advantage is clearly borne out by operating gas-fired power plants, where carbon emissions are consistently half those of coal power plants. Moreover, gas-fired plants offer greater operational flexibility: they have much faster restart times and can build up to full capacity twice as quickly as coal-fired plants.
LIFE CYCLE ASSESSMENT
Life cycle assessments (LCAs) are used to measure the environmental impact of a product, service or process across every stage of its use, from extraction of the raw materials through end-of-life disposal (landfilling, recycling, etc.) and including maintenance, transportation and more. CIRAIG estimated life cycle emissions of CO2-equivalent for several production processes covering a large portion of our gas business (conventional and unconventional, onshore and offshore, LNG, etc.) and compared them with life cycle emissions for eight of the most common coal processes. The LCA was conducted in accordance with a standardized method (ISO 14040 and ISO 14044) and critically reviewed by independent, third-party examiners (experts and manufacturers) before being published.
500 kg CO2-eq/MWh
Median greenhouse gas emissions across the gas chain
1,000 kg CO2-eq/MWh
Median greenhouse gas emissions across the coal chain
Source: Review of Life Cycle Analysis of Gas and Coal Supply and Power Generation from GHG and Air Quality Perspective, Imperial College London.
30 • INTEGRATING CLIMATE INTO OUR STRATEGY
1. IPCC Fourth Assessment Report, 2007.
2. The Climate & Clean Air Coalition (CCAC) is a partnership of governments and industry to improve methane emissions measurement and control methods. It was established and promoted by UN Environment and the Environmental Defense Fund.
3. Including BP, Eni, Equinor, Neptune Energy International, Pemex, PTT, Repsol and Shell.
4. Alongside accelerated deployment of carbon capture and storage and improving energy efficiency in industry and transportation.
5. Conducted with UN Environment and Imperial College London.
6. Reducing Methane Emissions Across the Natural Gas Value Chain – Guiding Principles, with signatories including BP, Eni, Equinor, ExxonMobil, Repsol, Shell and Wintershall, as well as the IEA, the Environmental Defense Fund and other organizations.
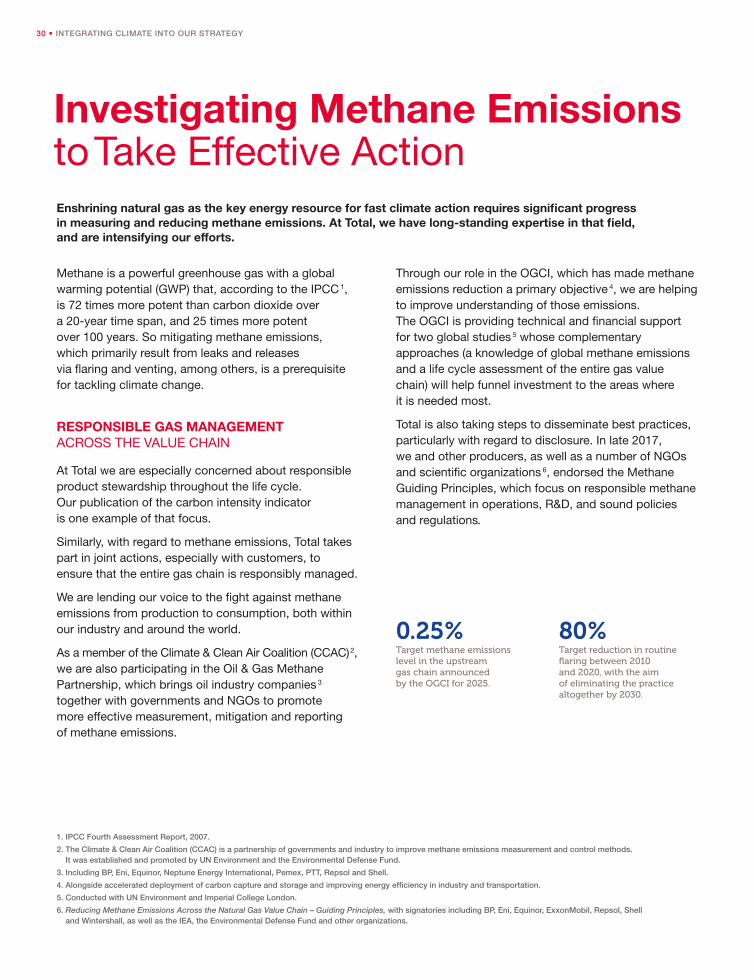
Investigating Methane Emissions to Take Effective Action
0.25% Target methane emissions level in the upstream gas chain announced by the OGCI for 2025.
80%Target reduction in routine flaring between 2010 and 2020, with the aim of eliminating the practice altogether by 2030.
Methane is a powerful greenhouse gas with a global warming potential (GWP) that, according to the IPCC 1, is 72 times more potent than carbon dioxide over a 20-year time span, and 25 times more potent over 100 years. So mitigating methane emissions, which primarily result from leaks and releases via flaring and venting, among others, is a prerequisite for tackling climate change.
RESPONSIBLE GAS MANAGEMENT ACROSS THE VALUE CHAIN
At Total we are especially concerned about responsible product stewardship throughout the life cycle. Our publication of the carbon intensity indicator is one example of that focus.
Similarly, with regard to methane emissions, Total takes part in joint actions, especially with customers, to ensure that the entire gas chain is responsibly managed.
We are lending our voice to the fight against methane emissions from production to consumption, both within our industry and around the world.
As a member of the Climate & Clean Air Coalition (CCAC) 2, we are also participating in the Oil & Gas Methane Partnership, which brings oil industry companies 3 together with governments and NGOs to promote more effective measurement, mitigation and reporting of methane emissions.
Through our role in the OGCI, which has made methane emissions reduction a primary objective 4, we are helping to improve understanding of those emissions. The OGCI is providing technical and financial support for two global studies 5 whose complementary approaches (a knowledge of global methane emissions and a life cycle assessment of the entire gas value chain) will help funnel investment to the areas where it is needed most.
Total is also taking steps to disseminate best practices, particularly with regard to disclosure. In late 2017, we and other producers, as well as a number of NGOs and scientific organizations 6, endorsed the Methane Guiding Principles, which focus on responsible methane management in operations, R&D, and sound policies and regulations.
Enshrining natural gas as the key energy resource for fast climate action requires significant progress in measuring and reducing methane emissions. At Total, we have long-standing expertise in that field, and are intensifying our efforts.
INTEGRATING CLIMATE INTO OUR STRATEGY • 31
1. This figure is the ratio of methane emissions by volume from operated upstream oil and gas production assets to the volume of natural gas production sold.
We eliminate routine flaring
on new projects.
2000An independent
auditor verifies Total’s environmental and social
indicators, including methane emissions.
2005We join the Climate & Clean Air Coalition and the Global Gas Flaring Reduction
(GGFR) Partnership.
2014We sign the
Methane Guiding Principles.
2017The field phase of
the methane studies underwritten by the
OGCI and the Oil & Gas Methane Partnership
gets under way.
2018
Milestones
MAINTAINING ONE OF THE INDUSTRY’S BEST PERFORMANCE RECORDS
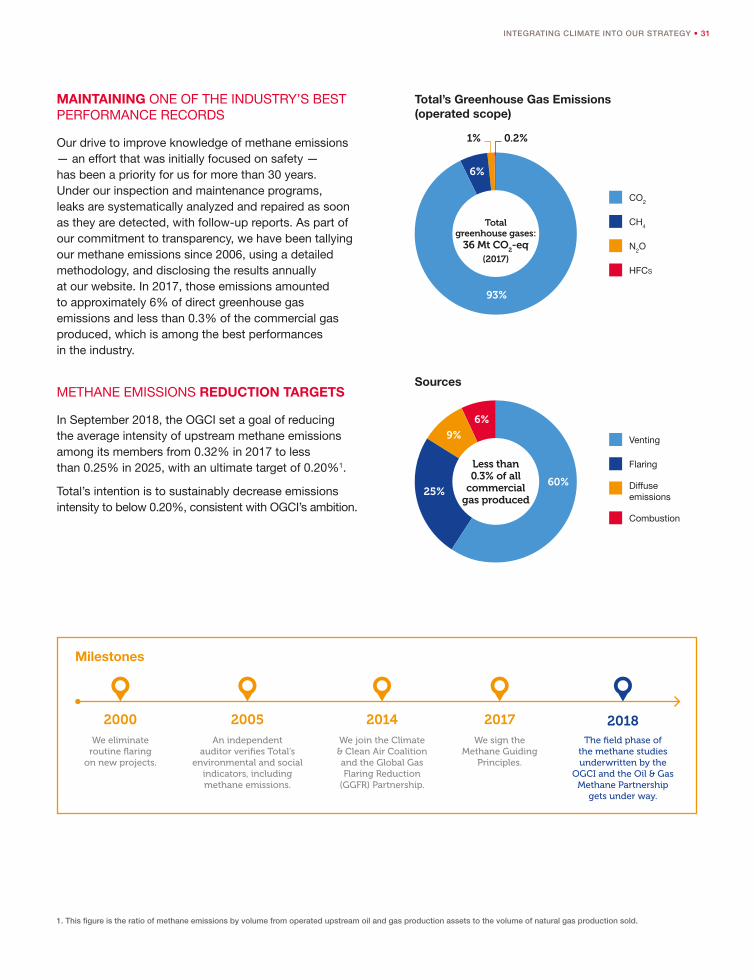
Our drive to improve knowledge of methane emissions — an effort that was initially focused on safety — has been a priority for us for more than 30 years. Under our inspection and maintenance programs, leaks are systematically analyzed and repaired as soon as they are detected, with follow-up reports. As part of our commitment to transparency, we have been tallying our methane emissions since 2006, using a detailed methodology, and disclosing the results annually at our website. In 2017, those emissions amounted to approximately 6% of direct greenhouse gas emissions and less than 0.3% of the commercial gas produced, which is among the best performances in the industry.
METHANE EMISSIONS REDUCTION TARGETS
In September 2018, the OGCI set a goal of reducing the average intensity of upstream methane emissions among its members from 0.32% in 2017 to less than 0.25% in 2025, with an ultimate target of 0.20%1.
Total’s intention is to sustainably decrease emissions intensity to below 0.20%, consistent with OGCI’s ambition.
Total’s Greenhouse Gas Emissions (operated scope)
CO2
CH4
N2O
HFCs
93%
0.2%1%
6%
Total greenhouse gases:
36 Mt CO2-eq
(2017)
Sources
Venting
Flaring
Diffuse emissions
Combustion
60%25%
9%
6%
Less than 0.3% of all
commercial gas produced
32 • INTEGRATING CLIMATE INTO OUR STRATEGY
1. The International Maritime Organization (http://www.imo.org) has mandated a global sulfur cap of 0.50% m/m (mass/mass) in the fuel oil used by ships, effective January 1, 2020.
2. CMA CGM is a global leader in the container shipping industry, operating in 160 countries through its network of over 755 local offices. It employs more than 30,000 people and operates 504 ships serving more than 420 commercial ports.
Steering the Shipping Industry Through the Energy Transition
In the maritime and inland waterway shipping industry, new and stricter European Union and international standards governing sulfur dioxide emissions1 are prompting ship owners to upgrade their fleets. Against that backdrop, LNG is uniquely suited to assume a larger role. It emits smaller amounts of sulfur oxide, nitrogen oxide and fine particulate matter and reduces carbon emissions by about 25%. As a result, it improves a ship’s energy efficiency design index (EEDI) by 20% compared to a fuel oil propulsion system.
TAILORED ENERGY SOLUTIONS
The wider use of LNG as a fuel is an important component of Total’s LNG strategy. In 2017, we helped shipping company CMA CGM 2 review the most ecofriendly energy solutions available, and were instrumental in its decision to equip nine of its 22,000-TEU (twenty-foot equivalent unit) newbuild container ships with LNG propulsion. Total was subsequently selected to supply fuel to the ships, amounting to 300,000 tons annually over 10 years.
In liquefied form, natural gas — the linchpin energy source for successful delivery of the IEA’s Sustainable Development Scenario — also provides a solution for the shipping industry as it confronts the energy transition in the medium term. Total is actively promoting the use of LNG bunker fuel in the container shipping industry as part of a comprehensive strategy for carbon-free transportation.
In 2020, we will acquire our first bunker vessel, with a capacity of 18,600 cubic meters, able to serve these new mega container ships in a single operation. The new vessel, 135 meters long but highly maneuverable, will be able to navigate ports and terminals in complete safety. LNG-powered itself and able to reliquefy boil-off gas, the ship will also comply with the most stringent environmental standards. With its large size, it will be able to service a growing market.
INTEGRATING CLIMATE INTO OUR STRATEGY • 33
Electricity, Pivotal to Our Low-Carbon Strategy
In the face of demographic growth, digital technology, electric vehicles, electric motor-driven systems in manufacturing, air conditioning and much more, the world is going electric. Electricity is coming to the forefront worldwide and in every scenario outlined by the IEA. By 2040, it will account for 40% of the rise in final consumption1, the same share of growth as oil over the past 25 years. To address the need for clean, affordable energy while complying with the IEA’s Sustainable Development Scenario, the world will need to curtail its use of coal for power generation and make greater use of low-carbon energy sources.
CAPITALIZING ON EVERY RESOURCE
At Total, we have taken this planetary imperative to heart. Confronted with a fast-growing and increasingly digital and distributed market, we created a new business segment — Gas, Renewables & Power (GRP) — tasked with managing the resources that will drive the energy transition.
Natural gas is an essential partner to renewable energy for power generation, and we have made it a cornerstone of our strategy. As the lowest-carbon fossil fuel, gas could make up 60% of our oil and gas production mix within 20 years. Total is also betting on growth in renewables, and photovoltaic solar in particular, with an integrated presence that ranges from solar panel manufacturing to marketing green energy to residential consumers. We continue to expand our energy efficiency services with the aim of reducing energy demand intensity. And we are developing projects in fields such as energy storage, clean fuels and carbon capture, utilization and storage (CCUS).
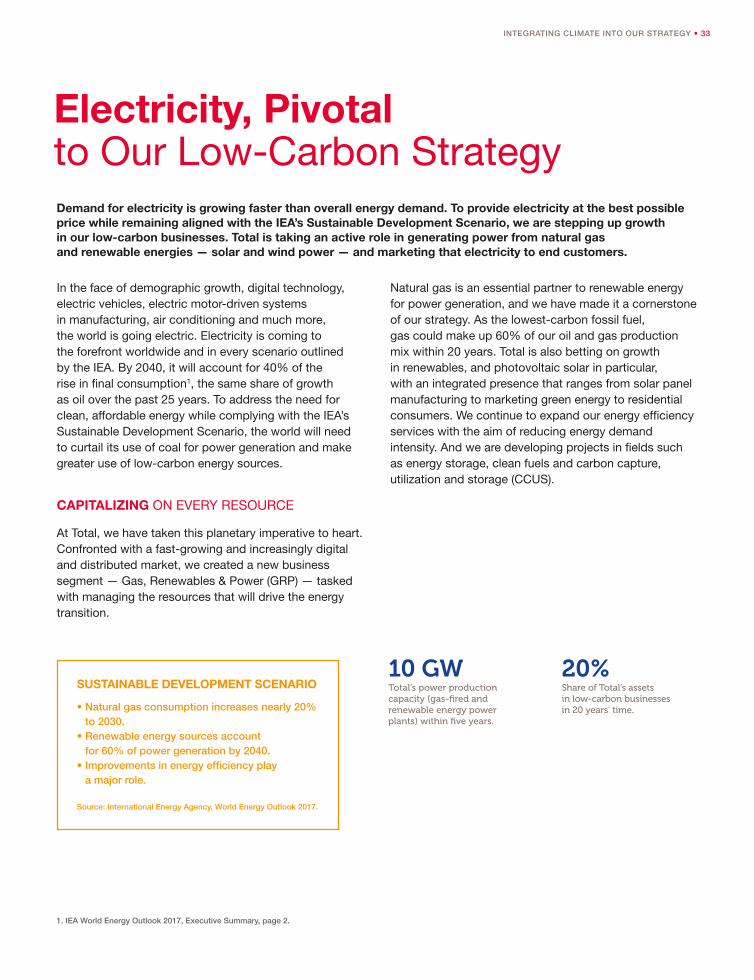
SUSTAINABLE DEVELOPMENT SCENARIO
• Natural gas consumption increases nearly 20% to 2030.
• Renewable energy sources account for 60% of power generation by 2040.
• Improvements in energy efficiency play a major role.
Source: International Energy Agency, World Energy Outlook 2017.
10 GWTotal’s power production capacity (gas-fired and renewable energy power plants) within five years.
20%Share of Total’s assets in low-carbon businesses in 20 years’ time.
Demand for electricity is growing faster than overall energy demand. To provide electricity at the best possible price while remaining aligned with the IEA’s Sustainable Development Scenario, we are stepping up growth in our low-carbon businesses. Total is taking an active role in generating power from natural gas and renewable energies — solar and wind power — and marketing that electricity to end customers.
1. IEA World Energy Outlook 2017, Executive Summary, page 2.
34 • INTEGRATING CLIMATE INTO OUR STRATEGY
Acquisitions for Sustainable Growth in Low-Carbon BusinessesIn support of our expansion in low-carbon businesses, Total continues to acquire new businesses that are integral to our strategy and bring us new expertise. These acquisitions will enable us to reduce the carbon intensity of our energy solutions while still meeting the surging demand for electricity.
As part of our intensified efforts to build an integrated presence across the gas value chain, Total announced in November 2017 that we were acquiring Engie’s upstream LNG business. This portfolio of assets1 fits well with Total’s own holdings. By combining these assets, we will expand our capacity in the areas of liquefaction (2.5 million tons), regasification (14 million tons annually) and shipping (10 LNG carriers), managing nearly 40 million tons of LNG beginning in 2020. As a result, Total will become the second-ranked LNG operator among the majors, with a 10% global market share.
In September 2017, energy efficiency specialist GreenFlex joined Total. GreenFlex will spearhead our expansion in this market in Europe, over and above the growth of our affiliates BHC Energy in France and Tenag in Germany.
Meanwhile, with the creation of Total Eren following our acquisition of an interest in EREN Renewable Energy (EREN RE), we have moved into wind power production while solidifying our presence in photovoltaic solar. Total Eren focuses solely on utility-scale plants, while Total Solar also develops distributed solar systems for industrial and commercial customers.
Lastly, in the wake of our 2017 launch of Total Spring — a natural gas and green power offering for the B2C market in France – our 2018 acquisition of Direct Energie will accelerate Total’s expansion in gas and power marketing, as well as power generation from natural gas and renewable energies. We are aiming for total gas-fired and renewable capacity in excess of 10 GW within five years, and a 7-million-strong customer base by 2022.
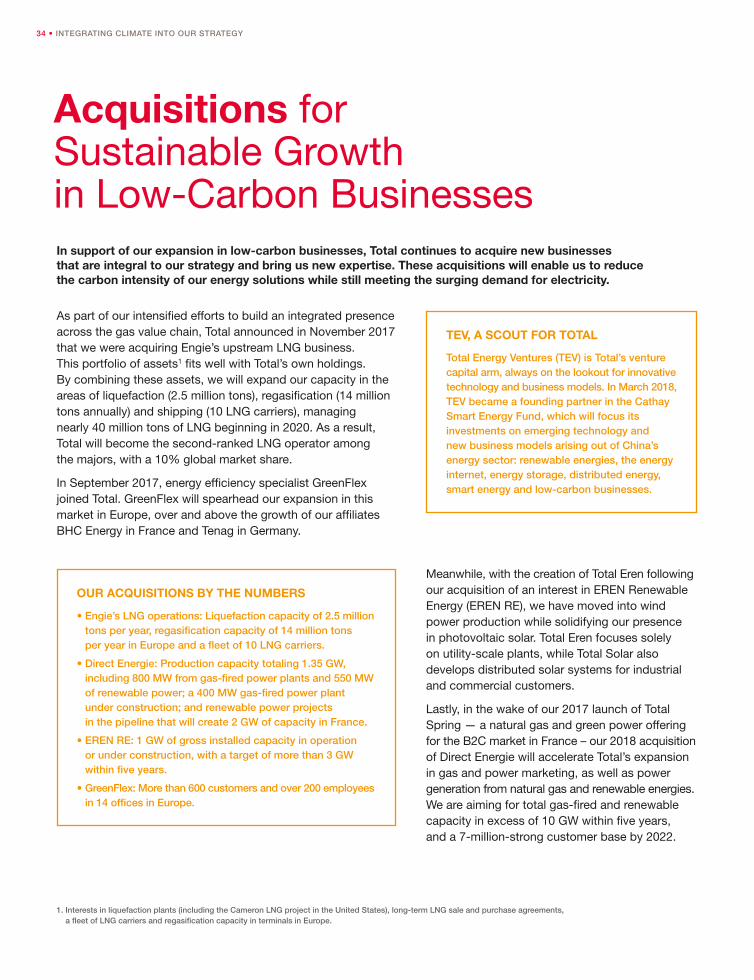
OUR ACQUISITIONS BY THE NUMBERS
• Engie’s LNG operations: Liquefaction capacity of 2.5 million tons per year, regasification capacity of 14 million tons per year in Europe and a fleet of 10 LNG carriers.
• Direct Energie: Production capacity totaling 1.35 GW, including 800 MW from gas-fired power plants and 550 MW of renewable power; a 400 MW gas-fired power plant under construction; and renewable power projects in the pipeline that will create 2 GW of capacity in France.
• EREN RE: 1 GW of gross installed capacity in operation or under construction, with a target of more than 3 GW within five years.
• GreenFlex: More than 600 customers and over 200 employees in 14 offices in Europe.
TEV, A SCOUT FOR TOTAL
Total Energy Ventures (TEV) is Total’s venture capital arm, always on the lookout for innovative technology and business models. In March 2018, TEV became a founding partner in the Cathay Smart Energy Fund, which will focus its investments on emerging technology and new business models arising out of China’s energy sector: renewable energies, the energy internet, energy storage, distributed energy, smart energy and low-carbon businesses.
1. Interests in liquefaction plants (including the Cameron LNG project in the United States), long-term LNG sale and purchase agreements, a fleet of LNG carriers and regasification capacity in terminals in Europe.
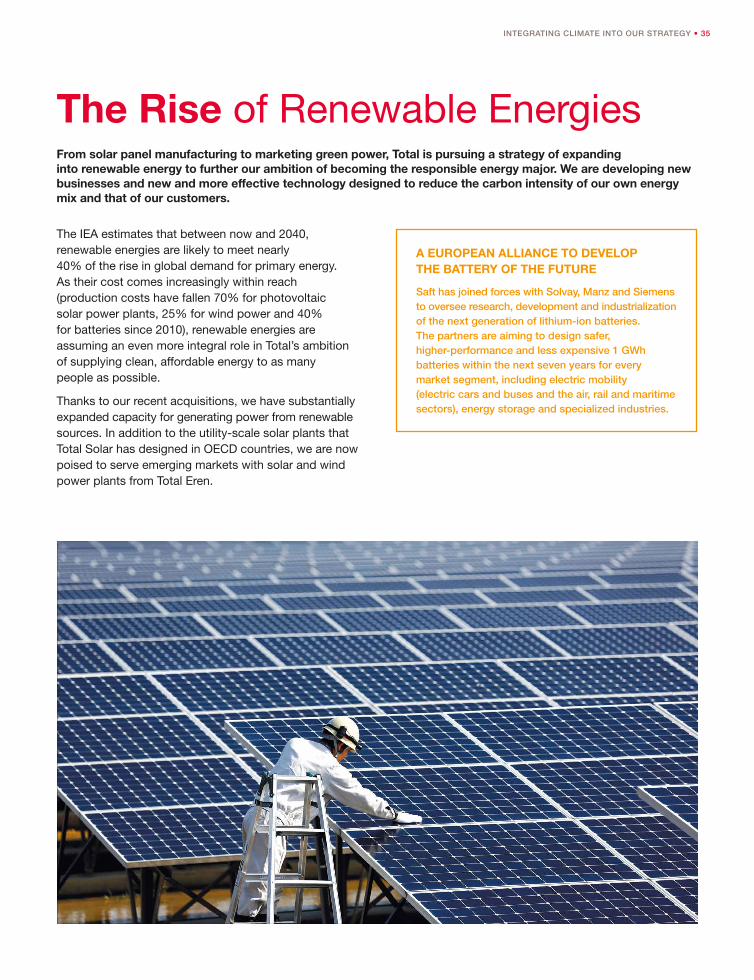
INTEGRATING CLIMATE INTO OUR STRATEGY • 35
The Rise of Renewable Energies
The IEA estimates that between now and 2040, renewable energies are likely to meet nearly 40% of the rise in global demand for primary energy. As their cost comes increasingly within reach (production costs have fallen 70% for photovoltaic solar power plants, 25% for wind power and 40% for batteries since 2010), renewable energies are assuming an even more integral role in Total’s ambition of supplying clean, affordable energy to as many people as possible.
Thanks to our recent acquisitions, we have substantially expanded capacity for generating power from renewable sources. In addition to the utility-scale solar plants that Total Solar has designed in OECD countries, we are now poised to serve emerging markets with solar and wind power plants from Total Eren.
From solar panel manufacturing to marketing green power, Total is pursuing a strategy of expanding into renewable energy to further our ambition of becoming the responsible energy major. We are developing new businesses and new and more effective technology designed to reduce the carbon intensity of our own energy mix and that of our customers.
A EUROPEAN ALLIANCE TO DEVELOP THE BATTERY OF THE FUTURE
Saft has joined forces with Solvay, Manz and Siemens to oversee research, development and industrialization of the next generation of lithium-ion batteries. The partners are aiming to design safer, higher-performance and less expensive 1 GWh batteries within the next seven years for every market segment, including electric mobility (electric cars and buses and the air, rail and maritime sectors), energy storage and specialized industries.
36 • INTEGRATING CLIMATE INTO OUR STRATEGY
Through Total Solar, we can also install distributed photovoltaic systems on rooftops and solar carports at residential, industrial and commercial sites.
More broadly, we can now operate across the entire photovoltaic solar value chain by leveraging the expertise of our affiliates, from solar cells manufactured by SunPower to the marketing of green power through our launch of Total Spring and our acquisition of Direct Energie. Meanwhile, our R&D on next-generation energy management and control systems is helping to slash the cost of energy usage.
TECHNOLOGY THAT ADDRESSES THE CLIMATE CHALLENGE
In addition to our presence in renewable power generation, Total is investing in energy storage capacity through our affiliate Saft. As a result, we can integrate renewable energies — which are variable by nature — into the grid more smoothly. Saft’s high-performance lithium-ion batteries help operators manage production peaks and troughs, a process known as demand response, while also reducing electricity losses during transmission and distribution. In addition, they can be used to start up emergency generators — a major asset for enhancing smart grid operations and ensuring a safe and secure power supply.
Saft batteries could help reduce transportation-related carbon emissions by 40% between now and 2030. Their value for the rail industry, where Saft announced two sizable contracts in India 1 and Qatar 2 early this year, has been evident for some time. The company’s lightweight, space-saving batteries can also meet the technical challenges posed by hybrid and electric propulsion and will soon be playing a key role in urban environments, as well as at ports, airports and industrial sites and in shipping 3.
1. A contract to provide 1,600 batteries for Alstom India’s double-section electric freight locomotives.
2. A contract to provide 150,000 nickel-technology backup batteries installed in stations and on board trains for Doha’s future metro system.
3. Hybrid ships use Seanergy® battery systems to handle peak power demand in critical situations and save 25% on fuel at the same time.
BATTERIES WITH A SMALL ENVIRONMENTAL FOOTPRINT
Saft conducts a complete life cycle assessment (LCA) of its products to measure their environmental footprint at each stage of their life. For example, the LCA conducted on the Evolion® lithium-ion telecommunications battery showed that it generates 40% fewer carbon emissions than traditional lead batteries while offering improved performance.
A SECOND SOLAR POWER PLANT IN JAPAN
In May 2017, Total Solar began construction of a new solar power plant in Japan that will come on line this year. It follows in the footsteps of the 27 MW-peak Nanao plant, which supplies power to nearly 8,900 homes. This second plant, located in Miyako in Iwate Prefecture, has a capacity of 25 MW-peak, supplying clean, reliable energy to an additional 8,000-plus homes.
THE WORLD’S MOST EFFICIENT PHOTOVOLTAIC CELLS
SunPower manufactures solar panels verified at 22.8% efficiency. That is a 44% improvement, on average, over standard photovoltaic systems.
100,000 tons Carbon emissions avoided by solarizing 5,000 service stations and 300 industrial sites over the next five years.
1.9 GWTotal owns interests in a combined 1.9 GW of renewable power generation capacity currently in operation.
1 GW Gross installed capacity in operation or under construction by Total Eren, which is targeting 3 GW in 2023.
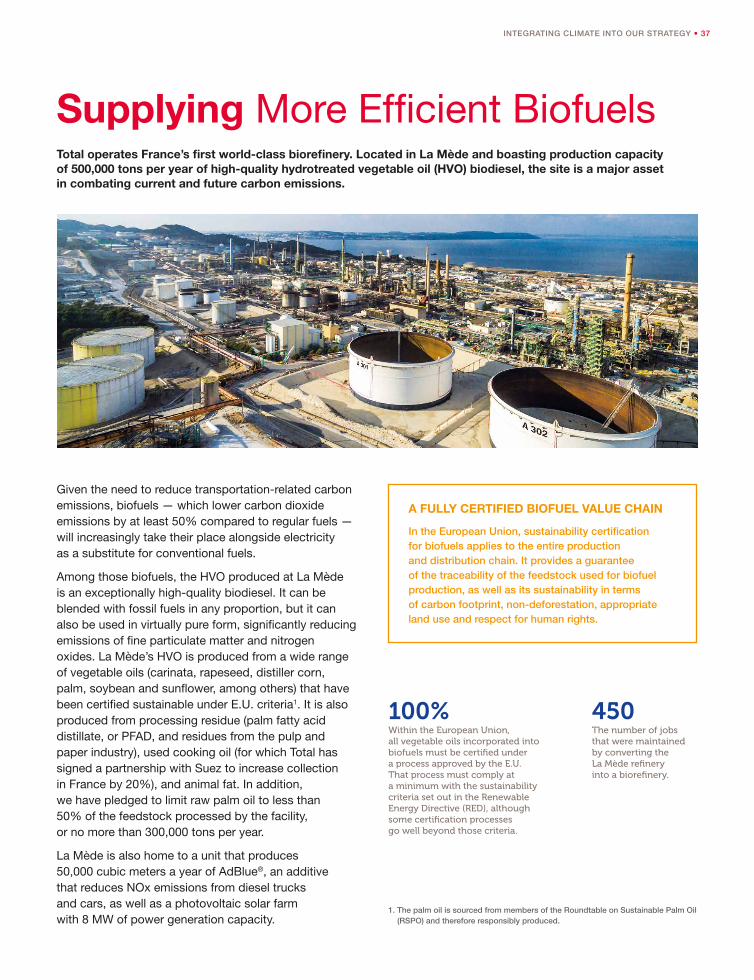
INTEGRATING CLIMATE INTO OUR STRATEGY • 37
Supplying More Efficient Biofuels
1. The palm oil is sourced from members of the Roundtable on Sustainable Palm Oil (RSPO) and therefore responsibly produced.
Total operates France’s first world-class biorefinery. Located in La Mède and boasting production capacity of 500,000 tons per year of high-quality hydrotreated vegetable oil (HVO) biodiesel, the site is a major asset in combating current and future carbon emissions.
Given the need to reduce transportation-related carbon emissions, biofuels — which lower carbon dioxide emissions by at least 50% compared to regular fuels — will increasingly take their place alongside electricity as a substitute for conventional fuels.
Among those biofuels, the HVO produced at La Mède is an exceptionally high-quality biodiesel. It can be blended with fossil fuels in any proportion, but it can also be used in virtually pure form, significantly reducing emissions of fine particulate matter and nitrogen oxides. La Mède’s HVO is produced from a wide range of vegetable oils (carinata, rapeseed, distiller corn, palm, soybean and sunflower, among others) that have been certified sustainable under E.U. criteria1. It is also produced from processing residue (palm fatty acid distillate, or PFAD, and residues from the pulp and paper industry), used cooking oil (for which Total has signed a partnership with Suez to increase collection in France by 20%), and animal fat. In addition, we have pledged to limit raw palm oil to less than 50% of the feedstock processed by the facility, or no more than 300,000 tons per year.
La Mède is also home to a unit that produces 50,000 cubic meters a year of AdBlue®, an additive that reduces NOx emissions from diesel trucks and cars, as well as a photovoltaic solar farm with 8 MW of power generation capacity.
A FULLY CERTIFIED BIOFUEL VALUE CHAIN
In the European Union, sustainability certification for biofuels applies to the entire production and distribution chain. It provides a guarantee of the traceability of the feedstock used for biofuel production, as well as its sustainability in terms of carbon footprint, non-deforestation, appropriate land use and respect for human rights.
450The number of jobs that were maintained by converting the La Mède refinery into a biorefinery.
100%Within the European Union, all vegetable oils incorporated into biofuels must be certified under a process approved by the E.U. That process must comply at a minimum with the sustainability criteria set out in the Renewable Energy Directive (RED), although some certification processes go well beyond those criteria.
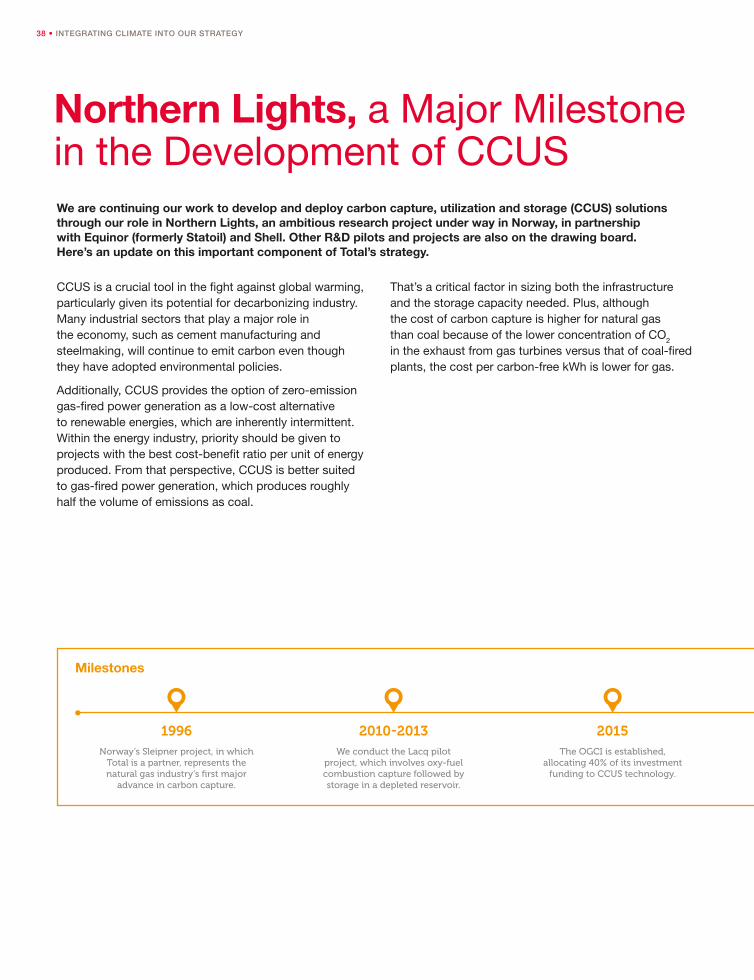
38 • INTEGRATING CLIMATE INTO OUR STRATEGY
Norway’s Sleipner project, in which Total is a partner, represents the natural gas industry’s first major
advance in carbon capture.
1996We conduct the Lacq pilot
project, which involves oxy-fuel combustion capture followed by storage in a depleted reservoir.
2010-2013 The OGCI is established,
allocating 40% of its investment funding to CCUS technology.
2015
Milestones
Northern Lights, a Major Milestone in the Development of CCUS
CCUS is a crucial tool in the fight against global warming, particularly given its potential for decarbonizing industry. Many industrial sectors that play a major role in the economy, such as cement manufacturing and steelmaking, will continue to emit carbon even though they have adopted environmental policies.
Additionally, CCUS provides the option of zero-emission gas-fired power generation as a low-cost alternative to renewable energies, which are inherently intermittent. Within the energy industry, priority should be given to projects with the best cost-benefit ratio per unit of energy produced. From that perspective, CCUS is better suited to gas-fired power generation, which produces roughly half the volume of emissions as coal.
That’s a critical factor in sizing both the infrastructure and the storage capacity needed. Plus, although the cost of carbon capture is higher for natural gas than coal because of the lower concentration of CO2 in the exhaust from gas turbines versus that of coal-fired plants, the cost per carbon-free kWh is lower for gas.
We are continuing our work to develop and deploy carbon capture, utilization and storage (CCUS) solutions through our role in Northern Lights, an ambitious research project under way in Norway, in partnership with Equinor (formerly Statoil) and Shell. Other R&D pilots and projects are also on the drawing board. Here’s an update on this important component of Total’s strategy.
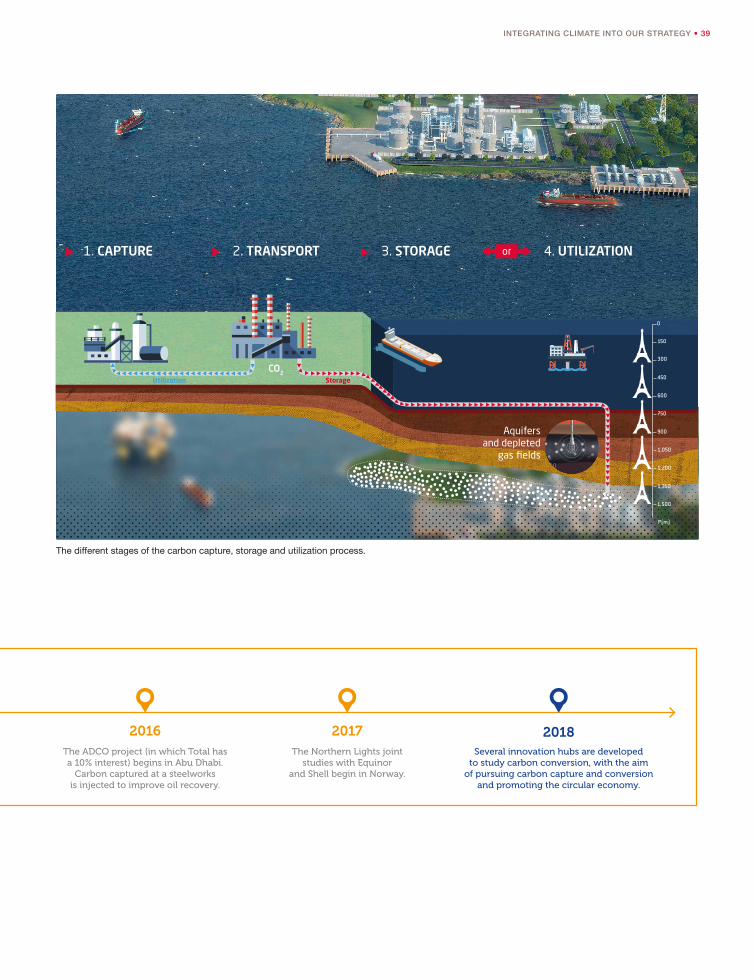
INTEGRATING CLIMATE INTO OUR STRATEGY • 39
The ADCO project (in which Total has a 10% interest) begins in Abu Dhabi.
Carbon captured at a steelworks is injected to improve oil recovery.
2016The Northern Lights joint
studies with Equinor and Shell begin in Norway.
2017Several innovation hubs are developed
to study carbon conversion, with the aim of pursuing carbon capture and conversion
and promoting the circular economy.
2018
The different stages of the carbon capture, storage and utilization process.
450
300
150
600
750
900
1,050
1,350
1,500
P(m)
1,200
0
2. TRANSPORT 4. UTILIZATION3. STORAGE1. CAPTURE or
Aquifers and depleted
gas fi elds
CO2Utilization Storage
40 • INTEGRATING CLIMATE INTO OUR STRATEGY
6 billion tons of CO
2The estimated volume of carbon capture and storage required by 2050, according to the IEA Sustainable Development Scenario.
NORTHERN LIGHTS, A LARGE-SCALE PROJECT
With a long-standing commitment to CCUS development, Total is working alongside Equinor and Shell on development studies now being conducted in Norway for the Northern Lights project. This research is looking at the transportation and storage of emissions generated by the cement industry, as a prelude to examining other industries. The first phase is targeting a carbon transportation and storage capacity of 1.5 million tons per year, which could potentially be expanded to spur the development of new commercial-scale capture solutions in Norway and elsewhere in Europe. It has the potential to be the first storage site in the world to receive carbon from industrial sources in multiple countries. It could also serve as a template that encourages similar projects in other countries.
Meanwhile, we are in talks with the Norwegian authorities to jointly draft a contractual framework. CCUS technology requires a major financial investment, but will have a significant positive impact on the broader community; consequently, financing should come through public-private partnerships.
TEN PERCENT OF THE OVERALL R&D BUDGET
We plan to devote up to 10% of our overall R&D budget to research into CCUS technology. Through our membership in the OGCI, we are also working with other energy industry professionals to study carbon capture technology, global storage capacity and the challenges posed by commercial development of that technology. As well, we have forged other partnerships, with Stanford University on simulated carbon storage, and with cement and steel manufacturers. In China, as part of the CHEERS (Chinese-European Emission-Reducing Solutions) project, we are helping to build a prototype unit that will be able to generate power and steam almost entirely with captured carbon.
INTEGRATING CLIMATE INTO OUR STRATEGY • 41
A Resilient PortfolioAt a time of heavy demand for electricity, with oil and gas continuing to play a prominent role in the global energy mix, we are maintaining a resilient portfolio through a strategy of carefully selecting and prioritizing projects.
1. Effective from 2021, or the current price if higher in a given country.
2. Sensitivity calculated for a crude oil price of USD 60 to USD 80 per barrel, compared to a reference scenario based on a carbon price in regions already covered by a carbon pricing scheme.
Any decision to develop known — or yet to be discovered — energy reserves, whether in whole or in part, depends on a variety of factors that include demand trends, profitability, political considerations, environmental concerns and carbon pricing. The IEA estimates that the reservoirs currently producing oil contain approximately 1.7 trillion barrels, and that 40% of the world’s current proved reserves could meet our oil needs for the period 2014-2035. However, it is thought that one-third of those needs will be met by reservoirs that are not yet in production or have yet to be discovered, and those fields could be more environmentally or financially advantageous than some reservoirs already discovered.
That makes selecting and prioritizing projects critically important. We are focusing on assets with competitive production and processing costs and which meet the highest safety and environmental standards. This simultaneously selective and responsible approach is rooted in an agile organization committed to providing energy that is affordable, reliable and clean. Guided by that principle, Total acquired Maersk Oil, in the process becoming the second-largest operator in the North Sea. At the same time, we sold our stake in Norway’s Martin Linge field, where operating costs were high. Through those decisions, we are restructuring and expanding our presence in the strategic North Sea region and creating the potential for strong operational synergies.
Furthermore, as demand for electricity rises, we are continuing our push into both natural gas, as reflected in our acquisition of Engie’s upstream LNG business, and renewable energies. Our integration of EREN RE has cemented our presence in solar energy and opened the door to the wind power market. Our acquisition of GreenFlex has rounded out our portfolio in the critical area of energy efficiency.
ACCOUNTING FOR THE PRICE OF CARBON
When evaluating our investments, we apply a long-term carbon price that varies from USD 30 to USD 40, depending on the oil price scenario, or we use an established carbon price if it is higher in a given country. This is consistent with our support for initiatives to replace coal with natural gas in power generation and our investment in R&D on low-carbon technologies. In-house studies have shown that a long-term carbon price of USD 40 per ton1, if applied worldwide, would have a negative impact of around 5% on the discounted present value of Total’s upstream and downstream assets 2.
In addition, the average lifespan of Total’s proved and probable reserves is approximately 20 years, while the discounted present value of those reserves beyond 20 years represents less than 10% of the discounted present value of our upstream assets.
FACILITIES THAT CAN WITHSTAND NATURAL DISASTERS
Another key factor in the resilience of our portfolio is the reliability of our facilities. The Intergovernmental Panel on Climate Change (IPCC) anticipates increasingly significant natural impacts over the coming decades, in certain regards and certain parts of the world. We assess the vulnerability of our facilities to those events and take the risk of both weather and seismic disasters into account when designing industrial facilities. Our studies have not identified any facilities that are unable to withstand the currently known consequences of climate change.
42 • INTEGRATING CLIMATE INTO OUR STRATEGY
Energy Efficiency
MEETING OUR INTERNAL OBJECTIVES
We are reaffirming our goal of improving energy efficiency at our operated sites by 1% a year for the period 2010-2020. Total has developed a Group Energy Efficiency Index (GEEI), and in 2010 we set a target GEEI of 90.4 by 2020. That goal has already been surpassed: our GEEI for 2017 was 85.7, thanks in particular to a significant decrease in routine gas flaring. We also continued to pursue ISO 50001 energy management certification for our principal sites in 2017.
Our retail network has contributed to our energy performance as well, with an action plan for our service stations that includes new equipment, such as doors on our refrigerator and freezer cases and more energy-efficient lighting. In 2017, the network achieved its goal of reducing its energy use by 10% from 2010 levels.
AN ALL-INCLUSIVE APPROACH WITH GREENFLEX
In October 2017, we completed our acquisition of GreenFlex, a major force in European energy efficiency (see opposite). The deal is further evidence of Total’s strategy in the realm of energy efficiency and will lead to rapid development of our service offerings, by consolidating our long-time affiliates (BHC Energy in France and Tenag in Germany) under a single name. With GreenFlex, Total offers customers a comprehensive strategy for energy efficiency. Each day, our multidisciplinary experts put together effective, long-term solutions that combine support, data intelligence and financing to deliver tangible, sustainable results.
The digital solutions developed by GreenFlex are key to our energy and environmental stewardship on behalf of our customers.
Total’s expansion in multiple strategic markets, including France, Germany, Belgium, the Netherlands, the United Kingdom and the Middle East, will rely on this holistic approach. In a fast-growing market, we have set a target of USD 1 billion in revenue for 2022.
Ongoing gains in energy efficiency are essential to altering the trajectory of energy-related carbon emissions. At Total, we have maintained our efforts to manage energy efficiency at our sites as closely as possible. In keeping with this strategy, we expanded our energy efficiency services in 2017 with our acquisition of France’s GreenFlex.
GreenFlex by the Numbers• More than 600 customers• Revenue of more than €350 million in 2017• Over 200 employees• 32% reduction in energy consumption for customers
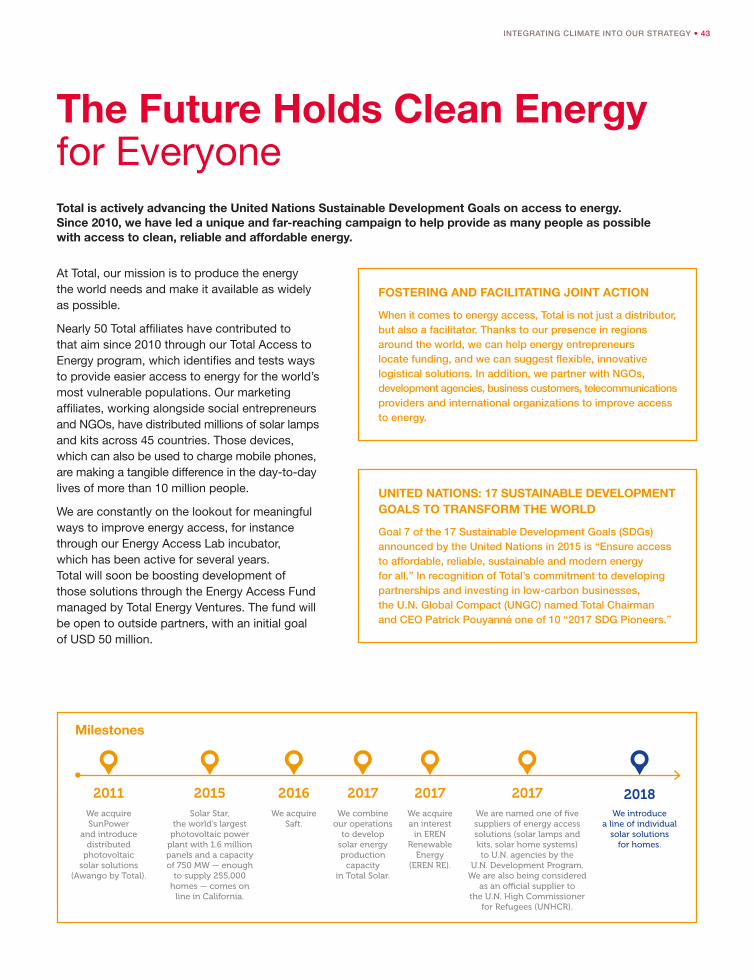
INTEGRATING CLIMATE INTO OUR STRATEGY • 43
FOSTERING AND FACILITATING JOINT ACTION
When it comes to energy access, Total is not just a distributor, but also a facilitator. Thanks to our presence in regions around the world, we can help energy entrepreneurs locate funding, and we can suggest flexible, innovative logistical solutions. In addition, we partner with NGOs, development agencies, business customers, telecommunications providers and international organizations to improve access to energy.
UNITED NATIONS: 17 SUSTAINABLE DEVELOPMENT GOALS TO TRANSFORM THE WORLD
Goal 7 of the 17 Sustainable Development Goals (SDGs) announced by the United Nations in 2015 is “Ensure access to affordable, reliable, sustainable and modern energy for all.” In recognition of Total’s commitment to developing partnerships and investing in low-carbon businesses, the U.N. Global Compact (UNGC) named Total Chairman and CEO Patrick Pouyanné one of 10 “2017 SDG Pioneers.”
The Future Holds Clean Energy for Everyone
At Total, our mission is to produce the energy the world needs and make it available as widely as possible.
Nearly 50 Total affiliates have contributed to that aim since 2010 through our Total Access to Energy program, which identifies and tests ways to provide easier access to energy for the world’s most vulnerable populations. Our marketing affiliates, working alongside social entrepreneurs and NGOs, have distributed millions of solar lamps and kits across 45 countries. Those devices, which can also be used to charge mobile phones, are making a tangible difference in the day-to-day lives of more than 10 million people.
We are constantly on the lookout for meaningful ways to improve energy access, for instance through our Energy Access Lab incubator, which has been active for several years. Total will soon be boosting development of those solutions through the Energy Access Fund managed by Total Energy Ventures. The fund will be open to outside partners, with an initial goal of USD 50 million.
Total is actively advancing the United Nations Sustainable Development Goals on access to energy. Since 2010, we have led a unique and far-reaching campaign to help provide as many people as possible with access to clean, reliable and affordable energy.
We acquire SunPower
and introduce distributed
photovoltaic solar solutions
(Awango by Total).
2011Solar Star,
the world’s largest photovoltaic power
plant with 1.6 million panels and a capacity of 750 MW — enough
to supply 255,000 homes — comes on
line in California.
2015We acquire
Saft.
2016We combine
our operations to develop
solar energy production
capacity in Total Solar.
2017We acquire an interest
in EREN Renewable
Energy (EREN RE).
2017We are named one of five suppliers of energy access solutions (solar lamps and kits, solar home systems) to U.N. agencies by the
U.N. Development Program. We are also being considered
as an official supplier to the U.N. High Commissioner
for Refugees (UNHCR).
2017We introduce
a line of individual solar solutions
for homes.
2018
Milestones
44 • INTEGRATING CLIMATE INTO OUR STRATEGY
Focus onTransportation
Global warming, coupled with changing technology and usage, is irrevocably altering every form of transportation. From cars and trucks to ships and aircraft, we have demonstrated a long-term commitment to finding concrete solutions to reduce the environmental and health consequences of today’s transportation options.
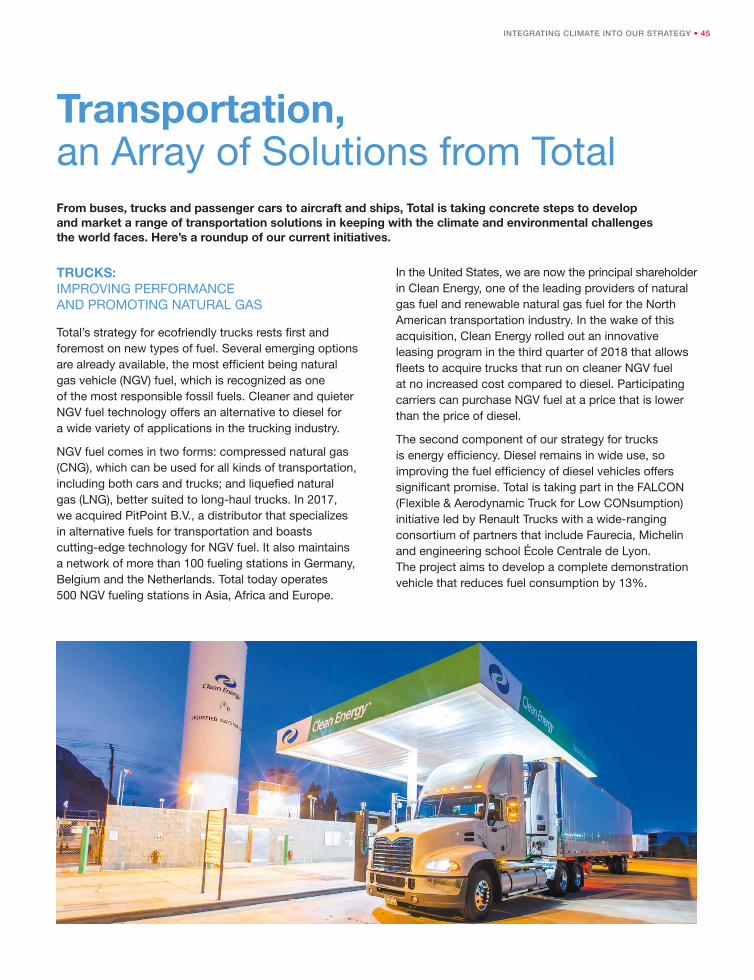
INTEGRATING CLIMATE INTO OUR STRATEGY • 45
Transportation, an Array of Solutions from Total
TRUCKS: IMPROVING PERFORMANCE AND PROMOTING NATURAL GAS
Total’s strategy for ecofriendly trucks rests first and foremost on new types of fuel. Several emerging options are already available, the most efficient being natural gas vehicle (NGV) fuel, which is recognized as one of the most responsible fossil fuels. Cleaner and quieter NGV fuel technology offers an alternative to diesel for a wide variety of applications in the trucking industry.
NGV fuel comes in two forms: compressed natural gas (CNG), which can be used for all kinds of transportation, including both cars and trucks; and liquefied natural gas (LNG), better suited to long-haul trucks. In 2017, we acquired PitPoint B.V., a distributor that specializes in alternative fuels for transportation and boasts cutting-edge technology for NGV fuel. It also maintains a network of more than 100 fueling stations in Germany, Belgium and the Netherlands. Total today operates 500 NGV fueling stations in Asia, Africa and Europe.
From buses, trucks and passenger cars to aircraft and ships, Total is taking concrete steps to develop and market a range of transportation solutions in keeping with the climate and environmental challenges the world faces. Here’s a roundup of our current initiatives.
In the United States, we are now the principal shareholder in Clean Energy, one of the leading providers of natural gas fuel and renewable natural gas fuel for the North American transportation industry. In the wake of this acquisition, Clean Energy rolled out an innovative leasing program in the third quarter of 2018 that allows fleets to acquire trucks that run on cleaner NGV fuel at no increased cost compared to diesel. Participating carriers can purchase NGV fuel at a price that is lower than the price of diesel.
The second component of our strategy for trucks is energy efficiency. Diesel remains in wide use, so improving the fuel efficiency of diesel vehicles offers significant promise. Total is taking part in the FALCON (Flexible & Aerodynamic Truck for Low CONsumption) initiative led by Renault Trucks with a wide-ranging consortium of partners that include Faurecia, Michelin and engineering school École Centrale de Lyon. The project aims to develop a complete demonstration vehicle that reduces fuel consumption by 13%.
46 • INTEGRATING CLIMATE INTO OUR STRATEGY
Another area of research involves optimizing load factors in order to streamline journeys. Through our Total Energy Ventures (TEV) investment fund, we have acquired a stake in start-up OnTruck. An estimated 30% of trucks making medium-distance freight journeys (roughly 150 kilometers) are only half full. The OnTruck platform matches shippers with carriers to pool shipments and improve load factors.
MARITIME SHIPPING: LIQUEFIED NATURAL GAS GAINS CONVERTS
Marine fuels will have their sulfur content capped at just 0.5% in 2020, compared to 3.5% today. Our specialized marketing affiliate, Total Marine Fuels Global Solutions, offers a variety of options for complying with the cap, including liquefied natural gas (LNG).
To encourage wider use of LNG, we have signed several major agreements with shipping lines, including CMA CGM, a global leader in the shipping industry that chose Total as its exclusive supplier of LNG for 10 years starting in 2020. These LNG volumes — unprecedented in the history of marine LNG — will supply CMA CGM’s nine newbuild container ships, scheduled for delivery beginning in 2020. We will be investing in a specially designed bunker vessel for the ships covered under the agreement.
Total has also partnered with Brittany Ferries to supply marine LNG to the Honfleur, a ferry that will operate between Portsmouth, England, and Ouistreham, France, beginning in 2019. That agreement posed a real logistical challenge; the lack of LNG infrastructure in the ports served by the Honfleur prompted the creation of an innovative supply chain that uses ISO containers.
AIR TRANSPORTATION: BIOJET FUEL, THE SOLUTION OF THE FUTURE
Between now and 2030, the number of air passengers is likely to double from 3 billion to 6 billion per year. To combat climate change, the air transportation sector has set a goal of halving its net greenhouse gas emissions from the 2005 baseline by 2050. Biojet fuel will play a pivotal role in meeting that target. Total can claim several important biojet milestones, such as the 2016 Lab’line for the Future project, in which biojet fuel was used on at least one weekly Air France flight between Paris and Toulouse. Similarly, flights to deliver Airbus models to Cathay Pacific and Air China have been powered by biojet fuel from Total. And we have signed green growth agreements with France’s Ministry for the Ecological and Inclusive Transition and Ministry for Transport. The five major players in France’s biojet fuel industry — Air France, Airbus, Safran, Suez and Total — are currently conducting a study to define the optimal conditions for producing and marketing clean fuels for air transportation.
DATA ENHANCING OUR SERVICES
Today’s connected cars have profoundly changed the way we look at transportation. Total has acquired French start-up WayKonect, a platform for collecting and processing data generated by connected cars. That acquisition, coupled with our fuel cards, will help us enhance the fleet management services we offer our business customers: fleet managers will have access to detailed information about how each car is being used.In addition, through Total Energy Ventures we have acquired a stake in Xee, a platform that collects and processes data from connected cars.
INTEGRATING CLIMATE INTO OUR STRATEGY • 47
PROMOTING GROWTH IN HYDROGEN ENERGY
Hydrogen offers vast potential as an energy carrier: it can be used to produce storable energy and emits zero carbon when used as a fuel. Total is one of 13 leading companies from the energy, transportation and manufacturing sectors to form the Hydrogen Council. That organization’s goal is to place hydrogen at the forefront of the future energy mix. We are also pursuing deployment of hydrogen fueling stations through a joint venture, H2 Mobility Germany, that was launched in 2015 with partners including Air Liquide, Daimler, Linde, OMV and Shell. The consortium plans to build a network of 400 hydrogen fueling stations across Germany.
HUTCHINSON, LEADING THE WAY IN E-MOBILITY
Hutchinson, a Total affiliate, designs vibration control, fluid management and sealing systems for its customers in the transportation sector, including car and truck manufacturers and the rail and aerospace industries. The company draws on its state-of-the-art expertise to address the challenges posed by electric fleets, from reducing vehicle weight and saving energy to regulating engine heat. In the process it is gaining new know-how and helping to make mobility safer, more comfortable and more sustainable.
PASSENGER CARS: ELECTRIC VEHICLES BACKED BY ENERGY EFFICIENCY
Although sales of electric vehicles are rising steadily worldwide, more than a billion of the world’s cars are still powered by internal combustion engines. Improving their environmental performance is a major challenge. We are aiding that cause with our Total Excellium line of fuels, which have been awarded the Total Ecosolutions label.
We also develop and market lubricants for the manufacturing and automotive sectors. Products with the Total Ecosolutions label can reduce consumption by anywhere from 1 to 2.2%, and thereby passenger car carbon emissions as well.
Biofuels are another tool in the fight against carbon emissions. We have been producing biofuels for more than 20 years and are the top marketer in Europe today.
Elastomers are also an important option for improving the energy efficiency of passenger cars. Hutchinson, a wholly owned Total affiliate, has recognized expertise that has made it a world leader in vibration control, sealing and fluid management systems and insulation (see opposite).
48 • INTEGRATING CLIMATE INTO OUR STRATEGY
A THINK TANK TO STUDY NEAR-TERM SOLUTIONS
Total is a founding member of the Movin’On Lab (formerly Open Lab Mobility), a Michelin initiative that brings together nearly 200 major companies from the transportation industry. This “think and do tank,” organized into communities of interests, examines a variety of issues and solutions connected with sustainable mobility and works with its members to tackle those challenges.One of its aims is to study practices and policies that can be implemented on a wide scale within a decade, so as to compel innovation in response to urgent needs. As part of that effort, we served as contributor and co-author of a report entitled “Speeding Up to <2°C: Actionable Clean Mobility Solutions.” This analysis highlights seven solutions — products and behaviors alike. Behaviors play a decisive role, and the report includes a look at the potential offered by ride sharing (which Total promotes through our partnership with BlaBlaCar), measures adopted by municipalities to reduce urban congestion and pollution (e.g., policies to encourage travel during specified hours or changes in tolls based on peak and non-peak hours) and ecodriving (educating drivers on best driving practices, as Total does with its B2B customers). The study highlights the positive impact of biofuels, the growing reliance on electric vehicles for urban deliveries and the increased use of natural gas (of which Total is a major provider), notably for the transportation of goods.
ELECTRICITY: EASIER ACCESS TO CHARGING OPTIONS
Electric vehicles now account for 0.3% of cars on the road, and sales of those vehicles are rising. A network of charging stations is a major advantage in ensuring that trend continues. Owners of electric vehicles express a wide variety of very specific needs. So we are developing a full range of charging services for customers on the go, regardless of their location or the time of day.
There are currently three types of charging points: those in private use at homes or offices, those found at service stations, and those located outside the retail network. For the first group, which accounts for 80% of all vehicle charging, Total Spring’s green mobility package includes overnight electric vehicle charging for customers, reducing charging costs by half compared to peak daytime hours. We also provide access to charging points through our network of service stations. That will eventually include 1,000 fast charging (150 kW) points installed every 150 kilometers, at 300 service stations located on major roads in Western Europe. Lastly, we are going beyond our own infrastructure to build partnerships designed to expand the reach of the charging point network. Ultimately, we hope to see tens of thousands of public charging stations available to users across Europe.
We will be drawing on our expertise in fuel cards to help customers take advantage of that extensive network. In 2017, we had more than 3.3 million fuel cards in circulation throughout Europe. Those cards allow companies of all sizes to manage their spending on fuel more closely, and they also provide access to an array of services. Total customers will be able to use one and the same card to charge their electric and hybrid vehicles and enjoy the range of products and services now available — from conventional and NGV fuels to payment for parking, tolls and car washes.
INTEGRATING CLIMATE INTO OUR STRATEGY • 49
Our Figures
As part of our continuous improvement process, we disclose our results. We rely on best reporting practices that make it easier for stakeholders to assess our performance.
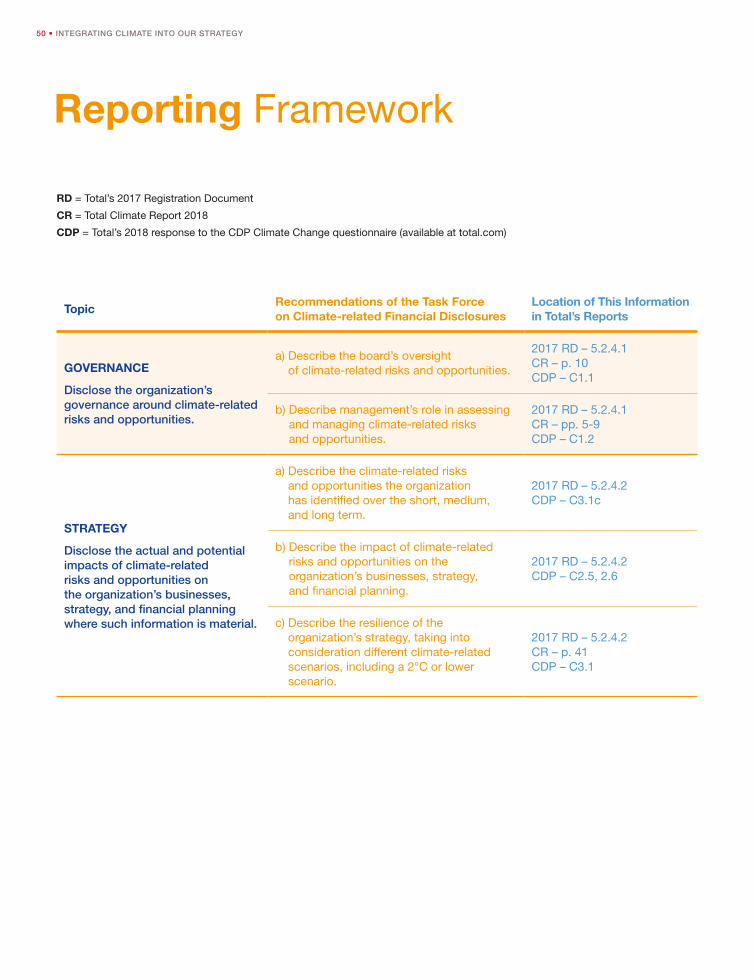
50 • INTEGRATING CLIMATE INTO OUR STRATEGY
Reporting Framework
RD = Total’s 2017 Registration Document
CR = Total Climate Report 2018
CDP = Total’s 2018 response to the CDP Climate Change questionnaire (available at total.com)
TopicRecommendations of the Task Force on Climate-related Financial Disclosures
Location of This Information in Total’s Reports
GOVERNANCE
Disclose the organization’s governance around climate-related risks and opportunities.
a) Describe the board’s oversight of climate-related risks and opportunities.
2017 RD – 5.2.4.1CR – p. 10 CDP – C1.1
b) Describe management’s role in assessing and managing climate-related risks and opportunities.
2017 RD – 5.2.4.1CR – pp. 5-9CDP – C1.2
STRATEGY
Disclose the actual and potential impacts of climate-related risks and opportunities on the organization’s businesses, strategy, and financial planning where such information is material.
a) Describe the climate-related risks and opportunities the organization has identified over the short, medium, and long term.
2017 RD – 5.2.4.2CDP – C3.1c
b) Describe the impact of climate-related risks and opportunities on the organization’s businesses, strategy, and financial planning.
2017 RD – 5.2.4.2CDP – C2.5, 2.6
c) Describe the resilience of the organization’s strategy, taking into consideration different climate-related scenarios, including a 2°C or lower scenario.
2017 RD – 5.2.4.2CR – p. 41CDP – C3.1
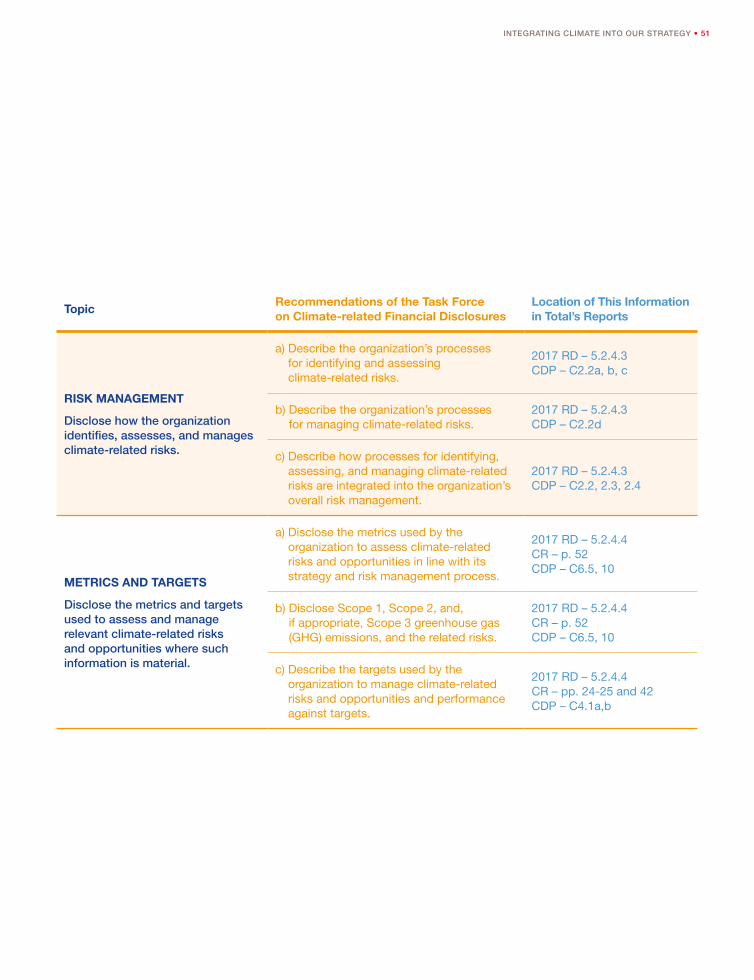
INTEGRATING CLIMATE INTO OUR STRATEGY • 51
TopicRecommendations of the Task Force on Climate-related Financial Disclosures
Location of This Information in Total’s Reports
RISK MANAGEMENT
Disclose how the organization identifies, assesses, and manages climate-related risks.
a) Describe the organization’s processes for identifying and assessing climate-related risks.
2017 RD – 5.2.4.3 CDP – C2.2a, b, c
b) Describe the organization’s processes for managing climate-related risks.
2017 RD – 5.2.4.3CDP – C2.2d
c) Describe how processes for identifying, assessing, and managing climate-related risks are integrated into the organization’s overall risk management.
2017 RD – 5.2.4.3 CDP – C2.2, 2.3, 2.4
METRICS AND TARGETS
Disclose the metrics and targets used to assess and manage relevant climate-related risks and opportunities where such information is material.
a) Disclose the metrics used by the organization to assess climate-related risks and opportunities in line with its strategy and risk management process.
2017 RD – 5.2.4.4 CR – p. 52CDP – C6.5, 10
b) Disclose Scope 1, Scope 2, and, if appropriate, Scope 3 greenhouse gas (GHG) emissions, and the related risks.
2017 RD – 5.2.4.4 CR – p. 52CDP – C6.5, 10
c) Describe the targets used by the organization to manage climate-related risks and opportunities and performance against targets.
2017 RD – 5.2.4.4CR – pp. 24-25 and 42CDP – C4.1a,b
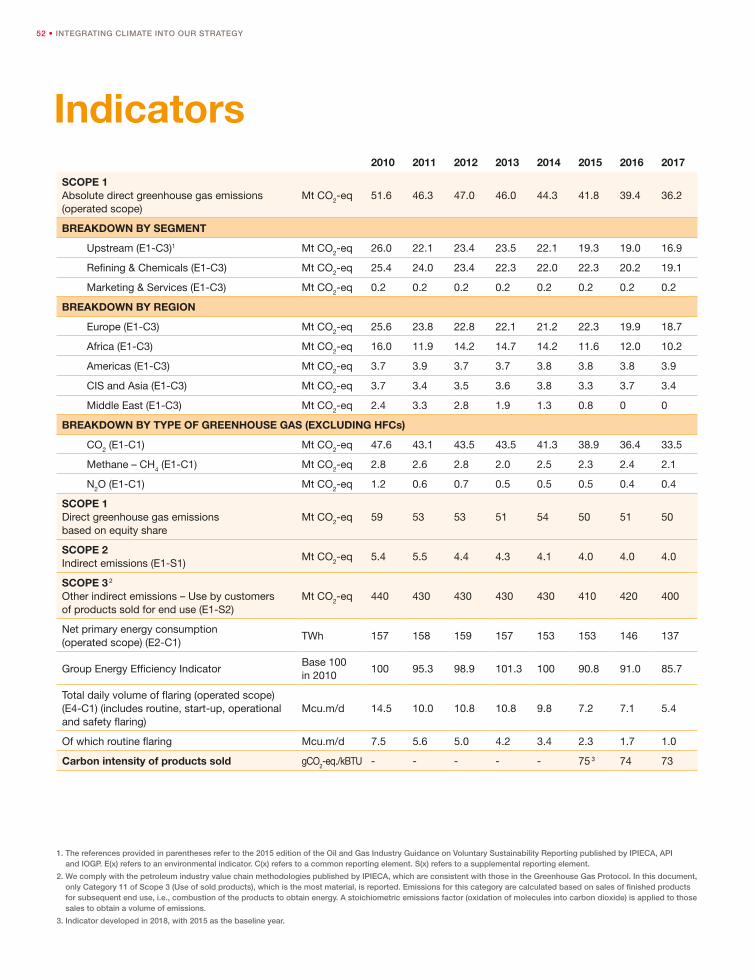
52 • INTEGRATING CLIMATE INTO OUR STRATEGY
Indicators2010 2011 2012 2013 2014 2015 2016 2017
SCOPE 1Absolute direct greenhouse gas emissions (operated scope)
Mt CO2-eq 51.6 46.3 47.0 46.0 44.3 41.8 39.4 36.2
BREAKDOWN BY SEGMENT
Upstream (E1-C3)1 Mt CO2-eq 26.0 22.1 23.4 23.5 22.1 19.3 19.0 16.9
Refining & Chemicals (E1-C3) Mt CO2-eq 25.4 24.0 23.4 22.3 22.0 22.3 20.2 19.1
Marketing & Services (E1-C3) Mt CO2-eq 0.2 0.2 0.2 0.2 0.2 0.2 0.2 0.2
BREAKDOWN BY REGION
Europe (E1-C3) Mt CO2-eq 25.6 23.8 22.8 22.1 21.2 22.3 19.9 18.7
Africa (E1-C3) Mt CO2-eq 16.0 11.9 14.2 14.7 14.2 11.6 12.0 10.2
Americas (E1-C3) Mt CO2-eq 3.7 3.9 3.7 3.7 3.8 3.8 3.8 3.9
CIS and Asia (E1-C3) Mt CO2-eq 3.7 3.4 3.5 3.6 3.8 3.3 3.7 3.4
Middle East (E1-C3) Mt CO2-eq 2.4 3.3 2.8 1.9 1.3 0.8 0 0
BREAKDOWN BY TYPE OF GREENHOUSE GAS (EXCLUDING HFCs)
CO2 (E1-C1) Mt CO2-eq 47.6 43.1 43.5 43.5 41.3 38.9 36.4 33.5
Methane – CH4 (E1-C1) Mt CO2-eq 2.8 2.6 2.8 2.0 2.5 2.3 2.4 2.1
N2O (E1-C1) Mt CO2-eq 1.2 0.6 0.7 0.5 0.5 0.5 0.4 0.4
SCOPE 1 Direct greenhouse gas emissions based on equity share
Mt CO2-eq 59 53 53 51 54 50 51 50
SCOPE 2 Indirect emissions (E1-S1)
Mt CO2-eq 5.4 5.5 4.4 4.3 4.1 4.0 4.0 4.0
SCOPE 3 2
Other indirect emissions – Use by customers of products sold for end use (E1-S2)
Mt CO2-eq 440 430 430 430 430 410 420 400
Net primary energy consumption (operated scope) (E2-C1)
TWh 157 158 159 157 153 153 146 137
Group Energy Efficiency IndicatorBase 100 in 2010
100 95.3 98.9 101.3 100 90.8 91.0 85.7
Total daily volume of flaring (operated scope) (E4-C1) (includes routine, start-up, operational and safety flaring)
Mcu.m/d 14.5 10.0 10.8 10.8 9.8 7.2 7.1 5.4
Of which routine flaring Mcu.m/d 7.5 5.6 5.0 4.2 3.4 2.3 1.7 1.0
Carbon intensity of products sold gCO2-eq./kBTU - - - - - 75 3 74 73
1. The references provided in parentheses refer to the 2015 edition of the Oil and Gas Industry Guidance on Voluntary Sustainability Reporting published by IPIECA, API and IOGP. E(x) refers to an environmental indicator. C(x) refers to a common reporting element. S(x) refers to a supplemental reporting element.
2. We comply with the petroleum industry value chain methodologies published by IPIECA, which are consistent with those in the Greenhouse Gas Protocol. In this document, only Category 11 of Scope 3 (Use of sold products), which is the most material, is reported. Emissions for this category are calculated based on sales of finished products for subsequent end use, i.e., combustion of the products to obtain energy. A stoichiometric emissions factor (oxidation of molecules into carbon dioxide) is applied to those sales to obtain a volume of emissions.
3. Indicator developed in 2018, with 2015 as the baseline year.
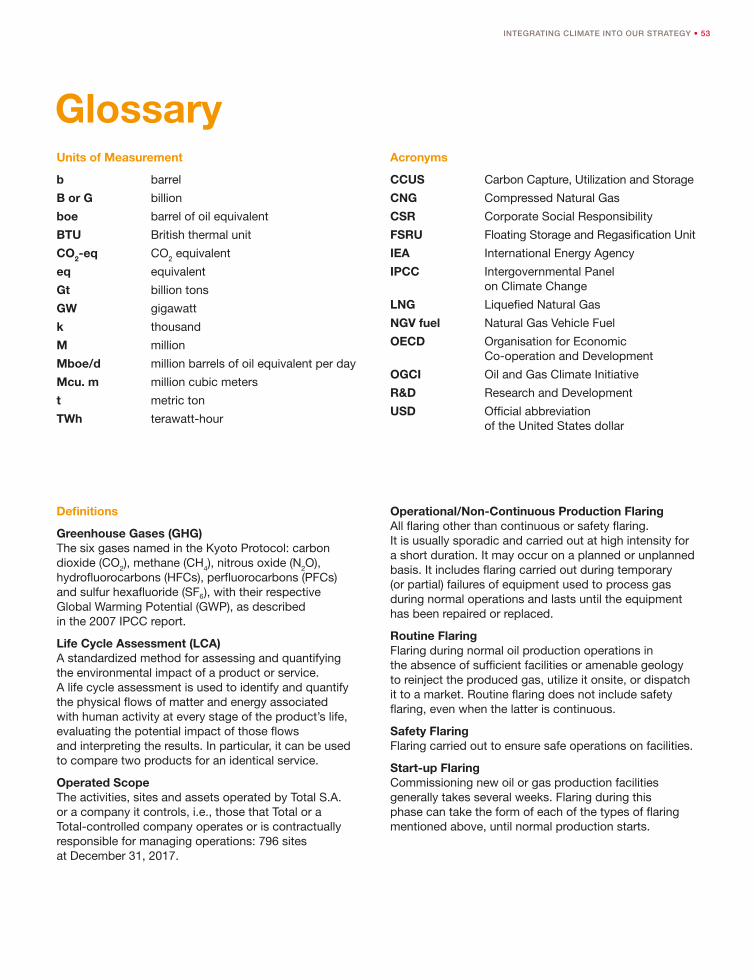
INTEGRATING CLIMATE INTO OUR STRATEGY • 53
GlossaryUnits of Measurement
b barrel
B or G billion
boe barrel of oil equivalent
BTU British thermal unit
CO2-eq CO2 equivalent
eq equivalent
Gt billion tons
GW gigawatt
k thousand
M million
Mboe/d million barrels of oil equivalent per day
Mcu. m million cubic meters
t metric ton
TWh terawatt-hour
Acronyms
CCUS Carbon Capture, Utilization and Storage
CNG Compressed Natural Gas
CSR Corporate Social Responsibility
FSRU Floating Storage and Regasification Unit
IEA International Energy Agency
IPCC Intergovernmental Panel on Climate Change
LNG Liquefied Natural Gas
NGV fuel Natural Gas Vehicle Fuel
OECD Organisation for Economic Co-operation and Development
OGCI Oil and Gas Climate Initiative
R&D Research and Development
USD Official abbreviation of the United States dollar
Definitions
Greenhouse Gases (GHG)The six gases named in the Kyoto Protocol: carbon dioxide (CO2), methane (CH4), nitrous oxide (N2O), hydrofluorocarbons (HFCs), perfluorocarbons (PFCs) and sulfur hexafluoride (SF6), with their respective Global Warming Potential (GWP), as described in the 2007 IPCC report.
Life Cycle Assessment (LCA)A standardized method for assessing and quantifying the environmental impact of a product or service. A life cycle assessment is used to identify and quantify the physical flows of matter and energy associated with human activity at every stage of the product’s life, evaluating the potential impact of those flows and interpreting the results. In particular, it can be used to compare two products for an identical service.
Operated ScopeThe activities, sites and assets operated by Total S.A. or a company it controls, i.e., those that Total or a Total-controlled company operates or is contractually responsible for managing operations: 796 sites at December 31, 2017.
Operational/Non-Continuous Production FlaringAll flaring other than continuous or safety flaring. It is usually sporadic and carried out at high intensity for a short duration. It may occur on a planned or unplanned basis. It includes flaring carried out during temporary (or partial) failures of equipment used to process gas during normal operations and lasts until the equipment has been repaired or replaced.
Routine Flaring Flaring during normal oil production operations in the absence of sufficient facilities or amenable geology to reinject the produced gas, utilize it onsite, or dispatch it to a market. Routine flaring does not include safety flaring, even when the latter is continuous.
Safety FlaringFlaring carried out to ensure safe operations on facilities.
Start-up FlaringCommissioning new oil or gas production facilities generally takes several weeks. Flaring during this phase can take the form of each of the types of flaring mentioned above, until normal production starts.
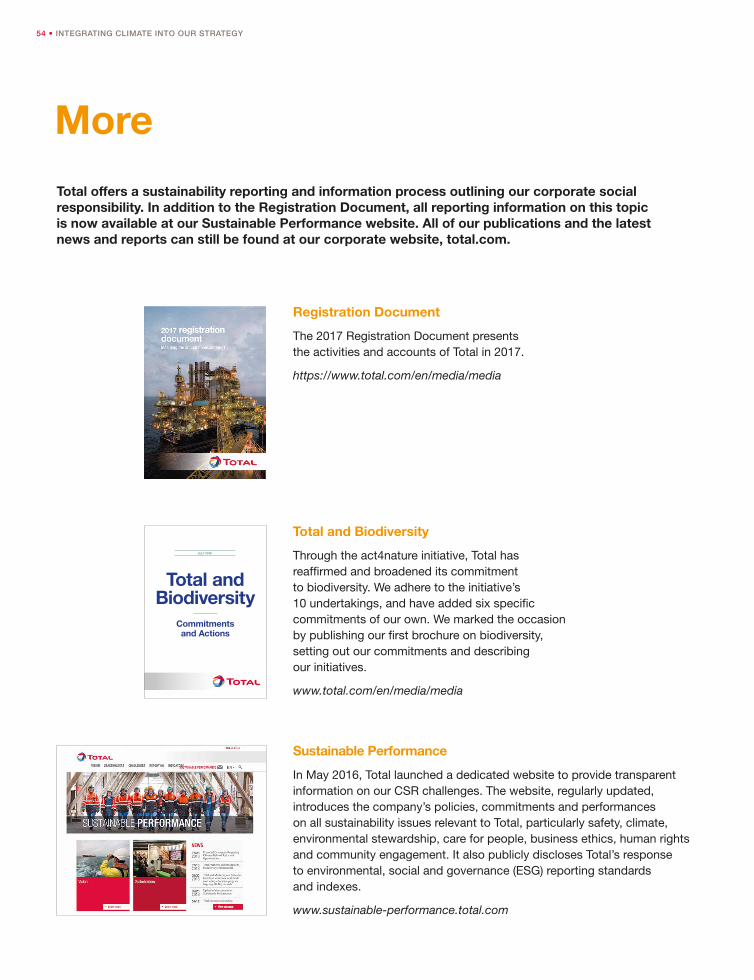
54 • INTEGRATING CLIMATE INTO OUR STRATEGY
More
Total offers a sustainability reporting and information process outlining our corporate social responsibility. In addition to the Registration Document, all reporting information on this topic is now available at our Sustainable Performance website. All of our publications and the latest news and reports can still be found at our corporate website, total.com.
Registration Document
The 2017 Registration Document presents the activities and accounts of Total in 2017.
https://www.total.com/en/media/media
Commitmentsand Actions
BiodiversityTotal and
JULY 2018
Total and Biodiversity
Through the act4nature initiative, Total has reaffirmed and broadened its commitment to biodiversity. We adhere to the initiative’s 10 undertakings, and have added six specific commitments of our own. We marked the occasion by publishing our first brochure on biodiversity, setting out our commitments and describing our initiatives.
www.total.com/en/media/media
Sustainable Performance
In May 2016, Total launched a dedicated website to provide transparent information on our CSR challenges. The website, regularly updated, introduces the company’s policies, commitments and performances on all sustainability issues relevant to Total, particularly safety, climate, environmental stewardship, care for people, business ethics, human rights and community engagement. It also publicly discloses Total’s response to environmental, social and governance (ESG) reporting standards and indexes.
www.sustainable-performance.total.com
Printing
This document was printed with vegetable ink on 100% recycled uncoated, natural white Cyclus Offset paper, produced from recycled FSC-certified pulp, reducing pressure on the world’s forests. The E.U. Ecolabel-certified paper was produced in an ISO 14001- and FSC-certified paper mill. The printer is certified as complying with Imprim’Vert, the French printing industry’s environmental initiative.
Avec Ecofoliotous les papiers
se recyclent.
No. FSC/C124913. The Print Time to Market® concept adopted means that only copies actually distributed are printed. With Citeo, Total is encouraging paper recycling. Sort your trash, protect the environment.
www.citeo.com
Illustrations
Total – Total, Sovcomflot – Total, Istock/Stéphane Jaquemet, Christina Hedges – OGCI, Capa – Total, Inpex, Agence Grizzli, Pierre-Olivier – Capa – Total.
Design and Production
/
Disclaimer
This report, from which no legal consequences may be drawn, is for information purposes only. The entities in which Total S.A. directly or indirectly owns interests are separate legal entities. Total S.A. shall not be held liable for their acts or omissions. The terms “Total,” “Total Group” and “Group” may be used in this report for convenience where general reference is made to Total S.A. and/or its affiliates. Similarly, the words “we,” “us” and “our” may also be used to refer to affiliates or to their employees. It cannot be inferred from the use of these expressions that Total S.A. or any of its affiliates is involved in the business or management of any other Total Group company.
This document refer to a carbon intensity indicator for Total energy sales that measures the weighted average greenhouse gas emissions of energy products sold by Total, from their production in Total facilities to their end use by Total customers. This indicator covers, besides direct GHG emissions of Total (scope 1), indirect GHG emissions (scopes 2 and 3) that Total does not control (for the definitions of scopes 1, 2 and 3, refer to Total’s Registration Document).
This document may contain forward-looking information and statements that are based on business and financial data and assumptions made in a given business financial, competitive and regulatory environment. They may prove to be inaccurate in the future and are subject to a number of risk factors. Neither Total S.A. nor any of its subsidiaries or affiliates assumes any obligation to investors or other stakeholders to update in part or in full any forward-looking information or statement, objective or trend contained in this document, whether as a result of new information, future events or otherwise. Additional information concerning factors, risks and uncertainties that may affect Total’s financial results or activities is provided in the most recent Registration Document, the French-language version of which is filed with the French securities regulator Autorité des Marchés Financiers (AMF), and in Form 20-F filed with the United States Securities and Exchange Commission (SEC).
total.com
Corporate CommunicationsTotal S.A.2 place Jean-Millier92400 Courbevoie, FranceTel.: +33 (0)1 47 44 45 46Share capital: €6,207,262,032.50Registered in Nanterre: RCS 542 051 180www.total.com
Total is a major energy player, which produces and markets fuels, natural gas and low-carbon electricity. Our 100,000 employees are committed to better energy that is safer, more affordable, cleaner and accessible to as many people as possible. Active in more than 130 countries, our ambition is to become the responsible energy major.