integrating flood hazard into site selection of detention basins...
TRANSCRIPT

Full Terms & Conditions of access and use can be found athttp://www.tandfonline.com/action/journalInformation?journalCode=cjep20
Download by: [Tennessee Tech University], [Ebrahim Ahmadisharaf] Date: 23 November 2015, At: 08:23
Journal of Environmental Planning and Management
ISSN: 0964-0568 (Print) 1360-0559 (Online) Journal homepage: http://www.tandfonline.com/loi/cjep20
Integrating flood hazard into site selection ofdetention basins using spatial multi-criteriadecision-making
Ebrahim Ahmadisharaf, Masoud Tajrishy & Nasrin Alamdari
To cite this article: Ebrahim Ahmadisharaf, Masoud Tajrishy & Nasrin Alamdari (2015):Integrating flood hazard into site selection of detention basins using spatial multi-criteria decision-making, Journal of Environmental Planning and Management, DOI:10.1080/09640568.2015.1077104
To link to this article: http://dx.doi.org/10.1080/09640568.2015.1077104
Published online: 15 Oct 2015.
Submit your article to this journal
Article views: 23
View related articles
View Crossmark data

Integrating flood hazard into site selection of detention
basins using spatial multi-criteria decision-making
Ebrahim Ahmadisharaf a*, Masoud Tajrishyb and Nasrin Alamdari c
aCivil and Environmental Engineering Department, Tennessee Technological University,Cookeville, TN, USA; bCivil Engineering Department, Sharif University of Technology,
Tehran, Iran; cBiological Systems Engineering Department, Virginia Polytechnic Instituteand State University, Blacksburg, VA, USA
(Received 25 October 2014; final version received 23 July 2015)
This study presents an innovative approach for the integration of flood hazard into thesite selection of detention basins. The site selection process is conducted by takinginto account multiple criteria and disciplines. Hydraulic modeling results derived fromstormwater management model are employed by Technique for the Order ofPrioritization by Similarity to Ideal Solution (TOPSIS) to determine flood hazardscore. The score generated by TOPSIS is used in a spatial multi-criteria decision-making site selection framework. Applying the framework, a suitability map isgenerated in which primary locations for detention basin placement are determined.The method is demonstrated through the case study of Darakeh River Catchment,which is located in northern Tehran, Iran. The presented framework can be easilyutilized for site selection of other stormwater management techniques, such as lowimpact development and best management practices, due to its versatility.
Keywords: detention basin; site selection; SWMM; spatial multi-criteriadecision-making; flood hazard
1. Introduction
Floods are some of the most damaging events among natural disasters. More than half of
worldwide flood damage occurs in Asia (Tingsanchali 2012). In spite of extensive
research on river flooding, urban flooding has not been considered extensively important
and is yet to be studied (Chen, Hill, and Urbano 2009). In particular, among developing
countries such as Iran, urban flood planning and management is often carried out by
using traditional approaches, such as channelization (discharging the rainwater into the
channel network), without consideration of novel techniques (source control approaches)
such as low-impact development (LID) and best management practices (BMPs). It is,
therefore, necessary to study the capabilities of novel stormwater measures such as
detention basins for urban flood control in developing countries.
Recent developments have brought a wide variety of novel techniques such as LID
and BMPs into stormwater management (Young et al. 2009). Effectiveness of these
measures depends on their geographic location and unplanned application may worsen an
existing situation (McCuen 1974; Emerson, Welty, and Traver 2005; Gilroy and McCuen
2009; Fang et al. 2010). As these techniques influence several disciplines, the site
selection problem is multi-objective and needs a strong synergy between various
*Corresponding author. Email: [email protected]
� 2015 University of Newcastle upon Tyne
Journal of Environmental Planning and Management, 2015
http://dx.doi.org/10.1080/09640568.2015.1077104
Dow
nloa
ded
by [
Ten
ness
ee T
ech
Uni
vers
ity],
[E
brah
im A
hmad
isha
raf]
at 0
8:23
23
Nov
embe
r 20
15

stakeholders from different areas (Yeh and Labadie 1997). A flexible tool capable of
integrating multiple objectives is thus required. Multi-criteria decision-making (MCDM)
methods are useful tools and can provide a systematic framework to deal with such
complex multi-disciplinary problems (Fattahi and Fayyaz 2010).
There is extensive literature on MCDM applications in environmental and water
resource disciplines. Hajkowicz and Collins (2007) reviewed 61 MCDM methods which
were employed in such contexts. Several MCDM techniques were employed in a wide
variety of water resource problems, namely: Willett and Sharda (1991) for the selection
of flood control projects; Ahmadisharaf, Kalyanapu, and Chung (2015) for spatial
assessment of flood management alternatives; Abrishamchi et al. (2005) for urban water
supply; Zarghami (2006) for irrigation planning; Zarghami (2010) for integrated urban
water management (IUWM); Young et al. (2009, 2010), Young, Dymond, and Kibler
(2011) for urban stormwater BMP selection; Giri and Nejadhashemi (2014) for
agricultural BMP selection; Dang, Babel, and Luong (2011) for evaluation of the most
important flood risk parameters; Fernandez and Lutz (2010) for flood hazard mapping;
Afshar et al. (2011) for evaluation of water resource management alternatives; and Kim
and Chung (2013) for assessing the vulnerability to climate change. However, there exist
few applications of MCDM tools for selection and siting of LID/BMPs.
Martin, Ruperd, and Legret (2007) carried out the first application of MCDM for LID/
BMP selection where Elimination and Choice that Translates Reality (ELECTRE) (Roy
1978) was employed for the analysis of decision criteria for BMP selection. Young et al.
(2009) introduced analytical hierarchy process (AHP) (Saaty 1980) for selection of
suitable BMPs. Young et al. (2010), Young, Dymond, and Kibler, 2011) later coupled
Geographic Information System (GIS) with this methodology and applied it to a real
world problem of BMP selection. Ahammed, Hewa, and Argue (2012) used AHP for
evaluation of different water sensitive urban design and LID technologies. Jia et al.
(2013) developed a software program, BMPSELEC, based on a multi-criteria selection
index system for LID/BMP planning and selection. Jato-Espino et al. (2014) applied
AHP for the selection of different types of urban pervious pavements. Moving forward
with the MCDM-based studies, some efforts have been made to develop models for
selection and siting of LID/BMPs. Cheng, Zhen, and Shoemaker (2009) developed a
BMP decision support system, BMPDSS, which is a decision-making tool for BMP
placement based on hydrologic, hydraulic and water quality modeling results. The system
for urban stormwater treatment and analysis integration, which was developed by the US
Environmental Protection Agency (Shoemaker et al. 2009; Lee et al. 2012), is another
tool for modeling, siting and optimization of a set of LID/BMPs. But research on the
application of the hydrologic models and MCDM methods together remains unclear
(Chung and Lee 2009). Additionally, it is noted through the literature review that
hydraulic modeling results have not yet been directly used in MCDM-aided site selection
problems. Chung et al. (2011) illustrated the benefits of integrating continuous runoff
simulation results and MCDM techniques for evaluation of urban watershed management
alternatives. Nevertheless, there has been no effort for the integration of hydraulic
modeling results into site selection of BMPs, including detention basins. The
conventional methodology for BMP site selection entails two major steps: (1) assessment
of the current drainage network by using a hydrologic�hydraulic modeling tool and (2)
placement of BMPs in the areas of concern by consideration of project limitations and
case study restrictions. However, the hydraulic modeling results are not directly applied
in the site selection framework. The subjective decision pertaining to the locations for
BMP placement may potentially yield uncertain solutions for the site-selection problem.
2 E. Ahmadisharaf et al.
Dow
nloa
ded
by [
Ten
ness
ee T
ech
Uni
vers
ity],
[E
brah
im A
hmad
isha
raf]
at 0
8:23
23
Nov
embe
r 20
15

Thus, a less subjective automated procedure needs to be established in order to
incorporate hydraulic modeling results into the site selection of BMPs.
The main objective of this study is to integrate hydraulic modeling results into the site
selection of detention basins by using a spatial MCDM (SMCDM)-based framework.
Hydraulic modeling results are used as a criterion called “flood hazard” in the site-
selection framework. Considering the scope of the study focusing on flood control,
detention basins are selected among the existing LID/BMPs due to their efficiency in
runoff control, as shown in previous studies (Young et al. 2010; Young, Dymond, and
Kibler 2011) and literature suggestions (e.g., Young 2006; Jia et al. 2013). In particular,
as a high return period is analyzed, detention basins are chosen which are effective in
large magnitude runoffs. Other techniques, such as LIDs, are more efficient in small
rainfall events (Schneider and McCuen 2006; Gilroy and McCuen 2009; Zahmatkesh
et al. 2014).
The presented site selection framework consists of three modules and generates a raster
map showing the suitability of each grid cell for detention basin placement. A highly
urbanized catchment, Darakeh, located in the city of Tehran, Iran is used to illustrate the
presented framework. The framework can be easily utilized for site selection of other
stormwater management techniques, such as LID and BMPs, due to its versatility.
2. Methodology
The methodology used by the SMCDM-based framework is presented in this section. The
framework entails three modules: (1) hydrologic�hydraulic modeling; (2) flood hazard
determination; and (3) site selection of detention basins. Primary required data to apply
the framework are intensity-duration-frequency (IDF) curves, as well as GIS datasets of
landuse, soil infiltration, terrain and stream cross sections. The framework for site
selection of detention basins is visualized in Figure 1. Each module is clarified in the next
sections.
2.1. Hydrologic�hydraulic modeling
Hydrologic and hydraulic modeling is carried out by applying USEPA’s stormwater
management model (SWMM) version 5.1.002. SWMM is a distributed dynamic
simulation model that can handle single-event or continuous simulation of both water
quantity and quality (Giron�as et al. 2010; Rossman 2010). Rainfall-runoff transformation
and flow routing are the hydrologic and hydraulic processes, respectively. The Soil
Conservation Service method (US Department of Agriculture (USDA) National
Resources Conservation Service (NRCS) 2004) is selected for rainfall-runoff modeling
due to its simplicity and low data requirement. Full dynamic wave is chosen as the flow
routing technique due to its high accuracy and ability to simulate non-uniform unsteady
flow conditions. The technique solves one-dimensional (1D) full Saint Venant flow
equations. More details about hydrologic�hydraulic modeling by SWMM can be found
in Rossman (2010).
2.2. Flood hazard determination
This section describes the methodology used to determine flood hazard. The innovative
approach to integrate flood hazard into the site selection of detention basins is also
presented in this section. The output results of the first module (hydrologic�hydraulic
Journal of Environmental Planning and Management 3
Dow
nloa
ded
by [
Ten
ness
ee T
ech
Uni
vers
ity],
[E
brah
im A
hmad
isha
raf]
at 0
8:23
23
Nov
embe
r 20
15

modeling) are employed as input into this module. Flood hazard is defined as a linear
function of four indicators: flood beginning time, duration, volume and maximum rate.
The values of the four parameters are combined using a distance-based MCDM approach,
Technique for the Order of Prioritization by Similarity to Ideal Solution (TOPSIS)
(Hwang and Yoon 1981). TOPSIS can be easily programmed as it has a simple
computational procedure (Kim, Park and Yoon 1997). It is utilized here as it can directly
use the original values of evaluation criteria and does not need subjective judgments by
the decision-maker (DM) to post-process hydraulic modeling results. Furthermore, using
TOPSIS enables the DM to avoid the situation that two alternatives under evaluation
have the same value and cannot be appropriately ranked (Hsieh, Chin, and Wu 2006).
TOPSIS is also preferred here to another popular distance-based approach, Compromise
Programming (Zeleny 1973), which only accounts for the distance to utopia (positive
ideal solution) but not the distance to nadir (negative ideal solution), whereas TOPSIS
takes into account both ideal solutions (Hwang and Yoon 1981). In TOPSIS, the best
alternative is the option with closest distance to utopia and farthest from nadir. For these
reasons, TOPSIS is employed for flood hazard determination by post-processing
hydraulic modeling results generated by SWMM.
Figure 1. Schematic of site selection framework.
4 E. Ahmadisharaf et al.
Dow
nloa
ded
by [
Ten
ness
ee T
ech
Uni
vers
ity],
[E
brah
im A
hmad
isha
raf]
at 0
8:23
23
Nov
embe
r 20
15

TOPSIS is applied in the current study in the following steps:
(1) Construction of the evaluation matrix: an evaluation matrix is constructed which
consists of m flooded junctions and n (which is four here) flood hazard indicators.
The values are taken from SWMM modeling results (generated in the first
module). Let F denote the evaluation matrix and fij denote the pixels of F.
Subscripts i and j refer to the flooded junction and flood hazard indicator,
respectively.
(2) Standardization of the pixels of the evaluation matrix: the values of the four flood
hazard indicators, including flood beginning time, duration, volume and
maximum rate, are standardized at flooded junctions. The following equation is
applied to standardize the pixels of evaluation matrix:
rij D fijPmiD 1fij
(1)
in which rij is the pixel of standardized evaluation matrix.
(3) Determination of the weighted standardized values of the evaluation matrix: the
standardized values of each flood hazard indicator (determined in the previous
step) are multiplied to the associated weight at each flooded junction. The
following equation is applied to standardize the pixels of evaluation matrix:
vij Dwj fij (2)
where vij is the pixel of weighted standardized evaluation matrix and wj is the
weight of flood hazard indicator j.
(4) Determination of the utopia and nadir for each flood hazard indicator: values of
utopia and nadir are determined for each of the four flood hazard indicators in the
flooded junctions. Utopia is the value of the flood hazard indicator at the junction
with the least crucial flooding status. In other words, it is the junction with the
latest flood beginning time, shortest flood duration, minimum flood volume and
minimum flood rate, among all flooded junctions. On the other hand, nadir is the
junction that has the earliest flood beginning time, longest flood duration,
maximum flood volume and maximum flood rate, among all flooded junctions.
(5) Computation of the distance to utopia and nadir: Euclidean distance of each flood
hazard indicator at each flooded junction to the corresponding utopia and nadir is
computed in this step. The following equations are used to calculate the distance
to utopia and nadir:
diu DffiffiffiffiffiffiffiffiffiffiffiffiffiffiffiffiffiffiffiffiffiffiffiffiffiffiffiffiffiffiffiffiffiXn
jD 1ðvij � vujÞ
r(3)
din DffiffiffiffiffiffiffiffiffiffiffiffiffiffiffiffiffiffiffiffiffiffiffiffiffiffiffiffiffiffiffiffiffiXn
jD 1ðvij � vnjÞ
r(4)
in which vuj and vnj are the utopia and nadir for flood hazard indicator j, and diuand din are the distance to utopia and nadir for flooded junction i, respectively.
Journal of Environmental Planning and Management 5
Dow
nloa
ded
by [
Ten
ness
ee T
ech
Uni
vers
ity],
[E
brah
im A
hmad
isha
raf]
at 0
8:23
23
Nov
embe
r 20
15

(6) Computation of the relative distance to nadir: relative distance to nadir is
computed for each flooded junction based on the following equation:
ci D diu
din C diu(5)
where ci is the relative distance to nadir for flooded junction i. The greater this relative
distance, the closer to the nadir. In other words, a higher relative distance refers to a more
crucial flood hazard status. Relative distance values are then normalized and the
standardized values are called the final flood hazard score. The normalization is
performed to have the summation of the scores equal to unity.
si D ciPmiD 1ci
(6)
in which si is the flood hazard score for flooded junction i.
Applying the above mentioned procedure, a flood hazard score is assigned to each of
the flooded junctions. The flood hazard scores are then assigned to the contributing
drainage areas (CDAs) of the junction. CDAs with a higher flood hazard score are more
suitable for the construction of a detention basin. In other words, a detention basin is
preferred to be placed upstream of the junctions with a higher flood hazard. The common
areas between the CDAs of two junctions are assigned the flood hazard score of the
junction located upstream. A GIS raster layer is the final product in which the grid cells
indicate the flood hazard score. Thus, flood hazard can be integrated into the other
decision criteria for site selection of detention basins. TOPSIS calculations are performed
in a simple spreadsheet in Microsoft Excel.
2.3. Site selection of detention basins
Site selection of detention basins is conducted by using a SMCDM-based framework, in
which AHP determines the weight of decision criteria and GIS performs the geospatial
analysis. In contrast to many MCDM methods, AHP has a unique approach for weight
determination and can also check the inconsistencies of DM judgments. While AHP
could be alternatively used for the flood hazard determination, it is to be noted that
conducting a similar process with AHP requires building a large PCM (with rows and
columns equal to the number of junctions in the channel network) and thus performing
many pairwise comparisons. Moreover, because AHP cannot use original values of the
criteria (it uses a 1�9 qualitative scale), carrying out pairwise comparisons needs DM
judgments and thereby adds subjective uncertainty to the process. AHP consists of three
steps for weight determination: (1) construction of criteria pairwise comparison matrix
(PCM); (2) extraction of criteria weights; and (3) consistency assessment of the DM
judgments reflected in the criteria PCM. AHP calculations are performed in a spreadsheet
within a Microsoft Excel environment and GIS analyzes are performed within ESRI’s
ArcGISTM environment.1
Site selection of LID/BMPs is commonly carried out based on hydrologic,
environmental and economic concerns. Here, permeability, topographic slope, flood
hazard, land acquisition, distance to channels and social hotspots are selected as decision
criteria. For each criterion, multiple classes are defined and the score for each class is
6 E. Ahmadisharaf et al.
Dow
nloa
ded
by [
Ten
ness
ee T
ech
Uni
vers
ity],
[E
brah
im A
hmad
isha
raf]
at 0
8:23
23
Nov
embe
r 20
15

determined by construction of a PCM. The following notes about the decision criteria
should be clarified:
� Selection of criteria depends on the study area characteristics. For instance, social
hotspots may vary with the case study.
� As the infiltration process in the detention basin is allowed, the permeability is an
important factor. Here, curve number (CN) is considered as a permeability
indicator, as it represents infiltration of both landuse and soil (USDA NRCS 2004).
� Both surface and underground detention basins are proposed, but surface options
are preferred due to the lower required costs of implementation. Thus, in land
acquisition criterion, the first priority is given to open spaces and parks that are
well suited to surface options, and the second priority is given to the areas
owned by the government and municipality that are appropriate for underground
options. Residential areas and health centers are the least favorable landuse
areas, which cannot be occupied due to the restrictions by the cities on urban
encroachment.
The final step is GIS application to generate a spatial suitability map for detention
basin placement. A model is developed within ArcGISTM Model Builder for
geoprocessing operations. The criteria raster layers are overlaid using the model and
following Equation (7):
Vi DXnjD 1
wjvij (7)
in which, Vi is the aggregated score of grid cell i, wj is the weight of criterion j, vij is the
score of grid cell i with respect to criterion j and n is the number of criteria. The output of
this model is a suitability map in which the grid cells show the suitability for detention
basin placement. This map is the final product of the framework presented here for site
selection of detention basins.
3. Case study
A highly urbanized case study in the city of Tehran, Iran, is selected to illustrate the
applicability of the SMCDM framework. The drainage network of the study region has
several complexities due to the rapid, heterogeneous and disorganized development
(Mahab Ghodss Consulting Engineers (hereafter called “MGCE”) and P€oyry 2011). In
recent years, the increase in impervious surfaces as a result of rapid urbanization and
landuse modification has intensified the risk of flooding and caused frequent overflows of
the drainage network. In this study, the Darakeh Catchment located in northern Tehran is
chosen as the study site to illustrate the applicability of the SMCDM-based framework.
The catchment is vulnerable to flooding due to the presence of a high population, as well
as several buildings and assets. It has an area of 43.7 km2, including 17 km2 of urban area
and 26.7 km2 rural area. The drainage network of the study site has a total length of
33 km. Sedimentation is obvious in a large portion of the network which blocks up to
50% of the capacity in some portions (MGCE and P€oyry 2011). A combination of natural
and manmade channels is employed for flood control without using any novel stormwater
management approach (e.g., LID/BMPs). Figure 2 presents the location map for the case
study.
Journal of Environmental Planning and Management 7
Dow
nloa
ded
by [
Ten
ness
ee T
ech
Uni
vers
ity],
[E
brah
im A
hmad
isha
raf]
at 0
8:23
23
Nov
embe
r 20
15

Heavy traffic is evident in the study region during the daytime, so the five major
highways are considered social hotspots. Distance to highways is selected as the indicator
of social hotspot criterion. It is to be noted that while distance to highways is considered as
the only indicator of social hotspots in the present study, other indicators, such as distance
to health centers, can be potentially used to further describe this criterion. The hierarchical
structure of the decision criteria for site selection of the detention basins in the study area
is depicted in Figure 3. Goal, criteria and indicators are organized in three levels. The first
level refers to the goal, or the site selection of detention basins. The second level presents
the six decision criteria. The third level shows the indicators of the decision criteria.
4. Framework demonstration
In this section, the presented SMCDM-based framework is demonstrated through a case
study of the Darakeh Catchment. As discussed earlier, the framework consists of three
modules of hydrologic�hydraulic modeling, flood hazard determination and site
selection of detention basins.
4.1. Hydrologic�hydraulic modeling of the study area
The first step in applying the presented methodology is performing a hydrologic�hydraulic
modeling. A hyetograph is created for 100-yr, six-hr design rainfall event using Tehran
Figure 2. Location map of the study area.
Figure 3. Hierarchy for site selection of detention basins.
8 E. Ahmadisharaf et al.
Dow
nloa
ded
by [
Ten
ness
ee T
ech
Uni
vers
ity],
[E
brah
im A
hmad
isha
raf]
at 0
8:23
23
Nov
embe
r 20
15

IDF equations developed by MGCE and P€oyry (2011). The IDF equations are a function of
return period and invert elevation. The created storm hyetograph is used as the input for the
rainfall-runoff transformation process. Based on MGCE and P€oyry (2011), Darakeh
Catchment delineates into eight subcatchments, five urban and three rural. A rain gage is
set for each subcatchment in SWMM, based on the subcatchment mean invert elevation.
CN values of the subcatchments and Manning’s roughness coefficients of the channels are
directly extracted from MGCE and P€oyry (2011). The values are not calibrated against
field-observed flow data due to the lack of such information. Nevertheless, local reports on
surcharge of channels and specific discharges from the neighbor catchments were used to
verify the CN values.
Taking the abovementioned information, a SWMMmodel is built to simulate rainfall-
runoff transformation and flow routing processes in the study area. The flow routing time
step is set to 1 second with a maximum of 20 trials per time step. An adjustment factor of
25% is used as a variable time step to satisfy the Courant condition within the channels
and to avoid numerical instabilities. A head convergence tolerance of 0.1 mm is also
used. Ponding is not allowed due to the lack of data on ponded area at the junctions.
Furthermore, allowing ponding results in several numerical oscillations in the flow
hydrographs of the channel junctions. Hence, to avoid these types of numerical problems,
the ponding is ignored here.
Running the SWMM model, the simulation summary shows mass continuity errors of
¡0.002% and ¡0.005% for surface runoff and flow routing, respectively, which implies
the validity of analyzed results. No flow instability is seen in the channels. Table 1
summarizes the SWMM modeling results of a 100-yr storm, including flood parameters
in flooded junctions. Figure 4 depicts the flood status in the study area. High flooding
occurs upstream of the drainage network, especially junctions D6 and D7. Moving
further downstream, junctions D8 and D9 have minor flooding, but junctions D10 and
D11 have more flooding due to the overland flow from two subcatchments. The junctions
downstream of D11 are not flooded aside from WDC2, which has remarkable flooding
and is located close to the catchment outlet.
It is important to remember that due to the lack of historical flood data, modeling
results are not calibrated with the observed values. The modeling results, therefore,
cannot be taken as final definitive predicted values. However, this does not affect the
illustration of the site selection framework as the paper focus does not lie in the
representation of calibrated hydrologic�hydraulic modeling results for the case study.
Rather, the modeling process is conducted as a part of the framework to illustrate the
general site selection procedure.
Table 1. Flood parameters in flooded junctions.
Junction Flood beginningtime (min)
Floodduration (min)
Floodvolume (m3)
Maximumflood rate (cms)
D6 190.6 40.2 94,070 80.0
D7 195.3 43.8 40,017 24.2
D8 200.2 17.4 250 1.7
D9 214.9 25.8 60 0.1
D10 200.8 39.6 13,100 10.9
D11 200.6 47.4 15,745 9.3
WDC2 203.1 116.4 278,491 65.5
Journal of Environmental Planning and Management 9
Dow
nloa
ded
by [
Ten
ness
ee T
ech
Uni
vers
ity],
[E
brah
im A
hmad
isha
raf]
at 0
8:23
23
Nov
embe
r 20
15

4.2. Flood hazard determination for the study area
Taking the hydrologic�hydraulic results and the presented algorithm for flood hazard
determination, a flood hazard score is determined at drainage network junctions,
applying TOPSIS and following the outlined methodology. An equal importance of
0.25 is assigned to each of the four flood hazard indicators. Flood hazard scores at
flooded junctions are presented in Table 2. The most crucial flood hazard status
belongs to the upstream junctions (D6 and D7) and a downstream junction (WDC2) in
accordance with the SWMM modeling results discussed earlier. Midstream areas
are mostly unflooded, but minor overflow much less than junctions D6, D7 and WDC2
is evident.
The next step is to assign junction flood hazard scores to the corresponding CDAs.
CDAs of junction D6, D7 and WDC2 are assigned the highest scores. The upstream areas
of the catchment, which are common areas between CDAs of all the flooded junctions,
Figure 4. 100-yr flood status in the case study.
10 E. Ahmadisharaf et al.
Dow
nloa
ded
by [
Ten
ness
ee T
ech
Uni
vers
ity],
[E
brah
im A
hmad
isha
raf]
at 0
8:23
23
Nov
embe
r 20
15
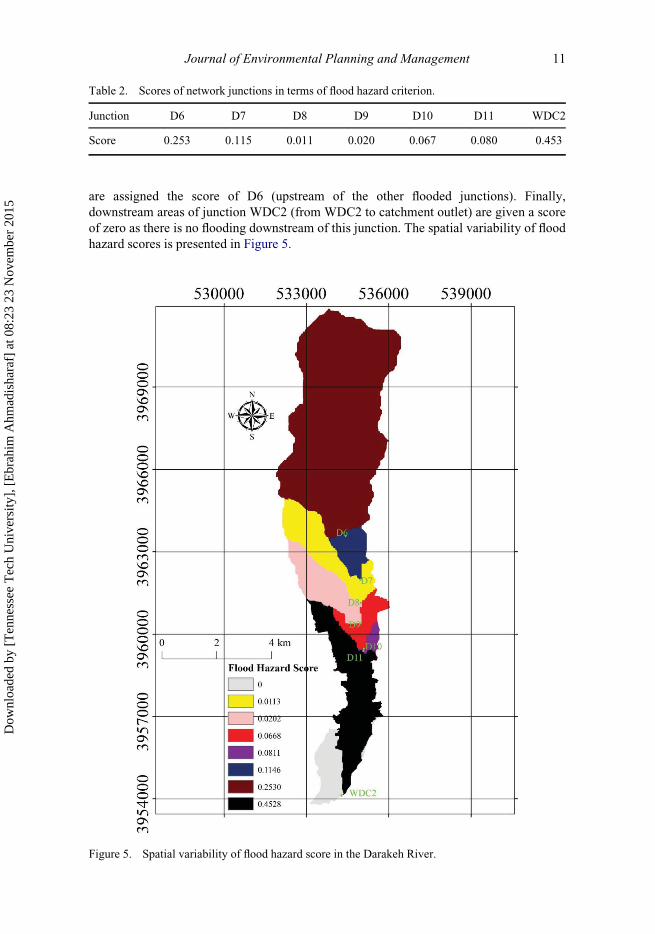
are assigned the score of D6 (upstream of the other flooded junctions). Finally,
downstream areas of junction WDC2 (from WDC2 to catchment outlet) are given a score
of zero as there is no flooding downstream of this junction. The spatial variability of flood
hazard scores is presented in Figure 5.
Table 2. Scores of network junctions in terms of flood hazard criterion.
Junction D6 D7 D8 D9 D10 D11 WDC2
Score 0.253 0.115 0.011 0.020 0.067 0.080 0.453
Figure 5. Spatial variability of flood hazard score in the Darakeh River.
Journal of Environmental Planning and Management 11
Dow
nloa
ded
by [
Ten
ness
ee T
ech
Uni
vers
ity],
[E
brah
im A
hmad
isha
raf]
at 0
8:23
23
Nov
embe
r 20
15

4.3. Site selection of detention basins for the study area
In this section, the presented SMCDM-based site selection framework is applied to the
case study of Darakeh River. The rasters of the two criteria distance to channels and
social hotspots (with the indicator of distance to highways) are produced using the
Euclidean Distance function of ArcGISTM. First, each criterion is classified into
multiple non-overlapping classes. An AHP PCM, which consists of the classes as rows
and columns, is then constructed for each criterion to derive the score of the classes in
each criterion. Table 3 shows the scores of the criteria (or the indicators) classes. It is
to be noted that the flood hazard criterion is not listed in this table as the scores were
previously determined by TOPSIS in module 2 (hydrologic�hydraulic modeling). The
GIS rasters of the criteria are then reclassified to the scores presented in Table 3 using
the ArcGISTM Reclassify function.
The next step is building the AHP PCM of the decision criteria to determine the weights.
A 6 £ 6 matrix is built, as shown in Table 4. The judgments are conducted based on the
authors’ preferences and also by taking into account the opinions of a limited number of
experts from the private sector. Preferences of the stakeholders from government and
municipalities are not reflected in the judgment. The inconsistency ratio of the criteria PCM
is computed as 0.04, which is less than 0.10 (maximum allowable value of the inconsistency
Table 3. Scores of the criteria classes for the study area.
Criterion Indicator Class Score Inconsistencyratio
Topographic slope ¡ 0%�5% 0.566 0.06
5%�10% 0.267
10%�15% 0.127
>15% 0.040
Distance to channels ¡ 0�100 m 0.513 0.05
100�250 m 0.261
250�500 m 0.129
500�1000 m 0.063
>1000 m 0.033
Social hotspots Distance to highways >5000 m 0.583 0.06
2500�5000 m 0.290
1000�2500 m 0.085
0�1000 m 0.042
Permeability CN 65�70 0.513 0.05
70�75 0.261
75�80 0.129
80�85 0.063
85�90 0.033
Land acquisition Landuse Open spaces/parks 0.654 0.09
Urban facilities 0.249
Mountainous 0.048
Residential/health centers 0.048
12 E. Ahmadisharaf et al.
Dow
nloa
ded
by [
Ten
ness
ee T
ech
Uni
vers
ity],
[E
brah
im A
hmad
isha
raf]
at 0
8:23
23
Nov
embe
r 20
15

ratio suggested by Saaty (1980)) and verifies the consistencies of the judgments. Extracted
criteria weights are presented in Table 5. The highest weight belongs to the land acquisition
criterion due to the Tehran municipality restrictions on urban encroachment, and the flood
hazard criterion due to the main objective of the current study which is flood control. The
second priority is given to social hotspots due to the importance of traffic flow in the city and
its role in daily transportation. Distance to channels and permeability are given the next
priority and topographic slope is assigned the lowest importance.
The final step is the application of the ArcGISTM Model Builder, discussed earlier in
the methodology section, to generate the suitability map for detention basin placement.
Running the model for the study site of Darakeh River, a suitability map is produced,
where the grid cells show the suitability of detention basin placement. To give a better
understanding of the final results, aggregated scores are qualitatively classified into three
different groups regarding the detention basin placement. They are presented in Table 6
and are stated as: unsuitable (class 1), moderately suitable (class 2) and highly suitable
(class 3). The areas of class 3 (highly suitable) are obviously desired for the construction
of a detention basin.
The final suitability map for detention basin placement in the Darakeh River is
presented in Figure 6 based on the abovementioned qualitative classification. Based on
the figure, 47.2%, 51.1% and 1.6% of the catchment areas are occupied with classes
1�3, respectively. Areas of class 3, which are the most suitable for detention basin
placement, are mostly located in the midstream areas (upstream of junction WDC2)
for two main reasons: First, SWMM modeling results show that junction WDC2 has
remarkable flooding issues and the upstream sections are assigned the highest score
for the flood hazard criterion. Due to the high importance of this criterion, these
locations are given a considerable score. Second, open spaces and parks are located in
the midstream sections, which attain a high value from the land acquisition criterion
(also of high importance). There are also upstream areas (upstream of junction D6)
Table 4. AHP PCM of site selection criteria.
CriterionTopographic
slopeDistance tochannels
Socialhotspot Permeability
Floodhazard
Landacquisition
Topographic slope 1 1/3 1/7 1/3 1/9 1/9
Distance to channels 3 1 1/5 1 1/7 1/7
Social hotspot 7 5 1 5 1/3 1/3
Permeability 3 1 1/5 1 1/7 1/7
Flood hazard 9 7 3 7 1 1
Land acquisition 9 7 3 7 1 1
Table 5. Site selection criteria weights.
Landacquisition
Floodhazard Permeability
Socialhotspot
Distance tochannels
Topographicslope Criterion
0.348 0.348 0.050 0.176 0.050 0.026 Weight
Journal of Environmental Planning and Management 13
Dow
nloa
ded
by [
Ten
ness
ee T
ech
Uni
vers
ity],
[E
brah
im A
hmad
isha
raf]
at 0
8:23
23
Nov
embe
r 20
15

with high suitability due to the high flood hazard criterion score and the existence of
open spaces upstream of junction D6. Other areas upstream of junction D6, which are
mostly mountainous with steep topographic slopes, do not fall within the highly
suitable class (class 3).
Table 6. Qualitative classification of aggregated score for detention basin placement.
Class 1 2 3
Aggregated score 0�0.20 0.2�0.40 0.40�1
Qualitative description Unsuitable Moderately suitable Highly suitable
Figure 6. Suitability map for detention basin placement in the Darakeh River.
14 E. Ahmadisharaf et al.
Dow
nloa
ded
by [
Ten
ness
ee T
ech
Uni
vers
ity],
[E
brah
im A
hmad
isha
raf]
at 0
8:23
23
Nov
embe
r 20
15

To select the final location for detention basin placement, class 3 regions should be
scrutinized. Taking the average score of these regions, the values are found to be very
close and are therefore difficult to prioritize. In this situation, an additional criterion (with
discrimination capacity) can be considered. However, this is not conducted here and
instead the sensitivity of the preliminary suitable regions with respect to the criteria
weights is analyzed in order to evaluate the robustness of these regions. The most robust
region is selected as the best location for detention basin placement. The next section
describes the sensitivity analysis for the present study.
5. Sensitivity analysis
A sensitivity analysis is performed to assess the robustness of preliminary selected regions
with respect to the criteria weights. Six additional weight sets are defined in tandem with the
preliminary weight set. The weight set scenarios are defined by the variation of the weights
of the three most important decision criteria: flood hazard, land acquisition and social
hotspots. Six other weight sets are defined, along with the preliminary assigned weights,
producing a total of seven weight sets. The seven weight set scenarios are: (1) preliminary
assigned weights (Table 7); (2) 10% increase in flood hazard criterion weight; (3) 10%
decrease in flood hazard criterion weight; (4) 10% increase in land acquisition criterion
weight; (5) 10% decrease in land acquisition criterion weight; (6) 10% increase in social
hotspots criterion weight; and (7) 10% decrease in social hotspots criterion weight. Table 7
shows the criteria weights in different weight set scenarios. For each scenario, a suitablity
map is generated in ArcGISTM and the map is classified into three groups using the
classification in Table 6. Final suggested areas are those that are in suitability class 3 (highly
suitable) in all seven weight set scenarios. Moreover, regions with an area of less than 4 ha
(10 acre) are eliminated according to the recommendations by USEPA (2000). Figure 7
visualizes the final suggested locations for detention basin placement. Three locations are
selected, based on the map, as final regions for detention basin placement. These locations
have areas of 4.7, 25.8 and 5.7 ha, respectively. Selected location 1 is in an open space area,
but the two others are located in parks. Discriminating these three locations depends on the
project goals and limitations. Location 2 has a remarkably higher area compared to the other
choices and will be more desirable in a condition that a larger detention basin is needed.
Location 1 will also be desirable when open spaces are preferred to parks. Again, the
hydrologic and hydraulic modeling results are not calibrated, and it is to be highlighted that
the suggested areas for detention basin placement should not be taken as ultimate choices
and should be used cautiously.
Table 7. Criteria weights in different sensitivity analysis scenarios.
Criterionweight set
Topographicslope
Distance tochannels
Socialhotspot Permeability
Floodhazard
Landacquisition
1 0.026 0.050 0.176 0.050 0.348 0.348
2 0.019 0.044 0.169 0.044 0.383 0.341
3 0.033 0.057 0.183 0.057 0.314 0.355
4 0.019 0.044 0.169 0.044 0.341 0.383
5 0.033 0.057 0.183 0.057 0.355 0.314
6 0.023 0.047 0.194 0.047 0.345 0.345
7 0.030 0.054 0.159 0.054 0.352 0.352
Journal of Environmental Planning and Management 15
Dow
nloa
ded
by [
Ten
ness
ee T
ech
Uni
vers
ity],
[E
brah
im A
hmad
isha
raf]
at 0
8:23
23
Nov
embe
r 20
15

6. Summary and conclusions
In this study, an innovative methodology for site selection of detention basins was
presented. The approach integrates flood hazard into site selection of detention basins
using a SMCDM-based framework. It entails three modules: hydrologic�hydraulic
modeling, flood hazard determination and site selection of detention basins. In the first
module, USEPA’s SWMM was used for hydrologic�hydraulic modeling. The hydraulic
modeling results, including flood beginning time, duration, volume and rate, were used as
flood hazard indicators. In the second module, TOPSIS was applied to combine the four
indicators and to determine the flood hazard scores. Flood hazard was then employed as a
decision criterion in the third module. Six criteria were considered for site selection,
Figure 7. Final suggested locations for detention basin placement in the Darakeh River.
16 E. Ahmadisharaf et al.
Dow
nloa
ded
by [
Ten
ness
ee T
ech
Uni
vers
ity],
[E
brah
im A
hmad
isha
raf]
at 0
8:23
23
Nov
embe
r 20
15

including permeability, topographic slope, flood hazard, land acquisition, distance to
channels and social hotspots. The final product of the framework is a raster map, in which
the grid cells indicate the suitability of the locations for detention basin placement. An
illustrative example in a highly urbanized catchment, in this case the Darakeh area
located in the city of Tehran, Iran, was also provided. Sensitivity of primary candidates
for detention basin placement was analyzed to evaluate the robustness of selected areas.
The framework for site selection of detention basins can be used for other types of
stormwater management techniques such as LID/BMPs due to its versatility.
Nevertheless, it has some limitations which are discussed in this section.
First, due to the importance of criteria weights in MCDM, stakeholders are commonly
engaged in the weighting process (Munda 2006; Lai, Lundie, and Ashbolt 2008).
Nevertheless, the weights were determined here based on the authors’ preferences and
also by accounting for the opinions of a limited number of experts from the private
sector, as this was not the main scope of this paper and was only a step to illustrate the
general procedure of the innovative SMCDM-based site selection framework.
Consequently, the results of this study cannot be taken as the final absolute suitability
map for detention basin placement and need to be coupled with a more sophisticated
process of public engagement and stakeholders’ participation before it can be utilized in
practice. Weighting should be carried out with the participation of stakeholders from
government and municipalities to validate the results of this study. This can be performed
by using some interviews, questionnaires, and workshops.
Second, a distance-based MCDM method, TOPSIS, was used in this study for flood
hazard determination. Other MCDM methods, including but not limited to, outranking
techniques (e.g., ELECTRE), can be potentially used in the future to verify current
findings. Similarly, for the criteria weight determination, a pairwise comparison MCDM
technique, AHP, was used. Another pairwise comparison method, analytical network
process can be employed in the situation that the criteria are not independent.
Additionally, other methods such as Entropy can be employed for criteria weighting.
Third, the robustness of the selected areas for detention basin placement was
assessed through a simple sensitivity analysis. However, this approach analyzed the
subjective uncertainty; it cannot express the probabilistic and imprecise forms of
uncertainty (Bender and Simonovic 2000). A potential solution is coupling the fuzzy
sets (Zadeh 1965) into the decision-making framework (Ascough et al. 2008). In this
context, the studies of Anagnostopoulos and Vavatsikos (2012) for site selection of
natural systems for wastewater treatment, and Chen, Khan and Paydar (2010a) for the
evaluation of irrigated cropland suitability, is noteworthy. Alternatively, recent
advanced sensitivity analysis methodologies such as that proposed by Chen, Yu and
Khan (2010b, 2013), can be utilized. Apart from the evaluation criteria weights,
uncertainty of the decision criteria values was not analyzed in our study. For example,
the impact of the design storm uncertainty, which might be due to statistical analysis
of rainfall datasets or future climate change, on the suitability of the areas for
detention basin placement would be an interesting research topic for future studies. In
particular, in the absence of observed data, which was the case in our study site, this
type of study will be valuable. A possible solution is using probabilistic methods such
as Monte Carlo simulation instead of the conventional deterministic approaches.
A recent study by Jato-Espino et al. (2014), in which Monte Carlo methods were
employed to stochastically model the criteria variability in selection of urban pervious
pavements, is notable. Nevertheless, there is still rare application in the context of
LID/BMP selection or siting.
Journal of Environmental Planning and Management 17
Dow
nloa
ded
by [
Ten
ness
ee T
ech
Uni
vers
ity],
[E
brah
im A
hmad
isha
raf]
at 0
8:23
23
Nov
embe
r 20
15

Fourth, even though the paper focused on flood control, the site selection process was
performed with an integrated perspective of urban stormwater management by accounting
for various selection criteria. It is, therefore, more holistic in comparison with the recent
detention basin site selection by MGCE and P€oyry (2011) in the Tehran Stormwater
Master Plan, that was only based on the hydraulic capacity of the drainage network.
Nonetheless, more efforts still need to be made to meet the key requirements of sustainable
stormwater management (Lai, Lundie, and Ashbolt 2008; Barbosa, Fernandes, and David
2012). For instance, water quality improvement capabilities of detention basins were not
taken into consideration in this study. Adding such criteria to the current decision-making
framework will enhance the sustainability of the suitability map.
Finally, flood hazard was determined as a linear function of four flood parameters
generated by SWMM, which has some limitations. First, other flood parameters can be
considered for flood hazard determination, such as rate of rise and warning time. Second,
SWMM is not a raster-based model and cannot determine flood inundation extent. A
more advanced flood model tool should be employed to determine flood hazard. Future
elaborations are recommended to investigate the effect of flood modeling and flood
hazard determination on the final suitability map.
Acknowledgements
The authors are grateful to Dr Alfred Kalyanapu at Tennessee Technological University forproviding MCDM and GIS resources. We would also like to acknowledge support provided by theCenter for the Management, Utilization and Protection of Water Resources at TennesseeTechnological University. Special thanks to Steven A. Stratz for assistance in improving theEnglish language structure of the article.
Disclosure statement
No potential conflict of interest was reported by the authors.
Note
1. It is to be noted that in order to perform all the computations of the third module in ArcGISTM
environment, AHP calculations can also be performed by implementing a Python script inArcGISTM environment.
ORCID
Ebrahim Ahmadisharaf http://orcid.org/0000-0002-9452-7975Nasrin Alamdari http://orcid.org/0000-0001-6595-6669
References
Abrishamchi, A., A. Ebrahimian, M. Tajrishi, and M.A. Marino. 2005. “Case Study: Application ofMulticriteria Decision Making to Urban Water Supply.” Journal of Water Resources Planningand Management 131 (4): 326�335.
Afshar, A., M.A. Marino, M. Saadatpour, and A. Afshar. 2011. “Fuzzy TOPSIS Multi-CriteriaDecision Analysis Applied to Karun Reservoirs System.” Water Resources Management 25(2): 545�563.
Ahammed, F., G.A. Hewa, and J.R. Argue. 2012. “Applying Multi-Criteria Decision Analysis toSelect WSUD and LID Technologies.” Water Science and Technology: Water Supply 12 (6):844�853.
18 E. Ahmadisharaf et al.
Dow
nloa
ded
by [
Ten
ness
ee T
ech
Uni
vers
ity],
[E
brah
im A
hmad
isha
raf]
at 0
8:23
23
Nov
embe
r 20
15

Ahmadisharaf, A., A.J. Kalyanapu, and E.S. Chung. 2015. “Evaluating the Effects of InundationDuration and Velocity on Selection of Flood Management Alternatives Using Multi-CriteriaDecision Making.”Water Resources Management 29 (8): 2543�2561.
Anagnostopoulos, K., and A. Vavatsikos. 2012. “Site Suitability Analysis for Natural Systems forWastewater Treatment with Spatial Fuzzy Analytic Hierarchy Process.” Journal of WaterResources Planning and Management 138 (2): 125�134.
Ascough, J.C., H.R. Maier, J.K. Ravalico, and M.W. Strudley. 2008. “Future Research Challengesfor Incorporation of Uncertainty in Environmental and Ecological Decision-Making.”Ecological Modelling 219 (3): 383�399.
Barbosa, A.E., J.N. Fernandes, and L.M. David. 2012. “Key Issues for Sustainable UrbanStormwater Management.”Water Research 46 (20): 6787�6798.
Bender, M.J., and S.P. Simonovic. 2000. “A Fuzzy Compromise Approach to Water ResourceSystems Planning Under Uncertainty.” Fuzzy Sets and Systems 115 (1): 35�44.
Chen, J., A.A. Hill, and L.D. Urbano. 2009. “A GIS-Based Model for Urban Flood Inundation.”Journal of Hydrology 373 (1): 184�192.
Chen, Y., S. Khan, and Z. Paydar. 2010a. “To Retire or Expand? A Fuzzy GIS�Based SpatialMulti�Criteria Evaluation Framework for Irrigated Agriculture.” Irrigation and Drainage 59(2): 174�188.
Chen, Y., J. Yu, and S. Khan. 2010b. “Spatial Sensitivity Analysis of Multi-Criteria Weights inGIS-Based Land Suitability Evaluation.” Environmental Modelling and Software 25 (12):1582�1591.
Chen, Y., J. Yu, and S. Khan. 2013. “The Spatial Framework for Weight Sensitivity Analysis inAHP-Based Multi-Criteria Decision Making.” Environmental Modelling and Software 48:129�140.
Cheng, M.S., J.X. Zhen, and L. Shoemaker. 2009. “BMP Decision Support System for EvaluatingStormwater Management Alternatives.” Frontiers of Environmental Science and Engineeringin China 3 (4): 453�463.
Chung, E.S., W.P. Hong, K.S. Lee, and S.J. Burian. 2011. “Integrated Use of a ContinuousSimulation Model and Multi-Attribute Decision-Making for Ranking Urban WatershedManagement Alternatives.” Water Resources Management 25 (2): 641�659.
Chung, E.S., and K.S. Lee. 2009. “Prioritization of Water Management for Sustainability UsingHydrologic Simulation Model and Multicriteria Decision Making Techniques.” Journal ofEnvironmental Management 90 (3): 1502�1511.
Dang, N.M., M.S. Babel, and H.T. Luong. 2011. “Evaluation of Flood Risk Parameters in the DayRiver Flood Diversion Area, Red River Delta, Vietnam.” Natural Hazards 56 (1): 169�194.
Emerson, C.H., C. Welty, and R.G. Traver. 2005. “Watershed-Scale Evaluation of a System ofStorm Water Detention Basins.” Journal of Hydrologic Engineering 10 (3): 237�242.
Fang, Z., A. Zimmer, P.B. Bedient, H. Robinson, J. Christian, and B.E. Vieux. 2010. “Using aDistributed Hydrologic Model to Evaluate the Location of Urban Development and FloodControl Storage.” Journal of Water Resources Planning and Management 136 (5): 597�601.
Fattahi, P., and S. Fayyaz. 2010. “A Compromise Programming Model to Integrated Urban WaterManagement.”Water Resources Management 24 (6): 1211�1227.
Fernandez, D.S., and M.A. Lutz. 2010. “Urban Flood Hazard Zoning in Tucuman Province,Argentina, Using GIS and Multicriteria Decision Analysis.” Engineering Geology 111 (1):90�98.
Gilroy, K.L., and R.H. McCuen. 2009. “Spatio-Temporal Effects of Low Impact DevelopmentPractices.” Journal of Hydrology 367 (3): 228�236.
Giri, S., and A.P. Nejadhashemi. 2014. “Application of Analytical Hierarchy Process for EffectiveSelection of Agricultural Best Management Practices.” Journal of Environmental Management132: 165�177.
Giron�as, J., L.A. Roesner, L.A. Rossman, and J. Davis. 2010. A New Applications Manual for theStorm Water Management Model (SWMM). Environmental Modelling and Software, 25 (6):813�814.
Hajkowicz, S., and K. Collins. 2007. “A Review of Multiple Criteria Analysis for Water ResourcesPlanning and Management.”Water Resources Management 21 (9): 1553�1566.
Hsieh, L.F., J.B. Chin, and M.C. Wu. 2006. “Performance Evaluation for University ElectronicLibraries in Taiwan.” The Electronic Library 24 (2): 212�224.
Journal of Environmental Planning and Management 19
Dow
nloa
ded
by [
Ten
ness
ee T
ech
Uni
vers
ity],
[E
brah
im A
hmad
isha
raf]
at 0
8:23
23
Nov
embe
r 20
15

Hwang, C.L., and K.P. Yoon. 1981. Multiple Attribute Decision Making: Methods andApplications. New York: Springer-Verlag.
Jato-Espino, D., J. Rodriguez-Hernandez, V.C. Andr�es-Valeri, and F. Ballester-Mu~noz. 2014. “AFuzzy Stochastic Multi-Criteria Model for the Selection of Urban Pervious Pavements.” ExpertSystems with Applications 41 (15): 6807�6817.
Jia, H., H. Yao, Y. Tang, L.Y. Shaw, J.X. Zhen, and Y. Lu. 2013. “Development of a Multi-CriteriaIndex Ranking System for Urban Runoff Best Management Practices (BMPs) Selection.”Environmental Monitoring and Assessment 185 (9): 7915�7933.
Kim, Y., and E.S. Chung. 2013. “Assessing Climate Change Vulnerability with Group Multi-Criteria Decision Making Approaches.” Climatic Change 121 (2): 301�315.
Kim, G., C.S. Park, and K.P. Yoon. 1997. “Identifying Investment Opportunities for AdvancedManufacturing Systems with Comparative-Integrated Performance Measurement.”International Journal of Production Economics 50 (1): 23�33.
Lai, E., S. Lundie, and N.J. Ashbolt. 2008. “Review of Multi-Criteria Decision Aid for IntegratedSustainability Assessment of Urban Water Systems.” Urban Water 5 (4): 315�327.
Lee, J.G., A. Selvakumar, K. Alvi, J. Riverson, J.X. Zhen, L. Shoemaker, and F.H. Lai. 2012. “AWatershed-Scale Design Optimization Model for Stormwater Best Management Practices.”Environmental Modelling and Software 37: 6�18.
Martin, C., Y. Ruperd, and M. Legret. 2007. “Urban Stormwater Drainage Management: TheDevelopment of a Multicriteria Decision Aid Approach for Best Management Practices.”European Journal of Operational Research 181 (1): 338�349.
McCuen, R.H. 1974. “A Regional Approach to Urban Storm Water Detention.” GeophysicalResearch Letters 1 (7): 321�322.
MGCE, and P€oyry. 2011. Tehran Stormwater Management Master Plan. Tehran. (in Persian).Munda, G. 2006. “Social Multi-Criteria Evaluation for Urban Sustainability Policies.” Land Use
Policy 23 (1): 86�94.Rossman, L.A. 2010. Storm Water Management Model User’s Manual, Version 5.0. Cincinatti:
National Risk Management Research Laboratory, Office of Research and Development,USEPA.
Roy, B. 1978. “ELECTRE III: Un algorithme de classements fond�e sur une repr�esentation floue despr�ef�erences en pr�esence de criteres multiples.” Cahiers du CERO 20 (1): 3�24.
Saaty, T.L. 1980. The Analytical Hierarchical Process: Planning, Priority Settings, ResourceAllocation. New York: McGraw-Hill.
Schneider, L.E., and R.H. McCuen. 2006. “Assessing the Hydrologic Performance of BestManagement Practices.” Journal of Hydrologic Engineering 11 (3): 278�281.
Shoemaker, L., J. Riverson, K. Alvi, J.X. Zhen, S. Paul, and T. Rafi. 2009. SUSTAIN: A Frameworkfor Placement of Best Management Practices in Urban Watersheds to Protect Water Quality.Cincinnati: National Risk Management Research Laboratory, Office of Research andDevelopment, USEPA.
Tingsanchali, T. 2012. “Urban Flood Disaster Management.” Procedia Engineering 32: 25�37.USDA NRCS. 2004. “Estimation of Direct Runoff from Storm Rainfall.” In National Engineering
Handbook�Part 630 Hydrology, 10.1�10.22, Washington, DC. Accessed 10 April 2012.http://www.wcc.nrcs.usda.gov/ftpref/wntsc/H&H/NEHhydrology/ch10.pdf
USEPA. 2000. “National Menu of Stormwater Best Management Practices: Dry Detention Ponds.”Accessed 1 May 2012. http://water.epa.gov/polwaste/npdes/swbmp/Dry-Detention-Ponds.cfm
Willett, K., and R. Sharda. 1991. “Using the Analytic Hierarchy Process in Water ResourcesPlanning: Selection of Flood Control Projects.” Socio-Economic Planning Sciences 25 (2):103�112.
Yeh, C.H., and J.W. Labadie. 1997. “Multiobjective Watershed-Level Planning of Storm WaterDetention Systems.” Journal of Water Resources Planning and Management 123 (6): 336�343.
Young, K.D. 2006. “Application of the Analytic Hierarchy Process Optimization Algorithm in BestManagement Practice Selection.” M.Sc. Thesis, Virginia Polytechnic Institute and StateUniversity, Blacksburg, VA.
Young, K.D., D.F. Kibler, B.L. Benham, and G.V. Loganathan. 2009. “Application of theAnalytical Hierarchical Process for Improved Selection of Storm-Water BMPs.” Journal ofWater Resources Planning and Management 135 (4): 264�275.
20 E. Ahmadisharaf et al.
Dow
nloa
ded
by [
Ten
ness
ee T
ech
Uni
vers
ity],
[E
brah
im A
hmad
isha
raf]
at 0
8:23
23
Nov
embe
r 20
15

Young, K.D., T. Younos, R.L. Dymond, D.F. Kibler, and D.H. Lee. 2010. “Application of theAnalytic Hierarchy Process for Selecting and Modeling Stormwater Best ManagementPractices.” Journal of Contemporary Water Research and Education 146 (1): 50�63.
Young, K.D., R.L. Dymond, and D.F. Kibler. 2011. “Development of an Improved Approach forSelecting Stormwater Best Management Practices.” Journal of Water Resources Planning andManagement 137 (3): 268�275.
Zadeh, L. 1965. “Fuzzy Sets.” Information and Control 8 (3): 338�353.Zahmatkesh, Z., S.J. Burian, M. Karamouz, H. Tavakol-Davani, and E. Goharian. 2014. “Low-
Impact Development Practices to Mitigate Climate Change Effects on Urban StormwaterRunoff: Case Study of New York City.” Journal of Irrigation and Drainage Engineering 141(1): 04014043 1�13.
Zarghami, M. 2006. “Integrated Water Resources Management in Polrud Irrigation System.” WaterResources Management 20 (2): 215�225.
Zarghami, M. 2010. “Urban Water Management Using Fuzzy-Probabilistic Multi-ObjectiveProgramming with Dynamic Efficiency.”Water Resources Management 24 (15): 4491�4504.
Zeleny, M. 1973. “Compromise Programming.” In Multiple Criteria Decision Making, edited byJ. L. Cochrane, and M. Zeleny, 262�301. Columbia: University of South Carolina Press.
Journal of Environmental Planning and Management 21
Dow
nloa
ded
by [
Ten
ness
ee T
ech
Uni
vers
ity],
[E
brah
im A
hmad
isha
raf]
at 0
8:23
23
Nov
embe
r 20
15