integrating hydrodynamic and hydraulic modeling for
TRANSCRIPT

HAL Id: hal-01328561https://hal.inria.fr/hal-01328561
Submitted on 8 Jun 2016
HAL is a multi-disciplinary open accessarchive for the deposit and dissemination of sci-entific research documents, whether they are pub-lished or not. The documents may come fromteaching and research institutions in France orabroad, or from public or private research centers.
L’archive ouverte pluridisciplinaire HAL, estdestinée au dépôt et à la diffusion de documentsscientifiques de niveau recherche, publiés ou non,émanant des établissements d’enseignement et derecherche français ou étrangers, des laboratoirespublics ou privés.
Distributed under a Creative Commons Attribution| 4.0 International License
Integrating Hydrodynamic and Hydraulic Modeling forEvaluating Future Flood Mitigation in Urban
EnvironmentsMahesh Prakash, James Hilton, Lalitha Ramachandran
To cite this version:Mahesh Prakash, James Hilton, Lalitha Ramachandran. Integrating Hydrodynamic and HydraulicModeling for Evaluating Future Flood Mitigation in Urban Environments. 11th International Sym-posium on Environmental Software Systems (ISESS), Mar 2015, Melbourne, Australia. pp.282-292,�10.1007/978-3-319-15994-2_28�. �hal-01328561�
Integrating Hydrodynamic and Hydraulic Modeling for Evaluating Future Flood Mitigation in Urban Environments
Mahesh Prakash1*, James Hilton1 and Lalitha Ramachandran2
1CSIRO Digital Productivity Flagship, Melbourne, Australia 2The City of Port Phillip, Victoria, Australia
Abstract. We present an integrated flood modelling tool that is able to evaluate different mitigation solutions for areas that are prone to floods from storm surge and heavy rainfall. Our model integrates catchment and coastal flood modelling (spatio-temporally dynamic), including sea level rise, to provide a holistic inundation model for future flooding. Addi-tionally, the model aims to enable simulation of a combination of flood mitigation and ad-aptation options. To date, the practice has been to model either drainage augmentation so-lutions alone, or (for coastal inundation) single coastal adaptation solutions. This tool aims to deliver the capacity to model a range of both coastal and drainage adaptation solu-tions to understand what combination of solutions might be effective. The model is demonstrated for example cases in the City of Port Phillip, Melbourne. Three mitigation strategies involving the use of a hypothetical off-shore reef and the combination of a sin-gle valve systems and retention/detention measures are evaluated for the region around Elwood canal for current and future scenarios.
Keywords: modular mitigation analysis, drainage augmentation, local councils, evidence based cost-benefit analysis, land-use planning.
1 Introduction
Australia has a very long coastline stretching almost 36,000 km in the mainland. A significant percentage of the population resides along this coastline especially along the eastern seaboard. Among these urban environments there are several locations that are low lying and are prone to flooding including storm surge, heavy rainfall and catchment. The Elwood Canal region in the City of Port Phillip (CoPP) in Melbourne, Victoria is particularly at risk of flooding which has been indicated through flood mapping studies carried out internally by engineers in the council as well as through AECOM [1]. However the coastal flood inundation studies have been carried out using essentially static bath tub type models which do not provide details of flooding such as duration and areas that are prone to water logging (lack of sufficient drainage). This can be particularly important to decide future infrastructure needs including the effect of sea level rise (SLR). Additionally mitigation and adaptation options have not been investigated using a simulation and modelling approach in the past following on from a flood modelling exercise. An integrated flood modelling tool that is able to evaluate different mitigation solutions has therefore been developed by CSIRO for the CoPP so that the council:
1. Continues to have new (as becomes available) catchment and coastal data modelled into an integrated hydrodynamic model in order to understand what climate risks might pre-sent design and maintenance challenges to a range of municipal assets and land use
adfa, p. 1, 2011. © Springer-Verlag Berlin Heidelberg 2011
planning processes. Specifically, we want to have a clear perspective on the future be-haviour (shape, extent and duration) of flooding, and what changes how and when.
2. Is able to model a range of adaptation solutions and land use planning changes to test their effectiveness in mitigating flooding, in order to understand what future infrastruc-ture and land-use needs might be.
These then give councils a basis for understanding where and when critical infrastructure and land-use changes may need to be made, as well as the required investment plan for new adaptive infrastructure. The tool is currently being investigated by the Association of Bay-side Municipalities (ABM), Victoria for Port Phillip bay-wide deployment.
2 Key Components of the Tool
The mitigation modeling tool being developed consists of the following key components:
1. Hydrodynamic module - A 2D shallow water based model will be used to simu-late the flow hydrodynamics for the scenarios. The solver is able to concurrently simulate flood inundation due to sea level rise, storm surge, tides and rainfall al-lowing scenarios with multiple flood interactions possible. This is especially im-portant for coastal councils where there is a significant likelihood of combined coastal and catchment flooding.
2. Topography clean-up module (terrain/bathymetry) - The solver is integrated with a LiDAR pre-processing capability that allows input of raw/processed Li-DAR data at varying resolutions to be used as input into the hydrodynamic model. The model allows specification of variable drag maps resulting from regions with varying vegetation composition and other resistance (infrastructure) overlays.
3. Hydraulic module - Drainage is handled either as an infiltration sink or by using an explicit 1D network model connection into the 2D solver for complex urban drainage infrastructure.
4. Mitigation module- Mitigation solutions are integrated into the hydrodynam-ic/hydraulic model either as modules (eg: drainage augmentation, reten-tion/detention systems) or as structures that can be designed in AutoCAD or simi-lar and imported into the model.
5. Analysis and Visualisation module - An integrated visualisation tool allows the results of the hydrodynamic solver to be produced in a visual 3D Google Earth-like environment. The flood inundation can be visualised as depth/velocity/force maps to provide a before and after quantitative assessment of the assessed mitiga-tion scenario(s).
A detailed description of the computational models and the mitigation models is provided in the sections below.
3 Computational Models
The tidal and pluvial hydrodynamics were modelled using a shallow water model devel-oped by CSIRO. The method has been specially adapted for modelling widespread areas of urban inundation. The model is well suited to both heavy rainfall events and tidal inunda-tion. Recent applications include the impact of heavy rainfall events leading to the flash floods in Toowoomba in 2012 and the effects of possible SLR in the Kakadu region. The shallow water equations represent the depth averaged height and unit discharge of water above a fixed datum. The equations are discretised onto a fixed grid representing the land

surface and computationally processed to predict the water dynamics. The underlying method is based on the finite-volume methods presented by Kurganov and Petrova [2]. The method requires a combined topological and bathymetric height map above a given vertical datum as well as an initial distribution of water. In addition the method allows the input of a given boundary condition, which may represent a storm surge or tsunami, as well as a spa-tially distributed source map, which may represent a rainfall or other water source. The effect of base friction is imposed using a Manning drag model.
The underground drains were incorporated into the hydrodynamic model using a 1D pipe network model (see Fig. 1). The solution to the 1D pipe network is derived as a steady state output at every hydrodynamic model time step. This integrated solution provides an accu-rate estimate of the dynamic flooding across a large urban region. The models have been extensively tested and validated against benchmark test cases presented by Neelz and Pender [3].
Fig. 1. Flow in drainage network for the City of Port Phillip
3 hours after a 1 in a 10 year ARI rainfall.
4 Mitigation Models
A highlight of the software tool is the ability to incorporate different types of mitigation options as applications which then can be deployed to specific parts of the region of inter-est. The mitigation models can be classified into three broad categories:
• Drainage augmentation: These can be either a simple measure such as increasing the size of the drainage pipe, deploying back valves into existing drainage pipes or enhancing drainage capacity by incorporating pumps at specified locations in the urban drainage system.
• Retention/detention systems: Retention/detention systems are typically useful for low to medium level flooding where a water storage system is also utilized for managed release of water to provide for additional capacity during a predicted flood event (such as a flash flood). Retention/detention systems can either be at a household level (tanks), street level (underground large storage tanks) and/or large parks/open spaces used as dug-out stor-age/release facilities.
• Sea walls/off-shore reefs/protective barriers: These are large engineering or natural (such as mangroves) protective barriers that are specifically designed to protect a region in a council for its economic, heritage and/or environmental value typically against storm surge or similar events.

The software tool is able to incorporate all three forms of mitigation models. The drainage augmentation and retention/detention systems are built in the tool in such a way that they can be modularly incorporated into any mitigation analysis either by a point and click mechanism or by assigning the mitigation model(s) to a particular chosen location in the council. The protective barriers are incorporated typically via an AutoCAD or similarly designed input. This is because protective barriers are specifically designed for a region of interest and cannot be modularized.
5 Data Inputs
The data requirements for the tool are summarized below:
• Terrestrial and bathymetric LiDAR data • Land-use classification data to derive a variable drag map for the region of interest • Historical storm surge data • Tidal data • Sea level rise scenario(s) • Rainfall data • Drainage network information (ArcGIS compatible) • Mitigation solutions
─ Modular (retention/detention, back valves, pumps) ─ Designed (AutoCAD or similar for custom sea walls and protective barriers and off
shore reefs) • Historic flood data for validation • Previously performed flood study information for calibration
6 Modelling Process Flow Chart
The mitigation modeling process involves several components that have a specific purpose, these are described below, Fig. 2 provides a graphical flowchart summary describing the steps involved in the integrated mitigation modeling process:
1. Adoption of existing flood study data as input into an integrated flood mitigation model.
Purpose: Effective use of existing data and to reduce rework. Existing data will also be used for validation purposes.
2. Statistical extreme event analysis Purpose: To understand and estimate the occurrence likelihood of extreme
events such as storm surges and rainfalls for current day and for the future. This is important since there could be large variations in climatic conditions in a study re-gion of interest. Rigorous statistical analysis provides a better basis for estimating flood frequency and amplitude. Using this approach will provide an envelope that can then be used as input into a hydrodynamic/hydraulic model for scenario simu-lations.
3. Statistical joint probability analysis Purpose: To understand and estimate the occurrence likelihood of joint flood
events such as coastal and catchment flooding for current day and for the future. Very few of the previous flood studies investigated the joint likelihood of flood-

ing. Joint probability analysis is an emerging and robust approach for a holistic analysis of encompassing all possible avenues for flooding.
4. Integration of hydrodynamic modelling with a comprehensive drainage network (hydraulic) model
Purpose: To accurately predict flooding in an urban environment. A key out-come from the case study (described below) conducted for the City of Port Phillip study (2014) was that drainage networks contribute to flood inundation especially when there is a storm surge event and/or sea level rise due to the drainage pipes working as a reverse carrier of water from the sea further inland. This will be es-pecially important for low-lying inland locations.
5. Incorporation of outputs from the statistical modelling into the hydrodynam-ic/hydraulic model.
Purpose: For simulation scenario analysis that uses an occurrence likelihood approach including joint (coastal and catchment) flood events. This provides a ro-bust statistically based envelope for flood inundation predictions that is relevant for coastal councils.
6. Analysis of future flooding to investigate the effect of sea level rise. Purpose: This is important since any future infrastructure (overland or under-
ground) will need to be justified from a cost/benefit perspective. 7. Integration of suggested mitigation and adaptation strategies.
Purpose: This relates to quantitatively assessing the effect of suggested mitiga-tion and adaptation strategies for specific “hot spot” locations. This approach pro-vides a quantitative method of assessing the effectiveness of flood mitigation and adaptation strategies especially for future flooding.
8. Provide further guidance on flood mitigation following on from the integrated analysis in step 7 above.
Purpose: This is a feedback loop that allows the planners/engineers to test var-ious suggested strategies and potentially enhance their effectiveness.
The modelling components are linked and packaged (see Fig. 3) utilizing the CSIRO Work-space: A scientific workflow platform [4]. Workspace has the following advantages that are advantageous for the development of the mitigation modelling tool including:
1. Ability to modularly include different mitigation options 2. Ability to seamlessly connect computational models such as the 2D hydrodynamic
model with the 1D network model for drainage 3. In-built capability to manage distributed computing such that a set of simulation
scenarios can be assigned to different GPUs/CPUs and results drawn back into a unified analysis/visualization environment
4. In-built visualization facility
7 Case Studies
7.1 Simulation Scenarios
Table 1 summarises the simulation scenarios investigated for the integrated flood impact study. These scenarios were derived following on from a preliminary joint probability anal-ysis as described in section 6 above. A maximum storm surge height of 1.3 m was chosen on the basis of the gauge measurements at St Kilda marina by Melbourne Water [5]. It is acknowledged that the maximum storm surge height recorded in St Kilda marina is higher than the one recorded at Williamstown (1.15 m) in the work of McInnes et al. [6]. The higher value is used for the purposes of evaluating a severe but very likely future scenario.

The rainfall input condition was finalised following on from discussions with Melbourne Water for a typical storm event in CoPP. The same scenarios were repeated for evaluating the effect of mitigation described in section 4.
Table 1. Simulation scenarios
No Max. Stm ht. (m)
Rain (ARI)
Rain (hrs)
SLR (m)
Max ht (AHD)
1 1.30 100 3 0.0 1.30 2 1.30 100 3 0.4 1.70 3 1.30 100 3 0.8 2.10 4 1.30 100 3 1.1 2.40
7.2 Designed Mitigation - Off-Shore Reef
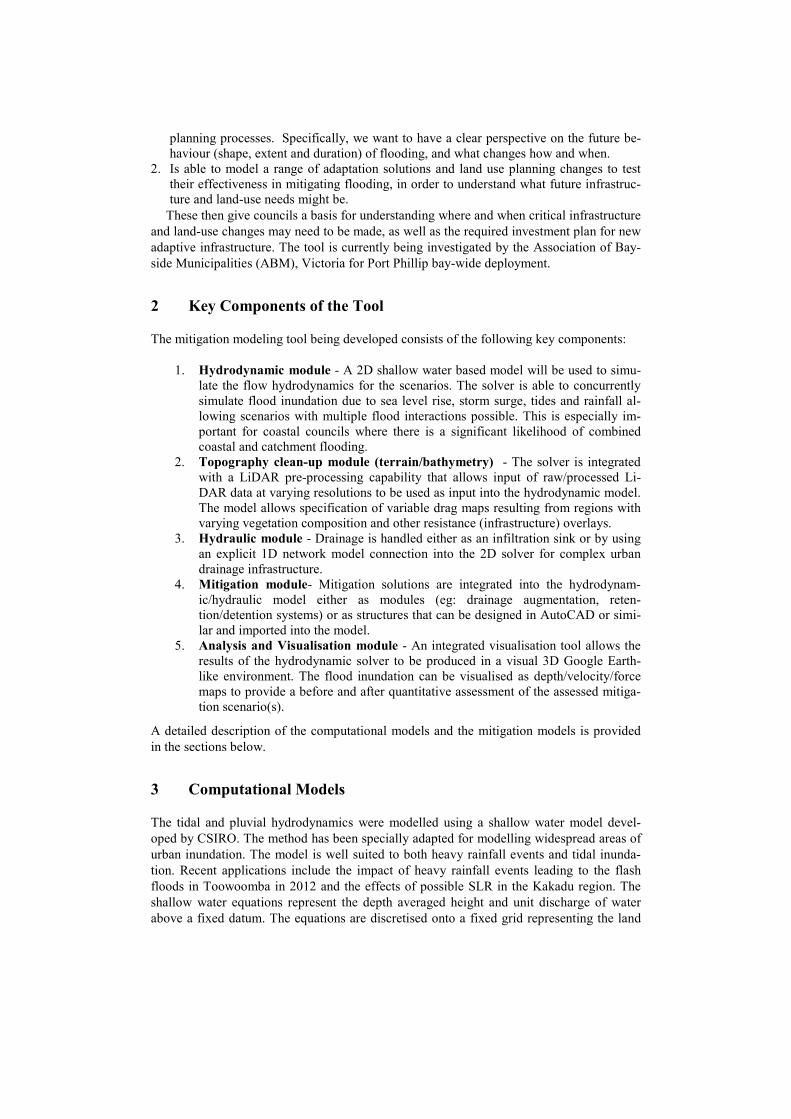
The first case study is used to demonstrate the application of the tool to evaluate the ef-fectiveness of a hypothetical off-shore reef designed to attenuate the effect of a storm surge wave impacting the Elwood region in the City of Port Phillip. The off-shore reef was intro-duced into the model by importing a design concept proposed by Prof. Rob Roggema (Ur-ban Design, Swinburne University, Melbourne). The off-shore reef is 3 m tall, 150-200 m in width and approximately 2 km offshore. Fig. 4 shows the case without the seawall (left) and with the seawall (right), where the initial water level is shown in blue to highlight the difference between the maps. Fig. 5 shows the change in maximum flood extent without and with the off-shore reef for a high storm surge for current day conditions. 7.3 Modular Mitigation – Back Calves and Retention/Detention
In the second example two mitigation models (as shown in Fig. 6) have been investigated namely: 1. Non return valves included along the stretch of Elwood canal and main drains at St
Kilda and end of Langridge Street and 2. Retention detention consisting of water tanks installed on all lots in the Elwood region,
along roads identified as being prone to flooding and a cricket oval in north-west of El-sternwick Park.

Fig. 2. Flowchart describing the steps involved in the integrated assessment of
flood mitigation and adaptation strategies
Fig. 3. Modelling components for the integrated mitigation modeling tool packaged using CSIRO Workspace: A scientific workflow platform
Output: Report for councils, ABM
Output: Prototype as a template for future use by councils
Mitigation options analysis current/future SLR scenarios
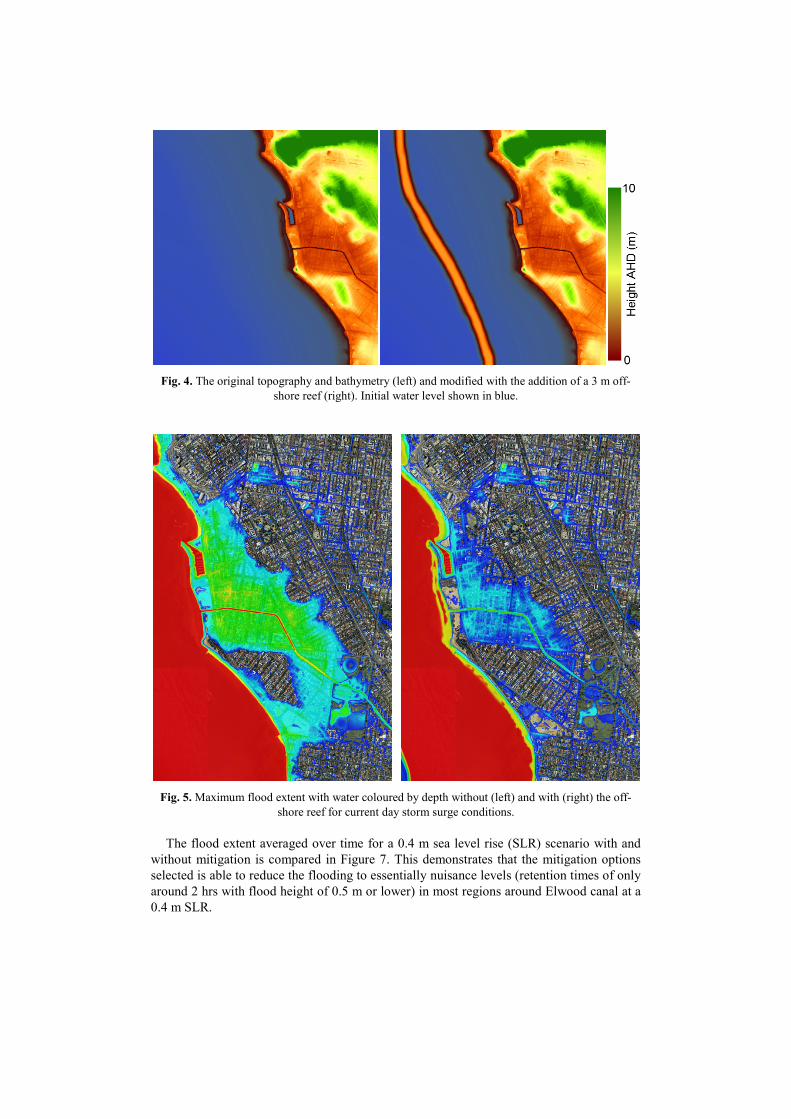
Fig. 4. The original topography and bathymetry (left) and modified with the addition of a 3 m off-
shore reef (right). Initial water level shown in blue.
Fig. 5. Maximum flood extent with water coloured by depth without (left) and with (right) the off-
shore reef for current day storm surge conditions.
The flood extent averaged over time for a 0.4 m sea level rise (SLR) scenario with and without mitigation is compared in Figure 7. This demonstrates that the mitigation options selected is able to reduce the flooding to essentially nuisance levels (retention times of only around 2 hrs with flood height of 0.5 m or lower) in most regions around Elwood canal at a 0.4 m SLR.

Fig. 6. Modular mitigation types and location around Elwood Canal
Fig. 7. Flood extent at 0.4 m SLR (a) no mitigation (b) with mitigation. Water is coloured by reten-
tion time with blue indicating 2 hrs and red 24 hrs.
8 Advantages and Limitations
a. Data inputs and methodology will necessarily change over time due to the nature of input data including LiDAR and climatic inputs. This model enables the capacity to feed in more updated datasets and methodology as they become available – this in turn provides a smarter and more cost-effective way to develop integrated flood simulations and test solutions. At present, no tool/model does this easily.
b. Usefulness of an integrated future flood modelling tool to land use and infrastructure managers – the capacity to gain a clear perspective about future integrated (coastal and catchment) flood behaviour provides enormous potential to understand the actual extent and risks associated with inundation over time. Current practice continues to model coastal and catchment flooding separately and creates a disjoint in providing this necessary perspective.
c. The capacity to simulate a range of coastal and drainage adaptation solutions into an integrated future flood model enables a range of testing and analysis of adaptation and drainage augmentation to measure what combination of solutions works, for what types of flooding, and for how long. This type of assessment capacity also provides a sound evidence base for consequent infrastructure design and an evidence-based cost benefit analyses of local and regional solutions.
d. Such a model also enables the capacity to assess and determine areas that will not be able to provide effective adaptation solutions – this then enables an evidence-base for the consideration of different land uses or drastic changes to current land use.
(a) (b)
e. The tool currently does not have the capacity to process point cloud LiDAR data and requires a “clean and processed” LiDAR input. CSIRO is aware of this limitation and work is underway to address this issue.
d. Visualisation of the results currently requires the LiDAR obtained terrain/bathymetry to match up with textural information. This is always not straightforward due to the inherent inconsistency associated with frames of reference for these layers. This issue is being investigated so that a Workspace based frame reference fixing algorithm can be provided to clients.
9 Conclusions
The flood modelling tool is an integrated system for stakeholders to investigate potential mitigation options in response to flood scenarios. The tool provides end-to-end modelling, analysis and visualization capability, as demonstrated by the City of Port Phillip case study. The model has also been developed to test the effectiveness of customised adaptation solu-tions. The next phase of development will be to customize the tool for use by land-use and infrastructure managers, especially in Local Government through a Port Phillip bay-wide approach.
Acknowledgements
The authors would like to acknowledge financial support provided by the City of Port Phil-lip and the CSIRO Digital Productivity and Services Flagship for conducting research to-wards developing the integrated flood mitigation analysis tool. The authors would also like to acknowledge the in-kind expertise and review provided by a range of key stakeholders including Melbourne Water, the Association of Bayside Municipalities, AECOM, and SGS Consulting to consider data and methodological inputs and likely adaptation solutions to be tested. Finally the authors would like to thank Fletcher Woolard from CSIRO for assistance in producing the visualisations related to this project.
References
1. AECOM, City of Port Phillip – Case Study for the Elwood Canal, Port Phillip Bay Coastal Ad-aptation Pathways Project, 19th September (2012).
2. Kurganov, A. Petrova, G., A Second-Order Well-Balanced Positivity Preserving Central-Upwind Scheme for the Saint-Venant System, Commn. Math. Sci., 5, 133-160 (2007).
3. Neelz S. and Pender G., Benchmarking the latest generation of 2D hydraulic modeling packages, Report SC12000, Environmental Agency UK.
4. Workspace: A scientific workflow platform, http://dx.doi.org/10.4225/08/544E4FF7B67B0, ac-cessed, 6th Nov 2014.
5. Hoang T., Frequency analysis of tide levels for St Kilda marina (Site No: 229670), Melbourne Water, 2011.
6. McInnes, K. L., O’Grady, J. And Macadam, I., The effect of climate change on extreme sea lev-els in Port Phillip Bay, Dept. Of Sustainability and Environment, VIC report, 2009.