integrating larval connectivity with local demography ... · integrating larval connectivity with...
TRANSCRIPT
Integrating larval connectivity with local demography reveals regionaldynamics of a marine metapopulation
DARREN W. JOHNSON,1,2,7 MARK R. CHRISTIE,1,3 TIMOTHY J. PUSACK,1,4 CHRISTOPHER D. STALLINGS,1,5 AND MARK A. HIXON1,6
1Department of Integrative Biology, Oregon State University, Corvallis, Oregon 97331-2914 USA2Department of Biological Sciences, California State University, Long Beach, California 90840 USA
3Department of Biological Sciences & Department of Forestry and Natural Resources Purdue University, West Lafayette, Indiana 47907 USA4Williams-Mystic Maritime Studies Program Williams College, Mystic, Connecticut 06355 USA5College of Marine Science University of South Florida, St. Petersburg, Florida 33701-5016 USA
6Department of Biology, University of Hawai’i, Honolulu, HI 96822-2216 USA
Abstract. Many ocean species exist within what are called marine metapopulations: networks ofotherwise isolated local populations connected by the exchange of larval offspring. In order to managethese species as effectively as possible (e.g., by designing and implementing effective networks of mar-ine protected areas), we must know how many offspring are produced within each local population(i.e., local demography), and where those offspring disperse (i.e., larval connectivity). Although thereis much interest in estimating connectivity in the relatively simple sense of identifying the locations ofspawning parents and their settling offspring, true measures of demographic connectivity that accountfor among-site variation in offspring production have been lacking. We combined detailed studies oflocal reproductive output and larval dispersal of a coral reef fish to quantify demographic connectivitywithin a regional metapopulation that included four widely spaced islands in the Bahamas. We presenta new method for estimating demographic connectivity when the levels of dispersal among popula-tions are inferred by the collection of genetically “tagged” offspring. We estimated that 13.3% ofrecruits returned to natal islands, on average (95% CI = 1.1–50.3%), that local retention was high onone of the islands (41%, 95% CI = 6.0–97.0%), and that larval connectivity was appreciable, evenbetween islands 129 km apart (mean = 1.6%, 95% CI = 0.20–8.8%). Our results emphasize the impor-tance of properly integrating measurements of production with measurements of connectivity. Had wenot accounted for among-site variation in offspring production, our estimates of connectivity wouldhave been inaccurate by a factor as much as 6.5. At a generational timescale, lifetime offspring produc-tion varied substantially (a fivefold difference among islands) and the importance of each island tolong-term metapopulation growth was dictated by both larval production and connectivity. At thescale of our study (local populations inhabiting 5-ha reefs), the regional metapopulation could notgrow without external input. However, an exploratory analysis simulating a network of four marineprotected areas suggested that reserves of >65 ha each would ensure persistence of this network. Thus,integrating studies of larval connectivity and local demography hold promise for both managing andconserving marine metapopulations effectively.
Key words: conditional connectivity; dispersal; growth; larvae; marine reserves; parentage analysis; reproduction;self-recruitment; survival.
INTRODUCTION
Many marine species have a complex life cycle in which alarval stage capable of long-distance dispersal is followed byan adult stage that is much more sedentary. One conse-quence of such a life cycle is that multiple populations thatare otherwise demographically isolated can be connected bythe periodic exchange of larvae, thus creating networks oflocal populations that form a “marine metapopulation”(Kritzer and Sale 2006). Understanding the long-termdynamics and persistence of marine metapopulationsrequires that we understand the degree to which individualstend to replace themselves: by the retention of dispersive off-spring to their natal population and the survival of thoseoffspring to maturity and/or by the dispersal of offspring toother populations within the network and the subsequent
production of descendants (e.g., grand offspring) that returnto the focal population (Armsworth 2002, Hastings andBotsford 2006, Burgess et al. 2014). Two key aspects of thisprocess are demographic connectivity (the proportion of off-spring produced at one local population that recruit toanother) and lifetime offspring production (the number ofoffspring expected to be produced by a typical recruit). Ithas been difficult to obtain empirical data on both of theseparameters, though scientists have made progress towardunderstanding metapopulation dynamics by simulatingeither production or connectivity (e.g., Figueira 2009,Watson et al. 2011a). Empirical studies that measure bothproduction and connectivity simultaneously would be par-ticularly valuable for guiding management and conservationstrategies, as such studies would provide managers withinformation required to design marine reserves that specifi-cally enhance population persistence of focal species, anessential objective in many management and conservationplans (Palumbi 2003, Botsford and Hastings 2006, Kaplanet al. 2006, Burgess et al. 2014).
Manuscript received 9 February 2018; accepted 29 March 2018.Corresponding Editor: Cheryl J. Briggs.
7 E-mail: [email protected]
1419
Ecology, 99(6), 2018, pp. 1419–1429© 2018 by the Ecological Society of America
The long-term growth of any population depends onwhether a typical individual produces enough surviving off-spring to replace itself over its lifetime. However, in a net-work of populations characterizing a metapopulation,replacement can occur both by the retention of offspring tothe local population and by the return of descendants thatwere produced at other populations (e.g., grand offspring,great-grand offspring, etc.; Hastings and Botsford 2006).Regional growth within such a network of local populationscan be evaluated by multiplying the demographic connectiv-ity matrix (i.e., the proportion of offspring produced at agiven population that survive and recruit to each populationwithin the network) by lifetime offspring production (whichincludes post-settlement survivorship and reproduction oncemature, i.e., local demography). The resultant matrix (calledthe realized connectivity matrix; Burgess et al. 2014)describes the average exchange of individuals among thelocal populations within a generation. If the largest realeigenvalue of the realized connectivity matrix is >1, then thenetwork of populations will grow in the long term, and likelypersist (Hastings and Botsford 2006).There are several important applications of these theoreti-
cal concepts to empirical settings. The first is to ask whethera particular network of populations is likely to grow on itsown or whether immigration from outside the network isrequired to sustain the regional metapopulation (e.g., Salleset al. 2015). A second application is to examine the degreeto which metapopulation growth depends on contributionsfrom each local population within the network. Finally, onecan ask how large the local populations within a particularmetapopulation would have to be in order for the networkto maintain positive growth on its own. Such an analysiswould provide a broad-stroke assessment of metapopulationdynamics, yet one that has direct relevance for designingeffective networks of marine protected areas (MPAs; e.g.,Botsford et al. 2009, Moffitt et al. 2011). MPA design hastypically focused on protecting a combination of desiredhabitats and species, and although persistence is a goal ofMPA design, few MPA networks explicitly consider condi-tions for long-term demographic persistence (Williams et al.2005, Botsford and Hastings 2006).The dynamics of a marine metapopulation will depend on
larval dispersal, a process that is notoriously difficult tomeasure. Larvae are minuscule and have the capability todisperse long distances in a vast ocean. Fortunately, the lar-vae of marine species may be tracked to various degrees byartificial or natural tags. For example, natural or deliberateexposure of developing offspring to chemicals may leave apermanent signal in their bodies, allowing recruits to beidentified to source populations (e.g., Jones et al. 1999,Swearer et al. 1999, Almany et al. 2007, Becker et al. 2007,Cuif et al. 2015). Similarly, one can use multi-locus geno-types to find parent–offspring pairs within samples of adultsand new recruits (e.g., Jones et al. 2005, Planes et al. 2009,Saenz-Agudelo et al. 2009, Christie et al. 2010, Berumenet al. 2012, Harrison et al. 2012, Pusack et al. 2014,D’Aloia et al. 2015). Such methods are valuable becausethey yield definitive information about the beginning andendpoints of larval dispersal. However, because samplingparents and offspring from the field is a labor-intensive pro-cess, and because marine metapopulations can be large in
size, a potential drawback of these techniques is that infor-mation on larval connectivity may be sparse (Christie et al.2017). Unless populations are very small, it is possible to tagonly a small proportion of the population, and the numberof recruits whose source population is found will naturallybe quite low. Because of this fact, there is a need for analyti-cal techniques that accommodate sparse, but nonethelessdefinitive information on larval connectivity.We present a new method for estimating demographic con-
nectivity when the levels of dispersal among populations areinferred by the collection of “tagged” offspring. Demographicconnectivity, expressed as the proportion of offspring pro-duced at population j that survived and recruited to popula-tion i (Jacobi and Jonsson 2011, Burgess et al. 2014, Lettet al. 2015), can be calculated by combining estimates of localoffspring production with information gathered by the collec-tion of recruits whose source population is known. Ourapproach accounts for variation in sampling effort and spa-tial scale, and is appropriate even when the number of taggedoffspring observed within a sample is low, as it often is in nat-ural populations (e.g., D’Aloia et al. 2013, Pusack et al.2014, Nanninga et al. 2015). Importantly, if offspring pro-duction is known, then inferences about demographic con-nectivity can be made from both positive results (cases wheretagged offspring are found) and negative results (cases wheretagged offspring are not found). Statistical power is derivedfrom the total number of individuals sampled and tagged,not just the number of cases where the source population ofrecruits is known. These features allow investigators whotrack larvae (by chemical and/or genetic tagging) to generaterobust estimates of demographic connectivity, and to quan-tify uncertainty in those connectivity estimates. Such infor-mation will help to bridge the gap between empiricalestimates of dispersal and analyses of metapopulationdynamics (Botsford et al. 2009, Burgess et al. 2014).We measured local demography and larval connectivity of
a common coral-reef fish, the bicolor damselfish (Stegastespartitus). By measuring reproductive output and larval dis-persal at the same time, we estimated average demographicconnectivity within a network of populations inhabiting thereefs at four islands within a semi-enclosed ocean basin.Specifically, we measured the proportion of eggs producedat each island population that recruited to other island pop-ulations. This information is essential for understanding thedynamics of metapopulations, but values of demographicconnectivity may be difficult to interpret on their own. Suc-cessful recruitment depends on survival, and because sur-vivorship throughout the early life stages may beexceedingly low for marine species, values of demographicconnectivity may also be low. In such cases it will not beobvious whether demographic connectivity is low because oflow survival or because few of the survivors went from pointA to point B. To decouple the effects of survival and disper-sal, we also estimated the proportion of surviving recruitsproduced at one population that were found at other popu-lations, a property we call conditional connectivity because itis conditional on early life survival. This measure factorsout mortality during early life stages and provides a comple-mentary assessment of local retention and exchange amongpopulations. We estimated lifetime offspring production andevaluated the potential for a metapopulation of four island
1420 DARRENW. JOHNSON ET AL. Ecology, Vol. 99, No. 6
populations, each inhabiting 5 ha of reef, to persist on itsown. Finally, we conducted an exploratory analysis to evalu-ate how large four marine protected areas in this networkwould need to be in order to ensure protection of a specieswhose combined patterns of lifetime reproduction anddemographic connectivity (regardless of life history charac-teristics) are similar to our study species.
METHODS
Study system and genetic sampling
We measured reproduction and larval connectivity ofbicolor damselfish at four widely separated islands lining theperimeter of Exuma Sound, Bahamas, a semi-enclosed,deep-water (~2,000 m) basin: the Exuma Cays Land andSea Park, the island of Eleuthera, Cat Island, and LeeStocking Island. Our study reefs at each island ranged indepth from 4 to 12 m (see Hixon et al. 2012 and Pusacket al. 2014 for detailed descriptions). Bicolor damselfishhave dispersive larvae, yet juveniles and adults inhabit smallhome ranges (~2 m in diameter) and exhibit strong site fide-lity (Myrberg 1972, Knapp and Warner 1991, Johnson 2008,Hixon et al. 2012). They live in loosely structured socialgroups centered on specific coral heads, and consume bothpassing plankton and benthos. Males defend clutches ofdemersal eggs until the larvae hatch and disperse.To detect larval connectivity among islands, we took tis-
sue samples from adults and newly settled recruits at eachisland population. Fish were collected for genetic analysis atthree reefs per island, and samples were taken during 10 sep-arate summer monthly reproductive periods (July 2005 andJune–August during 2006–2008). Individuals were geno-typed at 10 highly polymorphic microsatellite loci and par-ent–offspring pairs were recorded (nadults = 1,348, ~337 perisland, nrecruits = 1,930, ~482 per island; see Pusack et al.2014 for full details). Parentage was analyzed by a Bayesianexclusion method (Christie 2010), which does not requireknowledge of the proportion of candidate parents sampled,and provides strict control over type I error rates (Christie2013, Christie et al. 2013, Anderson and Ng 2014). Thisprocedure allowed us to track the start points and endpointsof dispersal and to quantify uncertainty associated withthese findings by resampling putative parent–offspring pairsby their probability of type I and type II errors(Appendix S1). Basic results of the parentage analyses havebeen published previously (Pusack et al. 2014), but the dataon demography (which were collected during the same timeperiod as the tissue samples used for genetic analyses) arepresented here for the first time. In this study, we concen-trate on the estimation of offspring production at eachisland, and we demonstrate how information on offspringproduction and larval dispersal can be combined to estimatedemographic connectivity between local populations.
Post-settlement survival, growth, and reproduction
From 2006 to 2008, we measured post-settlement demog-raphy at each island. Measuring demography in the fieldwas a very labor-intensive process, and demography wasmeasured at two of the three study reefs per island. We
assume that average rates of demography that were esti-mated from the two reefs per island were representative ofthe island population as a whole. Among-reef variation indemography was subsumed within our analyses andreflected in the uncertainties associated with demographicparameters estimated for each island. Study reefs averaged~1.6 ha in area, and within each reef we established 11–22permanent plots. Plots were approximately 2 9 2 m andcentered on large coral heads that were inhabited by groupsof bicolor damselfish. Within each plot, all fish were individ-ually tagged and subsequently measured throughout thestudy (overall sample size = 1,894 fish). Fish were taggedwith subcutaneous injections of elastomer, and tags werecolor and location coded to identify individuals. Additionaldetails regarding techniques of tagging and monitoring aredescribed by Johnson and Hixon (2011) and Hixon et al.(2012). Individual growth in each local population was esti-mated by fitting growth curves to data on changes in bodysize, and size-dependent survival was estimated using logisticregression (see Appendix S2 for details).We measured reproductive output by measuring the area
of egg masses within artificial nests (Hixon et al. 2012). Wecalculated per capita reproduction at each reef on each sam-pling day by summing the area of eggs produced and divid-ing by the number of adults (fish >6 cm total length [TL];Schmale 1981). Reproductive activity of bicolor damselfishfollows a lunar cycle (Robertson et al. 1988, Johnson andHixon 2011, Hixon et al. 2012). To account for this pattern,we described per capita reproduction as a periodic functionof lunar day
ft ¼ exp b þ A cos2p29:5
� �ðt� tMAXÞ
� �� �(1)
where b describes average offspring production, A is theamplitude of the increase/decrease of reproduction with lunarday, and tMAX is the lunar day when reproduction is maxi-mal. We used a mixed-effects modeling framework to select avariant of Eq. 1 to describe how reproduction varied amongthe local populations (i.e., islands). For the full model, weallowed all three parameters to vary among islands. We usedAIC values to evaluate whether simpler models (e.g., withsome parameters held constant across islands) would provideadequate summaries of the data (Burnham and Anderson2002, see Appendix S2). Clutches of eggs were laid in contigu-ous monolayers, so the area of each clutch was proportionalto the number of eggs therein. Thus, egg number was esti-mated by multiplying egg mass area (cm2) by 215 eggs/cm2,the average density of eggs observed during our study.We estimated lifetime egg production by combining the
age schedule of survivorship (derived from estimates ofgrowth and size-dependent survival at each island) with theage schedule of reproduction (defined as 0 before maturity;ft afterward, and included a seasonal component; seeAppendix S2). These quantities were multiplied, and lifetimeegg production was calculated by integrating this productfrom age 0 to infinity.
Estimating demographic connectivity
If one considers genotyped individuals to be “tagged,”then demographic connectivity between populations (ci,j)
June 2018 INTEGRATING DEMOGRAPHYAND CONNECTIVITY 1421
can be estimated by dividing the number of tagged recruitsthat were spawned at population j and recruited to popula-tion i (i.e., Ri.j) by the total number of tagged offspringproduced at population j (i.e., bOj):
ci;j ¼ Ri;jbOj
(2)
Which stages are considered to be offspring will dependon the goals of the analyses and the information available,but connectivity is usefully expressed as the number oftagged recruits per egg produced (Burgess et al. 2014). Inthis form, connectivity measurements implicitly include sur-vival during the egg, larval, and early juvenile stages. In thisstudy, we calculated tagged offspring produced at an islandpopulation as bOj ¼ NA �
Z t2
t1ftdt (3)
where NA is number of genotyped adults in a sample, thefunction ft describes per capita egg production (as it varieswith lunar day; see Eq. 1), and t1 and t2 are days of the lunarcycle marking the start and end points of a reproductiveperiod.For each of 10 reproductive periods examined in this
study, we knew how many of the newly settled recruits sam-pled at island i were spawned by parents sampled at island j.In our analysis, we calculated the average values of demo-graphic connectivity (ci,j) that were most likely to have pro-duced the observed number of parent–offspring pairs foreach pair of islands and for all 10 dispersal events. In thisanalysis, we pooled data for all 10 events and thus estimatedaverage values of connectivity. The method is capable of esti-mating connectivity on an event-by-event basis, but addi-tional analyses suggested that a simpler model in whichconnectivity was the same over time was preferred to a morecomplicated model in which connectivity values variedamong events (Appendix S1). Connectivity was estimated atour pre-defined spatial scale (5 ha), but because the area ofhabitat we searched during recruit collections was muchsmaller than the total area available, we treated our observednumber of parent–offspring pairs as realization of a randomvariable. We assumed that the number of genetically taggedrecruits observed at each island–time combination followeda Poisson distribution, with the expected value (E[NPO]) setby connectivity between islands (which was unknown), off-spring production (bOj , which was known), area searched(ASearched, which was known), and total area (ATotal, set to5 ha)
E½NPO� ¼ ASearchedbOjci;j
ATotal: (4)
This approach was appropriate because we were able tosearch only a small fraction of the total habitat availableand the chances of observing parent–offspring pairs werenaturally low. Note that the expected number of tagged off-spring observed in a sample is normalized by area searched,not by the total number of recruits collected in that sample.Our calculations of connectivity are not sensitive to the
number of recruits that came from other locations (see Bodeet al. [2017] for an illuminating discussion of such dilutioneffects).Our approach was to estimate likelihood profiles for
demographic connectivity estimates by calculating the prob-ability of obtaining the observed number of geneticallytagged recruits per island pair, given different levels of con-nectivity (see Appendix S1 for additional details). In thisway, we could describe plausible values of connectivity, evenwhen the number of parent–offspring pairs were few. Thismethod derives statistical power from the total number ofadults genotyped and is informative when “tagged” off-spring are either found or not found. For example, even ifno parent–offspring connections were found between twolocal populations, if offspring production was high and wesearched a large proportion of the habitat, then we could befairly certain that connectivity was low. On the other hand,if offspring production was low and/or if little of the avail-able habitat was searched, then we would be less certain thatconnectivity values were near zero. This information wasassessed for each cohort and island pair and was reflected inour estimated confidence intervals for the connectivity val-ues. We note that there will be an appreciable amount ofuncertainty in estimates of demographic connectivity. Inmost natural systems, it is not practical to collect offspringfrom a large proportion of the available habitat, and aproper account of demographic connectivity will requirethat uncertainty in components such as reproduction areincorporated into the final estimate. Our estimates of con-nectivity are therefore interpreted in a probabilistic context,and with a focus on regions of high confidence surroundingthe point estimates. When the goal of the analysis was esti-mation, we concentrated on both the point estimates andtheir confidence intervals. When estimates of demographicconnectivity were used to infer higher-order properties suchas realized connectivity and metapopulation growth (seebelow), uncertainty in the estimates of connectivity wasexplicitly incorporated into these calculations.In addition to measuring demographic connectivity as the
number of eggs produced at population i that ultimatelyrecruited to population j, we also estimated average connec-tivity by using the expected number of recruits as our mea-sure of offspring production. We refer to this measure asconditional connectivity because it is conditional on earlylife survival. It estimates the probability that an offspringfrom population i dispersed to population j, given that itsurvived to the age at which collection occurred. In otherwords, it may be used to summarize what proportion of thetotal number of juveniles produced from population irecruited to population j. Conditional connectivity was cal-culated as the number of tagged recruits divided by the totalnumber of recruits that were spawned at a particular popula-tion and survived to the age at collection (~13 d post-settle-ment). This latter quantity was calculated by multiplying Oi
by estimated values of survival during the egg stage (0.60;Johnson et al. 2010), larval stage (1.02 9 10�3; Johnsonet al. 2015), settlement (0.307; Almany and Webster 2006)and the early post-settlement stage (mean = 0.77; thisstudy). Rates of survival may of course vary, but because wewere interested in calculating average connectivity valuesbetween islands and over a period of several years, it was
1422 DARRENW. JOHNSON ET AL. Ecology, Vol. 99, No. 6
reasonable to use average survival values in these calcula-tions. When estimating conditional connectivity, we incor-porated the uncertainty in our estimates of both productionand survival (Appendix S1).Both connectivity and conditional connectivity are mea-
sures that depend on the spatial scale of interest. Total areaof interest (ATotal) is arbitrary but may be set by considera-tions such as sampling area or management goals (e.g., areasdesignated for marine reserve protection). In this study, webegin by considering a spatial scale of 5 ha. This is theapproximate average of the cumulative area of reef that wesurveyed at each of the four island populations we studied,and is a scale that is comparable to a variety of other studiesof reef fishes (reviews by Sale 1998, MacNeil and Connolly2015).
Evaluating growth of the regional metapopulation
The potential for growth of the metapopulation can beevaluated by calculating the dominant eigenvalue of therealized connectivity matrix, which is the product of lifetimeoffspring production and the demographic connectivitymatrix (Armsworth 2002, Hastings and Botsford 2006). Ifthe value is >1, then the metapopulation will grow; and ifthe value is <1, then the metapopulation will decline in thelong term. This is a density-independent description ofmetapopulation growth, but one that will be adequate undermany conditions (Armsworth 2002, also see Appendix S3).Here, we use the approach to describe the growth capacityof the metapopulation, based on average connectivity valuesand evaluated at the observed, average densities. To estimatepotential growth of the regional metapopulation of bicolordamselfish, we generated the realized connectivity matrix bymultiplying each column of the demographic connectivitymatrix by lifetime egg production for each island popula-tion. To describe uncertainty in these estimates, 1,000 valuesof demographic connectivity and lifetime egg productionwere derived from resampled estimates of the parametersdescribing demography and parentage. In this way, we usedthe interval estimates of connectivity, which was moreappropriate than the point estimates (i.e., in cases where noparent–offspring pairs were observed in our sample, wecould be confident that average connectivity was low, but itwas unlikely to be a true value of zero). The mean values ofthe realized connectivity matrices were used to evaluate thepotential for a regional metapopulation of four island popu-lations, each measuring 5 ha, to grow with no external input.We assume that patterns of demographic connectivity arestable, and while we acknowledge complexities such asstochastic variation in connectivity (e.g., Guizien et al.2014) and density dependence may affect the accuracy oflong-term projections, we believe that the eigenvalue of therealized connectivity matrix can provide a useful estimate ofa metapopulation’s potential for growth. To evaluate the rel-ative contribution of the local population inhabiting eachisland to the dynamics of the four-island metapopulation,we calculated the sensitivity of metapopulation growth tochanges in the elements of the realized connectivity matrixby calculating the partial derivative of the eigenvalue withrespect to the small changes in the elements of the realizedconnectivity matrix (Appendix S3). We also calculated
sensitivities of metapopulation growth rate to lifetime eggproduction at each of the four study islands (Appendix S3).Finally, we conducted an exploratory analysis where we
adjusted ATotal and calculated k in order to answer thequestion of how large in area four island populationswould have to be in order for the metapopulation tomaintain positive growth on its own without externalinput. This analysis assumes that patterns of demographyand larval connectivity among the areas sampled are simi-lar to those within the larger area to which inferences aremade. As long as the extent of spatial scaling is not solarge as to include major changes in habitat or ocean cur-rents, such analyses can provide a useful assessment ofmetapopulation dynamics. In addition, this analysis can beused to evaluate how large four marine protected areas inthis network would need to be in order to ensure protec-tion of a species whose combined patterns of lifetimereproduction and demographic connectivity (and not nec-essarily life history characteristics) are similar to our studyspecies. Although our data are for a non-fished species,there are multiple reasons to believe that patterns of real-ized connectivity may be similar for a variety of specieswithin our study region. First is that patterns of larvalexchange may be strongly influenced by ocean currents,and currents that connect two locations may facilitatetransport of larvae of multiple species (e.g., Kool et al.2010, Watson et al. 2011b, Treml et al. 2012). Second isthat our measure of metapopulation growth, the eigen-value of the realized connectivity matrix, is a measure ofthe potential for an individual to replace itself within themetapopulation. For a population to grow, a typical indi-vidual must at least replace themselves within their life-times, and basic life history theory suggests that speciesmay achieve replacement via different strategies (e.g., byproducing many offspring with relatively low survivalrates, or by producing fewer offspring with higher survivalrates; Stearns 1992, Roff 2002). Because species’ capacitiesfor demographic replacement may be similar, variation inrealized connectivity may be more sensitive to larval dis-persal. If multiple species release their larvae into the sameocean currents, then these species may have similar pat-terns of realized connectivity between locations.
RESULTS
Post-settlement survival, growth, and reproduction
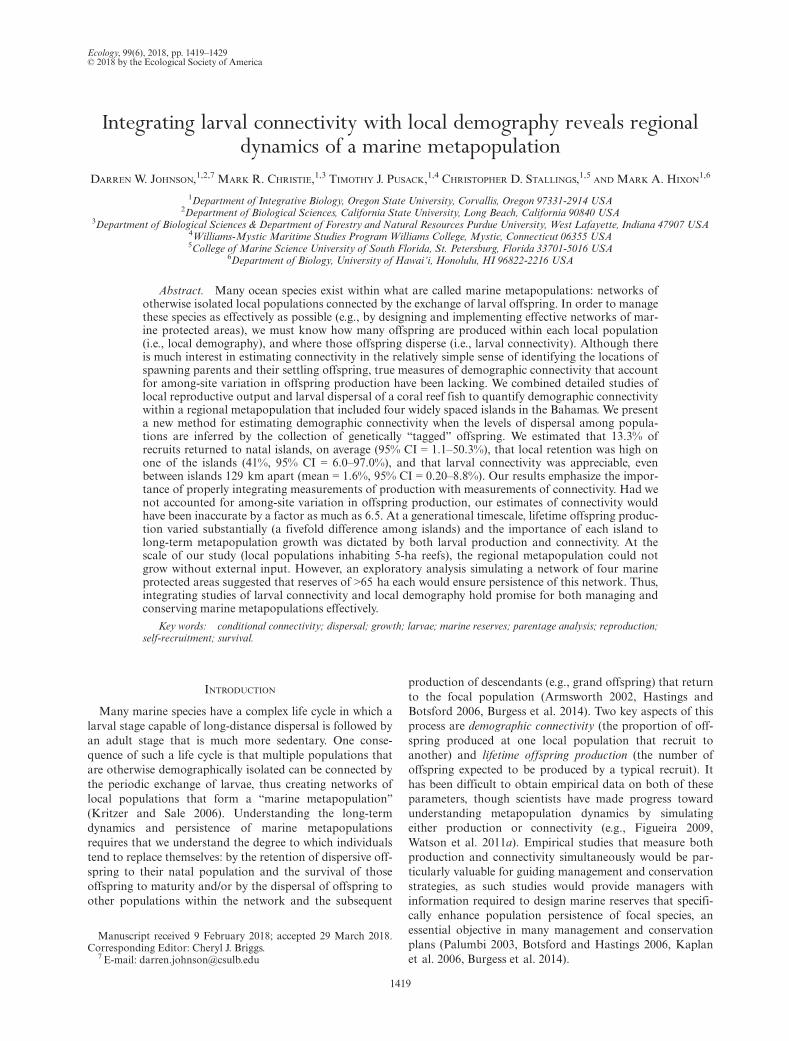
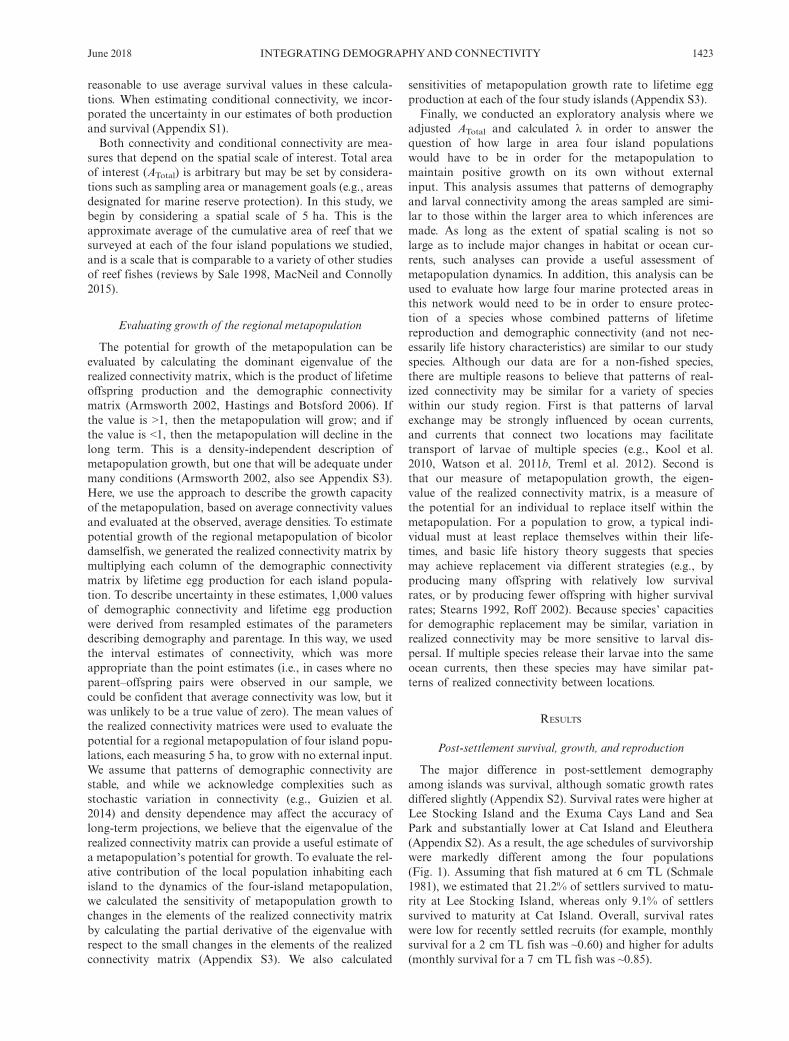
The major difference in post-settlement demographyamong islands was survival, although somatic growth ratesdiffered slightly (Appendix S2). Survival rates were higher atLee Stocking Island and the Exuma Cays Land and SeaPark and substantially lower at Cat Island and Eleuthera(Appendix S2). As a result, the age schedules of survivorshipwere markedly different among the four populations(Fig. 1). Assuming that fish matured at 6 cm TL (Schmale1981), we estimated that 21.2% of settlers survived to matu-rity at Lee Stocking Island, whereas only 9.1% of settlerssurvived to maturity at Cat Island. Overall, survival rateswere low for recently settled recruits (for example, monthlysurvival for a 2 cm TL fish was ~0.60) and higher for adults(monthly survival for a 7 cm TL fish was ~0.85).
June 2018 INTEGRATING DEMOGRAPHYAND CONNECTIVITY 1423
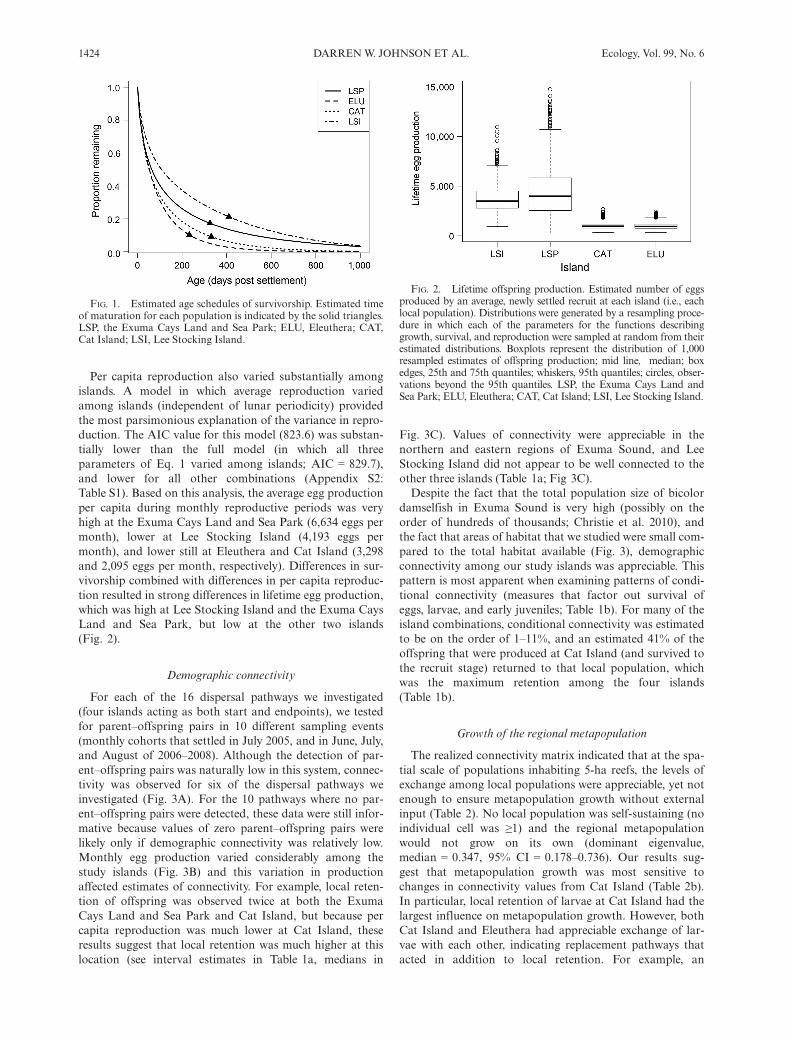
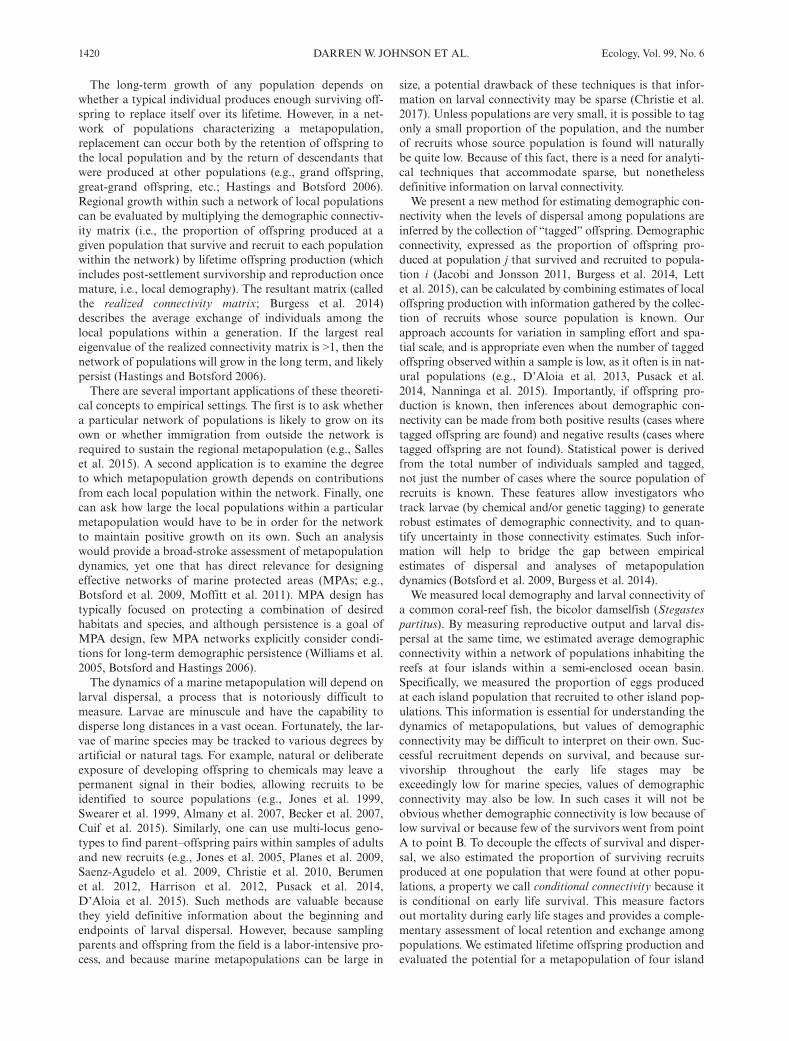
Per capita reproduction also varied substantially amongislands. A model in which average reproduction variedamong islands (independent of lunar periodicity) providedthe most parsimonious explanation of the variance in repro-duction. The AIC value for this model (823.6) was substan-tially lower than the full model (in which all threeparameters of Eq. 1 varied among islands; AIC = 829.7),and lower for all other combinations (Appendix S2:Table S1). Based on this analysis, the average egg productionper capita during monthly reproductive periods was veryhigh at the Exuma Cays Land and Sea Park (6,634 eggs permonth), lower at Lee Stocking Island (4,193 eggs permonth), and lower still at Eleuthera and Cat Island (3,298and 2,095 eggs per month, respectively). Differences in sur-vivorship combined with differences in per capita reproduc-tion resulted in strong differences in lifetime egg production,which was high at Lee Stocking Island and the Exuma CaysLand and Sea Park, but low at the other two islands(Fig. 2).
Demographic connectivity
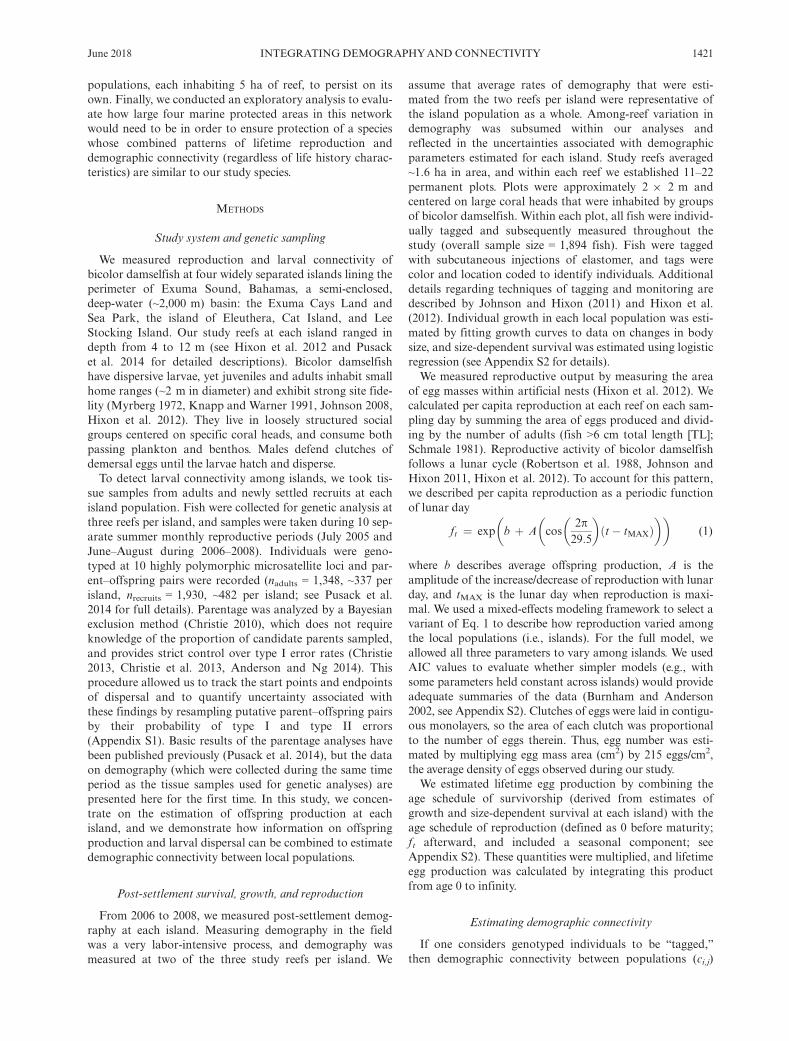
For each of the 16 dispersal pathways we investigated(four islands acting as both start and endpoints), we testedfor parent–offspring pairs in 10 different sampling events(monthly cohorts that settled in July 2005, and in June, July,and August of 2006–2008). Although the detection of par-ent–offspring pairs was naturally low in this system, connec-tivity was observed for six of the dispersal pathways weinvestigated (Fig. 3A). For the 10 pathways where no par-ent–offspring pairs were detected, these data were still infor-mative because values of zero parent–offspring pairs werelikely only if demographic connectivity was relatively low.Monthly egg production varied considerably among thestudy islands (Fig. 3B) and this variation in productionaffected estimates of connectivity. For example, local reten-tion of offspring was observed twice at both the ExumaCays Land and Sea Park and Cat Island, but because percapita reproduction was much lower at Cat Island, theseresults suggest that local retention was much higher at thislocation (see interval estimates in Table 1a, medians in
Fig. 3C). Values of connectivity were appreciable in thenorthern and eastern regions of Exuma Sound, and LeeStocking Island did not appear to be well connected to theother three islands (Table 1a; Fig 3C).Despite the fact that the total population size of bicolor
damselfish in Exuma Sound is very high (possibly on theorder of hundreds of thousands; Christie et al. 2010), andthe fact that areas of habitat that we studied were small com-pared to the total habitat available (Fig. 3), demographicconnectivity among our study islands was appreciable. Thispattern is most apparent when examining patterns of condi-tional connectivity (measures that factor out survival ofeggs, larvae, and early juveniles; Table 1b). For many of theisland combinations, conditional connectivity was estimatedto be on the order of 1–11%, and an estimated 41% of theoffspring that were produced at Cat Island (and survived tothe recruit stage) returned to that local population, whichwas the maximum retention among the four islands(Table 1b).
Growth of the regional metapopulation
The realized connectivity matrix indicated that at the spa-tial scale of populations inhabiting 5-ha reefs, the levels ofexchange among local populations were appreciable, yet notenough to ensure metapopulation growth without externalinput (Table 2). No local population was self-sustaining (noindividual cell was ≥1) and the regional metapopulationwould not grow on its own (dominant eigenvalue,median = 0.347, 95% CI = 0.178–0.736). Our results sug-gest that metapopulation growth was most sensitive tochanges in connectivity values from Cat Island (Table 2b).In particular, local retention of larvae at Cat Island had thelargest influence on metapopulation growth. However, bothCat Island and Eleuthera had appreciable exchange of lar-vae with each other, indicating replacement pathways thatacted in addition to local retention. For example, an
FIG. 1. Estimated age schedules of survivorship. Estimated timeof maturation for each population is indicated by the solid triangles.LSP, the Exuma Cays Land and Sea Park; ELU, Eleuthera; CAT,Cat Island; LSI, Lee Stocking Island.
FIG. 2. Lifetime offspring production. Estimated number of eggsproduced by an average, newly settled recruit at each island (i.e., eachlocal population). Distributions were generated by a resampling proce-dure in which each of the parameters for the functions describinggrowth, survival, and reproduction were sampled at random from theirestimated distributions. Boxplots represent the distribution of 1,000resampled estimates of offspring production; mid line, median; boxedges, 25th and 75th quantiles; whiskers, 95th quantiles; circles, obser-vations beyond the 95th quantiles. LSP, the Exuma Cays Land andSea Park; ELU, Eleuthera; CAT, Cat Island; LSI, Lee Stocking Island.
1424 DARRENW. JOHNSON ET AL. Ecology, Vol. 99, No. 6
appreciable number of eggs produced at Cat Island recruitedto Eleuthera (and vice versa), suggesting that grand off-spring of fish at Cat Island may have recruited back to CatIsland and contributed to the replacement of their grandpar-ents. Metapopulation growth was somewhat sensitive tochanges in these rates of exchange (see the corresponding,off-diagonal cells in Table 2b).We also examined sensitivity of metapopulation growth
to changes in lifetime egg production at each of the fourislands. These calculations resulted in median sensitivity val-ues of 0.025, 0.015, 0.040, and 0.019, for the Exuma CaysLand and Sea Park, Eleuthera, Cat Island, and Lee Stock-ing Island, respectively. The absolute values are low becausethey represent the effects of a small change in lifetime eggproduction (mean value = 2,574 eggs), and these changesare also proportional to connectivity values, which reflectmortality during the egg, larval, and early juvenile stages,and are naturally low (Table 1a). The relative values indicatethat metapopulation dynamics are most sensitive to changesin lifetime egg production at Cat Island (and to a lesserextent, the Exuma Cays Land and Sea Park) than changesin lifetime egg production at Lee Stocking Island orEleuthera (Table 2c). Despite high lifetime egg productionfor the Lee Stocking Island, the observation of very lowconnectivity with other islands and little-to-no replacementsuggests that changes in production at this island wouldhave a relatively small effect on growth of the regionalmetapopulation.An exploratory analysis indicated that if local populations
inhabited reefs ≥65 ha in size, then we could be confidentthat the regional metapopulation would persist via networkeffects (dominant eigenvalue: median = 2.09, 95%CI = 1.03–4.94). Assuming a linear scaling between localpopulation area and connectivity, metapopulation growthrate would be expected to increase by ~0.03 units for every1 ha increase in area of reef inhabited by the four local pop-ulations. These results suggest that for species whose pat-terns of demographic connectivity are similar to those forbicolor damselfish (regardless of differences in life history),a network of four, 65-ha marine reserves in this region wouldmaintain positive growth without external input.
DISCUSSION
Despite the very large number of bicolor damselfishinhabiting coral reefs lining the Exuma Sound, the relativelysmall areas of reef we studied, and the substantial distancebetween study islands, demographic connectivity among ourstudy populations was appreciable. This pattern was mostapparent when considering conditional connectivity, a
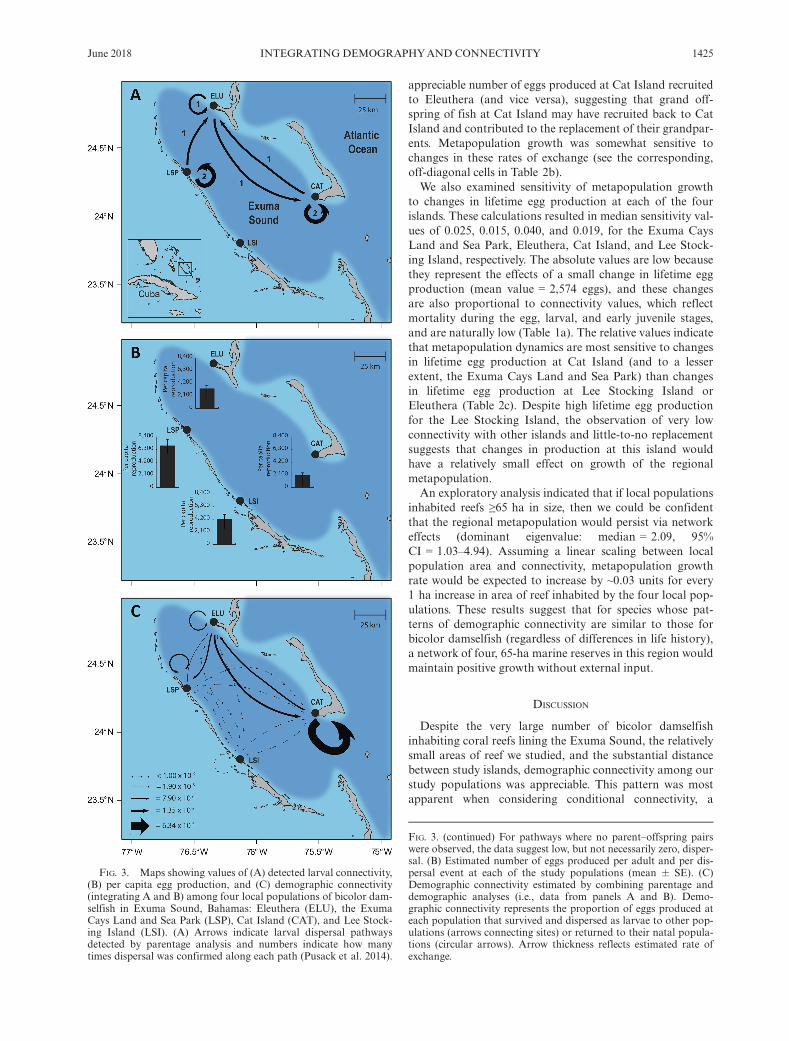
FIG. 3. Maps showing values of (A) detected larval connectivity,(B) per capita egg production, and (C) demographic connectivity(integrating A and B) among four local populations of bicolor dam-selfish in Exuma Sound, Bahamas: Eleuthera (ELU), the ExumaCays Land and Sea Park (LSP), Cat Island (CAT), and Lee Stock-ing Island (LSI). (A) Arrows indicate larval dispersal pathwaysdetected by parentage analysis and numbers indicate how manytimes dispersal was confirmed along each path (Pusack et al. 2014).
FIG. 3. (continued) For pathways where no parent–offspring pairswere observed, the data suggest low, but not necessarily zero, disper-sal. (B) Estimated number of eggs produced per adult and per dis-persal event at each of the study populations (mean � SE). (C)Demographic connectivity estimated by combining parentage anddemographic analyses (i.e., data from panels A and B). Demo-graphic connectivity represents the proportion of eggs produced ateach population that survived and dispersed as larvae to other pop-ulations (arrows connecting sites) or returned to their natal popula-tions (circular arrows). Arrow thickness reflects estimated rate ofexchange.
June 2018 INTEGRATING DEMOGRAPHYAND CONNECTIVITY 1425
measure of connectivity that was summarized per survivingrecruit and thus factored out the high rate of mortality expe-rienced by eggs and larvae of this species. Conditional con-nectivity between islands was 1.6% on average, and involveddispersal distances up to 129 km. Conditional, local reten-tion was estimated to be 13.3% on average, and was esti-mated to be 41% at Cat Island (95% CI = 6.0–97.0%). Weacknowledge that the 95% confidence intervals for many ofour connectivity estimates are large (Table 1), but given thelogistical challenges of measuring both reproduction andconnectivity in large, marine populations, and the need toaccount for the accumulation of uncertainty, it is very diffi-cult to estimate demographic connectivity with a high degreeof precision. We emphasize that likelihood values were lar-gest in the regions near our point estimates, and we may stillbe reasonably confident that some values of connectivitywere small whereas others were appreciable. One reason forthe relatively large connectivity values observed here may bethe presence of oceanographic features that facilitate
dispersal among island populations and/or retention of lar-vae within populations. In particular, mesoscale gyres formseasonally within Exuma Sound (Colin 1995, Stockhausenand Lipcius 2001) and are especially prevalent in a regioncentered among the Exuma Cays Land and Sea Park,Eleuthera, and Cat Island, the three islands for which weobserved connectivity and local retention of larvae, but notoff Lee Stocking Island (Pusack et al. 2014). Depending onthe timing of reproduction and larval behavior, these oceancurrents may facilitate either dispersal to other islands orretention to the natal population (see Paris and Cowen 2004for direct evidence that larvae of S. partitus can detect andmake use of ocean currents). Relevant to our current study,Pusack et al. (2014) measured allele frequencies within eachof our four study populations. FST comparisons suggestappreciable gene flow among three of our study islands(Eleuthera, Exuma Cays Land and Sea Park, and CatIsland), but a low degree of gene flow between Lee StockingIsland and the others. These patterns are consistent of our
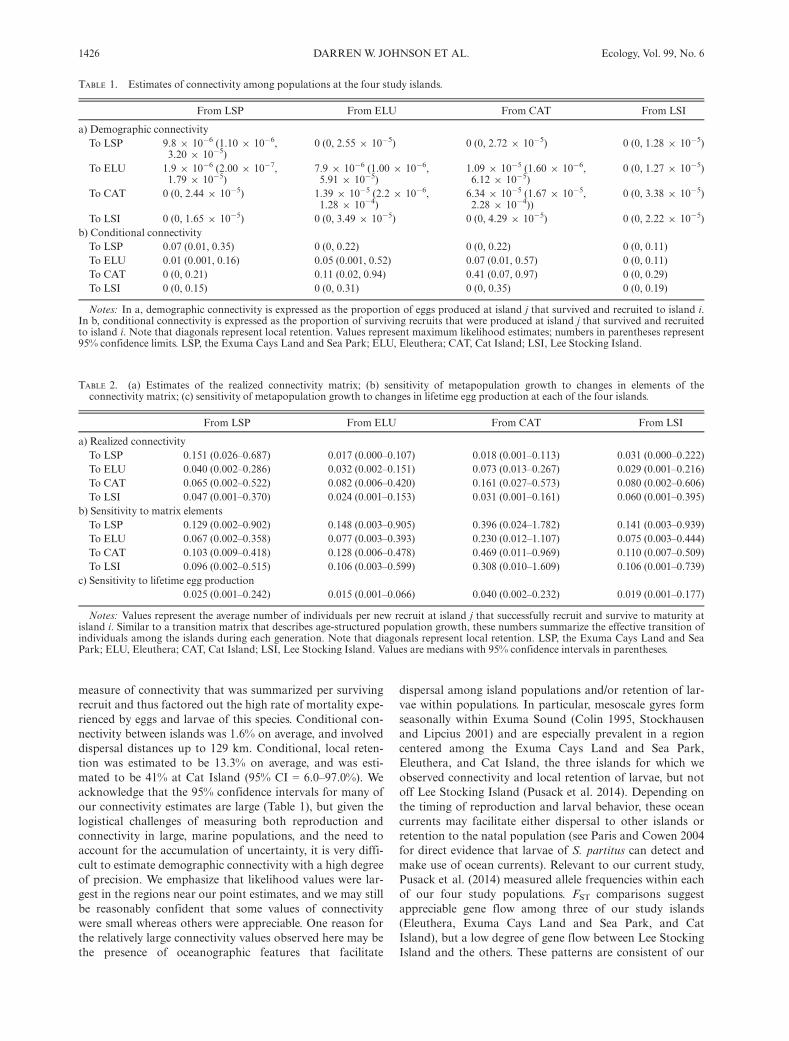
TABLE 1. Estimates of connectivity among populations at the four study islands.
From LSP From ELU From CAT From LSI
a) Demographic connectivityTo LSP 9.8 9 10�6 (1.10 9 10�6,
3.20 9 10�5)0 (0, 2.55 9 10�5) 0 (0, 2.72 9 10�5) 0 (0, 1.28 9 10�5)
To ELU 1.9 9 10�6 (2.00 9 10�7,1.79 9 10�5)
7.9 9 10�6 (1.00 9 10�6,5.91 9 10�5)
1.09 9 10�5 (1.60 9 10�6,6.12 9 10�5)
0 (0, 1.27 9 10�5)
To CAT 0 (0, 2.44 9 10�5) 1.39 9 10�5 (2.2 9 10�6,1.28 9 10�4)
6.34 9 10�5 (1.67 9 10�5,2.28 9 10�4))
0 (0, 3.38 9 10�5)
To LSI 0 (0, 1.65 9 10�5) 0 (0, 3.49 9 10�5) 0 (0, 4.29 9 10�5) 0 (0, 2.22 9 10�5)b) Conditional connectivityTo LSP 0.07 (0.01, 0.35) 0 (0, 0.22) 0 (0, 0.22) 0 (0, 0.11)To ELU 0.01 (0.001, 0.16) 0.05 (0.001, 0.52) 0.07 (0.01, 0.57) 0 (0, 0.11)To CAT 0 (0, 0.21) 0.11 (0.02, 0.94) 0.41 (0.07, 0.97) 0 (0, 0.29)To LSI 0 (0, 0.15) 0 (0, 0.31) 0 (0, 0.35) 0 (0, 0.19)
Notes: In a, demographic connectivity is expressed as the proportion of eggs produced at island j that survived and recruited to island i.In b, conditional connectivity is expressed as the proportion of surviving recruits that were produced at island j that survived and recruitedto island i. Note that diagonals represent local retention. Values represent maximum likelihood estimates; numbers in parentheses represent95% confidence limits. LSP, the Exuma Cays Land and Sea Park; ELU, Eleuthera; CAT, Cat Island; LSI, Lee Stocking Island.
TABLE 2. (a) Estimates of the realized connectivity matrix; (b) sensitivity of metapopulation growth to changes in elements of theconnectivity matrix; (c) sensitivity of metapopulation growth to changes in lifetime egg production at each of the four islands.
From LSP From ELU From CAT From LSI
a) Realized connectivityTo LSP 0.151 (0.026–0.687) 0.017 (0.000–0.107) 0.018 (0.001–0.113) 0.031 (0.000–0.222)To ELU 0.040 (0.002–0.286) 0.032 (0.002–0.151) 0.073 (0.013–0.267) 0.029 (0.001–0.216)To CAT 0.065 (0.002–0.522) 0.082 (0.006–0.420) 0.161 (0.027–0.573) 0.080 (0.002–0.606)To LSI 0.047 (0.001–0.370) 0.024 (0.001–0.153) 0.031 (0.001–0.161) 0.060 (0.001–0.395)
b) Sensitivity to matrix elementsTo LSP 0.129 (0.002–0.902) 0.148 (0.003–0.905) 0.396 (0.024–1.782) 0.141 (0.003–0.939)To ELU 0.067 (0.002–0.358) 0.077 (0.003–0.393) 0.230 (0.012–1.107) 0.075 (0.003–0.444)To CAT 0.103 (0.009–0.418) 0.128 (0.006–0.478) 0.469 (0.011–0.969) 0.110 (0.007–0.509)To LSI 0.096 (0.002–0.515) 0.106 (0.003–0.599) 0.308 (0.010–1.609) 0.106 (0.001–0.739)
c) Sensitivity to lifetime egg production0.025 (0.001–0.242) 0.015 (0.001–0.066) 0.040 (0.002–0.232) 0.019 (0.001–0.177)
Notes: Values represent the average number of individuals per new recruit at island j that successfully recruit and survive to maturity atisland i. Similar to a transition matrix that describes age-structured population growth, these numbers summarize the effective transition ofindividuals among the islands during each generation. Note that diagonals represent local retention. LSP, the Exuma Cays Land and SeaPark; ELU, Eleuthera; CAT, Cat Island; LSI, Lee Stocking Island. Values are medians with 95% confidence intervals in parentheses.
1426 DARRENW. JOHNSON ET AL. Ecology, Vol. 99, No. 6
estimates of little to no demographic connectivity betweenLee Stocking Island and the other islands during the studyperiod (Table 1).This study underscores the importance of gathering con-
currently and integrating data on both the production andthe dispersal of larvae, i.e., both local demography and lar-val connectivity. The dynamics and persistence of ametapopulation depend critically on both of these phenom-ena and isolated information on one or the other may leadto unreliable conclusions. For example, we detected twoinstances of local retention for both the Exuma Cays Landand Sea Park and Cat Island. Without information on larvalproduction, one might conclude that levels of local retentionwere similar. However, per capita egg production was lowerat Cat Island, and the proportion of habitat searched wasmuch smaller. This information suggested that local reten-tion at Cat Island was ~6.5 9 higher than at the ExumaCays Land and Sea Park. Similarly, data on reproductiverates were critical in revealing substantial connectivitybetween Cat Island and Eleuthera, and a lower, but stillappreciable level of connectivity between the Exuma CaysLand and Sea Park and Eleuthera (Fig. 3C).It is likely that the patterns of connectivity we observed
were strongly influenced by ocean currents within ExumaSound (Colin 1995, Stockhausen and Lipcius 2001). Becausepersistent ocean currents may influence the dispersal of lar-vae of multiple species (e.g., Watson et al. 2011b), patternsof connectivity among local populations of other reef speciesat these islands may be similar to those we observed forbicolor damselfish. If so, we would expect greater retentionof larvae in the north and east regions of the sound. Thispattern is consistent with Stoner et al.’s (1998) finding thatlate-stage veliger larvae of queen conch (Strombus gigas)were most abundant in the northeastern region of ExumaSound, moderately abundant near Cat Island, and low nearLee Stocking Island, despite a moderate density of adults.Similarly, Lipcius et al. (2001) used a biophysical model tosimulate the transport of larvae of spiny lobster (Panulirusargus) within Exuma Sound and inferred that local retentionwould be very high at Cat Island, moderate at Eleutheraand the Exuma Cays Land and Sea Park, and lowest at LeeStocking Island. These patterns are also consistent withwhat we found for bicolor damselfish. It is also notable thatthe one marine reserve in our study (the Exuma Cays Landand Sea Park) exhibited both local retention of larvae anddelivery of larvae to other islands. This marine reserve iseffective at protecting fishes at multiple trophic levels(Mumby et al. 2006, Lamb and Johnson 2010), and it isplausible that many species within this reserve benefit fromboth local retention of larvae and export of larvae to otherlocations within Exuma Sound.This study also revealed major differences in lifetime off-
spring production among islands, but again, the metapopu-lation-level consequences of these differences must beinterpreted within the context of larval dispersal. Lifetimeoffspring production was relatively high at Lee StockingIsland and the Exuma Cays Land and Sea Park, but sub-stantially lower at Eleuthera and Cat Island (where averagesurvival to maturity was low). We believe that the differencesin survival among islands was largely due to differences inthe structural complexity of habitats at these locations.
Habitat structure often provides small fish with refuge spacefrom predators and increased complexity typically increasessurvival (e.g., Beukers and Jones 1998, Johnson 2006, Scharfet al. 2006, Hixon et al. 2012). Habitats at Cat Island andEleuthera were comprised of structurally simple corals(mainly massive Orbicella, formerly Montastrea), whereashabitats at the other two islands contained a variety of coralsthat were structurally complex (e.g., Agarica and Porites).Per capita reproduction was highest at the Exuma CaysLand and Sea Park, somewhat lower at Lee Stocking Island,and lower still at the other two islands (Fig. 3B). These pat-terns are correlated with spatial variation in habitat com-plexity, yet we believe they are influenced more directly byfood availability. Current speeds within damselfish habitatwere notably higher at the Exuma Cays Land and Sea Park,somewhat high at Lee Stocking Island, and lower at theother two islands. Bicolor damselfish routinely feed onplankton that drift near their home territories (Myrberg1972, Johnson 2008), and among-island differences in repro-ductive rates may be driven by differences in the supply ofplanktonic food (e.g., Thresher 1983). Based on informationon lifetime egg production alone, one might conclude thatLee Stocking Island and the Exuma Cays Land and SeaPark were most important for the functioning of themetapopulation. However, Cat Island had a relatively highdegree of both local retention and connectivity withEleuthera. When also considering larval dispersal, it is clearthat regional metapopulation growth was more sensitive tovariation in lifetime egg production at Cat Island than at theother sites we studied (Table 2b,c).Our analysis of metapopulation dynamics was set to a
scale of populations inhabiting 5-ha reefs at each of the fourislands. At this scale, average replacement of individuals waslow and the metapopulation would quickly decline if not forinput of larvae from outside the regional metapopulation(k = 0.34). Scaling-up, our results suggest that four reefs of~65 ha in area would experience sufficient demographic con-nectivity that the metapopulation would persist entirely onits own (k was significantly >1). Although bicolor dam-selfish is not a fished species, these results may provide auseful guideline for designing effective networks of marineprotected areas for species with similar combinations ofdispersal and demographic patterns. Protecting four, 65-hasections of coral reef in this region would help ensure thelong-term persistence of species whose patterns of realizedconnectivity are similar to bicolor damselfish, regardless ofany differences in life history.Much effort has gone into estimating patterns of dispersal
of marine larvae (reviewed by Levin 2006, Cowen andSponaugle 2009, Hil�ario et al. 2015). Although such studieshave been motivated by understanding how connectivityaffects population dynamics, few have concurrently mea-sured variation in reproductive output to fully evaluatedemographic connectivity (Botsford et al. 2009). Our resultssuggest that spatial variation in offspring production canplay a major role in the demographic connectivity anddynamics of marine metapopulations. Because understand-ing such effects is integral to the effective design of networksof marine protected areas (Palumbi 2003, Botsford andHastings 2006, Burgess et al. 2014), additional studiesthat integrate data on both larval dispersal and local
June 2018 INTEGRATING DEMOGRAPHYAND CONNECTIVITY 1427
demography will be exceedingly valuable for the successfulconservation and management of marine species.
ACKNOWLEDGMENTS
We thank the many assistants and colleagues who helped with thefieldwork, especially J. Moye, M. Albins, and R. Lamb. We are alsograteful to the staff of the Cape Eleuthera Institute, the Exuma CaysLand and Sea Park, and the Caribbean Marine Research Center(CMRC) for facilitating our research. The manuscript benefitedfrom constructive comments by S. Burgess, S. Swearer, and J. W.White. This project was supported by a grant from the NationalScience Foundation (OCE-05-50709) to M.A. Hixon.
LITERATURE CITED
Almany, G. R., and M. S. Webster. 2006. The predation gauntlet:early post-settlement mortality in reef fishes. Coral Reefs 25:19–22.
Almany, G. R., M. L. Berumen, S. R. Thorrold, S. Planes, and G. P.Jones. 2007. Local replenishment of coral reef fish populations ina marine reserve. Science 316:742–744.
Anderson, E. C., and T. C. Ng. 2014. Comment on “Bayesian parent-age analysis with systematic accountability of genotyping error,missing data and false matching.” Bioinformatics 30:743–745.
Armsworth, P. R. 2002. Recruitment limitation, population regula-tion, and larval connectivity in reef fish metapopulations. Ecology83:1092–1104.
Becker, B. J., L. A. Levin, F. J. Fodrie, and P. A. McMillan. 2007.Complex larval connectivity patterns among marine invertebratepopulations. Proceedings of the National Academy of SciencesUSA 104:3267–3272.
Berumen, M. L., G. R. Almany, S. Planes, G. P. Jones, P. Saenz-Agudelo, and S. R. Thorrold. 2012. Persistence of self-recruitmentand patterns of larval connectivity in a marine protected area net-work. Ecology and Evolution 2:444–452.
Beukers, J. S., and G. P. Jones. 1998. Habitat complexity modifiesthe impact of piscivores on a coral reef fish population. Oecologia114:50–59.
Bode, M., D. H. Williamson, H. B. Harrison, N. Outram and G. P.Jones. 2017. Estimating dispersal kernels using genetic parentagedata. Methods in Ecology and Evolution 9:490–501.
Botsford, L. W., and A. Hastings. 2006. Conservation dynamics ofmarine metapopulations with dispersing larvae. Pages 411–429 inJ. P. Kritzer and P. F. Sale, editors. Marine metapopulations. Aca-demic Press, Burlington, New Jersey, USA.
Botsford, L. W., J. W. White, M.-A. Coffroth, C. B. Paris, S. Planes,T. L. Shearer, S. R. Thorrold, and G. P. Jones. 2009. Connectivityand resilience of coral reef metapopulations in marine protectedareas: matching empirical efforts to predictive needs. Coral Reefs28:327–337.
Burgess, S. C., K. J. Nickols, C. D. Griesemer, L. A. Barnett, A. G.Dedrick, E. V. Satterthwaite, L. Yamane, S. G. Morgan, J. W.White, and L. W. Botsford. 2014. Beyond connectivity: howempirical methods can quantify population persistence toimprove marine protected-area design. Ecological Applications24:257–270.
Burnham, K. P., and D. R. Anderson. 2002. Model selection andmultimodel inference: a practical information-theoretic approach.Springer, New York, New York, USA.
Christie, M. R. 2010. Parentage in natural populations: novel meth-ods to detect parent-offspring pairs in large data sets. MolecularEcology Resources 10:115–128.
Christie, M. R. 2013. Bayesian parentage analysis reliably controlsthe number of false assignments in natural populations. Molecu-lar Ecology 22:5731–5737.
Christie, M. R., D. W. Johnson, C. D. Stallings, and M. A. Hixon.2010. Self-recruitment and sweepstakes reproduction amidextensive gene flow in a coral-reef fish. Molecular Ecology19:1042–1057.
Christie, M. R., J. A. Tennessen, and M. S. Blouin. 2013. Bayesianparentage analysis with systematic accountability of genotypingerror, missing data and false matching. Bioinformatics 29:725–732.
Christie, M. R., P. G. Meirmans, O. E. Gaggiotti, R. J. Toonen, andC. White. 2017. Disentangling the relative merits and disadvan-tages of parentage analysis and assignment tests for inferringpopulation connectivity. ICES Journal of Marine Science 74:1749–1762.
Colin, P. L. 1995. Surface currents in Exuma Sound, Bahamas andadjacent areas with reference to potential larval transport. Bul-letin of Marine Science 56:48–57.
Cowen, R. K., and S. Sponaugle. 2009. Larval dispersal and marinepopulation connectivity. Annual Review of Marine Science 1:443–466.
Cuif, M., D. M. Kaplan, C. Fauvelot, C. Lett, and L. Vigliola. 2015.Monthly variability of self-recruitment for a coral reef damselfish.Coral Reefs 34:759–770.
D’Aloia, C. C., S. M. Bogdanowicz, J. E. Majoris, R. G. Harrison,and P. M. Buston. 2013. Self-recruitment in a Caribbean reef fish:a method for approximating dispersal kernels accounting for seas-cape. Molecular Ecology 22:2563–2572.
D’Aloia, C. C., S. M. Bogdanowicz, R. K. Francis, J. E. Majoris, R.G. Harrison, and P. M. Buston. 2015. Patterns, causes, and conse-quences of marine larval dispersal. Proceedings of the NationalAcademy of Sciences USA 112:13940–13945.
Figueira, W. F. 2009. Connectivity or demography: defining sourcesand sinks in coral reef fish metapopulations. Ecological Model-ling 220:1126–1137.
Guizien, K., M. Belharet, C. Moritz, and J. M. Guarini. 2014. Vul-nerability of marine benthic metapopulations: implications ofspatially structured connectivity for conservation practice in theGulf of Lions (NW Mediterranean Sea). Diversity and Distribu-tions 20:1392–1402.
Harrison, H. B., et al. 2012. Larval export from marine reservesand the recruitment benefit for fish and fisheries. Current Biology22:1023–1028.
Hastings, A., and L. W. Botsford. 2006. Persistence of spatial popu-lations depends on returning home. Proceedings of the NationalAcademy of Sciences USA 103:6067–6072.
Hil�ario, A., A. Metaxas, S. M. Gaudron, K. L. Howell, A. Mercier,N. C. Mestre, R. E. Ross, A. M. Thurnherr, and C. Young. 2015.Estimating dispersal distance in the deep sea: challenges andapplications to marine reserves. Frontiers in Marine Science 2:6.
Hixon, M. A., T. W. Anderson, K. L. Buch, D. W. Johnson, J. B.McLeod, and C. D. Stallings. 2012. Density dependence and pop-ulation regulation in marine fish: a large-scale, long-term fieldmanipulation. Ecological Monographs 82:467–489.
Jacobi, M. N., and P. R. Jonsson. 2011. Optimal networks ofnature reserves can be found through eigenvalue perturbation the-ory of the connectivity matrix. Ecological Applications 21:1861–1870.
Johnson, D. W. 2006. Predation, habitat complexity, and variationin density-dependent mortality of temperate reef fishes. Ecology87:1179–1188.
Johnson, D. W. 2008. Combined effects of condition and density onpost-settlement survival and growth of a marine fish. Oecologia155:43–52.
Johnson, D. W., and M. A. Hixon. 2011. Sexual and lifetime selec-tion on body size in a marine fish: the importance of life-historytrade-offs. Journal of Evolutionary Biology 24:1653–1663.
Johnson, D. W., M. R. Christie, and J. Moye. 2010. Quantifying evo-lutionary potential of marine fish larvae: heritability, selection,and evolutionary constraints. Evolution 64:2614–2628.
Johnson, D. W., M. R. Christie, C. D. Stallings, T. J. Pusack, and M.A. Hixon. 2015. Using post-settlement demography to estimatelarval survivorship: a coral reef fish example. Oecologia 179:729–739.
Jones, G. P., M. J. Milicich, M. J. Emslie, and C. Lunow. 1999. Self-recruitment in a coral reef fish population. Nature 402:802.
1428 DARRENW. JOHNSON ET AL. Ecology, Vol. 99, No. 6

Jones, G. P., S. Planes, and S. R. Thorrold. 2005. Coral reef fish lar-vae settle close to home. Current Biology 15:1314–1318.
Kaplan, D. M., L. W. Botsford, and S. Jorgensen. 2006. Dispersalper recruit: an efficient method for assessing sustainability in mar-ine reserve networks. Ecological Applications 16:2248–2263.
Knapp, R. A., and R. R. Warner. 1991. Male parental care andfemale choice in the bicolor damselfish, Stegastes partitus: biggeris not always better. Animal Behaviour 41:747–756.
Kool, J. T., C. B. Paris, S. Andr�efou€et, and R. K. Cowen. 2010.Complex migration and the development of genetic structure insubdivided populations: an example from Caribbean coral reefecosystems. Ecography 33:597–606.
Kritzer, J. P., and P. F. Sale. 2006. Marine metapopulations. Aca-demic Press, Burlington, MA, USA.
Lamb, R. W., and D. W. Johnson. 2010. Trophic restructuring ofcoral reef fish communities in a large marine reserve. MarineEcology Progress Series 408:169–180.
Lett, C., T. Nguyen-Huu, M. Cuif, P. Saenz-Agudelo, and D. M.Kaplan. 2015. Linking local retention, self-recruitment, and per-sistence in marine metapopulations. Ecology 96:2236–2244.
Levin, L. A. 2006. Recent progress in understanding larval disper-sal: new directions and digressions. Integrative and ComparativeBiology 46:282–297.
Lipcius, R. N., W. T. Stockhausen, and D. B. Eggleston. 2001. Mar-ine reserves for Caribbean spiny lobster: empirical evaluation andtheoretical metapopulation recruitment dynamics. Marine andFreshwater Research 52:1589–1598.
MacNeil, M. A., and S. R. Connolly. 2015. Multi-scale patterns andprocesses in reef fish abundance. Pages 116–124 in C. Mora, editor.Ecology of fishes on coral reefs. Cambridge University Press, Cam-bridge, UK.
Moffitt, E. A., J. W. White, and L. W. Botsford. 2011. The utilityand limitations of size and spacing guidelines for designing mar-ine protected area (MPA) networks. Biological Conservation144:306–318.
Mumby, P. J., et al. 2006. Fishing, trophic cascades, and the processof grazing on coral reefs. Science 311:98–101.
Myrberg, A. A. 1972. Ethology of the bicolor damselfish, Eupoma-centrus partitus (Pisces: Pomacentridae): a comparative analysisof laboratory and field behaviour. Animal Behaviour Mono-graphs 5:197IN1–283IN2.
Nanninga, G. B., P. Saenz-Agudelo, P. Zhan, I. Hoteit, and M. L.Berumen. 2015. Not finding Nemo: limited reef-scale retention ina coral reef fish. Coral Reefs 34:383–392.
Palumbi, S. R. 2003. Population genetics, demographic connectivity,and the design of marine reserves. Ecological Applications 13:S146–S158.
Paris, C. B., and R. K. Cowen. 2004. Direct evidence of a biophysi-cal retention mechanism for coral reef fish larvae. Limnology andOceanography 49:1964–1979.
Planes, S., G. P. Jones, and S. R. Thorrold. 2009. Larval dispersalconnects fish populations in a network of marine protected areas.Proceedings of the National Academy of Sciences USA 106:5693–5697.
Pusack, T. J., M. R. Christie, D. W. Johnson, C. D. Stallings, and M.A. Hixon. 2014. Spatial and temporal patterns of larval dispersal
in a coral-reef fish metapopulation: evidence of variable reproduc-tive success. Molecular Ecology 23:3396–3408.
Robertson, D. R., D. G. Green, and B. C. Victor. 1988. Temporalcoupling of production and recruitment of larvae of a Caribbeanreef fish. Ecology 69:370–381.
Roff, D. A. 2002. Life history evolution. Sinauer Associates, Sun-derland, Massachusetts, USA.
Saenz-Agudelo, P., G. P. Jones, S. R. Thorrold, and S. Planes. 2009.Estimating connectivity in marine populations: an empirical eval-uation of assignment tests and parentage analysis under differentgene flow scenarios. Molecular Ecology 18:1765–1776.
Sale, P. F. 1998. Appropriate spatial scales for studies of reef-fishecology. Austral Ecology 23:202–208.
Salles, O. C., J. A. Maynard, M. Joannides, C. M. Barbu, P. Saenz-Agudelo, G. R. Almany, M. L. Berumen, S. R. Thorrold, G. P.Jones, and S. Planes. 2015. Coral reef fish populations can persistwithout immigration. Proceedings of the Royal Society B282:20151311.
Scharf, F. S., J. P. Manderson, and M. C. Fabrizio. 2006. The effectsof seafloor habitat complexity on survival of juvenile fishes: spe-cies-specific interactions with structural refuge. Journal of Experi-mental Marine Biology and Ecology 335:167–176.
Schmale, M. C. 1981. Sexual selection and reproductive success inmales of the bicolor damselfish, Eupomacentrus partitus (Pisces:Pomacentridae). Animal Behaviour 29:1172–1184.
Stearns, S. C. 1992. The Evolution of Life Histories. First edition.Oxford University Press, Oxford, UK.
Stockhausen, W. T., and R. N. Lipcius. 2001. Single large or severalsmall marine reserves for the Caribbean spiny lobster? Marineand Freshwater Research 52:1605–1614.
Stoner, A. W., N. Mehta, and M. Ray-Culp. 1998. Mesoscale distri-bution patterns of queen conch (Strombus gigas Linne) in ExumaSound, Bahmas: links in recruitment from larvae to fishery yields.Journal of Shellfish Research 17:955–969.
Swearer, S. E., J. E. Caselle, D. W. Lea, and R. R. Warner. 1999.Larval retention and recruitment in an island population of acoral-reef fish. Nature 402:799.
Thresher, R. E. 1983. Habitat effects on reproductive success in thecoral reef fish, Acanthochromis polyacanthus (Pomacentridae).Ecology 64:1184–1199.
Treml, E. A., J. J. Roberts, Y. Chao, P. N. Halpin, H. P. Possingham,and C. Riginos. 2012. Reproductive output and duration of thepelagic larval stage determine seascape-wide connectivity of mar-ine populations. Integrative and Comparative Biology 52:525–537.
Watson, J. R., C. G. Hays, P. T. Raimondi, S. Mitarai, C. Dong, J.C. McWilliams, C. A. Blanchette, J. E. Caselle, and D. A. Siegel.2011a. Currents connecting communities: nearshore communitysimilarity and ocean circulation. Ecology 92:1193–1200.
Watson, J. R., D. A. Siegel, B. E. Kendall, S. Mitarai, A. Rass-weiller, and S. D. Gaines. 2011b. Identifying critical regions insmall-world marine metapopulations. Proceedings of the NationalAcademy of Sciences USA 108:E907–E913.
Williams, J. C., C. S. ReVelle, and S. A. Levin. 2005. Spatial attri-butes and reserve design models: a review. Environmental Model-ing & Assessment 10:163–181.
SUPPORTING INFORMATION
Additional supporting information may be found in the online version of this article at http://onlinelibrary.wiley.com/doi/10.1002/ecy.2343/suppinfo
June 2018 INTEGRATING DEMOGRAPHYAND CONNECTIVITY 1429
Appendix S1. Integrating larval connectivity with local demography reveals regional dynamics of a marine metapopulation. Darren W. Johnson, Mark R. Christie, Timothy J. Pusack, Christopher D. Stallings, and Mark A. Hixon. Ecology. 2018.
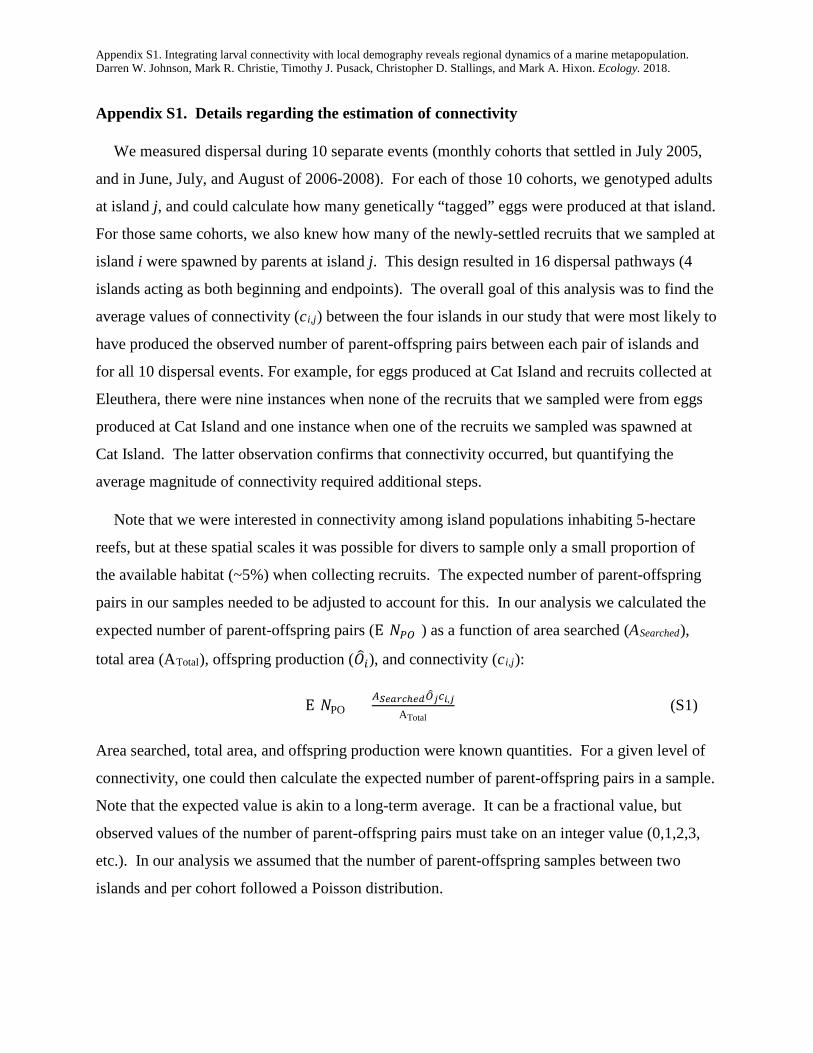
Appendix S1. Details regarding the estimation of connectivity
We measured dispersal during 10 separate events (monthly cohorts that settled in July 2005,
and in June, July, and August of 2006-2008). For each of those 10 cohorts, we genotyped adults
at island j, and could calculate how many genetically “tagged” eggs were produced at that island.
For those same cohorts, we also knew how many of the newly-settled recruits that we sampled at
island i were spawned by parents at island j. This design resulted in 16 dispersal pathways (4
islands acting as both beginning and endpoints). The overall goal of this analysis was to find the
average values of connectivity (ci,j) between the four islands in our study that were most likely to
have produced the observed number of parent-offspring pairs between each pair of islands and
for all 10 dispersal events. For example, for eggs produced at Cat Island and recruits collected at
Eleuthera, there were nine instances when none of the recruits that we sampled were from eggs
produced at Cat Island and one instance when one of the recruits we sampled was spawned at
Cat Island. The latter observation confirms that connectivity occurred, but quantifying the
average magnitude of connectivity required additional steps.
Note that we were interested in connectivity among island populations inhabiting 5-hectare
reefs, but at these spatial scales it was possible for divers to sample only a small proportion of
the available habitat (~5%) when collecting recruits. The expected number of parent-offspring
pairs in our samples needed to be adjusted to account for this. In our analysis we calculated the
expected number of parent-offspring pairs (E[𝑁𝑁𝑃𝑃𝑃𝑃]) as a function of area searched (ASearched),
total area (ATotal), offspring production (𝑂𝑂�𝑖𝑖), and connectivity (ci,j):
E[𝑁𝑁PO] = 𝐴𝐴𝑆𝑆𝑆𝑆𝑆𝑆𝑆𝑆𝑆𝑆ℎ𝑆𝑆𝑒𝑒𝑃𝑃�𝑗𝑗𝑐𝑐𝑖𝑖,𝑗𝑗ATotal
(S1)
Area searched, total area, and offspring production were known quantities. For a given level of
connectivity, one could then calculate the expected number of parent-offspring pairs in a sample.
Note that the expected value is akin to a long-term average. It can be a fractional value, but
observed values of the number of parent-offspring pairs must take on an integer value (0,1,2,3,
etc.). In our analysis we assumed that the number of parent-offspring samples between two
islands and per cohort followed a Poisson distribution.
Appendix S1. Integrating larval connectivity with local demography reveals regional dynamics of a marine metapopulation. Darren W. Johnson, Mark R. Christie, Timothy J. Pusack, Christopher D. Stallings, and Mark A. Hixon. Ecology. 2018.
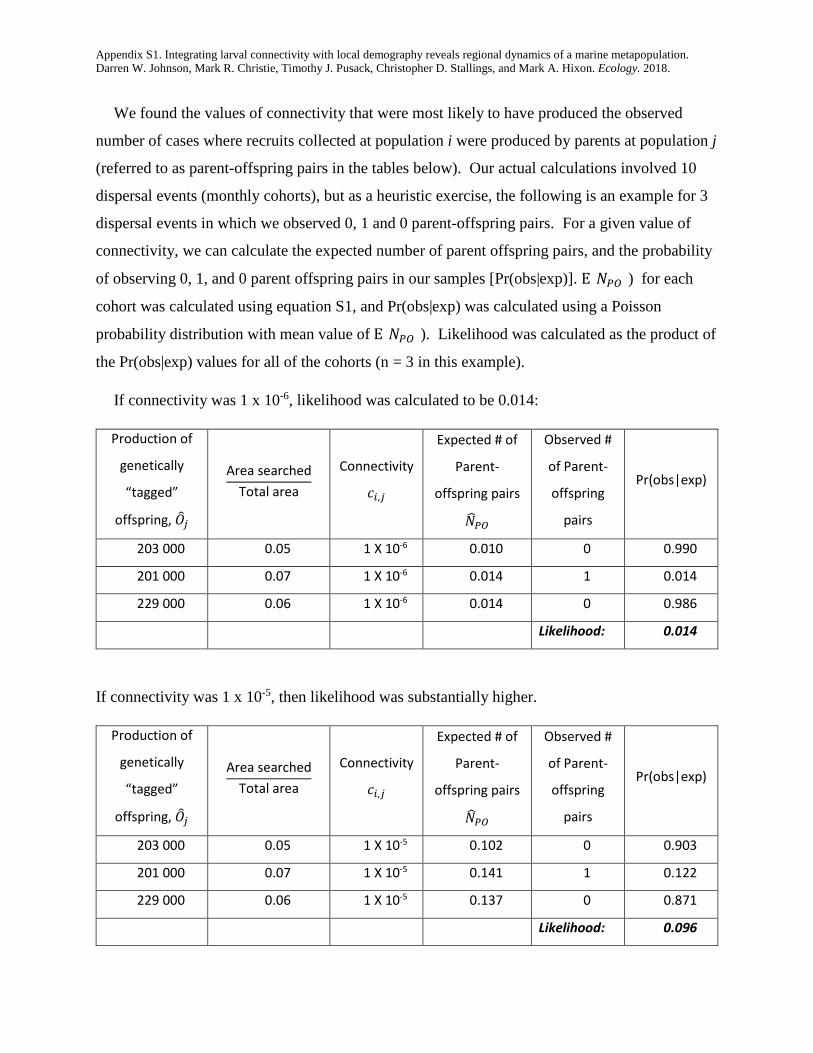
We found the values of connectivity that were most likely to have produced the observed
number of cases where recruits collected at population i were produced by parents at population j
(referred to as parent-offspring pairs in the tables below). Our actual calculations involved 10
dispersal events (monthly cohorts), but as a heuristic exercise, the following is an example for 3
dispersal events in which we observed 0, 1 and 0 parent-offspring pairs. For a given value of
connectivity, we can calculate the expected number of parent offspring pairs, and the probability
of observing 0, 1, and 0 parent offspring pairs in our samples [Pr(obs|exp)]. E[𝑁𝑁𝑃𝑃𝑃𝑃]) for each
cohort was calculated using equation S1, and Pr(obs|exp) was calculated using a Poisson
probability distribution with mean value of E[𝑁𝑁𝑃𝑃𝑃𝑃]). Likelihood was calculated as the product of
the Pr(obs|exp) values for all of the cohorts (n = 3 in this example).
If connectivity was 1 x 10⁻⁶, likelihood was calculated to be 0.014:
Production of
genetically
“tagged”
offspring, 𝑂𝑂�𝑗𝑗
Area searchedTotal area
Connectivity
𝑐𝑐𝑖𝑖,𝑗𝑗
Expected # of
Parent-
offspring pairs
𝑁𝑁�𝑃𝑃𝑃𝑃
Observed #
of Parent-
offspring
pairs
Pr(obs|exp)
203 000 0.05 1 X 10⁻⁶ 0.010 0 0.990
201 000 0.07 1 X 10⁻⁶ 0.014 1 0.014
229 000 0.06 1 X 10⁻⁶ 0.014 0 0.986
Likelihood: 0.014
If connectivity was 1 x 10⁻⁵, then likelihood was substantially higher.
Production of
genetically
“tagged”
offspring, 𝑂𝑂�𝑗𝑗
Area searchedTotal area
Connectivity
𝑐𝑐𝑖𝑖,𝑗𝑗
Expected # of
Parent-
offspring pairs
𝑁𝑁�𝑃𝑃𝑃𝑃
Observed #
of Parent-
offspring
pairs
Pr(obs|exp)
203 000 0.05 1 X 10⁻⁵ 0.102 0 0.903
201 000 0.07 1 X 10⁻⁵ 0.141 1 0.122
229 000 0.06 1 X 10⁻⁵ 0.137 0 0.871
Likelihood: 0.096
Appendix S1. Integrating larval connectivity with local demography reveals regional dynamics of a marine metapopulation. Darren W. Johnson, Mark R. Christie, Timothy J. Pusack, Christopher D. Stallings, and Mark A. Hixon. Ecology. 2018.
This procedure was repeated for connectivity values ranging from 0 to 0.001 in increments of
1 × 10⁻⁷ until the maximum likelihood estimates for connectivity values were obtained.
However, our procedure for estimating connectivity relies on inputs that are estimates, and
therefore subject to some uncertainty. To incorporate this uncertainty into our overall estimates
of connectivity we used a resampling procedure. For each of 1000 iterations, input parameters
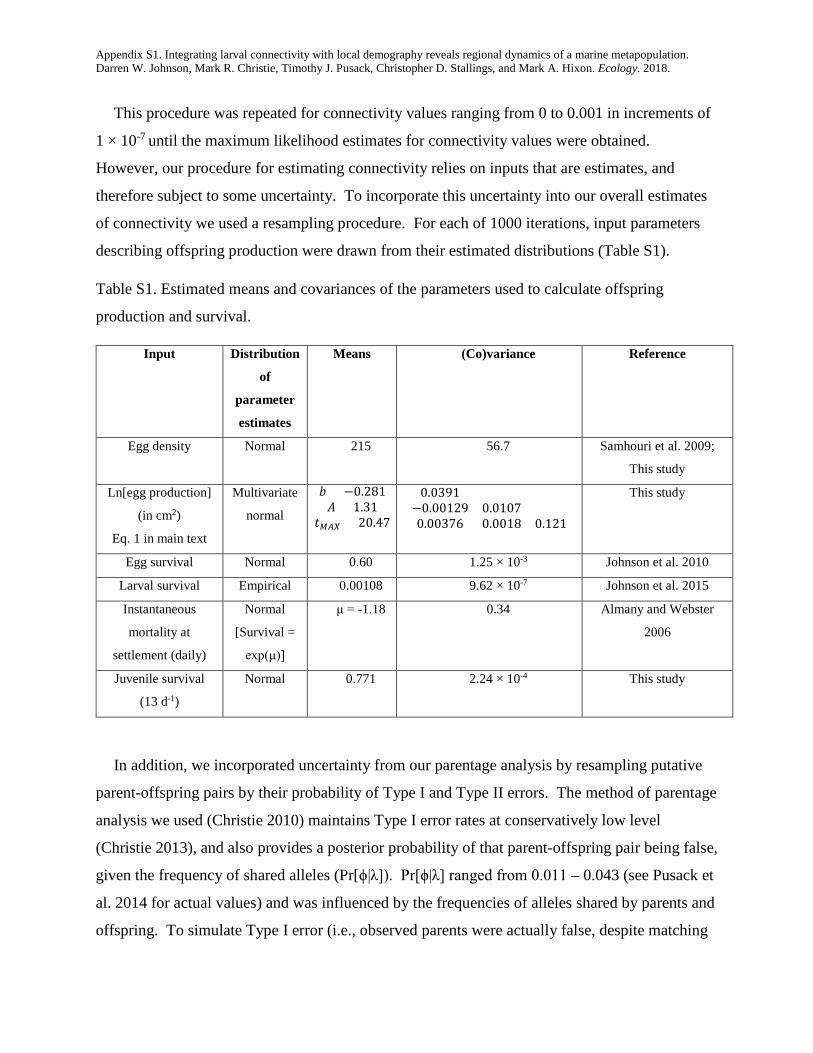
describing offspring production were drawn from their estimated distributions (Table S1).
Table S1. Estimated means and covariances of the parameters used to calculate offspring
production and survival.
Input Distribution
of
parameter
estimates
Means (Co)variance Reference
Egg density Normal 215 56.7 Samhouri et al. 2009;
This study
Ln[egg production]
(in cm2)
Eq. 1 in main text
Multivariate
normal
𝑏𝑏 = −0.281𝐴𝐴 = 1.31
𝑡𝑡𝑀𝑀𝐴𝐴𝑀𝑀 = 20.47
0.0391−0.00129 0.01070.00376 0.0018 0.121
This study
Egg survival Normal 0.60 1.25 × 10⁻³ Johnson et al. 2010
Larval survival Empirical 0.00108 9.62 × 10⁻⁷ Johnson et al. 2015
Instantaneous
mortality at
settlement (daily)
Normal
[Survival =
exp(μ)]
μ = -1.18 0.34 Almany and Webster
2006
Juvenile survival
(13 d-1)
Normal 0.771 2.24 × 10⁻⁴ This study
In addition, we incorporated uncertainty from our parentage analysis by resampling putative
parent-offspring pairs by their probability of Type I and Type II errors. The method of parentage
analysis we used (Christie 2010) maintains Type I error rates at conservatively low level
(Christie 2013), and also provides a posterior probability of that parent-offspring pair being false,
given the frequency of shared alleles (Pr[ϕ|λ]). Pr[ϕ|λ] ranged from 0.011 – 0.043 (see Pusack et
al. 2014 for actual values) and was influenced by the frequencies of alleles shared by parents and
offspring. To simulate Type I error (i.e., observed parents were actually false, despite matching
Appendix S1. Integrating larval connectivity with local demography reveals regional dynamics of a marine metapopulation. Darren W. Johnson, Mark R. Christie, Timothy J. Pusack, Christopher D. Stallings, and Mark A. Hixon. Ecology. 2018.
alleles at 10 of 10 loci), in each of the 1000 iterations, each of the observed parent-offspring
pairs was treated as a random variable and sampled as true with a probability of 1- Pr[ϕ|λ]. Type
II error rates were simulated by considering whether some pairs of recruits and adults could be
parent-offspring, despite matching at fewer than 10 of 10 loci. Such results would be possible
because of genotyping error. In our study there were 42 recruit-adult pairs that matched at 9 of
10 loci. However, it was biologically possible that only 12 of these could be parent-offspring
pairs (in many cases the adult was dead long before the recruits were collected; in other cases the
adult was too young to be reproductive at the time the recruit was collected). In contrast, all
eight identified pairs that matched at 10 of 10 loci were all biologically plausible parent-
offspring pairs. Using our estimated genotyping error rate of 0.014 (Christie et al. 2010), a
recruit-adult pair that matched at 9/10 loci may have been a true parent offspring pair if there
was a genotyping error at one loci, but not the other nine. In that case, the probability would be
0.014 x (1-0.014)9. However, because all putative parent-offspring pairs were reanalyzed from
DNA extraction to genotyping (Pusack et al. 2014), the actual probability of Type II error was
lower (approximately [0.014 × (1-0.014)9]2). To simulate Type II error rate, each recruit-adult
pair was sampled as a true parent offspring pair, with probability equal to the estimated Type II
error probability. Note that if recruits and adults mismatched at more than 1 locus, the
probability of Type II error was negligible ([(0.014)2 × (1-0.014)8]2 = 3.06 × 10⁻⁸), so these cases
were not included in our simulation.
Based on resampled values of demographic parameters and number of parent-offspring pairs,
a likelihood profile for demographic connectivity values was calculated. Assuming that the
number of parent-offspring pairs found in each sample of recruits followed a Poisson
distribution, we calculated the probability of observing the data for connectivity values ranging
from 0 to 0.001 in increments of 1 × 10⁻⁷. To summarize the overall likelihood profile for
connectivity, we averaged all 1000 probabilities associated with each connectivity value. The
resulting likelihood profiles represent both the inherent variability of sampling recruits
(described by the Poisson distribution) and the uncertainty of estimates of offspring production
and parentage (described by our resampling procedure). These likelihood profiles were used to
generate 95% confidence intervals for each estimate of connectivity. The range of values whose
log likelihood lies within 𝜒𝜒𝛼𝛼,12
2 units of the maximum defines a confidence interval at the α-1 level
Appendix S1. Integrating larval connectivity with local demography reveals regional dynamics of a marine metapopulation. Darren W. Johnson, Mark R. Christie, Timothy J. Pusack, Christopher D. Stallings, and Mark A. Hixon. Ecology. 2018.
(Meeker and Escobar 1995). To calculate upper and lower confidence limits, we found the upper
and lower values of connectivity that were 1.92 units of log likelihood below the maximum
likelihood estimate. We used a similar procedure to describe the likelihood profiles for
conditional connectivity, but these calculations involved the additional steps of resampling
values of survival during the egg, larval, settler, and early juvenile stages. Parameters describing
survival during each of these stages were sampled from their estimated distributions (Table S1).
For each level of conditional connectivity, we resampled 1000 different sets of parameters
describing both offspring production and offspring survival, and for each of these 1000
iterations, we calculated the probability of observing the parentage data (with genotyping error
included as described above). We calculated likelihoods for levels of conditional connectivity
ranging from 0 to 1 and in increments of 1 × 10⁻⁴.
Although our analyses concentrated on estimating average connectivity values, it is possible
that values of connectivity between islands changed over time. To evaluate whether it was
reasonable to assume that patterns of connectivity were stable, we compared measures of fit
(AIC values) for two models: one in which connectivity among islands was allowed to vary
during each reproductive event, and one in which connectivity among islands was assumed to be
constant across reproductive periods. Support for the constant-connectivity model was
overwhelming (AICconstant = 80.67, AICvariable = 336), largely because the variable-connectivity
model (which was much more complex and required the estimation of many more parameters)
provided only a marginal increase in likelihood.
We note that one reason for choosing a simpler model is the challenge of estimating variable
connectivity. The regional population size of bicolor damselfish is large, and although we
concentrated on 4 focal islands, there are many other locations that may contribute offspring to
our study islands. Within this system it was possible to sample only a relatively small proportion
of the adults and offspring in the populations of interest, and it would be difficult to detect
moderate to small changes in demographic connectivity. Similarly, it is difficult to say whether
temporal variation in larval exchange (a pattern discussed in our earlier study; Pusack et al.
2014) was truly indicative of spatial and temporal variation in demographic connectivity.
Guided by parsimony, we chose a model in which patterns of demographic connectivity are
temporally consistent. This choice was appropriate considering that the goals of the study were
Appendix S1. Integrating larval connectivity with local demography reveals regional dynamics of a marine metapopulation. Darren W. Johnson, Mark R. Christie, Timothy J. Pusack, Christopher D. Stallings, and Mark A. Hixon. Ecology. 2018.
to estimate average values of connectivity among the study islands, and that there is some
evidence to suggest that the spatial patterns of connectivity we detected may remain consistent
over much larger timescales (see Pusack et al. 2014, and discussion in the main text).
LITERATURE CITED
Christie, M. R. 2010. Parentage in natural populations: novel methods to detect parent-offspring pairs in large data sets. Molecular Ecology Resources 10:115–128.
Christie, M. R. 2013. Bayesian parentage analysis reliably controls the number of false assignments in natural populations. Molecular Ecology 22:5731–5737.
Christie, M. R., D. W. Johnson, C. D. Stallings, and M. A. Hixon. 2010. Self-recruitment and sweepstakes reproduction amid extensive gene flow in a coral-reef fish. Molecular Ecology 19:1042–1057.
Meeker, W.Q., and W.A. Escobar. 1995. Teaching about confidence regions based on maximum likelihood estimation. American Statistician 49: 48-53.
Pusack, T. J., M. R. Christie, D. W. Johnson, C. D. Stallings, and M. A. Hixon. 2014. Spatial and temporal patterns of larval dispersal in a coral-reef fish metapopulation: evidence of variable reproductive success. Molecular Ecology 23:3396–3408.
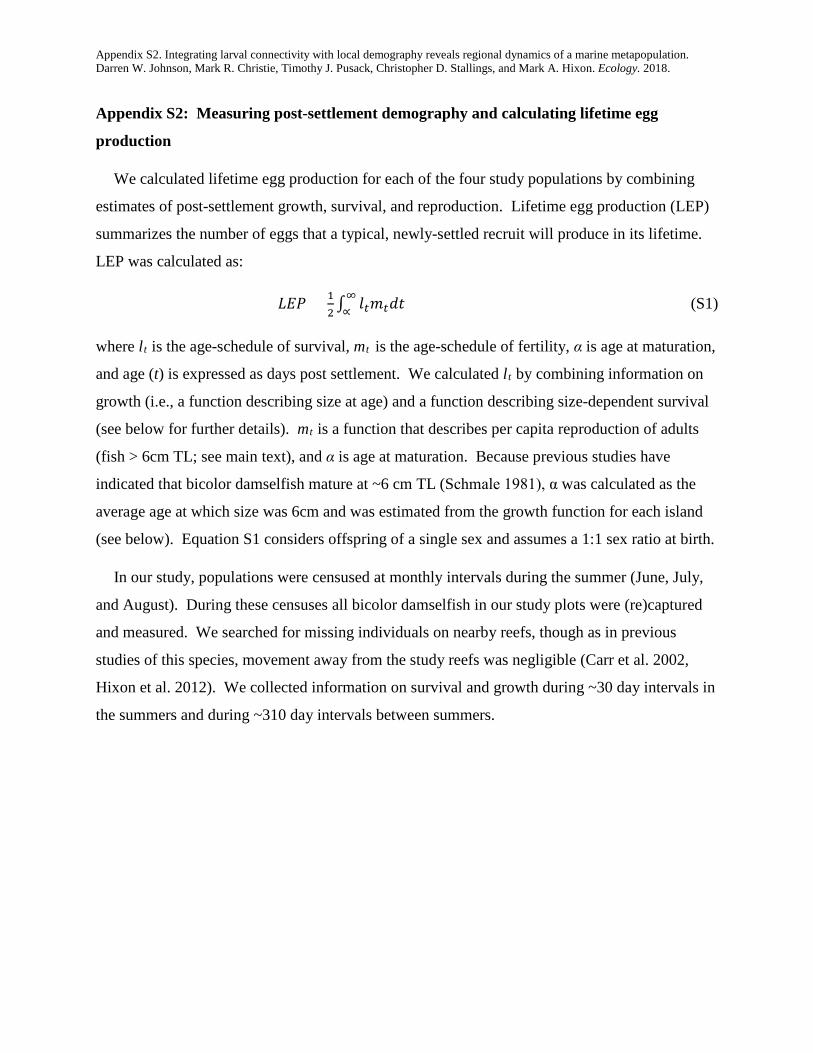
Appendix S2. Integrating larval connectivity with local demography reveals regional dynamics of a marine metapopulation. Darren W. Johnson, Mark R. Christie, Timothy J. Pusack, Christopher D. Stallings, and Mark A. Hixon. Ecology. 2018.
Appendix S2: Measuring post-settlement demography and calculating lifetime egg
production
We calculated lifetime egg production for each of the four study populations by combining
estimates of post-settlement growth, survival, and reproduction. Lifetime egg production (LEP)
summarizes the number of eggs that a typical, newly-settled recruit will produce in its lifetime.
LEP was calculated as:
𝐿𝐿𝐿𝐿𝐿𝐿 = 12 ∫ 𝑙𝑙𝑡𝑡𝑚𝑚𝑡𝑡𝑑𝑑𝑑𝑑
∞∝ (S1)
where lt is the age-schedule of survival, mt is the age-schedule of fertility, α is age at maturation,
and age (t) is expressed as days post settlement. We calculated lt by combining information on
growth (i.e., a function describing size at age) and a function describing size-dependent survival
(see below for further details). mt is a function that describes per capita reproduction of adults
(fish > 6cm TL; see main text), and α is age at maturation. Because previous studies have
indicated that bicolor damselfish mature at ~6 cm TL (Schmale 1981), α was calculated as the
average age at which size was 6cm and was estimated from the growth function for each island
(see below). Equation S1 considers offspring of a single sex and assumes a 1:1 sex ratio at birth.
In our study, populations were censused at monthly intervals during the summer (June, July,
and August). During these censuses all bicolor damselfish in our study plots were (re)captured
and measured. We searched for missing individuals on nearby reefs, though as in previous
studies of this species, movement away from the study reefs was negligible (Carr et al. 2002,
Hixon et al. 2012). We collected information on survival and growth during ~30 day intervals in
the summers and during ~310 day intervals between summers.
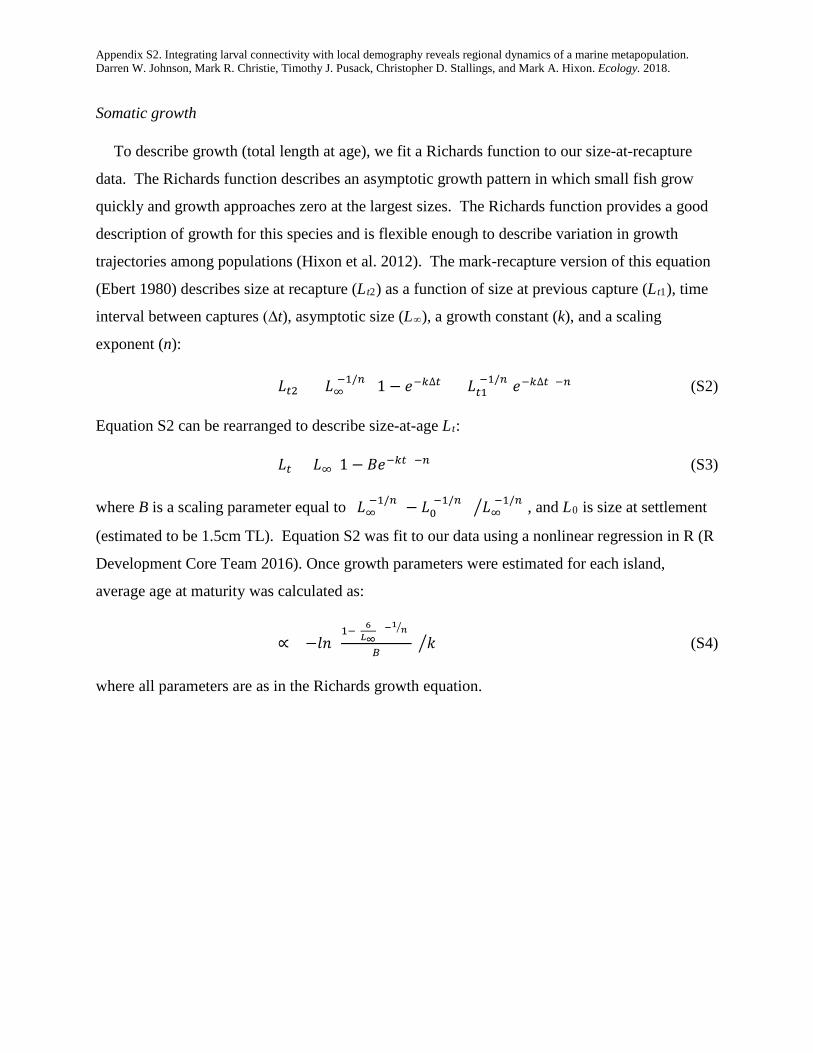
Appendix S2. Integrating larval connectivity with local demography reveals regional dynamics of a marine metapopulation. Darren W. Johnson, Mark R. Christie, Timothy J. Pusack, Christopher D. Stallings, and Mark A. Hixon. Ecology. 2018.
Somatic growth
To describe growth (total length at age), we fit a Richards function to our size-at-recapture
data. The Richards function describes an asymptotic growth pattern in which small fish grow
quickly and growth approaches zero at the largest sizes. The Richards function provides a good
description of growth for this species and is flexible enough to describe variation in growth
trajectories among populations (Hixon et al. 2012). The mark-recapture version of this equation
(Ebert 1980) describes size at recapture (Lt2) as a function of size at previous capture (Lt1), time
interval between captures (∆t), asymptotic size (L∞), a growth constant (k), and a scaling
exponent (n):
𝐿𝐿𝑡𝑡2 = [𝐿𝐿∞(−1/𝑛𝑛)(1 − 𝑒𝑒−𝑘𝑘∆𝑡𝑡) + 𝐿𝐿𝑡𝑡1
(−1/𝑛𝑛)𝑒𝑒−𝑘𝑘∆𝑡𝑡]−𝑛𝑛 (S2)
Equation S2 can be rearranged to describe size-at-age Lt:
𝐿𝐿𝑡𝑡 = 𝐿𝐿∞(1 − 𝐵𝐵𝑒𝑒−𝑘𝑘𝑡𝑡)−𝑛𝑛 (S3)
where B is a scaling parameter equal to (𝐿𝐿∞(−1/𝑛𝑛) − 𝐿𝐿0
(−1/𝑛𝑛)) 𝐿𝐿∞(−1/𝑛𝑛)� , and L0 is size at settlement
(estimated to be 1.5cm TL). Equation S2 was fit to our data using a nonlinear regression in R (R
Development Core Team 2016). Once growth parameters were estimated for each island,
average age at maturity was calculated as:
∝= −𝑙𝑙𝑙𝑙 (1−( 6
𝐿𝐿∞)(−1 𝑛𝑛� )
𝐵𝐵) 𝑘𝑘� (S4)
where all parameters are as in the Richards growth equation.
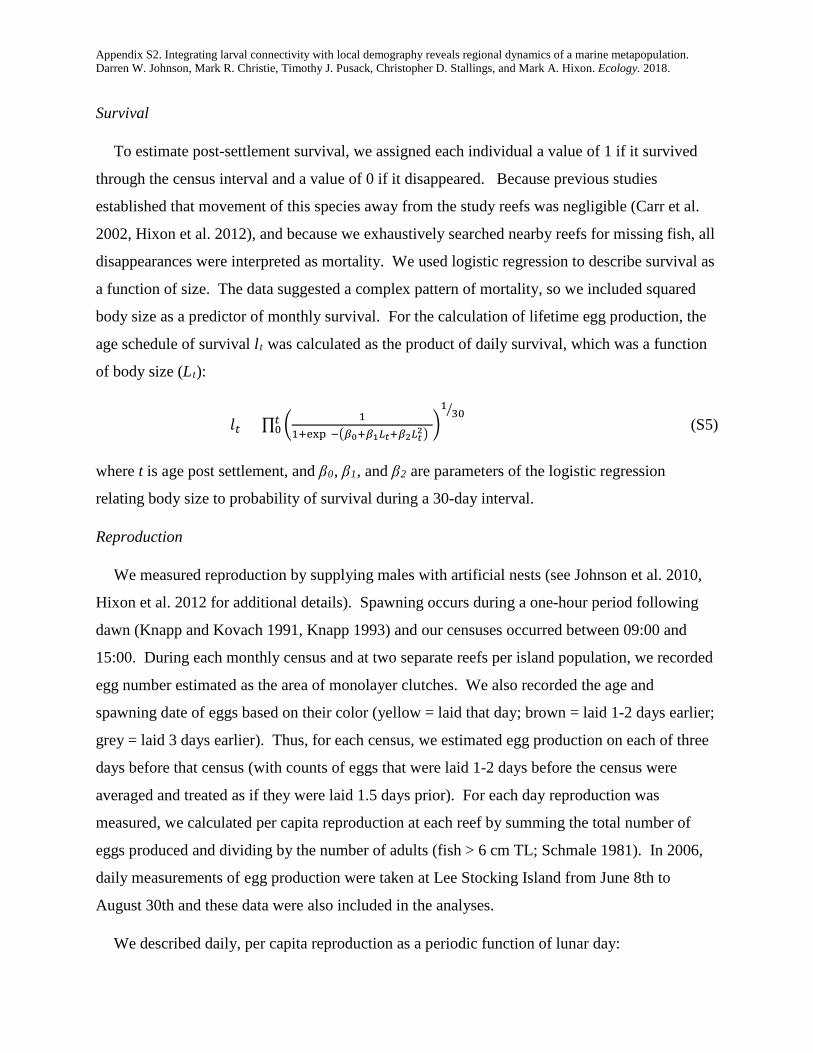
Appendix S2. Integrating larval connectivity with local demography reveals regional dynamics of a marine metapopulation. Darren W. Johnson, Mark R. Christie, Timothy J. Pusack, Christopher D. Stallings, and Mark A. Hixon. Ecology. 2018.
Survival
To estimate post-settlement survival, we assigned each individual a value of 1 if it survived
through the census interval and a value of 0 if it disappeared. Because previous studies
established that movement of this species away from the study reefs was negligible (Carr et al.
2002, Hixon et al. 2012), and because we exhaustively searched nearby reefs for missing fish, all
disappearances were interpreted as mortality. We used logistic regression to describe survival as
a function of size. The data suggested a complex pattern of mortality, so we included squared
body size as a predictor of monthly survival. For the calculation of lifetime egg production, the
age schedule of survival lt was calculated as the product of daily survival, which was a function
of body size (Lt):
𝑙𝑙𝑡𝑡 = ∏ � 11+exp (−�𝛽𝛽0+𝛽𝛽1𝐿𝐿𝑡𝑡+𝛽𝛽2𝐿𝐿𝑡𝑡2�)
�130�
𝑡𝑡0 (S5)
where t is age post settlement, and β0, β1, and β2 are parameters of the logistic regression
relating body size to probability of survival during a 30-day interval.
Reproduction
We measured reproduction by supplying males with artificial nests (see Johnson et al. 2010,
Hixon et al. 2012 for additional details). Spawning occurs during a one-hour period following
dawn (Knapp and Kovach 1991, Knapp 1993) and our censuses occurred between 09:00 and
15:00. During each monthly census and at two separate reefs per island population, we recorded
egg number estimated as the area of monolayer clutches. We also recorded the age and
spawning date of eggs based on their color (yellow = laid that day; brown = laid 1-2 days earlier;
grey = laid 3 days earlier). Thus, for each census, we estimated egg production on each of three
days before that census (with counts of eggs that were laid 1-2 days before the census were
averaged and treated as if they were laid 1.5 days prior). For each day reproduction was
measured, we calculated per capita reproduction at each reef by summing the total number of
eggs produced and dividing by the number of adults (fish > 6 cm TL; Schmale 1981). In 2006,
daily measurements of egg production were taken at Lee Stocking Island from June 8th to
August 30th and these data were also included in the analyses.
We described daily, per capita reproduction as a periodic function of lunar day:
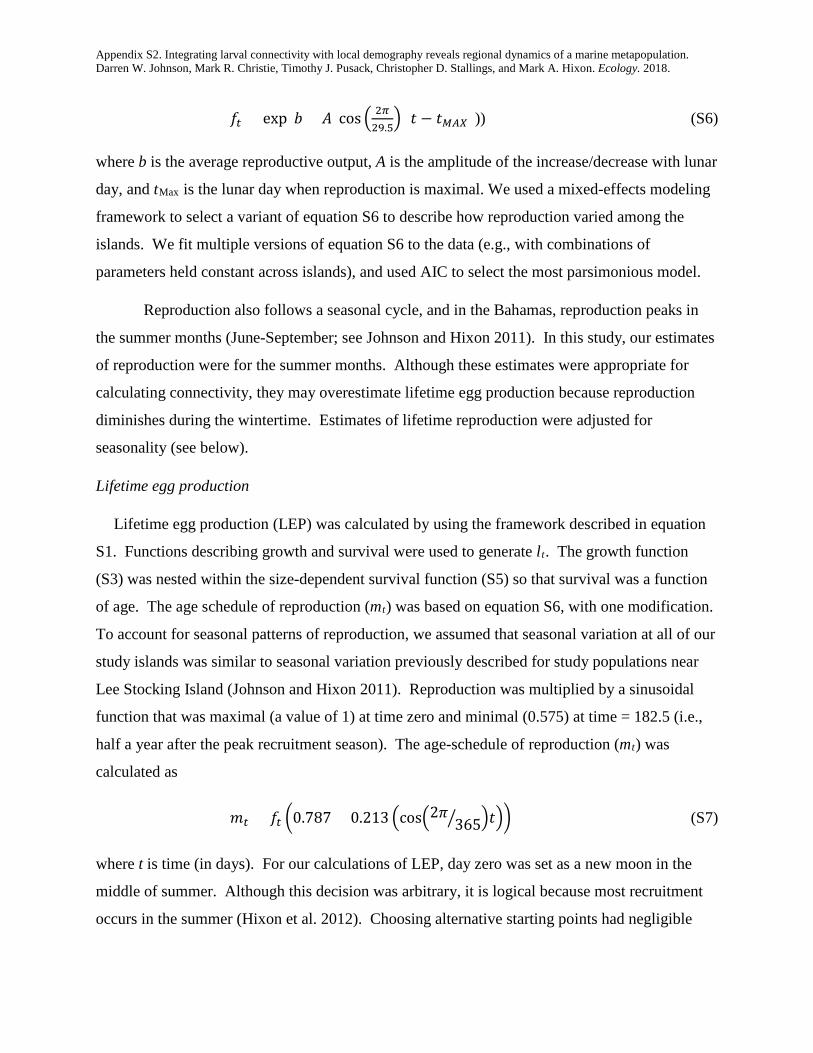
Appendix S2. Integrating larval connectivity with local demography reveals regional dynamics of a marine metapopulation. Darren W. Johnson, Mark R. Christie, Timothy J. Pusack, Christopher D. Stallings, and Mark A. Hixon. Ecology. 2018.
𝑓𝑓𝑡𝑡 = exp(𝑏𝑏 + 𝐴𝐴(cos � 2𝜋𝜋29.5
� (𝑑𝑑 − 𝑑𝑑𝑀𝑀𝑀𝑀𝑀𝑀))) (S6)
where b is the average reproductive output, A is the amplitude of the increase/decrease with lunar
day, and tMax is the lunar day when reproduction is maximal. We used a mixed-effects modeling
framework to select a variant of equation S6 to describe how reproduction varied among the
islands. We fit multiple versions of equation S6 to the data (e.g., with combinations of
parameters held constant across islands), and used AIC to select the most parsimonious model.
Reproduction also follows a seasonal cycle, and in the Bahamas, reproduction peaks in
the summer months (June-September; see Johnson and Hixon 2011). In this study, our estimates
of reproduction were for the summer months. Although these estimates were appropriate for
calculating connectivity, they may overestimate lifetime egg production because reproduction
diminishes during the wintertime. Estimates of lifetime reproduction were adjusted for
seasonality (see below).
Lifetime egg production
Lifetime egg production (LEP) was calculated by using the framework described in equation
S1. Functions describing growth and survival were used to generate lt. The growth function
(S3) was nested within the size-dependent survival function (S5) so that survival was a function
of age. The age schedule of reproduction (mt) was based on equation S6, with one modification.
To account for seasonal patterns of reproduction, we assumed that seasonal variation at all of our
study islands was similar to seasonal variation previously described for study populations near
Lee Stocking Island (Johnson and Hixon 2011). Reproduction was multiplied by a sinusoidal
function that was maximal (a value of 1) at time zero and minimal (0.575) at time = 182.5 (i.e.,
half a year after the peak recruitment season). The age-schedule of reproduction (mt) was
calculated as
𝑚𝑚𝑡𝑡 = 𝑓𝑓𝑡𝑡 �0.787 + 0.213 �cos�2𝜋𝜋365� �𝑑𝑑�� (S7)
where t is time (in days). For our calculations of LEP, day zero was set as a new moon in the
middle of summer. Although this decision was arbitrary, it is logical because most recruitment
occurs in the summer (Hixon et al. 2012). Choosing alternative starting points had negligible
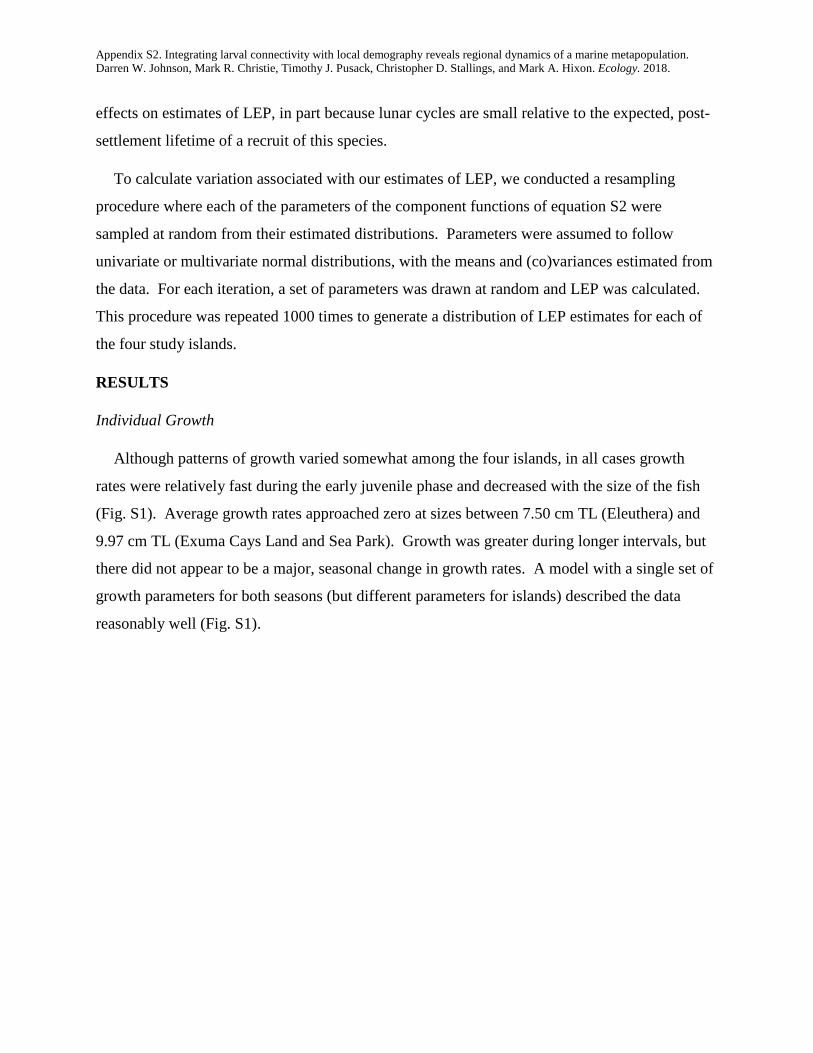
Appendix S2. Integrating larval connectivity with local demography reveals regional dynamics of a marine metapopulation. Darren W. Johnson, Mark R. Christie, Timothy J. Pusack, Christopher D. Stallings, and Mark A. Hixon. Ecology. 2018.
effects on estimates of LEP, in part because lunar cycles are small relative to the expected, post-
settlement lifetime of a recruit of this species.
To calculate variation associated with our estimates of LEP, we conducted a resampling
procedure where each of the parameters of the component functions of equation S2 were
sampled at random from their estimated distributions. Parameters were assumed to follow
univariate or multivariate normal distributions, with the means and (co)variances estimated from
the data. For each iteration, a set of parameters was drawn at random and LEP was calculated.
This procedure was repeated 1000 times to generate a distribution of LEP estimates for each of
the four study islands.
RESULTS
Individual Growth
Although patterns of growth varied somewhat among the four islands, in all cases growth
rates were relatively fast during the early juvenile phase and decreased with the size of the fish
(Fig. S1). Average growth rates approached zero at sizes between 7.50 cm TL (Eleuthera) and
9.97 cm TL (Exuma Cays Land and Sea Park). Growth was greater during longer intervals, but
there did not appear to be a major, seasonal change in growth rates. A model with a single set of
growth parameters for both seasons (but different parameters for islands) described the data
reasonably well (Fig. S1).
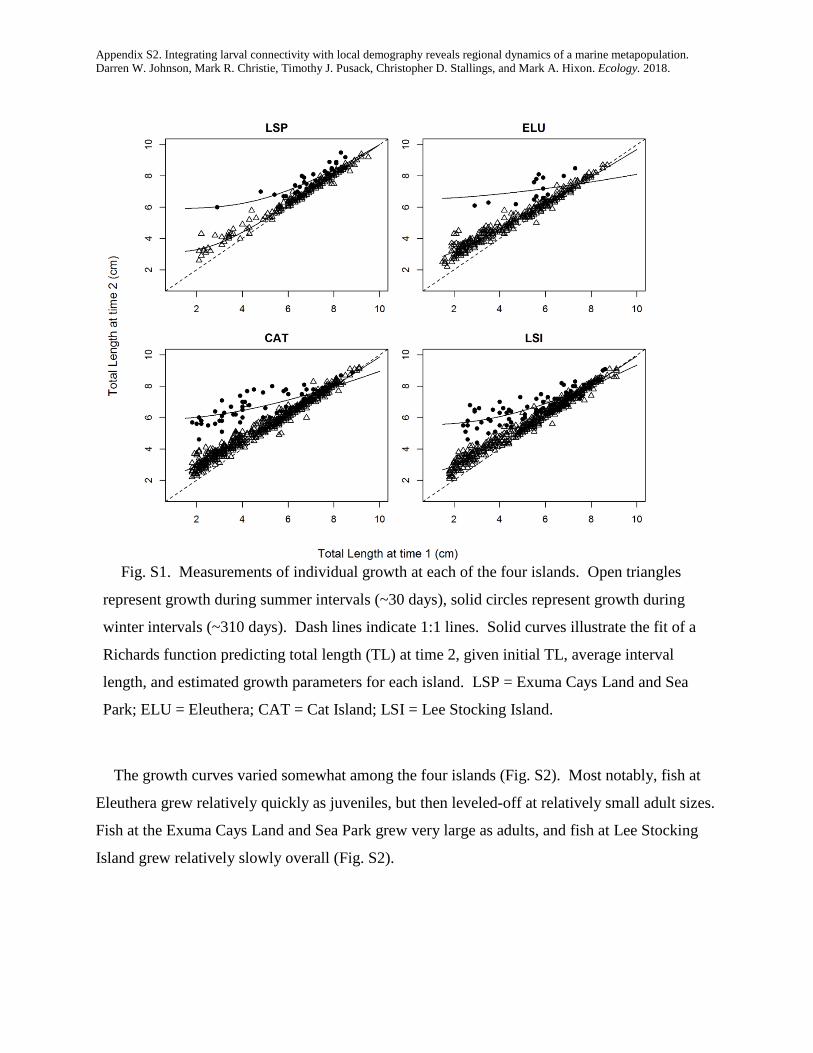
Appendix S2. Integrating larval connectivity with local demography reveals regional dynamics of a marine metapopulation. Darren W. Johnson, Mark R. Christie, Timothy J. Pusack, Christopher D. Stallings, and Mark A. Hixon. Ecology. 2018.
Fig. S1. Measurements of individual growth at each of the four islands. Open triangles
represent growth during summer intervals (~30 days), solid circles represent growth during
winter intervals (~310 days). Dash lines indicate 1:1 lines. Solid curves illustrate the fit of a
Richards function predicting total length (TL) at time 2, given initial TL, average interval
length, and estimated growth parameters for each island. LSP = Exuma Cays Land and Sea
Park; ELU = Eleuthera; CAT = Cat Island; LSI = Lee Stocking Island.
The growth curves varied somewhat among the four islands (Fig. S2). Most notably, fish at
Eleuthera grew relatively quickly as juveniles, but then leveled-off at relatively small adult sizes.
Fish at the Exuma Cays Land and Sea Park grew very large as adults, and fish at Lee Stocking
Island grew relatively slowly overall (Fig. S2).
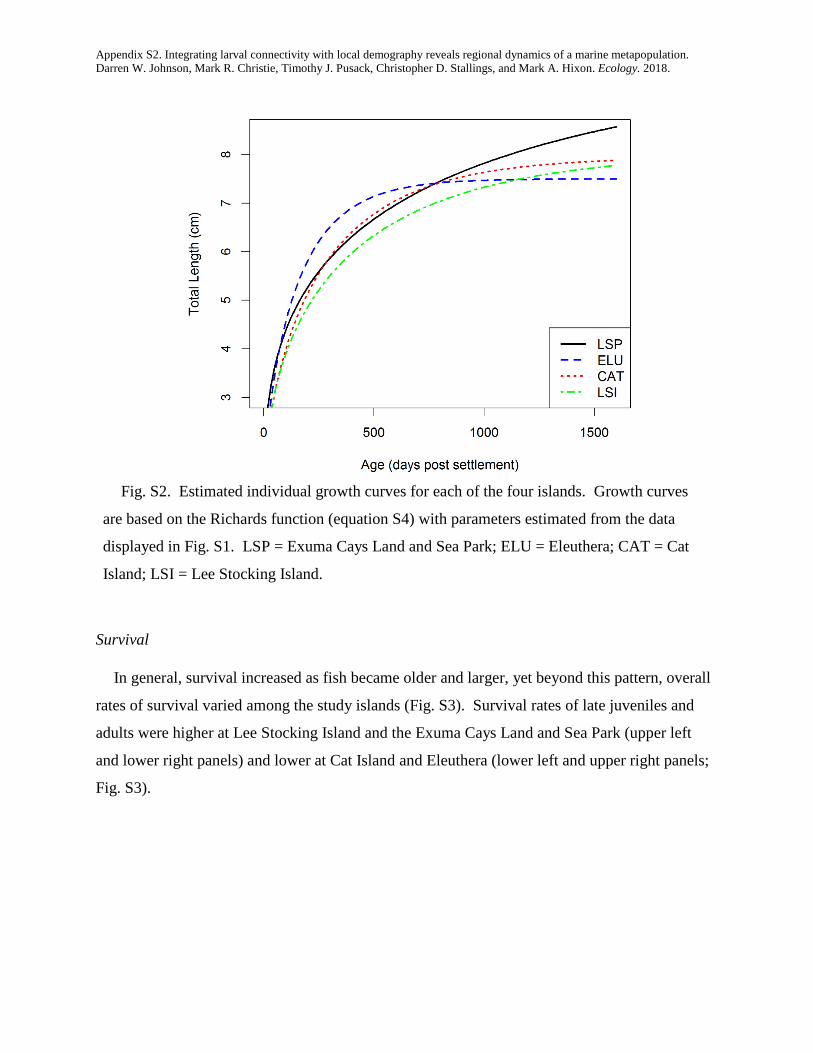
Appendix S2. Integrating larval connectivity with local demography reveals regional dynamics of a marine metapopulation. Darren W. Johnson, Mark R. Christie, Timothy J. Pusack, Christopher D. Stallings, and Mark A. Hixon. Ecology. 2018.
Fig. S2. Estimated individual growth curves for each of the four islands. Growth curves
are based on the Richards function (equation S4) with parameters estimated from the data
displayed in Fig. S1. LSP = Exuma Cays Land and Sea Park; ELU = Eleuthera; CAT = Cat
Island; LSI = Lee Stocking Island.
Survival
In general, survival increased as fish became older and larger, yet beyond this pattern, overall
rates of survival varied among the study islands (Fig. S3). Survival rates of late juveniles and
adults were higher at Lee Stocking Island and the Exuma Cays Land and Sea Park (upper left
and lower right panels) and lower at Cat Island and Eleuthera (lower left and upper right panels;
Fig. S3).
Appendix S2. Integrating larval connectivity with local demography reveals regional dynamics of a marine metapopulation. Darren W. Johnson, Mark R. Christie, Timothy J. Pusack, Christopher D. Stallings, and Mark A. Hixon. Ecology. 2018.
Fig. S3. Proportional survival over a 30-day period for each of the islands. Each dot
represents average survival within 1cm size bins. Solid curve indicates the expected,
proportional survival as a function of the size of fish. Dashed lines indicate 95% confidence
bands. LSP = Exuma Cays Land and Sea Park; ELU = Eleuthera; CAT = Cat Island; LSI =
Lee Stocking Island.
Reproduction
Per capita reproduction followed the lunar cycle, with a peak in reproduction occurring around
lunar day 21 (tMAX = 20.47; Fig. S4). A model in which the only the elevation of the curve (b)
varied among the islands provided the best fit to the data (Table S1). Although a model in which
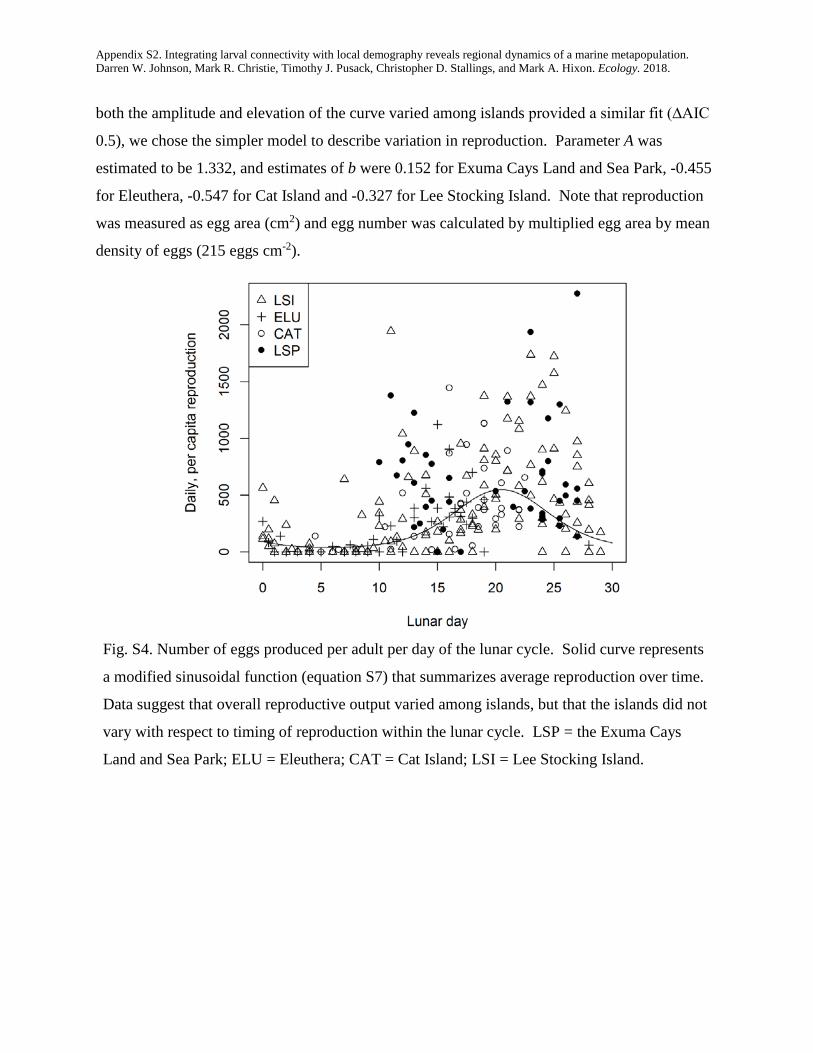
Appendix S2. Integrating larval connectivity with local demography reveals regional dynamics of a marine metapopulation. Darren W. Johnson, Mark R. Christie, Timothy J. Pusack, Christopher D. Stallings, and Mark A. Hixon. Ecology. 2018.
both the amplitude and elevation of the curve varied among islands provided a similar fit (∆AIC
0.5), we chose the simpler model to describe variation in reproduction. Parameter A was
estimated to be 1.332, and estimates of b were 0.152 for Exuma Cays Land and Sea Park, -0.455
for Eleuthera, -0.547 for Cat Island and -0.327 for Lee Stocking Island. Note that reproduction
was measured as egg area (cm2) and egg number was calculated by multiplied egg area by mean
density of eggs (215 eggs cm-2).
Fig. S4. Number of eggs produced per adult per day of the lunar cycle. Solid curve represents
a modified sinusoidal function (equation S7) that summarizes average reproduction over time.
Data suggest that overall reproductive output varied among islands, but that the islands did not
vary with respect to timing of reproduction within the lunar cycle. LSP = the Exuma Cays
Land and Sea Park; ELU = Eleuthera; CAT = Cat Island; LSI = Lee Stocking Island.
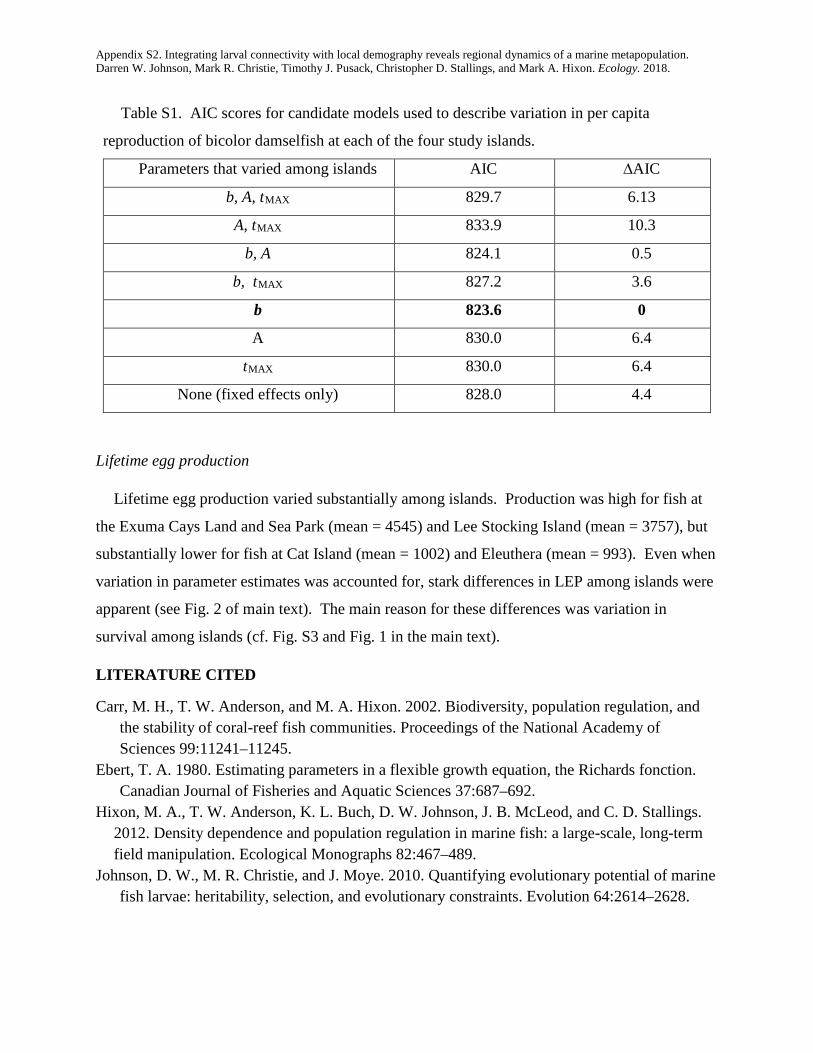
Appendix S2. Integrating larval connectivity with local demography reveals regional dynamics of a marine metapopulation. Darren W. Johnson, Mark R. Christie, Timothy J. Pusack, Christopher D. Stallings, and Mark A. Hixon. Ecology. 2018.
Table S1. AIC scores for candidate models used to describe variation in per capita
reproduction of bicolor damselfish at each of the four study islands.
Parameters that varied among islands AIC ∆AIC
b, A, tMAX 829.7 6.13
A, tMAX 833.9 10.3
b, A 824.1 0.5
b, tMAX 827.2 3.6
b 823.6 0
A 830.0 6.4
tMAX 830.0 6.4
None (fixed effects only) 828.0 4.4
Lifetime egg production
Lifetime egg production varied substantially among islands. Production was high for fish at
the Exuma Cays Land and Sea Park (mean = 4545) and Lee Stocking Island (mean = 3757), but
substantially lower for fish at Cat Island (mean = 1002) and Eleuthera (mean = 993). Even when
variation in parameter estimates was accounted for, stark differences in LEP among islands were
apparent (see Fig. 2 of main text). The main reason for these differences was variation in
survival among islands (cf. Fig. S3 and Fig. 1 in the main text).
LITERATURE CITED
Carr, M. H., T. W. Anderson, and M. A. Hixon. 2002. Biodiversity, population regulation, and the stability of coral-reef fish communities. Proceedings of the National Academy of Sciences 99:11241–11245.
Ebert, T. A. 1980. Estimating parameters in a flexible growth equation, the Richards fonction. Canadian Journal of Fisheries and Aquatic Sciences 37:687–692.
Hixon, M. A., T. W. Anderson, K. L. Buch, D. W. Johnson, J. B. McLeod, and C. D. Stallings. 2012. Density dependence and population regulation in marine fish: a large-scale, long-term field manipulation. Ecological Monographs 82:467–489.
Johnson, D. W., M. R. Christie, and J. Moye. 2010. Quantifying evolutionary potential of marine fish larvae: heritability, selection, and evolutionary constraints. Evolution 64:2614–2628.

Appendix S2. Integrating larval connectivity with local demography reveals regional dynamics of a marine metapopulation. Darren W. Johnson, Mark R. Christie, Timothy J. Pusack, Christopher D. Stallings, and Mark A. Hixon. Ecology. 2018.
Johnson, D. W., and M. A. Hixon. 2011. Sexual and lifetime selection on body size in a marine
fish: the importance of life-history trade-offs. Journal of Evolutionary Biology 24:1653–1663.
Knapp, R. A. 1993. The influence of egg survivorship on the subsequent nest fidelity of female bicolour damselfish, Stegastes partitus. Animal Behaviour 46:111–121.
Knapp, R. A., and J. T. Kovach. 1991. Courtship as an honest indicator of male parental quality in the bicolor damselfish, Stegastes partitus. Behavioral Ecology 2:295–300.
Schmale, M. C. 1981. Sexual selection and reproductive success in males of the bicolor damselfish, Eupomacentrus partitus (Pisces: Pomacentridae). Animal Behaviour 29:1172–1184.
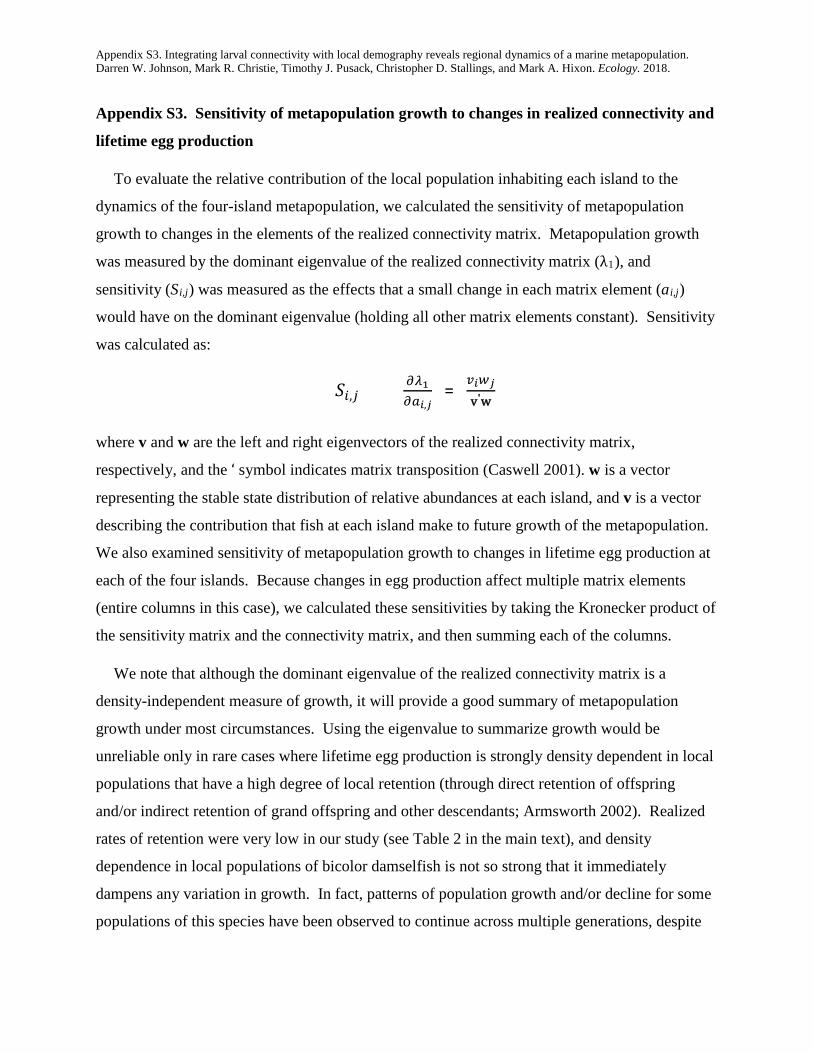
Appendix S3. Integrating larval connectivity with local demography reveals regional dynamics of a marine metapopulation. Darren W. Johnson, Mark R. Christie, Timothy J. Pusack, Christopher D. Stallings, and Mark A. Hixon. Ecology. 2018.
Appendix S3. Sensitivity of metapopulation growth to changes in realized connectivity and
lifetime egg production
To evaluate the relative contribution of the local population inhabiting each island to the
dynamics of the four-island metapopulation, we calculated the sensitivity of metapopulation
growth to changes in the elements of the realized connectivity matrix. Metapopulation growth
was measured by the dominant eigenvalue of the realized connectivity matrix (λ1), and
sensitivity (Si,j) was measured as the effects that a small change in each matrix element (ai,j)
would have on the dominant eigenvalue (holding all other matrix elements constant). Sensitivity
was calculated as:
𝑆𝑆𝑖𝑖,𝑗𝑗 = 𝜕𝜕𝜆𝜆1𝜕𝜕𝑎𝑎𝑖𝑖,𝑗𝑗
= 𝑣𝑣𝑖𝑖𝑤𝑤𝑗𝑗
v'w
where v and w are the left and right eigenvectors of the realized connectivity matrix,
respectively, and the ‘ symbol indicates matrix transposition (Caswell 2001). w is a vector
representing the stable state distribution of relative abundances at each island, and v is a vector
describing the contribution that fish at each island make to future growth of the metapopulation.
We also examined sensitivity of metapopulation growth to changes in lifetime egg production at
each of the four islands. Because changes in egg production affect multiple matrix elements
(entire columns in this case), we calculated these sensitivities by taking the Kronecker product of
the sensitivity matrix and the connectivity matrix, and then summing each of the columns.
We note that although the dominant eigenvalue of the realized connectivity matrix is a
density-independent measure of growth, it will provide a good summary of metapopulation
growth under most circumstances. Using the eigenvalue to summarize growth would be
unreliable only in rare cases where lifetime egg production is strongly density dependent in local
populations that have a high degree of local retention (through direct retention of offspring
and/or indirect retention of grand offspring and other descendants; Armsworth 2002). Realized
rates of retention were very low in our study (see Table 2 in the main text), and density
dependence in local populations of bicolor damselfish is not so strong that it immediately
dampens any variation in growth. In fact, patterns of population growth and/or decline for some
populations of this species have been observed to continue across multiple generations, despite
Appendix S3. Integrating larval connectivity with local demography reveals regional dynamics of a marine metapopulation. Darren W. Johnson, Mark R. Christie, Timothy J. Pusack, Christopher D. Stallings, and Mark A. Hixon. Ecology. 2018.
clear patterns of density dependence in demographic rates such as survival to maturation and per-
capita fecundity (Hixon et al. 2012). It is important to note that density dependence is not
incompatible with sustained patterns of population growth or decline. Moderate levels of density
dependence will typically restrict, rather than prevent growth variation (reviewed by Caley et al.
1996). Under such circumstances, and especially when rates of local retention are low (as they
are in our study), the dominant eigenvalue of the realized connectivity matrix can provide an
accurate summary of metapopulation growth (Armsworth 2002).
LITERATURE CITED
Armsworth, P. R. 2002. Recruitment limitation, population regulation, and larval connectivity in reef fish metapopulations. Ecology 83:1092–1104.
Caley M.J., Carr, M. H., Hixon, M.A., Hughes, T.P., Jones, G.P., and Menge, B.A. 1996. Recruitment and the local dynamics of open marine populations. Annual Review of Ecology and Systematics. 27:477-500.
Caswell, H. 2001. Matrix population models: construction, analysis, and interpretation. Sinauer Associates, Inc. Sunderland, MA, USA. 722p.
Hixon, M. A., T. W. Anderson, K. L. Buch, D. W. Johnson, J. B. McLeod, and C. D. Stallings. 2012. Density dependence and population regulation in marine fish: a large-scale, long-term field manipulation. Ecological Monographs 82:467–489.