integrating mitigation and adaptation as complementary tools in reducing the risk of climate change...
Post on 21-Dec-2015
219 views
TRANSCRIPT

Integrating Mitigation and Adaptation as Complementary Tools in Reducing
the Risk of Climate Change
Gary Yohe
June 24, 2004
International Energy Workshop
Paris

Outline of Remarks
• Reflections from the TAR• Perspectives on a risk-based approach to
integration• Incorporating the results of mitigation into
adaptation analyses, and visa-versa• New uncertainties in climate sensitivity• Robustness in near-term mitigation policy

A Perspective from the TAR
• Climate related damages that can be avoided by mitigation are the benefits of that mitigation
• Credible calculations of the benefits of mitigation must therefore recognize the potential that adaptation (autonomous and planned) could reduce damages and therefore the benefits of mitigation.

Support for that Approach
The environmental economics literature – optimal intervention assumes efficient evasive activity
The finance literature – calculates risk premia net of diversifiable risk thereby assuming efficient diversification

More from the TAR
• Adaptation may or may not reduce damages significantly
– SLR examples from developed coastlines (the US developed coastline work of Yohe shows significant cost savings from adaptation; corroboration in subsequent global coverage by Nichols and friends)
– SLR examples from low-lying islands (Atoll states work by Adger shows abandonment only option to SLR, but earlier significant stress from other sources)

Including Adaptation can be Critical
• It follows that adaptation cannot be ignored in any credible calculation of the benefit side of mitigation
– It passes the Lave test (factor of two)– But we are not sure where, when and how.
Fundamental Conclusions from Chapter 18
• “Current knowledge of adaptation and adaptive capacity is insufficient for reliable prediction of adaptations; it is also insufficient for rigorous evaluation of planned adaptation options, measures and policies of governments” (pg 880 or WGII Report)
• Vulnerability is a function of exposure and sensitivity; and both can be influenced by adaptive capacity
• All of these are path dependent and site specific

A Potentially Unsettling Conclusion
• Asking for estimates of the economic value of mitigation might be wrong question.
• Thinking about mitigation in the context of a cost-benefit framework might be the wrong approach
…….at least for a while….
A Risk-based Approach that Accommodates the Synthesis of Impacts cum Adaptation with
Mitigation Targets
• Thinking about both mitigation and adaptation as tools to reduce the risk of troublesome, intolerable, etc…. climate change makes them complements rather than substitutes.
• Mitigation is then a means of hedging against bad outcomes measured, net of adaptation, in terms of the likelihood of crossing critical thresholds.
• Adaptation is then a means by which systems can expand their coping ranges or delay their contraction.

An Artificial Illustration – The Baseline
0
20
40
60
80
100
120
140
160
0 10 20 30 40 50
Period
Clim
ate
Vari
able

An Artificial Illustration:Adding Adaptation Alone
0
20
40
60
80
100
120
140
160
0 10 20 30 40 50
Period
Clim
ate
Varia
ble

An Artificial Illustration:Adding Mitigation Alone
0
20
40
60
80
100
120
140
160
0 10 20 30 40 50
Period
Clim
ate
Varia
ble

An Artificial Illustration:Adding Mitigation with Adaptation
0
20
40
60
80
100
120
140
160
0 10 20 30 40 50
Period
Clim
ate
Varia
ble

The Cost Side
• The cost side of mitigation (thought of as a risk-reducing tool whose outputs are measured in terms of a vector of impacts) is one of cost-effectiveness; i.e., minimizing the cost of achieving certain objectives.
• The cost side of adaptation (thought of as a risk-reducing tools whose outputs are measured in terms of the likelihood of crossing thresholds) is one of opportunity cost informed by understanding how the determinants of adaptive capacity help or impede adaptation.

Decision-makers’ Context
• Their job is to assess the relative opportunity costs of achieving specific risk reductions.
• Double causality is required to assess the effectiveness of mitigation.
• Single causality is sufficient to assess adaptation; but not in a synthetic approach.
• Uncertainty becomes the reason for contemplating policy rather than the reason for contemplating delay.

Can Science Support this Approach?
• Recent MIT work (Webster, et. al., “Uncertainty Analysis on Climate Change and Research Policy Response”, Climatic Change, 2003) produces distributions of temperature change associated with a specific concentration threshold and translates that into SLR possibilities (at least for 2100, but could produce transcients).

More Support
• Recent Schneider work (See OECD Workshop on the Benefits of Climate Policy and forthcoming special issue of Global Environmental Change) produces distributions of an extreme event (THC shutdown) conditional on – natural variables (climate sensitivity, etc…)– policy-related variables (the discount rate in an
otherwise informed optimization exercise).
Even More Support
• Roger Jones (See OECD Workshop on the Benefits of Climate Policy and forthcoming special issue of Global Environmental Change) : links site specific thresholds to adaptation and climate variables– SLR illustration with the likelihood of crossing critical
thresholds at specific years– Episodes of coral bleaching and mortality with the
likelihood of crossing critical ocean temperature thresholds at specific years

Some Profound UncertaintyDistributions of Climate Sensitivity
0
10
20
30
40
50
60
70
80
90
100
0 2 4 6 8 10
Andronova &Schlesinger(2001)
this paper
Cu
mu
lati
ve d
en
sit
y f
un
cti
on
, %
Climate sensitivity, oC
An Example: How Near-term Policy Could be Examined as a Risk-reducing Tool
• The starting point – the CDF of climate sensitivity.• The question – What does the expanding uncertainty
mean for near term mitigation?• The method – Envision hedging experiments a la the
EMF experiments– Begin policy in 2005– Uncertainty and ultimate temperature target revealed
in 2035– Associated least cost adjustment

The Example continues
• The model – a revised DICE global model– Zero pure rate of time preference – low discount rate– Logarithmic utility in per capita consumption– Limit on the rate of decarbonization– Policy as a carbon tax (scarcity rent) that increases
over time at the endogenously determined private rate of interest (mitigation is an investment)
• Calibrate the CDF on climate sensitivity to a discrete representation in terms of a parameter that reflects the inverse of the thermal capacity of the atmospheric layer and the upper ocean.

An Alternative Representation From DICE-99
0
1
2
3
4
5
6
7
8
9
2000 2050 2100 2150 2200 2250 2300 2350
Year
Tem
per
atur
e In
crea
se
Sin
ce
19
00
1.5 degrees
2 degrees
3 degrees
4 degrees
5 degrees
6 degrees
7 degrees
8 degrees
9 degrees

The Example continues
• Hedging strategies are evaluated in terms of robustness – the range of futures that they can handle with “reasonable” adjustment costs.
• Hedging is also evaluated in terms of “keeping doors open” – temperature targets that are still possible.
• The critical comparison is between a favored hedging strategy and doing nothing between 2005 and 2035.

The Temperature Target Experiment
• Set near-term policy assuming that temperature and climate sensitivity will be revealed in 2035.
• Choices for the near-term are expressed in terms of a initial carbon tax.
• An initial global tax of $10 per ton of carbon maximizes expected global GDP– Targets of 2, 2.5, 3, and 3.5 degrees are assumed to
be equally likely choices in 2035– Climate sensitivity according to the CDF

Expected GDP Across Near-Term Options
14243.69
14243.7
14243.71
14243.72
14243.73
14243.74
14243.75
14243.76
14243.77
0 5 10 15 20 25 30 35
Initial Tax
Exp
ecte
d D
isco
un
ted
GD
P (
trill
ion
s o
f 19
95$)

An Example – Hedging (?) to Meet a 3 Degree Target in a 6 Degree Sensitivity World
0
50
100
150
200
250
300
350
400
450
2000 2020 2040 2060
Year
Ca
rbo
n T
ax
($
pe
r to
n)
Deterministic
$10 Initial Tax
$0 Initial Tax
More on the Example – Hedging to Meet a 3 Degree Target in a 6 Degree Sensitivity World
6.00
7.00
8.00
9.00
10.00
11.00
2000 2020 2040 2060 2080
Year
Emis
sio
ns
(gT
Ca
rbo
n E
qui
vale
nt)
Deterministic
$10 Initial Tax
$0 Initial Tax
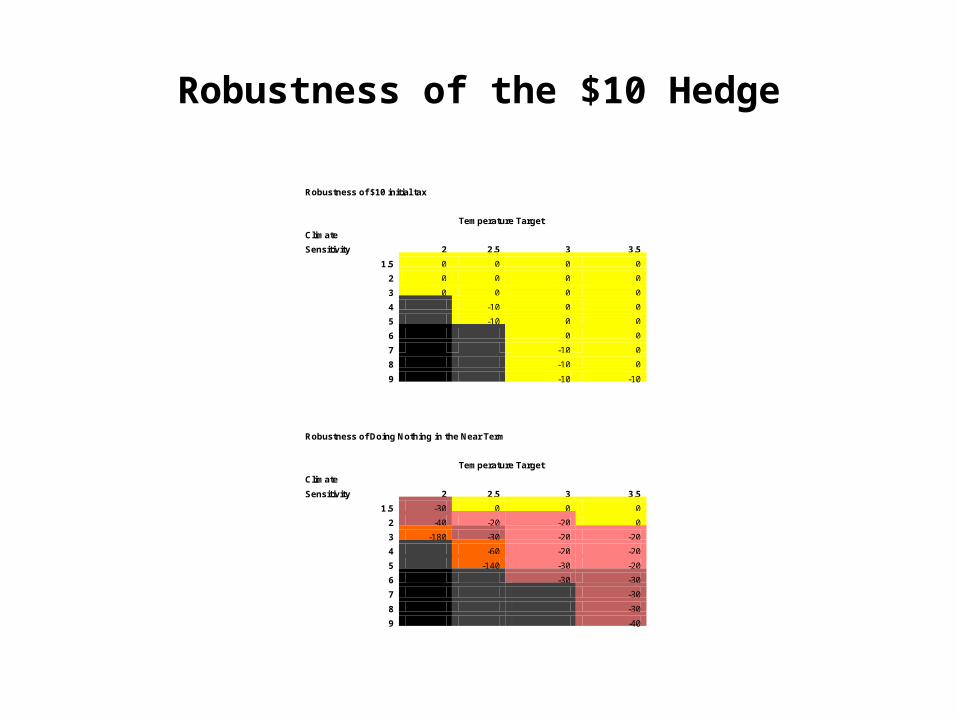
Robustness of the $10 Hedge
Robustness of $10 initial tax
Temperature Target
Climate
Sensitivity 2 2.5 3 3.5
1.5 0 0 0 0
2 0 0 0 0
3 0 0 0 0
4 -10 0 0
5 -10 0 0
6 0 0
7 -10 0
8 -10 0
9 -10 -10
Robustness of Doing Nothing in the Near Term
Temperature Target
Climate
Sensitivity 2 2.5 3 3.5
1.5 -30 0 0 0
2 -40 -20 -20 0
3 -180 -30 -20 -20
4 -60 -20 -20
5 -140 -30 -20
6 -30 -30
7 -30
8 -30
9 -40

Implications for the Near-Term
• Near-term hedging to reduce adjustment costs associated with temperature targets is modest and robust.
• Even if it is decided that no mitigation should be undertaken after adjustment, the economic effects involve small costs for low sensitivities and larger benefits for high sensitivities.

So
• It is possible to use uncertainty to assess policy analyses and come to policy relevant conclusions about confidence without being policy prescriptive.
• And it follows that we can explore the implications of applying one decision framework rather than another in the policy evaluation process. In a cost-benefit context, adaptation and mitigation are substitutes. In a risk-reducing context, they are complements.