integrating quality measures into ehrs: available tools and lessons learned november 17, 2010
TRANSCRIPT

Integrating Quality Measures into EHRs:
Available Tools and Lessons Learned
November 17, 2010

04/19/23 2
• Quality reporting requirements in the Final Rule
– Hospitals have 15 mandatory quality measures
• 2 ED throughput measures
• 7 stroke measures
• 6 VTE measures
– Eligible professionals have 3 required core measures and 3 additional measures selected from a menu of 38
• Core measures include: hypertension measurement, tobacco use and intervention, and adult weight management
• Alternative core measures include weight management in children, flu shots for patients over 50 and childhood immunizations
• The final rule reinforced the requirement that all data must be in structured format, all requirements must be met using certified EHR technology, and that the rules apply to all patients, not just Medicare and Medicaid patient.
Meaningful Use Summary

04/19/23 3
Why This Journey to be a Data Driven Organization?
• It is not the computer itself that has value, – but the access to information, – the ability to track and avoid errors, – the speed and reliability in finding what we need, in
making decisions, and in implementing care without error or delay.
• Computers let us achieve a level of quality care that we could never achieve without them.
QUALITY
QUALITY
Data Driven Healthcare Organization

04/19/23 4
Data is Used to Assess Needs, Drive Interventions and Report Performance in a Closed-loop Continuous Improvement Model
Clinical, Operational or Research Goals
Data Acquisition Data Integration Data Analysis
Establish Standards of Care
Screen and Identify Patients
Provide Data-Driven Support
to Clinicians
Measure Quality, Outcomes and
CostsReport Results
GO
AL
SA
NA
LY
SIS
INT
ER
VE
NT
ION
RE
PO
RT
ING
Data Driven Healthcare Organization
04/19/23 5
What is the Current State of Your Data?
• What do we currently measure?
• How do we measure it?
• Why do we measure it?
• Does a data dictionary exist for all data elements?
• What is the current state of our data and it’s integrity?
• Does existing workflow support data collection requirements and outcome objectives?
Getting Started

04/19/23 6
Laying the Foundation
• Data Use Models — Information needs must be focused on solving identified problems across the organization
• Data Governance — Establish data owners/stewards and processes for making data related decisions
• Data Quality — Determine how data quality will be measured and how quality issues will be remediated. Data quality criteria needs to be set for each data field of interest. Is the data valid? eg. Indicate preliminary and final on lab tests. Does the data make sense?
• Data Standards — Organizational decisions on data definitions, medical vocabularies and naming conventions must be made early and consistently enforced
Getting Started

04/19/23 7
Data Driven Use Models
Clinical Intelligence
Operational Intelligence
Financial Intelligence
Research and Surveillance
Retrospective
Prospective
Predictive
• Quality/Outcomes Management• High-Risk/Cost Case
Management• Adverse Event Detection• Infection Control• Compliance Reporting• Drug Utilization Reviews
• Capacity Planning and Management
• Patient Flow Management (ED and Inpatient)
• Resource Utilization• Patient Scheduling/Access
• Patient Cost Analysis• Service Line Analysis• Procedure Cost Analysis• Referral Analysis• Revenue Cycle Analysis
and Coding Optimization• Market Analysis
• Health Services Research• Comparative Effectiveness• Drug Outcomes Research• Drug Safety Surveillance• Disease Surveillance• Patient Recruitment
Components of a Data Driven Healthcare Organization

04/19/23 8
Are You Set Up to Manage Data?
• Do medical staff bylaws and policies support outcome objectives?
• What tools are available to collect aggregate data?
• Does the reappointment process support review of data at the individual physician level (how do I compare to my peers?)
• Do we have IT tools to support the amount of data to be collected?(SQL db, Business Objects)
• Do we have the IT tools to distribute data in a meaningful format?(physician report cards)
• Does a committee structure exist to guide us through this journey?
Components of a Data Driven Healthcare Organization
04/19/23 9
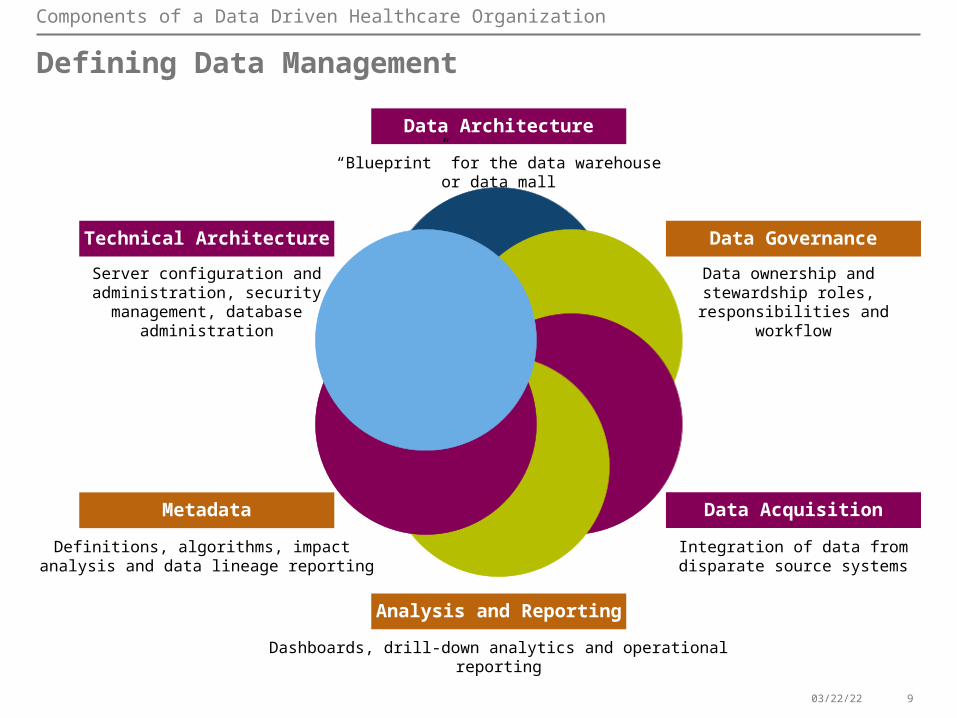
Defining Data Management
Data Architecture
Data Governance
Data Acquisition
Analysis and Reporting
Metadata
Technical Architecture
Server configuration and administration, security management, database
administration
“Blueprint” for the data warehouse or data mall
Integration of data from disparate source systems
Definitions, algorithms, impact analysis and data lineage reporting
Data ownership and stewardship roles,
responsibilities and workflow
Dashboards, drill-down analytics and operational reporting
Components of a Data Driven Healthcare Organization
04/19/23 10
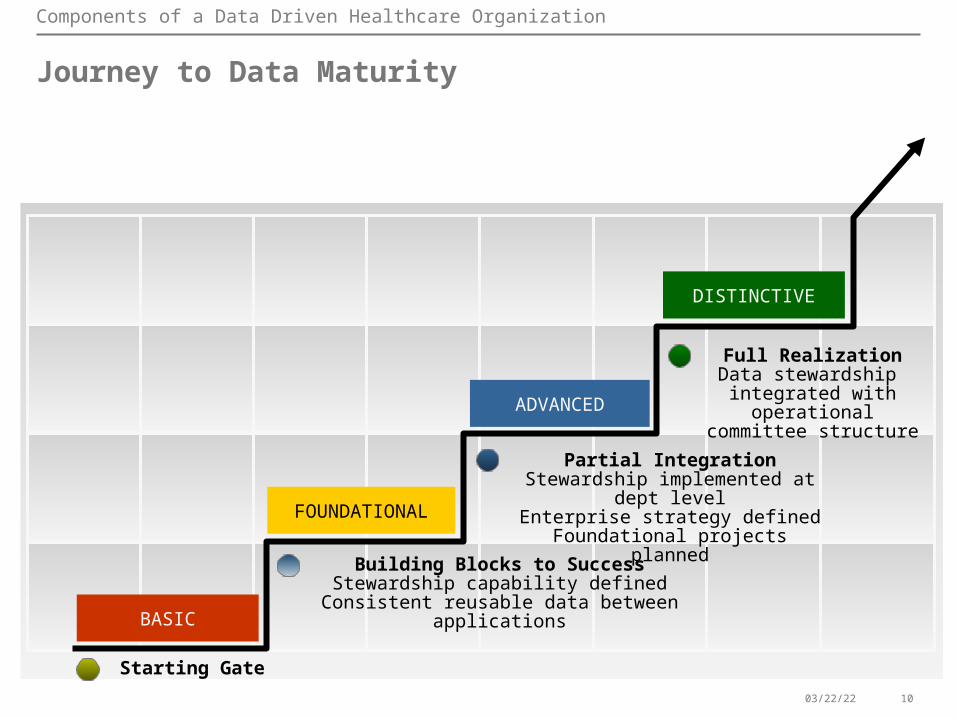
Journey to Data Maturity
Full RealizationData stewardship
integrated with operational committee structure
Partial IntegrationStewardship implemented at dept level
Enterprise strategy definedFoundational projects planned
Building Blocks to SuccessStewardship capability defined
Consistent reusable data between applications
Starting Gate
DISTINCTIVE
ADVANCED
FOUNDATIONAL
BASIC
Components of a Data Driven Healthcare Organization

04/19/23 11
Governance Challenge
Leadership
Project Committees
Project Sponsors
Policy Groups
InformationServices
VisionVision
StrategyStrategy
AccountabilityAccountability OversightOversight
IntegratedGovernance
Model
PrioritizationPrioritization
Components of a Data Driven Healthcare Organization
04/19/23 12
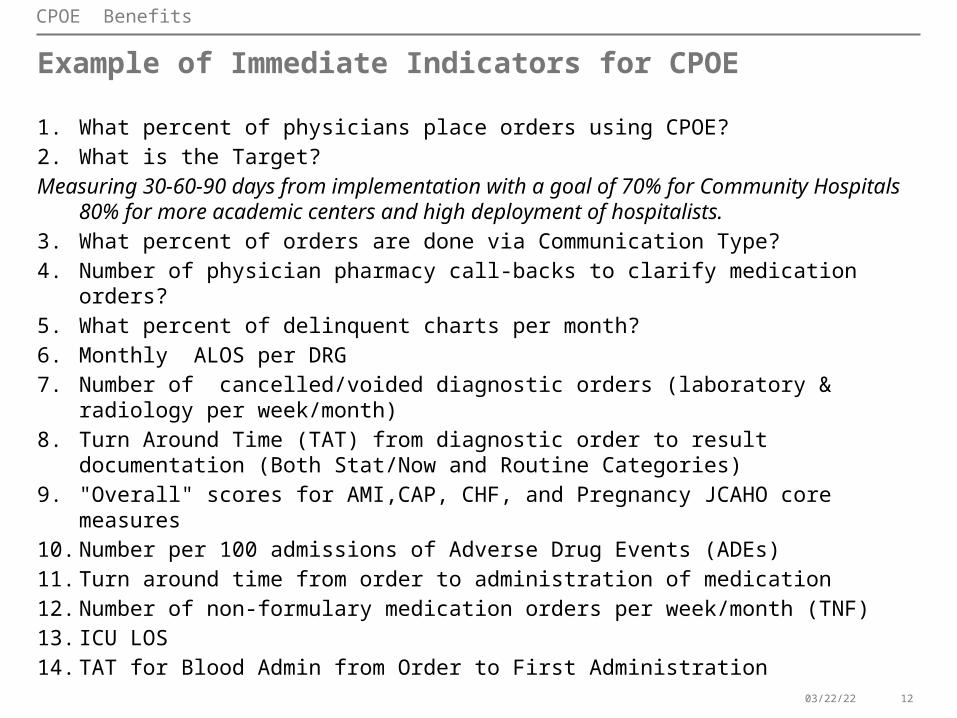
Example of Immediate Indicators for CPOE
CPOE Benefits
1. What percent of physicians place orders using CPOE?2. What is the Target?Measuring 30-60-90 days from implementation with a goal of 70% for Community Hospitals
80% for more academic centers and high deployment of hospitalists.3. What percent of orders are done via Communication Type?4. Number of physician pharmacy call-backs to clarify medication orders?5. What percent of delinquent charts per month? 6. Monthly ALOS per DRG 7. Number of cancelled/voided diagnostic orders (laboratory & radiology per week/month) 8. Turn Around Time (TAT) from diagnostic order to result documentation (Both Stat/Now
and Routine Categories) 9. "Overall" scores for AMI,CAP, CHF, and Pregnancy JCAHO core measures10. Number per 100 admissions of Adverse Drug Events (ADEs) 11. Turn around time from order to administration of medication12. Number of non-formulary medication orders per week/month (TNF) 13. ICU LOS 14. TAT for Blood Admin from Order to First Administration

04/19/23 13
Example of Long Term Indicators for CPOE
CPOE Benefits
1. Total cost per discharge (for DRGs of interest)2. Use of peer-reviewed Order Sets (pathways and protocols) Physician and Nursing3. Number of unexpected admission/ readmission to higher level of care per
week/month 4. Number of Ventilator Days /ICU stay5. Number of Dietary Order Clarifications6. Orders within a Care Plan7. % of patients receiving Electronic Prescriptions ED8. % of ED Physicians using Electronic Prescriptions9. Reason for Radiology Exam Completed (Compare only the pre to post conversion
statistics)10. Appropriate Reason for Exam (When field is changed to reflect another choice)11. Reason for Consult Given (Free Text Field Use — Y or N)12. Total cost per discharge (for DRGs of interest)13. Use of peer-reviewed Order Sets (pathways and protocols) Physician and Nursing14. Number of unexpected admission/readmission to higher level of care per
week/month

04/19/23 14
Indentify Baseline Data
• Determine what current data elements can be collected and utilized as baseline data
• Baseline data must be used to determine benefits and return on investment
CPOE Benefits
04/19/23 15
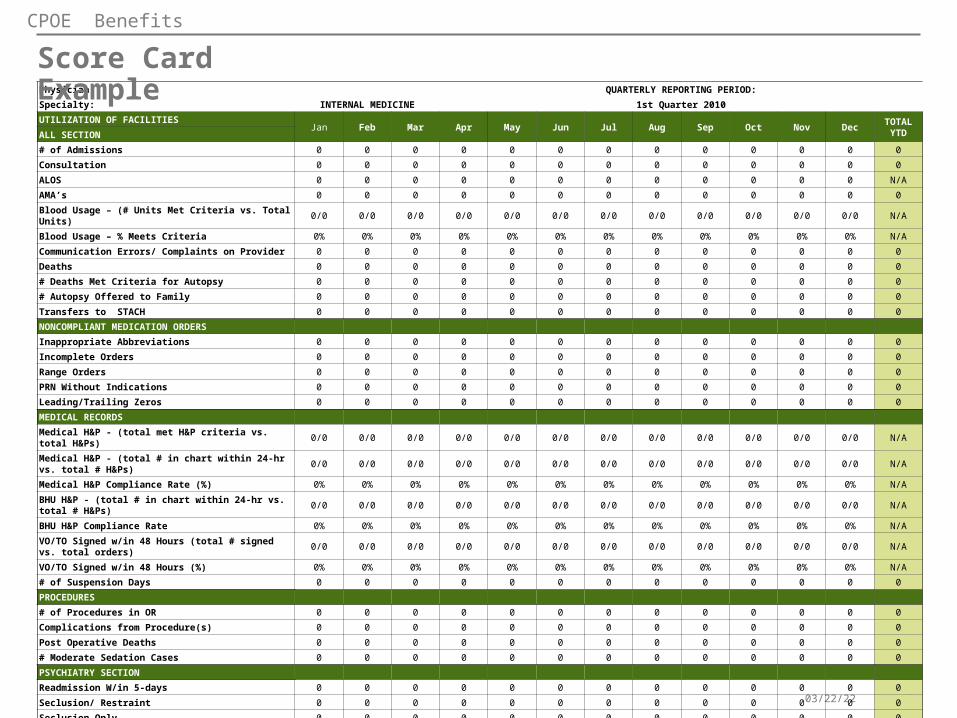
Physician: QUARTERLY REPORTING PERIOD:
Specialty: INTERNAL MEDICINE 1st Quarter 2010
UTILIZATION OF FACILITIESJan Feb Mar Apr May Jun Jul Aug Sep Oct Nov Dec
TOTAL YTDALL SECTION
# of Admissions 0 0 0 0 0 0 0 0 0 0 0 0 0
Consultation 0 0 0 0 0 0 0 0 0 0 0 0 0
ALOS 0 0 0 0 0 0 0 0 0 0 0 0 N/A
AMA’s 0 0 0 0 0 0 0 0 0 0 0 0 0
Blood Usage – (# Units Met Criteria vs. Total Units) 0/0 0/0 0/0 0/0 0/0 0/0 0/0 0/0 0/0 0/0 0/0 0/0 N/A
Blood Usage – % Meets Criteria 0% 0% 0% 0% 0% 0% 0% 0% 0% 0% 0% 0% N/A
Communication Errors/ Complaints on Provider 0 0 0 0 0 0 0 0 0 0 0 0 0
Deaths 0 0 0 0 0 0 0 0 0 0 0 0 0
# Deaths Met Criteria for Autopsy 0 0 0 0 0 0 0 0 0 0 0 0 0
# Autopsy Offered to Family 0 0 0 0 0 0 0 0 0 0 0 0 0
Transfers to STACH 0 0 0 0 0 0 0 0 0 0 0 0 0
NONCOMPLIANT MEDICATION ORDERS
Inappropriate Abbreviations 0 0 0 0 0 0 0 0 0 0 0 0 0
Incomplete Orders 0 0 0 0 0 0 0 0 0 0 0 0 0
Range Orders 0 0 0 0 0 0 0 0 0 0 0 0 0
PRN Without Indications 0 0 0 0 0 0 0 0 0 0 0 0 0
Leading/Trailing Zeros 0 0 0 0 0 0 0 0 0 0 0 0 0
MEDICAL RECORDS
Medical H&P - (total met H&P criteria vs. total H&Ps) 0/0 0/0 0/0 0/0 0/0 0/0 0/0 0/0 0/0 0/0 0/0 0/0 N/A
Medical H&P - (total # in chart within 24-hr vs. total # H&Ps)
0/0 0/0 0/0 0/0 0/0 0/0 0/0 0/0 0/0 0/0 0/0 0/0 N/A
Medical H&P Compliance Rate (%) 0% 0% 0% 0% 0% 0% 0% 0% 0% 0% 0% 0% N/A
BHU H&P - (total # in chart within 24-hr vs. total # H&Ps) 0/0 0/0 0/0 0/0 0/0 0/0 0/0 0/0 0/0 0/0 0/0 0/0 N/A
BHU H&P Compliance Rate 0% 0% 0% 0% 0% 0% 0% 0% 0% 0% 0% 0% N/A
VO/TO Signed w/in 48 Hours (total # signed vs. total orders)
0/0 0/0 0/0 0/0 0/0 0/0 0/0 0/0 0/0 0/0 0/0 0/0 N/A
VO/TO Signed w/in 48 Hours (%) 0% 0% 0% 0% 0% 0% 0% 0% 0% 0% 0% 0% N/A
# of Suspension Days 0 0 0 0 0 0 0 0 0 0 0 0 0
PROCEDURES
# of Procedures in OR 0 0 0 0 0 0 0 0 0 0 0 0 0
Complications from Procedure(s) 0 0 0 0 0 0 0 0 0 0 0 0 0
Post Operative Deaths 0 0 0 0 0 0 0 0 0 0 0 0 0
# Moderate Sedation Cases 0 0 0 0 0 0 0 0 0 0 0 0 0
PSYCHIATRY SECTION
Readmission W/in 5-days 0 0 0 0 0 0 0 0 0 0 0 0 0
Seclusion/ Restraint 0 0 0 0 0 0 0 0 0 0 0 0 0
Seclusion Only 0 0 0 0 0 0 0 0 0 0 0 0 0
Self-Inflicted Injury/Suicide Attempt Requiring Treatment 0 0 0 0 0 0 0 0 0 0 0 0 0
Score Card Example
CPOE Benefits
04/19/23 16
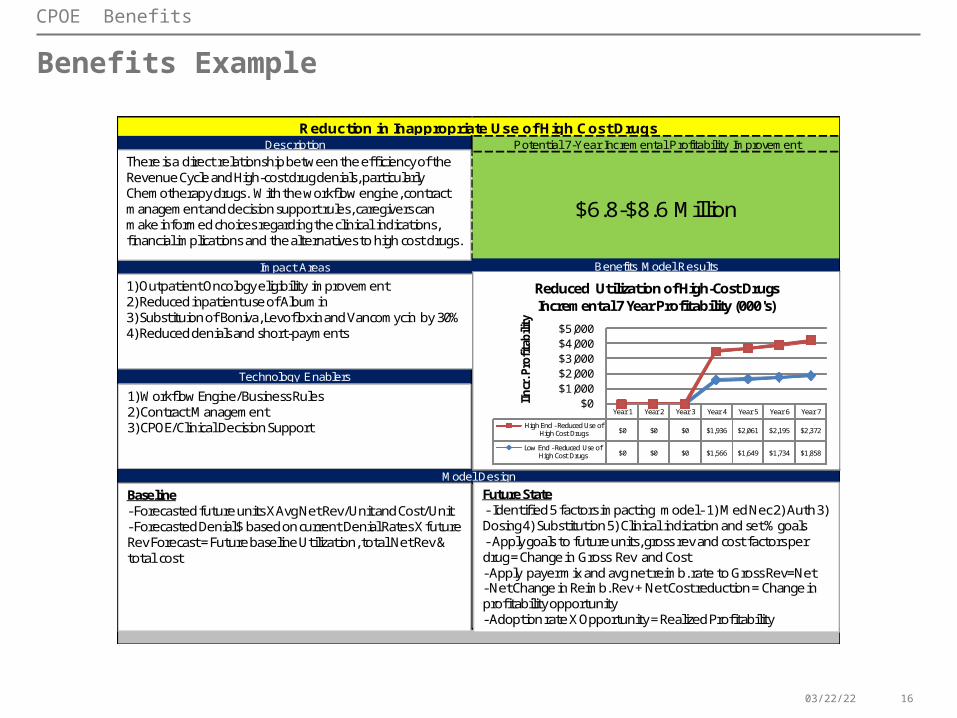
Benefits Example
Description Potential 7-Year Incremental Profitability Improvement
Impact Areas Benefits Model Results
Technology Enablers
Model Design
Reduction in Inappropriate Use of High Cost Drugs
$6.8-$8.6 Million
There is a direct relationship between the efficiency of the Revenue Cycle and High-cost drug denials, particularly Chemotherapy drugs. With the workflow engine, contract management and decision support rules, caregivers can make informed choices regarding the clinical indications, financial implications and the alternatives to high cost drugs.
1) Outpatient Oncology eligibility improvement2) Reduced inpatient use of Albumin3) Substituion of Boniva, Levofloxin and Vancomycin by 30%4) Reduced denials and short-payments
1) Workflow Engine/Business Rules2) Contract Management3) CPOE/Clinical Decision Support
Baseline- Forecasted future units X Avg Net Rev/Unit and Cost/Unit- Forecasted Denial $ based on current Denial Rates X future Rev Forecast = Future baseline Utilization, total Net Rev & total cost
Future State- Identified 5 factors impacting model - 1) Med Nec 2) Auth 3) Dosing 4) Substitution 5) Clinical indication and set % goals- Apply goals to future units, gross rev and cost factors per drug = Change in Gross Rev and Cost - Apply payer mix and avg net reimb. rate to Gross Rev=Net - Net Change in Reimb. Rev + Net Cost reduction = Change in profitability opportunity- Adoption rate X Opportunity = Realized Profitability
Year 1 Year 2 Year 3 Year 4 Year 5 Year 6 Year 7
High End - Reduced Use of High Cost Drugs $0 $0 $0 $1,936 $2,061 $2,195 $2,372
Low End - Reduced Use of High Cost Drugs $0 $0 $0 $1,566 $1,649 $1,734 $1,858
$0 $1,000 $2,000 $3,000 $4,000 $5,000
IInc
r. P
rofit
abili
ty
Reduced Utilization of High-Cost Drugs Incremental 7 Year Profitability (000's)
CPOE Benefits
04/19/23 17
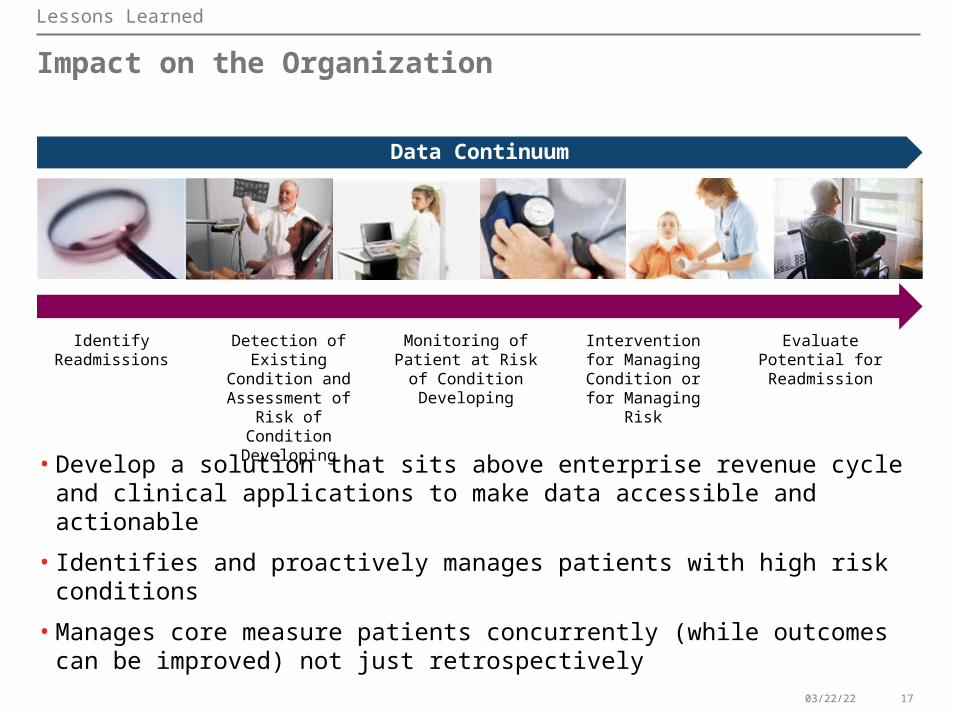
Impact on the Organization
• Develop a solution that sits above enterprise revenue cycle and clinical applications to make data accessible and actionable
• Identifies and proactively manages patients with high risk conditions
• Manages core measure patients concurrently (while outcomes can be improved) not just retrospectively
Data Continuum
Lessons Learned
Identify Readmissions
Detection of Existing Condition and
Assessment of Risk of Condition Developing
Monitoring of Patient at Risk of Condition
Developing
Intervention for Managing Condition or for Managing Risk
Evaluate Potential for Readmission
04/19/23 18
Ask Your Organization
1.Key Questions
• What is the current state of your data?
• Are you set up to manage data (governance)?
• What is the most efficient data management solution (architecture)?
• What is your capability to derive intelligence from data to effect process improvement (informatics)?
• What is your budget and timeframe (scope)?
Lessons Learned

04/19/23 19
Everything Must be Done With the Final Destination in Mind
• Start slow and grow, avoid taking on too many improvements at once
• Avoid unstructured text as much as possible
• Establish a culture whereby quality is top of mind– More than a single committee– Each committee meeting quality is woven into the discussion
• Communication strategy for entire organization so they gain understanding
• Organizational change methodology– Leverage for each time change the documentation or ordering
pathways and associated processes
Lessons Learned

04/19/23 20
Case Study
Debbie Newman, MBA, CPHIMSDebbie Newman, MBA, CPHIMSDirector of Process ImprovementDirector of Process ImprovementLicking Memorial Health SystemsLicking Memorial Health Systems

04/19/23 21
Licking Memorial Health Systems – Licking County, Ohio

04/19/23 22
CMS Requirements & Effects
–CMS Core measure requirements• Hospital based activity
–CMS and State - Anticipated core measure requirements• Expansion into cross-organization activity• Expansion into claims based measures
–2014 CMS and State – What’s coming?• ED throughput (admit decision to admit, door to
admit)• Global immunization measures
04/19/23 23
CMS Requirements & Effects
What’s the big deal?
Hospital requirements =physician requirements

04/19/23 24
LMHS Lessons Learned
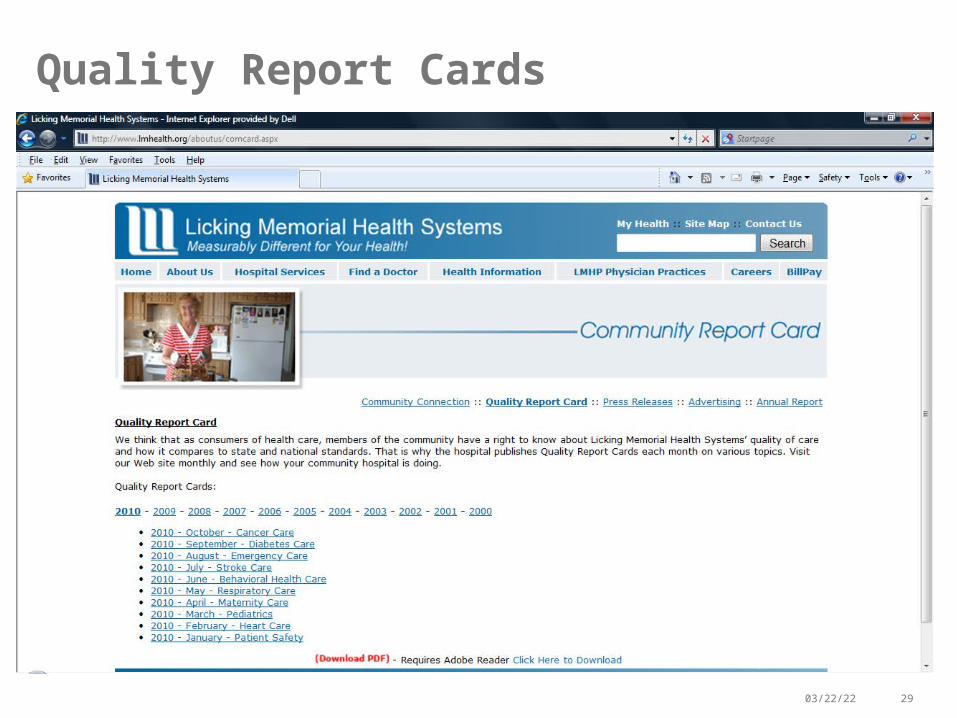
•Early adoption can have it’s complexities– Example – Maternity laceration prevalence– Example – Community Report Cards
•Software not created to mine data– Is a purchased EMR truly set up to evaluate quality?– Are reports available to account for CMS complexities?
• Infrastructure not in place to affect data– How do we evaluate outliers?– Who is involved in evaluations?– How do we communicate to physicians / clinicians?

04/19/23 25
Electronic Medical Record Observations
•Access – Total access for all providers?
•Real time – Scanning delays – true access when needed?
•Printing – Where and when appropriate?

04/19/23 26
Electronic Medical Record Observations
•Downtime – What is the process for downtime?
•Duplication – Where are areas for simplification?

04/19/23 27
Hospital or Physician OfficeElectronic Medical Record Success Stories
•Recall notification• Who received a particular implant?
•Best practice • How are we managing our Core Measure patients?

04/19/23 28
Software Limitations & Lessons Learned•Basic software may be too versatile
•Not set up for monitoring quality
•Garbage in – garbage out
•Need standard responses to measure quality
•Need central Quality Committee
•Early adoption has its downfalls
04/19/23 29
Quality Report Cards

04/19/23 30

04/19/23 31
Question and Answers
Have a question?
Beverly [email protected]
Debbie [email protected]

THANK YOU