integrating spatial and business data for improved...
TRANSCRIPT

T R A N S P O R T A T I O N R E S E A R C H
Number E-C176 September 2013
Integrating Spatial and Business Data for
Improved DecisionsA Peer Exchange
May 4–5, 2013Boise, Idaho

TRANSPORTATION RESEARCH BOARD 2013 EXECUTIVE COMMITTEE OFFICERS Chair: Deborah H. Butler, Executive Vice President, Planning, and CIO, Norfolk Southern Corporation,
Norfolk, Virginia Vice Chair: Kirk T. Steudle, Director, Michigan Department of Transportation, Lansing Division Chair for NRC Oversight: Susan Hanson, Distinguished University Professor Emerita,
School of Geography, Clark University, Worcester, Massachusetts Executive Director: Robert E. Skinner, Jr., Transportation Research Board TRANSPORTATION RESEARCH BOARD 2012–2013 TECHNICAL ACTIVITIES COUNCIL Chair: Katherine F. Turnbull, Executive Associate Director, Texas A&M Transportation Institute,
Texas A&M University System, College Station Technical Activities Director: Mark R. Norman, Transportation Research Board Paul Carlson, Research Engineer, Texas A&M Transportation Institute, Texas A&M University System,
College Station, Operations and Maintenance Group Chair Thomas J. Kazmierowski, Manager, Materials Engineering and Research Office, Ontario Ministry of
Transportation, Toronto, Canada, Design and Construction Group Chair Ronald R. Knipling, Principal, safetyforthelonghaul.com, Arlington, Virginia, System Users Group
Chair Mark S. Kross, Consultant, Jefferson City, Missouri, Planning and Environment Group Chair Joung Ho Lee, Associate Director for Finance and Business Development, American Association of
State Highway and Transportation Officials, Washington, D.C., Young Members Council Representative
Peter B. Mandle, Director, LeighFisher, Inc., Burlingame, California, Aviation Group Chair Harold R. (Skip) Paul, Director, Louisiana Transportation Research Center, Louisiana Department of
Transportation and Development, Baton Rouge, State DOT Representative Anthony D. Perl, Professor of Political Science and Urban Studies and Director, Urban Studies Program,
Simon Fraser University, Vancouver, British Columbia, Canada, Rail Group Chair Steven Silkunas, Director of Business Development, Southeastern Pennsylvania Transportation
Authority, Philadelphia, Pennsylvania, Public Transportation Group Chair Peter F. Swan, Associate Professor of Logistics and Operations Management, Pennsylvania State,
Harrisburg, Middletown, Pennsylvania, Freight Systems Group Chair James S. Thiel, General Counsel, Wisconsin Department of Transportation, Legal Resources Group
Chair Thomas H. Wakeman, Research Professor, Stevens Institute of Technology, Hoboken, New Jersey,
Marine Group Chair Johanna P. Zmud, Director, Transportation, Space, and Technology Program, RAND Corporation,
Arlington, Virginia, Policy and Organization Group Chair

TRANSPORTATION RESEARCH CIRCULAR E-C176
Integrating Spatial and Business Data for Improved Decisions
A Peer Exchange
May 4–5, 2013 Boise, Idaho
James P. Hall Editor
Information Systems and Technology Committee Geographic Information Science and Applications Committee
Transportation Research Board
Transportation Research Board 500 Fifth Street, NW
Washington, D.C. www.TRB.org

Javy Awan, Production Editor; Jennifer Correro, Proofreading and Layout
TRANSPORTATION RESEARCH CIRCULAR E-C176 The Transportation Research Board is a unit of the National Research Council, a private, nonprofit institution that is the principal operating agency of the National Academy of Sciences and the National Academy of Engineering. Under a congressional charter granted to the National Academy of Sciences, the National Research Council provides scientific and technical advice to the government, the public, and the scientific and engineering communities. The Transportation Research Board is distributing this Circular to make the information contained herein available for use by individual practitioners in state and local transportation agencies, researchers in academic institutions, and other members of the transportation research community. The information in this Circular was taken directly from the submissions of the authors. This document is not a report of the National Research Council or of the National Academy of Sciences.
Policy and Organization Group Johanna P. Zmud, Chair
Data and Information Systems Section
Joseph L. Schofer, Chair
Information Systems and Technology Committee Frances D. Harrison, Chair
Martin Akerman Terrence C. Bills
Mike G. Bousliman Ioannis Brilakis Colin N. Brooks
Mr. Brian Derstine
Hazar Y. Dib Nora M. El-Gohary Joe L. Garvey, III
Don Grayson James P. Hall Mingwei Hu
Zhixia Li Murali Rao
Robert Schultz Yinhai Wang Dan Wilcox
James E. Yarsky Yu Yuan
Guohui Zhang
Geographic Information Science and Applications Committee James P. Hall, Cochair
Cesar A. Quiroga, Cochair
Faris B. Al-Memar William H. Bachman
Terrence C. Bills Mike G. Bousliman Ronald N. Buliung Joseph A. Burns Martin W. Catala Samuel Granato Jessica Y. Guo
Mark W. Horner
Charlene E. Howard Junfeng Jiao
Evelyn Sue Kimbrough Peggi S. Knight
Stephen M. Lewis Qiong Liu
Harvey J. Miller Randall J. Murphy
Val Noronha
Barbara Katherine Ostrom Lisa K. Park
Zhong-Ren Peng Mohammed A. Quddus
Wayne A. Sarasua Mark J. Sarmiento Darren M. Scott
Orion Theodore Stewart Christopher David Upchurch
J. Greg Yarbrough
Thomas M. Palmerlee, TRB Staff Representative Mai Quynh Le, Program Associate
Transportation Research Board
500 Fifth Street, NW Washington, DC 20001
www.TRB.org
iii
Contents Preface .............................................................................................................................................1 Background, Objectives, and Results of the Integrating Spatial and Business Data for Improved Decisions Peer Exchange ..............................................................3
Frances Harrison and James P. Hall Summary of State Questionnaire Responses: Peer Exchange Questions ...............................18
James P. Hall High-Priority Research Needs Statements ................................................................................39
Capability Maturity Model for the Integration and Use of Geospatial and Business Data ...................................................................................40 John Selmer, Steve Quinn, William Johnson, George Crowder, and James P. Hall Spatial Portrayal of Performance Measures .......................................................................43 Bryan Kelley, William Johnson, Scott Richrath, Frances Harrison, and Brian Derstine Peer Exchange on Aligning Data Systems to Communicate with Decision Makers Supporting Risk-Based Asset Management ..................................45 Jerri Bohard, Greg Slater, Penelope Weinberger, and Terry Bills
Appendix: List of Acronyms .......................................................................................................47

1
Preface
usiness intelligence (BI) tools offer great potential to help transportation agencies to pinpoint areas of potential savings by combining information across functional areas and
offices and enabling in-depth analysis of past trends, monitoring of current expenditures and activities, and tracking of emerging changes. When married to geographic information systems (GIS), the value of BI is magnified, i.e., agencies are able to integrate spatial data layers and conduct location-based analyses. However, the ability to integrate disparate data sets to feed BI tools is a stumbling block for effective use of these solutions.
The TRB Transportation Information Systems and Technology Committee and the Geographic Information Science and Applications Committee hosted a peer exchange to bring together state transportation executives, chief information officers, and GIS experts to present current best practices for integrating spatial and business data, and to discuss strategies to overcoming existing barriers to implementing these solutions. Participants explored both technical and organizational factors and identified priority research needs. Eight state transportation agencies—Alaska, Colorado, Idaho, Iowa, Maryland, Oregon, Utah, and Virginia—were selected for participation based on their progress and interest in spatial BI products for decision making. A total of 15 individuals from state agencies along with eight individuals from federal agencies, universities, and the private sector participated in the peer exchange. A planning group chaired by Frances Harrison of Spy Pond Partners carried out the detailed planning for the peer exchange. This circular was prepared by James P. Hall of the University of Illinois–Springfield as a factual summary of the event. The views contained in this circular are those of individual peer exchange participants and do not necessarily represent the views of all participants, the planning team, the sponsoring committees, or TRB.
Prior to the peer exchange, state agency participants completed comprehensive questionnaires on their current practices and concerns in business and spatial data management and progress in integrating spatial and business data for analysis. In general, agencies are using a variety of methods to access source system data and make it available for integrated mapping and reporting including real-time integration via web services and database links. States use integrated spatial and business data for decision making in a variety of areas, including safety analysis, asset and performance management, project scoping, environmental assessment, and traffic operations. Areas identified for future development include further standardization and automation of the process for accessing source system data and expanding the scope of data sources for analysis. There was also interest in using spatial business analytics, but, currently, the states were focused on simple visualization.
At the peer exchange, attendees focused on three major themes: technical approaches to integrating business and spatial data; opportunities for providing business value; and data governance and collaboration with external partners. Participants then developed three high-priority research needs statements:
1. Developing a capability maturity model for integrating and using geospatial and
business data; 2. Investigating techniques for the spatial portrayal of performance measures; and 3. Aligning data systems to communicate with decision makers supporting risk-based
asset management.
B

2 TR Circular E-C176: Integrating Spatial and Business Data for Improved Decisions
Funding provided by the Federal Highway Administration (FHWA) and the Environmental Systems Research Institute (ESRI) to help support this event is gratefully acknowledged.
3
Background, Objectives, and Results of the Integrating Spatial and Business Data for Improved Decisions
Peer Exchange
FRANCES HARRISON Spy Pond Partners
JAMES P. HALL
University of Illinois–Springfield
his peer exchange was organized by TRB’s Transportation Information Systems and Technology Committee and the Geographic Information Science and Applications
Committee. BACKGROUND As transportation agencies face budget cuts and reductions in staff, they are looking to information technology solutions as a way to improve efficiencies. BI tools offer great potential to help agencies to pinpoint areas of potential savings by combining information across functional areas and offices and enabling in-depth analysis of past trends, monitoring of current expenditures and activities, and tracking of emerging changes. When married to GIS, the value of BI is magnified. Agencies are able to integrate spatial data layers and conduct location-based analyses.
However, the ability to integrate disparate data sets to feed BI tools is a stumbling block for effective use of these solutions. Integration of linearly referenced roadway data across systems has been partially addressed through the development of enterprise linear referencing systems (LRS), but many agencies are still struggling to keep multiple roadway data applications in synch. “Out-of-the-box” BI solutions do not generally include GIS functions. Some state departments of transportation (DOTs) have invested in custom-built GIS-enabled data warehouses, but these require ongoing maintenance, drawing upon limited staff or contractor resources. There is a need to identify current best practices in GIS-enabled BI and to identify strategies for helping agencies to overcome existing barriers to implementing these solutions.
The planned joint meeting of state agency GIS professionals and the AASHTO Subcommittee on Information Systems (ASIS) at the GIS for Transportation (GIS-T) Conference in Boise, Idaho, in May 2013 provided a unique opportunity to bring together state DOT managers and GIS and information technology (IT) specialists along with federal, university, and vendor professionals to discuss ways to better leverage available technology solutions to meet DOT business requirements.
This peer exchange also built on the Workshop on Integrating Spatial and Business Data for improved Decisions held at the 92nd Annual Meeting of the Transportation Research Board on January 13, 2013, in Washington D.C. The workshop explored the state of the practice of spatially enabled BI tools for management reporting and methods for integrating transportation spatial and business data. Presenting agencies included the Illinois, Utah, and Virginia DOTs,
T

4 TR Circular E-C176: Integrating Spatial and Business Data for Improved Decisions
FHWA, ESRI, Spy Pond Partners, and University of Illinois–Springfield. The presentations and workshop discussions helped to identify current issues to set the agenda for the peer exchange. PEER EXCHANGE OBJECTIVES The objective of this peer exchange was to bring together state transportation executives, chief information officers, GIS experts, and other professionals to present current best practices for integrating transportation agency spatial and business data and to discuss strategies for helping agencies to overcome existing barriers to implementing these solutions. The peer exchange was held May 4–5, 2013, immediately before the May 5–9 joint GIS-T and ASIS conference, in Boise, Idaho.
Invited state agency participants prepared advance reports highlighting their current practices, successes, and implementation challenges. At the peer exchange, participants explored both technical and organizational factors, and identified priority research needs. A summary of the highlights of the peer exchange results was presented at the GIS-T conference on May 6. A major product of the peer exchange is this circular which outlines high-priority research problem statements to advance the state of the practice. PEER EXCHANGE PARTICIPANTS In 2012, a Peer Exchange Planning Committee was formed to determine the objectives of the peer exchange and to administer pre-peer activities. The planning committee consisted of the following members: Frances Harrison, Spy Pond Partners, Chair; Terry Bills, ESRI; James P. Hall, University of Illinois–Springfield; Matthew Hardy, AASHTO; Joseph Hausman, FHWA; Bryan Kelley, Virginia DOT; Frank Pisani, Utah DOT; Scott Richrath, Colorado DOT; Mark Sarmiento, FHWA; John Selmer, Iowa DOT; Gregory Slater, Maryland State Highway Administration (SHA); Craig Thor, FHWA; Patrick Zhang, FHWA; and Tyler Zundel, Idaho DOT. Thomas M. Palmerlee was TRB staff representative.
The Planning Committee identified and selected eight state transportation agencies for participation in the peer exchange based on their progress and interest in spatial BI products for decision making. The participating state transportation agencies included:
• Alaska Department of Transportation and Public Facilities (DOTPF); • Colorado DOT; • Idaho Transportation Department; • Iowa DOT; • Maryland SHA; • Oregon DOT; • Utah DOT; and • Virginia DOT.
Ultimately, a total of 15 state agency representatives and eight additional federal,
university, and private-sector representatives participated in the peer exchange. The following is a listing of the 23 peer exchange participants:

Harrison and Hall 5
Name Organization Eric Abrams Iowa DOT Terry Bills ESRI Jerri Bohard Oregon DOT Jason Brinkman Idaho Transportation Department George Crowder Alaska DOTPF James P. Hall University of Illinois–Springfield Frances Harrison Spy Pond Partners, LLC Joseph Hausman FHWA William Johnson Colorado DOT Brett Juul Oregon DOT Bryan Kelley Virginia DOT Erin Lesh Maryland SHA Thomas M. Palmerlee TRB Frank Pisani Utah DOT Steve Quinn Utah DOT Scott Richrath Colorado DOT Mark Sarmiento FHWA John Selmer Iowa DOT Gregory Slater Maryland SHA Craig Thor FHWA Shibu Varughese Virginia DOT Penelope Weinberger AASHTO Tyler Zundel Idaho Transportation Department STATE TRANSPORTATION AGENCY QUESTIONNAIRES State agencies completed a questionnaire prior to the peer exchange. The questionnaire explored the agencies’ current practices in business data integration, spatial data management, location referencing, and integrating spatial and business data. The questionnaire also queried their current questions and concerns in these areas.
The following lists all of the questions that were posed to the state agencies. The summary of responses for each state agency is included in the next chapter of this circular. Business Data Integration
1. Please describe your agency’s approach to integrating data from different BI systems for reporting.
2. What is your data warehouse platform? 3. What extract–transform–load (ETL) or enterprise application integration (EAI) tools
do you use? 4. What categories of data are included in your data warehouse or are available via your
EAI tool? 5. What business unit is responsible for architecture, configuration, and management of
the database–tools? 6. What business units are involved in making decisions regarding what data should be
integrated?
6 TR Circular E-C176: Integrating Spatial and Business Data for Improved Decisions
7. Does your agency license a standard set of BI or reporting tools for use by multiple business units?
8. What tools do you use? 9. What are the most common uses of these tools? 10. What business unit is responsible for maintaining and configuring the tools for new
users? 11. How many regular users are there for these tools (e.g., number of staff running at
least one report every month)? Spatial Data Management
12. Which of the following business applications provide integrated map-based query and reporting capabilities?
13. How are geospatial data made available to agency staff? 14. Have you integrated crowd sourcing or social media into your spatial data resource?
In what areas do you see future growth for these data sources? Location Referencing
15. What location referencing methods (LRMs) does your agency use for its various data sets (crash, pavement, bridge, projects, etc.)?
16. Does your agency have any of the following: • A centrally managed enterprise-level LRS; • An ability to automatically translate across different LRMs; • An ability to reference your spatial data to different geometric representations of
the road network; • An automated capability to update your road network while maintaining valid
location references for existing business data on the network; or • A standard approach to integrating linearly referenced data from different points
in time. 17. What software do you use for updating and managing your LRS? 18. How do you synchronize location referencing across different business applications
(e.g., asset management, program development, operations)? 19. Does your agency have the capability to conduct trend analysis using linearly
referenced data (e.g., crash rates, pavement condition)? If so, how does your agency accomplish temporal management of your roadway network and business data to enable this analysis? Integrating Spatial and Business Data
20. What technical integration method(s) do you use for integrating business and spatial data where spatial feature data are maintained separately from business data (e.g., web services, specialized views, etc.)?
21. Do you have capabilities to integrate business and spatial data in real time or do you utilize batch processes? Please provide an example.

Harrison and Hall 7
22. Do you have the capability to create tabular reports of road inventory characteristics and dynamically segment the data based on user-selected attributes, e.g., break sections along a route whenever number of lanes or pavement type changes?
23. In which of the following areas does your agency currently use integrated spatial and business data for decision making:
• Safety analysis, • Pavement management, • Bridge management, • Maintenance management, • Performance management, • Project scoping, • Environmental assessment, • Capital program development, • Traffic operations, or • Other.
24. Please list specific benefits your agency has been able to realize through integrating business and geospatial data. If you have quantified these benefits, are you willing to share your analysis?
25. What new capabilities would you like to see your agency develop in the next few years for integrating business and spatial data in the above areas?
26. Has your agency made use of any spatial business analytics to perform statistical analysis, predictive modeling, visualization, and forecasting? If so, please describe.
27. What formal or informal data governance processes do you have in place to ensure that spatial and business data is available across the organization? What are your major challenges in this area?
28. What have been the major barriers to making more extensive use of integrated spatial and business data in your agency? Questions and Concerns
29. What questions do you have for your peers regarding integration of spatial and business data for better decision making?
30. Does your agency have specific concerns about the Moving Ahead for Progress in the 21st Century Act (MAP-21) data and performance reporting requirements that you would like to discuss at this peer exchange? If so, please describe. Summary of Key Findings from the Questionnaire Responses The following is a summary of the key findings from the state agency responses to the questionnaires. This circular includes the state responses in their entirety in a later section.
• Agencies are using a variety of methods for tapping into source system data and making it available for integrated mapping and reporting.
• In general, hybrid approaches to data integration were in place. All eight of the states had data warehouses with batch ETL processes; but some also had real-time integration via web services and database links.

8 TR Circular E-C176: Integrating Spatial and Business Data for Improved Decisions
• There were also different approaches to synchronization of location referencing across business applications; this is a time-consuming manual process for many states.
• States were using integrated spatial and business data for decision making in a variety of areas, including safety analysis, asset and performance management, project scoping, environmental assessment, and traffic operations.
• Areas noted for future development included further standardization and automation of the process for accessing source system data and expanding the scope of what data could be analyzed. There was interest in using spatial business analytics, but mostly states were focused on simple visualization.
• Also, agencies desired further understanding implications of the MAP-21 performance, asset management and new Highway Performance Monitoring System (HPMS) requirements on geospatial analysis capabilities. PEER EXCHANGE STRUCTURE AND RESULTS The peer exchange occurred May 4–5, 2013, in Boise, Idaho. The structure and results of the peer exchange follow. Introductory Remarks Frances Harrison, Peer Exchange Planning Team chair and the Chief Technical Officer of Spy Pond Partners, LLC, welcomed the participants. She thanked them for their efforts in identifying the state of the practice prior to the peer exchange and she encouraged attendees to participate actively in the peer exchange, discussing the successes and challenges they had experienced in integrating spatial and business data for decision making. She reiterated the objectives of the peer exchange, which included the identification of high-priority research issues to develop draft research needs statements.
The May 4 agenda centered on state agency presentations with discussion focused around four central theme areas: current capabilities, successful implementation practices, challenges, and future directions. The following is a summary of the state agency presentations. Colorado Department of Transportation Scott Richrath and William Johnson, Presenters Colorado DOT has been very active in the integration of spatial and business data. Their current capabilities include an I-70 Mobile Application (http://goi70.com/) for real-time road information with future expansion to I-25. Colorado has also deployed CoTrip.org for weather and traffic alerts and YourCDOTDollar.com which tracks roadway performance and transportation expenditures. Colorado’s Online Transportation Information System (http://dtdapps.coloradodot.info/otis) contains information for transportation planning on current and projected traffic volumes, state highway attributes, summary roadway statistics, demographics, and geographic data.
For successful implementation practices, Colorado cites the policy institution of a single agencywide LRS and the deployment of enterprise resource planning software which contains a
Harrison and Hall 9
significant spatial component. As an example of finding new funding sources, Colorado DOT also noted that the I-70 Mobile App revenue paid for the mobile application development.
For challenges, Colorado cites the explosion of information with the need to increase analysis capabilities. Colorado state government has centralized IT decision making, coinciding with Colorado DOT’s downsizing of legacy systems. For the future, Colorado DOT is implementing a data business plan (http://www.camsys.com/pubs/CDOT_Performance_ Data_Business_Plan.pdf) which will formalize a data governance structure with a complete data inventory and assessment. Colorado DOT has also created a formal Knowledge Management Governance Oversight Committee structure with specialized governance teams. Idaho Transportation Department Tyler Zundel and Jason Brinkman, Presenters The technology governance group for the Idaho Transportation Department’s (ITD) is the Information Technology Governance Council (ITGC). ITGC consists of ITD executives who are advised by managers from both IT and business process areas. The ITGC has budgetary authority and prioritizes and authorizes IT projects, directs IT initiatives, and has standards oversight. The ITGC faces challenges in addressing issues of security and the growth of mobile devices.
One of the primary focus areas for ITGC is the improvement of various asset management systems and data collection operations with the integration of spatial capabilities. Major initiatives include the modernization of legacy systems including fleet management and the pavement management system. ITD is developing a data warehouse while modernizing their LRS capabilities. In addition, they are working to improve their Investment Corridor Analysis Planning System (ICAPS), data-driven performance analysis, and investment analysis practices. Iowa Department of Transportation John Selmer and Eric Abrams, Presenters The Iowa DOT has been active in developing methods, tools, and technologies towards a mature GIS for business in their agency. Iowa has recently reorganized with the creation of a Performance and Technology Division which includes the sections of Organizational Improvements, Strategic Communications, and Research and Development. The Performance and Technology Division reports directly to the agency’s director. Since both GIS and Asset Management are cross functional, the division’s focus is on collaboration with the business owners within the agency towards penetrating agency silos. The Organizational Improvements section addresses performance management, asset management, strategic planning, and process improvements. The Strategic Communications section includes web, public information, social media, and field communications. The Research and Development section comprises GIS and BI, agency research, and innovation functions.
Regarding GIS, Iowa has moved towards spatial maturity within the parameters of alignment with department needs, data management, accessibility, integration, and sustainability. In 2005, Iowa took steps to leverage the enterprise database core to create a cohesive, integrative environment for spatial applications that includes web services. The GIS support team includes a blend of GIS and IT staff while investing in specialization of analytical staff. The spatial data architecture concept is to create once and use many times. Iowa is employing GIS to develop
10 TR Circular E-C176: Integrating Spatial and Business Data for Improved Decisions
cross-organizational decision-support products. Iowa has employed comprehensive dynamic segmentation techniques on the core spatial infrastructure to integrate business data for multiple uses including asset analysis and specific applications, e.g., snowplow movements integrated with material resource planning.
Since asset management decision making encompasses a large portion of agency resources, it is important to show the return on investment (ROI) for new initiatives. Iowa is technology-rich but is working towards being information-rich in disseminating information to decision makers and the public. Maryland State Highway Administration Greg Slater and Erin Lesh, Presenters Maryland has improved its capabilities in the integration of spatial and business data for improved decisions. Traditionally, IT and planning departments had worked independently in developing databases and applications. Planning also contained the core GIS function. More recently, IT and planning have coordinated project requests while integrating business and spatial elements. Maryland is also working towards enterprise integration of business and spatial components, and the complete incorporation of spatial technology into business operations and decision support.
Challenges to these efforts included communication issues, historic silo functions, resistance to change, a lack of understanding between the differences in IT and GIS technology and data, and a lack of standards. Successful practices included monthly coordination meetings, a full Maryland executive support of the importance of geospatial capabilities, education, and the incorporation of GIS in IT standards documentation.
Current applications include comprehensive and complete LRS capabilities for federal reporting and a continually developing asset management system. Maryland has also deployed an Enterprise GIS Portal (eGIS) to integrate business and spatial data and processes. Currently, there are 300 power users of the eGIS. eGIS has been integrated with external business systems including the Miss Utility Ticket Tracking System and Maryland is exploring its uses for better external communications and integration with social media technologies.
Maryland is focusing on a data-driven decision-making framework in the key performance-based planning areas of safety, mobility–economy and system preservation–asset management. Valuation of projects is important justify the incorporation of history and the results of decisions such as the impact of the highway safety plan on severe crashes. The safety analysis capabilities have been expanded to pedestrian and bike applications.
For mobility, key analysis areas included travel patterns, bottlenecks, and integration of external data. For asset management, applications have moved beyond pavement and bridges to include lighting, signs, traffic barriers, rumble strips, striping, and weather sensors. Through eGIS the GIS-based asset management system is able to work in conjunction with the analysis of safety, congestion, environmental impacts, and spatial analysis capabilities including the analysis of the adaptability of assets to projected climate changes due to precipitation, sea level rise, and temperature.
For the future, Maryland desires greater integration of data–components in eGIS to include activity-based modeling, a project life cycle, and an executive dashboard with a focus on getting all project-based activities into the GIS platform to coordinate activities and track
Harrison and Hall 11
performance. Maryland will also be releasing public-facing eGIS applications with storytelling capabilities to better serve Maryland’s citizens. Oregon Department of Transportation Jerri Bohard and Brett Juul, Presenters Oregon DOT has a GIS Steering Committee which is responsible for its GIS governance functions. Members of the Steering Committee, composed of staff from various parts of the agency, are GIS stakeholders who approve the larger GIS projects and plans that guide the work of GIS staff. Ohio DOT has developed a GIS strategic plan with objectives, action items, and timelines with assigned responsibilities. As part of the GIS governance, the Steering Committee guides data sharing agreements, service agreements, and memorandums of understanding as well as the development of policies, standards, and guidelines.
Ohio DOT also participates in multistate agency GIS governance through the Oregon Geographic Information Council (OGIC). OGIC has a policy advisory committee and coordinates with federal, tribal, state, and local government agencies. These efforts facilitate shared funding for projects and GIS software as well as the development of base data layer standards.
Ohio DOT has developed specific GIS applications including a TransInfo system containing information on over 80 asset categories for asset analysis and project scoping. The primary web application for displaying those categories is TransGIS (https://odot.maps.arcgis. com/home/). It is among other notable applications that include a safety priority information system and an Ohio DOT project tracker. It has also been used as a template for portions of intelligent transportation systems (ITS) and emergency operations applications. Ohio DOT’s GIS Unit staff has already put TransGIS functionality to good use by interactively providing key data layer information during Statewide Transportation Improvement Program (STIP) scoping and climate adaptation work sessions.
Challenges in implementing spatial business applications include the lack of time or resources to meet demand for projects, conduct training, improving access to GIS web applications, and providing technical support. Utah Department of Transportation Steve Quinn and Frank Pisani, Presenters Utah DOT has taken an enterprise view in improving its capabilities in the integration of spatial and business data for decisions. Utah currently has a centralized GIS with the deployment of GIS capabilities in multiple business areas. Utah DOT has successfully deployed UGate, which is their spatial data warehouse. UGate includes a data portal with web access to spatial products including straight line diagrams, Uplan, traffic information, and Utah DOT projects.
Utah DOT’s spatial architecture contains a source systems tier (Utah DOT Business data), a database tier (UGate data warehouse), a server tier (web and map services), and an applications tier (interactive maps and data). This enables the creation of specific spatial decision-support products for users from staff level to senior management.
Challenges for this effort include a cumbersome ETL process, identifying straight line diagram uses, delivering value, and advancing the roadway data collection across multiple asset

12 TR Circular E-C176: Integrating Spatial and Business Data for Improved Decisions
categories. Additional issues include addressing legacy systems and disparate technologies, determining whether to build or buy, managing growth, and acquiring funding and resources.
For lessons learned, Utah recommends that GIS be more than maps; it has to add value and be easy to use. For implementation, the view should be departmentwide. Data management requires effort and stand-alone databases should be avoided. It is also important to engage management and end users. Utah also believes that successful implementation requires tremendous training and communications within the department. This will be a big focus for Utah DOT this fiscal year.
For desired capabilities, Utah DOT emphasizes the importance to have one version of the truth for data and that all data has a managed, validated, and trusted home. Also important is the capability to have a one-stop source for all data with search capabilities including geography-based, key word, and contextual. It is also necessary to integrate computer aided drafting and design (CADD) with GIS for accurate right-of-way, assets, and roadway features data. Virginia Department of Transportation Bryan Kelley and Shibu Varughese, Presenters Virginia DOT manages the stewardship of their enterprise data through the Information Technology Division which includes data management, the Roadway Network System (RNS) program, the GIS program, and the BI program. The goal is to store and disseminate information to support operational and strategic decision making throughout the organization. Virginia DOT integrates business data with spatial data to create business intelligence for dashboards, spatial analysis, and reporting. Virginia DOT has employed a variety of methods to create an integrated spatial data warehouse with outputs in a web services framework.
Successful deployment has been enabled through code-development standards, incorporation of a data exchange broker, and use of a nascent process that uses time-enabled data with visualization and analysis tools. Virginia DOT also uses an Enterprise Metadata Repository which contains metadata extracted from the operational system databases. Virginia DOT is developing a geospatial data policy which would mandate that applications and data shall be location referenced by default (with certain exceptions), which will, over time, allow for spatial analysis of the majority of enterprise data.
Virginia DOT believes an enterprise approach to data and making it available to users in a usable and managed way is essential to the long term success of this effort. This is a long-term effort and it requires a strategic vision that is endorsed by business users, such as there should be only one linear referencing system. For implementation, business owner champions can help lead high benefit efforts and possibly fund projects. User involvement and training are essential.
In addition to the need for supplemental resources, implementation issues include the changeover of data reporting practices, outreach, and education for users in new spatial access techniques, and the speed of spatial technology evolution. Future needs include more robust and intuitive roadway and spatial application programming interfaces for other system integration. Also, there is a need to work towards an integrated spatial data warehouse to integrate all things “highway” in a spatially temporal way.

Harrison and Hall 13
BREAKOUT GROUP THEMES AND DISCUSSION QUESTIONS On May 5, Joe Hausman of FHWA briefed the participants on national initiatives including of MAP-21 National Performance Measures and Targets, MAP-21 Asset Management Plans, Safety–Model Inventory Roadway Elements activities, HPMS initiatives, and traffic monitoring efforts.
The peer exchange participants then participated in breakout discussion groups centered on three themes: (a) technical approaches to integrating business and spatial data; (b) providing business value with opportunities for improvement; and (c) data governance and collaboration with external partners. The goal of the three breakout groups was to identify successful practices, challenges, and specific research needs areas. Each participant had the opportunity to rotate through each of the groups so they were able to participate in the discussion for all themes. Each group had a facilitator and a recorder to help direct discussion.
The discussion topics for each group are listed below. Group A. Technical Approaches to Integrating Business and Spatial Data Facilitator: James Hall, University of Illinois–Springfield Recorder: Penelope Weinberger, AASHTO
• Alternative architectures for spatially enabled business data. • Synchronizing differing LRSs across business applications. • Integrating data collected at different points in time, referenced to different versions
of the LRS. • Dynamic segmentation for tabular reporting. • Integration with analytical tools. • LRS integration services.
Group B. Providing Business Value: Opportunities for Improvement Facilitator: Terry Bills, ESRI Recorder: Tom Palmerlee, TRB
• LRS integration services, • Safety planning, • Asset management, • Program development, • Project development, • Policy–resource analysis, and • Other.
Group C. Data Governance and Collaboration with External Partners
• Operations management, • Geospatial data policies,

14 TR Circular E-C176: Integrating Spatial and Business Data for Improved Decisions
• Data ownership, • Organizational models for IT–business coordination, and • State DOT collaboration with metropolitan planning organizations (MPOs) and local
jurisdictions on data issues (including performance data coordination for MAP-21). BREAKOUT GROUP REPORTS Frances Harrison, Spy Pond Partners, Facilitator Each breakout group presented its primary discussion topics and research needs themes. There were a few common items resulting from the discussion groups relating to organizational challenges as follows.
First, some participants believed it was important to avoid two traps: (a) collecting data first and then figuring out how to manage it and keep it current and (b) having IT–GIS units develop a tool or capability without having an engaged set of business users for that tool with an established set of business questions that drive the use of the tool.
The breakout groups also identified several notable challenges. The amount of data available is outstripping agencies’ ability to analyze. There is a desire to have tools that allow for data exploration and pattern detection, but there needs to be more work on what that would look like in practice. Also, there is a need to understand whether there is value to be gained that justifies the effort of tapping into new data sources, especially real-time data, worth the effort.
It was noted that people and processes are more of a challenge than the technology side. Governance, communication, leadership, and organizational alignments are all critical elements for success.
There is also a continuing need for making the business case and describe or document ROI for enterprise data integration and reporting initiatives, particularly to executives.
The following provides a bulleted list of discussion areas covered by each of the groups. Group A. Technical Approaches to Integrating Business and Spatial Data Successes
• Managing history with tools like Oracle total recall. • Successful implementation using guidance from NCHRP Project 20-27, Adaptation
of Geographic Information Systems for Transportation. • Policy or legislative mandates to incorporate spatial linkage.
Challenges
• Determining the amount data needed. • Systematic solutions are needed for information storage and growth, accommodating
big data. • How to demonstrate the level of need. • How to enable IT personnel to understand the business requirements. • Need for a common translation mechanism.
Harrison and Hall 15
• Need examples of business process requirement documents. • Demonstrating value and ROI. • Need architecture capabilities assessment model. • Need information reporting models. • Managing historical files. • Spatial analysis services options. • Need guidance on architecture and translation. • Need information on game changers for business units, where is technology heading. • Need best practices examples. • Synchronizing multiple LRSs. • Bifurcation between IT and information users. • Coordination with local agency systems for data and program management, e.g.,
different LRSs and naming conventions. • Incentives for local agencies to fully participate for both data collection and usage. • Development of web services for external access. • Promoting interagency cooperation and agency partnerships for building systems. • Building the business case for external data delivery.
Research Needs
• Documenting best practices, • Architectural capability maturity model guidance, • Expanding AASHTO guidance with specifications for business systems, • Spatial analysis, • Web services, • Address reconciliation, • Process to integrate local–external data, • Expanding the NCHRP Project 20-27 guidance, • Education–outreach, and • Communications planning and IT.
Group B: Providing Business Value: Opportunities for Improvement Key Value Areas
• Beginning caveats: start with what decisions need to be made and aligning GIS with business units.
• Communication tools: doing a better job of using GIS for effective communication with the public. What does the public want to know?
• Data integration for better decision making; ability to integrate information across business areas; need for an enterprise approach. Real value occurs after integration across units.
• Efficiency and visualization; optimization of investments. • Visualization for data quality. • Coordination with other agencies.

16 TR Circular E-C176: Integrating Spatial and Business Data for Improved Decisions
Opportunity Areas
• Demonstration of ROI. • Need CADD–GIS integration peer exchange on how GIS informs decision makers
and the public. • Performance analysis and the use of GIS and BI.
Group C. Data Governance and Collaboration with External Partners Successes
• DOT in Colorado is engaged in governance standards: – Geospatial and – Metadata.
• Establishment and adherence to standards. • Establish asset management; shows “how bad the data are” and highlights the
business case for data governance. • Use organizational committees to find the person(s) who are interested.
Opportunities
• Establish stewardship. • Prevent duplication of effort. • Common–standard terminology. • Affecting the necessary cultural change that accompanies data governance. • Data business planning:
– Performance focused and – Links business to data.
• Compliance auditing. • Overcoming organizational inertia. • Central state IT versus DOT IT:
– Pros and cons of both structures, – Top down can drive best practices, and – Reduced data duplication (e.g. landmarks).
• One master hub for all DOT data sources, systems integrate to hub. – This hub requires data architecture with committees to identify–prioritize. – Must cut through internal barriers.
• Maturity of technology, organizational structure, process. • Core data principles. • Know your business partners. • Demonstrate how to get buy-in. • Top-down support need (more than one). • Identify as risk. • How to address potential difference between IT–GIS approach.

Harrison and Hall 17
• Does it start with the governor? Research Needs
• Model policies. • Model organizational structure. • Knowledge base. • Best DOT practices in
– Data sharing policies, – Data exchange standards, and – Data stewardship agreements.
• Methods for sustaining data communication practices. • Recognizing official data–database of record:
– Public information and – Best practices in sharing with DOT partners and other state agencies.
• Data governance policy: – Principles and – Examples–guidance on sharing data.
• Link to data business plan. • Define what enterprise data means. • Is a case study a venue? • How to make the business case for data.
IDENTIFICATION OF HIGH-PRIORITY RESEARCH NEEDS At the end of the peer exchange, each breakout group presented its primary discussion topics and high-priority research needs themes. After a thorough discussion, three primary high-priority research needs areas were identified:
1. Capability Maturity Model for the Integration and Use of Geospatial and Business Data.
2. Spatial Portrayal of Performance Measures. 3. Peer Exchange on Aligning Data Systems to Communicate with Decision Makers
Supporting Risk-Based Asset Management.
The full descriptions for these statements are included in the final three chapters of this circular.

18
Summary of State Questionnaire Responses Peer Exchange Questions
JAMES P. HALL
University of Illinois–Springfield
he following are a summary of the state agency responses to questions submitted prior to the Integrating Spatial and Business Data for Improved Decisions Peer Exchange. States
Participating in the survey were Alaska (AK), Colorado (CO), Idaho (ID), Iowa (IA), Maryland (MD), Oregon (OR), Utah UT), and Virginia (VA). PART 1. BUSINESS DATA INTEGRATION 1. Please describe your agency’s approach to integrating data from different BI systems for reporting (check all that apply).
• We have a central data warehouse updated through batch processes that extract data from source information systems (e.g., road inventory, crash data, bridge data, pavement data, project data)—CO, IA, MD, OR, UT, VA.
• We have a central data warehouse updated in real time as data changes in our source systems—CO, MD.
• We use EAI technology to integrate data on the fly as reports are requested (e.g., an Enterprise Service Bus)—IA, VA.
• We build reports that query multiple source systems directly—CO, ID, IA, MD, OR, UT, VA. Other Alaska Alaska DOT&PF is transitioning from a legacy mainframe transportation database (natural programming language and ADABAS database handler) to a GIS-enabled highway data warehouse using ESRI’s spatial software and Oracle relational database. The transition is about half completed. Alaska DOT&PF has a decent geodatabase, road centerlines for all state-maintained and higher functionally classified roads, and a decent number of user applications. Additionally, the department has developed a portfolio of spatial data management tools and spatial data products. Colorado Colorado DOT has multiple systems in operation that are at varying levels of maturity of integration. Idaho ITD is currently in the process of creating a data warehouse with Cambridge Systematics.
T

Hall 19
Maryland Maryland SHA manually compiles data coming from different business information systems for StateStat reporting. Maryland SHA also builds custom applications for various reporting needs and each business unit inputs data directly into the system. Oregon Oregon DOT uses Feature Manipulation Engine (FME), report extracts, and TransInfo. 2. What is your data warehouse platform?
• Oracle—AK, UT, VA. • Structured Query Language (SQL) Server—ID (in progress), OR. • Sybase—none. • SAP—CO. • Netezza (IBM)—none. • Teradata—none. • Not applicable, we don’t have a data warehouse—none.
Other Alaska For the most part, we use ESRI software and custom tools for spatial data management and application tools. Idaho As noted in Question 1, the data warehouse is in flight and will be SQL Server. Iowa Database Central approach to data. Leverage Oracle and SQL Server. Maryland We have more than one: Oracle, QlikView (proprietary data warehouse), and SQL Server. 3. What ETL or EAI tools do you use?
Alaska For the most part we use ESRI software and custom tools for spatial data management and application tools. Colorado Custom ized ETL tools. Idaho Python. Iowa FME server architecture or custom SQL. Maryland Talend, QlikView, and custom scripts–procedures. Oregon FME and SQL Server Integration Services (SSIS). Utah We have FME but have not widely used it. We use custom PL–SQL Oracle packages.

20 TR Circular E-C176: Integrating Spatial and Business Data for Improved Decisions
Virginia Data Stage. Virginia DOT is also looking at SSIS, Business Objects Data Integrator. 4. What categories of data are included in your data warehouse or available via your EAI tool?
• Budget and expenditure data—CO, MD, OR, VA. • Construction project–capital program data—CO, IA, MD, OR, UT, VA. • Personnel–human resources (HR) data—CO, MD, OR. • Traffic data—AK, ID, MD, OR, UT, VA. • Crash data—AK, ID, OR, UT, VA. • Road inventory data—AK, ID, IA, MD, OR, UT, VA. • Bridge data—AK, CO, ID, IA, MD, OR, UT, VA. • Roadside or safety asset data—AK, IA, MD, OR, UT. • Right-of-way or parcel data—OR. • Equipment data—AK, CO, IA. • Common code lists (districts, departments, jurisdictions, etc.)—AK, CO, MD, OR.
Other Idaho All choices noted are “to be” data sets. Iowa Department of Natural Resources data. Maryland Environm ental. Oregon Projects, rockfalls, landslides, aggregate, access management, environmental features, financial data, HR data, project budget and expenditure data. Virginia Some datasets are loaded–transformed via web–windows services, SQL, and Python. 5. What business unit is responsible for architecture, configuration, and management of the database–tools? Alaska A planning division business unit within the Program Development Division, Transportation Information Group, Transportation Data Services. Colorado Governor’s Office of Information Technology, GIS Data Management Section, ITS. Idaho Enterprise Technology Services (ETS). Iowa Performance and Technology Division and IT Division. Maryland The Office of IT is responsible for most systems integrating business data. The GIS–IT group is responsible for most systems integrating business data via spatial platforms.

Hall 21
Oregon Information Systems, ETS, Information Systems, and Transportation Application Development. Utah Engineering–GIS and IT. Virginia IT Division, Enterprise Data Management. At Virginia DOT, Enterprise Data Management is comprised of three parts (BI, GIS program, and the Roadway Network System Program). 6. What business units are involved in making decisions regarding what data should be integrated?
Alaska The Transportation Information Group supports five core department business areas:
1. Highway Safety which includes the highway safety improvement program, 2. Road Weather Information Systems (RWIS), 3. Traffic (includes HPMS), 4. Transportation asset management, and 5. Traveler Information (includes 511).
GIS is a supporting technology to integrate these five business areas into the state’s road
centerline network and established LRM (route–milepoint). We have established stakeholder communities of interest for each of these five core business areas. We collaborate on what should be included in the geodatabase and referenced on the LRS.
The department’s Transportation Asset Management (TAM) Information System development will definitely expand the collaboration. The TAM Data Integration Committee will be addressing the enterprise needs that include spatial data, inventory business processes, and spatial data access. Colorado The IT Management Team (committee), the Division of Transportation Development Intelligent Transportation Systems, Office of Financial Management and Budget Staff Branches, and Governor’s Office of Information Technology. Idaho The Division of Highways (highways, maintenance, safety) and the Division of Administration (financial services, project tracking). Iowa The Performance and Technology Division has taken the lead on this but other offices are involved. Maryland Every business unit is involved in making decisions regarding their own data for integration and reporting. Oregon Projects are selected and guided by a steering committee made up of representatives from throughout the agency. In addition, we keep close ties with Asset Management Integration, Intermodal Oregon, Transportation Data Section, Geoenvironmental Services, Bridge, Motor Carrier, Traffic, Department of Motor Vehicles, Rail, Planning, and Active Transportation.
22 TR Circular E-C176: Integrating Spatial and Business Data for Improved Decisions
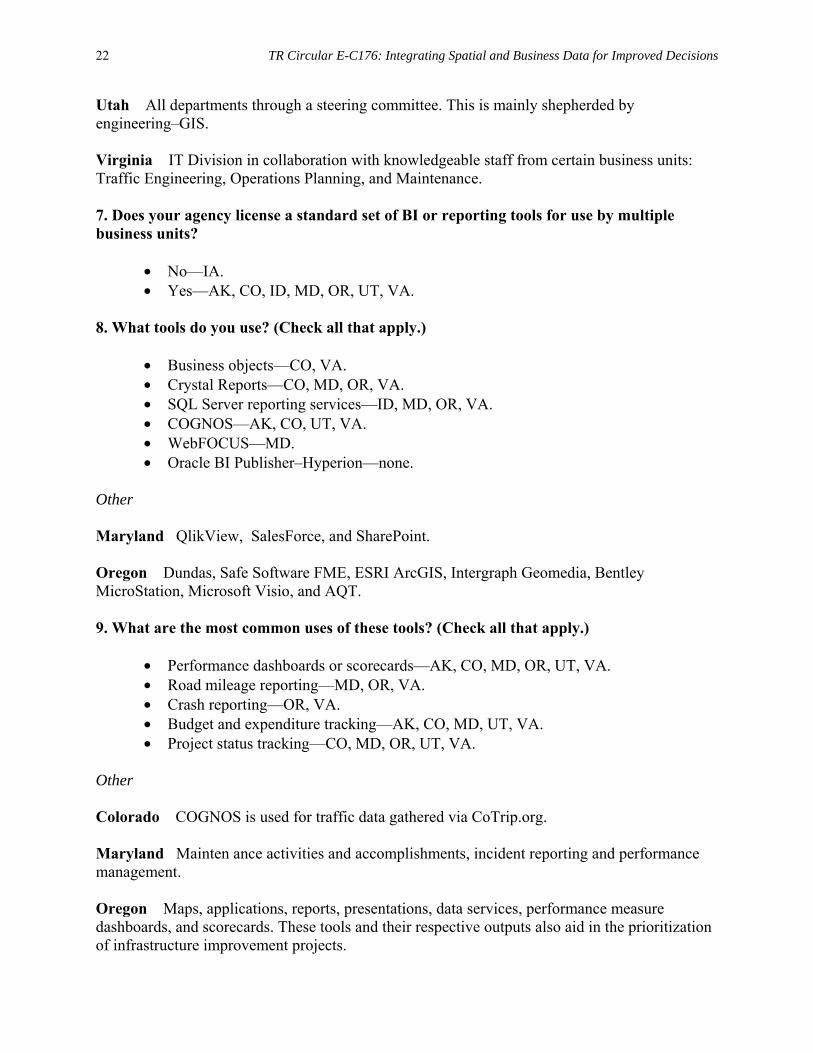
Utah All departments through a steering committee. This is mainly shepherded by engineering–GIS. Virginia IT Division in collaboration with knowledgeable staff from certain business units: Traffic Engineering, Operations Planning, and Maintenance. 7. Does your agency license a standard set of BI or reporting tools for use by multiple business units?
• No—IA. • Yes—AK, CO, ID, MD, OR, UT, VA.
8. What tools do you use? (Check all that apply.)
• Business objects—CO, VA. • Crystal Reports—CO, MD, OR, VA. • SQL Server reporting services—ID, MD, OR, VA. • COGNOS—AK, CO, UT, VA. • WebFOCUS—MD. • Oracle BI Publisher–Hyperion—none.
Other Maryland QlikView, SalesForce, and SharePoint. Oregon Dundas, Safe Software FME, ESRI ArcGIS, Intergraph Geomedia, Bentley MicroStation, Microsoft Visio, and AQT. 9. What are the most common uses of these tools? (Check all that apply.)
• Performance dashboards or scorecards—AK, CO, MD, OR, UT, VA. • Road mileage reporting—MD, OR, VA. • Crash reporting—OR, VA. • Budget and expenditure tracking—AK, CO, MD, UT, VA. • Project status tracking—CO, MD, OR, UT, VA.
Other Colorado COGNOS is used for traffic data gathered via CoTrip.org. Maryland Mainten ance activities and accomplishments, incident reporting and performance management. Oregon Maps, applications, reports, presentations, data services, performance measure dashboards, and scorecards. These tools and their respective outputs also aid in the prioritization of infrastructure improvement projects.

Hall 23
10. What business unit(s) is responsible for maintaining and configuring the tools for new users?
Alaska Division of Administrative Services. Colorado Governor’s Office of IT. Idaho ETS. Maryland Office of IT. Oregon
• Information Systems—Enterprise Technology. • GIS Unit. • Information systems—Field Services Unit. • Information systems—Transportation Application Development.
Utah IT. Virginia IT Division, Enterprise Data Management. 11. How many regular users are there for these tools (e.g., number of staff running at least one report every month)? Approximate number of regular users:
• Alaska: 50; • Colorado: 35; • Idaho: 15; • Maryland: 300; • Oregon: 1,500+; • Utah: 50; and • Virginia: 1,000.
PART II. SPATIAL DATA MANAGEMENT 12. Which of the following business applications provide integrated map-based query and reporting capabilities? (Check all that apply.)
• Road inventory—AK, CO, ID, IA, MD, OR, VA. • Crash data—AK, CO, ID, OR, VA. • Bridge management—AK, CO, ID, IA, OR, VA. • Pavement management—AK, CO, ID, OR, VA.

24 TR Circular E-C176: Integrating Spatial and Business Data for Improved Decisions
• Construction program management—CO, OR. • Maintenance management—CO, ID, OR, VA. • Financial management—MD, OR. • Right-of-way—OR. • Environmental—CO, MD, OR, VA. • HPMS—AK, CO, ID, IA, MD, OR, VA. • Incident management—ID, IA, MD, OR, VA. • Traffic monitoring—AK, ID, IA, MD, OR. • Integrated data viewer—AK, CO, IA, MD, OR, VA.
Other Alaska We are at the very beginning stages for our integrated map-based query and reporting capabilities. Our vision is to have a fully operational system by calendar year 2015. Additionally, we are deploying ArcGIS Online capability through the AASHTO Transportation Interest Group on Uplan. We hope this endeavor will provide data sharing and collaborative relationships with a broad group of stakeholders. Idaho ITD is working with Bio-West on the IPLAN project which will provide a centralized map-based query and reporting engine from a standard web browser, using data from the “to be” data warehouse. Iowa Aviation, Political Boundaries, Five-Year Plan, Project Scheduling System (this may be construction program management), snowplows, automatic traffic recorders, RWIS, Automated Weather Observing System. Maryland Accessibility, Access permits, Project Status, Total Maximum Daily Load, National Pollutant Discharge and Elimination (stormwater), District Traffic Studies. Oregon Access management, asset management, culverts, planning, wage determination, TransGIS Portal. Utah Utah has one enterprise tool that houses most of the data above. Utah has chosen not to build “viewing” GIS within systems. Virginia Virginia DOT has an enterprise mapping application where most datasets are available for analysis and review. Most business data are managed along Virginia DOT’s LRS, which is the source for the depiction of many data layers. 13. How are geospatial data made available to agency staff? (Check all that apply.)
• Web-based mapping application with multiple data layers for viewing—AK, CO, ID, IA, MD, OR, UT, VA.
• Web-based mapping application allowing data to be downloaded—AK, CO, IA, MD, OR, UT, VA.
• Files available for download from a web page—AK, CO, ID, IA, MD.

Hall 25
• On request from data owner—CO, ID, IA, MD, OR, UT. Other Alaska We are at various stages of operational capability for these areas, but are expanding each day. Iowa Representational State Transfer (REST) -compliant web services for direct connections to enterprise spatial databases. Maryland File server, map services, and external data portals. Oregon ArcGIS web-mapping services, ArcSDE, internal Networked Attached Storage and external Full Text Protocol site. 14. Have you integrated crowd sourcing–social media into your spatial data resource? In what areas do you see future growth for these data sources?
Alaska Not much yet. Potential areas are traveler information, maintenance deficiencies, and traffic incidents Colorado No. Future growth areas are the development of the statewide plan (a.k.a. long-range plan) and notification to customers when new data sets are published. Idaho The BlueToad tool uses the motorist’s Bluetooth devices to meter average speed and traffic volume. Iowa Looking into harvesting social media to detect transportation issues. Maryland We have a map-based application (in testing phase) for displaying planning projects that will allow the public to provide comments via Facebook and Twitter. Oregon No. Utah None to limited; we are experimenting with road condition data crowd sourcing. Future use in disaster relief could be priceless. Virginia Data are available for viewing from enterprise web-based map (Integrator), desktop apps (ArcMap, ArcGIS Explorer), and data are available (from ArcSDE).

26 TR Circular E-C176: Integrating Spatial and Business Data for Improved Decisions
PART III. LOCATION REFERENCING 15. What LRMs does your agency use for its various data sets (crash, pavement, bridge, projects, etc.)? (Check all that apply.)
• Route–milepoint—AK, CO, ID, IA, MD, OR, UT, VA. • Jurisdiction–route–milepoint—CO, IA, OR, VA. • Intersection–offset—CO, IA, OR, VA. • Route milepost offset—CO, IA, OR, VA. • Control section–offset—CO. • Street–address—OR, VA. • Latitude–Longitude—AK, CO, IA, MD, OR, UT, VA. • Project stationing—CO, OR.
Other Colorado Public Land Survey System. Idaho The base LRM for Idaho is segment–milepoint. This LRM can be converted into any number of alternate LRMs. Iowa Literal description. Oregon By description. 16. Does your agency have any of the following? (Check all that apply.)
• A centrally managed enterprise-level LRS—AK, CO, ID, IA, MD, OR, UT, VA. • An ability to automatically translate across different LRMs—CO, ID, IA, VA. • An ability to reference your spatial data to different geometric representations of the
road network—AK, CO, ID, IA, OR. • An automated capability to update your road network while maintaining valid
location references for existing business data on the network (e.g., change route numbers or section lengths without causing roadway attributes to move or disappear over time)—AK, ID, IA, OR, VA.
• A standard approach to integrating linearly referenced data from different points in time (e.g., a means to compare past and present roadway attributes)—AK, ID, IA, MD. 17. What software do you use for updating and managing your LRS?
• Custom built–“homegrown” software—AK, CO, IA, MD, UT, VA. Commercial Package Alaska We have the standard ESRI spatial products that include ArcMap, ArcServer, and SDE plus GeoNorth's MapOptix.

Hall 27
Idaho AgileAssets Network Manager. This is this company’s first implementation of this product. Maryland ESRI, Oracle, and custom applications. Oregon State highways: TransInfo, Bentley/ExOR with FME, ArcGIS, and Intergraph Geomedia. 18. How do you synchronize location referencing across different business applications (e.g., asset management, program development, operations)? (Check all that apply.)
• We use a single, standardized LRM across all applications—CO, OR, UT. • Our business applications support multiple LRMs—CO, MD. • We extract data from each system and use translation services or functions to convert
all data to a common LRM—AK, CO, IA, OR. • We manage locations for data in disparate business systems in a central database and
use database links or web services to maintain relationships between business attributes and locations—IA, VA.
• We use batch processes to periodically synchronize our location referencing in applications to our centrally maintained LRS—CO, IA, VA. Other Alaska We would like standardize to a single route–milepoint LRM but realize there will be situations that require a translation function. Our goal is to subscribe to the enterprise LRM as close to the business data collection as possible. Colorado Synchronized manual process to maintain unification of LRM across multiple business data sets. Idaho The primary LRMs are segment–milepoint and route–milepoint. Oregon Manual by description and conflation. Utah We send out e-mail alerts to database administrators on LRS changes. Some systems choose to update and some do not. We are moving toward primary latitude–longitude storage of features that will stay constant and creating a batch process to keep current LRMs in place in all business systems. Virginia The location of business data at Virginia DOT is managed in one of three ways:
• Location and business data maintained within the central RNS (e.g., speed zone data); • Location data only maintained within the RNS and business data maintained within
the business source system (e.g., bridge management); or • Location and business data are extracted and periodically synchronized with a
business source system (e.g., pavement management).

28 TR Circular E-C176: Integrating Spatial and Business Data for Improved Decisions
19. Does your agency have the capability to conduct trend analysis using linearly referenced data (e.g., crash rates, pavement condition)? If so, how does your agency accomplish temporal management of your roadway network and business data to enable this analysis? Alaska Our crash transition plan is in its first year. We are just getting started converting paper crash forms to electronic forms (TraCS and proprietary systems), which will provide crash location spatial coordinates. Pavement data are collected with a different inventory system than the road centerlines, but hopefully will be in a single contract later this year. Any roadway attribute can be extracted from the road centerlines and digital imaging. The GIS staff publishes the road network periodically for stakeholders to assign their business data to the road centerlines and LRS. Colorado Traffic safety assessments have the ability to conduct trend analysis. We have explored temporal analysis with other referenced data as pilot projects. We maintain archives of the yearly published LRS–LRM products back to mid-2000s. Idaho Yes, for pavement condition over time and traffic counts over time. The roadway network is temporally differentiated based on whether the feature “moves with the road” when the network changes. For example, pavement condition stays with the road when changes occur. Traffic data “moves with the road” when a realignment occurs based on business rules and specific attributes of the change occurring. Iowa Yes. Temporal management is handled in the linear referencing at a 1-day resolution dating back to January 1, 2001. Business systems can call the LRS with any supported LRS, either by SQL or web service. The call will convert the LRS to a datum reference based on the date and can then transform to another LRM. Iowa DOT requires business systems to store the date and datum reference. Maryland Maryland SHA runs a trend analysis quarterly for business plan reporting. We also create–store a new centerline and LRS every year. Oregon Yes, with annual coordinated and timed snapshots from various data sources and Oregon–Trans and TransInfo temporal features. Utah In GIS using ESRI time options and desktop analysis. This analysis is completed in depth using asset management software like Deighton Pavement Model. Virginia Virginia DOT does have the capability to conduct trend analysis using linearly referenced data. This type of analysis is currently being accomplished with static snapshots of data, insofar as this is being done. There is great analysis potential with the data. Virginia DOT publishes and maintains a quarterly snapshot of the enterprise LRS data as well as some business data elements (similar to HPMS snapshot). Virginia DOT is using ESRI Geodatabase Archiving for managing the temporality of some spatial data. Virginia DOT is investigating the use of Oracle Total Recall in order to better manage and utilize the temporal dimension of the business

Hall 29
data. With both of these elements in place, data (theoretically) can be walked back and forth through time on temporally different road networks. PART IV. INTEGRATING SPATIAL AND BUSINESS DATA 20. What technical integration method(s) do you use for integrating business and spatial data where spatial feature data are maintained separately from business data (e.g., web services, specialized views, etc.)? Alaska We use the standard packages listed for integrating business and spatial data, i.e., web services and specialized views. We have developed an integrated spatially enabled system for two of our core business areas: highway safety and traffic. The Spatially Integrated Roadway Information System (SIRIS) is the department’s geospatial–linear reference-based system for managing, linking, and accessing transportation data. It consists of three separate components: The Roadway Data System (RDS), Traffic System, and Crash System. SIRIS can also be integrated with other information systems, e.g., asset management, through spatial or linear referencing. RDS provides a common road centerline and LRS network for locating any transportation feature or attribute spatially or by route–milepoint. RDS contains the road centerline–LRS network, jurisdictional boundaries, and common roadway features and attributes. RDS provides capabilities for location referencing for any external transportation data set through the LRS and road centerlines.
ArcGIS Online is our most recent endeavor in integrating business and spatial data. We have established a small ArcGIS Online application for STIP projects; this application is public facing. Alaska DOTPF has applied for membership in AASHTO’s UPlan TIG. We expect membership later this year. Colorado Snapshot of database(s) is dynamically segmented to a calibrated route layer. Idaho There is direct system integration between the LRS and the maintenance–pavement management system. When changes occur to the LRS, they are pushed across the direct interface to update the business data based on business rules. Iowa Heterogeneous database connections, REST-based service, and database links. Maryland Web services, views, and database links. Oregon X,Y event location and dynamic segmentation. Utah Web services approach and views. We use a custom common map element called iMAP for use in generating LRS measures for new projects. Virginia Virginia DOT generally uses database processes (e.g., database batch packages) and web–windows services to synchronize the spatial and business data with other systems. For example, the synching of bridge data is accomplished every evening via a database batch

30 TR Circular E-C176: Integrating Spatial and Business Data for Improved Decisions
process. The consuming and publishing of crash data are accomplished every evening via windows–web services. Other components utilize real-time connections via spatial data views. 21. Do you have capabilities to integrate business and spatial data in real time or do you utilize batch processes? Please provide an example. Alaska ArcGIS Online is probably as close to addressing this as anything else we have done. Otherwise, we use the Published Road Centerline Network as the reporting schema to serve production data to the end users who in turn integrate their business data with the road network. This allows data elements to be visually displayed without the need for the users to maintain their own centerline–LRS network. Colorado No real-time capabilities. Idaho Any integration will be a batch-based interface or web service such as described during changes to the LRS. Iowa Both real time and batch. Use spatial databases to manage information and REST end points to merge data together. For example if a web page is needed for a mobile phone or desktop, we can use REST endpoints and add them to a web map. We leverage Geocortex Essentials, JavaScript, or ArcGIS online for this. Maryland We mostly utilize batch processes. Some integration is real-time. For example, our Coordinated Highways Action Response Team system has real time feeds for traffic operations, weather, dynamic messaging signs, videos, etc. Oregon Batch and consume from query layers, i.e., Speedmap uses hardware loops in road and information is consumed by web applications with real time updates in 2-min intervals. The TransInfo state highway database maintains spatial data and assets together in real time. Utah Batch process updated nightly. We use dynamic segmentation from our business tables weekly for our sign data. Virginia Both batch and real-time processes are used. Batch processes include bridge management, pavement management, etc. Real time processes include environmental project management, speed zone data, etc. 22. Do you have the capability to create tabular reports of road inventory characteristics and dynamically segment the data based on user-selected attributes, for example, break sections along a route whenever number of lanes or pavement type changes? Alaska Yes. We are working on a new text log application that will deliver tabular reports of selected road inventory characteristics based on user input. Colorado Yes, but not at the user’s request. This is part of the publication process. Please see Question 20.

Hall 31
Idaho To a limited extent. The AgileAssets Asset Management system contains a “finest partition” component that allows some reporting as described. There is a legacy capability on the mainframe to do this as well. Iowa Yes. Maryland Yes. Oregon Yes, we provide a web application where users can select highway and milepoint ranges and receive a canned tabular report. We also provide ad hoc reports upon request. Virginia Virginia DOT has the technology and data available to dynamically segment the data, and have conducted some efforts to this end. There are tradeoffs, however, to doing this type of analysis on-the-fly, with performance of the reporting being the obvious first item. 23. In which of the following areas does your agency currently use integrated spatial and business data for decision making?
• Safety analysis—CO, ID, MD, OR, VA. • Pavement management—CO, ID, MD, OR, UT, VA. • Bridge management—CO, ID, IA, MD, OR, UT, VA. • Maintenance management—CO, ID, MD, OR, UT. • Performance management—CO, ID, OR. • Project scoping—CO, ID, IA, MD, OR. • Environmental assessment—CO, IA, MD, OR, UT, VA. • Capital program development—IA. • Traffic operations—CO, ID, IA, MD, OR, VA.
Other Alaska None at this time, as we are in year one of the mainframe transition from our legacy system to the GIS-enabled highway data warehouse. By calendar year 2015, we should be able to check off
1. Safety, 2. Pavement management, 3. Bridge management, 4. Maintenance management, 5. Project scoping, 6. Traffic operations, 7. Traveler information, and 8. RWIS.

32 TR Circular E-C176: Integrating Spatial and Business Data for Improved Decisions
Specific Examples Colorado Maintenance levels of service can be determined in SAP for each of nine maintenance program areas for each of 15 maintenance sections in Colorado. Idaho High-accident locations are easily represented on a map and can be analyzed in a variety of ways: time of day, accident severity, driver information, causation, and weather conditions. These data can provide information to inform decisions. Oregon Access management, aggregate sites, rockfalls, planning documentation, project locating tool, Safety Priority Index System, work planning, speed maps, etc. Virginia These studies then help to determine if any safety improvements can be made to reduce the number of crashes (e.g., motorcycle crashes on VA-221 along meandering and graded curves). This is also used to study guardrail placement, line-of-sight, enforcement areas, etc. 24. Please list specific benefits your agency has been able to realize through integrating business and geospatial data. If you have quantified these benefits, are you willing to share your analysis? Alaska
• A methodology and applications to automate the maintenance of roadway-related features and attributes.
• A common frame of reference for roadway-related features and attributes, i.e., the route- and milepoint-based centerline–linear reference network.
• The ability to maintain event attributes and locations in separate systems. • The ability to visualize multiple roadway attributes for project selection, tradeoff
analysis, and business area analysis, e.g., highway safety analysis. Colorado The Transportation Commission can visualize by map the condition of pavement for a variety of categories of the network (e.g., Interstate versus non-Interstate, National Highwa System (NHS) versus non-NHS, by volume, or by truck volume). Colorado DOT’s Online Transportation Information Systems and YourCDOTDollar.com depict geographic performance, project, and other information for internal and external users. Idaho Better decision making and more robust investment analysis. Iowa Geospatial web services and a database central, software neutral approach to data allows us to create data once and use many times. Data from HPMS can be leveraged in a portal to the public or another portal internal to the network. DOT staff has the ability to connect directly to the raw data with GIS software or any report builders. We have not quantified these benefits. Maryland Reduce redundancy, increase efficiency, and enable better collaboration.

Hall 33
Oregon Consistent and current reporting and the ability to synthesize disparate data. We have not quantified these benefits. Oregon DOT Project Tracking Map makes Oregon DOT construction project data available to the general public. The benefit of this project tracking map is improved transparency and accountability. Utah Data visualization, i.e., making our data work for us. There is one source of data. 25. What new capabilities would you like to see your agency develop in the next few years for integrating business and spatial data in the above areas? Alaska
• Enterprise data collection plan. • Full ArcGIS online deployment. • User applications that meet their spatial information needs. • Improved knowledge management. • Basemap and LRS for all public roads with an update strategy. • As-built plans delivered with the projects that depict the road geometry and
centerlines that can be electronically processed into the geodatabase. • Fully deployed data governance and data stewardship • IT environment that can meet the present and future DOT spatial information needs. • Improved linkage and integration of the DOT transportation data to the road
centerline network.
Colorado Report performance for any area selected by the user for pavement, bridge, maintenance, and other assets as well as safety and mobility. Manage the distribution of the management of business data and LRS integration to multiple business users. Idaho
• Broad-based impact analysis for projects. • Maximum ROI. • Higher speed–efficiency, more automation, less manual work. • Integration of mobile devices for view and capture–edit of enterprise data. • More informed decisions.
Iowa Pull data from CADD and develop processes to eliminate field collection. Add a maintenance management system to manage changes to field assets and conditions (signs, guardrails, etc.). Encourage use of more software as a service for DOT customers (local, county, state, and consultants). Retrofit geometry to financial and other nonspatial business systems. Investigate crowd sourcing. Maryland Risk assessment-based asset management, better decision-making capabilities based on data–analysis and right-of-way management.

34 TR Circular E-C176: Integrating Spatial and Business Data for Improved Decisions
Oregon Easier web-delivered editing tools. Consistent LRS on all public roads. Utah Dynamic clash detection on project programs and assets. Virginia Enact a geospatial data policy for the agency that has requirements for spatial data standards, collection, and management. Policy should also allow for establishing a process to retrofit existing systems with location data elements where appropriate. Standardize the mechanisms with which mobile-based data collectors–apps are consuming–supplying data to the enterprise. Establish standards for the currency of data collection (e.g., how often does a given asset need to be collected). Does a one-time data collection every number of years support the business processes and needs? Or is continuous collection and inventory needed? Establish services with which systems can easily integrate with or leverage enterprise datasets (e.g., LRS, boundaries), and clearly delineate what the data are recommended for and what the data should not be used for. 26. Has your agency made use of any spatial business analytics to perform statistical analysis, predictive modeling, visualization, and forecasting? If so, please describe. Alaska N one yet. Colorado Mostly visualization through www.YourCDOTDollar.com and mapping of asset condition. Idaho Not currently occurring, but IDT is interested in this area. IDT has some projects in process that may provide this capability, e.g., ICAPS, IPLAN. Iowa TransCAD for doing statewide model. Starting to work with pavement attributes, social media. Maryland Yes, we model and forecast congestion and overlay with safety data for decision making and project investment. Oregon Predictive Site Location for Solar Highway prototype. Oregon DOT also uses some planning modeling and participation in the processing of climate data for planning future transportation adaptation strategies. Utah No. Virginia Virginia DOT has made use of spatial analysis for visualization and some statistical analysis. These efforts have been conducted with crash (and related) data, some asset data, some pavement data, and traffic data. Some additional work has been conducted with traffic engineering and transportation planning-related tools (corridor simulation, network modeling). However, this is just the beginning of what is possible.

Hall 35
27. What formal or informal data governance processes do you have in place to ensure that spatial and business data are available across the organization? What are your major challenges in this area?
Alaska We have introduced a draft data governance policy to the TAM Steering Committee. The TAM Data Integration Committee will address this at some point. Within the Program Development Division, we have prepared a draft data business plan and established many of the data governance structures that we need. This plan addresses many of the national best practices that have been documented in NCHRP reports and other publications. We hope to finalize the Data Business Plan by calendar year 2015, when the mainframe transition is complete and the formal TAM data governance policy is in place.
Major challenges include the following:
• Stovepipe data collection and database efforts; • Lack of adequate enterprise data governance policies; • Slow implementation of specific data governance items, i.e., establishing roles and
responsibilities such as assigning data ownership and data stewards; • Slow deployment of the IT infrastructure to support an enterprise data warehouse; and • Implementation.
Colorado Colorado DOT has established a Knowledge Management Governance Oversight Committee tasked with developing and managing the data governance strategy for the organization. Major challenges include more issues than time to solve issues, defining terms and thesaurus, and policy. Idaho There are requirements for data dictionaries, data models for data analysis, and architectural review on projects. Additionally there are standard operating procedures for managing change to the LRS. Iowa Iowa DOT has a governance process and guidelines in place but there are struggles to enforce. Challenges are people, policy and procedural barriers and not technical. A new performance division was formed in 2012 and that division will address barriers. Maryland We take an enterprise GIS approach to sharing data. A major challenge is with data maintenance. Oregon Governance is provided by GIS and Asset Management Steering Committees. There are data sharing agreements with business lines and deliveries of read–access data through web applications. Utah We determine the steward of each dataset before moving it into our spatial data warehouse. This steward not only determines the security of the data layer but also the responsibility down to each field in the data. Challenges are providing the steward to manage the data throughout the process. This is not position-specified and causes a lot of work on the GIS staff.
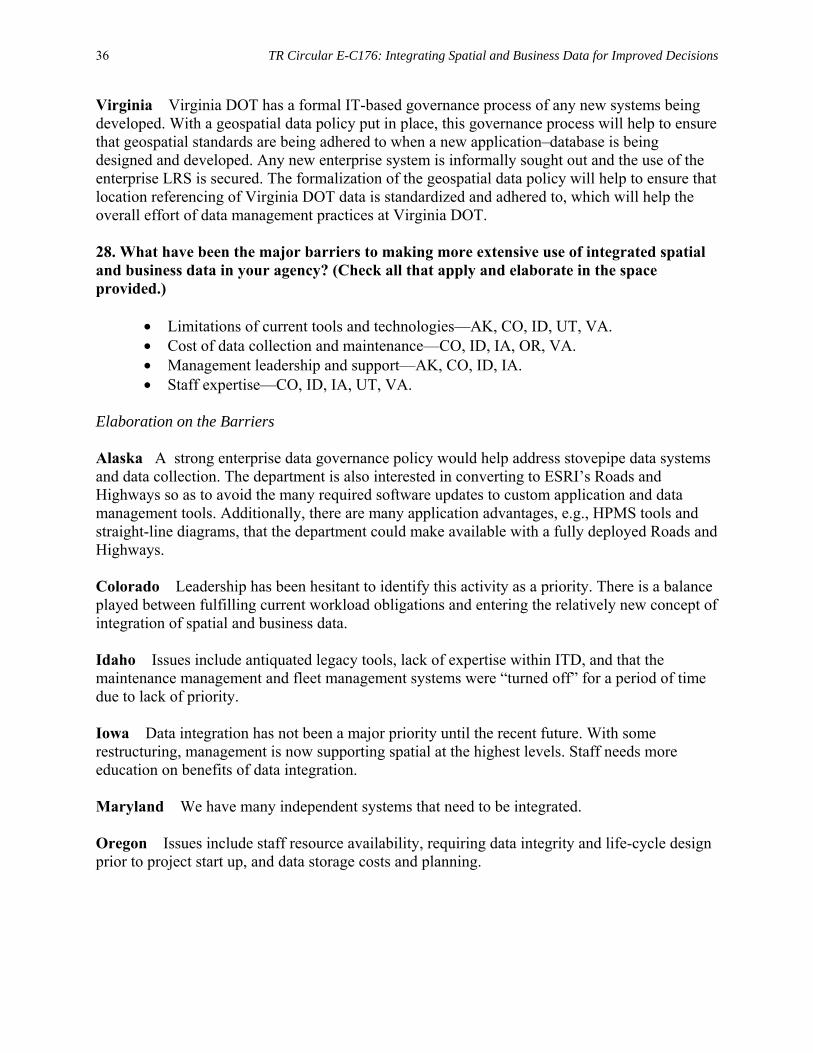
36 TR Circular E-C176: Integrating Spatial and Business Data for Improved Decisions
Virginia Virginia DOT has a formal IT-based governance process of any new systems being developed. With a geospatial data policy put in place, this governance process will help to ensure that geospatial standards are being adhered to when a new application–database is being designed and developed. Any new enterprise system is informally sought out and the use of the enterprise LRS is secured. The formalization of the geospatial data policy will help to ensure that location referencing of Virginia DOT data is standardized and adhered to, which will help the overall effort of data management practices at Virginia DOT. 28. What have been the major barriers to making more extensive use of integrated spatial and business data in your agency? (Check all that apply and elaborate in the space provided.)
• Limitations of current tools and technologies—AK, CO, ID, UT, VA. • Cost of data collection and maintenance—CO, ID, IA, OR, VA. • Management leadership and support—AK, CO, ID, IA. • Staff expertise—CO, ID, IA, UT, VA.
Elaboration on the Barriers Alaska A strong enterprise data governance policy would help address stovepipe data systems and data collection. The department is also interested in converting to ESRI’s Roads and Highways so as to avoid the many required software updates to custom application and data management tools. Additionally, there are many application advantages, e.g., HPMS tools and straight-line diagrams, that the department could make available with a fully deployed Roads and Highways. Colorado Leadership has been hesitant to identify this activity as a priority. There is a balance played between fulfilling current workload obligations and entering the relatively new concept of integration of spatial and business data. Idaho Issues include antiquated legacy tools, lack of expertise within ITD, and that the maintenance management and fleet management systems were “turned off” for a period of time due to lack of priority. Iowa Data integration has not been a major priority until the recent future. With some restructuring, management is now supporting spatial at the highest levels. Staff needs more education on benefits of data integration. Maryland We have many independent systems that need to be integrated. Oregon Issues include staff resource availability, requiring data integrity and life-cycle design prior to project start up, and data storage costs and planning.

Hall 37
Virginia
• Resource availability: not enough staff or budget available to not only evangelize the integration of spatial and business data, but to implement the integration.
• Outreach and education: need to spend more time and effort on providing the business users with the knowledge, skills, and abilities to make effective use of their data that has a location component.
• Thinking spatially: need to spend more time and effort on providing non-spatial IT development staff the knowledge, skills, and abilities to ensure that location data are collected and managed effectively.
• Data quality assurance–quality control: if requiring systems and business units to location reference their data (e.g., using the LRS), the quality and completeness of the LRS should be the primary concern. However, with the vast amount of data, and the relative complexity of LRS–LRM interaction, it has been a source of significant frustration to the business when the LRS data that they need is not valid or is still undergoing processing. PART V. QUESTIONS AND CONCERNS 29. What questions do you have for your peers regarding integration of spatial and business data for better decision making? Colorado
• What technology–processes are used to integrate multiple systems to a single platform for visualization?
• We would like to see more case studies from other DOTs demonstrating success. Idaho
• What is your greatest challenge? • Your greatest achievement? • How have you handled (if you have) dual carriageways, i.e., associating and
disassociating attribute and business data?
Maryland: We are interested in challenges faced by other DOTs and lessons learned. Oregon: In general, want to take this opportunity to learn more about other states’ practices in this area.
Utah
• Who owns the enterprise data process, e.g., the business or the IT divisions. Who dictates schedule, scope, budget, and prioritizes tasks?
• Custom or customized off-the-shelf, what is the current breakdown of your architecture? • Where has GIS been most successful?

38 TR Circular E-C176: Integrating Spatial and Business Data for Improved Decisions
Virginia
• How effective have geospatial data policies been in either standardizing how location data are being collected and managed or requiring systems to collect–manage location data?
• How are centerline data (federal roads, state roads, local roads) being managed–collected within the respective states?
• What successes have been found in conducting outreach–training activities with business units on GIS and the integration of spatial and business data?
• How does the DOT make your enterprise LRS available to other systems (internal versus external)?
• How is the rate of business buy-in, has there been any pushback because of changes in the business process and the additional workload of locating data (real or imagined)? 30. Does your agency have specific concerns about MAP-21 data and performance reporting requirements that you would like to discuss at this Peer Exchange? If so, please describe. Alaska T he state basemap requirement. Colorado
• Performance targets may be established for portions of the network beyond control and ownership of the state DOT. How will the state DOT gather and report this information and at what expense?
• How will system performance be reported—locally, regionally, statewide? • Is it meaningful to have a statewide reliability or congestion performance measure? • What process will integrate MPO and state reporting? • Should a state DOT take the lead in determining data collection, reporting, and
measurement methodologies? Idaho Not at this time, but we are interested in hearing what other peer agencies have to say about the “all roads” initiative. Maryland No. Oregon We expect many new data requirements to come from MAP-21 rule making. We need to ensure that the data requirements are what states can actually use and not just “nice to have.” In addition, we may need to choose to discontinue some existing data collection to be able to free up resources to collect the new data. Utah
• How as DOTs can we be prepared better to respond to the requirements? Is there a common platform or data model that might help?
• How important is GIS to your DOT when it comes to MAP-21? • For the all public roads LRS, what is your plan?

39
High-Priority Research Needs Statements
he following research needs statements were generated and identified as a priority by the Integrating Spatial and Business Data for Improved Decisions Open Architecture Peer
Exchange held May 4–5, 2013, in Boise, Idaho. The peer exchange brought together state transportation agency managers, IT experts, and GIS specialists to share experiences in integrating spatial and business data for improved decisions. A total of 15 state agency representatives from eight states and seven additional federal, university, and private agency representatives participated in the Peer Exchange in active discussion groups. The following high-priority research needs area was identified. A full description follows.
1. Capability Maturity Model for the Integration and Use of Geospatial and Business Data.
2. Spatial Portrayal of Performance Measures. 3. Peer Exchange on Aligning Data Systems to Communicate with Decision Makers
Supporting Risk-Based Asset Management.
T

40
HIGH-PRIORITY RESEARCH NEEDS STATEMENT 1
Capability Maturity Model for the Integration and Use of Geospatial and Business Data
JOHN SELMER
Iowa Department of Transportation
STEVE QUINN Utah Department of Transportation
WILLIAM JOHNSON
Colorado Department of Transportation
GEORGE CROWDER Alaska Department of Transportation and Public Facilities
JAMES P. HALL
University of Illinois–Springfield
he spatially referenced information and data resources of transportation agencies are valuable to decision-making activities in such critical areas as asset management, safety
engineering, and program development. However, the management of the spatial data infrastructure has become increasingly complex with enterprise deployment of integrated systems, data stewardship responsibilities, and a growing multifaceted portfolio of internal and external spatial data sources and formats. The accessibility of interactive spatial information and decision-support products is also important to internal and external users. The evolving sophistication of spatial BI tools and data analysis methodologies requires advanced data integration and spatial information management techniques.
In May 2013, a peer exchange was held with eight state transportation agencies on the topic of integrating spatial and business data for improved decisions. The peer participants included spatial information specialists, IT directors, and senior management. Participants identified the following problem areas in managing the spatial data infrastructure in transportation agencies:
• Lack of knowledge of spatial data architectures and systematic solutions for spatial information storage and growth;
• Difficulties in the synchronization of multiple referencing methods in a single LRS;
• Inability to accommodate evolving “big data” management and analysis techniques;
• Lack of models for the development of spatial information reporting ; • Difficulties in managing the historical spatial data resource for analysis and
forecasting;
T
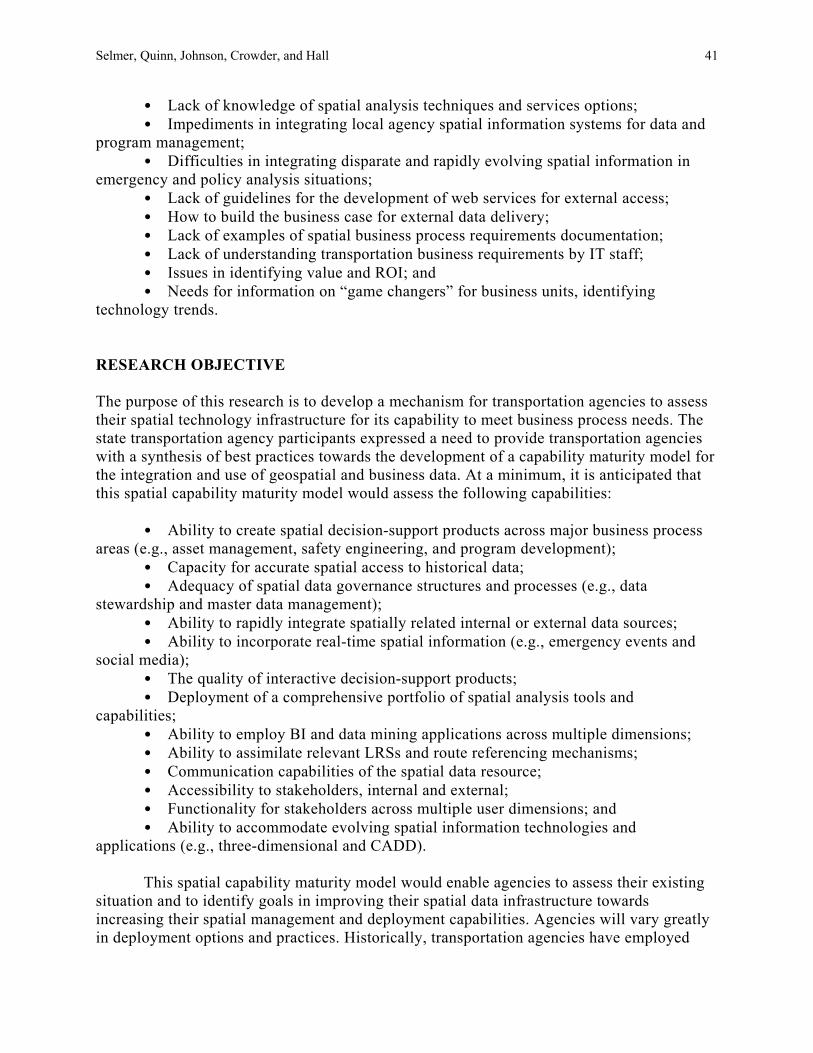
Selmer, Quinn, Johnson, Crowder, and Hall 41
• Lack of knowledge of spatial analysis techniques and services options; • Impediments in integrating local agency spatial information systems for data and
program management; • Difficulties in integrating disparate and rapidly evolving spatial information in
emergency and policy analysis situations; • Lack of guidelines for the development of web services for external access; • How to build the business case for external data delivery; • Lack of examples of spatial business process requirements documentation; • Lack of understanding transportation business requirements by IT staff; • Issues in identifying value and ROI; and • Needs for information on “game changers” for business units, identifying
technology trends. RESEARCH OBJECTIVE The purpose of this research is to develop a mechanism for transportation agencies to assess their spatial technology infrastructure for its capability to meet business process needs. The state transportation agency participants expressed a need to provide transportation agencies with a synthesis of best practices towards the development of a capability maturity model for the integration and use of geospatial and business data. At a minimum, it is anticipated that this spatial capability maturity model would assess the following capabilities:
• Ability to create spatial decision-support products across major business process areas (e.g., asset management, safety engineering, and program development);
• Capacity for accurate spatial access to historical data; • Adequacy of spatial data governance structures and processes (e.g., data
stewardship and master data management); • Ability to rapidly integrate spatially related internal or external data sources; • Ability to incorporate real-time spatial information (e.g., emergency events and
social media); • The quality of interactive decision-support products; • Deployment of a comprehensive portfolio of spatial analysis tools and
capabilities; • Ability to employ BI and data mining applications across multiple dimensions; • Ability to assimilate relevant LRSs and route referencing mechanisms; • Communication capabilities of the spatial data resource; • Accessibility to stakeholders, internal and external; • Functionality for stakeholders across multiple user dimensions; and • Ability to accommodate evolving spatial information technologies and
applications (e.g., three-dimensional and CADD).
This spatial capability maturity model would enable agencies to assess their existing situation and to identify goals in improving their spatial data infrastructure towards increasing their spatial management and deployment capabilities. Agencies will vary greatly in deployment options and practices. Historically, transportation agencies have employed

42 TR Circular E-C176: Integrating Spatial and Business Data for Improved Decisions
different organizational models to develop GIS applications. Implementation techniques vary widely based on existing technical architectures, information system management practices, business process organization, and organizational culture.
However, to assist agencies in implementation planning, the development of this model should be packaged with the identification of best practices and successful implementation strategies.

43
HIGH-PRIORITY RESEARCH PROBLEM STATEMENT 2
Spatial Portrayal of Performance Measures
BRYAN KELLEY Virginia Department of Transportation
WILLIAM JOHNSON SCOTT RICHRATH
Colorado Department of Transportation
FRANCES HARRISON Spy Pond Partners, LLC
BRIAN DERSTINE
Iteris
IS and BI tools have evolved to enable exploration, analysis and reporting of performance data with tight integration across spatial, tabular, and chart views. Many state DOTs and
MPOs are interested in developing or enhancing existing BI capabilities and dashboards for representing a range of agency and system performance metrics, including, but not limited to, asset condition, maintenance level of service, travel time and system reliability, fatalities and serious injuries, and project delivery (on time and on budget). Some of the existing systems incorporate spatial views, but there are relatively few examples of how spatial views can be seamlessly integrated into the BI environment. A collection of working examples and prototype models for both exploratory analysis environments as well as executive and public-facing dashboards would be very helpful, allowing agencies to adopt successful features and maximize value from their individual efforts. RESEARCH OBJECTIVE The objective of this effort is to compile successful models of dashboards and other BI tools that seamlessly integrate spatial data views to support decision making. It could involve the following activities:
• Survey of current examples within transportation agencies; • Survey of current examples within other public-sector agencies and private-sector
organizations; • Contest for innovative performance data exploration environments, held in
conjunction with a future TRB or GIS-T conference; and • Synthesis of successful practices—including design elements, tool integration, and
data integration methods—for use for decision making.
G

44 TR Circular E-C176: Integrating Spatial and Business Data for Improved Decisions
QUESTIONS FOR PROPOSAL AUTHORS Focus on transportation asset management to take advantage of interests of participants attending the conference.

45
HIGH-PRIORITY RESEARCH PROBLEM STATEMENT 3
Peer Exchange on Aligning Data Systems to Communicate with Decision Makers Supporting Risk-Based Asset Management
JERRI BOHARD
Oregon Department of Transportation
GREG SLATER Maryland State Highway Administration
PENELOPE WEINBERGER
AASHTO
TERRY BILLS ESRI
tate DOTs have a long history of creating and maintaining data programs that capture and report transportation asset condition (e.g., pavement management systems) and performance
(e.g., traffic monitoring programs). Still, senior decision makers sometimes feel they lack the data necessary to support major investment and policy decisions. They often seek information about the broader context and outcomes of transportation improvements, such as economic development, jobs, equity, and sustainability. Because transportation benefits, costs, and impacts are inherently distributed over space and associated demographics, spatial and visual presentations of data can provide insights into the ways outcomes are distributed across different areas and populations.
The purpose of this peer exchange is to identify both good practices in data programs for supporting decision processes, from collection to delivery, as well as areas where improvements are both desirable and feasible. To accomplish this, the exchange will bring together teams of state transportation decision makers and information professionals who will present a series of case studies that illustrate the types of information senior decision makers need and want, effective strategies for delivering that information, and ultimately, the value of good information for supporting transportation decision making.
The presentation teams will be composed of at least two representatives from each of six or seven states, who will prepare in advance and present examples of both successes and challenges in the collection, analysis, and delivery of information for decision making. State teams would include an executive from each participating state, as well one or more supporting data systems practitioners (e.g., analysts, GIS, visualization, and communication specialists). Presentations may include interactive displays of graphical products.
These presentations will contribute to improving our understanding of how transportation executives use information in decision making, what works and does not, and ideas for better aligning data programs, and analysis and display tools with user needs and capabilities.
As cases are presented, peer participants will work together to
S

46 TR Circular E-C176: Integrating Spatial and Business Data for Improved Decisions
• Examine successes and challenges in communicating information that is usable, useful, and used in decision making.
• Identify challenges of building and sustaining processes that transform data into useful information for decision support, keeping data current, integrating data spatially from multiple sources, and building and maintaining analysis, mapping and visualization skills.
• Explore appropriate investment levels for data collection, analysis, and presentation in light of both the value of essential information and contemporary funding constraints.
• Suggest actions and research initiatives that would improve the use of data systems and tools in supporting decision making.
• Prepare a presentation for the Asset Management Conference that follows the peer exchange.
• Produce a Transportation Research E-Circular to disseminate the results of this peer exchange.
This peer exchange is designed to precede and support the April 28–30, 2014, Transportation Asset Management Conference. The planning committee is seeking presentations that are relevant to the peer theme. The following topics are included in their call for presentations:
• Communicating within the organization, to lawmakers, and to the public. • Documenting successful approaches to communicating data-derived outcome
estimates that affect project programming and prioritization. • Showcasing methods to integrate geospatial information into decision-support
processes.
To take advantage of this interest, state peer participants will be encouraged to use asset management case studies where appropriate. RESOURCES Conference Proceedings on the Web 12: Adapting Freight Models and Traditional Freight Data
Programs for Performance Measurement, Transportation Research Board of the National Academies, Washington, D.C., forthcoming November 2013. http://onlinepubs.trb.org/onlinepubs/conf/ CPW12.pdf.
Conference Proceedings on the Web 9: Meeting Critical Data Needs for Decision Making in State and Metropolitan Transportation Agencies, Transportation Research Board of the National Academies, Washington, D.C., 2013. http://onlinepubs.trb.org/onlinepubs/conf/CPW9.pdf.
Transportation Research Circular E-C109: Transportation Information Assets and Impacts: An Assessment of Needs, Transportation Research Board of the National Academies, Washington, D.C., 2006. http://onlinepubs.trb.org/onlinepubs/circulars/ec109.pdf.
Transportation Research Circular E-C115: Challenges of Data for Performance Measures: A Workshop, Transportation Research Board of the National Academies, Washington, D.C., 2007. http://onlinepubs. trb.org/onlinepubs/circulars/ec115.pdf.
Transportation Research Circular E-C121: Information Assets to Support Transportation Decision Making: Report of a Peer Exchange of State Transportation Organizations, Transportation Research

Selmer, Quinn, Johnson, Crowder, and Hall 47
Board of the National Academies, Washington, D.C., 2007. http://onlinepubs.trb.org/onlinepubs/ circulars/ec121.pdf.

48
APPENDIX
List of Acronyms
AASHTO American Association of State Highway and Transportation Officials DOT&PF Department of Transportation and Public Facilities (Alaska) AK Alaska ASIS AASHTO Subcommittee on Information Systems BI business intelligence CADD computer-aided drafting and design CO Colorado DOT department of transportation eGIS Enterprise GIS Portal (Maryland) EAI Enterprise application integration ETL extract, transform, load ETS Enterprise technology services FHWA Federal Highway Administration FME feature manipulation engine GIS geographic information system GIS-T GIS for transportation HPMS Highway Performance Monitoring System HR human resources HSIP highway safety improvement program IA Iowa ICAPS Investment Corridor Analysis Planning System (Idaho) ID Idaho IT information technology ITD Idaho Transportation Department ITGC Idaho’s Information Technology Governance Council IRS intelligent transportation system LRM linear referencing method LRS linear referencing system MAP-21 Moving Ahead for Progress in the 21st Century Act MD Maryland MPO metropolitan planning organization NCHRP National Cooperative Highway Research Program OGIC Oregon Geographic Information Council OTIS Online Transportation Information System (Colorado) RDS Roadway Data System (Alaska DOT&PF) REST Representational State Transfer RNS Roadway Network System (Virginia DOT) ROI return on investment RWIS road weather information system SHA State Highway Administration (Maryland) SIRIS Spatially Integrated Roadway Information System (Alaska DOT&PF)

Selmer, Quinn, Johnson, Crowder, and Hall 49
SQL structured query language SSIS SQL server integration services STIP statewide transportation improvement program TAM transportation asset management TAMIS Transportation Asset Management Information System (Alaska DOT&PF) TIG Technology Implementation Group TRB Transportation Research Board UT Utah VA Virginia


The National Academy of Sciences is a private, nonprofit, self-perpetuating society of distinguished scholars engaged in scientific and engineering research, dedicated to the furtherance of science and technology and to their use for the general welfare. On the authority of the charter granted to it by the Congress in 1863, the Academy has a mandate that requires it to advise the federal government on scientific and technical matters. Dr. Ralph J. Cicerone is president of the National Academy of Sciences. The National Academy of Engineering was established in 1964, under the charter of the National Academy of Sciences, as a parallel organization of outstanding engineers. It is autonomous in its administration and in the selection of its members, sharing with the National Academy of Sciences the responsibility for advising the federal government. The National Academy of Engineering also sponsors engineering programs aimed at meeting national needs, encourages education and research, and recognizes the superior achievements of engineers. Dr. C. D. (Dan) Mote, Jr., is president of the National Academy of Engineering. The Institute of Medicine was established in 1970 by the National Academy of Sciences to secure the services of eminent members of appropriate professions in the examination of policy matters pertaining to the health of the public. The Institute acts under the responsibility given to the National Academy of Sciences by its congressional charter to be an adviser to the federal government and, on its own initiative, to identify issues of medical care, research, and education. Dr. Harvey V. Fineberg is president of the Institute of Medicine. The National Research Council was organized by the National Academy of Sciences in 1916 to associate the broad community of science and technology with the Academy’s purposes of furthering knowledge and advising the federal government. Functioning in accordance with general policies determined by the Academy, the Council has become the principal operating agency of both the National Academy of Sciences and the National Academy of Engineering in providing services to the government, the public, and the scientific and engineering communities. The Council is administered jointly by both Academies and the Institute of Medicine. Dr. Ralph J. Cicerone and Dr. C. D. (Dan) Mote, Jr., are chair and vice chair, respectively, of the National Research Council. The Transportation Research Board is one of six major divisions of the National Research Council. The mission of the Transportation Research Board is to provide leadership in transportation innovation and progress through research and information exchange, conducted within a setting that is objective, interdisciplinary, and multimodal. The Board’s varied activities annually engage about 7,000 engineers, scientists, and other transportation researchers and practitioners from the public and private sectors and academia, all of whom contribute their expertise in the public interest. The program is supported by state transportation departments, federal agencies including the component administrations of the U.S. Department of Transportation, and other organizations and individuals interested in the development of transportation. www.TRB.org
www.national-academies.org

TRANSPORTATION RESEARCH BOARD500 Fifth Street, NWWashington, DC 20001