integrating the quantifiler duo dna quantification kit ... › content › dam › lifetech ›...
TRANSCRIPT

Integrating the
Quantifiler®
Duo DNA Quantification Kit with the
AmpFℓSTR®
Yfiler®
PCR Amplification Kit in Sexual Assault Investigations
Lisa Calandro, M.P.H.Sr. Manager, Technical Marketing

2 © 2007 Applied Biosystems
Outline
●
Introduction●
Y STR analysis
●
Quantifiler®
Duo assay specificity and efficiency●
Performance with mixture samples
●
Performance with inhibited and degraded samples●
Correlation to AmpFℓSTR®
Yfiler®
kit performance●
Conclusions

Y STR Analysis

4 © 2007 Applied Biosystems
When Are Y STRs Used in Forensic Casework?*
●
Autosomal testing yields little or no male DNA profile–
Samples where female DNA is in vast excess of male DNA–
Low level minor male -
interpretation tricky or impossible●
Very few or no sperm are detected●
Differential extraction is not possible –
non sexual assault samples●
Clarify the number of male contributors●
“Last resort”
type of testing:–
Cold cases–
Post-conviction cases
*Source: Cassie Johnson, Orchid
5 © 2007 Applied Biosystems
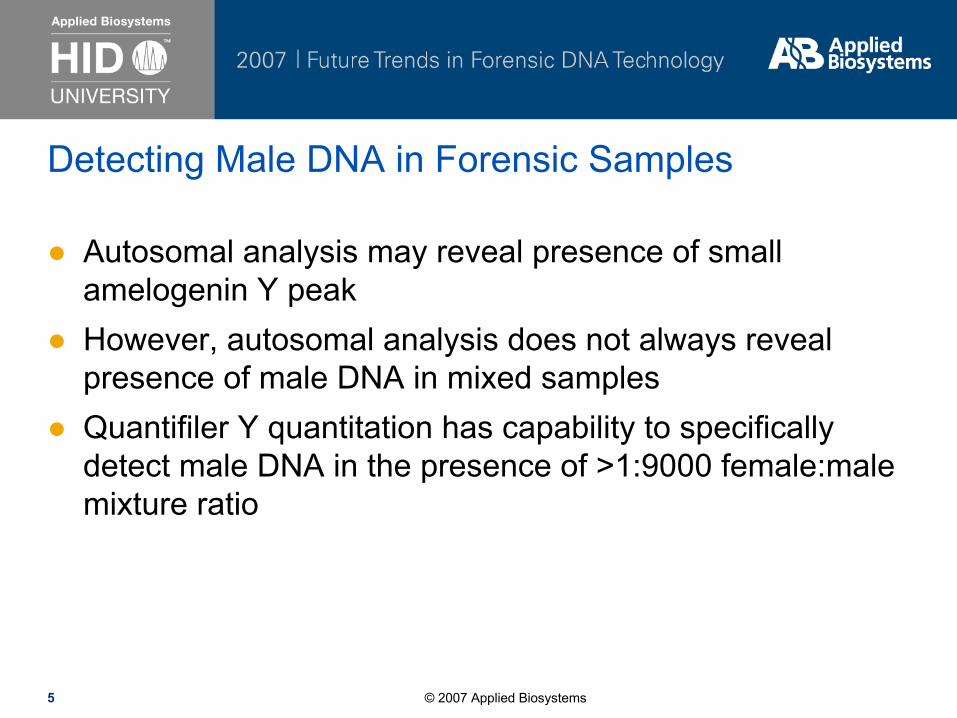
Detecting Male DNA in Forensic Samples
●
Autosomal analysis may reveal presence of small amelogenin
Y peak
●
However, autosomal analysis does not always reveal presence of male DNA in mixed samples
●
Quantifiler Y quantitation has capability to specifically detect male DNA in the presence of >1:9000 female:male mixture ratio

6 © 2007 Applied Biosystems
AmpFℓSTR®
Yfiler®
Amplification Kit Overview
●
Amplifies 17 loci in a single reaction using 5-dye chemistry for increased discrimination capacity–
Same dye set used with the AmpFℓSTR®
Identifiler®
Kit
●
Provides specific and sensitive detection of male DNA in the presence of high concentrations of female DNA
●
Developed and validated specifically with the Quantifiler™
Human and Y Human Male Assays
●
User-friendly YfilerTM
haplotype database
●
Validated for use with ABI PRISM®
310, 3100, 3100-Avant Genetic Analyzers and Applied Biosystems 3130 and 3130xl Genetic Analyzers

7 © 2007 Applied Biosystems
YDYS19
DYS389I/II
DYS390
DYS391
DYS392
DYS393
DYS385a/b
DYS437
DYS438
DYS439
DYS448
DYS456
DYS458
DYS635
Y GATA H4
European
Minimal
Haplotype
SWGDAM
ABI
AmpFSTR®
Yfiler®
Kit
17 Y-STR Loci

8 © 2007 Applied Biosystems
Identifiler Analysis of Casework Sampleª
* Since no male DNA detected, a range of input DNA will be amplified in Yfiler
* Lip/breast swabbing from female victim of oral assault
ªSource: Joe Varlaro, Spencer Laboratories, Inc.

9 © 2007 Applied Biosystems
Yfiler Analysis of Casework Sampleª
10 © 2007 Applied Biosystems
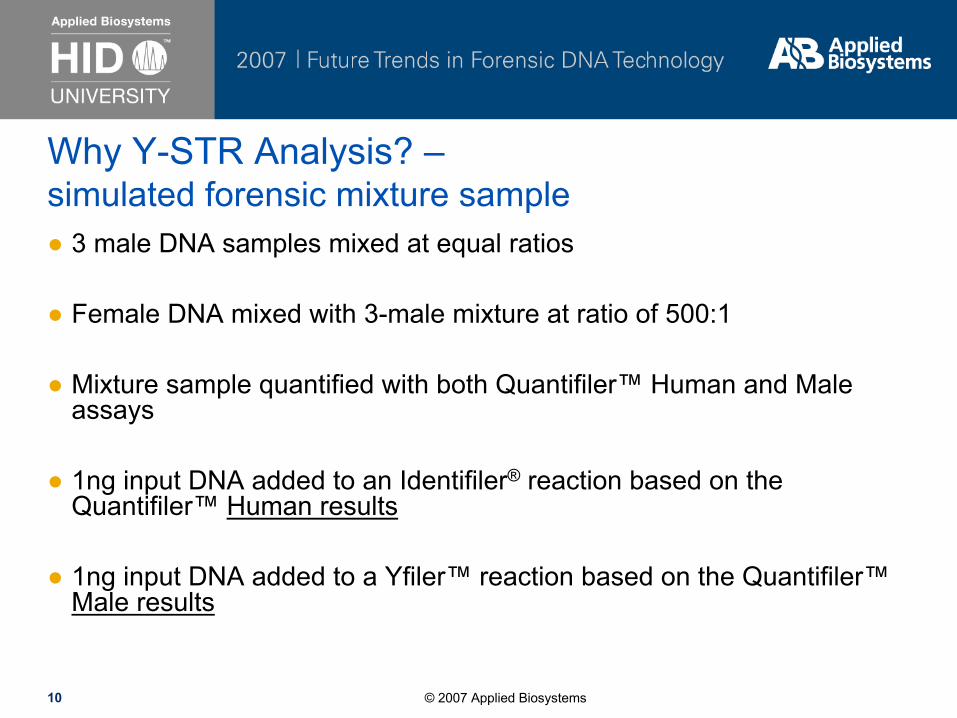
Why Y-STR Analysis? – simulated forensic mixture sample
●
3 male DNA samples mixed at equal ratios
●
Female DNA mixed with 3-male mixture at ratio of 500:1
●
Mixture sample quantified with both Quantifiler™
Human and Male assays
●
1ng input DNA added to an Identifiler®
reaction based on the Quantifiler™
Human results
●
1ng input DNA added to a Yfiler™
reaction based on the Quantifiler™
Male results

11 © 2007 Applied Biosystems
AmpFℓSTR®
Identifiler®
Amplification Result –
sample quantified with the human assay only
Only single source female sample detected
Amelogenin –
X only

12 © 2007 Applied Biosystems
AmpFℓSTR®
Yfiler®
Amplification Result –
sample quantified with the male assay
Three male profiles detected

13 © 2007 Applied Biosystems
Discriminatory capacity†
for three U.S. populations
Y-STR marker combination
African American (N=786)
Caucasians (N=778)
Hispanics (N=381)
European minimal haplotype (9)
75.8% 61.7% 79.8%
“US Haplotype”
(11)
86.8% 74.3% 85.6%
“US Haplotype”
+ DYS437 (12)
87.6% 76.7% 88.2%
AmpFSTR®
Yfiler®
kit (17) 97.6% 95.5% 95.8%
†DC= (# of different haplotypes / pop. size) x 100

14 © 2007 Applied Biosystems
Most common Haplotype identified by the European Minimal Haplotype markers (20 individuals)
European Minimal Haplotype
0# of differenthaplotypes
20Yfiler®
Kit
Sample Info DYS19 1DYS385 DYS389 DYS389 DYS390 DYS391 DYS392 DYS393 DYS438 DYS439 DYS437 DYS448 DYS456 DYS458 Y GATA DYS635 C37 14 11,14 13 29 24 11 13 13 13 12 14 19 15 17 12 23C330 14 11,14 13 29 24 11 13 13 13 11 15 19 15 19 11 23ATCC 14 11,14 13 29 24 11 13 13 12 13 15 19 15 17 13 23C304 14 11,14 13 29 24 11 13 13 12 13 15 19 17 18 12 23C327 14 11,14 13 29 24 11 13 13 12 13 15 19 16 16 12 24C63 14 11,14 13 29 24 11 13 13 12 13 15 17 16 17 11 23C177 14 11,14 13 29 24 11 13 13 12 12 15 21 17 19 12 24C198 14 11,14 13 29 24 11 13 13 12 12 15 18 16 17 12 23C276RL 14 11,14 13 29 24 11 13 13 12 12 15 19 15 19 12 23C294 14 11,14 13 29 24 11 13 13 12 12 15 19 15 17 11 24C236 14 11,14 13 29 24 11 13 13 12 12 14 19 15 18 12 23C85RL 14 11,14 13 29 24 11 13 13 12 12 14 19 16 16 11 24C12 14 11,14 13 29 24 11 13 13 12 11 15 19 17 18 12 23C194 14 11,14 13 29 24 11 13 13 12 11 15 19 17 17 12 23C197 14 11,14 13 29 24 11 13 13 12 11 15 19 15 16 >13 24C318 14 11,14 13 29 24 11 13 13 12 11 15 19 16 17 12 23C345 14 11,14 13 29 24 11 13 13 12 11 15 19 15 18 12 23C66RL 14 11,14 13 29 24 11 13 13 12 11 15 19 16 19 12 23C205 14 11,14 13 29 24 11 13 13 12 11 14 19 15 17 12 23C158 14 11,14 13 29 24 11 13 13 12 10 15 19 16 20 13 23
6SWGDAM
Sample Info DYS19 1DYS385 DYS389 DYS389 DYS390 DYS391 DYS392 DYS393 DYS438 DYS439 DYS437 DYS448 DYS456 DYS458 Y GATA DYS635 C37 14 11,14 13 29 24 11 13 13 13 12 14 19 15 17 12 23C330 14 11,14 13 29 24 11 13 13 13 11 15 19 15 19 11 23ATCC 14 11,14 13 29 24 11 13 13 12 13 15 19 15 17 13 23C304 14 11,14 13 29 24 11 13 13 12 13 15 19 17 18 12 23C327 14 11,14 13 29 24 11 13 13 12 13 15 19 16 16 12 24C63 14 11,14 13 29 24 11 13 13 12 13 15 17 16 17 11 23C177 14 11,14 13 29 24 11 13 13 12 12 15 21 17 19 12 24C198 14 11,14 13 29 24 11 13 13 12 12 15 18 16 17 12 23C276RL 14 11,14 13 29 24 11 13 13 12 12 15 19 15 19 12 23C294 14 11,14 13 29 24 11 13 13 12 12 15 19 15 17 11 24C236 14 11,14 13 29 24 11 13 13 12 12 14 19 15 18 12 23C85RL 14 11,14 13 29 24 11 13 13 12 12 14 19 16 16 11 24C12 14 11,14 13 29 24 11 13 13 12 11 15 19 17 18 12 23C194 14 11,14 13 29 24 11 13 13 12 11 15 19 17 17 12 23C197 14 11,14 13 29 24 11 13 13 12 11 15 19 15 16 >13 24C318 14 11,14 13 29 24 11 13 13 12 11 15 19 16 17 12 23C345 14 11,14 13 29 24 11 13 13 12 11 15 19 15 18 12 23C66RL 14 11,14 13 29 24 11 13 13 12 11 15 19 16 19 12 23C205 14 11,14 13 29 24 11 13 13 12 11 14 19 15 17 12 23C158 14 11,14 13 29 24 11 13 13 12 10 15 19 16 20 13 23
Sample Info DYS19 1DYS385 DYS389 DYS389 DYS390 DYS391 DYS392 DYS393 DYS438 DYS439 DYS437 DYS448 DYS456 DYS458 Y GATA DYS635 C37 14 11,14 13 29 24 11 13 13 13 12 14 19 15 17 12 23C330 14 11,14 13 29 24 11 13 13 13 11 15 19 15 19 11 23ATCC 14 11,14 13 29 24 11 13 13 12 13 15 19 15 17 13 23C304 14 11,14 13 29 24 11 13 13 12 13 15 19 17 18 12 23C327 14 11,14 13 29 24 11 13 13 12 13 15 19 16 16 12 24C63 14 11,14 13 29 24 11 13 13 12 13 15 17 16 17 11 23C177 14 11,14 13 29 24 11 13 13 12 12 15 21 17 19 12 24C198 14 11,14 13 29 24 11 13 13 12 12 15 18 16 17 12 23C276RL 14 11,14 13 29 24 11 13 13 12 12 15 19 15 19 12 23C294 14 11,14 13 29 24 11 13 13 12 12 15 19 15 17 11 24C236 14 11,14 13 29 24 11 13 13 12 12 14 19 15 18 12 23C85RL 14 11,14 13 29 24 11 13 13 12 12 14 19 16 16 11 24C12 14 11,14 13 29 24 11 13 13 12 11 15 19 17 18 12 23C194 14 11,14 13 29 24 11 13 13 12 11 15 19 17 17 12 23C197 14 11,14 13 29 24 11 13 13 12 11 15 19 15 16 >13 24C318 14 11,14 13 29 24 11 13 13 12 11 15 19 16 17 12 23C345 14 11,14 13 29 24 11 13 13 12 11 15 19 15 18 12 23C66RL 14 11,14 13 29 24 11 13 13 12 11 15 19 16 19 12 23C205 14 11,14 13 29 24 11 13 13 12 11 14 19 15 17 12 23C158 14 11,14 13 29 24 11 13 13 12 10 15 19 16 20 13 23

15 © 2007 Applied Biosystems
Caucasian35%
Hispanic17%
Filipino3%
Asian9%
African American28%
Vietnamese3%
Black African2%
Native American3%
Yfiler Population Data by Ethnic Group3,561 Samples
Samples from:
Austria
CA DOJ
Italy
Minn. BCA
NIST
OCME
Orchid
Poland
Santa Clara County
SeraCare
SLED
South Africa

16 © 2007 Applied Biosystems
Key Features of Yfiler Haplotype Database
●
Ability to search all 17 Yfiler loci ●
Ability to search microvariant
Y STR types
●
Ability to perform batch searches using outputs from either Genotyper
or GeneMapper ID
v3.2

17 © 2007 Applied Biosystems
Concordant with NIST 20plex and 11plex data
Microvariant Example

18 © 2007 Applied Biosystems
AmpFSTR®
Yfiler®
Kit
Input Haplotypes from Genotyper
Search results for individual samples

Quantifiler®
Duo DNA Quantification Kit: Quantitative and Qualitative Assessment of
Total Human and Human Male DNA

20 © 2007 Applied Biosystems
Objectives
●
Develop a multiplexed real-time PCR assay to:–
Quantify total human DNA and human male DNA in a single PCR reaction
–
Determine the ratio of human male and female DNA–
Detect PCR inhibitors
–
Allow selection of appropriate STR amplification kit–
Predict success with downstream STR amplification

21 © 2007 Applied Biosystems
Quantifiler®
Duo Kit: A Guide to Sample Assessment
IPC Ct Value
DNA Extract
Mixture Ratio
Autosomal STR Y-Filer®
kit
Heavy Inhibition
Re-Purification STR Analysis
Partial Inhibition
MiniFiler™ kit Identifiler®
kit
Quantification

22 © 2007 Applied Biosystems
Comparison to Quantifiler®
Kits
●
DNA standard is pooled human male genomic DNA●
PCR Reaction Mix optimized for expanded multiplex performance
●
Ability to obtain ratio of human and male DNA in a mixture sample in a single reaction–
Dual quantification of human and male DNA minimizes sample consumption
●
Assay designed to guide selection of appropriate AmpFℓSTR®
Kit chemistry–
Maximizes recovery of interpretable STR profiles

23 © 2007 Applied Biosystems
Configuration of Assay
Target Marker Size Dye
Human DNA
RPPH1(Ribonuclease
P RNA component H1)140 bp VIC®
Human Male DNA
SRY(Sex determining region Y)
130 bp FAM™
IPC Artificial Template 130 bp NED™
The multiplex assay is run on the 7500 Real Time PCR System using SDS v1.2.3 software.

24 © 2007 Applied Biosystems
Std. Curve Amplification Plots and ΔRn (SRY/RNaseP/IPC)
SRY
RPPH1
IPC
Sample ng/µl Ave Ct Ave Ct Ave Ct Ave ∆Rn Ave ∆Rn Ave ∆RnRPPH1 SRY IPC RPPH1 SRY IPC
std 1 50 22.9 23.7 29.7 5.4 6.8 1.4std 2 16.7 24.6 25.5 29.5 5.3 6.7 1.4std 3 5.56 26.2 27.0 29.4 5.2 6.7 1.4std 4 1.85 27.8 28.7 29.3 5.0 6.7 1.5std 5 0.62 29.4 30.3 29.4 4.7 6.4 1.4std 6 0.21 30.9 31.8 29.4 4.3 5.8 1.4std 7 0.068 32.5 33.1 29.4 3.4 4.6 1.4std 8 0.023 33.7 34.8 29.3 2.7 2.7 1.4

25 © 2007 Applied Biosystems
Standard Curves and IPC Ct Values
Multiplex Standard Curve Human Genomic DNA
20.022.024.026.028.030.032.034.036.038.0
-2.0 -1.5 -1.0 -0.5 0.0 0.5 1.0 1.5 2.0Log of [ ]
Ave
Ct
SRY-FAMRPPH1-VICIPC-NED

26 © 2007 Applied Biosystems
RPPH1 Assay Specificity
Male & Female
Gorilla
RPPH1
RNAse P.6.4s (140bp)Species Ave.Ct
Orangutan 40.0Chimp 40.0Gorilla 37.9Macaque 40.0Dog 40.0Cow 40.0Pig 40.0Cat 40.0Chicken 40.0Fish (Salmon) 40.0Rabbit 40.0Mouse 40.0Rat 40.0Hamster 40.0Male 26.5Female 26.2E.coli 40.0Pseudomonas 40.0Neisseria 40.0Staphylococcus 40.0Saccharomyces 40.0
RPPH1
10 ng of DNA from the indicated species was tested.

27 © 2007 Applied Biosystems
SRY Assay Specificity
Male
Chimp
SRY
SRY.2s 130 bpSpecies Ave. Ct
Orangutan 40.0Chimp 30.7Gorilla 40.0Macaque 40.0Dog 40.0Cow 40.0Pig 40.0Cat 40.0Chicken 40.0Fish 40.0Rabbit 40.0Mouse 40.0Rat 40.0Hamster 40.0Male (Raji) 28.8Female (NA14672a) 40.0E.coli 40.0pseudomonas 40.0Neisseria 40.0Staphylococcus 40.0Saccharomyces 40.0
.
10 ng of DNA from the indicated species was tested.

28 © 2007 Applied Biosystems
Analysis of Male & Female MixturesQuantitation of Mixtures
-1.000
0.000
1.000
2.000
3.000
4.000
5.000
6.000
1:0 1:2 1:5 1:10 1:20
Male/female DNA ratio
Qua
ntity
(ng/
ul)
SRYRPPH1
Male DNA added at a constant concentration of 0.2 ng/µl
29 © 2007 Applied Biosystems
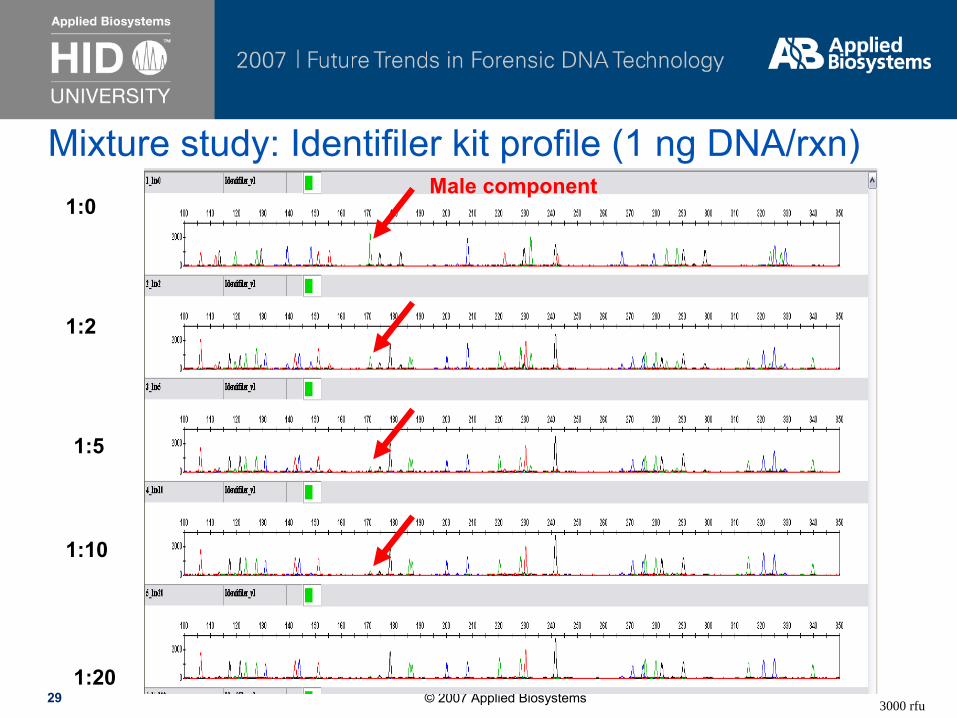
1:0
1:2
1:20
1:10
1:5
Mixture study: Identifiler kit profile (1 ng DNA/rxn)
3000 rfu
Male component

30 © 2007 Applied Biosystems
Analysis of Male & Female Mixtures 50 pg of male DNA
Male/female ratio
SRY measured
conc (ng/µl)
RPPH1 measured
conc (ng/µl)
SRY/RPPH1 expected
ratio
SRY/RPPH1 measured
ratio1:0 0.028 0.031 1:1 1:11:1 0.032 0.078 1:2 1:2.41:5 0.037 0.198 1:6 1:5.4
1:10 0.034 0.356 1:11 1:10.61:100 0.035 3.140 1:101 1:901:500 0.037 15.220 1:501 1:408 1:1000 0.033 33.540 1:1001 1:1007
Male DNA added at a constant concentration of 0.025 ng/µl

31 © 2007 Applied Biosystems
Mixture study: YFiler
kit profile (1 ng DNA/rxn)
1:20
1:100
1:500
1:1000
5000 rfuscale
M:F Ratio

32 © 2007 Applied Biosystems
Post-coital samples Quantitation results (ng/μl) after differential extraction
Sample type Sample name RPPH1 SRY Quantifiler H Quantifiler YE-cell fraction, 4h 1E 63.40 0.08 76.80 0.11E-cell fraction, 8h 2E 105.20 2.78 126.80 5.64
E-cell fraction, 12h 3E 51.40 0.11 69.80 0.00E-cell fraction, 24h 4E 44.80 0.08 61.00 0.00Sperm fraction, 4h 1S 3.22 2.99 5.19 4.57Sperm fraction, 8h 2S 5.01 4.54 6.40 6.18
Sperm fraction, 12h 3S 0.83 0.85 1.13 0.87Sperm fraction, 24h 4S 1.67 1.35 2.19 1.90
Quantitation of post-coital samples(e-cell fraction)
0.00
20.00
40.00
60.00
80.00
100.00
120.00
1E 2E 3E 4E
Qua
ntity
(ng/
ul)
RPPH1 SRY
Quantitation of post-coital samples (sperm fraction)
0.00
1.00
2.00
3.00
4.00
5.00
6.00
1S 2S 3S 4S
Qua
ntity
(ng/
ul)
RPPH1SRY

33 © 2007 Applied Biosystems
Post-coital samples: E cell -
Identifiler kit profile (1 ng DNA/rxn)
1E 4 h
2E 8 h
3E 12 h
4E 24 h
2000 rfu
34 © 2007 Applied Biosystems
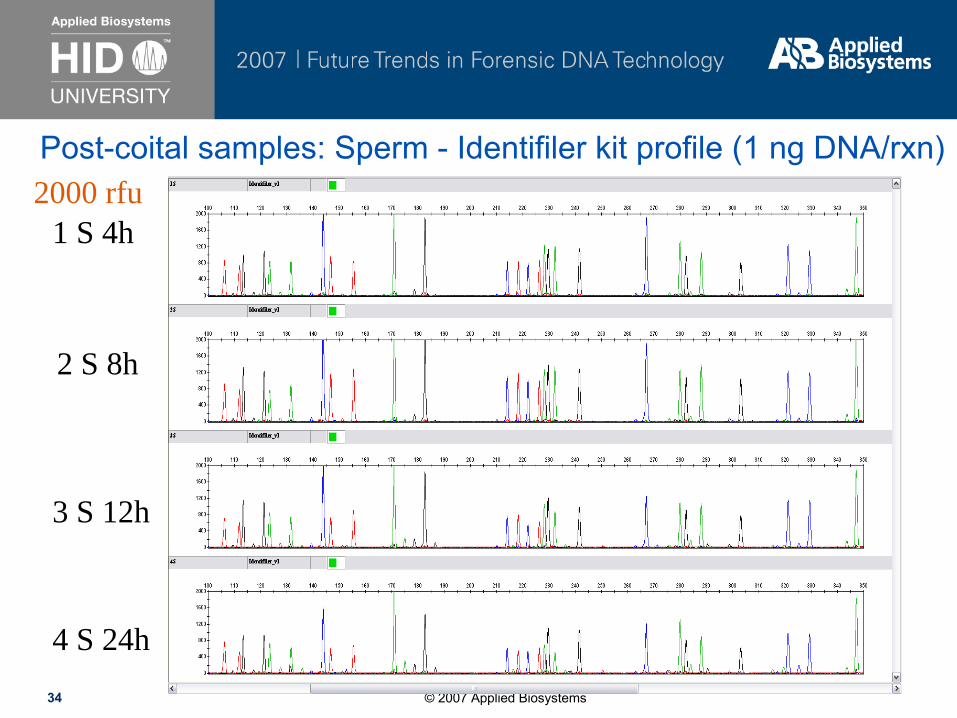
1 S 4h
2 S 8h
3 S 12h
4 S 24h
2000 rfuPost-coital samples: Sperm -
Identifiler kit profile (1 ng
DNA/rxn)

35 © 2007 Applied Biosystems6000 rfu
Post-coital samples: sperm fraction -
YFiler
kit profile (1 ng DNA/rxn)
1 S 4h
2 S 8h
3 S 12h
4 S 24h

36 © 2007 Applied Biosystems
Body fluid mixture samples -
Quantitation results (ng/μl)Quantitation of body fluid mixture samples
0.00
1.00
2.00
3.00
4.00
5.00
6.00
7.00
8.00
1M 2M 3M 4M 5M 6M 7M
Qua
ntity
(ng/
ul)
RPPH1 SRY
Sample type Sample name RPPH1 SRY Quantifiler Hu Quantifiler Y
SRY/RPPH1 measured
ratio
SRY/TERT measured
ratio Male saliva ctrl 1M 1.45 1.29 2.15 2.46 1:1.1 1:0.87
Female saliva ctrl 2M 0.54 0.00 0.81 0.00 0.000 0.000Female blood ctrl 3M 2.24 0.00 3.02 0.00 0.000 0.000
Male saliva/female saliva mix 1 4M 0.91 0.43 1.44 0.68 1:2.1 1:2.1Male saliva/female saliva mix 2 5M 1.46 0.43 2.22 0.69 1:3.4 1:3.2Male saliva/female blood mix 1 6M 3.28 1.02 5.11 1.40 1:3.2 1:3.7Male saliva/female blood mix 2 7M 6.88 1.42 9.28 1.84 1:4.8 1:5

37 © 2007 Applied Biosystems
Mixture study conclusions
●
Successful quantification of the male component in mixtures with male/female DNA ratios up to 1:1000–
Tested using 25 pg/ul
and 200 pg/ul
of male DNA.
●
Accurate measurement of the male/female ratio in a mixture sample relative to expected results
●
DNA input based on Quantifiler Duo kit results led to generation of an interpretable profile of the male component up to a 1:10
male/female mixture ratio using the Identifiler kit●
DNA input based on Quantifiler Duo kit results led to generation
of an interpretable YFiler
kit profile for the male component up to a 1:1000 male/female mixture ratio
38 © 2007 Applied Biosystems
Effect of Inhibitors
●
Evaluated the ability to detect the presence of known PCR inhibitors such as hematin and humic
acid using the
Quantifiler Duo kit●
Varied inhibitor concentrations in DNA samples and tested using the Quantifiler Duo and Identifiler kits to assess predictive performance

39 © 2007 Applied Biosystems
Humic
Acid Inhibited Samples -
IPC Signal

40 © 2007 Applied Biosystems
Humic
Acid Inhibited Samples -
SRY Signal
7.5ng/µl is undetected

41 © 2007 Applied Biosystems
Humic
Acid Inhibited Samples -
RPPH1 Signal
7.5ng/µl is undetected

42 © 2007 Applied Biosystems
Humic
Acid Inhibited Samples: Correlation with Identifiler Kit Profile
IPC signal with increasing humic acid concentration
272829303132333435363738394041
0ng/u
l
1ng/u
l
2ng/u
l
3ng/u
l 3.
75ng
/ul 7.
5ng/u
l 11
.25 ng
/ul 15
ng/ul
30ng
/ul
Concentration of humic acid
IPC
Ct
Ctr-Hum_0
Hum_1 ng/uL
Hum_2 ng/uL
Hum_3 ng/uL
Hum_3.75 ng/uL
Hum_7.5 ng/uL
Hum_11.2 ng/uL
Hum_15 ng/uL
Hum_30 ng/uL

43 © 2007 Applied Biosystems
Hematin Inhibited Samples: Correlation between IPC Signal and Identifiler Kit Profile
IPC signal with increasing hematin concentration
272829303132333435363738394041
0uM 2.5uM 5uM 7.5uM 10uM 12.5uM 15uM 17.5uM 20uM 40uM
Concentration of Hematin
IPC
Ct
Ctr-Hem0
Hem_2.5 uM
Hem_5.0 uM
Hem_7.5 uM
Hem_10 uM
Hem_12.5 uM
Hem_15 uM
Hem_17.5 uM
Hem_20 uM
Hem_40 uM

44 © 2007 Applied Biosystems
Inhibited Samples
●
Quantifiler Duo kit results demonstrated IPC shift in the presence of increasing amounts of inhibitor
●
Quantifiler Duo kit results correlated with STR kit performance

45 © 2007 Applied Biosystems
Degraded DNA
Degraded DNA: Concentration (ng/ul)
0.00
2.00
4.00
6.00
8.00
10.00
12.00
14.00
16.00
Intact 2 U 3U 4 U 5 U 6 U
Units
Conc
entra
tion
RNase P 140SRY
.RPPH1SRY
DNaseI Units

46 © 2007 Applied Biosystems
Quantification of Degraded DNA
Quantification of degraded DNA was performed using Quantifiler®
Duo (Multiplex assay) and Quantifiler®
kits.
Results with Degraded DNA Series
0.00
2.00
4.00
6.00
8.00
10.00
12.00
Intact 2u 3u 4u 5u 6u
DNA Degradation State
Qua
nt R
esul
ts (n
g/ul
)
Quantifiler HumanQuantifiler YMultiplex RPPH1Multiplex SRY
47 © 2007 Applied Biosystems
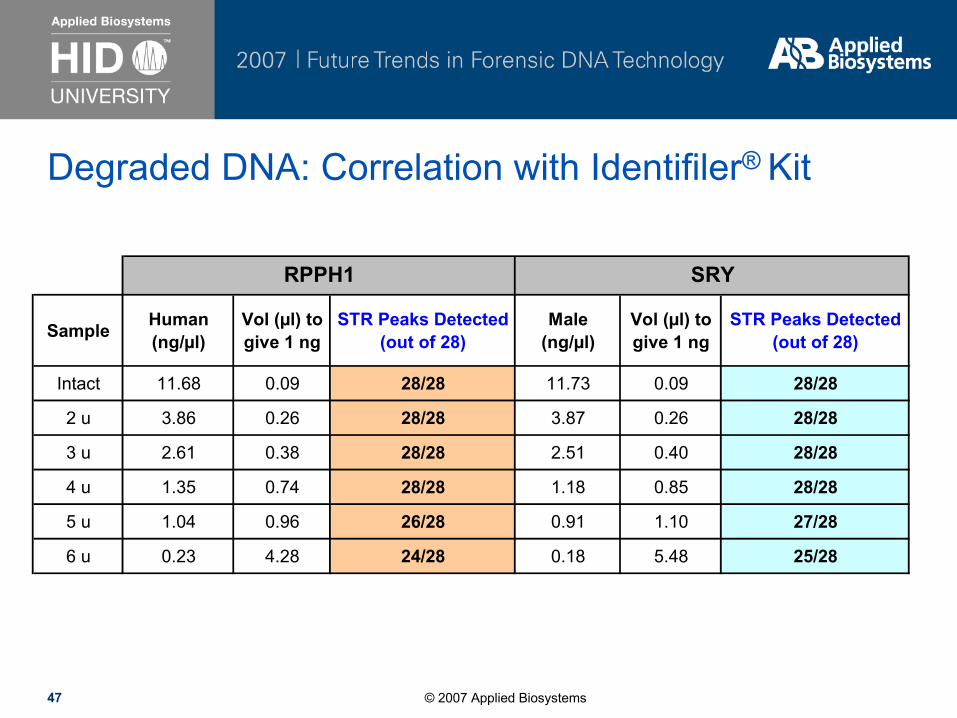
Degraded DNA: Correlation with Identifiler®
Kit
Sample Human (ng/µl)
Vol (µl) to give 1 ng
STR Peaks Detected (out of 28)
Male (ng/µl)
Vol (µl) to give 1 ng
STR Peaks Detected (out of 28)
Intact 11.68 0.09 28/28 11.73 0.09 28/28
2 u 3.86 0.26 28/28 3.87 0.26 28/28
3 u 2.61 0.38 28/28 2.51 0.40 28/28
4 u 1.35 0.74 28/28 1.18 0.85 28/28
5 u 1.04 0.96 26/28 0.91 1.10 27/28
6 u 0.23 4.28 24/28 0.18 5.48 25/28
RPPH1 SRY
48 © 2007 Applied Biosystems
Conclusions
●
The Quantifiler Duo kit is a multiplex real time PCR assay for simultaneous quantification of total human and human male DNA
●
IPC enables monitoring for the presence of PCR inhibitors●
The assay is specific for human and higher primates
●
Provides information about the mixture ratio of total human and human male DNA in a sample
●
High dynamic range of quantification from 23 pg/µl to 50 ng/µl
●
The quantification results correlate well with Identifiler®
and YFiler®
kit performance

49 © 2007 Applied Biosystems
Acknowledgements
●
Applied Markets Research and Development–
Jai Shewale, Maura Barbisin, Pius Brzoska, Robert Green, Michael Malicdem, Robert Lagace, Rixun
Fang, Cristin
O’Shea, Julio Mulero, Lori Hennessy, Chien-Wei Chang and Manohar
Furtado
●
Applied Markets Marketing–
Heidi Kijenski, Karen Cormier and Lisa Calandro
●
Applied Markets Product Development: –
Lindy Kauffman, Yixin
N Li, Sabine Short and Beth Ladin

50 © 2007 Applied Biosystems
Legal Statements
For Research, Forensic or Paternity Use Only. Not for use in diagnostic procedures.
Purchase of the Quantifiler®
Duo Kit includes an immunity from suit under patents specified in the product insert to use only the amount purchased
solely in forensic and paternity testing, and also for the purchaser’s own internal research. No other patent rights are conveyed expressly, by implication, or by estoppel. For further information contact the Director of Licensing, Applied Biosystems, 850 Lincoln Centre Drive, Foster City, California 94404, USA.
Not for re-sale.
Applera, Applied Biosystems, AB (Design), AmpFlSTR, FAM, Identifiler, NED, Quantifiler, and Y-Filer are registered trademarks, and MiniFiler is a trademark of
the Applera Corporation or its subsidiaries in the US and/or certain
other countries.

Thank You
Quantifiler®
Duo DNA Quantification Kit