integrating train information for advanced … chapters present the prototype railtrac system...
TRANSCRIPT

Technical Report Documentation Page 1. Report No.
FHWA/TX-01/1752-7
2. Government Accession No.
3. Recipient’s Catalog No.
4. Title and Subtitle
INTEGRATING TRAIN INFORMATION FOR ADVANCED TRANSPORTATION MANAGEMENT
5. Report Date
March 2001
6. Performing Organization Code
7. Author(s)
Leonard G. Ruback & Kevin Balke
8. Performing Organization Report No.
Report 1752-7 9. Performing Organization Name and Address
Texas Transportation Institute The Texas A&M University System College Station, Texas 77843-3135
10. Work Unit No. (TRAIS)
11. Contract or Grant No.
Project No. 0-1752 12. Sponsoring Agency Name and Address
Texas Department of Transportation Research and Technology Implementation Office P. O. Box 5080 Austin, Texas 78763-5080
13. Type of Report and Period Covered
Research: September 1997 – August 2000
14. Sponsoring Agency Code
15. Supplementary Notes
Research performed in cooperation with the Texas Department of Transportation and the U.S. Department of Transportation, Federal Highway Administration. Research Project Title: TransLink Research Program 16. Abstract
The report documents an effort to monitor railroad movements in a corridor and provide train-related information to multiple agencies. The report is divided into five chapters addressing the tasks of the project. The first chapter provides background information and defines the objectives. The second chapter investigates potential railroad information consumers and includes an assessment of needs. The third and fourth chapters present the prototype RailTrac System including field, telecommunication, central processing, and user interface components. RailTrac was developed to accomplish the train monitoring, data processing, and user interface goals. Chapter five describes the implementation of the prototype RailTrac System in College Station, Texas. Numerous appendices present specific topics concerning the design and evolution of RailTrac in more detail. Topics addressed include the following: field data collection station design, issues surrounding sensor location selection, evaluation of sensor technology, and the derivation of a sensor specification for train sensing and the definition of field component messages and protocols. 17. Key Words
Train, Railroad, Intelligent Transportation Systems, Radar, Sensor
18. Distribution Statement
No Restrictions. This document is available to the public through NTIS: National Technical Information Service 5285 Port Royal Road Springfield, Virginia 22161
19. Security Classif.(of this report)
Unclassified
20. Security Classif.(of this page)
Unclassified
21. No. of Pages
76
22. Price
Form DOT F 1700.7 (8-72) Reproduction of completed page authorized


INTEGRATING TRAIN INFORMATION FOR ADVANCED TRANSPORTATION MANAGEMENT
by
Leonard G. Ruback Associate Research Scientist
Texas Transportation Institute
and
Kevin N. Balke, Ph.D., P.E. TransLink® Research Center Director
Texas Transportation Institute
Report 1752-7 Project Number 0-1752
Research Project Title: TransLink Research Program
Sponsored by the Texas Department of Transportation
In Cooperation with the U.S. Department of Transportation Federal Highway Administration
March 2001
TEXAS TRANSPORTATION INSTITUTE The Texas A&M University System College Station, Texas 77843-3135


v
DISCLAIMER The contents of this report reflect the views of the authors, who are responsible for the facts and accuracy of the data presented herein. The contents do not necessarily reflect the official views or policies of the Texas Department of Transportation (TxDOT) or the Federal Highway Administration (FHWA). This report does not constitute a standard, specification, or regulation.
NOTICE The United States Government and the State of Texas do not endorse products or manufacturers. Trade or manufacturer’s names appear herein solely because they are considered essential to the object of this report.

vi
ACKNOWLEDGMENTS
The authors acknowledge TxDOT, the Federal Highway Administration (FHWA) and the U.S. Department of Transportation (USDOT) for financial and other support throughout the project. TxDOT staff was particularly instrumental in providing assistance for this project, especially Mr. Al Kosik, Project Director, and Mr. Carlos Lopez, Program Coordinator of the Traffic Operations Division. The authors also want to acknowledge the valuable contribution of the following individuals and companies who provided assistance during this research project: Mr. Lee Robinson, Traffic Systems Manager, City of College Station Public Works Dept., Traffic Section Mr. Pat Walker, Senior Traffic Signal Technician, City of College Station Public Works Dept., Traffic Section Mr. Eric Hurt, Assistant Fire Chief, City of College Station Mr. George Mitchell, Transportation Dept. Manager, City of Bryan Mr. Kirk Barnes, Traffic Operations Engineer, TxDOT Bryan District Mr. Walt Magnussen, Associate Director, Texas A&M University Telecommunications Mr. Douglas Williams, Associate Director, Texas A&M University Department of Parking, Traffic and Transportation Services Decatur Electronics, Inc. Microwave Sensors, Inc. (now MS Sedco) MPH Industries Inc. Whelen Engineering, Inc. Kustom Signals, Inc.

vii
TABLE OF CONTENTS
Page
Chapter 1 - Introduction ................................................................................................................................1 Introduction .............................................................................................................................................................. 1 Scope........................................................................................................................................................................ 2 Organization Of Report ............................................................................................................................................ 2
Chapter 2 - Identification Of Railroad Information Consumers ...................................................................5 Assessment Of User Information Needs .................................................................................................................. 5 System Requirements............................................................................................................................................... 6
Chapter 3 - Railtrac Field And Telecommunication Subsystem...................................................................7 Overview.................................................................................................................................................................. 7 Field Subsystem ....................................................................................................................................................... 9 Site Selection............................................................................................................................................................ 9 Train Detection Package ........................................................................................................................................ 10 Telecommunication Subsystem.............................................................................................................................. 12
Chapter 4 - Railtrac Central And User Subsystems ....................................................................................15 Central Processing System ..................................................................................................................................... 15 Concept Of Operation ............................................................................................................................................ 15 User Subsystem...................................................................................................................................................... 18
Chapter 5 - Implementation Of Prototype System ......................................................................................23 Railroad Operations................................................................................................................................................ 23
Appendix A - Mobile Data Collection Station Design................................................................................25
Appendix B - Sensor Placement Calculation ..............................................................................................29
Appendix C - Sensor Evaluation .................................................................................................................31 Radar Sensor Specification .................................................................................................................................... 35
Appendix D - Message Encoding Protocol Definition................................................................................37 Calculation Of Data Payload Length...................................................................................................................... 39 Calculation Of Frame_Checksum .......................................................................................................................... 39 Sample Messages ................................................................................................................................................... 39
Appendix E - Doppler Radar Sensor Specification.....................................................................................41 Radar Sensor Specification .................................................................................................................................... 41
Appendix F - Sample Radar Output ............................................................................................................43
Appendix G - Train Detection Package Message Definitions.....................................................................49 Heartbeat Message ................................................................................................................................................. 49 Train Pre-Detect Message ...................................................................................................................................... 55 Train Post-Detect Message..................................................................................................................................... 58 Status Message ....................................................................................................................................................... 60 Set Configuration Variable Message...................................................................................................................... 61 Get Configuration Variable Message ..................................................................................................................... 61
Appendix H - Train Detection Package Configuration Variables...............................................................63


1
CHAPTER 1 - INTRODUCTION INTRODUCTION Train operations cause thousands of hours of vehicle delay nationwide each day and frequently disrupt emergency vehicle operations and transit service in most urban areas. Recent mergers and consolidations in the rail industry will result in more frequent, longer, and higher speed trains operating in some of the nation’s most congested corridors. These changes in railroad operations will have a direct impact on surface street operations. Operations and safety on the surface street system could be improved if transportation agencies had advance information that a train was approaching a highway-rail intersection. With this advance information, transportation agencies could affect traffic control and diversion strategies that would minimize the disruption to vehicular traffic and transit operations. In addition, information about when trains will be blocking specific crossings in an area will be valuable to transportation users that depend on rapid response, such as commercial delivery services and emergency vehicles. One research theme within the TransLink® Research Center1 focuses on coordinating and improving the operations of both vehicular and train traffic through the railroad/roadway interface. Integrating train movement information into the normal operations of a transportation management center could accomplish this goal. Information about train movement can be used by local systems in the field, such as closed-loop traffic signal systems, to provide better and safer preemption. By bringing it back to a central control center, train information can be linked to emergency services operations, automated route planning, smart vehicles, and dynamic signing to improve the overall efficiency of the transportation network. OBJECTIVES The goal of this research was to develop the functional specifications for a system of detecting and tracking train movements in an urban corridor and to explore different methods for disseminating this information. The specific objectives of this research project were as follows:
1. Examine different off-the-shelf technologies for detecting and monitoring train movements in an urban corridor.
2. Using information about train movements, develop a method for predicting train arrival and departure time information at the various grade crossings in an urban roadway corridor.
3. Develop a methodology for disseminating train movement and arrival/departure time information in a traffic management center.
4. Prepare a system architecture for implementing train monitoring and develop the hardware and software functional specifications for implementing the system.
1 The TransLink® Research Center is a multi-modal, public/private research program founded by METRO, Rockwell, Southwestern Bell, TxDOT, Texas Transportation Institute and the USDOT to study effective ways of linking transportation systems for the deployment of ITS.

2
5. Implement a prototype of the system in an actual highway/rail corridor in an urban area.
The system, henceforth called RailTrac, was developed by TTI researchers and staff and tested in College Station, Texas. SCOPE This research is multifaceted and will explore several areas. Requirements will be developed for a nonvital train detection and tracking system that would operate outside the traditional train detection system (railroad track circuits and preempt relays) currently in place. To alleviate any concerns of the railroad companies, all associated equipment will be nonintrusive and located off railroad right-of-ways.
The prototype system will attempt to manage a single track rail network with support for a single train in the network at a time. Future work can expand the software components to accommodate multiple tracks and multiple trains if warranted. The expansion into multi-train, multi-track is strictly a software development issue and should not require upgrades to field hardware/software.
Although train status information is valuable, it is more of a “second tier” type data input to a traffic management system. The train monitoring system costs must be balanced with the expected benefits. Researchers will use off-the-shelf equipment for all components of the system and will use mature technology to minimize system down time. The system is envisioned as being operated by a city or state agency with central office equipment housed in a traffic management center and receiving train movement information from field stations deployed along the rail corridor.
All rail information will be disseminated from this central location via traditional data communication networks (i.e., Ethernet). The system will use the methods and equipment for information exchange via the Internet (i.e., Hyper Text Markup Language [HTML], Extensible Markup Language [XML]). Note the term Internet is used but in reality the network could be an intranet or a combination of intranet and Internet.
Information receivers will use simple web browser software to access a web page containing rail corridor information or subscribe to a realtime rail information broadcast. The system will also support more unique information sharing such as TxDOT’s center-to-center data management architecture. ORGANIZATION OF REPORT In Chapter 2, rail operations are reviewed to determine likely rail information consumers (i.e., other transportation systems and agencies that are effected by railroad operations and might have a need for train movement information). The chapter identifies specific data elements to support these rail information consumers. Chapters 3 and 4 present the RailTrac System. RailTrac monitors a rail corridor and produces train arrival and departure information for intersections in the corridor. In Chapter 3, a means for gathering raw train movement data from the field is

3
investigated. Included in this chapter is an examination of current, cost effective technology that could be deployed along a rail corridor if warranted. Emphasis was given to unlicensed technologies that allowed for the gathering of train information for a location off of the railroad right-of-way. In Chapter 4, the research time presents a design for a central processing system that accepts data from the field stations and produces a corridor-wide view of rail operations. The chapter also includes information on the development of a method of organizing and transporting the rail information to the end users or clients. Chapter 5 shows how the prototype system was implemented in the Wellborn Corridor in College Station, Texas.


5
CHAPTER 2 - IDENTIFICATION OF RAILROAD INFORMATION CONSUMERS
ASSESSMENT OF USER INFORMATION NEEDS A transportation management center brings data from many sensors to a single location for use in enhancing the management of equipment and personnel to more effectively respond to changing roadway conditions. Incorporating railroad information builds a more complete picture of the entire multimodal transportation network. Management centers fulfill the role of data provider to other government and private agencies as well as the public at large.
Emergency service providers such as fire, Emergency Medical Services (EMS) and police can benefit from advance knowledge of grade crossing blockage and clearing times. Rail blockage information can be incorporated into an automated routing system that could dynamically calculate the best route to the emergency. Another option would be for emergency services dispatchers (such as a 911 center) to have access to live railroad conditions and merge transportation network status data into their automated dispatching equipment.
Transit operators manage a large fleet of vehicles on tight schedules. Knowledge of long-term intersection blockages (such as for a malfunctioning crossing gate) can be used to navigate a bus around the delay. Providing bus drivers with up to the second train arrival and grade crossing blockage times can improve paratransit operations. Drivers can alter their routing to avoid needless delay. Transit system patrons can benefit from systems that take in bus location and roadway network conditions to estimate the arrival time at downstream stops. The system could be used both onboard and at bus stops.
Local traffic control devices (traffic signals) receive a very basic indication of an approaching train. More detailed information about conditions in the area can allow an automatic traffic signal controller to coordinate vehicular and pedestrian movements efficiently and safely. Advance knowledge of a train’s arrival and departure can be used to better prepare for entrance into and exit from preemption. Finally, motorist information systems such as changeable message signs could inform motorists of impending delay. Motorists could choose to take another route to their destination or to continue on their normal route prepared to wait. More futuristic systems are evolving that will bring roadside messaging into the vehicle. Use of cellular phones and the wireless application protocol (WAP) can bring realtime train delay information to a user anywhere. The WAP is a method for delivering simple textual content to a digital cellular phone via the Internet. Once again, the railroad component could be incorporated into a more elaborate navigation package in the vehicle of the future.

6
SYSTEM REQUIREMENTS After reviewing the potential users of train information, the researcher identified the data elements listed below. The data elements provide information about a single train’s current status and projections into the future. The data elements are as follows: Shared Data Object Specification:
• location (either measured or predicted) of the train within the corridor, • direction of train movement, • speed of the train, • length of the train, • estimated time of arrival at downstream grade crossings, and • estimated duration that a train would be occupying a crossing and delay traffic
(occupancy time). It is likely that several of the rail data consumers will not be located in the same place as the RailTrac processor. A method to deliver timely information to multiple agencies located within a region or beyond is required. Data Object Delivery Functional Specification:
• Provide a realtime network broadcast of rail information for subscribed clients. The broadcast will deliver immediate information updates to clients as conditions in the corridor change. Consider this service as information “push” to a user client.
• Provide the rail data in a concise, organized file for user client access. The method is less time critical and would be useful to a wider user pool that does not require a broadcast-type service. Consider this service as information on demand or information “pull.”
• Employ XML as the data encoding language. • Provide an interface to the TxDOT Center-to-Center statewide information management
system architecture. Each data consumer will require a software application to access the railroad information. With the abundance of low cost (or free) Internet software applications, it seems apparent that this would be the technology of choice. Internet software can be used on an intranet and inherit the security of the managed network. Data Display Receptor Functional Specification: • Rail information will be available for many different software applications through the use of
XML as the data encoding language and network file access. • Rail information will be available for simple display through an Internet web browser with
embedded XML support.

7
CHAPTER 3 - RAILTRAC FIELD AND TELECOMMUNICATION SUBSYSTEM
OVERVIEW The following two chapters describe the RailTrac System. RailTrac is organized into several distinct functional subsystems as shown in Figure 1. The Field Subsystem comprises all equipment deployed to gather data along a rail corridor. Currently the subsystem contains only Train Detection Packages (TDP). Each TDP continually scans a single location for train movement and reports conditions. The transport mechanism for moving all data from the field to raw data receptors is defined as the Telecom Subsystem. Since a rail monitoring system is likely to be deployed over several miles, it must be assumed that different technologies might be used for moving data to and from the field. Field data will need to be merged into a single stream for delivery to raw data receptors. Raw data receptors include the main program that processes the incoming data and any system management tools. The Central Subsystem encompasses several software applications running on one or more computers located at a central or hub location. The “hub” would likely be a traffic management center (TMC) or a field office in which communication from the field group can be routed. The task of the subsystem is to combine and process data from multiple sensors to produce global train movement and location information. The Central Subsystem creates the Shared Data Objects and supports the delivery mechanisms defined earlier (i.e., network broadcast to subscribers, XML data file creation, and TxDOT center-to-center interface). The User Subsystem is comprised of all train data user clients. User clients extract information from the rail system for display and to relay to other systems (i.e. changeable message signs and traffic signal controllers) via the reception of a broadcast message or access to a data file.
Figure 1. RailTrac System Organizational Diagram.
Conceptually, the Train Monitoring System is further broken down into specific task blocks. Refer to Figure 2 for a more detailed functional diagram of the RailTrac System. TDPs provide train data from the field and link to a Communications Multiplexer (CM). The TDPs may communicate via radio, dialup modem, fiber modem, Ethernet, or other proprietary communication system. The CM combines data streams from all TDP communication links into a single stream. The stream is made available to multiple raw data clients. Examples of raw data clients are the Central Processing Package (CPP) and the Configuration Management Package (CMP). The CPP links into the CM and receives a raw data stream. The data from the corridor
TelecommSubsystem
FieldSubsystem
CentralSubsystem
UserSubsystem
TCP/IPNetwork
TCP/IPInternetRS232

8
is extracted and processed to build system outputs. The CPP calculates the following information for wide distribution:
• time of current update. • rail corridor status (clear, train detected, unknown). • information about each train currently in the corridor:
• train location, • train speed, • train direction, and • confidence in train data.
• information about each point in the corridor to derive arrival/departure predictions: • estimated time of arrival at prediction site (mainly intersections) for each train
currently in the corridor, • estimated time of departure from the prediction site for each train currently in the
corridor, and • confidence in each prediction.
The CPP uses three methods for delivery of the above data. The CPP includes a data server to provide live broadcasts (new data upon calculation) to clients. Clients typically subscribe to the service. The CPP builds a data file using Extensible Markup Language for encoding. XML is a method to encode and describe data and is rapidly becoming the “standard” way (note XML is a standard) of exchanging data on the World Wide Web. The file is forwarded to an Internet Web server. Finally the CPP will support a TxDOT center-to-center protocol interface to enable information to be shared on a statewide basis.
Figure 2. Conceptual Architecture.
Train DetectionPackage
Train DetectionPackage
Train DetectionPackage
Train DetectionPackage
CommunicationMultiplexer
Central ProcessingSystem
SystemManagement
Live Data UserClients
TXDOT C2CInterface
Web ServerWeb Data User
ClientsTrain Detection
Package

9
FIELD SUBSYSTEM The Field Subsystem is the entity of RailTrac that provides all the input raw data containing a train’s speed, direction, and current position within the corridor. The subsystem is intended to contain numerous strategically located Train Detection Packages throughout the rail corridor. Each TDP monitors a small area of railroad track for train movement and reports conditions to a master data gathering application within the Central Subsystem. SITE SELECTION The TDP exact locations are not critical but their spacing must not be excessive. Overly long spacing introduces excessive errors due to each train being measured for a small time percentage of its trip through the corridor. Experience in College Station indicates that station spacing should be approximately 4000 to 6000 feet for reasonable coverage given a similar train length distribution. Further spacing is acceptable on the edges of the corridor where sensors act more as an early warning mechanism. Closer spacing is required where more accurate arrival/departure information is desired or average train lengths are low. Accuracy of arrival and departure calculations is dependent on the amount of time a train is being directly measured. Dead reckoning, used when a train is between sensors, is only a means to roughly estimate location from the most recent measured speed data. Sensor sites were chosen based on infrastructure available (pole, power, cabinet), access to grade crossing closure information (traffic signal preempt), and spacing within the corridor.
Once researchers determine station spacing, they must define exact sites. The sensor is designed to detect from at least 100 feet away; therefore flexibility in exact pole location is provided. The most important factor in site selection is access to infrastructure (power and telecommunications) and the presence of moving objects outside the detection zone but in close proximity. A site and mounting angle for the radar should be chosen to minimize reception of background reflections. Keep in mind that a radar sensor emits a wave that equates to a potentially large elliptical detection zone. The radar should be mounted at least 20 feet high and tilted toward the ground at the railroad track. The radar should be aligned such that the angle between the radar line of sight and the railroad track is approximately 40 degrees. The harsh side angle and the downward tilt are required to minimize the detection zone thus lowering the location uncertainty when matching a location with a detected train. Mounting locations that work well are traffic signal poles (easy access to power and possible communications) and wooden planted poles (cheap alternative when no other agency assets are available). Figures 3 and 4 show typical station sites and a detailed view of radar sensor aiming.

10
Figure 3. Sample Sensor Installations.
Figure 4. Radar Aimed Toward the Ground to Minimize the Detection Zone and Background Noise.
TRAIN DETECTION PACKAGE The TDP is comprised of a train sensor unit (TSU), an accompanying field processor unit (FPU), a communication network interface unit (NIU), and a power source/supply (PS). The FPU receives and manages all data to and from the TSU as well as the NIU. Under control of the FPU, the TSU continually scans the forward area for movement. The TSU delivers, at minimum, target speed and direction via a serial data connection with the FPU. Current technology in use for the TSU is doppler radar. A technology specific feature of the radar sensor is the ability to measure the reflected signal strength of a target. This data is packaged in the serial stream from the sensor and delivered to the FPU. The FPU polls the TSU at a rate of 15 times per second. Return data samples from the TSU are input into an algorithm that filters or

11
“smoothes” the data and attempts to reject false targets. The new data stream is presented to a routine that calculates train length, train position, and true train speed. Figure 5 shows the Field Subsystem block diagram.
Figure 5. Field Subsystem Block Diagram. From the sensor evaluation testing, we learned that Radio Frequency radar technology had no problems detecting a train when one was present. The real problem was to effectively reject false targets. The largest cause (in fact nearly all) of false train detection is rain. Rain reflects enough RF energy to compete with the signature of a moving train during heavy downpours. Our evaluation of traffic sensor doppler radar products revealed that rain caused false detects in each one. The research staff decided that the only way to handle the rain issue was to gather more information about the target (reflected signal strength) and to develop logic to help identify a detection as a train or rain. Control over algorithm sensitivity is provided through configuration variables. These variables set a background signal intensity threshold and a confidence number. When background “noise” raises above the threshold the algorithm moves into rain mode. The software routine produces a confidence number for the detection. A train detect is declared if the confidence is equal to or higher than that held in the TDP configuration. The NIU is the site’s communication link back to a Central Processing Package or hub computer within the Central Subsystem. The FPU communicates via an RS232 serial port to the NIU. There are several choices for NIU technology; wireless, dialup modem, Ethernet (through the use of a simple terminal server), and long distance modems are several examples. The FPU builds several different messages for transmission to the CPP. During normal operation, the TDP sends messages to the CPP and does not expect to receive any. All communication flows from the field to central. In essence, each station operates completely independent of any other station or central.
Power Supply
Field ProcessorUnit (FPU)
Network InterfaceUnit (NIU)
Train Sensor Unit(TSU)
RS-232C
RS-232C
� 10 Base T� Modem� Wireless

12
The TDP employs the Message Encoding Protocol (MEP) developed during the evaluation phase of the project. The MEP is designed to be an extra error detection system and not to be the primary means of error detection. Primary error detection must be supplied by the NIU. Each TDP transmission follows this protocol and incoming messages from the NIU are expected to be in this format. The TDP can be configured (via Configuration Variable setting) to disable checksum testing on incoming frames. This setting is not recommended for normal usage.
The FPU is completely configurable via the communications link. This feature allows for the system as a whole to be remotely calibrated (if a communication path is available from central to field). Researchers can perform remote configuration and calibration using a configuration management program. This feature will reduce the number of trips to setup and calibrate the site during operation. It is anticipated that data from the site can be reviewed periodically to determine if system calibration is required. The “reverse” communication link also gives the ability to remotely reset the site, cancel a train detection, or receive detailed TSU/FPU data for later analysis. Although these are considered calibration variables, they perform more like system commands and can be issued at any time. TELECOMMUNICATION SUBSYSTEM There are several choices for communication technology for field systems. Wireless has become popular in recent years and shows great promise. The current thrust in RF devices is to provide a robust service while being spectrum and power conservative. Spread spectrum technologies achieve these goals. Several vendors offer products in this category using either direct sequence or frequency hopping techniques to produce the spread spectrum output. Spread spectrum equipment operating in the popular unlicensed 900 MHz and 1200 MHz ISM (industrial, scientific and medical) bands are readily available. The new spread spectrum radios offer several important advantages:
• increased interference immunity, • high data throughput (33.4k bits per second upwards to 1 Mbps +), • ten mile maximum range for line of sight systems, • low power consumption – solar power capable, • small compact size, easy integration, • no Federal Communications Commission licensing required, and • smaller, lighter weight antennas.
Choosing the unlicensed radio band enables quick deployment but there are drawbacks. Unfortunately, the unlicensed units are power limited to 1 watt and antenna gain limited to 6dB, making for an overall maximum RF effective radiated power (ERP) of 36dBm by law. With such a low ERP and high operating frequency, all radios on the network must be in direct line of sight for reliable communication. Since the remote stations can be scattered anywhere along the corridor, a radio repeater visible to all stations may be required. Height is the principal property for good long range repeater visibility and coverage. Data radio systems are available for use without Federal Communications Commission licensing, relatively easy to install, and reliable. Unfortunately unlicensed wireless systems are limited in transmission power by the FCC.

13
Other options for NIU technology are dialup telephone modems, private fiber optic or DS1 (T1) networks, “alarm” circuits leased from the local telephone provider, and digital cellular. Dialup telephone modems are not new technology and their use and capability are well known. If access to a fiber optic or high bandwidth copper (T1) is an option, the field site data stream could be added into the network traffic. Local telephone providers lease “alarm” or “dry pair” circuits for a fraction of the cost of circuits with dial tones. Digital cellular can be an attractive option. Field sites can use Cellular Digital Packet Data (CDPD) (if the service is offered in the area). CDPD delivers an RS232 interface for the TDP and uses the Internet to deliver the data to a receptor. Network delivery of the data eliminates the need for a modem bank or similar end equipment to recover data from the field. Unfortunately CDPD service is not guaranteed and coverage is generally in high population areas only. Since multiple technologies are possible for the NIU, a method to merge various links into a single stream is necessary. A Communication Multiplexer handles this task. The device can be either a stand alone terminal server or a computer and associated software. Its function is to converge all data streams into a single stream and to make copies of the stream available to raw data users. Raw data users are the Central Processing System and any connected System Management tools. The device will need to merge information flowing in from RS232 ports, telephone modems and a traditional network (i.e., Ethernet). The software serves up single streams of raw data to multiple clients using the Transmission Control Protocol/Internet Protocol suite. The receiver applications can be located anywhere on the network (assuming an intranet) or worldwide via a gateway.


15
CHAPTER 4 - RAILTRAC CENTRAL AND USER SUBSYSTEMS The Central Subsystem contains all the equipment and processes that convert raw sensor station data into rail corridor information and delivers that data. A web server application is contained within the grouping to facilitate information distribution via the World Wide Web. An application to manage TDP configuration and calibration is also within this grouping. Each entity within this subsystem is a software application running on a computer. The applications can all run on one computer or be distributed. Latency issues need to be considered if researchers wish to pursue a distributed model. CENTRAL PROCESSING SYSTEM The Central Processing System will require custom software. The development package chosen must have capabilities for building client-server TCP/IP-based applications, designing user interfaces, and integrating custom controls from other vendors. The term TCP/IP represents a suite or collection of protocols used for data communication via a network or the Internet. Microsoft offers several software development platforms based on their ActiveX technology. ActiveX is a software design concept that allows small full-function applications that do specific jobs to be inserted and used within a large software build. Many hardware vendors are offering ActiveX controls for their products. Visual Basic is one of the Microsoft family of development suites and is a good environment to quickly produce attractive user applications. Unfortunately, the ease of building complicated software has its consequences. Visual Basic tends to deliver end product software that is larger in size, slower, and more wasteful of system resources than other development systems. These issues are always to be considered when embarking on a software project, especially projects that have tasks that are extremely time sensitive. Bulky code requires a faster processor and more memory resources (RAM and mass storage) to give comparable performance to efficient code. For this demonstration project, the ability to quickly arrive at a working prototype takes precedence over code efficiency and resource conservation. CONCEPT OF OPERATION The Central Processing System (CPS) receives a single stream of raw sensor data from the Telecommunications Subsystem. It first forwards the stream to the Message Encoding Protocol API (Application Programming Interface) for analysis. The API extracts the data payload from each frame sent and maintains communication statistics for each TDP. Valid messages are then routed to a handler depending upon the source of the message (originating station). The TDP message handler is an ActiveX component and was developed to provide the interface between the TDP messages and the CPS. The control reports specific events to the CPS such as Train Arrive, Train Depart, Train at Sensor, etc. From these events the CPS determines the status of the rail corridor. Status can either be Clear, North Train, South Train, or Unknown.
Upon declaring a train in the corridor, the CPS begins to track the location of the head end and the tail of the train. With the train’s position known, estimates for arrival and departure time for upstream locations are calculated. The estimates are updated at least every two seconds while the train is in the corridor. Status updates happen every 20 seconds while the corridor is clear.

16
Each new status update produces a Railmonitor data object. The Railmonitor data object contains the following data objects:
• Update Time – Combination time and date when data was created (i.e., valid as of
this time), • Corridor Status – Simple text description of the overall status of the rail corridor (i.e.,
Clear, Train Detected, Unknown), • Trainlist – List of all trains currently known to be in the corridor, and • Sitelist – List of all points within the corridor for which train arrivals and departures
will be calculated.
The Trainlist object is a list of active Train objects. An active train object is created when a train is being tracked. Train objects contain the following data objects:
• Identifier – Unique code for each train, • Location, • Speed, • Length, • Direction, • Confidence of data in the Train object, and • Sitelist.
The Sitelist object is composed of Site objects. Site objects hold information specific to a location (typically an intersection) in the corridor. A site object may also be a point within the corridor where a train sensor station is located. Site objects contain the following data objects:
• Identifier, • Name of the site, • Status, and • Predicted Trainlist.
The Predicted Trainlist object is a list of Predicted Train objects. Predicted Train objects represent trains that are currently within the corridor. Predicted Train objects contain the following data objects:
• identifier (Matches to the Identifier object in Trainlist), • estimated time of arrival – Time in seconds until train arrives at site, • estimated time of departure – Time in seconds that train will depart site, and • confidence in data within Predicted Train object.
The data for the objects is encoded using the Extensible Markup Language. XML can be also be used to store data. All configuration files for the CPS are XML format files. Information technology vendors (databases, web products, etc.) are building XML interfaces into new and existing products. Newer web browsers have XML support built in therefore making access to

17
data from multiple sources easy. Data providers can now be released from the creation of a data display (HTML) with their data (XML). The XML files are stored into an area accessible by a traditional web server. The server delivers the data files to users anywhere on the Internet or Intranet. This technique does not support server “push.” For users that require immediate corridor updates, the CPS provides a message server that pushes corridor status information out to subscribers as soon as the content is available. A System Management tool is provided in the Central Processing Package that is used to remotely configure TDP stations and to view raw data from the field. The tool is an ActiveX software component coupled with an Internet Explorer web page. The ActiveX component could also be used within a stand alone executable to perform the same function. The package connects with the Communication Multiplexer and provides a technician the ability to view and to update configuration variables on a TDP remotely. Figure 6 gives a more indepth breakdown of the CPS. The left side of the diagram shows the external links. The link to the Communication Multiplexer brings in data from the field. The lower area documents the server for live data, the interface into the TxDOT center–to–center architecture, and the writing of an XML format file for delivery to a web server.

18
CommunicationMultiplexerInterface
MessageEncoding Protocol
API
Message Switch
System Setup andConfiguration
Global SensorMessage Handler
Corridor Analysis
Preempt Handler
Train Status
Create Outputs
Live FeedServer
Individual Sensor Handler
Individual Sensor Handler
���
Corridor Predictionand Confidence
XML File to Web Server
TxDOTC2C
Figure 6. Central Processing System Block Diagram. USER SUBSYSTEM
Information clients are expected to link into the RailTrac System via a TCP/IP network. This can be an intranet or Internet or both. Users access an XML file that contains the latest information concerning train activity within the corridor. XML files can easily be displayed using simple HTML. Color coding immediately alerts viewers to conditions in the corridor. See Table 1 for the color legend. The simple textual display returns the status of the corridor in general (Clear, Train, Unknown), a list of points along the corridor in which train arrival and departure predictions will be generated, and an associated confidence rating. Train status is included with data identifying the train’s speed, direction, length, location, and confidence rating. The update time is used to verify the timeliness of the data. Finally, some simple information is included pertaining to the last train through the corridor. When a train is present,

19
the ETA and ETD columns show the expected arrival and departure time for the current train at each site and a confidence rating on the prediction. An example display follows in Figure 7.
Figure 7. Textual Display of System Output.

20
Table 1. Color Code Legend.
Color Meaning Green Sensor at site and operational. Site Clear. Orange Sensor at site and operational. Preempt Active. Red Sensor at site and operational. Train Detected. Yellow Sensor at site and inoperative. Blue No sensor at site.
The XML can also be readily integrated into other systems and processes. The same display could be used with the push XML, the only difference being in the method of data delivery to the display.
TxDOT has been developing a statewide architecture for traffic management information sharing. The RailTrac System will include a component that integrates railroad information into the TxDOT center-to-center format. This data mapping will allow any management center around the state access to current rail corridor status. Local agencies, if given access to the statewide system, could use the TxDOT software package to access all available multimodal content for their area.
Another data user could be a software application that receives a RailTrac feed (either TxDOT C2C or XML file) and produces a Wireless Application Protocol version of the content for distribution through digital cellular phones such as those offered by Sprint PCS. Figure 8 shows a sample cellular phone display while receiving rail corridor information. Figure 9 shows clasps of the cellular phone’s screen.
The realm of wireless Internet to a mobile user is just beginning to evolve. High bandwidth to users on the go should be a reality in the next few years. Wireless Internet has a bright future and should energize demand for live traffic information.

21
Figure 8. Digital Cellular Phone with WAP Capability.
Figure 9. WAP Messaging on a Digital Cellular Phone.


23
CHAPTER 5 - IMPLEMENTATION OF PROTOTYPE SYSTEM
RAILROAD OPERATIONS A review of railroad operations in the Bryan - College Station, Texas, area was conducted to better understand the impact of trains on the transportation network. The Union Pacific Railroad serves the cities of Bryan and College Station. Union Pacific’s Fort Worth Subdivision mainline accommodates 12 to 20 trains daily connecting Houston, Galveston, and the petrochemical gulf coast with Fort Worth and points north. Union Pacific has indicated that traffic levels are expected to increase on the line in the future. There is a potential that the rail traffic will increase to the point where a second mainline will be added adjacent to the present main. The line runs north/south through the cities and is a significant impediment to vehicular and pedestrian traffic. The rail line effectively bisects Texas A&M University and parallels Wellborn Road. Congestion during university home football games is so severe that a curfew is imposed on rail movements to ensure both vehicular and pedestrian safety along the route. Day to day train volume and density is not predictable to any significant degree of accuracy. Although trains run on a general schedule set by the railroad, significant variation occurs due to unexpected delays as well as planned “work windows” along the rail line. There is only a single grade separated crossing along the line at University Drive. Several of the at-grade intersections have minimal storage space for vehicles between the railroad and the cross street, inclined storage space, and heavy pedestrian activity. Many of the campus shuttle bus routes must cross the railroad at these intersections.
Train types vary from long unit coal and automobile trains of over 7000 feet in length to short aggregate and local trains. A unit train is composed of a single type of railcar, hauling a single commodity to a single customer. Coal and grain are commonly transported in this manner. Locals are short trains whose task is to pickup and deliver cars for area industries. Trains pass through the cities with a wide variation in speed. Trains slowing to enter the passing track in Bryan (located less than a mile from Texas A&M University) routinely move at less than 10 mph. A unit coal train moving at 10 mph will create a delay in excess of 8 minutes at a single grade crossing. Trains entering or leaving the south side of College Station can be moving in excess of 50 mph. In general trains travel at speeds of 20 to 25 mph through College Station. Table 2 summarizes the distribution of train lengths for trains passing through College Station. The table reveals that there is a slight preponderance toward long trains but it is not overwhelming. Train length distribution information is useful in determining acceptable spacing for sensors along a corridor. The higher percentage of time a train is not in front of a sensor the higher the inaccuracy in location and speed projections. Appendix B contains a more detailed study of the length distribution and its impact on sensor spacing.

24
Table 2. Train Length Distribution.
Length Distribution (Percent) Less than 2000 feet 10.2 Between 2000 and 4000 feet 28.6 Between 4000 and 6000 feet 27.0 Greater than 6000 feet 34.2
Figure 10 is a map of the Bryan – College Station area in which RailTrac was implemented. Bryan is in the upper area of the map and College Station in the lower region. Thick blue lines denote major arterials. Wellborn Road runs parallel to the Union Pacific mainline (in red). Train Detection Packages were deployed at locations denoted with a yellow circle. Sensor spacing varies from a minimum of 5200 feet to a maximum of 8600 feet.
Figure 10. Bryan - College Station Roadways, Railroad, and Train Detection Stations.

25
APPENDIX A - MOBILE DATA COLLECTION STATION DESIGN Data collection required sensor mounting and management platform to support initial field testing of sensors and field equipment software. In concert with sensor performance evaluation, software algorithms for the end product field controller were under development and required testing. TTI staff designed and constructed a mobile data collection station, as shown in Figure 11, that could be positioned anywhere along the rail corridor, provide needed power for equipment, and communicate back to a central office to report conditions. The mobility allows for easy positioning of detectors along the rail corridor to determine where sensors are to be deployed for best results. The use of low energy consumption sensors (approximately seven watts measured power consumption) enables the station to be powered from a single solar panel and storage batteries. A 60-watt solar panel from Kyocera Corporation was chosen for the job. The panel measures 26 x 30 inches (780 sq. inches), supplies ample energy, and is very lightweight. A charge controller to regulate energy transfer to the batteries completes the power generation design. The trailer was equipped with two large deep cycle marine batteries storing enough energy to supply the site’s equipment for approximately six days without any recharging current. Real-time communication from the field is the task of a corridor-wide wireless data network. TTI researchers developed a protocol, henceforth called the Message Encoding Protocol (MEP), for use in all data communications with field equipment. Appendix D defines the protocol. For permanent installations, the solar/wireless option eliminates the need for costly trenching and hookup fees to acquire commercial power and communication (telephone service). Additionally, solar and wireless have no recurring costs. A control computer, similar to a programmable logic controller, manages all the different electronic equipment on the trailer and performs the following tasks:
• performs all packetizing and protocol conversion for information moving on the
wireless network, • controls the operation of the radar sensor including rebooting and direction sense, • controls heartbeat generation, and • monitors the battery voltage and electronics compartment temperature.
Heartbeat messages are used to monitor the quality of the communication link to each site and to report battery voltage. Missing heartbeats are an indicator of system failure at the site or severe interference on the RF channel. The control computer chosen for the task is the Basic Tiger from Wilke Technology GmbH. The Tiger is essentially a single board computer/controller demonstrating the state of the art in microcontroller technology. It is inexpensive yet computationally powerful, physically small (not much larger than a traditional Central Processing Unit chip), and consumes little energy. The Tiger offers a programming package utilizing the BASIC computer language, a common choice for low to medium duty controllers. A very powerful feature of the controller is its built-in multitasking operating system and use of software drivers to interface peripheral devices. This concept, standard in larger computers, is very helpful for rapid code development. An application rarely consists of a single monolithic task with linear processing in a large loop. Finally, the controller provides numerous channels for analog and digital input/output as well as support for several RS232 data ports. Figure 12 shows a block diagram of the data collection site design.

26
Figure 11. Mobile Data Collection Station.

27
Figure 12. Data Collection Station Block Diagram.


29
APPENDIX B - SENSOR PLACEMENT CALCULATION
Figure 13. Train Length Distribution.
The graph in Figure 13 shows the distribution of train lengths for trains traveling through College Station. The graph is read as the percentage of the total number of trains that were equal to or less than the specified length. The average train length (50 percent less than the specified length) is approximately 4800 feet. Researchers can use this data to determine effective spacing for train detection stations along this specific rail corridor. Note that train types and lengths are dependent on the traffic mixture for each rail line. To maintain good train data, trains must be in front of a physical sensor for a high percentage of time while in the corridor. If sensor stations are located at one mile spacing, 53 percent of the trains will be in a detection zone for their entire trip through the corridor. If we accept 2000 feet as a dead reckoning distance (area where no data is available for the train), the number of trains that meet the criteria increases to 76 percent. The system designer will have to make some decisions on how much dead reckoning time is acceptable. If the sensor station distance interval is reduced to 4000 feet, 60 percent of passing trains will always be in a detection zone. Using the same 2000 feet of dead reckoning distance, the number of trains meeting the criteria rises to 90 percent.
Distribution of Train Lengths Through College Station430 Samples
0
10
20
30
40
50
60
70
80
90
100
0 1000 2000 3000 4000 5000 6000 7000 8000
Feet
Per
cen
tag
e

30
Another factor that should be considered when determining sensor spacing is the potential for significant train acceleration or deceleration between sensors. These areas should have a closer sensor spacing to deliver more frequent train location and speed updates. Finally, it is appropriate for certain areas of a corridor to require higher accuracy in train location and speed data. Fringe areas where trains do not change speed and have few crossings or other areas of interest can operate with longer sensor spacing. These stations will likely operate in an “early warning” mode to announce the arrival or departure of a train into or out of the corridor.

31
APPENDIX C - SENSOR EVALUATION
An infrared (laser) product was reviewed first. A Kustom Signals Pro Laser II Lidar sensor was evaluated by handholding the unit and measuring passing trains at a distance similar to that required for a sensor installation. Results showed that tracking the locomotive or lead car at a distance was simple but the sensor had to be moved to maintain beam alignment as the train neared the station. At a distance the laser did an excellent job of returning an accurate speed but as the head of the train passed, the product was unable to discern the speed of the moving “wall” of rail cars. The laser unit was able to acquire the speed of some of the cars in a train but consistent detection was unachievable. The laser was not receiving sufficient reflected energy to make a positive detection. Lightwave systems operate by continually measuring the range of a target. Speed is calculated as the rate of change of the target’s range. Without range data it is impossible to calculate speed. Infrared laser technology would be a good choice for a sensor that would measure train presence when not moving. Subsequent discussions with a laser radar vendor indicated that a heating unit would likely be required to ensure year-round reliability from a laser sensor.
Traditional radio frequency radar systems use a different technique to directly measure the speed of a target. The Doppler effect is employed to ascertain the speed of a moving object. RF energy is slightly altered when reflected from a moving target. The frequency of the reflected signal is lower when the target is moving away from the receiving station and higher when moving toward the station. Careful analysis of the frequency difference can reveal the speed and direction of travel of the target with respect to the receiver. Being that the microwave emissions from the radar are much lower in frequency than that of light, more of the incident signal is reflected back to the receiver by the sides of metallic railcars. Testing demonstrated that it is relatively easy to acquire speed information of the head end of a train and the following cars. Since the RF emission is lower in frequency, the detection area is conical in shape instead of a point. The wider detection area introduces uncertainty in the exact location of the passing train.
The sensor technology pursued for the off right-of-way detectors was RF Doppler radar. The choice enabled several important concepts. RF radar systems employ a mature technology. Research and development on microwave components has been underway since the 1930s and solid state equipment is now common and reliable. Motion sensing radar products are widely used as triggers for door or gate openers, intrusion systems, and as precision speed sensors. Because of advances in solid state integrated circuitry, the transmitter/receiver can be physically small and lightweight. A Doppler system will work adequately in pole mounted side-fire installations or overhead, aimed directly at the target as long as the appropriate off-angle corrections are understood. Range issues should easily be met with Federal Communications Commission part 15 equipment, ensuring low power consumption and lower cost. RF radar systems can offer presence (or range) as well as speed and direction detection if desired.
A search was conducted to identify potential suppliers of an applicable radar product. A review of current roadway and police radar detectors revealed three companies with products that were worthy of further study. Microwave Sensors Inc. (now called MS Sedco), a manufacturer of a line of traffic sonic and radar motion sensor equipment was contacted. Discussions revealed that the company was preparing to introduce a radar sensor that would offer realtime speed data. A

32
pair of prototype traffic Doppler radar sensors, model TC26-S, was offered for evaluation. See Figure 14. The sensors provided an ASCII representation of the speed of a target with a resolution of 1 mph via a RS232 serial data port. The minimum detectable speed was less than 3 mph. Unfortunately the direction of the target could not be recovered from the unit as designed. An internal switch determines the direction of movement that the sensor observes and is designed to be set during installation. Subsequent discussions with Microwave Sensors resulted in an agreement for TTI to modify the unit to enable remote direction change capability. Tests conducted on the sensors were successful. The sensors were small, lightweight, and consumed little power during operation. The RF power output was easily sufficient to detect trains at our required range. Researchers tested the speed measurement accuracy using a laser radar speed reference. The RF unit showed close agreement in speed detection accuracy. The units performed well. The only problems were in occasional sensor lockups and RS232 communication driver hardware failure. The former was easily overcome with software on the field controller. The unit is fairly sensitive to rain. It is unknown if Microwave Sensors ever brought their radar speed sensor product to market. A review of the company website did not list the item or anything similar.
Figure 14. Microwave Sensors, Inc. Model TC26-S Radar Sensor.
Whelen Engineering Company, Inc. was contacted and a model TDW-10 Wide Beam Vehicle Detector was purchased. The TDW-10 is designed for mounting over a lane of traffic or on a pole mounted off to the side of a traffic lane. In similar fashion as the TC26-S, the Whelen sensor offers a RS232 serial data port and an ASCII representation of vehicle relative speed. The TDW-10 unit is larger in size than the Microwave Sensor counterpart and likewise can only detect movement in only one direction, configurable via an internal jumper. The unit was installed and evaluated for several months as shown in Figure 15.
The Whelen sensor had several shortcomings. The unit only reports when a target is acquired. There is no communication with the sensor when no target is detected, thus making communication failures difficult to detect. The unit has a test feature but a technician is required to open the sensor housing. The minimum speed reported by the sensor was 10 mph. The unit showed a tendency to not recover gracefully from power outages, requiring a remote rebooting

33
system to be incorporated into the field controller. The Whelen sensor was the least affected by rain, although most rain showers appear to be less than 10 mph on radar sensors. The sensor is designed to have a wide coverage footprint. The wide area led to significant uncertainty in train location upon detection. The Whelen product had problems producing a continuous stream of speed samples as a train passed. The detection during passage was inconsistent, thus making end-of-train detection imprecise. A narrow beam Whelen product (TDN-30 Narrow Beam Vehicle Detector) was also tested but showed more gaps in speeds as a train passed and was somewhat difficult to align when installed. Both units are designed for overhead bridge mounting. While not an issue in the vehicular detection marketplace, overhead installation is unrealistic in most rail applications. Use of the Whelen as the primary sensor would require a secondary system to pinpoint a train’s position upon arrival into and exit from the detection zone.
Figure 15. Whelen Model TDW-10.
MPH Industries, supplier of police speed radar, was approached about providing a unit. MPH recently provided speed radar units to Burlington Northern Santa Fe’s Argentine Yard upgrade project in Kansas City. MPH delivered a modified police radar and researchers tested it. The unit, like the others, was small, low power, and provided a serial data link. This unit was able to determine movement direction. Field tests revealed that though the sensor easily measured passing trains, background objects or noise produced numerous spurious train detects. The manufacturer showed little interest in modifying the product; therefore testing was curtailed. The MPH unit is very similar in construction and appearance to the Decatur Electronics unit discussed next.
The final candidate product was another police/sports radar. Decatur Electronics products are used for sports, police, industrial/OEM, and scientific applications. Decatur provided a sample doppler radar sensor for evaluation. The sample was a sports radar and was unable to recover direction, had a minimum speed of 15 mph, and a speed resolution of 1 mph. Communication to the unit was RS232. See Figure 16. Researchers installed the radar and testing began. The Decatur radar showed excellent speed accuracy and the ability to give a continuous speed

34
Figure 16. Decatur SI-2 Doppler Radar.
stream as a train passed the sensor. The radar showed no problems in detecting trains at our required range. In similar fashion to the Microwave Sensors offering, the Decatur radar had difficulty during periods of rain. Discussions with Decatur revealed that they were interested in modifying an upcoming doppler radar product to meet our specifications. They had a new radar product called the SI-2 ready to enter the market that would be relatively easy to modify (software) to meet our needs. Electronic Integrated Systems, Inc. was approached to determine if their RTMS radar product could be used in a train detection role. After discussions with their technical staff, they decided that their sensor would not perform well in this role or there was insufficient market to warrant their research and development effort. A similar response was received from Schwartz Electro-Optics, Inc. Schwartz sells an active infrared scanning system for vehicular detection. Both the Electronic Integrated Systems and Schwartz products were significantly more expensive than the RF products.
Given the experience with the Microwave Sensors, MPH Industries, and Decatur radar products it was determined that rain was going to be an issue in any RF doppler product. Of the group tested, the Decatur and Microwave Sensors products perform best. Unfortunately there was no clear indication of whether Microwave Sensors would actually get a product to market. Decatur was willing to modify their product to meet a reasonable TTI specification. The decision was made to try to overcome the rain issue through software and to prepare a specification for Decatur Electronics.

35
RADAR SENSOR SPECIFICATION After evaluating several doppler radar products, TTI developed a doppler radar specification. Decatur Electronics was the only company within the group evaluated that was interested in producing an item that met the specification. It is possible that other vendors may be interested or even the reviewed vendors may be interested if market demand was sufficient. The specification is included as Appendix E. An order was placed with Decatur Electronics on June 12, 1999. Sample output from the delivered sensor is documented in Appendix F.

37
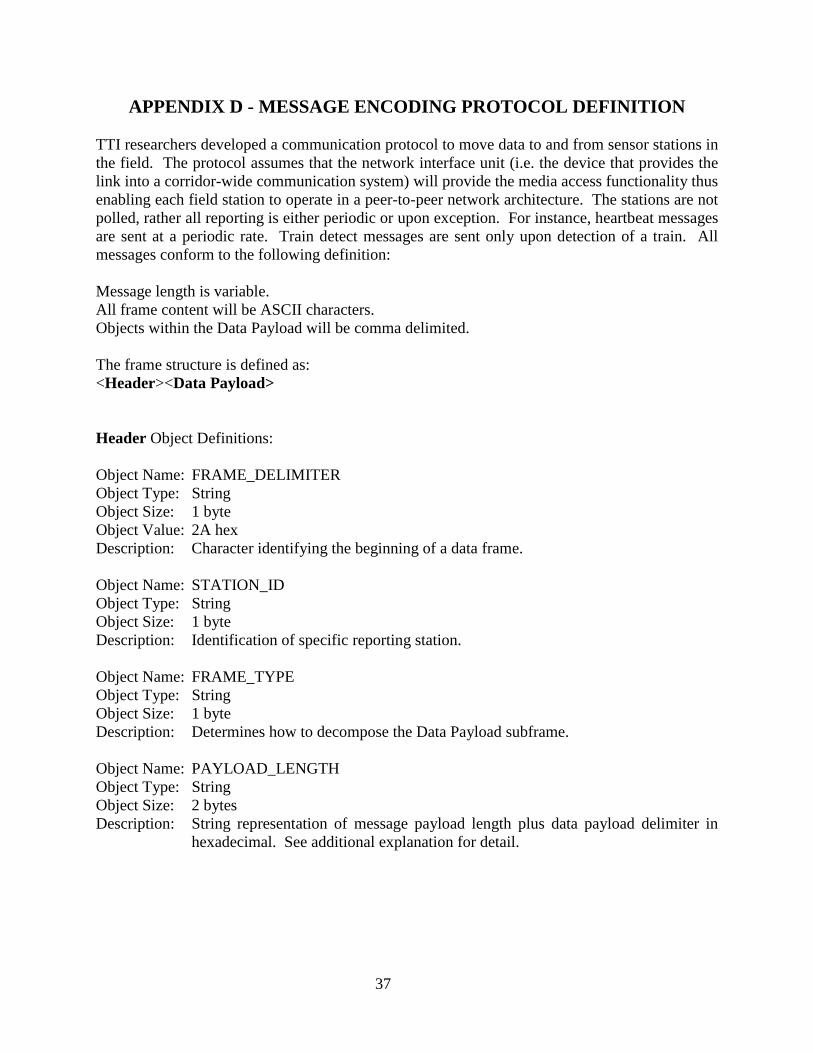
APPENDIX D - MESSAGE ENCODING PROTOCOL DEFINITION TTI researchers developed a communication protocol to move data to and from sensor stations in the field. The protocol assumes that the network interface unit (i.e. the device that provides the link into a corridor-wide communication system) will provide the media access functionality thus enabling each field station to operate in a peer-to-peer network architecture. The stations are not polled, rather all reporting is either periodic or upon exception. For instance, heartbeat messages are sent at a periodic rate. Train detect messages are sent only upon detection of a train. All messages conform to the following definition: Message length is variable. All frame content will be ASCII characters. Objects within the Data Payload will be comma delimited. The frame structure is defined as: <Header><Data Payload> Header Object Definitions: Object Name: FRAME_DELIMITER Object Type: String Object Size: 1 byte Object Value: 2A hex Description: Character identifying the beginning of a data frame. Object Name: STATION_ID Object Type: String Object Size: 1 byte Description: Identification of specific reporting station. Object Name: FRAME_TYPE Object Type: String Object Size: 1 byte Description: Determines how to decompose the Data Payload subframe. Object Name: PAYLOAD_LENGTH Object Type: String Object Size: 2 bytes Description: String representation of message payload length plus data payload delimiter in
hexadecimal. See additional explanation for detail.

38
Object Name: FRAME_CHECKSUM Object Type: String Object Size: 2 bytes Description: See checksum discussion below. Object Name: FRAME_NUMBER Object Type: String Object Size: 2 bytes Description: Sequential number assigned to every outgoing frame. Object content is the string
representation of the sequence number in hex. Valid sequence numbers are 00 hex to FF hex.
Data Payload Object Definitions: Object Name: PAYLOAD_DELIMITER Object Type: String Object Size: 1 byte Object Value: 3A hex Description: Character identifying the beginning of the data payload within a data frame. Object Name: PAYLOAD Object Type: String Object Size: Variable Description: ASCII data to be transported. Object Name: END_OF_FRAME Object Type: String Object Size: 2 bytes Object Value: 0D0A hex Description: Denotes the end of the data frame.

39
CALCULATION OF DATA PAYLOAD LENGTH The data payload length is defined as the sum of all characters within the PAYLOAD object plus the PAYLOAD_DELIMITER character. CALCULATION OF FRAME_CHECKSUM The FRAME_CHECKSUM is designed to be a simple check on the validity of a frame. This check feature is not designed to be the sole error-checking mechanism within the communication environment. The network interface unit will contain its own method for applying error detection/correction to all frames moving through the unit. Taking the hex value of each byte in the following objects and summing them modulo 256 calculate the simple checksum: STATION_ID FRAME_TYPE PAYLOAD_LENGTH FRAME_NUMBER PAYLOAD_DELIMITER PAYLOAD The final checksum is the string representation of the modulo 256 sum. SAMPLE MESSAGES Message as viewed by a simple text viewer application: *F01DB435: 1737238,#,+59.00,12.416,#,# *F01DBA36: 1737244,#,+59.00,12.397,#,# *F01DB037: 1737250,#,+59.00,12.416,#,# Hexadecimal representation: String equivalent: 2A 46 30 31 44 42 34 33 35 3A 20 31 37 33 37 32 *F01DB435: 17372 33 38 2C 23 2C 2B 35 39 2E 30 30 2C 31 32 2E 34 38,#,+59.00,12.4 31 36 2C 23 2C 23 0D 0A 16,#,#.. 2A 46 30 31 44 42 41 33 *F01DBA3 36 3A 20 31 37 33 37 32 34 34 2C 23 2C 2B 35 39 6: 1737244,#,+59 2E 30 30 2C 31 32 2E 33 39 37 2C 23 2C 23 0D 0A .00,12.397,#,#.. 2A 46 30 31 44 42 30 33 37 3A 20 31 37 33 37 32 *F01DB037: 17372 35 30 2C 23 2C 2B 35 39 2E 30 30 2C 31 32 2E 34 50,#,+59.00,12.4 31 36 2C 23 2C 23 0D 0A 16,#,#..


41
APPENDIX E - DOPPLER RADAR SENSOR SPECIFICATION RADAR SENSOR SPECIFICATION The Texas Transportation Institute is interested in purchasing a doppler radar sensor with the following characteristics: Physical
• The radar must be relatively small and lightweight. • The radar must be designed for continuous outdoor operation and meet National
Electrical Manufacturers Association environmental specifications for similar equipment. Logical
• The radar sensor will provide speed, direction, and received signal strength data as a response to a poll message.
• Given the correct polling sequence, the radar must be able to produce samples at no less than 10 times per second.
• Speed will be measured and reported with a resolution of 0.1 mph. • Minimum detectable speed is 3 mph. • Maximum detectable speed is 70 mph. • Received signal strength will be within a range of 0 to 100. It is not necessary for this
measurement to be absolute value. A measure of relative strength will suffice. • The sensor must be able to work in a “side-fire” installation. The sensor will be installed
at an angle to the vector of target motion. Electrical
• The radar will not require any special licensing for operation. • The radar must meet all FCC regulations covering such equipment. • The radar will be powered by a nominal 12 volt direct current supply. Minimum
operating voltage of 11 volts DC and a maximum of 14 volts DC. Interface
• The radar will communicate via RS232 with the following characteristics: • 9600 bits per second (more commonly baud), • 8 data bits, • 1 stop bit, and • no flow control.
• All communication to and from the radar will conform to ASCII encoding. Protocol
• The polling message is composed of exactly 4 bytes.

42
Poll Message Object Definitions: Object Name: FRAME_DELIMITER Object Type: String Object Size: 1 byte Object Value: 2A hex Description: Character identifying the beginning of a data frame. Object Name: FRAME_TYPE Object Type: String Object Size: 1 byte Object Value: 50 hex Description: Defines message type. Object Name: END_OF_FRAME Object Type: String Object Size: 2 bytes Object Value: 0D0A hex Description: Denotes the end of a frame. • The radar response to a poll message will be composed of exactly 14 bytes structured as:
• <Frame delimiter character><Direction character><Field delimiter><Speed><Field delimiter><Received signal strength><Carriage return line feed>
• The frame delimiter will be ASCII “*” (2A hex). • The field delimiter will be ASCII “,” (2C hex). • The direction character can have three options:
• ASCII “+” (2B hex) indicates motion is TOWARD the radar sensor. • ASCII “–“ (2D hex) indicates motion is AWAY from the radar sensor. • ASCII “?” (3F hex) indicates UNKNOWN direction.
• The speed will be represented by 5 ASCII characters structured as: • <Hundreds digit><Tens digit><Ones digit><Period><Tenths digit> • Speed indication will be composed of exactly 5 bytes.
• The received signal strength will be structured as: • <Hundreds digit><Tens digit><Ones digit> • Received signal strength will be composed of exactly 3 bytes.

43
APPENDIX F - SAMPLE RADAR OUTPUT The Decatur radar sensor was tested shortly after arrival. A location was selected and the mobile data station deployed. Figure 17 shows the test fixture. The site was solar powered and the controller fed raw radar output to the wireless modem. The data traveled back to the TransLink laboratory and printed on a stripchart for analysis.
Figure 17. Decatur Radar Test Fixture. The mobile station was placed approximately 50 feet from the railroad track and pointed south. Figure 18 shows station placement. The railroad tracks curve just beyond the detection zone bringing them into near alignment with the aim of the radar. Figure 19 approximates the field of view of the radar sensor.
Figure 18. Station Position with Respect to Railroad.

44
Note railroad track curving toward the left
Figure 19. Field of View of the Radar.
Figure 20 is a photo taken from the approximate point along the railroad tracks that intersects the center of the radar beam. The image shows the angle between radar sensor and actual train movement. True speed is derived by a trigonometric correction for the off angle.
Figure 20. Angle of Incidence of Radar Beam with Track.

45
Figure 21 shows a typical train moving outbound or away from the radar. Note the very sharp jump in reflected signal strength upon entrance and exit of the train. Note also that the radar continues to get speed readings from the train at a distance (albeit with low reflected signal strength). The radar continues to return the train’s speed 100 seconds after departure from the test station.
Legend Inbound
Speed Outbound
Speed Signal
Strength
Relative Power 10dB/Div Speed 10MPH/Div
Time - 25 seconds/Div
Figure 21. Radar Reflected Signal Profile – Outbound Train
Figure 22 shows an elevated noise floor and sporadic, somewhat random low speed readings. This is a characteristic return during a rain event. The controller that interfaces with the radar will need to employ a software solution to limit the effects of rain.
Legend Inbound
Speed Outbound
Speed Signal
Strength
Relative Power 10dB/Div Speed 10MPH/Div
Time - 25 seconds/Div
Figure 22. Radar Reflected Signal Profile – Rain Event

46
Figure 23 shows a typical inbound (moving toward sensor) train passing the sensor. Note again that the radar begins detecting the train well before it arrives in the detection zone. The radar speeds follow the train’s deceleration closely with very few obviously incorrect speed readings.
Legend Inbound
Speed Outbound
Speed Signal
Strength
Relative Power 10dB/Div Speed 10MPH/Div
Time - 25 seconds/Div
Figure 23. Radar Reflected Signal Profile – Inbound Train
Below is a graph showing data taken from the radar at approximately 5:12 PM. Notice the preponderance of outbound “clutter.” The clutter is evening peak traffic on a distant roadway. The controller that interfaces with the radar will need to handle background clutter.
Legend Inbound
Speed Outbound
Speed Signal
Strength
Relative Power 10dB/Div Speed 10MPH/Div
Time - 25 seconds/Div
Figure 24. Radar Reflected Signal Profile – Background Clutter

47
The following graph shows the case of a train entering the detection zone at a very slow speed and accelerating. Note again the sensor’s ability to sense the train’s speed at a great distance.
Legend Inbound
Speed Outbound
Speed Signal
Strength
Relative Power 10dB/Div Speed 10MPH/Div
Time - 25 seconds/Div
Figure 25. Radar Reflected Signal Profile – Accelerating Train
Below is a graph showing a data sample from midnight. Notice the very low noise floor and occasional traffic on the distant roadway.
Legend Inbound
Speed Outbound
Speed Signal
Strength
Relative Power 10dB/Div Speed 10MPH/Div
Time --- 25 seconds/Div
Figure 26. Radar Reflected Signal Profile – Minimal Background Clutter


49
APPENDIX G - TRAIN DETECTION PACKAGE MESSAGE DEFINITIONS
The Train Detection Packages use seven message types to exchange data with the Central Processor Unit. Consider each message as containing multiple variable length string data elements. The following will define each data element and associate it with a binary equivalent for use in further processing. The messages are defined below. All messages conform to the frame formatting documented in Appendix D. Element definition: Object Name: The name given to the specific piece of information. Object Type: The binary representation for the ASCII data. Object Size: Number of bytes required to hold the binary representation. Object Range: Set of possible values if less than the entire binary type range. Description: Brief description of element content. HEARTBEAT MESSAGE Purpose: Message is transmitted periodically (configurable rate) and reports current conditions (battery, solar, time, etc.) and information about the last train that passed the station. Heartbeat Object Definitions: Object Name: FRAME_TYPE Object Type: Byte Object Size: 1 byte Object Range: 30 hex Description: Message identification. Object Name: LOW_RES_CLOCK Object Type: Long Object Size: 4 bytes Object Range: 0 to 2,147,483,647 Description: A counter that represents the number of seconds from power up. Object Name: SENSE_DIRECTION Object Type: Byte Object Size: 1 byte Object Range: 30 hex, 31 hex, or 32 hex Description: A character that represents the direction of movement the sensor is currently
detecting.

50
Object Name: TEMPERATURE Object Type: Real Object Size: 8 bytes Description: Inside temperature of the cabinet in degrees Fahrenheit. Object Name: BATTERY_VOLTAGE Object Type: Real Object Size: 8 bytes Description: Voltage as read from the storage battery bank. Measurement units are volts. Object Name: CURRENT Object Type: Real Object Size: 8 bytes Description: Current flowing into (positive) or out of (negative) the battery bank.
Measurement units are amps. Object Name: ENERGY Object Type: Real Object Size: 8 bytes Description: Cumulative energy deposited (positive) or withdrawn (negative) from the battery
bank. Measurement units are watt hours. Object Name: SENSOR_COMMUNICATION_STATUS Object Type: Byte Object Size: 1 byte Object Range: 30 hex for bad communication status. 31 hex for good communication status. Description: Status of communication link between controller and sensor. Object Name: LAST_TRAIN_BEGIN Object Type: Long Object Size: 4 bytes Object Range: 0 to 2,147,483,647 Description: Capture of LOW_RES_CLOCK when last train first detected. Object Name: LAST_TRAIN_END Object Type: Long Object Size: 4 bytes Object Range: 0 to 2,147,483,647 Description: Capture of LOW_RES_CLOCK when last train departed.

51
Object Name: LAST_TRAIN_LENGTH Object Type: Real Object Size: 8 bytes Object Range: 0 to 10000 Description: Length of last train past the station in feet. Object Name: TIME_SINCE_LAST_TRAIN Object Type: Long Object Size: 4 bytes Object Range: 0 to 2,147,483,647 Description: The number of seconds since the last train passed the sensor. Calculated using
LOW_RES_CLOCK data. Object Name: HIGH_RES_CLOCK Object Type: Long Object Size: 4 bytes Object Range: 0 to 2,147,483,647 Description: A counter that represents the number of milliseconds from power up or last
counter rollover. Object Name: BACKGROUND_SIGNAL_INTENSITY Object Type: Byte Object Size: 1 byte Object Range: 0 to 100 Description: Indication of average background reflected signal intensity when not detecting a
train. Object Name: CONFIDENCE Object Type: Byte Object Size: 1 byte Object Range: 0 to 10 Description: Indication of confidence in the data used to declare train detection. Object Name: LAST_TRAIN_DIRECTION Object Type: Byte Object Size: 1 byte Object Range: 30 hex or 31 hex Description: Direction of last train that passed the station. Object Name: PREEMPT_CALL Object Type: Byte Object Size: 1 byte Object Range: 30 hex denotes preempt active.
31 hex denotes preempt inactive. 32 hex denotes preempt unknown or unavailable.
Description: Status of the preemption system associated with a nearby grade crossing.

52
Train Detect Message Purpose: Message is transmitted upon positive determination of a train at a station. The reporting interval is configurable. Train Detect Object Definitions: Object Name: FRAME_TYPE Object Type: Byte Object Size: 1 byte Object Range: 31 hex Description: Message identification. Object Name: LOW_RES_CLOCK Object Type: Long Object Size: 4 bytes Object Range: 0 to 2,147,483,647 Description: A counter that represents the number of seconds from power up. Object Name: DETECTION Object Type: Byte Object Size: 1 byte Object Range: 30 hex for positive detection.
31 hex for negative detection (detection lost at end of train). Description: A character that represents the detection of train motion. Object Name: SENSOR_SPEED Object Type: Real Object Size: 8 bytes Object Range: 0.0 to 99.9 Description: Speed the sensor is reporting directly in mph (Not true speed. Requires angular
correction.) Object Name: DIRECTION Object Type: Byte Object Size: 1 byte Object Range: 30 hex, 31 hex, or 32 hex Description: A character that represents the direction of movement the sensor is currently
detecting. Object Name: DUMMY Object Type: Byte Object Size: 1 byte Object Range: 23 hex Description: This field is unused in the current definition.

53
Object Name: TRUE_SPEED Object Type: Real Object Size: 8 bytes Object Range: 0.0 to 99.9 Description: True speed of the detected motion in mph. Object Name: LENGTH Object Type: Real Object Size: 8 bytes Object Range: 0 to 20,000 Description: Accumulated length of passing train in feet. Object Name: FIRST_DETECTED Object Type: Long Object Size: 4 bytes Object Range: 0 to 2,147,483,647 Description: Capture of LOW_RES_CLOCK when train first detected. Object Name: LAST_DETECTED Object Type: Long Object Size: 4 bytes Object Range: 0 to 2,147,483,647 Description: Capture of LOW_RES_CLOCK when train last detected. Object Name: LOCATION Object Type: Real Object Size: 8 bytes Object Range: 0 to 2,147,483,647 Description: Location of the front of the train in a linear corridor. Measurement is in feet from
the origin. Object Name: HIGH_RES_CLOCK Object Type: Long Object Size: 4 bytes Object Range: 0 to 2,147,483,647 Description: A counter that represents the number of milliseconds from power up or last
counter rollover. Object Name: CONFIDENCE Object Type: Byte Object Size: 1 byte Object Range: 0 to 10 Description: Indication of confidence in the data used to declare train detection.

54
Object Name: STRENGTH Object Type: Byte Object Size: 1 byte Object Range: 0 to 100 Description: Intensity of reflected radar signal from the train. Object Name: BACKGROUND_SIGNAL_INTENSITY Object Type: Byte Object Size: 1 byte Object Range: 0 to 100 Description: Indication of average background reflected signal intensity when not detecting a
train. Object Name: PREEMPT_CALL Object Type: Byte Object Size: 1 byte Object Range: 30 hex denotes preempt active.
31 hex denotes preempt inactive. 32 hex denotes preempt unknown or unavailable.
Description: Status of the preemption system associated with a nearby grade crossing. Object Name: ACCELERATION Object Type: Real Object Size: 8 bytes Object Range: -100.000 to +100.000 Description: Acceleration of the train measured in feet/sec2.

55
TRAIN PRE-DETECT MESSAGE Purpose: The message is transmitted upon early indication of a possible train. Recovery of this message is useful if immediate notification of target acquisition is necessary. Object Name: FRAME_TYPE Object Type: Byte Object Size: 1 byte Object Range: 34 hex Description: Message identification. Object Name: LOW_RES_CLOCK Object Type: Long Object Size: 4 bytes Object Range: 0 to 2,147,483,647 Description: A counter that represents the number of seconds from power up. Object Name: DETECTION Object Type: Byte Object Size: 1 byte Object Range: 30 hex for positive detection.
31 hex for negative detection (detection lost at end of train). Description: A character that represents the detection of train motion. Object Name: SENSOR_SPEED Object Type: Real Object Size: 8 bytes Object Range: 0.0 to 99.9 Description: Speed the sensor is reporting directly in mph. (Not true speed. Requires angular
correction.) Object Name: DIRECTION Object Type: Byte Object Size: 1 byte Object Range: 30 hex, 31 hex, or 32 hex Description: A character that represents the direction of movement the sensor is currently
detecting. Object Name: DUMMY Object Type: Byte Object Size: 1 byte Object Range: 23 hex Description: This field is unused in the current definition.

56
Object Name: TRUE_SPEED Object Type: Real Object Size: 8 bytes Object Range: 0.0 to 99.9 Description: True speed of the detected motion in mph. Object Name: LENGTH Object Type: Real Object Size: 8 bytes Object Range: 0 to 20,000 Description: Accumulated length of passing train in feet. Object Name: FIRST_DETECTED Object Type: Long Object Size: 4 bytes Object Range: 0 to 2,147,483,647 Description: Capture of LOW_RES_CLOCK when train first detected. Object Name: LAST_DETECTED Object Type: Long Object Size: 4 bytes Object Range: 0 to 2,147,483,647 Description: Capture of LOW_RES_CLOCK when train last detected. Object Name: LOCATION Object Type: Real Object Size: 8 bytes Object Range: 0 to 2,147,483,647 Description: Location of the front of the train in a linear corridor. Measurement is in feet from
the origin. Object Name: HIGH_RES_CLOCK Object Type: Long Object Size: 4 bytes Object Range: 0 to 2,147,483,647 Description: A counter that represents the number of milliseconds from power up or last
counter rollover. Object Name: CONFIDENCE Object Type: Byte Object Size: 1 byte Object Range: 0 to 10 Description: Indication of confidence in the data used to declare train detection.

57
Object Name: STRENGTH Object Type: Byte Object Size: 1 byte Object Range: 0 to 100 Description: Intensity of reflected radar signal from the train. Object Name: BACKGROUND_SIGNAL_INTENSITY Object Type: Byte Object Size: 1 byte Object Range: 0 to 100 Description: Indication of average background reflected signal intensity when not detecting a
train. Object Name: PREEMPT_CALL Object Type: Byte Object Size: 1 byte Object Range: 30 hex denotes preempt active.
31 hex denotes preempt inactive. 32 hex denotes preempt unknown or unavailable.
Description: Status of the preemption system associated with a nearby grade crossing. Object Name: ACCELERATION Object Type: Real Object Size: 8 bytes Object Range: -100.000 to +100.000 Description: Acceleration of the train measured in feet/sec2.

58
TRAIN POST-DETECT MESSAGE Purpose: The message is transmitted periodically for a set maximum time after a train has
departed a station. The contents of the message are useful in predicting the train’s position during dead reckoning.
Train Post Detect Object Definitions: Object Name: FRAME_TYPE Object Type: Byte Object Size: 1 byte Object Range: 32 hex Description: Message identification. Object Name: LOW_RES_CLOCK Object Type: Long Object Size: 4 bytes Object Range: 0 to 2,147,483,647 Description: A counter that represents the number of seconds from power up. Object Name: DIRECTION Object Type: Byte Object Size: 1 byte Object Range: 30 hex, 31 hex, or 32 hex Description: A character that represents the direction of movement of the last train past the
sensor. Object Name: LENGTH Object Type: Real Object Size: 8 bytes Object Range: 0 to 20,000 Description: Accumulated length of passing train in feet. Object Name: TRUE_SPEED Object Type: Real Object Size: 8 bytes Object Range: 0.0 to 99.9 Description: True speed of the detected motion in mph. Object Name: LOCATION Object Type: Real Object Size: 8 bytes Object Range: 0 to 2,147,483,647 Description: Location of the front of the train in a linear corridor. Measurement is in feet from
the origin.

59
Object Name: PREEMPT_CALL Object Type: Byte Object Size: 1 byte Object Range: 30 hex denotes preempt active.
31 hex denotes preempt inactive. 32 hex denotes preempt unknown or unavailable.
Description: Status of the preemption system associated with a nearby grade crossing. Object Name: HIGH_RES_CLOCK Object Type: Long Object Size: 4 bytes Object Range: 0 to 2,147,483,647 Description: A counter that represents the number of milliseconds from power up or last
counter rollover.

60
STATUS MESSAGE Purpose: Message is used to issue general information such as an acknowledgment or a
textual announcement. Status Object Definitions: Object Name: FRAME_TYPE Object Type: Byte Object Size: 1 byte Object Range: 33 hex Description: Message identification. Object Name: TEXT Object Type: String Object Size: Variable Object Range: 100 characters Description: Text explaining event, acknowledgment, or response to query. Object Name: CODE Object Type: Byte Object Size: 1 byte Object Range: 0 – 255 Description: A number that corresponds to identified Status Codes.
Table 3. Status Code Definitions.
Code Meaning 10 Invalid configuration variable frame length from GET command 11 Invalid get configuration variable identifier 12 Invalid configuration variable frame length from SET command 13 Invalid set configuration variable identifier 255 Frame passes transmission error checking

61
SET CONFIGURATION VARIABLE MESSAGE Purpose: Enables external updating of FPU variables Set Configuration Object Definition: Object Name: FRAME_TYPE Object Type: Byte Object Size: 1 byte Object Range: 42 hex Description: Message identification. Object Name: VARIABLE_IDENTIFIER Object Type: String Object Size: 2 bytes Object Range: 00 to 99 Description: Number identifying the configuration variable to be updated. Object Name: VALUE Object Type: String Object Size: Variable Object Range: 100 characters Description: Value of the configuration variable. GET CONFIGURATION VARIABLE MESSAGE Purpose: Enables external updating of FPU variables. Response is returned in a Status
Message with a TEXT field content of “Message_Pass=Read_Variable.” Get Configuration Object Definition: Object Name: FRAME_TYPE Object Type: String Object Size: 1 byte Object Range: 41 hex Description: Message identification. Object Name: VARIABLE_IDENTIFIER Object Type: Byte Object Size: 1 byte Object Range: 00 to 99 Description: Number identifying the configuration variable to be updated.


63
APPENDIX H - TRAIN DETECTION PACKAGE CONFIGURATION VARIABLES
The Train Detection Package is configured by assigning FPU variable station specific values. Each variable is described below and a summary follows in Table 4. Variable 00:
Space for a 30 ASCII character description of the software version running on the FPU. There is no default (the “default” is loaded with the program).
Variable 01:
Space for a 30 character description of the location of the sensor. An option would be to use latitude and longitude as part of the description.
Variable 02:
Each field station (TDP) has a unique single byte network address. The byte must map to a valid printable ASCII character. Examples are “0,” “3,” “A,” and “F.”
Variable 05:
The TDP produces a heartbeat message on a given time interval. The interval can be short (e.g., 3 seconds) or long (e.g., 3600 seconds). It is recommended that a heartbeat occurs at least every minute to support timely discovery of malfunctioning equipment.
Variable 07:
A rail corridor is defined to have a “0” direction and a “1” direction. The directions could correspond to north and south or east and west. There is a speed correction factor for each direction at a sensor station. The correction factor is required due to the radar not being parallel to the velocity vector of the train. Reasonable correction factors range between 1.0 (parallel with train velocity vector) to 1.4. The baseline correction factor can be calculated from distance measurements. It is simply a remapping of the train velocity vector. The measurement will get the correction factor close. A review of collected train passage data is required to fine tune the correction factor.
Variable 08: A minimum train length is assigned to keep a short duration detection from generating a train event. These short “trains” are likely maintenance vehicles, signal transients, or rain. The default setting is 150 feet.

64
Variable 09:
A threshold speed is checked to determine if Post Detect Messages are to be generated. The purpose of this setting is to not generate Post Detect Messages for slow moving trains. It is likely that slow moving trains will soon change speed, either stop or accelerate. In either case the accuracy of the Post Detect Message information will be much less than for trains moving at a normal speed. The default value is 8 mph.
Variable 10: An end of train is declared when the reflected signal strength drops below a threshold. The default value is 55.
Variable 11: The rail corridor is mapped by defining an origin with all other stations a measured number of feet from the origin. The default is 0 with the expectation that every station will require a unique number.
Variable 12: The TSU is polled by the FPU at a defined rate. The default is a poll every 40 milliseconds. It is not recommended that this value be changed.
Variable 19: When detection ends one of three events has happened. First and most often, the train has departed the sensor station. Second, the train has stopped within the station’s detection zone. With no movement the station declares an end of train. Third, a long gap in valid detection occurred as a train is moving past. The TDP will hold a train detection for an amount of time, waiting for detection reacquire. If a train is not reacquired during this time, any new detection will be declared a new train, and a new length will be started. The maximum wait time is set for slow moving trains. Since the train was moving slowly (less than 5 mph) there is a high probability that the train is stopping in front of the sensor. The default time to wait is 180 seconds.
Variable 20:
Each inbound data frame into the FPU must pass a basic frame test (correct length and format). The FPU can be configured to not conduct a checksum test. It is not recommended that this be done. The default value is 1.
Variable 25:
The single biggest problem with detection is the elimination of false detects caused by rain. The TDP calculates a background reflected signal intensity. When this value raises above a threshold the FPU train detection algorithm shifts into rain event mode. The default background intensity threshold is 40.

65
Variable 27: Each message generated by the TDP can be sent multiple times. This is useful when using an NIU that does not support guaranteed delivery. Each message type can be assigned a different number of copies to be transmitted. The default for the Train Detect Message is two copies.
Variable 28: The default number of copies of the Heartbeat Message is two. Variable 29:
The default number of copies of the Status Message is five.
Variable 30: The default number of copies of the Train Post Detect Message is two.
Variable 33: Each site issues the Post Train Detect Message after the train passes the site and until it reaches some point down the track. This point will be no further than the next sensor station. The point in the direction of increasing corridor position (away from the origin) default is 2000 feet but will need to be set for every installation.
Variable 34: In similar fashion, the minimum train location must be specified (train location toward the origin). The default is 0 feet but will need to be set for every installation.
Variable 35: Directions in the rail corridor are defined as “0” or “1.” The TDP must be told which corridor direction to equate motion toward the sensor and motion away from the sensor. If movement toward the radar sensor is equivalent to corridor direction “0” then this value must be 0. If the direction corresponds to corridor direction “1” the value must be 10.
Variable 36: Same as variable 35 except for movement away from the radar sensor.
Variable 37: Radar sensor data analysis is divided into two segments. High volume data (40 millisecond data) and low volume data. Low volume data is presented to the algorithm segment that calculates properties (e.g., length, location, direction). The default rate is 500 milliseconds and should not be changed.

66
Variable 39: At onset of detection a confidence in the detection is calculated. The confidence logic reviews several properties such as background signal intensity, train speed, and others to select a number. The confidence number can be used to filter low and medium probability detects. The confidence threshold provides a way to select between higher detection confidence with an increased probability of missing some trains or lower confidence but missing fewer (if any) trains. The TDP is configured to disregard detection with a confidence below a threshold. The default threshold is five.
Variable 40: Train detection depends, in part, on the reflected signal strength being above a threshold. The higher the threshold, the stronger the reflection (in general, the train being closer to the radar) to declare a detection. The default is 65.
Variable 41: See variable 19 for general description. This variable is the time to wait when detection is lost on a fast moving train (greater than 5 mph). Under these conditions either the train has departed the station (normal) or there is a long gap in train detection from the sensor. The time to wait for reacquire default value is 10 seconds. If reacquire does not occur within this time, any new detection will be declared as a new train.
Variable 42: A minimum speed for train detection is specified. This filters very slow speeds from generating a train event. The default is 4 mph.
Variable 43: See variable 7 for description. The speed correction factor for movement in the “1” direction default is 1.0000.
Variable 44: The accuracy of the speed samples from the radar decreases for very low speeds. A low speed correction shift point is defined such that speeds lower than specified are corrected by an additional factor. The default is 10.0 mph.
Variable 45: The low speed adjustment factor is a constant that the normal raw speed and correction factor is multiplied by to increase the accuracy of very low speeds. The default value is 0.98 (i.e., a 2 percent correction).
Variable 47: Each station is capable of accepting a traffic signal preempt indication for use in the train detection and reporting algorithms. This variable is set to 1 for stations with a preempt and 0 for stations without a preempt. The default is 0.
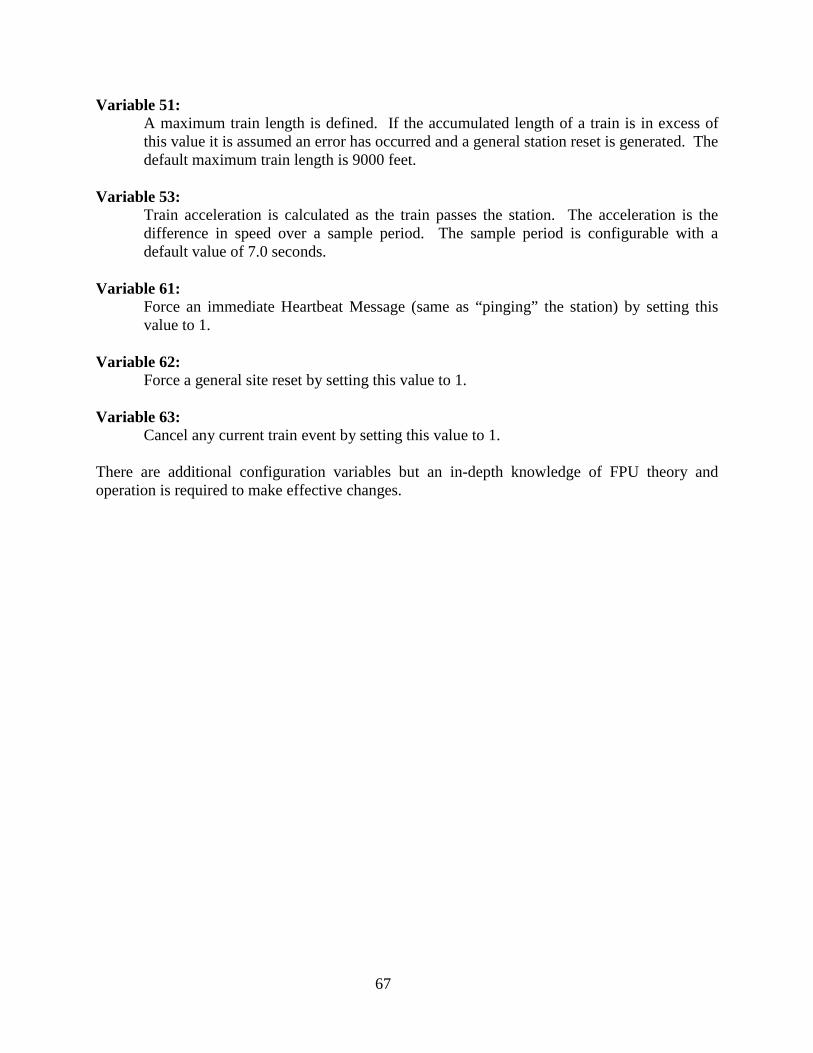
67
Variable 51: A maximum train length is defined. If the accumulated length of a train is in excess of this value it is assumed an error has occurred and a general station reset is generated. The default maximum train length is 9000 feet.
Variable 53: Train acceleration is calculated as the train passes the station. The acceleration is the difference in speed over a sample period. The sample period is configurable with a default value of 7.0 seconds.
Variable 61: Force an immediate Heartbeat Message (same as “pinging” the station) by setting this value to 1.
Variable 62: Force a general site reset by setting this value to 1.
Variable 63: Cancel any current train event by setting this value to 1.
There are additional configuration variables but an in-depth knowledge of FPU theory and operation is required to make effective changes.

68
Table 4. Summary of Configuration Variables.
Configuration Variables ID Information Range Default 00 Software version 30 characters “” 01 Location of site in corridor (text) 30 characters “SITE” 02 Field station network address 1 character “0” 05 Heartbeat time interval 0 to 2,147,483,647
seconds 5
07 Speed correction factor for “0” direction 1.0000 to 2.0000 1.0000 08 Minimum train length 0 to 9999 feet 150 09 Minimum speed to enable Post Detect Message 0 to 20 mph 8 10 Intensity threshold to end detect 0 to 100 55 11 Location of sensor in corridor (feet from origin) 0 to 2,147,483,647 feet 0 12 Sensor pole interval 0 to 20,000 millisecs 40 19 Maximum time to wait for reacquiring a dropped
detection 0 to 60 seconds 180
20 Frame error checking enable 0 or 1 1 25 Background intensity threshold 0 to 100 40 27 Number of copies of Train Detect Messages to send 1 to 20 2 28 Number of copies of Heartbeat Messages to send 1 to 20 2 29 Number of copies of Status Messages to send 1 to 20 5 30 Number of copies of Train Post Detect Messages to send 1 to 20 2 33 Maximum train location for Train Post Detect Message
generation 0 to 2,147,483,647 feet 2000
34 Minimum train location for Train Post Detect Message generation
0 to 2,147,483,647 feet 0
35 Motion inbound to sensor direction 0 or 10 0 36 Motion outbound from sensor direction 0 or 10 10 37 Analysis Period 0 to 10,000 millisecs 500 39 Confidence threshold for detection 0 to 10 5 40 Intensity threshold for detection 0 to 100 65 41 Minimum time to wait for reacquiring a dropped
detection 0 to 60 seconds 10
42 Minimum speed for train detection 0 to 10 mph 4 43 Speed correction factor for “1” direction 1.0000 to 2.0000 1.0000 44 Low speed correction shift point 0.0 to 20.0 mph 10.0 45 Low speed adjustment factor 0.00 to 5.00 0.98 47 Preempt Enable 0 or 1 0 51 Maximum train length 0 to 15,000 feet 9000 53 Speed sample interval for use in calculating acceleration 0.000 to 20.000 secs 7.0 61 Force a Heartbeat Message 1 0 62 Reset 1 0 63 Cancel train detection 1 0