integration of india's stock market with global and major ... · pdf file202 bis papers...
TRANSCRIPT
202 BIS Papers No 42
Integration of India’s stock market with global and major regional markets
Janak Raj and Sarat Dhal1
1. Introduction
National stock markets have emerged as the major channel for financial integration of emerging market economies amid globalisation, deregulation and advances in information technology. Among the factors contributing to growing financial integration are a rapid increase in the cross-border mobility of private capital inflows due to investors seeking portfolio diversification and better yields, a growing reliance of nations on the savings of other nations, and a shift in the leverage preference of companies from debt to equity finance. It is generally perceived that financial integration can be associated with several benefits, including development of markets and institutions and effective price discovery, leading to higher savings, investment and economic progress. At the same time, linkages among financial markets can pose various risks, such as the contagion and associated disruption of economic activities that were evident during the crisis in Asia in the late 1990s. More recently, in January 2008, national stock markets declined sharply in the wake of credit market developments in the United States. Economists have thus realised that it is useful for countries to monitor the progress of interdependence among financial markets for the sake of policy as well as market participants.
Recognising the critical importance of financial assets to economic agents and policy, numerous studies in the applied finance literature have concentrated on measuring the international integration of national stock markets across several developed and emerging market economies. In the copious literature, however, studies focused on India’s stock market are rather scarce,2 despite various stylised facts suggesting, prima facie, the growing linkage of the Indian market with global and major regional markets in Asia during the reform period beginning in the early 1990s.3 Illustratively, the Bombay Stock Exchange (BSE) of India has emerged as the largest stock exchange in the world in terms of the number of listed companies, comprising many large, medium-sized and small firms. With a market capitalisation of US$ 1.8 trillion in 2007, the BSE has become the tenth largest stock
1 Janak Raj is Adviser and Sarat Dhal is Assistant Adviser in the Department of Economic Analysis and Policy,
Reserve Bank of India. Responsibility for the views expressed in this paper rests entirely with the authors and not with the organisation to which the authors belong. The authors are grateful to Eli Remolona, Head of Economics for Asia and the Pacific at the Bank for International Settlements (BIS), for useful suggestions on an earlier draft of the paper presented at the first annual workshop of the Asian Research Network, organised in Hong Kong SAR in January 2008 by the Hong Kong Institute for Monetary Research and the BIS.
2 It is of particular interest that several studies on emerging markets, with a few exceptions, have not considered India. Studies that have included India are available for the period before 2003. However, as we see in this paper, India’s financial market has witnessed rapid progress since 2003.
3 Major reforms undertaken in the Indian capital market have included free pricing of equity issues in the primary market, introduction of the book-building process, screen-based trading in stock exchanges, allowing foreign institutional investors (FIIs) to operate in the Indian capital market and Indian companies to raise capital from international capital markets, dematerialisation of securities, rolling settlement (t + 2), setting up of the National Stock Exchange to create competitive pressures, corporatisation of major stock exchanges such as the BSE, strengthening of corporate governance practices and enhanced transparency and disclosure standards. For a comprehensive review of financial sector reform and perspectives on India, see the various articles by R Mohan and Y V Reddy referred to in this study.
BIS Papers No 42 203
exchange globally and come closer to advanced economies in terms of the ratio of market capitalisation to gross domestic product. As regards transaction cost, the Indian stock market compares with some of the developed and regional economies. With the objective of internationalisation, several Indian companies have opted for listing on the stock exchanges of other countries, especially the United States and the United Kingdom. Ten major Indian companies listed on the New York Stock Exchange (NYSE) account for a 19 per cent weight in the benchmark 30-scrip stock price index of the BSE. Fifty Indian companies are listed on the London Stock Exchange. Foreign capital flows have made a crucial contribution to the growth of India’s stock market. India has become a major destination, representing about a fourth of total portfolio capital inflows to the emerging market economies (EMEs) group. There are 1,247 foreign institutional investors participating in India’s stock market. The purchase and sales activities of such investors account for three fourths of the average daily turnover in India’s stock market.4 Since foreign investors operate in a number of countries at the same time, their operations can be expected to have contributed to the integration of the Indian stock market with other markets. Moreover, India has engaged in various bilateral trade and economic cooperation agreements with several countries and regional groups across Asia, Europe and the western hemisphere.
In this context, several issues arise. Is the Indian stock market integrated with global and regional markets? What is the extent of such market integration? Which regional and global markets have dominant influence on India’s stock market? While seeking answers to these questions is the major objective, we also have the motivation of contributing to the literature the experience of a leading emerging market economy like India. Following the dominant perspective in the applied finance literature, we use correlation and the vector error correction and cointegration model (VECM) to gauge the integration of India’s stock market with global markets such as the United States, the United Kingdom and Japan, and with major regional markets such as Singapore and Hong Kong, which are key financial centres in Asia. At the same time, the study demonstrates the critical role of data mining relating to frequency of data, sample periods and currency denomination of stock prices in the analysis of financial market integration. The study that follows comprises five sections, including a brief review of theoretical and applied finance perspectives relating to stock market integration, stock price variables and data used in the study, stylised facts, empirical analysis and summary findings.
2. Stock market integration hypothesis
In the theoretical literature, financial market integration derives from various postulates such as the law of one price (Cournot (1927), Marshall (1930)), portfolio diversification with risky assets (Markowitz (1952)), capital asset price models (Sharpe (1964), Lintner (1965)) and arbitrage price theory (Ross (1976)). Despite distinguishing features, these postulates share a common perspective: if risks command the same price, then the correlation of financial asset prices and the linkage among markets comes from the movement in the price of risks due to investors’ risk aversion. Based on these theoretical postulates, financial integration at the empirical level is studied using several de jure and de facto measures, although the latter, reflecting the actual degree of market linkages, have been more popular (Prasad et al (2006), Yu et al (2007)). Following the seminal works of Engle and Granger (1987), Johansen (1988) and Johansen and Juselius (1990), numerous studies beginning with Taylor and Tonks (1989), Kasa (1992) and, subsequently, Masih and Masih (2005),
4 Average daily turnover in the stock market is available for one-leg transactions, while turnover by the FIIs
includes two-way transactions (purchase and sales).
204 BIS Papers No 42
Chowdhry (1997) and Chowdhry et al (2007), among several others in the applied finance literature, have used the cointegration hypothesis to assess the international integration of financial markets. Until Taylor and Tonks (1989) and Kasa (1992), studies relied on correlation and regression analyses to gauge the nature of price convergence and international portfolio diversification across markets (Levy and Sarnat (1970), Agmon (1972), Solnik (1974) and Panton et al (1976)). Taylor and Tonks (1989) showed that the cointegration technique is useful from the perspective of the international capital asset price model. Kasa (1992) suggested that the short-term return correlation between stock markets is not appropriate from the perspective of long-horizon investors driven by common stochastic trends. A cointegration model is useful since it not only distinguishes between the nature of long-run and of short-run linkages among financial markets, but captures the interaction between them as well. Given the wide popularity of the cointegration hypothesis, we refrain from rehashing the algebra of this methodology. What is striking about the empirical literature is that studies on the subject have brought to the fore various useful perspectives relating to price equalisation, market equilibrium, market efficiency and portfolio diversification (Chowdhry et al (2007)). In order to facilitate our empirical analysis, a brief discussion on these perspectives follows.
2.1 The cointegration hypothesis The cointegration hypothesis has a generalised and statistical perspective on equilibrium dynamics among economic and financial variables. It begins with non-stationary variables with time-varying mean and variance properties. If the non-stationary variables are integrated within the same order – typically, the random walk or first-order integrated processes – then they may follow the path of equilibrium in the long run or share a cointegration relation, ie, a linear combination of them could be a stationary process. Within the multivariate vector error correction (VECM) framework of Johansen and Juselius (1990), the cointegration space may not be unique; there can be r cointegrating relationships among n non-stationary variables. In the extreme case, if r = 0, then the variables are not cointegrated and they do not follow a long-run equilibrium path. Similarly, if r = n, then the cointegration and error correction dynamics are redundant for the system of variables. In practice, there can be a single or multiple but less than n number of cointegration relations. According to Gonzalo and Granger (1995), the evidence of cointegration among national stock indices implies equilibrium constraints, which preclude the cointegrated indices from diverging too much in the long run. Such constraints emerge because these indices share common stochastic trends or driving forces underlying their mutual growth over extended time horizons. In contrast, a lack of cointegration suggests that stock markets have no long-run link and stock prices in different markets can diverge without constraint or without a trend. Stock market integration implies that the markets are exposed to similar risk factors and thus a common risk premium (Ahlgren and Antell (2002)). The existence of single long-run cointegration among stock market prices would imply that the unique long-run equilibrium path constrains markets. The cointegration test results are stronger, stable and more robust when there is more than one significant long-run vector (Johansen and Juselius (1990), Dickey et al (1991)). This is because for r cointegrating vectors, there are (n – r) common stochastic trends or factors underlying the dynamic linkages among the variables. The existence of multiple cointegrating vectors is consistent with the multifactor international capital asset pricing model (Bachman et al (1996)).
In some quarters it is postulated that cointegration of stock markets contradicts the efficient market hypothesis. According to this school of thought, in an efficient market, changes in asset prices cannot be predicted. In cointegration models, however, deviations of prices from a long-run relationship indicate predictable future price changes (Granger (1992), Baillie and Bollerslev (1989) and Hakkio and Rush (1989)). Diverging from this viewpoint, Dwyer and Wallace (1992), Crowder and Wohar (1998) and Masih and Masih (1997, 2002) argue that there is no general equivalence between market efficiency and lack of a long-run relationship
BIS Papers No 42 205
between assets. Dwyer and Wallace (1992) define market efficiency as the lack of arbitrage opportunities. Hassan and Naka (1996) suggest that in cointegrated markets, price movements in one market immediately influence other markets, consistent with efficient information sharing and free access to markets by domestic and foreign investors. Harvey (1995) and Korajczyk (1996) suggest that the improvement in market efficiency is consistent with increasing integration with world markets. If markets are predictable and foreign investors are sophisticated, then investors are likely to profit from the predictability of returns. As foreign investors take advantage of market inefficiencies, those market inefficiencies will decrease and prices will react more quickly to new information (Kim and Singhal (2000)). Another viewpoint is that national stock markets are different since they operate in the economic and social environments of different countries. Accordingly, a country’s financial market is efficient when prices reflect the fundamentals and risks of that country, rather than the fundamentals and risks of other countries. Several studies have, however, argued that financial integration could occur due to real economic interdependence or linkages among economic fundamentals across nations. For instance, the profit and loss account and the balance sheet of a domestic company relying on a large volume of exports and imports can be affected by the macroeconomic fundamentals of other countries.
From the perspective of portfolio diversification, economists have differing views. Integrated markets may or may not facilitate portfolio diversification. One view is that cointegrated stock markets weaken the benefits of international portfolio diversification in the long run (Chowdhry et al (2007), Kearney and Lucey (2004)). This is because the existence of common factors limits the amount of independent variation in stock prices (Chen et al (2002)). Another view is that portfolio diversification benefits would continue to accrue in the short run (Hassan and Naka (1996)), although not in the long run. Byers and Peel (1993) argue that cointegration among stock prices does not preclude the benefits of diversification, since these follow from the covariance of stock returns rather than from the covariance of prices. Similarly, Hakkio and Rush (1991) and Sephton and Larsen (1991) have questioned the reliability of using the cointegration hypothesis to test market efficiency and portfolio diversification. The extent of portfolio diversification in cointegrated markets would hinge on the size of the coefficients of the long-run cointegrating vector relating to various stock price indices (Verchenko (2000)). In our view, the cointegration vector can be consistent with the standard asset demand function, such that the price of one asset (domestic) depends on other assets (regional and global), some of which may serve as substitutes or complements to domestic assets. Therefore, portfolio diversification in the long run would depend on the size and the sign condition of the coefficients of the cointegration vector relating to various stock prices.
3. Data mining issues
Empirical finance studies have also brought to the fore various useful insights about the role of data mining for stock market integration analysis. Three important issues in this regard are the frequency of data, the currency denomination of stock prices and the sample period. Firstly, in some quarters it is felt that high-frequency daily data are preferred to weekly and monthly data in an environment of advanced information technology-enabled online trading platform and payment and settlement systems. Daily data capture speedy transmission of information, as both short- and long-run dynamic linkages matter for market integration (Voronkova (2004), Hassan and Naka (1996)). Others, however, argue that weekly stock returns are useful to avoid the problem of non-synchronous trading in some thinly traded stock markets (Cha and Oh (2000)). Several other studies use monthly and quarterly data, since economic fundamentals such as output, inflation and dividends, which are considered to be the key drivers of stock prices, are mostly available in these frequencies (Blackman et al (1994), Masih and Masih (2002)). For robustness of empirical analysis and serial
206 BIS Papers No 42
correlation, and to avoid common lag length problems in the cointegration model, it is useful to rely on a comparative analysis of daily and weekly data. Secondly, keeping in view the portfolio diversification and arbitrage activities of dominant market participants such as foreign investors, most of the studies use stock prices measured in a common reference currency, typically, the US dollar, which serves as the major invoicing currency for trade and investment activities (Bachman et al (1996), Christian and Renatas (2007), Hilliard (1979), Meric and Meric (1989), Philippatos et al (1983)). Studies using stock prices in domestic currency units argue that indices in national currencies restrict their change to movements in security prices and avoid distorting the empirical results with sharp devaluation of the exchange rates, especially during periods of crisis (Chowdhry et al (2007)). Thirdly, there is a view that in analysing the long-run integration of markets, it is appropriate to use a long sample period consisting of several years, rather than large sample observations with high-frequency daily or weekly data for a few years (Hakkio and Rush (1991)). However, over a very long horizon such as a decade, an empirical study has to contend with long-run integration being affected by structural shifts emanating from changes in the policy regime and the general economic environment.
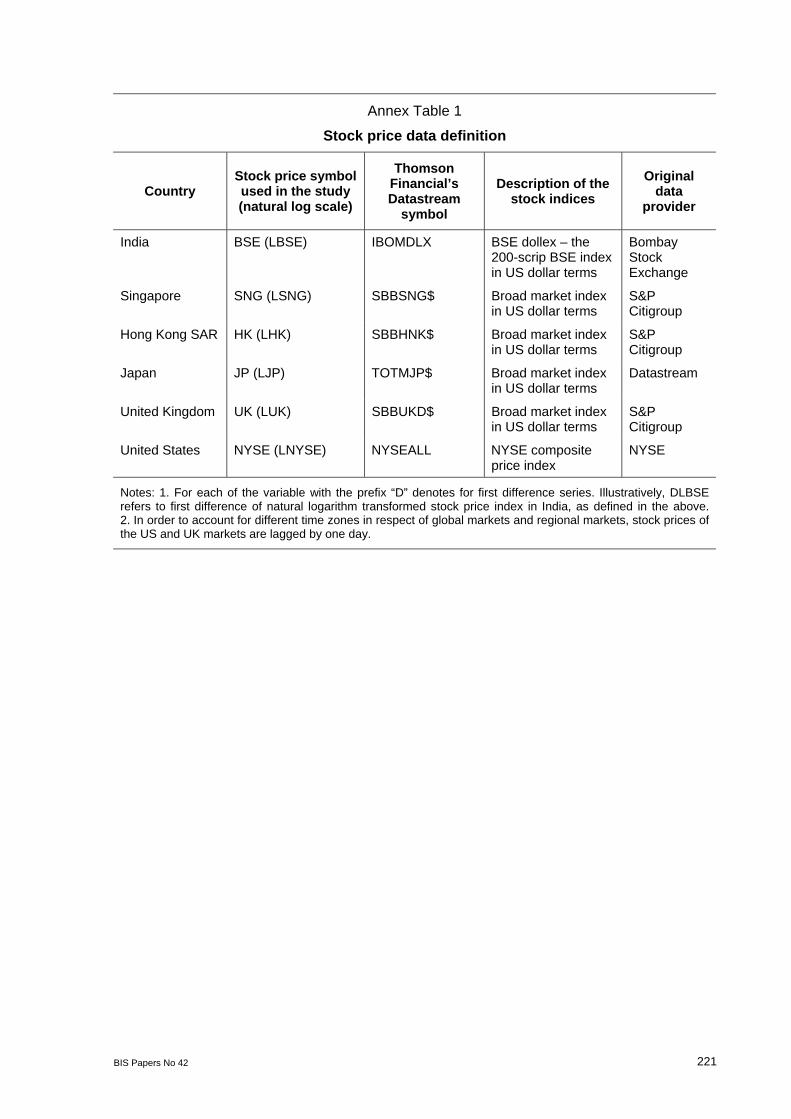
With the above issues as the backdrop, we use six stock price indices: the 200-scrip index of the BSE of India pertaining to the domestic market, two stock price indices relating to regional markets such as Singapore and Hong Kong, and three stock price indices relating to global markets in the United States, the United Kingdom and Japan, as defined in Annex Table 1. We use stock price indices measured in local currency as well as the US dollar. As regards frequency of data, we use daily as well as weekly stock prices. The sample period covers end-March 1993 to end-January 2008.5 Our choice of stock markets is guided by the consideration that India has significant trade and financial relations with these countries. Illustratively, global markets such as the United States continue to be India’s single largest trade and investment partner. India has had long-standing trade and financial relations with the United Kingdom since the era of British colonial rule. As regards regional markets, India has concluded a comprehensive economic cooperation agreement with Singapore. Hong Kong has significant trade and investment relations with India. Anecdotal evidence shows that about 1,500 Indian companies and seven Indian banks have a business presence in Hong Kong. The Hong Kong market is also the major financial centre in China and Asia, with which India has witnessed the rapid growth of trade in recent years. Recently, efforts have been initiated for free trade and double taxation avoidance agreements between India and Hong Kong.
4. Stylised facts
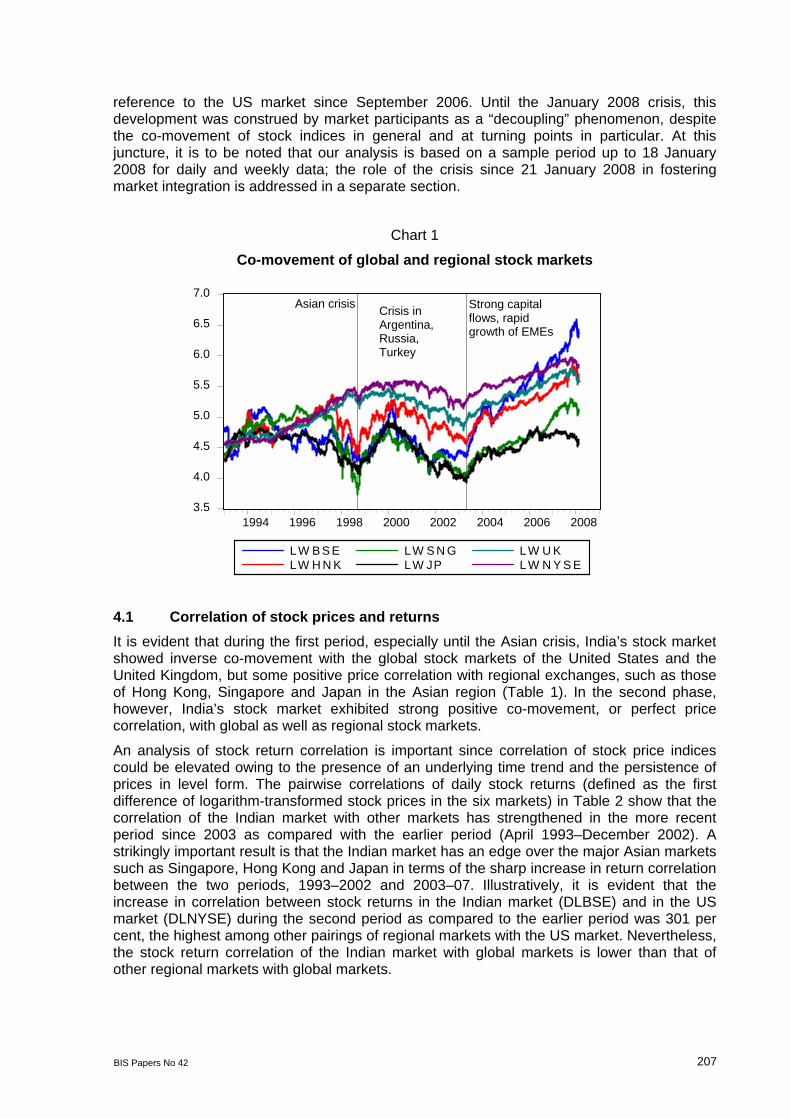
Chart 1 shows the co-movement of India’s stock market prices with those of global and regional markets.6 The financial integration process can be visualised in two phases: (i) the period from the 1990s to the first two years of the current decade, associated with various crises in emerging market economies, including the Asian crisis in 1997–98, and (ii) the post-crisis period since 2003, characterised by the revival of private foreign capital flows to emerging market economies in an environment of liberalisation, flexible exchange rates and strong economic growth. A notable point here is the crossover of the Indian market with
5 The choice of the beginning date for the sample, ie March 1993, is guided by the consideration that the
exchange rate was allowed to be market determined from this date. Thus, in terms of the first difference, the sample begins with the financial accounting year in India (April–March).
6 For the purposes of illustration, stock price indices in Chart 1 refer to price indices with a common base (1993–94).
BIS Papers No 42 207
reference to the US market since September 2006. Until the January 2008 crisis, this development was construed by market participants as a “decoupling” phenomenon, despite the co-movement of stock indices in general and at turning points in particular. At this juncture, it is to be noted that our analysis is based on a sample period up to 18 January 2008 for daily and weekly data; the role of the crisis since 21 January 2008 in fostering market integration is addressed in a separate section.
Chart 1
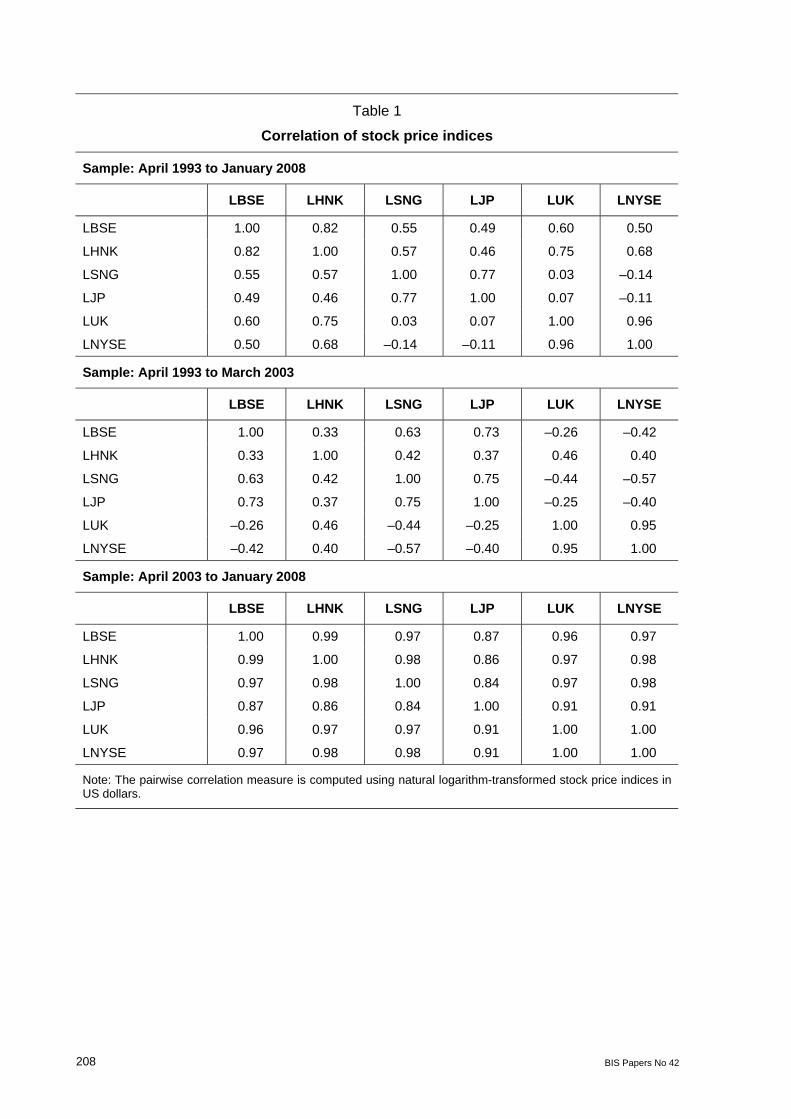
Co-movement of global and regional stock markets 4.1 Correlation of stock prices and returns It is evident that during the first period, especially until the Asian crisis, India’s stock market showed inverse co-movement with the global stock markets of the United States and the United Kingdom, but some positive price correlation with regional exchanges, such as those of Hong Kong, Singapore and Japan in the Asian region (Table 1). In the second phase, however, India’s stock market exhibited strong positive co-movement, or perfect price correlation, with global as well as regional stock markets.
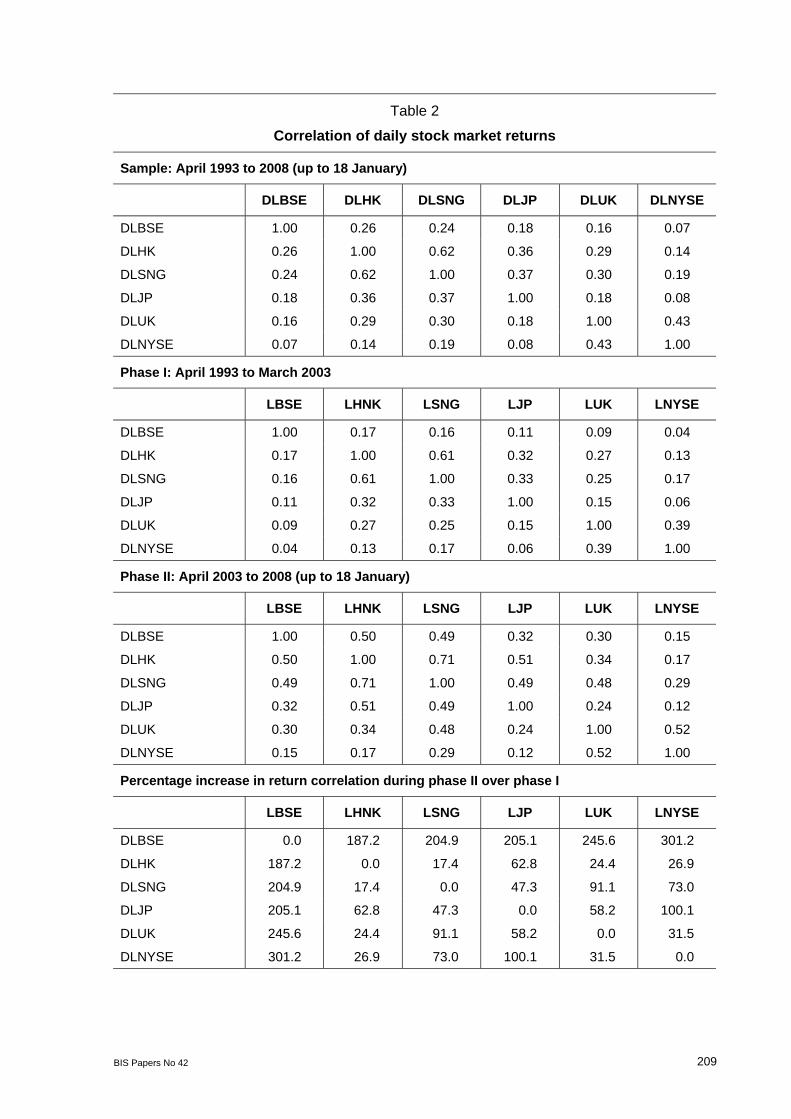
An analysis of stock return correlation is important since correlation of stock price indices could be elevated owing to the presence of an underlying time trend and the persistence of prices in level form. The pairwise correlations of daily stock returns (defined as the first difference of logarithm-transformed stock prices in the six markets) in Table 2 show that the correlation of the Indian market with other markets has strengthened in the more recent period since 2003 as compared with the earlier period (April 1993–December 2002). A strikingly important result is that the Indian market has an edge over the major Asian markets such as Singapore, Hong Kong and Japan in terms of the sharp increase in return correlation between the two periods, 1993–2002 and 2003–07. Illustratively, it is evident that the increase in correlation between stock returns in the Indian market (DLBSE) and in the US market (DLNYSE) during the second period as compared to the earlier period was 301 per cent, the highest among other pairings of regional markets with the US market. Nevertheless, the stock return correlation of the Indian market with global markets is lower than that of other regional markets with global markets.
3.5
4.0
4.5
5.0
5.5
6.0
6.5
7.0
1994 1996 1998 2000 2002 2004 2006 2008
L W B S EL W H N K
LW S N GLW JP
LW U K LW N Y S E
C risis inA rgentina,R ussia,T urk ey
St r o ng c api talf l o w s, r api dg r o w th o f EMEs
Asian crisis Crisis in Argentina,Russia, Turkey
Strong capital flows, rapid growth of EMEs
208 BIS Papers No 42
Table 1
Correlation of stock price indices
Sample: April 1993 to January 2008
LBSE LHNK LSNG LJP LUK LNYSE
LBSE 1.00 0.82 0.55 0.49 0.60 0.50
LHNK 0.82 1.00 0.57 0.46 0.75 0.68
LSNG 0.55 0.57 1.00 0.77 0.03 –0.14
LJP 0.49 0.46 0.77 1.00 0.07 –0.11
LUK 0.60 0.75 0.03 0.07 1.00 0.96
LNYSE 0.50 0.68 –0.14 –0.11 0.96 1.00
Sample: April 1993 to March 2003
LBSE LHNK LSNG LJP LUK LNYSE
LBSE 1.00 0.33 0.63 0.73 –0.26 –0.42
LHNK 0.33 1.00 0.42 0.37 0.46 0.40
LSNG 0.63 0.42 1.00 0.75 –0.44 –0.57
LJP 0.73 0.37 0.75 1.00 –0.25 –0.40
LUK –0.26 0.46 –0.44 –0.25 1.00 0.95
LNYSE –0.42 0.40 –0.57 –0.40 0.95 1.00
Sample: April 2003 to January 2008
LBSE LHNK LSNG LJP LUK LNYSE
LBSE 1.00 0.99 0.97 0.87 0.96 0.97
LHNK 0.99 1.00 0.98 0.86 0.97 0.98
LSNG 0.97 0.98 1.00 0.84 0.97 0.98
LJP 0.87 0.86 0.84 1.00 0.91 0.91
LUK 0.96 0.97 0.97 0.91 1.00 1.00
LNYSE 0.97 0.98 0.98 0.91 1.00 1.00
Note: The pairwise correlation measure is computed using natural logarithm-transformed stock price indices in US dollars.
BIS Papers No 42 209
Table 2
Correlation of daily stock market returns
Sample: April 1993 to 2008 (up to 18 January)
DLBSE DLHK DLSNG DLJP DLUK DLNYSE
DLBSE 1.00 0.26 0.24 0.18 0.16 0.07
DLHK 0.26 1.00 0.62 0.36 0.29 0.14
DLSNG 0.24 0.62 1.00 0.37 0.30 0.19
DLJP 0.18 0.36 0.37 1.00 0.18 0.08
DLUK 0.16 0.29 0.30 0.18 1.00 0.43
DLNYSE 0.07 0.14 0.19 0.08 0.43 1.00
Phase I: April 1993 to March 2003
LBSE LHNK LSNG LJP LUK LNYSE
DLBSE 1.00 0.17 0.16 0.11 0.09 0.04
DLHK 0.17 1.00 0.61 0.32 0.27 0.13
DLSNG 0.16 0.61 1.00 0.33 0.25 0.17
DLJP 0.11 0.32 0.33 1.00 0.15 0.06
DLUK 0.09 0.27 0.25 0.15 1.00 0.39
DLNYSE 0.04 0.13 0.17 0.06 0.39 1.00
Phase II: April 2003 to 2008 (up to 18 January)
LBSE LHNK LSNG LJP LUK LNYSE
DLBSE 1.00 0.50 0.49 0.32 0.30 0.15
DLHK 0.50 1.00 0.71 0.51 0.34 0.17
DLSNG 0.49 0.71 1.00 0.49 0.48 0.29
DLJP 0.32 0.51 0.49 1.00 0.24 0.12
DLUK 0.30 0.34 0.48 0.24 1.00 0.52
DLNYSE 0.15 0.17 0.29 0.12 0.52 1.00
Percentage increase in return correlation during phase II over phase I
LBSE LHNK LSNG LJP LUK LNYSE
DLBSE 0.0 187.2 204.9 205.1 245.6 301.2
DLHK 187.2 0.0 17.4 62.8 24.4 26.9
DLSNG 204.9 17.4 0.0 47.3 91.1 73.0
DLJP 205.1 62.8 47.3 0.0 58.2 100.1
DLUK 245.6 24.4 91.1 58.2 0.0 31.5
DLNYSE 301.2 26.9 73.0 100.1 31.5 0.0
210 BIS Papers No 42
Table 3
Statistical moments of stock returns
Full sample: April 1993 to January 2008
Statistics BSE HK SNG JP UK NYSE
Mean 16.0 10.7 7.5 3.0 8.2 9.2
Std. Dev. 420.0 400.9 388.2 361.4 263.7 242.4
Skewness –0.3 0.2 0.6 0.2 –0.1 –0.2
Kurtosis 7.7 13.8 17.6 6.5 5.8 7.0
Jarque-Bera 3,674.2 18,992.1 35,176.2 2,013.5 1,312.0 2,655.0
Phase I (April 1993 to March 2003)
Mean 3.3 5.1 –0.4 –2.7 4.3 7.1
Std. Dev. 408.3 443.4 432.5 375.0 265.0 253.6
Skewness 0.0 0.2 0.8 0.4 –0.1 –0.2
Kurtosis 6.1 13.1 16.7 6.8 5.4 7.3
Jarque-Bera 1,029.9 11,066.0 20,665.9 1,629.1 619.9 2,065.4
Phase II (April 2003 to January 2008)
LBSE LHNK LSNG LJP LUK LNYSE
Mean 41.3 21.9 23.1 14.5 16.0 13.5
Std. Dev. 441.6 298.2 278.9 332.3 261.0 218.2
Skewness –0.8 –0.2 –0.4 –0.4 –0.2 –0.3
Kurtosis 10.2 7.5 6.2 5.3 6.8 5.2
Jarque-Bera 2,990.7 1,094.0 593.3 326.9 787.6 287.7
Risk-adjusted return (mean/standard deviation, in per cent)
Full sample 3.8 2.7 1.9 0.8 3.1 3.8
Phase I 0.8 1.2 –0.1 –0.7 1.6 2.8
Phase II 9.4 7.3 8.3 4.4 6.1 6.2
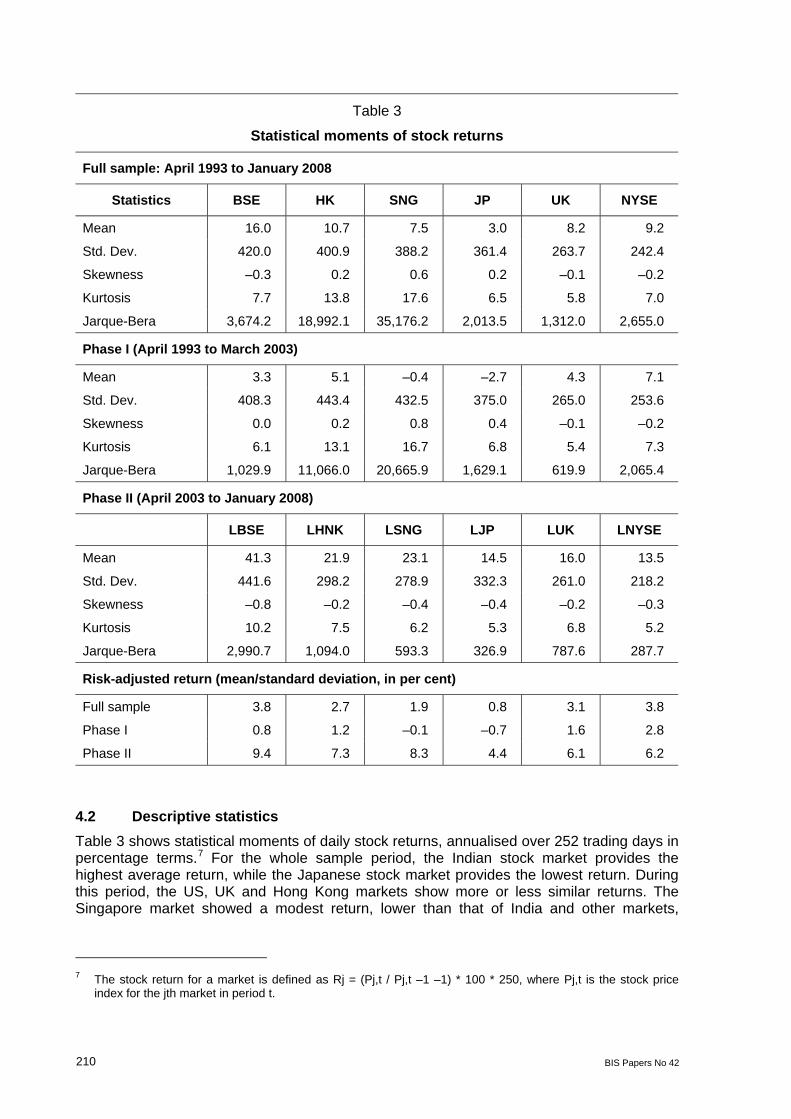
4.2 Descriptive statistics Table 3 shows statistical moments of daily stock returns, annualised over 252 trading days in percentage terms.7 For the whole sample period, the Indian stock market provides the highest average return, while the Japanese stock market provides the lowest return. During this period, the US, UK and Hong Kong markets show more or less similar returns. The Singapore market showed a modest return, lower than that of India and other markets,
7 The stock return for a market is defined as Rj = (Pj,t / Pj,t –1 –1) * 100 * 250, where Pj,t is the stock price
index for the jth market in period t.
BIS Papers No 42 211
excluding the Japanese market. For the period April 1993–March 2003, the average stock return was marginally positive in India and Hong Kong, and insignificant and negative in Singapore and Japan, respectively, while global markets in the United States and the United Kingdom showed a modest positive return, higher than those in India and Hong Kong. In the post-Asian crisis phase, the Indian market outperforms all other markets, and regional markets in general outperform global markets. Also, in terms of risk-adjusted return (average stock return adjusted to standard deviation), the Indian stock market provides the highest return during the post-Asian crisis period.
Skewness and kurtosis measures provide insights about the underlying statistical distribution of stock returns. It is evident that skewness is negative and kurtosis is positive for all six markets during the period April 2003–January 2008. However, both the skewness and the kurtosis measures pertaining to the Indian stock market are significantly different from those of other regional and global markets. On the other hand, regional markets in Singapore and Hong Kong and global markets including the United States, the United Kingdom and Japan exhibit more or less a similar pattern of statistical distribution. The Jarque-Bera statistic, defined over skewness and kurtosis measures, is very high for all six stock markets, implying that stock returns differ significantly from the normal distribution. Alternatively, this implies that in each stock market there exist opportunities for investors to benefit from abnormal returns.
5. Empirical cointegration analysis
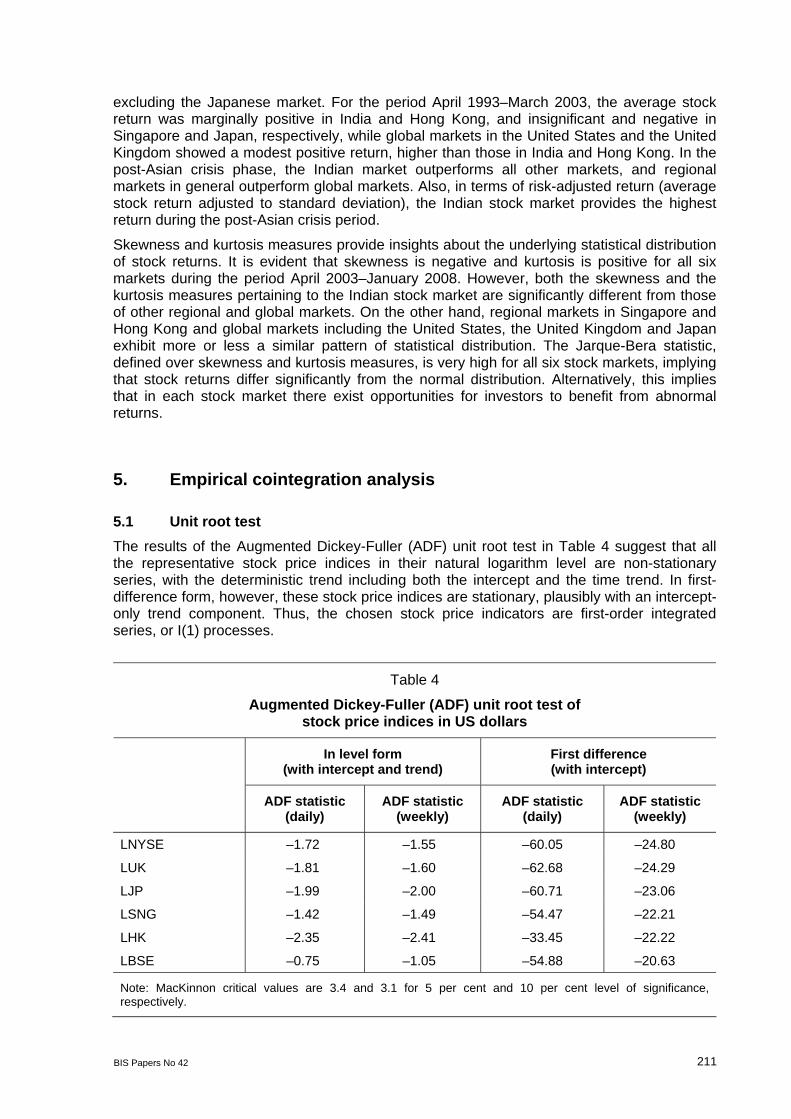
5.1 Unit root test The results of the Augmented Dickey-Fuller (ADF) unit root test in Table 4 suggest that all the representative stock price indices in their natural logarithm level are non-stationary series, with the deterministic trend including both the intercept and the time trend. In first-difference form, however, these stock price indices are stationary, plausibly with an intercept- only trend component. Thus, the chosen stock price indicators are first-order integrated series, or I(1) processes.
Table 4
Augmented Dickey-Fuller (ADF) unit root test of stock price indices in US dollars
In level form (with intercept and trend)
First difference (with intercept)
ADF statistic
(daily) ADF statistic
(weekly) ADF statistic
(daily) ADF statistic
(weekly)
LNYSE –1.72 –1.55 –60.05 –24.80
LUK –1.81 –1.60 –62.68 –24.29
LJP –1.99 –2.00 –60.71 –23.06
LSNG –1.42 –1.49 –54.47 –22.21
LHK –2.35 –2.41 –33.45 –22.22
LBSE –0.75 –1.05 –54.88 –20.63
Note: MacKinnon critical values are 3.4 and 3.1 for 5 per cent and 10 per cent level of significance, respectively.
212 BIS Papers No 42
5.2 Lag length of VECM The estimation of the Johansen and Juselius (1991) VECM requires the specification of a common lag length. In practice, the unrestricted VAR model is estimated first, and the lag length is ascertained from Swartz-Bayes information criteria (SBC), Hannan and Quinn criteria (HQC), the final prediction error criteria (FPE), the Akaike information criteria (AIC) and the sequential modified likelihood ratio test (LR). In this regard, the SBC and HQC showed a lower-order lag length of two days for the VAR model involving daily stock price data. On the other hand, the FPE and AIC determine a somewhat higher six- to eight-day lag length. Interestingly, for weekly data as well, the FPE and AIC suggested a three- to four-week lag length, while the SBC and HQC suggested a two-week lag length in line with the six- to eight-day lag length determined by the AIC and FPE for daily data. For high-frequency time series, empirical studies generally prefer lower-order lags, bearing in mind the informational efficiency of stock markets (Schollhamer and Sand (1987), Eun and Shim (1989), Hassan and Naka (1996)). Thus, our subsequent empirical analyses are based on lower-order lag lengths of two days and two weeks for daily and weekly stock prices, respectively.
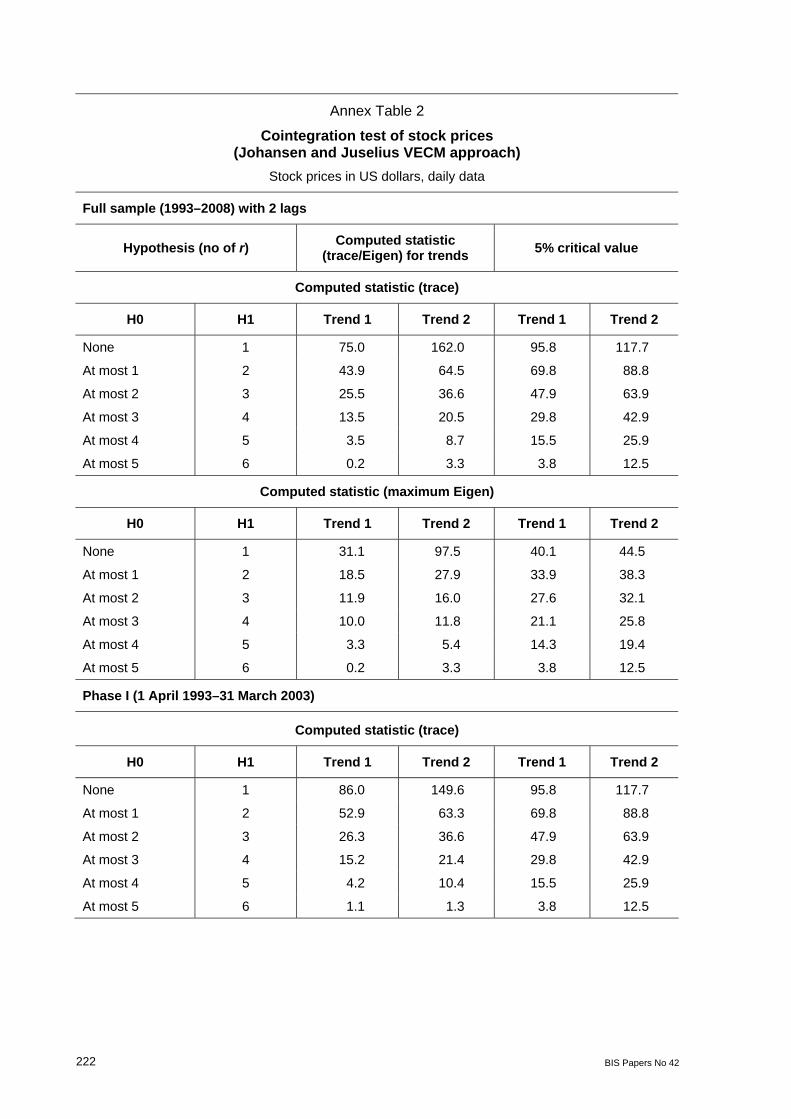
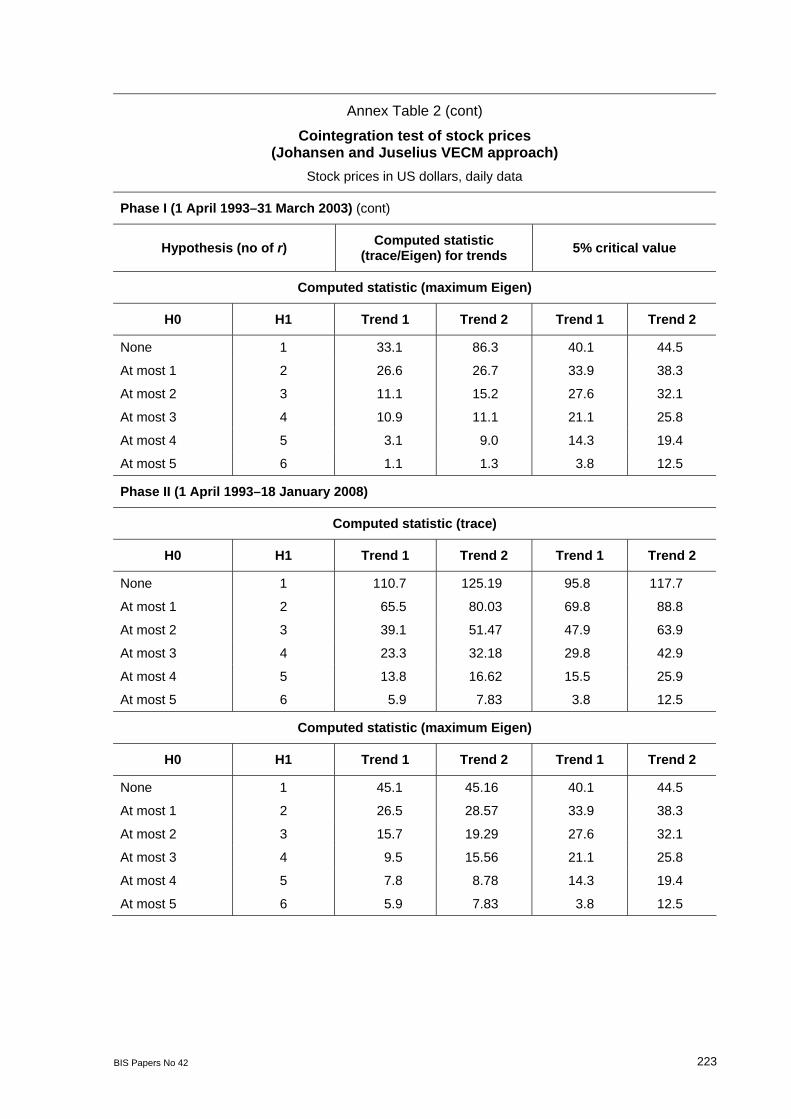
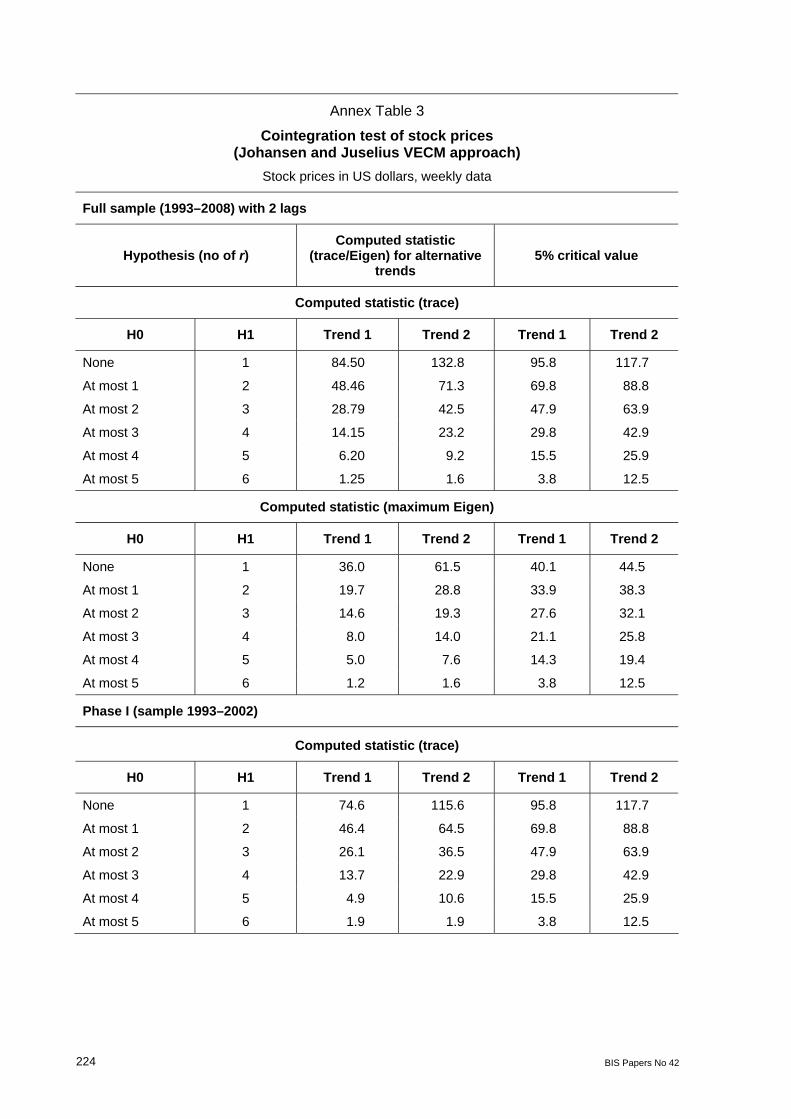
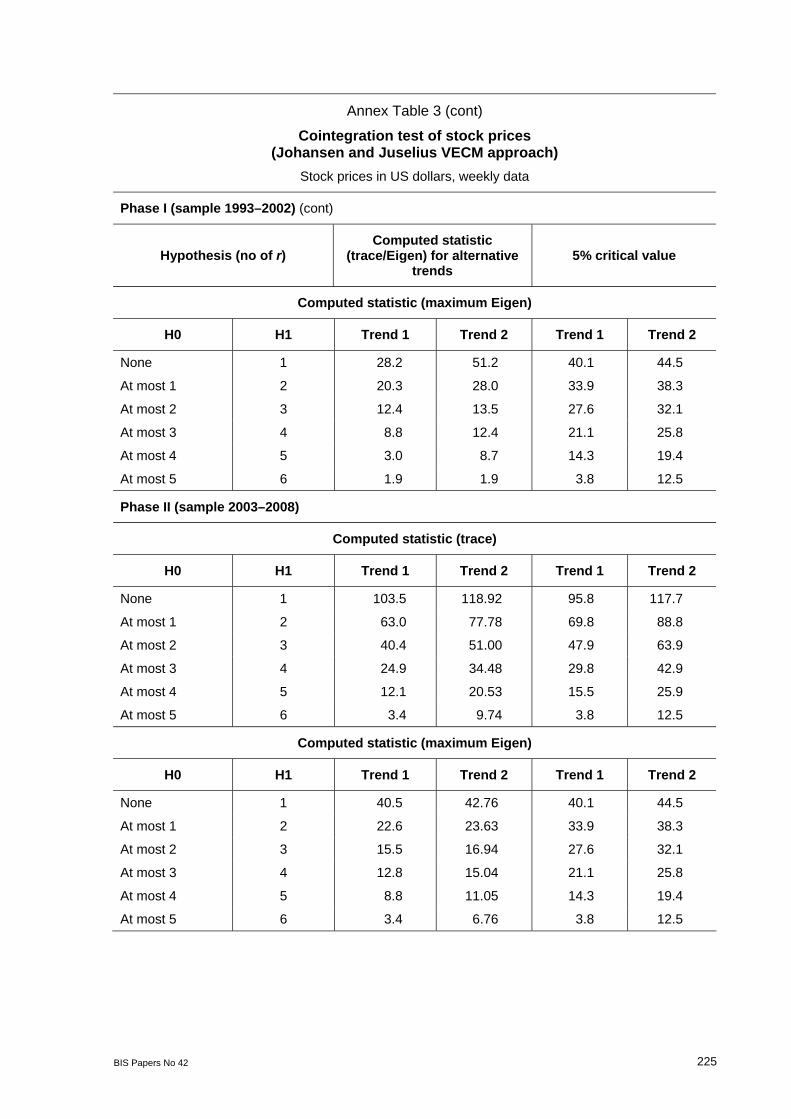
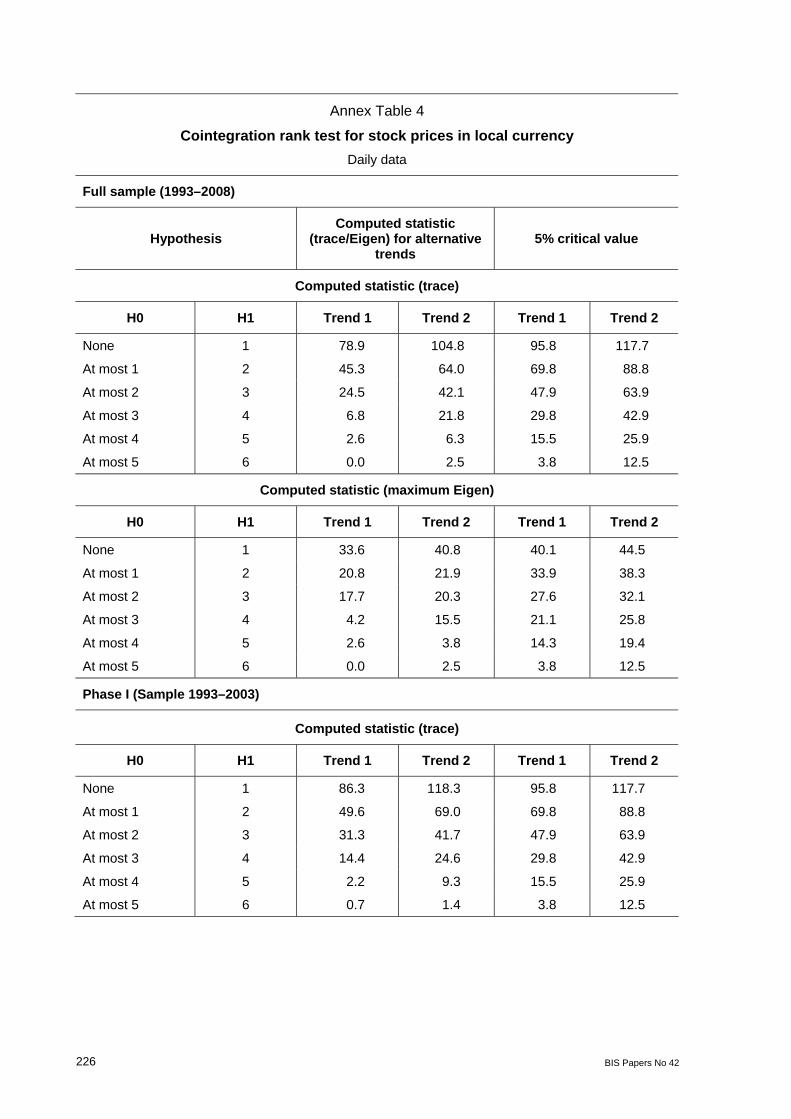
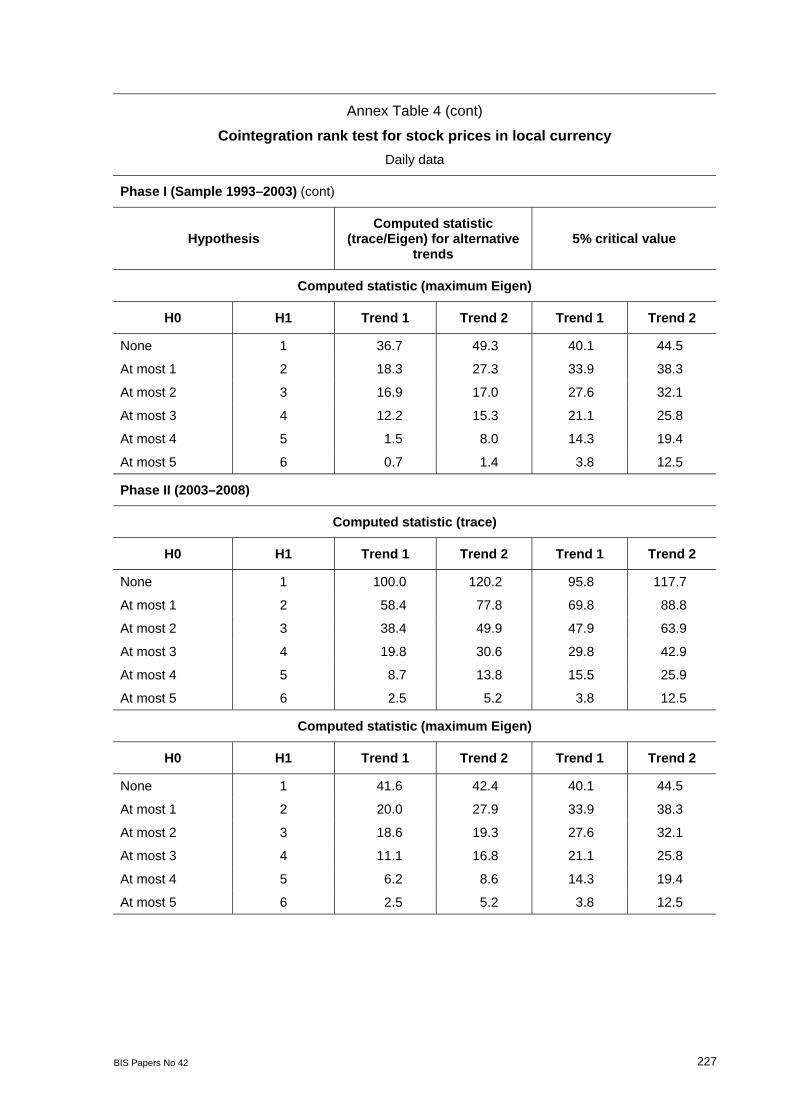
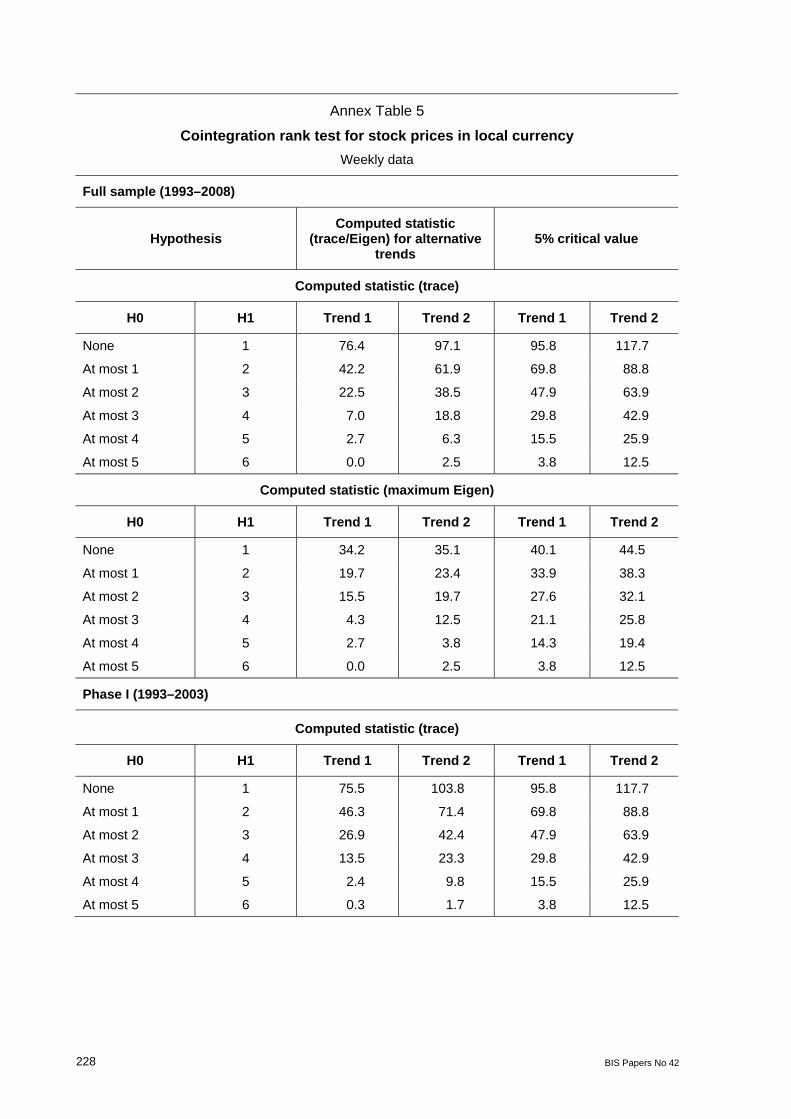
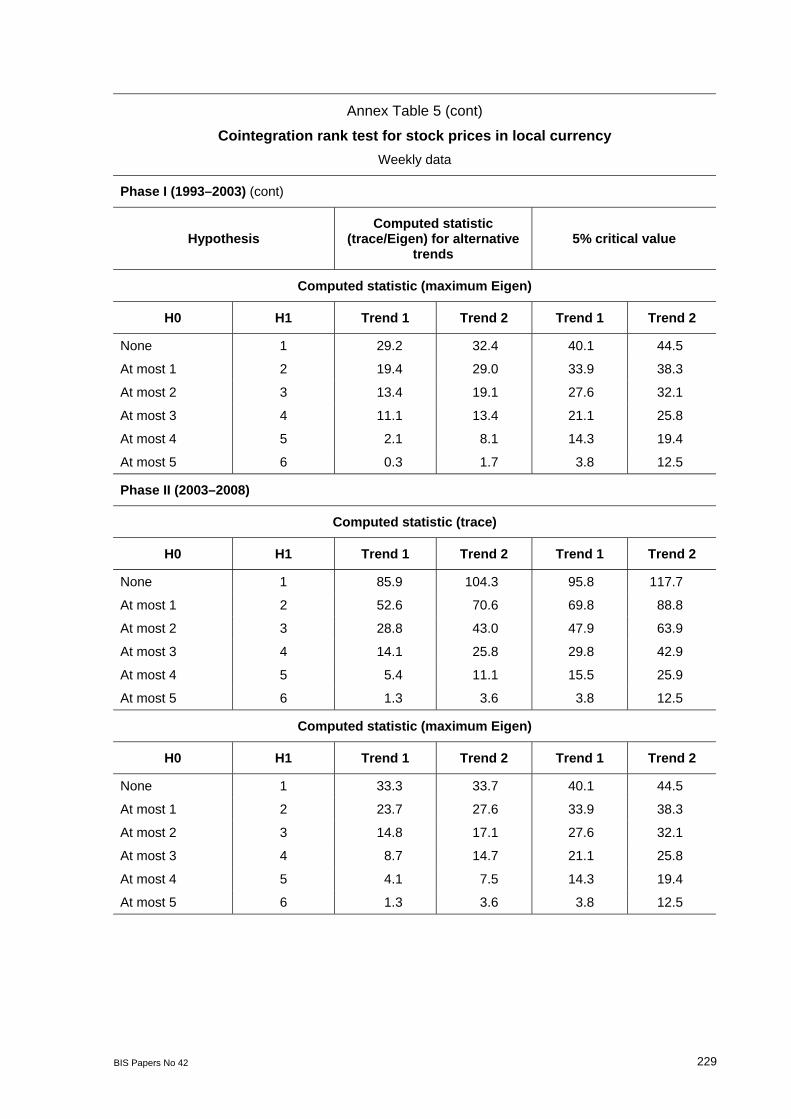
5.3 Cointegration rank test Empirical results of the cointegration rank test derived from Johansen’s multivariate VECM involving the six stock prices chosen in the study are summarised in Annex Tables 2–5. The tests were conducted for natural logarithm-transformed stock price indices measured in both US dollars and local currency over sample periods pertaining to the long sample (31 March 1993 to 18 January 2008 and two phases from 1 April 1993 to 31 March 2003) and the more recent period from April 2003 to 18 January 2008, using daily and weekly data and allowing two alternative types of linear deterministic trends, referring to the intercept only (Trend 1) and to the intercept as well as the time trend (Trend 2) stock index component. There are two broad findings on the evidence of stock market integration. First, the cointegration test is sensitive to the underlying trend assumption. For stock price indices measured in US dollars for the long sample 1993–2008 and two alternative phases of the sample involving daily and weekly data, both the trace and the maximum Eigen value tests of Johansen’s VECM support the evidence of a single cointegration relation with the linear trend component that includes the intercept as well as the time trend in stock market indices. Second, the currency denomination of stock prices plays an important role. Cointegration among stock markets could be supported for stock prices in US dollars for both weekly and daily data. However, for stock price indices measured in local currency, the evidence of cointegration among stock prices is not robust. Daily data could not support cointegration among stock prices in local currency for the whole sample, but could for two subsamples. On the other hand, weekly data on stock prices in local currency do not support cointegration of stock markets.
The existence of a single cointegration relation among stock price indices in US dollars gives rise to a concern that any particular stock price indicator pertaining to a global or a regional market could be critical for the integration of stock markets. Accordingly, in the first instance, we investigated the cointegration relation among five stock price indices, excluding the US stock index. Both the trace and the Eigen value tests for the VECM involving daily and weekly data on stock prices in US dollars ruled out any cointegration among five stock indices. Similarly, the exclusion of the UK index did not support cointegration among the remaining five stock indices, including the US index. However, exclusion of the Japanese, Singapore and Hong Kong indices one by one did not eliminate the evidence of a single cointegration relation. At the same time, excluding these three markets together did not eliminate the cointegration relation, implying that the cointegration space could be attributable to India’s integration with two global markets, including the United States and the United Kingdom. This finding was reinforced inasmuch as five stock markets excluding the Indian market, ie, two Asian regional markets (Singapore and Hong Kong) and three global markets (the United States, the United Kingdom and Japan) were not cointegrated.
BIS Papers No 42 213
Notwithstanding these results, it was found that regional markets could not be redundant in the long-run cointegration relation, as shown subsequently in terms of the coefficients and associated asymptotic t statistic. Furthermore, the likelihood ratio (LR) for the null hypothesis of zero restriction on the coefficients of regional markets taken individually or in pairs yielded a statistically significant chi-square statistic, thus revealing the critical importance of these markets.
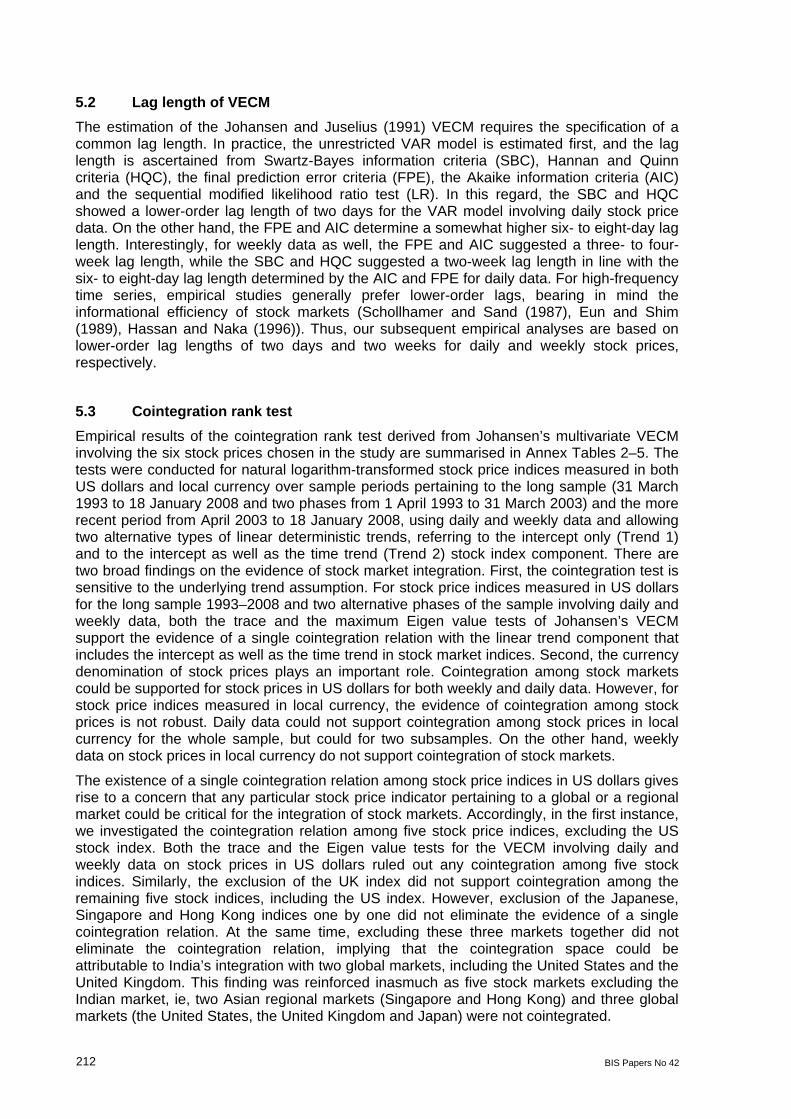
5.4 Cointegration over the sample period (1993–2008) After ascertaining that at best a single cointegration relation among the US dollar- denominated stock prices is supported, it is of interest to derive some useful perspectives from the sign condition and size of the coefficients in the long-run cointegration relation pertaining to stock price indices. Since our interest is in the Indian market vis-à-vis global and regional markets, we present the cointegrating vector normalised to India’s stock price (Table 5) using daily and weekly data for the full sample (1993–2008) and for two subperiods, phase I (1993–2002) and the post-Asian crisis phase (2003–08).
Table 5
Cointegration relation of stock prices in US dollars
Daily data Weekly data Stock prices
Full Phase I Phase II Full Phase I Phase II
LWBSE (normalised) 1.00 1.00 1.00 1.00 1.00 1.00
LWHNK –0.97 –0.76 –0.96 –1.13 –0.82 –1.38 (–5.65) (–4.99) (–2.43) (–5.88) (–4.63) (–3.07)
LWSNG 0.42 0.35 1.02 0.43 0.38 1.55 (3.42) (3.14) (2.48) (3.13) (2.96) (3.37)
LWJP –0.53 –0.62 0.62 –0.46 –0.65 1.26 (–5.05) (–6.34) (2.24) (–3.90) (–5.74) (3.94)
LWUK –4.04 –3.83 5.79 –3.65 –3.53 5.95 (–15.53) (–11.36) (5.91) (–11.89) (–9.19) (5.07)
LWNYSE 4.88 4.51 –10.77 4.47 4.26 –12.20 (17.36) (12.17) (–6.72) (12.58) (10.05) (–6.39)
Trend –0.76 –0.70 0.03 –3.29 –3.38 1.21 (–22.19) (–9.62) (0.11) (–10.04) (–8.25) (0.84)
Intercept –3.29 –2.75 21.41 –2.83 –2.70 24.78
Note: Figures in brackets indicate asymptotic t statistic.
5.4.1 Cointegration in phase I (April 1993–March 2003) First, the coefficients of regional and global stock price indicators in the cointegration relation do not have similar signs; some are positive while others are negative, a finding attributable to the differential risks associated with global and regional markets relative to the Indian market. This implies that the six stock markets chosen could meet investors’ long-run portfolio diversification objective. Second, in absolute terms, the coefficients of global markets (the United States and the United Kingdom) are substantially higher than those of regional markets such as Singapore and Hong Kong. Illustratively, for daily stock prices in US dollars, a percentage point change in the US stock index could be associated with a
214 BIS Papers No 42
4.5 per cent change in the Indian market during the period 1993–2002. However, during the same period, a percentage point change in a regional index, such as the Singapore and Hong Kong stock indices, could affect the Indian market by 0.4 per cent and 0.8 per cent, respectively. A similar finding also holds for weekly stock price data. Third, among Asian stock markets, Singapore has a negative coefficient, but Hong Kong and Japan have positive coefficients. This implies that Singapore stocks could serve as a competitor to Indian stocks and that the two markets would not be coterminous; a rise (fall) in one market could induce a fall (rise) in the other market. This finding derives from the view that Singapore is a more liberal and open economy than India. However, a crucial factor with regard to Singapore is that it has the most favourable taxation regime in terms of promoting external trade and investment. On the other hand, the Indian market could be coterminous with the Hong Kong and Japanese markets. Such a relationship among India, Hong Kong and Japan could be attributable to common risks and asset substitution on the part of investors between these markets. Fourth, as regards global markets, the United States has a negative impact while the United Kingdom has a positive impact on the Indian market, attributable to various factors. One, a naïve perspective is that the United States is the most advanced economy and a dominant trade and investment partner for most of the countries in the world. Its stock market could be characterised by international investors as having less risky assets. If the US stock market rises amid better macroeconomic fundamentals, then investors would prefer US stocks to Indian stocks. Consequently, there would be disinvestment by FIIs in India, and the stock market would witness a declining trend. However, we shall demonstrate subsequently that in a rapidly changing global environment, such perception of a country’s riskiness could be contextual, varying with time or shifts in the global economic and financial environment, especially when emerging market assets show significant improvement in terms of underlying risks due to strong growth prospects. Two, the positive association of the Indian market with the London market may be plausible because the latter is considered as a benchmark by most international investors. A rise or fall in the benchmark asset return would necessitate a similar adjustment in the return on alternative stock assets of other countries. The relative strength of the UK currency vis-à-vis other currencies, especially the US dollar, could be another factor. Moreover, resident and non-resident Indians have significant business interests in the UK economy. India also constitutes a major source of foreign investment for the British economy. Three, the US and UK markets could provide competing asset portfolio choices for investors and, in the presence of two globally competitive assets, the domestic market is likely to be differentially linked with global markets.
5.4.2 Cointegration in phase II (April 2003–March 2008) The empirical analysis for the recent period suggests various significant aspects of financial integration in the long and short run. First, the most crucial finding during the post-Asian crisis period 2003–08 pertains to changes in the cointegration relation as compared with the earlier sample from the period 1993–2002 (Table 5). Notably, a significant difference is seen in respect of global markets, including the United States, the United Kingdom and Japan. Illustratively, the cointegration relation based on daily stock prices in US dollars showed that a percentage point increase in the US stock price could in the long run induce a sharp decline in India’s stock price during 1993–2002. However, during the post-Asian crisis phase (2003–08), the US market could have a strong positive effect on the Indian market, albeit stronger in absolute terms during 2003–08 than in the earlier period 1993–2002. The role of the UK market is opposite to that of the US market. Alternatively, there is a shift in the role of the UK stock market, possibly from a benchmark to a portfolio diversifier asset. Also, for the Japanese market, the coefficient was negative for the recent period as against a positive coefficient in the earlier period. Similar results were found for the cointegration relation based on weekly stock prices in US dollars. Second, regional markets such as Singapore and Hong Kong showed some stability in terms of sign condition of the coefficients in the cointegration relation between the two subsample periods. At the same time, regional markets do not have a similar impact on the Indian market; an increase in the Hong Kong
BIS Papers No 42 215
market could be associated with a rise, while an increase in the Singapore market could be associated with a fall in the Indian market. Third, in absolute terms, there is an indication of a strengthening of the long-run integration of the Indian market with regional markets such as Hong Kong and Singapore. Illustratively, a percentage point increase in the Hong Kong market could be associated with a 0.76 per cent and a 1.25 per cent change in the Indian market during 1993–2002 and 2003–07, respectively, implying a strengthening of India’s integration with Hong Kong by 67 per cent between the two periods.
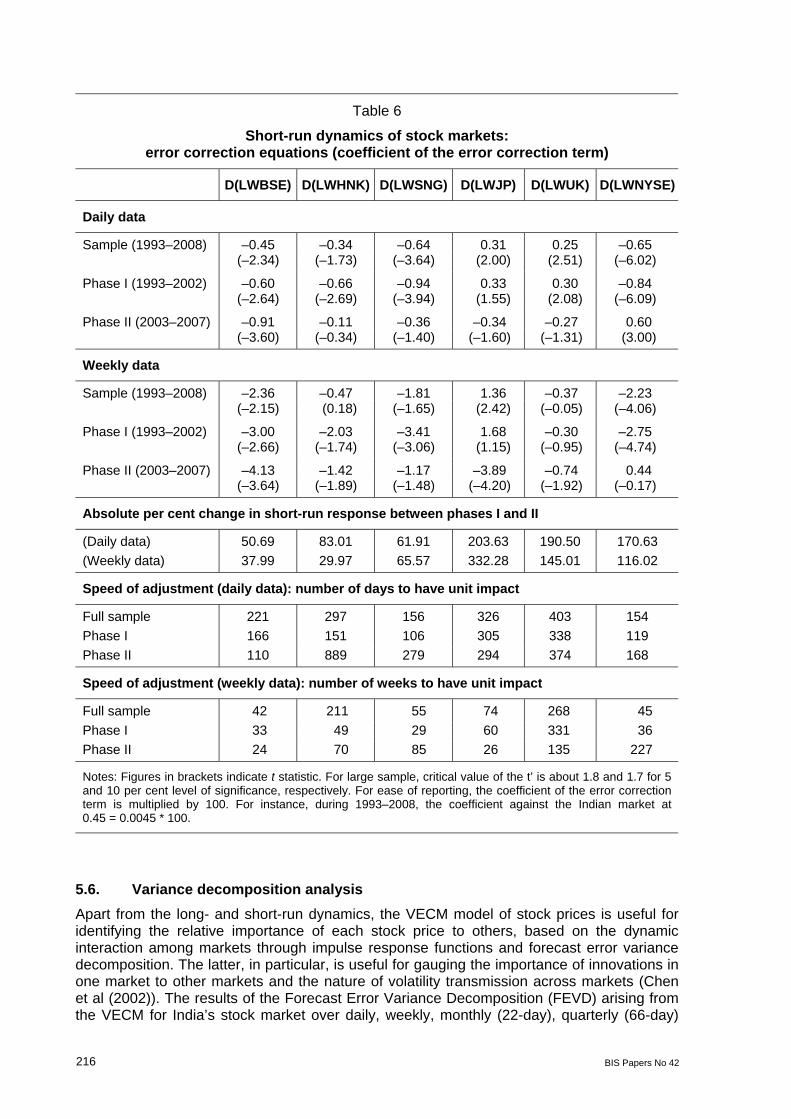
5.5 Short-run market linkage The nature of short-run integration of stock markets is evident from the coefficient of the error correction term in the VECM error correction equations pertaining to the six stock price indices (Table 6). First, for daily stock prices, it is clear that the Hong Kong, Singapore and US stock markets have an inverse response, whereas the Japanese and UK stock markets have a positive response to the short-term increase in the Indian stock market during 1993–2002. Second, the coefficient of the error correction term provides another important insight about the speed of adjustment of stock markets to the underlying long-run equilibrium path during the same period. Given an unanticipated positive shock, which would cause the Indian market to deviate from the long-run path, about half a year would be required by the Indian market to revert to its potential long-run trend path during 1993–2002. As regards the response of other markets to short-term changes in the Indian market, the Singapore and US markets would adjust at a relatively faster rate than the Hong Kong, Japanese and UK markets. Third, weekly stock price data show a much higher adjustment response than daily data for all markets, excluding the United Kingdom.
In phase II, the speed of adjustment of the Indian and US markets to a short-term deviation from the long-run path increased significantly as compared with the earlier period, which includes the developments in the 1990s (Table 6). The absolute response of the Indian market has increased from 0.6 during 1993–2002 to 0.9 during 2003–08; thus, the number of days required for unit response or complete adjustment to the long-run path has declined from 166 days to 110 days during the same period. There is also a shift in the nature of short-run adjustment of other markets, ie from downward adjustment to upward adjustment in the case of the US market and vice versa for the United Kingdom and Japan, reflecting the importance of a shift in the economic and financial environment for the long- and short-run nature of the financial integration process. The short-run adjustment of regional markets in the more recent period is not statistically significant, in contrast to the significant effect of the cointegration relation, implying that India’s integration with regional markets is of a long-run rather than a short-run nature in the more recent period. There are also some differences in the short-run response of global markets measured in weekly data as compared with daily data. Illustratively, the response of the US market is significant for the daily rather than the weekly sample. For the more recent period, Asian markets such as Hong Kong and Japan have become sensitive to developments in the Indian market.
216 BIS Papers No 42
Table 6
Short-run dynamics of stock markets: error correction equations (coefficient of the error correction term)
D(LWBSE) D(LWHNK) D(LWSNG) D(LWJP) D(LWUK) D(LWNYSE)
Daily data
Sample (1993–2008) –0.45 –0.34 –0.64 0.31 0.25 –0.65 (–2.34) (–1.73) (–3.64) (2.00) (2.51) (–6.02)
Phase I (1993–2002) –0.60 –0.66 –0.94 0.33 0.30 –0.84 (–2.64) (–2.69) (–3.94) (1.55) (2.08) (–6.09)
Phase II (2003–2007) –0.91 –0.11 –0.36 –0.34 –0.27 0.60 (–3.60) (–0.34) (–1.40) (–1.60) (–1.31) (3.00)
Weekly data
Sample (1993–2008) –2.36 –0.47 –1.81 1.36 –0.37 –2.23 (–2.15) (0.18) (–1.65) (2.42) (–0.05) (–4.06)
Phase I (1993–2002) –3.00 –2.03 –3.41 1.68 –0.30 –2.75 (–2.66) (–1.74) (–3.06) (1.15) (–0.95) (–4.74)
Phase II (2003–2007) –4.13 –1.42 –1.17 –3.89 –0.74 0.44 (–3.64) (–1.89) (–1.48) (–4.20) (–1.92) (–0.17)
Absolute per cent change in short-run response between phases I and II
(Daily data) 50.69 83.01 61.91 203.63 190.50 170.63 (Weekly data) 37.99 29.97 65.57 332.28 145.01 116.02
Speed of adjustment (daily data): number of days to have unit impact
Full sample 221 297 156 326 403 154 Phase I 166 151 106 305 338 119 Phase II 110 889 279 294 374 168
Speed of adjustment (weekly data): number of weeks to have unit impact
Full sample 42 211 55 74 268 45 Phase I 33 49 29 60 331 36 Phase II 24 70 85 26 135 227
Notes: Figures in brackets indicate t statistic. For large sample, critical value of the t’ is about 1.8 and 1.7 for 5 and 10 per cent level of significance, respectively. For ease of reporting, the coefficient of the error correction term is multiplied by 100. For instance, during 1993–2008, the coefficient against the Indian market at 0.45 = 0.0045 * 100.
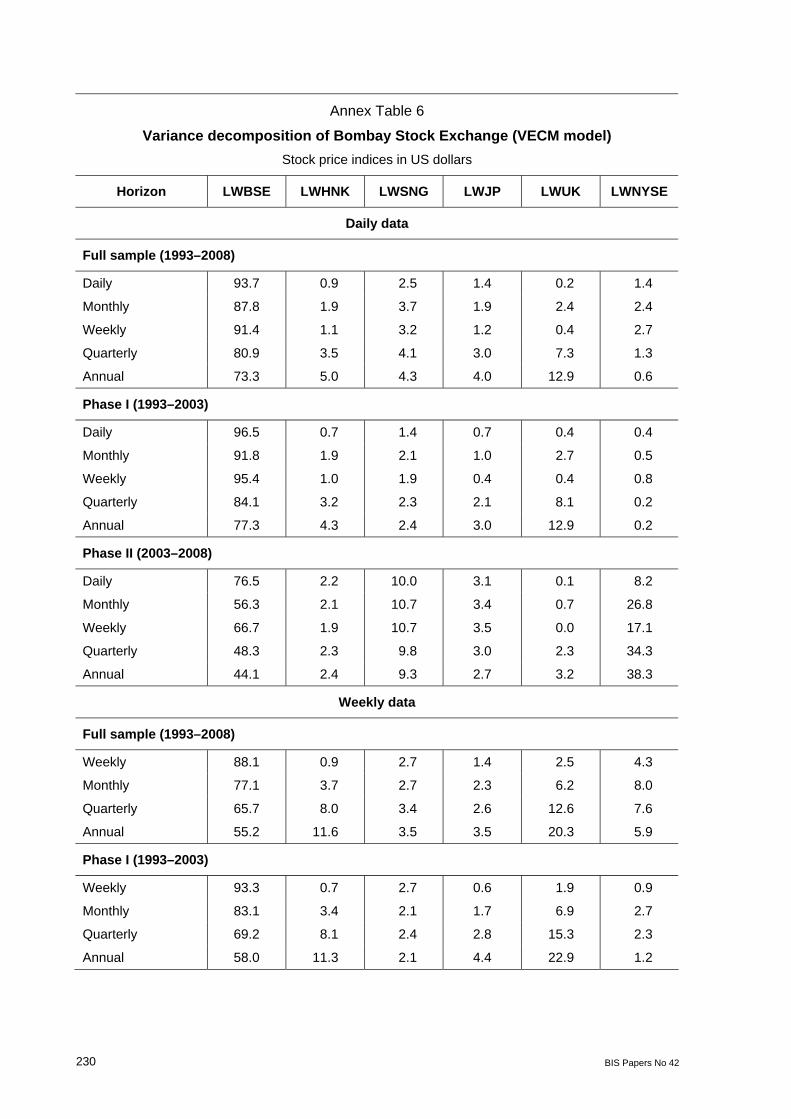
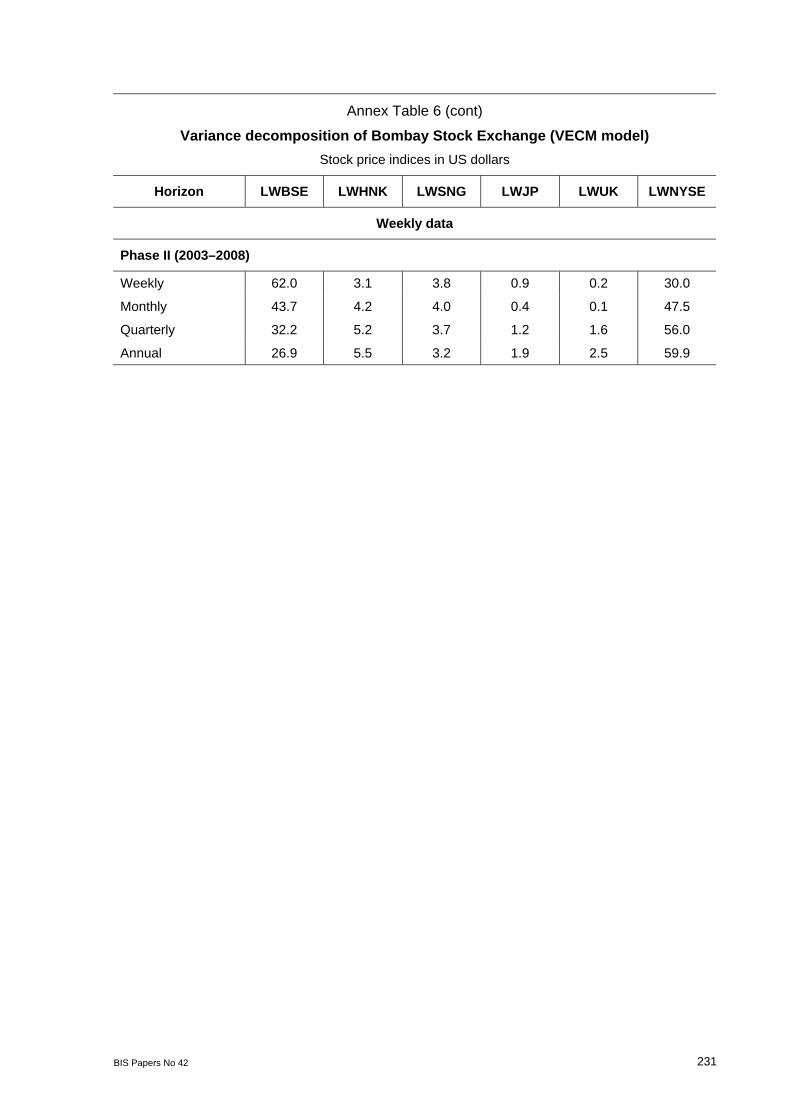
5.6. Variance decomposition analysis Apart from the long- and short-run dynamics, the VECM model of stock prices is useful for identifying the relative importance of each stock price to others, based on the dynamic interaction among markets through impulse response functions and forecast error variance decomposition. The latter, in particular, is useful for gauging the importance of innovations in one market to other markets and the nature of volatility transmission across markets (Chen et al (2002)). The results of the Forecast Error Variance Decomposition (FEVD) arising from the VECM for India’s stock market over daily, weekly, monthly (22-day), quarterly (66-day)
BIS Papers No 42 217
and annual (250 business-day) horizons are summarised in Annex Table 6. Similar to the long-run cointegration relation, the variance decomposition analysis shows a different level of financial integration for the two different phases. It is evident that in the more recent period, the US market has had a dominant effect on the Indian stock market. Singapore is the major regional source of variation for India’s stock market. Based on daily data, global and regional markets together account for about 56 per cent of the total variation in the Indian stock market over a monthly horizon for the more recent period (phase II), while they accounted for 92 per cent of such variation during 1993–2003 (phase I). However, over a six-month to one-year horizon, global and regional markets could account for as much as three fourths of the total variation in India’s stock market. A notable finding here is that the impact of global markets on India was more pronounced in weekly than in daily data. The impact of regional markets was substantially lower in the weekly data model than in the daily data model. Thus, there is a declining importance of domestic factors attributable to domestic stock prices’ own lags. As compared with other regional markets, it was evident that Hong Kong has a more or less similar dependence on the Singapore and US markets. On the other hand, Singapore and Japan are more dependent on the US market than is Hong Kong. The US market could account for the bulk of variation in the UK market. Finally, for the US market, domestic factors play a dominant role.
5.7 The crisis since January 2008 During 20–21 January 2008, regional markets witnessed a sharp decline in the wake of a more severe than anticipated credit market crisis in the United States. In the run-up to the crisis, the NYSE index declined by a total of 6.8 per cent between 14 and 18 January 2008, while the UK market declined by 10.8 per cent during the same period. In response, regional markets in Asia fell sharply during the two-day period of 20-21 January. From their peak level on 14 January 2008, stock markets in India, Singapore, Hong Kong and Japan declined by 22.8, 12.0, 15.1 and 10.5 per cent, respectively.
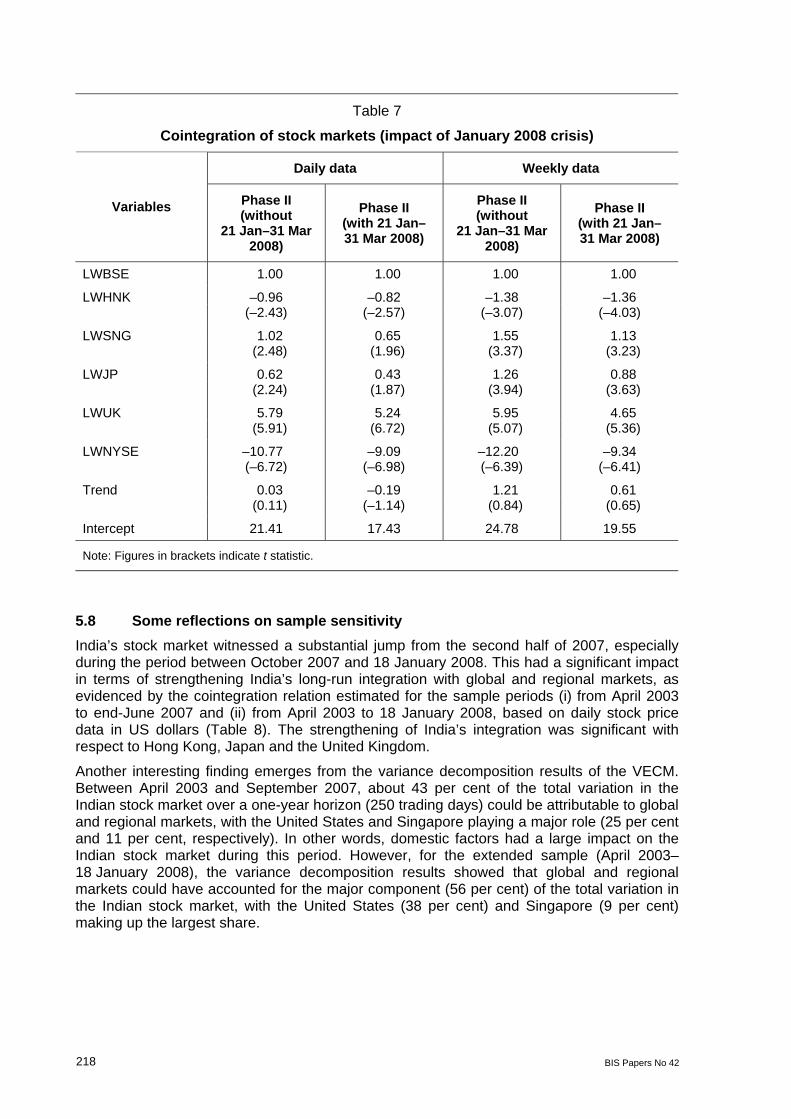
A pertinent question arises as to how the January 2008 crisis and developments thereafter up to 31 March 2008 impinged on financial market integration. In this regard there are four major findings. First, the earlier result of the single cointegration relation for the daily and weekly data continued to hold for the phase II sample, including data from 21 January to 31 March 2008. The cointegration rank tests were stronger for the extended sample period (phase II) than for the sample excluding the period from 21 January to 31 March 2008. Second, there was nonetheless a weakening of India’s long-run integration, as evidenced by the coefficients of the cointegrating vector in respect of global and regional markets (Table 7). The decline was highest in respect of the impact of Singapore, followed by that of Japan, the United States, Hong Kong and the United Kingdom. Third, there was a strengthening of India’s short-run integration with regional markets, as demonstrated by the size of the error correction term in the error correction equations for various markets. The increase was highest for Hong Kong, followed by India, the United Kingdom, Singapore, Japan and the United States. The weekly data showed more or less stable cointegration relations and short-run dynamics than did the daily data. Finally, in terms of variance decomposition, global and regional markets accounted for about 69 per cent of the total variation in the Indian stock market in the sample including the period from 21 January to 31 March 2008, as compared with 56 per cent in the sample excluding that period. The bulk of the increase was due to the impact of global markets such as the United States (8 per cent) and the United Kingdom (5 per cent).
218 BIS Papers No 42
Table 7
Cointegration of stock markets (impact of January 2008 crisis)
Daily data Weekly data
Variables Phase II (without
21 Jan–31 Mar 2008)
Phase II (with 21 Jan– 31 Mar 2008)
Phase II (without
21 Jan–31 Mar 2008)
Phase II (with 21 Jan– 31 Mar 2008)
LWBSE 1.00 1.00 1.00 1.00
LWHNK –0.96 –0.82 –1.38 –1.36 (–2.43) (–2.57) (–3.07) (–4.03)
LWSNG 1.02 0.65 1.55 1.13 (2.48) (1.96) (3.37) (3.23)
LWJP 0.62 0.43 1.26 0.88 (2.24) (1.87) (3.94) (3.63)
LWUK 5.79 5.24 5.95 4.65 (5.91) (6.72) (5.07) (5.36)
LWNYSE –10.77 –9.09 –12.20 –9.34 (–6.72) (–6.98) (–6.39) (–6.41)
Trend 0.03 –0.19 1.21 0.61 (0.11) (–1.14) (0.84) (0.65)
Intercept 21.41 17.43 24.78 19.55
Note: Figures in brackets indicate t statistic.
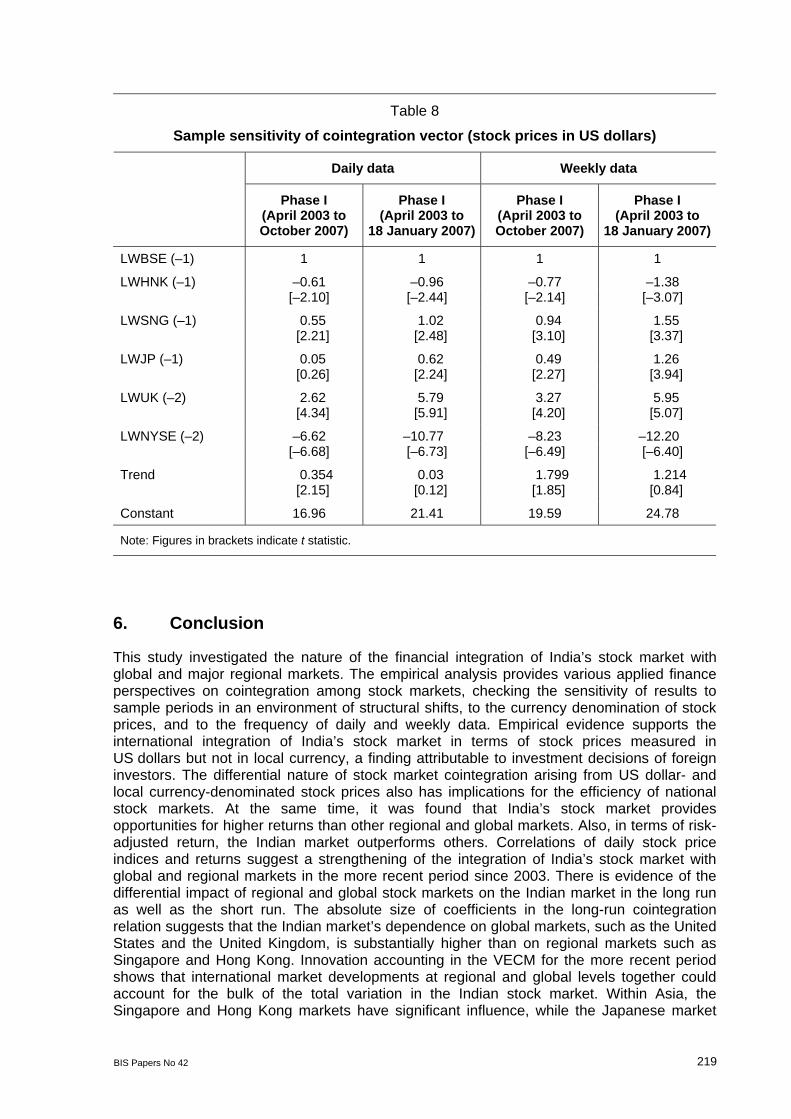
5.8 Some reflections on sample sensitivity India’s stock market witnessed a substantial jump from the second half of 2007, especially during the period between October 2007 and 18 January 2008. This had a significant impact in terms of strengthening India’s long-run integration with global and regional markets, as evidenced by the cointegration relation estimated for the sample periods (i) from April 2003 to end-June 2007 and (ii) from April 2003 to 18 January 2008, based on daily stock price data in US dollars (Table 8). The strengthening of India’s integration was significant with respect to Hong Kong, Japan and the United Kingdom.
Another interesting finding emerges from the variance decomposition results of the VECM. Between April 2003 and September 2007, about 43 per cent of the total variation in the Indian stock market over a one-year horizon (250 trading days) could be attributable to global and regional markets, with the United States and Singapore playing a major role (25 per cent and 11 per cent, respectively). In other words, domestic factors had a large impact on the Indian stock market during this period. However, for the extended sample (April 2003–18 January 2008), the variance decomposition results showed that global and regional markets could have accounted for the major component (56 per cent) of the total variation in the Indian stock market, with the United States (38 per cent) and Singapore (9 per cent) making up the largest share.
BIS Papers No 42 219
Table 8
Sample sensitivity of cointegration vector (stock prices in US dollars)
Daily data Weekly data
Phase I (April 2003 to October 2007)
Phase I (April 2003 to
18 January 2007)
Phase I (April 2003 to October 2007)
Phase I (April 2003 to
18 January 2007)
LWBSE (–1) 1 1 1 1
LWHNK (–1) –0.61 –0.96 –0.77 –1.38 [–2.10] [–2.44] [–2.14] [–3.07]
LWSNG (–1) 0.55 1.02 0.94 1.55 [2.21] [2.48] [3.10] [3.37]
LWJP (–1) 0.05 0.62 0.49 1.26 [0.26] [2.24] [2.27] [3.94]
LWUK (–2) 2.62 5.79 3.27 5.95 [4.34] [5.91] [4.20] [5.07]
LWNYSE (–2) –6.62 –10.77 –8.23 –12.20 [–6.68] [–6.73] [–6.49] [–6.40]
Trend 0.354 0.03 1.799 1.214 [2.15] [0.12] [1.85] [0.84]
Constant 16.96 21.41 19.59 24.78
Note: Figures in brackets indicate t statistic.
6. Conclusion
This study investigated the nature of the financial integration of India’s stock market with global and major regional markets. The empirical analysis provides various applied finance perspectives on cointegration among stock markets, checking the sensitivity of results to sample periods in an environment of structural shifts, to the currency denomination of stock prices, and to the frequency of daily and weekly data. Empirical evidence supports the international integration of India’s stock market in terms of stock prices measured in US dollars but not in local currency, a finding attributable to investment decisions of foreign investors. The differential nature of stock market cointegration arising from US dollar- and local currency-denominated stock prices also has implications for the efficiency of national stock markets. At the same time, it was found that India’s stock market provides opportunities for higher returns than other regional and global markets. Also, in terms of risk-adjusted return, the Indian market outperforms others. Correlations of daily stock price indices and returns suggest a strengthening of the integration of India’s stock market with global and regional markets in the more recent period since 2003. There is evidence of the differential impact of regional and global stock markets on the Indian market in the long run as well as the short run. The absolute size of coefficients in the long-run cointegration relation suggests that the Indian market’s dependence on global markets, such as the United States and the United Kingdom, is substantially higher than on regional markets such as Singapore and Hong Kong. Innovation accounting in the VECM for the more recent period shows that international market developments at regional and global levels together could account for the bulk of the total variation in the Indian stock market. Within Asia, the Singapore and Hong Kong markets have significant influence, while the Japanese market

220 BIS Papers No 42
has weak influence on the Indian market. The two global markets, the United States and the United Kingdom, could have a differential impact on the Indian market in the opposite direction, amid a structural shift in India’s integration with these global markets.
From a policy perspective, cointegrated stock markets would contribute to financial stability, since they cannot deviate too far from the long-run equilibrium path. From the standpoint of their portfolio diversification objective, investors cannot benefit from arbitrage activities in the long run. However, in the short run, markets would continue to be influenced by the portfolio diversification objective of foreign investors. The lack of evidence of integration of stock markets in terms of local currency gives rise to a concern that India’s stock market integration may not be complete, a finding attributable to the inadequate role of domestic investors.
BIS Papers No 42 221
Annex Table 1
Stock price data definition
Country Stock price symbol used in the study (natural log scale)
Thomson Financial’s Datastream
symbol
Description of the stock indices
Original data
provider
India BSE (LBSE) IBOMDLX BSE dollex – the 200-scrip BSE index in US dollar terms
Bombay Stock Exchange
Singapore SNG (LSNG) SBBSNG$ Broad market index in US dollar terms
S&P Citigroup
Hong Kong SAR HK (LHK) SBBHNK$ Broad market index in US dollar terms
S&P Citigroup
Japan JP (LJP) TOTMJP$ Broad market index in US dollar terms
Datastream
United Kingdom UK (LUK) SBBUKD$ Broad market index in US dollar terms
S&P Citigroup
United States NYSE (LNYSE) NYSEALL NYSE composite price index
NYSE
Notes: 1. For each of the variable with the prefix “D” denotes for first difference series. Illustratively, DLBSE refers to first difference of natural logarithm transformed stock price index in India, as defined in the above. 2. In order to account for different time zones in respect of global markets and regional markets, stock prices of the US and UK markets are lagged by one day.
222 BIS Papers No 42
Annex Table 2
Cointegration test of stock prices (Johansen and Juselius VECM approach)
Stock prices in US dollars, daily data
Full sample (1993–2008) with 2 lags
Hypothesis (no of r) Computed statistic (trace/Eigen) for trends 5% critical value
Computed statistic (trace)
H0 H1 Trend 1 Trend 2 Trend 1 Trend 2
None 1 75.0 162.0 95.8 117.7
At most 1 2 43.9 64.5 69.8 88.8
At most 2 3 25.5 36.6 47.9 63.9
At most 3 4 13.5 20.5 29.8 42.9
At most 4 5 3.5 8.7 15.5 25.9
At most 5 6 0.2 3.3 3.8 12.5
Computed statistic (maximum Eigen)
H0 H1 Trend 1 Trend 2 Trend 1 Trend 2
None 1 31.1 97.5 40.1 44.5
At most 1 2 18.5 27.9 33.9 38.3
At most 2 3 11.9 16.0 27.6 32.1
At most 3 4 10.0 11.8 21.1 25.8
At most 4 5 3.3 5.4 14.3 19.4
At most 5 6 0.2 3.3 3.8 12.5
Phase I (1 April 1993–31 March 2003)
Computed statistic (trace)
H0 H1 Trend 1 Trend 2 Trend 1 Trend 2
None 1 86.0 149.6 95.8 117.7
At most 1 2 52.9 63.3 69.8 88.8
At most 2 3 26.3 36.6 47.9 63.9
At most 3 4 15.2 21.4 29.8 42.9
At most 4 5 4.2 10.4 15.5 25.9
At most 5 6 1.1 1.3 3.8 12.5
BIS Papers No 42 223
Annex Table 2 (cont)
Cointegration test of stock prices (Johansen and Juselius VECM approach)
Stock prices in US dollars, daily data
Phase I (1 April 1993–31 March 2003) (cont)
Hypothesis (no of r) Computed statistic (trace/Eigen) for trends 5% critical value
Computed statistic (maximum Eigen)
H0 H1 Trend 1 Trend 2 Trend 1 Trend 2
None 1 33.1 86.3 40.1 44.5
At most 1 2 26.6 26.7 33.9 38.3
At most 2 3 11.1 15.2 27.6 32.1
At most 3 4 10.9 11.1 21.1 25.8
At most 4 5 3.1 9.0 14.3 19.4
At most 5 6 1.1 1.3 3.8 12.5
Phase II (1 April 1993–18 January 2008)
Computed statistic (trace)
H0 H1 Trend 1 Trend 2 Trend 1 Trend 2
None 1 110.7 125.19 95.8 117.7
At most 1 2 65.5 80.03 69.8 88.8
At most 2 3 39.1 51.47 47.9 63.9
At most 3 4 23.3 32.18 29.8 42.9
At most 4 5 13.8 16.62 15.5 25.9
At most 5 6 5.9 7.83 3.8 12.5
Computed statistic (maximum Eigen)
H0 H1 Trend 1 Trend 2 Trend 1 Trend 2
None 1 45.1 45.16 40.1 44.5
At most 1 2 26.5 28.57 33.9 38.3
At most 2 3 15.7 19.29 27.6 32.1
At most 3 4 9.5 15.56 21.1 25.8
At most 4 5 7.8 8.78 14.3 19.4
At most 5 6 5.9 7.83 3.8 12.5
224 BIS Papers No 42
Annex Table 3
Cointegration test of stock prices (Johansen and Juselius VECM approach)
Stock prices in US dollars, weekly data
Full sample (1993–2008) with 2 lags
Hypothesis (no of r) Computed statistic
(trace/Eigen) for alternative trends
5% critical value
Computed statistic (trace)
H0 H1 Trend 1 Trend 2 Trend 1 Trend 2
None 1 84.50 132.8 95.8 117.7
At most 1 2 48.46 71.3 69.8 88.8
At most 2 3 28.79 42.5 47.9 63.9
At most 3 4 14.15 23.2 29.8 42.9
At most 4 5 6.20 9.2 15.5 25.9
At most 5 6 1.25 1.6 3.8 12.5
Computed statistic (maximum Eigen)
H0 H1 Trend 1 Trend 2 Trend 1 Trend 2
None 1 36.0 61.5 40.1 44.5
At most 1 2 19.7 28.8 33.9 38.3
At most 2 3 14.6 19.3 27.6 32.1
At most 3 4 8.0 14.0 21.1 25.8
At most 4 5 5.0 7.6 14.3 19.4
At most 5 6 1.2 1.6 3.8 12.5
Phase I (sample 1993–2002)
Computed statistic (trace)
H0 H1 Trend 1 Trend 2 Trend 1 Trend 2
None 1 74.6 115.6 95.8 117.7
At most 1 2 46.4 64.5 69.8 88.8
At most 2 3 26.1 36.5 47.9 63.9
At most 3 4 13.7 22.9 29.8 42.9
At most 4 5 4.9 10.6 15.5 25.9
At most 5 6 1.9 1.9 3.8 12.5
BIS Papers No 42 225
Annex Table 3 (cont)
Cointegration test of stock prices (Johansen and Juselius VECM approach)
Stock prices in US dollars, weekly data
Phase I (sample 1993–2002) (cont)
Hypothesis (no of r) Computed statistic
(trace/Eigen) for alternative trends
5% critical value
Computed statistic (maximum Eigen)
H0 H1 Trend 1 Trend 2 Trend 1 Trend 2
None 1 28.2 51.2 40.1 44.5
At most 1 2 20.3 28.0 33.9 38.3
At most 2 3 12.4 13.5 27.6 32.1
At most 3 4 8.8 12.4 21.1 25.8
At most 4 5 3.0 8.7 14.3 19.4
At most 5 6 1.9 1.9 3.8 12.5
Phase II (sample 2003–2008)
Computed statistic (trace)
H0 H1 Trend 1 Trend 2 Trend 1 Trend 2
None 1 103.5 118.92 95.8 117.7
At most 1 2 63.0 77.78 69.8 88.8
At most 2 3 40.4 51.00 47.9 63.9
At most 3 4 24.9 34.48 29.8 42.9
At most 4 5 12.1 20.53 15.5 25.9
At most 5 6 3.4 9.74 3.8 12.5
Computed statistic (maximum Eigen)
H0 H1 Trend 1 Trend 2 Trend 1 Trend 2
None 1 40.5 42.76 40.1 44.5
At most 1 2 22.6 23.63 33.9 38.3
At most 2 3 15.5 16.94 27.6 32.1
At most 3 4 12.8 15.04 21.1 25.8
At most 4 5 8.8 11.05 14.3 19.4
At most 5 6 3.4 6.76 3.8 12.5
226 BIS Papers No 42
Annex Table 4
Cointegration rank test for stock prices in local currency Daily data
Full sample (1993–2008)
Hypothesis Computed statistic
(trace/Eigen) for alternative trends
5% critical value
Computed statistic (trace)
H0 H1 Trend 1 Trend 2 Trend 1 Trend 2
None 1 78.9 104.8 95.8 117.7
At most 1 2 45.3 64.0 69.8 88.8
At most 2 3 24.5 42.1 47.9 63.9
At most 3 4 6.8 21.8 29.8 42.9
At most 4 5 2.6 6.3 15.5 25.9
At most 5 6 0.0 2.5 3.8 12.5
Computed statistic (maximum Eigen)
H0 H1 Trend 1 Trend 2 Trend 1 Trend 2
None 1 33.6 40.8 40.1 44.5
At most 1 2 20.8 21.9 33.9 38.3
At most 2 3 17.7 20.3 27.6 32.1
At most 3 4 4.2 15.5 21.1 25.8
At most 4 5 2.6 3.8 14.3 19.4
At most 5 6 0.0 2.5 3.8 12.5
Phase I (Sample 1993–2003)
Computed statistic (trace)
H0 H1 Trend 1 Trend 2 Trend 1 Trend 2
None 1 86.3 118.3 95.8 117.7
At most 1 2 49.6 69.0 69.8 88.8
At most 2 3 31.3 41.7 47.9 63.9
At most 3 4 14.4 24.6 29.8 42.9
At most 4 5 2.2 9.3 15.5 25.9
At most 5 6 0.7 1.4 3.8 12.5
BIS Papers No 42 227
Annex Table 4 (cont)
Cointegration rank test for stock prices in local currency Daily data
Phase I (Sample 1993–2003) (cont)
Hypothesis Computed statistic
(trace/Eigen) for alternative trends
5% critical value
Computed statistic (maximum Eigen)
H0 H1 Trend 1 Trend 2 Trend 1 Trend 2
None 1 36.7 49.3 40.1 44.5
At most 1 2 18.3 27.3 33.9 38.3
At most 2 3 16.9 17.0 27.6 32.1
At most 3 4 12.2 15.3 21.1 25.8
At most 4 5 1.5 8.0 14.3 19.4
At most 5 6 0.7 1.4 3.8 12.5
Phase II (2003–2008)
Computed statistic (trace)
H0 H1 Trend 1 Trend 2 Trend 1 Trend 2
None 1 100.0 120.2 95.8 117.7
At most 1 2 58.4 77.8 69.8 88.8
At most 2 3 38.4 49.9 47.9 63.9
At most 3 4 19.8 30.6 29.8 42.9
At most 4 5 8.7 13.8 15.5 25.9
At most 5 6 2.5 5.2 3.8 12.5
Computed statistic (maximum Eigen)
H0 H1 Trend 1 Trend 2 Trend 1 Trend 2
None 1 41.6 42.4 40.1 44.5
At most 1 2 20.0 27.9 33.9 38.3
At most 2 3 18.6 19.3 27.6 32.1
At most 3 4 11.1 16.8 21.1 25.8
At most 4 5 6.2 8.6 14.3 19.4
At most 5 6 2.5 5.2 3.8 12.5
228 BIS Papers No 42
Annex Table 5
Cointegration rank test for stock prices in local currency Weekly data
Full sample (1993–2008)
Hypothesis Computed statistic
(trace/Eigen) for alternative trends
5% critical value
Computed statistic (trace)
H0 H1 Trend 1 Trend 2 Trend 1 Trend 2
None 1 76.4 97.1 95.8 117.7
At most 1 2 42.2 61.9 69.8 88.8
At most 2 3 22.5 38.5 47.9 63.9
At most 3 4 7.0 18.8 29.8 42.9
At most 4 5 2.7 6.3 15.5 25.9
At most 5 6 0.0 2.5 3.8 12.5
Computed statistic (maximum Eigen)
H0 H1 Trend 1 Trend 2 Trend 1 Trend 2
None 1 34.2 35.1 40.1 44.5
At most 1 2 19.7 23.4 33.9 38.3
At most 2 3 15.5 19.7 27.6 32.1
At most 3 4 4.3 12.5 21.1 25.8
At most 4 5 2.7 3.8 14.3 19.4
At most 5 6 0.0 2.5 3.8 12.5
Phase I (1993–2003)
Computed statistic (trace)
H0 H1 Trend 1 Trend 2 Trend 1 Trend 2
None 1 75.5 103.8 95.8 117.7
At most 1 2 46.3 71.4 69.8 88.8
At most 2 3 26.9 42.4 47.9 63.9
At most 3 4 13.5 23.3 29.8 42.9
At most 4 5 2.4 9.8 15.5 25.9
At most 5 6 0.3 1.7 3.8 12.5
BIS Papers No 42 229
Annex Table 5 (cont)
Cointegration rank test for stock prices in local currency Weekly data
Phase I (1993–2003) (cont)
Hypothesis Computed statistic
(trace/Eigen) for alternative trends
5% critical value
Computed statistic (maximum Eigen)
H0 H1 Trend 1 Trend 2 Trend 1 Trend 2
None 1 29.2 32.4 40.1 44.5
At most 1 2 19.4 29.0 33.9 38.3
At most 2 3 13.4 19.1 27.6 32.1
At most 3 4 11.1 13.4 21.1 25.8
At most 4 5 2.1 8.1 14.3 19.4
At most 5 6 0.3 1.7 3.8 12.5
Phase II (2003–2008)
Computed statistic (trace)
H0 H1 Trend 1 Trend 2 Trend 1 Trend 2
None 1 85.9 104.3 95.8 117.7
At most 1 2 52.6 70.6 69.8 88.8
At most 2 3 28.8 43.0 47.9 63.9
At most 3 4 14.1 25.8 29.8 42.9
At most 4 5 5.4 11.1 15.5 25.9
At most 5 6 1.3 3.6 3.8 12.5
Computed statistic (maximum Eigen)
H0 H1 Trend 1 Trend 2 Trend 1 Trend 2
None 1 33.3 33.7 40.1 44.5
At most 1 2 23.7 27.6 33.9 38.3
At most 2 3 14.8 17.1 27.6 32.1
At most 3 4 8.7 14.7 21.1 25.8
At most 4 5 4.1 7.5 14.3 19.4
At most 5 6 1.3 3.6 3.8 12.5
230 BIS Papers No 42
Annex Table 6
Variance decomposition of Bombay Stock Exchange (VECM model) Stock price indices in US dollars
Horizon LWBSE LWHNK LWSNG LWJP LWUK LWNYSE
Daily data
Full sample (1993–2008)
Daily 93.7 0.9 2.5 1.4 0.2 1.4
Monthly 87.8 1.9 3.7 1.9 2.4 2.4
Weekly 91.4 1.1 3.2 1.2 0.4 2.7
Quarterly 80.9 3.5 4.1 3.0 7.3 1.3
Annual 73.3 5.0 4.3 4.0 12.9 0.6
Phase I (1993–2003)
Daily 96.5 0.7 1.4 0.7 0.4 0.4
Monthly 91.8 1.9 2.1 1.0 2.7 0.5
Weekly 95.4 1.0 1.9 0.4 0.4 0.8
Quarterly 84.1 3.2 2.3 2.1 8.1 0.2
Annual 77.3 4.3 2.4 3.0 12.9 0.2
Phase II (2003–2008)
Daily 76.5 2.2 10.0 3.1 0.1 8.2
Monthly 56.3 2.1 10.7 3.4 0.7 26.8
Weekly 66.7 1.9 10.7 3.5 0.0 17.1
Quarterly 48.3 2.3 9.8 3.0 2.3 34.3
Annual 44.1 2.4 9.3 2.7 3.2 38.3
Weekly data
Full sample (1993–2008)
Weekly 88.1 0.9 2.7 1.4 2.5 4.3
Monthly 77.1 3.7 2.7 2.3 6.2 8.0
Quarterly 65.7 8.0 3.4 2.6 12.6 7.6
Annual 55.2 11.6 3.5 3.5 20.3 5.9
Phase I (1993–2003)
Weekly 93.3 0.7 2.7 0.6 1.9 0.9
Monthly 83.1 3.4 2.1 1.7 6.9 2.7
Quarterly 69.2 8.1 2.4 2.8 15.3 2.3
Annual 58.0 11.3 2.1 4.4 22.9 1.2
BIS Papers No 42 231
Annex Table 6 (cont)
Variance decomposition of Bombay Stock Exchange (VECM model) Stock price indices in US dollars
Horizon LWBSE LWHNK LWSNG LWJP LWUK LWNYSE
Weekly data
Phase II (2003–2008)
Weekly 62.0 3.1 3.8 0.9 0.2 30.0
Monthly 43.7 4.2 4.0 0.4 0.1 47.5
Quarterly 32.2 5.2 3.7 1.2 1.6 56.0
Annual 26.9 5.5 3.2 1.9 2.5 59.9
232 BIS Papers No 42
References
Agmon, T (1972): “The relationship among equity markets: a study of share price co-movement in the United States, United Kingdom, Germany and Japan”, Journal of Finance, vol 27, pp 839–55.
Ahlgren, N and J Antell (2002): “Testing for cointegration between international stock prices”, Applied Financial Economics, vol 12.
Arshanapalli, B and J Doukas (1993): “International stock market linkages: evidence from the pre- and post-October 1987 period”, Journal of Banking and Finance, pp 193–208.
Bachman, D, J C Jongmoo, B N Jeon and J K Kenneth (1996): “Common factors in international stock prices: evidence from cointegration study”, International Review of Financial Analysis, vol 5, no 1.
Baffes, J (1994): “Does cointegration among exchange rates imply market inefficiency”, Economic Letters, vol 44.
Bailey, W and R M Stulz (1990): “Benefits of international diversification: the case of Pacific Basin stock markets”, Journal of Portfolio Management, vol 16, pp 57–61.
Baillie, R T and T Bollerslev (1989): “Common stochastic trends in a system of exchange rates”, Journal of Finance, vol 44.
Blackman, K, K Holden and W Thomas (1994): “Long-term relationships between international share prices”, Applied Financial Economics, vol 4, pp 297–304.
Byers, J D and D A Peel (1993): “Some evidence on the interdependence of national stock markets and the gains from international portfolio diversification”, Applied Financial Economics, vol 3, pp 239–42.
Cha, B and S Oh (2000): “The relationship between developed equity markets and the Pacific Basin’s emerging equity markets”, International Review of Economics and Finance, vol 9, pp 299–322.
Chen, G M, M Firth and O M Rui (2002): “Stock market linkages: evidence from Latin America”, Journal of Banking and Finance, vol 26.
Cheung, Y L and S C Mak (1992): “The international transmission of stock market fluctuation between the developed markets and the Asia-Pacific markets”, Applied Financial Economics, vol 2, no 2.
Chowdhry, A R (1994): “Stock market interdependencies: evidence from the Asian NIEs”, Journal of Macroeconomics, vol 16, no 4.
Chowdhry, T, Lin Lu and Ke Peng (2007): “Common stochastic trends among Far Eastern stock prices: effects of Asian financial crisis”, International Review of Financial Analysis, vol 16.
Chung, P J and D J Liu (1994): “Common stochastic trends in Pacific rim stock markets”, Quarterly Review of Economics and Finance, vol 34, no 3.
Cournot, Augustin (1927): Researches into the Mathematical Principles of the Theory of Wealth, Nathaniel T Bacon (trans), Macmillan.
Cowen, D, R Salgado, H Shah, L Teo and A Zanello (2006): “Financial integration in Asia: recent developments and next steps”, International Monetary Fund Working Papers, no 06/196.
Crowder, W J, and M E Wohar (1998): “Cointegration, forecasting and international stock prices”, Global Finance Journal, vol 9, no 2.
BIS Papers No 42 233
Darbar, S M and P Deb (1997): “Co-movement in international equity markets”, Journal of Financial Research, vol 20, no 3, pp 305–22.
Dickey, D A, D W Jansen and D L Thornton (1991): “A primer on cointegration with an application to money and income”, Cointegration for Applied Economists, B B Rao (ed), St. Martin’s Press.
Dwyer, G P J and M S Wallace (1992): “Cointegration and market efficiency”, Journal of International Money and Finance, vol 11.
Engel, C (1996): “A note on cointegration and international capital market efficiency”, Journal of International Money and Finance, vol 11.
Engle, R F and C W J Granger (1987): “Cointegration and error correction: representation, estimation, and testing”, Econometrica, vol 55, no 2, pp 251–76.
Eun, C S and S Shim (1989): “International transmission of stock market movements”, Journal of Financial and Quantitative Analysis, vol 24, no 2, pp 241–56.
Gerrits, R and A Yuce (1999): “Short- and long-term links among European and US stock markets”, Applied Financial Economics, vol , pp 1–9.
Gonzallo, J and C W J Granger (1995): “Estimation of common long-memory components in cointegrated systems”, Journal of Business and Economic Statistics, vol 13.
Granger, C W J (1986): “Developments in the study of cointegrated economic variables”, Oxford Bulletin of Economics and Statistics, vol 48, August, pp 213–28.
——— (1988): “Some recent developments in a concept of causality”, Journal of Econometrics, vol 39 (1/2), pp 199–211.
Hakkio, C S and M Rush (1989): “Market efficiency and cointegration: an application to the sterling and deutschemark exchange markets”, Journal of International Money and Finance, vol 8, pp 75–88.
——— (1991): “Cointegration: how short is the long run?”, Journal of International Money and Finance, vol 10, no 4, pp 57l–81.
Harvey, Campbell R (1995): “Predictable risk and returns in emerging markets”, Review of Financial Studies, vol 8, pp 773–816.
Hassan, M K and A Naka (1996): “Short-run and long-run dynamic linkages among international stock markets”, International Review of Economics and Finance, vol 5, no 1.
Hillard, J (1979): “The relationship between equity indices on world exchanges,” Journal of Finance, vol 34, pp 103–14.
Janakiramanan, S and A S Lamba (1998): “An empirical examination of linkages between Pacific Basin stock markets”, Journal of International Financial Markets, Institutions and Money, vol 8, no 2, pp 155–173.
Jeon, J, Y Oh and D Y Yang (2005): “Financial market integration in East Asia: regional or global?”, Korea Institute for International Economic Policy Working Papers, no 05–02.
Johansen, S (1988): “Statistical analysis of cointegrating vectors”, Journal of Economic Dynamics and Control, vol 12, pp 231–54.
Johansen, S and K Juselius (1990): “Maximum likelihood estimation and inferences on cointegration – with applications to the demand for money”, Oxford Bulletin of Economics and Statistics, vol 52, no 2, pp 169–210.
Kanas, A (1998): “Linkages between the US and European equity markets: further evidence from cointegration tests”, Applied Financial Economics, vol 8, pp 607–14.
234 BIS Papers No 42
Kasa, K (1992): “Common stochastic trends in international stock markets”, Journal of Monetary Economics, vol 29, pp 95–124.
Kearney, C and B Lucey (2004): “International equity market integration: theory, evidence and implications”, International Review of Financial Analysis, vol 13, pp 571–83.
Kim, E Han and V Singhal (2000): “Stock market opening: experience of emerging economies”, Journal of Business, vol 73, pp 25–66.
Korajczyk, R A and C J Viallet (1989): “An empirical investigation of international asset pricing”, Review of Financial Studies, vol 2, pp 553–85.
Kwan, A C C, A B Sim and J A Cotsomitis (1995): “The causal relationships between equity indices on world exchanges”, Applied Economics, vol 27.
Lai, M, K S Lai and H Fang (1993): “Dynamic linkages between the New York and Tokyo stock markets: a vector error correction analysis”, Journal of International Financial Markets, Institutions and Money, vol 3, no 2, pp 73–96.
Levy, H and M Samat (1970): “International diversification of investment portfolios”, American Economic Review, vol 60, pp 668–75.
Lintner, J (1965): “Security prices, risk and maximum gains from diversification”, Journal of Finance, vol 20.
Markowitz, H (1952): “Portfolio selection”, Journal of Finance, vol 7.
Marshall, Alfred (1930): Principles of economics: an introductory volume, 8th ed, Macmillan.
Masih, A M M and R Masih (1997): “Dynamic linkages and the propagation mechanism driving major international markets: an analysis of the pre- and post-crash areas”, Quarterly Review of Economics and Finance, vol 37, no 4.
——— (1999): “Are Asian stock market fluctuations due mainly to intraregional contagion effects? Evidence based on Asian emerging stock markets”, Pacific Basin Finance Journal, vol 7, no 3–4, pp 251–82.
——— (2002): “Propagative causal price transmission among international stock markets: evidence from pre- and post- globalisation period”, Global Finance Journal, vol 13.
Meric, I and I Meric (1989): “Potential gains from international portfolio diversification and intertemporal stability and seasonality in international stock market relationships”, Journal of Banking and Finance, vol 13, pp 627–40.
Mohan, R (2004a): “Financial market reforms in India: policies and performance analysis”, RBI Bulletin, October.
——— (2004b): “Challenges to monetary policy in a globalising context”, RBI Bulletin, January.
——— (2005): “Globalisation, financial markets and the operation of monetary policy in India”, BIS Papers, no 23, Basel, May.
——— (2006): “Monetary and financial policy responses to global imbalances”, RBI Bulletin, December.
——— (2007a): “Risks associated with macroeconomic adjustments: global perspective”, RBI Bulletin, February.
——— (2007b): “Development of financial markets in India”, RBI Bulletin, June.
Panton, D B, V P Lessig and O M Joy (1976): “Co-movement of international equity markets: a taxonomic approach”, Journal of Financial and Quantitative Analysis, vol 11, pp 415–32.
BIS Papers No 42 235
Phengpis, C (2005): “Market efficiency and cointegration of spot exchange rates during periods of economic turmoil: another look at European and Asian currency crises”, Journal of Economics and Business, vol 58, pp 323–42.
Phengpis, C and V P Apilado (2004): “Economic interdependence and common stochastic trends: a comparative analysis between EMU and non-EMU stock markets”, International Review of Financial Analysis, vol 13.
Philippatos, G C, A Christofi and P Christofi (1983): “The intertemporal stability of international stock market relationships: another view”, Financial Management, Winter, pp 63–69.
Phylaktis, K and F Ravazzolo (2005): “Stock market linkages in emerging markets: implications for international portfolio diversification”, Journal of International Financial Markets, Institutions and Money, vol 15, pp 91–106.
Prasad, Eswar S, Kenneth Rogoff, Shang-Jin Wei and M Ayhan Kose (2003): “Effects of financial globalization on developing countries: some empirical evidence”, IMF Occasional Papers, no 220.
Ramchand, L and R Susmel (1998): “Volatility and cross-correlation across major stock markets”, Journal of Empirical Finance, vol 5, no 4, pp 397–416.
Reddy, Y V (2003): “The global economy and financial markets: outlook, risks and policy responses”, RBI Bulletin, October.
——— (2005): “Overcoming challenges in a globalised economy”, RBI Bulletin, July.
——— (2005a): “Implications of global financial imbalances for the emerging market economies”, RBI Bulletin, December.
——— (2005b): Annual policy statement for the year 2005–06, Reserve Bank of India, 28 April 2005.
——— (2006a): “Global imbalances – an Indian perspective”, RBI Bulletin, June.
——— (2006b): “Globalisation, money and finance – uncertainties and dilemmas”, RBI Bulletin, October.
Reserve Bank of India (2007): Development of financial markets and role of the central bank, report on currency and finance, 2005–06.
Richards, A J (1995): “Co-movements in national stock market returns: evidence of predictability, but not cointegration”, Journal of Monetary Economics, vol 36, no 3, pp 631–54.
Roca, E D (1999): “Short-term and long-term price linkages between the equity markets of Australia and its major trading partners”, Applied Financial Economics, vol 9, no 5, pp 501–11.
Ross, Stephen (1976): “The arbitrage theory of capital asset pricing”, Journal of Economic Theory, vol 13, no 3.
Schollhamer, H and O C Sand (1987): “Lead-lag relationships among national equity markets: an empirical investigation”, in S J Khoury and A Ghosh (eds), Recent developments in international banking and finance.
Sephton, P S and H K Larsen (1991): “Tests of exchange market efficiency: fragile evidence from cointegration tests”, Journal of International Money and Finance, vol 10, pp 561–70.
Sharpe, W (1964): “Capital asset prices: a theory of market equilibrium under conditions of risk”, Journal of Finance, vol 19, pp 425–42.
Solnik, B, C Boucrelle and Y Le Fur (1996): “International market correlation and volatility”, Financial Analysts Journal, vol 52, no 5, pp 17–34.
236 BIS Papers No 42
Stiglitz, Joseph (2002): Globalization and its discontents, Norton.
Taylor, M P and I Tonks (1989): “The internationalization of stock markets and abolition of UK exchange control”, Review of Economics and Statistics, vol 71, pp 332–6.
United States Agency for International Development (1998): Financial markets development, USAID policy paper.
Verchenko, O (2000): Potential for portfolio diversification across eastern European stock markets, M.A. thesis, National University Kiev-Mohyla Academy.
Voronkova, S (2004): “Equity market integration in central European emerging markets: a cointegration analysis with shifting regimes”, International Review of Financial Analysis, vol 13, pp 633–47.
Wong, Wing-Keung, A Agarwal and Jun Du (2005): “Financial integration for Indian stock market: a fractional cointegration approach”, working paper no 0501, Department of Economics, National University of Singapore.
Worthington, A C and H Higgs (2007): “Evidence of financial integration in Asia: an empirical application of panel unit root tests and multivariate cointegration and causality procedures”, University of Wollongong, Commerce Department Working Papers, no 07/09.
——— (2004a): “Co-movements in Asia-Pacific equity markets: developing patterns in APEC”, Asia-Pacific Journal of Economics and Business, vol 8, no 1, pp 78–92.
——— (2004b): “Transmission of equity returns and volatility in Asian developed and emerging markets: a multivariate GARCH analysis”, International Journal of Finance and Economics, vol 9, no 1, pp 71–80.
Worthington, A C, M Katsuura and H Higgs (2003): “Price linkages in Asian equity markets: evidence bordering the Asian economic, currency and financial crises”, Asia-Pacific Financial Markets, vol 10, no 1, pp 29–44.
Yu, I, L Fung and C Tam (2007): “Assessing financial market integration in Asia – equity markets”, Hong Kong Monetary Authority Working Papers, no 04/2007.