intel corporation type 4 air contaminant discharge permit ... · 2 project description ... in...
TRANSCRIPT

Intel Corporation Type 4 Air Contaminant Discharge
Permit Application
Prepared for Oregon Department of Environmental Quality
December 2014
Prepared by

ii
This page intentionally left blank

ES111914104811PDX III
Contents Section Page
Acronyms and Abbreviations .................................................................................................................... vii
1 Introduction ............................................................................................................................... 1‐1 1.1 Background ............................................................................................................................ 1‐1 1.2 Application Organization ....................................................................................................... 1‐1
2 Project Description ..................................................................................................................... 2‐1 2.1 Semiconductor Manufacturing Operations ........................................................................... 2‐1 2.2 Manufacturing Support Operations ....................................................................................... 2‐1
3 Emissions Information ................................................................................................................ 3‐1 3.1 Manufacturing Process Description ....................................................................................... 3‐1
3.1.1 Oxidation ................................................................................................................... 3‐1 3.1.2 Photolithography ...................................................................................................... 3‐1 3.1.3 Etching ...................................................................................................................... 3‐1 3.1.4 Doping ....................................................................................................................... 3‐2 3.1.5 Deposition ................................................................................................................. 3‐2 3.1.6 Planar ........................................................................................................................ 3‐2 3.1.7 Cleaning .................................................................................................................... 3‐2 3.1.8 Auxiliary Steps ........................................................................................................... 3‐2
3.2 Utility Support Systems .......................................................................................................... 3‐2 3.2.1 Rotor Concentrator Thermal Oxidizers ..................................................................... 3‐2 3.2.2 Packed‐Bed Wet Chemical Scrubbers ....................................................................... 3‐2 3.2.3 Boilers ....................................................................................................................... 3‐3 3.2.4 Emergency Generators and Fire Water Pumps ........................................................ 3‐3 3.2.5 Cooling Towers ......................................................................................................... 3‐3 3.2.6 Tanks ......................................................................................................................... 3‐3 3.2.7 TMXW Ammonia Treatment System ........................................................................ 3‐3 3.2.8 Bulk Specialty Solvent Waste System ....................................................................... 3‐3 3.2.9 Fabrication (Clean Rooms) Building Air Handling ..................................................... 3‐3 3.2.10 Bulk Chemical distribution ........................................................................................ 3‐4 3.2.11 Ultrapure Water ........................................................................................................ 3‐4 3.2.12 Rinsewater Reclaim Treatment ................................................................................ 3‐4 3.2.13 Chilled and Glycol Water .......................................................................................... 3‐4 3.2.14 Bulk Gas .................................................................................................................... 3‐4 3.2.15 Specialty Gas Systems ............................................................................................... 3‐4 3.2.16 Waste Collection and Treatment .............................................................................. 3‐4 3.2.17 Instrumentation and Control .................................................................................... 3‐4 3.2.18 Life Safety .................................................................................................................. 3‐4 3.2.19 Point of Use Abatement Systems ............................................................................. 3‐4
3.3 Emission Calculations and Methodology ............................................................................... 3‐5 3.3.1 Boiler Emissions ........................................................................................................ 3‐5 3.3.2 RCTO Natural Gas Combustion Emissions ................................................................ 3‐5 3.3.3 Emergency Generator and Fire Water Pumps .......................................................... 3‐6 3.3.4 Cooling Towers ......................................................................................................... 3‐6 3.3.5 Bulk Specialty Solvent Waste System ....................................................................... 3‐7 3.3.6 TMXW System ........................................................................................................... 3‐7

CONTENTS, CONTINUED
Section Page
IV ES111914104811PDX
3.3.7 Semiconductor Manufacturing Operations .............................................................. 3‐8 3.3.8 Miscellaneous Sources ............................................................................................ 3‐13 3.3.9 Categorically Insignificant Activities ........................................................................ 3‐14
3.4 Emissions Summary .............................................................................................................. 3‐16
4 Regulatory Requirements ........................................................................................................... 4‐1 4.1 Major New Source Review (NSR) ........................................................................................... 4‐1
4.1.1 Prevention of Significant Deterioration NSR ............................................................. 4‐1 4.1.2 Maintenance Area NSR ............................................................................................. 4‐3 4.1.3 Nonattainment Area NSR .......................................................................................... 4‐4 4.1.4 Minor Source NSR ..................................................................................................... 4‐4
4.2 New Source Performance Standards (NSPS) .......................................................................... 4‐5 4.2.1 NSPS Subpart A – General Provisions ........................................................................ 4‐5 4.2.2 NSPS Subpart Dc – Standards of Performance for Industrial‐Commercial‐
Institutional Steam Generating Units ........................................................................ 4‐5 4.2.3 NSPS Subpart IIII – Standards of Performance for Stationary Compression
Ignition Internal Combustion Engines ....................................................................... 4‐6 4.3 National Emissions Standards for Hazardous Air Pollutants (NESHAP) ................................. 4‐6
4.3.1 NESHAP Subpart ZZZZ ................................................................................................ 4‐6 4.3.2 NESHAP Subpart JJJJJJ ............................................................................................... 4‐6
4.4 Oregon Title V Operating Permit Program (Implementing Title V of the Clean Air Act) ........ 4‐7 4.5 Chemical Accident Prevention Program ................................................................................. 4‐7
5 Best Available Control Technology Analysis ................................................................................ 5‐1 5.1 Introduction ............................................................................................................................ 5‐1 5.2 BACT Applicability................................................................................................................... 5‐1
5.2.1 Applicable Pollutants ................................................................................................. 5‐1 5.2.2 Criteria for Emission Unit BACT Applicability ............................................................ 5‐1 5.2.3 Evaluation of Equipment Requiring BACT ................................................................. 5‐2 5.2.4 “New Project” Equipment ......................................................................................... 5‐2 5.2.5 Preproject Equipment (Retroactive ‐ BACT) .............................................................. 5‐3
5.3 BACT Analysis for New Project Equipment ............................................................................ 5‐4 5.3.1 Introduction ............................................................................................................... 5‐4 5.3.2 New Project Industrial Boiler NOx BACT Analysis ..................................................... 5‐7 5.3.3 New Project Industrial Boiler BACT for CO .............................................................. 5‐10 5.3.4 New Project Thermal Oxidizer CO and NOx BACT Analysis ..................................... 5‐12 5.3.5 New Project Emergency Generator NOx and CO BACT Analysis ............................. 5‐14 5.3.6 TMXW System NOx and CO BACT Analysis ............................................................. 5‐15 5.3.7 Fab Tools Including POU Devices NOx and CO BACT Analysis ................................ 5‐17
5.4 Summary of Proposed BACT for New Project Equipment .................................................... 5‐20 5.5 BACT Analysis for Preproject Equipment ............................................................................. 5‐20
5.5.1 Preproject Industrial Boiler NOx BACT Analysis ...................................................... 5‐21 5.5.2 Preproject Thermal Oxidizer CO and NOx BACT Analysis ....................................... 5‐21 5.5.3 Preproject TMXW System CO and NOx BACT Analysis ........................................... 5‐24 5.5.4 Preproject Fab Tools CO and NOx BACT Analysis .................................................... 5‐24
5.6 Summary of Proposed BACT for Preproject Equipment ...................................................... 5‐25
6 Ambient Air Quality Analysis for Criteria Pollutants .................................................................... 6‐1 6.1 Standards and Criteria Levels ................................................................................................. 6‐1 6.2 Modeling Approach ................................................................................................................ 6‐2

CONTENTS, CONTINUED
Section Page
ES111914104811PDX V
6.2.1 PM2.5 Modeling Approach ......................................................................................... 6‐2 6.3 Significant Air Quality Impact Level Analysis ......................................................................... 6‐2 6.4 Refined Analyses—Criteria Pollutants ................................................................................... 6‐2
6.4.1 Refined Analyses—NAAQS........................................................................................ 6‐3 6.4.2 Refined Analysis—Class II PSD Increment ................................................................ 6‐5
6.5 Class I PSD Increment Analysis............................................................................................... 6‐6
7 References .................................................................................................................................. 7‐1
Tables
3‐1 MAO Round 1 Stack Test Results ........................................................................................................ 3‐8 3‐2 Building Ratios .................................................................................................................................... 3‐9 3‐3 Calculated Building Fluorides Emission Rates During Testing .......................................................... 3‐10 3‐4 Total Scaled Building HF Emission Rates ........................................................................................... 3‐11 3‐5 Building Fluorides Emission Rates..................................................................................................... 3‐11 3‐6 Building HF Emission Rates ............................................................................................................... 3‐12 3‐7 Calculated Annual Emissions of Regulated Air Pollutants in Tons Per Year ..................................... 3‐16 4‐1 Facility Emission Rates (tpy) ............................................................................................................... 4‐2 4‐2 Requested Growth Allowance Allocation ........................................................................................... 4‐4 4‐3 Comparison of Requested PSELs to Netting Basis .............................................................................. 4‐5 5‐1 Proposed New Equipment Subject to BACT including Regulated Pollutants ..................................... 5‐3 5‐2 Preproject Equipment Subject to BACT including Regulated Pollutants ............................................ 5‐3 5‐3 Calculated Emission Units Emission Rates for Preproject Equipment ................................................ 5‐5 5‐4 NOx Control Cost Comparison .......................................................................................................... 5‐13 5‐5 CO Control Cost Comparison ............................................................................................................ 5‐13 5‐6 Summary of CI ICE NSPS Applicable to Facility New Project Emergency Generators ...................... 5‐15 5‐7 NOx Control Cost Comparison .......................................................................................................... 5‐19 5‐8 Summary of Proposed BACT for New Project Equipment ................................................................ 5‐20 5‐9 Preproject RCTO Emissions Data ...................................................................................................... 5‐22 5‐10 CO Control Cost Comparison ............................................................................................................ 5‐23 5‐11 CO Control Cost Comparison ........................................................................................................... 5‐23 5‐12 Summary of Proposed BACT for Preproject Equipment ................................................................... 5‐25 6‐1 Summary of Air Quality Standards and Applicable Criteria ................................................................ 6‐1 6‐2 Results of Significant Impact Level Analysis ........................................................................................ 6‐2 6‐3 Ambient Background Concentrations (micrograms per cubic meter) ................................................ 6‐3 6‐4 1‐hour NO2 Ambient Season Background Profile ............................................................................... 6‐4 6‐5 Seasonal 24‐hour PM2.5 Ambient Background Concentrations ........................................................ 6‐5 6‐6 Results of NAAQS Analysis .................................................................................................................. 6‐5 6‐7 Results of Class II PSD Analysis ........................................................................................................... 6‐6 6‐8 Class I Distances .................................................................................................................................. 6‐6 6‐9 Comparison of Modeled Concentrations with PSD Class I Significant Impact Levels and
Increments .......................................................................................................................................... 6‐7
Figures
1‐1 Vicinity Map ........................................................................................................................................ 1‐2 1‐2 Ronler Acres Campus Site Plan ........................................................................................................... 1‐3 1‐3 Aloha Campus Site Plan ...................................................................................................................... 1‐4

CONTENTS, CONTINUED
Section Page
VI ES111914104811PDX
3‐1 Overall Process Flow Diagram ........................................................................................................... 3‐17 3‐2 Fab Source Process Flow Diagram ..................................................................................................... 3‐19 3‐3 Utilities Support Process Flow Diagram ............................................................................................ 3‐21 5‐1 Fab Exhaust Management System .................................................................................................... 5‐18
Appendixes
A Air Contaminant Discharge Permit Forms B Land Use Compatibility Statements C Emissions Calculations D Road Dust Calculation Methodology E BACT Cost Estimate and Calculation Data Sheets F RBLC Review Results G Criteria Pollutant Modeling Protocol and DEQ Approval

ES111914104811PDX VII
Acronyms and Abbreviations ACDP Air Contaminant Discharge Permit
BACT Best Available Control Technology
BSSW bulk specialty solvent waste
CAA Clean Air Act
CatOx catalytic oxidation
CFR Code of Federal Regulations
CH4 methane
CO carbon monoxide
CO2 carbon dioxide
CO2e carbon dioxide equivalent
CUB central utility building
DAT deposition analysis threshold
DEQ (Oregon) Department of Environmental Quality
EPA U.S. Environmental Protection Agency
Fab fabrication area
Facility Ronler Acres and Aloha campuses
FGR flue gas recirculation
g/hp‐hr grams per horsepower‐hour
GHG greenhouse gas
HAP hazardous air pollutant
IC internal combustion
Intel Intel Corporation (applicant)
km kilometer
kV kilovolt
LAER lowest achievable emission rate
lb/hr pound per hour
lb/MMBtu pound per million British thermal units
LNB low NOx burner
µg/m3 microgram(s) per cubic meter
MAO Mutual Agreement and Order
MMBtu/hr million British thermal units per hour
NA not applicable
NAAQS National Ambient Air Quality Standards
NESHAP National Emission Standards for Hazardous Air Pollutants
NO nitric oxide
NO2 nitrogen dioxide

ACRONYMS AND ABBREVIATIONS
VIII ES111914104811PDX
NOx oxides of nitrogen
NSCR nonselective catalytic reduction
NSPS New Source Performance Standards
NSR New Source Review
O2 oxygen
OAR Oregon Administrative Rule
PM particulate matter
PM10 particulate matter less than 10 micrometers in aerodynamic diameter
PM2.5 particulate matter less than 2.5 micrometers in aerodynamic diameter
POTW publicly owned treatment works
POU point‐of‐use
ppm part per million
ppmvd part per million by volume, dry
PSD Prevention of Significant Deterioration
PSEL plant site emission limit
RACT reasonable available control technology
RBLC RACT/BACT/LAER Clearinghouse
RCTO rotor concentrator thermal oxidizer
RICE reciprocating internal combustion engines
SCR selective catalytic reduction
SER significant emission rate
SIL significant impact level
SNCR selective noncatalytic reduction
SO2 sulfur dioxide
SO3 sulfite
SOx oxides of sulfur
TMXW system Trimix ammonia wastewater treatment system
tpy ton(s) per year
VOC volatile organic compound

SECTION 1
ES111914104811PDX 1-1
Introduction This introductory section provides contextual background information and a summary of the application organization.
1.1 Background Intel Corporation (Intel) owns and operates two semiconductor manufacturing facilities in Oregon. One facility is located at 2501 NW 229th Avenue, Hillsboro, Oregon (Ronler Acres Campus). The second facility is located at 3585 SW 198th Avenue, Aloha, Oregon (Aloha Campus). Combined, the two campuses are the Facility that operates under a single Standard Air Contaminant Discharge Permit (ACDP), 34‐2681‐SI‐01, issued by the Oregon Department of Environmental Quality (DEQ) in 2007.
In February 2011, Intel began construction of a Facility expansion based on a Type 2 construction approval for the expansion issued December 20, 2010. An application for a Title V operating permit was submitted on April 12, 2012, in accordance with rules applicable at the time that required facilities with the potential to emit greater than 100,000 tons per year (tpy) of carbon dioxide equivalent (CO2e) to submit a Title V permit application.
In April 2014, DEQ entered into a Mutual Agreement and Order (MAO, No. AQ/AC‐NWR‐14‐027) with Intel. As part of the MAO, Intel is required to submit a Type 4 ACDP application by December 31, 2014.
This Type 4 ACDP application for the Facility addresses equipment identified in 2010, any equipment existing or planned for which construction approval was not obtained, and any additional equipment reasonably identifiable at this time for the Facility expansion. Other existing equipment is also addressed in this application to the extent needed to evaluate regulatory requirements such as ambient air quality impacts and Best Available Control Technology (BACT).
A vicinity map for the Facility is provided in Figure 1‐1, and a site plan for the Ronler Acres and Aloha campuses is provide in Figures 1‐2 and 1‐3, respectively.
1.2 Application Organization This ACDP application is organized as follows:
Section 1 introduces the project.
Section 2 provides a project description.
Section 3 provides emissions information, including a description of the manufacturing process, utility support systems, and associated air emission calculations.
Section 4 describes regulatory requirements.
Section 5 provides a BACT analysis.
Section 6 provides an ambient air quality impact analysis for criteria pollutants.
Section 7 contains a bibliography of documents cited in text.
Multiple appendixes are provided to support the application, consisting of required ACDP application forms in Appendix A, land use compatibility statements in Appendix B, emissions calculations in Appendix C, the road dust calculation methodology in Appendix D, BACT cost estimate and calculation data sheets in Appendix E, RACT/BACT/LAER Clearinghouse (RBLC) review results in Appendix F, and a criteria pollutant modeling protocol, with DEQ’s approval of the protocol, in Appendix G.

SECTION 1 INTRODUCTION
1-2 ES111914104811PDX
Intel’s point of contact for this ACDP application is as follows:
Name: Stephanie Shanley Title: Senior Environmental Engineer Telephone Number: (503) 613‐5950 E‐mail: [email protected]
FIGURE 1‐1 Vicinity Map

SECTION 1 INTRODUCTION
ES111914104811PDX 1-3
FIGURE 1‐2 Ronler Acres Campus Site Plan

SECTION 1 INTRODUCTION
1-4 ES111914104811PDX
FIGURE 1‐3 Aloha Campus Site Plan

SECTION 2
ES111914104811PDX 2-1
Project Description This section describes the proposed Facility expansion, semiconductor manufacturing operations, and manufacturing support operations.
In February 2011, Intel began construction of the Facility expansion based on a Type 2 construction approval for the expansion issued December 20, 2010. As part of the April 2014 MAO, Intel is required to submit a Type 4 ACDP application for the Facility for the following equipment:
Equipment identified in 2010
Any equipment existing or planned for which construction approval was not obtained
Any additional equipment reasonably identifiable at this time for the Facility expansion
Throughout this application, this equipment is referred to as “new project” equipment. Other existing equipment is also addressed in this application and is referred to as “preproject” equipment. The equipment emissions calculations in Appendix C provide installation dates or otherwise differentiate between “new project” and “preproject” equipment.
2.1 Semiconductor Manufacturing Operations The proposed project will employ additional semiconductor manufacturing operations similar to existing operations at the Facility. Semiconductor manufacturing begins with a silicon wafer substrate, followed by growth or application of various layers, patterning using photoresist, thermal diffusion, etching, doping, metallization, acid or solvent treatments, and ultrapure water rinse steps. Multiple processes occur, each with unique recipe steps. Many of these steps are repeated multiple times in various sequences and with variations in each step. Significant technology revisions will occur approximately every 2 years.
2.2 Manufacturing Support Operations The proposed project will employ the following additional manufacturing support utility systems:
Boilers
Emergency generators and fire water pumps
Cooling towers
Air pollution control systems
Air handling systems
Bulk chemical distribution systems
Water treatment systems
Chilled water and glycol distribution system
Bulk gas systems
Specialty gas systems
Wastewater collection and treatment
Solvent waste collection and storage
Facility monitoring and control system
Life safety systems
Administration offices and buildings
Additional information for manufacturing and support operations as related to sources of regulated air pollutants is provided in Section 3, Emissions Information.

This page intentionally left blank

SECTION 3
ES111914104811PDX 3-1
Emissions Information This section describes Intel’s semiconductor manufacturing processes, utility support systems, and air emission calculation methodologies, including sample calculations and air emission summary tables. Provided at the end of this section are the following process flow diagrams:
Figure 3‐1: Overall Process Flow Diagram
Figure 3‐2: Fab Source Process Flow Diagram
Figure 3‐3: Utilities Support Process Flow Diagram
3.1 Manufacturing Process Description Intel’s Facility uses silicon wafers to manufacture semiconductor devices for use in the computer industry. The Facility consists of buildings in which the devices are manufactured, typically referred to as “Fabs.” Manufacturing operations occur 24 hours a day and 365 days a year. However, production output varies with consumer demand and stage of process development.
Semiconductors are materials with an electrical conductivity between that of a conductor and an insulator. The manufacturing process occurs in a cleanroom environment to avoid micro contamination of the product. Semiconductors are fabricated in batches of silicon wafers and can take anywhere from one to two months to manufacture. The basic fabrication processes are oxidation, photolithography, etching, doping, and deposition. During the fabrication process, wafers are cycled through several steps with some steps repeated for various purposes at different points in the process. Emissions information for semiconductor manufacturing operations is provided in Section 3.3.7.
3.1.1 Oxidation Oxidation involves the generation of a silicon dioxide layer on the wafer surface to provide a base for the photolithography process. This layer also insulates and protects the wafer during subsequent processing. The silicon wafer surface oxidizes with steam or a gas such as oxygen to form additional semiconductor material.
3.1.2 Photolithography Photolithography is the process of imaging a circuit pattern onto a wafer. Photoresist material is spun onto the wafer to create an even layer of coating and then heat treated to remove any solvent remaining in the resist material. A photomask is placed over the wafer and light is projected through the voids in the photomask to form electrical patterns.
After exposure, the wafer is developed in a solution that dissolves the excess photoresist and is then rinsed to remove excess developer solution. The resulting wafer has a silicon dioxide layer exposed for the circuit pattern, with the rest of the wafer being covered with the remaining resist coating. Both the photoresist itself and the material used to remove excess photoresist from the edge of the wafer are organic solvents.
3.1.3 Etching Etching chemically removes unwanted materials from layers of the wafer. Wet chemical etching uses acidic solutions to etch the exposed layer of silicon dioxide at ambient or elevated temperatures.
In dry etching, etches are formed above the target layer by ionizing in a plasma field process gases under a vacuum. After etching, the remaining photoresist is removed using dry or liquid stripping compounds.

SECTION 3 EMISSIONS INFORMATION
3-2 ES111914104811PDX
3.1.4 Doping Following etch, the wafer typically moves on to a process where dopants are added to the wafer or layers. Dopants are impurities such as boron or phosphorus. Adding small quantities of these impurities to the wafer substrate alters its electrical properties. Implant and diffusion are two methods used to add dopants. During implant, a chemical is ionized and accelerated in a beam to velocities approaching the speed of light. Scanning the beam across the wafer surface implants the energized ions into the wafer. A subsequent heating step, termed annealing, is necessary to make the implanted dopants electrically active. Diffusion is a vapor phase process in which the dopant, in the form of a gas, is injected into a furnace containing the wafers. The gaseous compound breaks down into its elemental constituents on the hot wafer surface. Continued heating of the wafer allows diffusion of the dopant into the surface at controlled depths to form the electrical pathways within the wafer.
3.1.5 Deposition Deposition processes apply additional layers of silicon, silicon dioxide, or other materials to the wafer. Fluorinated gases are used to periodically clean the reaction chamber for those deposition processes. Due to safety and duct occlusion issues associated with the manufacturing operation, point‐of‐use (POU) devices are also used in deposition processes to condition the exhaust prior to routing the air stream to the facility’s centralized packed‐bed wet chemical scrubber system.
3.1.6 Planar Planar is a surface treatment process, which prepares the wafer for subsequent processing steps. A mildly corrosive chemical slurry is used as the polishing compound.
3.1.7 Cleaning Various organic and inorganic cleaners are used to clean equipment parts and quartz reaction chambers.
3.1.8 Auxiliary Steps Auxiliary steps include assembly, testing and packaging.
3.2 Utility Support Systems A number of utility systems support the manufacturing process. As they relate to potential sources of regulated air pollutants, these systems are described below.
3.2.1 Rotor Concentrator Thermal Oxidizers Volatile organic compound (VOC) emissions from the Fab, primarily the Lithography area, are routed to rotor concentrator thermal oxidizers (RCTOs). The RCTOs work by taking solvent‐laden air through a zeolite rotor concentrator where the VOCs are removed by adsorption for abatement. The rotor turns continuously transporting VOC‐laden Zeolite into an isolated regeneration zone where heated air is used to desorb the VOCs. The desorbate is now a highly concentrated airstream (typically 5 to 10 percent of the original exhaust volume) and is directed to a natural gas‐fired thermal oxidizer, which operates at temperatures in the combustion zone of approximately 1350 to 1450OF. The system is equipped with heat exchangers to lower the amount of supplemental natural gas required and thereby reduces oxides of nitrogen (NOx) and carbon monoxide (CO) emissions beyond that of straight thermal oxidizer systems. The primary heat exchanger is used to preheat the process air prior to combustion. The secondary heat exchanger is used to heat a slip stream of the process air that is used to regenerate the Zeolite rotor. The RCTOs are a source of natural gas combustion byproducts. Certain VOCs generated by the Fab are oxidized in the RCTOs and are emitted as PM2.5. VOCs that are not adsorbed by the Zeolite concentrator are also emitted by the RCTOs.
3.2.2 Packed-Bed Wet Chemical Scrubbers Acid gases conveyed by the Fab exhaust management system are routed to centralized packed‐bed water‐based wet scrubber systems. The scrubbers consist of a chamber containing packing material that provides a

SECTION 3 EMISSIONS INFORMATION
ES111914104811PDX 3-3
large surface area for liquid‐gas contact. The scrubbing liquid is introduced above the packing and flows down through the bed. Gases that are soluble in the scrubbing solution and have sufficient residence time in the chamber are absorbed and removed from the air stream. For inorganic acid gas control, a caustic such as sodium hydroxide is added to the solution to enhance the rate of absorption. Emissions of ammonia from the Fab are typically segregated from the acid gas stream and are controlled in scrubbers where sulfuric acid is introduced to the water in lieu of sodium hydroxide.
3.2.3 Boilers Boilers provide hot water to the various buildings and manufacturing processes. All of the Facility boilers are exclusively natural gas‐fired. Air emissions from the boilers are those associated with natural gas combustion including criteria pollutants and hazardous air pollutants (HAPs).
3.2.4 Emergency Generators and Fire Water Pumps Diesel fired generators are operated for testing and maintenance and are used in the event of an unplanned primary power outage. Diesel fired fire water pumps are provided in the event of a fire emergency. Air emissions from diesel combustion including criteria pollutants and HAPs are normally limited to periods when the emergency equipment is tested and maintained.
3.2.5 Cooling Towers The facility has mechanically induced (i.e. fan driven) wet cell cooling towers that are open to the atmosphere. The cooling towers are used to dissipate the heat loads generated by the Fab and to condition the incoming air to the correct temperature required by the Fab. Water treatment chemicals including biocides and anti‐scalants are added to the recirculating water system. The cooling towers are a source of particulate matter and a de minimis amount of HAPs.
3.2.6 Tanks Storage of raw chemicals and liquid waste occurs in multiple different tanks systems throughout the Facility. Solvent waste tanks are equipped with conservation vents to maintain safe internal tank pressures and to reduce vapor losses. Solvent waste tanks are vented to the RCTOs to control VOCs. Acidic and alkaline raw chemical and waste tanks are also fitted with conservation vents which exhaust to the facility’s scrubbers to control acidic and alkaline gases including HAPs.
3.2.7 TMXW Ammonia Treatment System The Trimix ammonia wastewater treatment (TMXW) system is an ammonia wastewater treatment system that includes gas‐phase ammonia abatement. Ammonia wastewater is pH adjusted and fed to an ammonia stripper. The ammonia stripper is a desorption process that removes ammonium ions out of the water to produce gas‐phase ammonia. The gas‐phase ammonia is exhausted to a two‐stage thermal catalytic oxidation/reduction system. The first catalyst converts ammonia to NOx and CO to CO2. The second catalyst converts NOx to nitrogen and water. Air emissions from this system include natural gas combustion byproducts and ammonia.
3.2.8 Bulk Specialty Solvent Waste System The bulk specialty solvent waste (BSSW) system stabilizes a solvent waste prior to offsite shipment. The treatment occurs in a tank that is exhausted to small natural gas‐fired thermal oxidizers. Air emissions from this system include natural gas combustion byproducts.
3.2.9 Fabrication (Clean Rooms) Building Air Handling The primary function of these systems is to replenish all clean room and process exhaust, provide clean room temperature and humidification control, and maintain positive atmospheric pressure within the Fab building.

SECTION 3 EMISSIONS INFORMATION
3-4 ES111914104811PDX
3.2.10 Bulk Chemical distribution High‐purity, high volume chemicals are distributed to the process equipment (tools) by a chemical distribution unit (CDU), through a distribution piping system. The CDUs are located in designated chemical distribution rooms. The bulk chemicals are usually received in 55‐gallon drums or 300‐gallon totes.
3.2.11 Ultrapure Water The ultrapure water (UPW) is produced from city water with equipment typically located in a Central Utility Building (CUB). The UPW equipment will include reverse osmosis and UPW makeup systems, primary and polish deionization systems, and subpolish deionization and distribution systems. The UPW will be used throughout the Fab, primarily for the rinsing of the wafer as part of multiple processing steps.
3.2.12 Rinsewater Reclaim Treatment This system collects several internally generated wastewaters for use as makeup to various process support systems including boilers, vacuum pumps, air pollution wet scrubbers, cooling towers, process tool uses, etc.
3.2.13 Chilled and Glycol Water Industrial chillers are also located in the CUB. The Glycol‐ chilled water chillers provide dehumidification for the various Fab makeup air handling units.
3.2.14 Bulk Gas Bulk gases are distributed throughout the Fab. These gases include: Nitrogen, Oxygen, Argon, Hydrogen, and Helium. Bulk gases are generated at the Facility by the liquefaction of air, delivered to the facility by truck as cryogenic liquids or delivered in compressed gas tube trailers.
3.2.15 Specialty Gas Systems Multiple specialty gas systems are provided to serve process equipment in the Fab. The cylinders are stored in designated rooms and cabinets.
3.2.16 Waste Collection and Treatment There are multiple waste collection systems which are designed to collect and store wastewater and other wastes from the Fabs prior to treatment and subsequent reuse, discharge or disposal.
3.2.17 Instrumentation and Control A Facility Monitoring and Control System integrates field instrumentation and standalone controlling distributed programmable logic controllers and instrumentation control systems. The Facility Monitoring and Control System will provide both monitoring and control for the mechanical and process systems which serve the Fab, CUB, and ancillary areas.
3.2.18 Life Safety LSS will include fire detection and alarm with voice evacuation and emergency telephone, gas monitoring and control, closed circuit television (CCTV), security access control, and Facility radio communications systems.
3.2.19 Point of Use Abatement Systems POU devices are used in a variety of manners within the Fabs to condition exhaust prior to routing the air stream to the pollution control systems. POU devices are typically driven by process and safety needs, but provide significant environmental benefits. Some POU devices have the benefit or co‐benefit of controlling process related greenhouse gas (GHG) emissions. Operation and location of GHG POU devices varies with process operations and configuration and are considered part of the Fab manufacturing process.

SECTION 3 EMISSIONS INFORMATION
ES111914104811PDX 3-5
3.3 Emission Calculations and Methodology This section describes the Facility emissions of regulated air pollutants, including sample calculations. Detailed calculation tables are provided in Appendix C. Equipment level emissions information is provided for the following:
Boilers
RCTOs
Emergency Generators and Fire Water Pumps
Cooling Towers
BSSW System
TMXW System
Fab Manufacturing Process
Miscellaneous Sources
A list of Categorically Insignificant Activities pursuant to Oregon Administrative Rule (OAR) 340‐200‐0020(20) is provided at the end of this section. Categorically Insignificant Activities are assessed for purposes of applicable requirements but are not a constituent of plant site emission limits (PSELs).
3.3.1 Boiler Emissions As a result of natural gas combustion the boilers are a source of criteria pollutant and HAP emissions. Boiler emission calculations are based on manufacturer’s data and the U.S. Environmental Protection Agency’s (EPA’s) “Compilation of Air Pollutant Emission Factors, Volume 1: Stationary Point and Area Sources,” also known as AP‐42. Assumptions used in calculating boiler air emissions include the following:
Hourly emissions assume the boilers are operating at maximum rated capacity.
Annual emissions are based on an annual operating capacity of 30%.
All particulate matter (PM) emissions are assumed to be particulate matter less than 2.5 micrometers in aerodynamic diameter (PM2.5).
A sample calculation for boiler emissions is provided below. Detailed emission calculation tables are provided in Appendix C.
= Emission Factor X Activity Rate
= hourly rate X hours per year X annual operating capacity
= 0.45 tpy
3.3.2 RCTO Natural Gas Combustion Emissions Using a zeolite concentrator and a natural gas‐fired thermal oxidizer, the RCTOs control VOC emissions from the Fabs. Similar to the boilers, as a result of natural gas combustion, the RCTOs are a source of criteria pollutants and HAP emissions. The same emission factor approach is used to calculate these emissions using engineering test data and AP‐42 emission factors. Assumptions used in estimating RCTO air emissions include the following:
Hourly emissions assume the RCTOs are operating at maximum rated capacity.

SECTION 3 EMISSIONS INFORMATION
3-6 ES111914104811PDX
Annual emissions are based on an annual operating capacity of 70 to 100% of maximum rated capacity.
All PM emissions are assumed to be PM2.5.
A sample calculation for RCTO emissions is provided below. Detailed emission calculation tables are provided in Appendix C.
= Emission Factor X Activity Rate
= hourly rate X hours per year X annual operating capacity
= 1.20 tpy
3.3.3 Emergency Generator and Fire Water Pumps The emergency generators and fire water pumps are powered by diesel fired internal combustion engines and during routine testing are a source of criteria pollutant and HAP emissions. Emission estimates are based on manufacturer emission rate data, manufacturer emission factors or AP‐42 emission factors. Assumptions used in estimating emergency generator and fire water pump air emissions include the following:
Hourly emissions assume the engines are operating at full load.
Annual emissions are based on the emergency generators operating for 30 hours per year.
Annual emissions are based on the fire water pumps operating for 50 hours per year.
A sample calculation for an emergency generator emissions is provided below. Detailed emission calculation tables are provided in Appendix C.
= Emission Factor X Activity Rate
= hourly rate X hours per year
= 0.70 tpy
3.3.4 Cooling Towers The total dissolved solids (TDS) entrained in drift droplets emitted from the cooling towers are a source of PM emissions. Overall PM emissions are estimated using the AP‐42 method of calculating drift particulate and the methods developed by Joel Reisman and Gordon Frisbie (Reisman and Frisbie, 2002) are used to estimate the particulate matter less than 10 micrometers in aerodynamic diameter (PM10) and PM2.5 fractions.
Using AP‐42 guidance, the total PM emissions are calculated as follows:

SECTION 3 EMISSIONS INFORMATION
ES111914104811PDX 3-7
PM = Water Circulation Rate X Drift Loss X TDS
Where:
Water Circulation Rate = Total recirculation rate through the cooling tower cell
Drift Loss = % of water circulated that is emitted as drift droplets from the cooling tower
TDS = Total Dissolved Solids concentration
PM10 and PM2.5 emissions are calculated as follows:
PM10 = PM X PM10 Factor (%)
PM2.5 = PM X PM2.5 Factor (%)
The primary assumptions used in estimating cooling tower PM10 and PM2.5 air emissions include the following:
Hourly emissions assume the cooling towers are operating at their maximum rated capacity recirculation rate and maximum TDS levels.
Annual emissions assume the cooling towers are operating at their average recirculation rate and average TDS levels.
A sample calculation for cooling tower emissions is provided below. Detailed emission calculation tables are provided in Appendix C.
= Water Circulation Rate X Drift Loss X TDS X PM10 Factor
PM10 and PM2.5 emissions from drift loss in the wet scrubbers are estimated using the same methodology as cooling towers and detailed emission calculation tables are also provided in Appendix C.
3.3.5 Bulk Specialty Solvent Waste System Each BSSW system includes a small natural gas‐fired thermal oxidizer. AP‐42 emission factors for external combustion of natural gas are used to calculate emissions of criteria pollutants and detailed emission calculation tables are provided in Appendix C.
3.3.6 TMXW System As described in Section 3.2, the TMXW system treats gas‐phase ammonia generated from a wastewater treatment operation. The gas‐phase ammonia is exhausted to a two‐stage, thermal catalytic oxidation/ reduction system. The first catalyst converts ammonia to NOx and CO to CO2. The second catalyst converts NOx to nitrogen and water.
Air emissions from this system include natural gas combustion byproducts and additional NOx from the oxidation of ammonia. AP‐42 emission factors are used to calculate emissions of criteria pollutants from natural gas combustion with the exception of CO and NOx. Emission factors for these pollutants were provided by the treatment system manufacturer. Detailed emission calculation tables are provided in Appendix C and additional information pertaining to emission calculations for CO and NOx is summarized as follows:

SECTION 3 EMISSIONS INFORMATION
3-8 ES111914104811PDX
The emission factor for CO provided by the treatment system manufacturer is 0.06 pounds per million British thermal units (lb /MMBtu) CO and it is conservatively assumed that 90 percent of the CO is removed across the first stage ammonia oxidation catalyst.
The emission factor for NOx emissions was established based on stoichiometric considerations and the highest expected loading rate of ammonia (the source of NOx upon existing the oxidation catalyst). The NOx emission rate is calculated to be 0.34 pound per hour (lb/hr).
3.3.7 Semiconductor Manufacturing Operations Semiconductor manufacturing operations are a source of criteria pollutants, HAPs, and GHGs. The emission calculations for these pollutants provided in Appendix C are based on chemical‐specific emission factors that have been previously approved by DEQ. The emission factors are derived from analytical testing of process tool exhaust, destruction/removal efficiencies of abatement systems and chemical mass balance. To calculate future Facility emission rates adjustments are made to account for changes in process technology and production volume.
In accordance with the April 2014 MAO, this application includes emission calculations for Fluorides and HF based on DEQ approved emissions testing as provided in the following sections.
3.3.7.1 Calculated Fluorides and HF Emissions Based on Source Test Data The April 2014 MAO requires Intel to conduct three rounds of testing for Fluorides and HF under a testing plan approved by DEQ. The first round of testing was required to be completed no later than July 1, 2014, and the second and third rounds must be completed by December 31, 2014, and December 31, 2015, respectively. The Facility Fluorides and HF emission calculations provided in this application are based on the first round (“MAO Round 1”) of testing, which is summarized in Table 3‐1.
TABLE 3‐1 MAO Round 1 Stack Test Results
Building Total Fluorides Emissions
(lb/hr) HF Emissions
(lb/hr)
D1D 0.1900 0.1588
D1X 0.0949 0.0820
Total D1D/X 0.2849 0.2408
D1C 0.0861 0.1003
RP1 0.0000 0.0063
D1B 0.0000 0.0132
RB1 0.0072 0.0320
Total D1B/C/RP1/RB1 0.0933 0.1518
F15 (Aloha) 0.0072 0.0670
Totals 0.3854 0.7335
Extrapolating source test data to calculate future potential Fluorides and HF emissions from each Fab building exhaust system involves a two‐step process. Each of these steps is described below. Detailed emission calculations are provided in Appendix C.
Step 1 – Adjusting Source Test Data to Account for Full Building Exhaust Flow Rates
Since the MAO Round 1 source testing program was performed on a representative subset of scrubbers from each building, the first step is used to calculate emissions from all scrubbers associated with that

SECTION 3 EMISSIONS INFORMATION
ES111914104811PDX 3-9
building’s air pollution control exhaust system. Source test emission rates are scaled up based on the ratio of the sum of design flow rates of the scrubbers operating during testing to the sum of the design flow rates of scrubbers tested:
Building Ratio
While the scrubbers were not tested at their design flow rates, the purpose of this step is to calculate emissions if all scrubbers had been simultaneously tested. As such, the ratio represents an appropriate scaling factor to represent calculated emissions during testing. Projecting future emissions associated with increased manufacturing and associated increases in exhaust flows is accounted for in Step 2.
Table 3‐2 provides the building‐specific ratios used to scale up source test data.
TABLE 3‐2 Building Ratios
Building Scrubber Number
Design Flow (scfm) Tested?
Operating During Test?
F15(Aloha) 1 60,000 Yes Yes
2 60,000 No Yes
3 85,000 Yes Yes
4 85,000 No Yes
5 60,000 Yes Yes
6 60,000 No No
Building Ratio = 350,000 cfm [design flow of the scrubbers operating during test]/205,000 cfm [design flow of the tested scrubbers] = 1.707
Building Scrubber Number
Design Flow (scfm) Tested?
Operating During Test?
D1B 1 55,000 Yes Yes
2 55,000 No No
3 55,000 No Yes
Building Ratio = 110,000/55,000 = 2.0
Building Scrubber Number
Design Flow (scfm) Tested?
Operating During Test?
RB1 C4 #1 45,000 Yes Yes
C4 #2 45,000 No No
C4 #3 55,000 Yes Yes
Planar #1 45,000 No Yes
Planar #2 45,000 No No
Planar #3 45,000 Yes Yes
Building Ratio = 190,000/145,000 = 1.31
Building Scrubber Number
Design Flow (scfm) Tested?
Operating During Test?
D1C 1 50,000 Yes Yes
2 50,000 No Yes
3 50,000 No No
4 50,000 Yes Yes

SECTION 3 EMISSIONS INFORMATION
3-10 ES111914104811PDX
TABLE 3‐2 Building Ratios
Building Ratio = 150,000/100,000 = 1.5
Building Scrubber Number
Design Flow (scfm) Tested?
Operating During Test?
D1D 1 50,000 Yes Yes
2 50,000 No Yes
3 50,000 Yes Yes
4 50,000 Yes Yes
5 50,000 No Yes
6 50,000 No No
Building Ratio = 250,000/150,000 = 1.667
Building Scrubber Number
Design Flow (scfm) Tested?
Operating During Test?
D1X 1 95,000 Yes Yes
2 95,000 No Yes
3 95,000 Yes Yes
4 95,000 No No
5 95,000 No No
Building Ratio = 285,000/190,000 = 1.5
Applying these ratios to the source test data (Table 3‐2), the total Fluorides and HF emissions occurring during the source test period for each building can be calculated. The scaled building emission rates are provided in Tables 3‐3 and 3‐4.
TABLE 3‐3 Calculated Building Fluoride Emission Rates During Testing
Building Tested Fluorides Emissions
(lb/hr) Scaled Fluorides Emissions
(lb/hr) Notes
D1D 0.1900 0.3167 Scaled up by 1.67
D1X 0.0949 0.1424 Scaled up by 1.5
Subtotal D1D/X 0.2849 0.4591
D1C 0.0861 0.1292 Scaled up by 1.5
RP1 0.0000 0.0000 Not applicable
D1B 0.0000 0.0000 Scaled up by 2.0
RB1 0.0072 0.0094 Scaled up by 1.310
Subtotal D1B/C/RP1/RB1 0.0933 0.1386
F15 (Aloha) 0.0072 0.0123 Scaled up by 1.707
Facility 0.3854 0.6100

SECTION 3 EMISSIONS INFORMATION
ES111914104811PDX 3-11
TABLE 3‐4 Total Scaled Building HF Emission Rates
Building HF Emissions
(lb/hr) Scaled HF Emissions
(lb/hr) Notes
D1D 0.1588 0.2647 Scaled up by 1.67
D1X 0.0820 0.1230 Scaled up by 1.5
Subtotal D1D/X 0.2408 0.3877
D1C 0.1003 0.1505 Scaled up by 1.5
RP1 0.0063 0.0126 Scaled up by 2.0
D1B 0.0132 0.0264 Scaled up by 2.0
RB1 0.0320 0.0419 Scaled up by 1.310
Subtotal D1B/C/RP1/RB1 0.1518 0.2314
F15 (Aloha) 0.0670 0.1144 Scaled up by 1.707
Facility 0.4596 0.7335
Step 2 – Allocate Source Test Data to Account for Process Activities Emitting Fluorides or HF and Technology
As indicated in Tables 3‐3 and Table 3‐4, emissions of Fluorides and HF are subtotaled by certain building groups. The buildings are linked to a process and individual semiconductor wafers are fabricated in multiple tools that reside in different buildings. As such, the building groups represent the process technology through which a wafer is processed. However, not all process manufacturing tools are sources of Fluorides or HF and one purpose of the emission inventory is to calculate emissions from each building exhaust system for use in ambient air dispersion modeling. To account for this, a Fluorides and HF process activity factor is applied to allocate emissions to each building exhaust system. The final adjustment is to account for changes in technology and production level projected to occur under future conditions. Tables 3‐5 and 3‐6 tabulate these adjustments and the final calculated Fluorides and HF emission rates for each building exhaust system once the full buildout of the Facility described by this application is complete.
The subtotaled, scaled emission rates from Tables 3‐3 and 3‐4 are multiplied by the process activity factor and technology/production factor to determine the projected building exhaust system emission rate.
TABLE 3‐5 Building Fluorides Emission Rates
Building Fluorides Process Activity Factor
Technology/Production Factor
Projected Building Exhaust System Fluorides Emissions After Full Buildout
(lb/hr) (tpy)
D1B 5.0%
2.57
0.0178 0.078
D1C 89.9% 0.3206 1.404
D1C EXAM 0.1% 0.0004 0.002
RB1 Planar 2.4% 0.0086 0.037
RB1 C4 2.4% 0.0086 0.037
RB1 EXAM 0.1% 0.0004 0.002

SECTION 3 EMISSIONS INFORMATION
3-12 ES111914104811PDX
TABLE 3‐5 Building Fluorides Emission Rates
Building Fluorides Process Activity Factor
Technology/Production Factor
Projected Building Exhaust System Fluorides Emissions After Full Buildout
RP1 0.1% 0.0004 0.002
Subtotal 100.0% 0.3566 1.562
D1D 49.80%
1.10
0.2526 1.106
D1D EXAM (south) 0.10% 0.0005 0.002
D1D EXAM (north) 0.10% 0.0005 0.002
D1X 49.90% 0.2531 1.109
D1X EXAM 0.10% 0.0005 0.002
Subtotal 100.0% 0.5072 2.222
D1X2 Emission Rate = D1X 0.2531 1.109
D1X2 EXAM Emission Rate = D1X EXAM 0.0005 0.002
D1X3 Emission Rate = D1X 0.2531 1.109
D1X3 EXAM Emission Rate = D1X EXAM 0.0005 0.002
MSB1 Emission Rate = 1/3 Aloha 0.0133 0.058
MSB2 Emission Rate = 1/3 Aloha 0.0133 0.058
MSB3 Emission Rate = 1/3 Aloha 0.0133 0.058
Subtotal 0.5470 2.396
Aloha 100% 3.29 0.0399 0.175
Total (tpy) 6.4
TABLE 3‐6 Building HF Emission Rates
Building HF Process
Activity Factor Technology/Production
Factor Project Building Exhaust System HF Emissions
After Full Buildout
(lb/hr) (tpy)
D1B 8.7%
2.39
0.0481 0.21
D1C 57.4% 0.3173 1.39
D1C EXAM 8.7% 0.0481 0.21
RB1 Planar 8.5% 0.0468 0.21
RB1 C4 8.5% 0.0468 0.21
RB1 EXAM 4.2% 0.0230 0.10
RP1 4.2% 0.0230 0.10
Subtotal 100.0% 0.55 2.42
D1D 45.00% 1.03 0.1789 0.78

SECTION 3 EMISSIONS INFORMATION
ES111914104811PDX 3-13
TABLE 3‐6 Building HF Emission Rates
Building HF Process
Activity Factor Technology/Production
Factor Project Building Exhaust System HF Emissions
After Full Buildout
D1D EXAM (south) 2.50% 0.0099 0.04
D1D EXAM (north) 2.50% 0.0099 0.04
D1X 45.00% 0.1789 0.78
D1X EXAM 5.00% 0.0199 0.09
Subtotal 100.0% 0.40 1.74
D1X2 Emission Rate = D1X 0.1789 0.78
D1X2 EXAM Emission Rate = D1X EXAM 0.0199 0.09
D1X3 Emission Rate = D1X 0.1789 0.78
D1X3 EXAM Emission Rate = D1X EXAM 0.0199 0.09
MSB1 Emission Rate = 1/3 Aloha 0.1166 0.51
MSB2 Emission Rate = 1/3 Aloha 0.1166 0.51
MSB3 Emission Rate = 1/3 Aloha 0.1166 0.51
Subtotal 0.7475 3.274
Aloha 100% 3.06 0.35 1.53
Total (tpy) 8.97
3.3.8 Miscellaneous Sources 3.3.8.1 Water Treatment The Facility produces UPW for use in semiconductor manufacturing operations.
3.3.8.2 Future Wastewater Treatment The Facility plans include a future wastewater treatment system. Unit operations for this system are still under development but it is anticipated the system may be a new source of hydrogen sulfide. Emission calculations are provided in Appendix C.
3.3.8.3 Specialty Exhaust Arsine gas is used in the manufacturing process. The arsine gas decomposes to arsenic particulate and remains upon certain manufacturing tool parts. During parts clean the residual particulate is vacuumed and exhausted to High Efficiency Particulate Air (HEPA) filters. Gas consumption information and emission calculations are provided in Appendix C.
3.3.8.4 Lime Silos Dry lime (calcium hydroxide) used in wastewater treatment operations is delivered to and stored in lime silos. During filling, the silos are a source of PM emissions as air is displaced by the lime being loaded. Each silo is equipped with a vent controlled by a fabric filter dust collector with a maximum average PM/PM10 outlet grain loading of 0.02 grains per cubic foot of air exhaust. Operating conditions and emission calculations for the lime silos are provided in Appendix C.

SECTION 3 EMISSIONS INFORMATION
3-14 ES111914104811PDX
3.3.8.5 Gas Analyzers A number of specialty gas analyzers generate hydrogen chloride emissions. Exhaust from the analyzers are controlled by POU wet fume scrubbers which discharge to the centralized packed bed wet chemical scrubber systems. Operating conditions and emission calculations for the gas analyzers are provided in Appendix C.
3.3.8.6 Road Dust Dust from vehicles traveling on paved and unpaved roads is a source of fugitive PM emissions. A detailed narrative of the calculation methodology to calculate emissions from road dust is provided in Appendix D and calculation tables are provided Appendix C.
3.3.9 Categorically Insignificant Activities The Facility operations include the following Categorical Insignificant Activities as defined in OAR‐340‐200‐0020(20):
a. Constituents of a chemical mixture present at less than 1% by weight of any chemical or compound regulated under divisions 200 through 268 excluding divisions 248 and 262 of this chapter, or less than 0.1% by weight of any carcinogen listed in the U.S. Department of Health and Human Service's Annual Report on Carcinogens when usage of the chemical mixture is less than 100,000 pounds/year
b. Evaporative and tail pipe emissions from onsite motor vehicle operation
c. Distillate oil, kerosene, and gasoline fuel‐burning equipment rated at less than or equal to 0.4 million British thermal units per hour (MMBtu/hr)
d. Natural gas and propane burning equipment rated at less than or equal to 2.0 MMBtu/hr
e. Office activities
f. Food service activities
g. Janitorial activities
h. Personal care activities
i. Groundskeeping activities including, but not limited to building painting and road and parking lot maintenance
j. Onsite laundry activities
k. Onsite recreation facilities
l. Instrument calibration
m. Maintenance and repair shop
n. Air cooling or ventilating equipment not designed to remove air contaminants generated by or released from associated equipment
o. Refrigeration systems with less than 50 pounds of charge of ozone‐depleting substances regulated under Title VI, including pressure tanks used in refrigeration systems but excluding any combustion equipment associated with such systems
p. Bench scale laboratory equipment and laboratory equipment used exclusively for chemical and physical analysis, including associated vacuum producing devices but excluding research and development facilities
q. Temporary construction activities
r. Warehouse activities

SECTION 3 EMISSIONS INFORMATION
ES111914104811PDX 3-15
s. Accidental fires
t. Air vents from air compressors
u. Air purification systems
v. Demineralized water tanks
w. Pretreatment of municipal water, including use of deionized water purification systems
x. Electrical charging stations
y. Fire brigade training
z. Instrument air dryers and distribution;
aa. Process raw water filtration systems
bb. Fire suppression
cc. Routine maintenance, repair, and replacement such as anticipated activities most often associated with and performed during regularly scheduled equipment outages to maintain a plant and its equipment in good operating condition, including but not limited to steam cleaning, abrasive use, and woodworking
dd. Electric motors
ee. Storage tanks, reservoirs, transfer and lubricating equipment used for ASTM grade distillate or residual fuels, lubricants, and hydraulic fluids
ff. Onsite storage tanks not subject to any New Source Performance Standards (NSPS), including underground storage tanks (UST), storing gasoline or diesel used exclusively for fueling of the facility's fleet of vehicles
gg. Natural gas, propane, and liquefied petroleum gas (LPG) storage tanks and transfer equipment
hh. Pressurized tanks containing gaseous compounds
ii. Emissions from wastewater discharges to publicly owned treatment works (POTW) provided the source is authorized to discharge to the POTW, not including onsite wastewater treatment and/or holding facilities
jj. Stormwater settling basins
kk. Fire suppression and training
ll. Paved roads and paved parking lots within an urban growth boundary
mm. Health, safety, and emergency response activities
nn. Emergency generators and pumps used only during loss of primary equipment or utility service due to circumstances beyond the reasonable control of the owner or operator, or to address a power emergency as determined by DEQ
oo. Noncontact steam vents and leaks and safety and relief valves for boiler steam distribution systems
pp. Noncontact steam condensate flash tanks
qq. Noncontact steam vents on condensate receivers, deaerators, and similar equipment
rr. Boiler blowdown tanks
ss. Industrial cooling towers that do not use chromium‐based water treatment chemicals
tt. Oil/water separators in effluent treatment systems

SECTION 3 EMISSIONS INFORMATION
3-16 ES111914104811PDX
uu. Combustion source flame safety purging on startup
3.4 Emissions Summary Table 3‐7 summarizes the Facility’s calculated annual emissions of regulated pollutants and identifies the requested plant site emission level (PSEL).
TABLE 3‐7 Calculated Annual Emissions of Regulated Air Pollutants in Tons Per Year
Source
Emissions Summary
CO NOx PM PM10 PM2.5 SO2 Fluorides HF Lead H2S VOC Total HAP CO2e
RCTOs 76.5 51.8 24.3 24.3 24.3 1.3 0 0 0.00026 0 d d d
Boilers 41.7 18.5 2.8 2.8 2.8 2.9 0 0 0.00056 0 d d d
BSSW 0.18 0.22 0.0055 0.0055 0.0055 0.0057 0 0 0.0000011 0 d d d
TMXW 1.1 12.0 0.09 0.09 0.09 0.09 0 0 0.000018 0 d d d
Manufacturing 44.5 11.9 6.3 3.6 0.21 11.4 6.4 8.97 0.00014 0 d d d
Fugitive Emissionsa, b 0 0 3.53 0.95 0.10 0 0 0 0 0 d d d
Misc. Sources 0 0 0.0078 0.0078 0.0042 0 0 0 0 0.56 d d d
Totals 164.0 94.4 37.2 31.8 27.5 15.8 6.4 8.97 0.00098 0.56 178 24 819000
Requested PSEL 164 95 38 32 28 39 6.4 9 c c 178 24 819000
Notes:
a Fugitive emissions are those associated with vehicle travel on unpaved roads. b Fugitive emissions associated with vehicle travel on paved roads are a Categorically Insignificant Activity as defined in OAR 340‐200‐0020(20) and consistent with OAR 340‐222‐0070(1), plant site emission limits do not include emissions from Categorically Insignificant Activities. c Emissions of lead and H2S are below de minimis emission levels and PSELs are not required. dIntel is not requesting a revised PSEL for VOC, total HAP, or CO2e. The PSELs proposed in the table are the same as those provided in the Title V Permit Application no. 26799.

Form AQ102, Item 4Figure 3-1: Overall Process Flow Diagram
Facility Operations Type 4 Air Contaminant Discharge Permit Application
ES091114132533PDX 483524.02.02 Rv4 09-12-14
FabPOU Devices
OxidationPhotolithography
EtchingDepositionCleaning
Wipedown
Semi-Conductor
Devices
Chemicals (liquid and gas)
Production Material (wafers)
Natural Gas
Wastewater Solid and Liquid Waste
UtilitiesBoilers ChillersCooling Towers
Water PurificationAcid Waste
NeutralizationWastewater Treatment
Ammonia Treatment System (TMXW)BSSW Treatment
SystemEmergency Generators
Fire Water PumpsTanks
Natural Gas
Chemical Refrigerants
Wastewater
Steam Hot Water
Purified Water Chilled Water

This page intentionally left blank

Form AQ102, Item 4Figure 3-2: Fab Source Process Flow Diagram
Facility Operations Type 4 Air Contaminant Discharge Permit Application
ES091114132533PDX 483524.02.02 Rv4 09-12-14
FabPOU Devices
OxidationPhotolithography
EtchingDepositionCleaning
Wipedown
Semi-Conductor
DevicesChemicals
(liquid and gas) Production
Material (wafers)
Natural Gas
Natural Gas
Wastewater
Hot Water Purified Water Chilled Water
Thermal Oxidizer
Wet Scrubber
Liquid Waste Collection
Solid Waste Collection
Emergency Power
To CUBFrom CUB
Recycle/ Disposal
Tank Emissions
Recycle/ Disposal
Water To AWN
Wipedown VOC
VOCs HAPs
Particulate MatterCombustionEmissions
PFCs
CombustionEmissions
VOCs HAPs

This page intentionally left blank

Form AQ102, Item 4Figure 3-3: Utilities Process Flow Diagram
Facility Operations Type 4 Air Contaminant Discharge Permit Application
ES091114132533PDX 483524.02.02 Rv4 09-12-14
Recycle/ Disposal
Publically Owned
Treatment Works
UtilitiesBoilers
TMXW Treatment System
BSSW Treatment SystemChillers
Cooling TowersWater Purification
WastewaterAcid Waste
Neutralization (AWN)Tanks
Diesel Engines (generators and fire pumps)
Hot Water Purified Water Chilled Water
To Fab
From Fab
Tank Emissions
VOC and HAP
Cooling Tower Particulate Matter
CombustionEmissions
from Boilers, TMXW, BSSW and Engines
Natural Gas
Refrigerants
Wastewater
Neutralization Chemicals
Water and Biocide Treatment
Chemicals
Diesel Fuel

This page intentionally left blank

SECTION 4
ES111914104811PDX 4-1
Regulatory Requirements This section describes the regulations applicable to the proposed project. The applicability determination conducted in this analysis is pursuant to the New Source Review (NSR) regulations, National Emission Standards for Hazardous Air Pollutants (NESHAP), NSPS, Clean Air Act (CAA) Title V Operating Permit, and CAA Chemical Accident Prevention programs.
4.1 Major New Source Review (NSR) The DEQ administers Oregon’s Major NSR program (OAR Chapter 340, Division 224) pursuant to EPA approved state implementation plan. Oregon’s major NSR program actually consists of three different programs whose applicability depends on the present and/or past status of attainment of National Ambient Air Quality Standards (NAAQS). In attainment areas (i.e., areas designated as achieving the NAAQS or as unclassifiable), Oregon’s attainment NSR program (Prevention of Significant Deterioration or PSD) applies to “major modifications” at “Federal Major Sources.”1 A major modification at a Federal Major Source must satisfy the PSD requirements enumerated in OAR 340‐224‐0070. Within maintenance areas (i.e., areas previously designated as nonattainment for a NAAQS but which subsequently attain the standard), the program applies to each major modification of a maintenance pollutant which must comply with the maintenance area NSR requirements at OAR 340‐224‐0060. Within nonattainment areas (i.e., areas designated as nonattainment for a NAAQS), each major modification of a nonattainment pollutant must comply with the nonattainment area NSR requirements at OAR 340‐224‐0050. The modifications proposed by Intel will be subject to Oregon’s maintenance area NSR requirements, as detailed below.
4.1.1 Prevention of Significant Deterioration NSR The proposed modifications do not trigger requirements of Oregon’s PSD program because the Intel Facility is not a Federal Major Source. The Intel Facility is located in an area designated as in attainment for all criteria pollutants except for CO and ozone, for which the area is designated as maintenance. The evaluation of whether Oregon’s PSD program applies to the Facility starts with whether the Facility qualifies as a Federal Major Source. A Federal Major Source is a source with the potential to emit more than 100 tpy of any individual regulated pollutant (excluding hazardous air pollutants) if that source falls within one of the source categories listed at OAR 340‐200‐0020(55) or 250 tpy of any individual regulated pollutant (excluding hazardous air pollutants) if that source does not fall within one of the enumerated source categories. Certain source categories apply on a facility‐wide basis (e.g., kraft pulp mills or portland cement plants) while other categories apply specifically to the enumerated equipment type (e.g., fossil fuel‐fired boilers, or combinations thereof, totaling more than 250 MMBtu heat input). Greenhouse gases are regulated under the CAA, but are not a pollutant that is considered for determining whether a source is a Federal Major Source.2
The Intel Facility is not within any of the source‐wide enumerated categories in OAR 340‐200‐0020(55). Therefore, because the potential to emit of the plant as a whole will be limited to less than 250 tpy for each regulated pollutant, the facility as a whole is not a Federal Major Source.
The Facility has aggregate fossil fuel‐fired boiler capacity in excess of 250 MMBtu per hour heat input. One of the designated source categories for purposes of identifying Federal Major Sources is “fossil fuel fired
1 Because the Facility is an existing source, this analysis does not address Major NSR applicability as it relates to wholly new sources.
2 On November 5, 2014, the Oregon Environmental Quality Commission adopted temporary regulations excluding greenhouse gases from consideration in determining whether a source is a Federal Major Source.

SECTION 4 REGULATORY REQUIREMENTS
4-2 ES111914104811PDX
boilers, or combination thereof, totaling more than 250 million BTU per hour heat input.” Therefore, the fossil fuel‐fired boilers must be evaluated to determine if these constitute a Federal Major Source. Consistent with EPA guidance, the boilers are evaluated independently of the Facility as a whole based on the boilers being a “nested source” or “source within a source.” This EPA guidance recognizes that listed source categories can exist within an unlisted source category. A source cannot hide a listed source category thereby making it subject to the 250 tpy threshold. Conversely, the presence of a listed source category does not make the entire facility subject to the 100 tpy threshold. As EPA has explained:
In other words, a source subject to the 100 TPY applicability test that emits greater than 100 TPY is subject to the PSD requirements even if that source is located within a facility for which the primary activity is subject to a 250 TPY applicability threshold and emits less than 250 TPY. In this situation, only the source that exceeds its applicability threshold is subject to PSD, not the entire facility.3
This guidance means that the fossil fuel‐fired boilers are in aggregate subject to the 100 tpy PSD threshold while the parent facility is subject to the 250 tpy threshold. The primary pollutants emitted by the fossil fuel‐fired boilers are NOx (an attainment pollutant) and CO (a maintenance pollutant). The NOx and CO potential to emit attributable to the fossil fuel‐fired boilers is 22.6 tpy and 45.3 tpy respectively4. Intel is requesting that DEQ impose a 99 tpy limit on NOx and CO emissions from the fossil fuel‐fired boilers at the Facility. Because the NOx and CO potential to emit from the fossil fuel‐fired boilers will be limited to less than 100 tpy, the fossil fuel‐fired boilers are not a Federal Major Source.
PSD applies to a Federal Major Source. As neither the facility as a whole nor the fossil fuel‐fired boilers qualify as a Federal Major Source, the proposed modifications to the Facility are not subject to PSD program requirements. Facility emission rates associated with the Federal Major Source applicability threshold of 250 tpy are provided in Table 4‐1.
TABLE 4‐1 Facility Emission Rates (tpy)
Pollutant Proposed PSEL
Natural Gas Equipment < 2.0
MMBtu/hr
Emergency Generators and Firewater Pump
Engines Cooling Towers
Other Insignificant Activities
Paved Road Dust Emissionsa Totalsb
PM 38 1.1 0.84 9.8 1.0 1.7 52.4
PM10 32 1.1 0.84 8.0 1.0 0.34 43.3
PM2.5 28 1.1 0.84 0.035 1.0 0.083 31.1
SO2 39 1.2 0.037 0 1.0 0 41.2
CO 164 54.5 8.9 0 1.0 0 228.4
NOx 95 59.5 41.9 0 1.0 0 197.4
VOC 178 * c c c 0 178
aPaved road dust emissions are those associated with vehicle travel on paved roads. Emissions from unpaved roads are included in the PSEL.
bReflects the sum of the emissions subject to the PSEL requirements (see Table 3‐7) and the emissions attributable to categorically insignificant activities. Categorically insignificant activity emissions are not included for PSEL computation but they are included for the determination of PSD applicability (OAR 340‐222‐0070).
cIntel is not requesting a revised PSEL for VOC. The PSELs proposed in the table are the same as those provided in the Title V Permit Application no. 26799.
3 March 24, 1995, letter from EPA Region 3 to Henry Nickel on behalf of Consolidation Coal Company.
4 Emissions of categorically insignificant boilers are included in this NOx and CO emission estimate.

SECTION 4 REGULATORY REQUIREMENTS
ES111914104811PDX 4-3
4.1.2 Maintenance Area NSR The proposed modifications trigger requirements of Oregon’s maintenance area NSR program. Maintenance area NSR requirements are triggered for each major modification of a maintenance pollutant. A major modification is defined at OAR 340‐200‐0020(71) as any physical change or change in the method of operation of a source that results in both (a) a PSEL exceeding the netting basis by a significant emission rate (SER) or more, and (b) accumulated increases in actual emissions since the applicable baseline period that equal or exceed the applicable SER for a maintenance air pollutant. Major modifications for ozone precursors (NOx and VOC) constitute major modifications for ozone. A major modification of a maintenance pollutant must comply with the maintenance area NSR requirements at OAR 340‐224‐0060.
The Facility must be evaluated in relation to Oregon’s maintenance area NSR program because it is located within the Oregon portion of the Portland‐Vancouver Interstate Maintenance Area for ozone and the Portland Maintenance Area for CO. The Facility will be subject to Oregon’s maintenance area NSR requirements because the accumulated increases in NOx and CO since the baseline period will require a PSEL in excess of the applicable SER over the netting basis for each pollutant. The Facility is not subject to maintenance area NSR for VOC as the requested PSEL does not exceed the netting basis by an SER or more. The maintenance area NSR requirements applicable to the Facility are addressed below.
4.1.2.1 Best Available Control Technology Oregon’s maintenance area NSR program requires that BACT be applied to a proposed major modification for a maintenance pollutant or precursor. BACT applies separately to each maintenance pollutant or precursor that is emitted at, or above, its SER over the netting basis. The Oregon maintenance area program is significantly more stringent than its federal counterpart, as BACT must be determined retroactively for units that are outside the current project (the modification undergoing permitting). Specifically, the Oregon maintenance area NSR program requires that BACT be determined for each emissions unit that emits the maintenance pollutant or precursor and that either (a) was not part of the netting basis, or (b) was included in the most recent netting basis, but has been modified and the modification resulted in an increase in actual emissions above the portion of the most recent netting basis attributable to the emissions unit for the maintenance pollutant or precursor. In determining retroactive BACT (i.e., for changes made prior to those covered by the current project), the technical and economic feasibility of retrofitting the emission unit can be considered if the change was made in compliance with NSR requirements in effect when the change was made and no limit is being relaxed that was previously relied on to avoid NSR. Retroactive BACT need not be applied where the modification to an individual emission unit has been previously constructed consistent with DEQ requirements in place at the time and where the modification, if constructed in the past 5 years was part of a discrete, identifiable larger project with emissions less than 10 percent of the SER.
Oregon’s maintenance area NSR program requires Intel to apply BACT for CO and NOx, since the Facility is requesting a PSEL for each of these maintenance pollutants or precursors at a level that exceeds the netting basis by more than the SER. Intel has prepared this control technology analysis, included as Section 5 of this application. Each emission unit was evaluated for whether BACT applies and, if so, whether retrofit cost and technical feasibility can be included in the assessment. Based on these determinations, the analysis demonstrates what constitutes BACT for each emission unit that will emit CO and NOx and is subject to the requirement to implement BACT.
4.1.2.2 Ambient Air Quality Impacts Analysis The Facility must provide an air quality impacts analysis for maintenance pollutants the Facility will emit at an SER over the netting basis in accordance with OAR 340‐225‐0050(1) and (2), and 340‐225‐0060.5 This air quality impacts analysis consists of a Class I increment analysis and Class II NAAQS and increment analysis. 5 OAR 340‐224‐0060(3)

SECTION 4 REGULATORY REQUIREMENTS
4-4 ES111914104811PDX
However, because there is no increment established for ozone or CO, and Oregon recognizes that single source ozone formation modeling is not practicable, only a CO NAAQS analysis is required. A CO air dispersion modeling protocol was submitted to, and approved by, DEQ outlining the modeling methodology used to evaluate the Facility impacts to air quality with respect to the CO NAAQS. That analysis is provided in the Ambient Air Quality Analysis section, Section 6, of this document.
The dispersion modeling completed by Intel demonstrates that the potential impacts from the Facility CO emissions will comply with the NAAQS at federally designated Class I and Class II areas. The results of that modeling demonstrate that the proposed modifications will not cause or contribute to a NAAQS exceedance.
4.1.2.3 CO and NOx Net Air Quality Benefit The Facility must demonstrate how a net air quality benefit will be achieved in the ozone and CO maintenance areas in which the Facility is located. Pursuant to OAR 340‐224‐0060(2)(b), Intel intends to satisfy this requirement for NOx and CO by obtaining an allocation from DEQ’s growth allowance bank. Specifically, Intel requests that DEQ allocate the amount of CO and NOx specified in Table 4‐2 from the state’s bank of available growth allowances to fully offset the Facility’s CO and NOx potential to emit:
TABLE 4‐2 Requested Growth Allowance Allocation
Pollutant Requested Allocation
(tons)
CO 228.4
NOx 197.4
The requested growth allowance allocation is appropriate under OAR 340‐224‐0440 because (1) DEQ’s allowance bank contains sufficient CO and NOx emissions to fulfill the request, and (2) the Facility will not use more than 50 percent of the remaining growth allowance for any pollutant or more than 1,000 tons of NOx.6
4.1.3 Nonattainment Area NSR The Facility is located in an area that is in attainment for all criteria air pollutants. Therefore, nonattainment area NSR does not apply.
4.1.4 Minor Source NSR Minor source NSR applies to those pollutants for which the area is in attainment of the particular NAAQS and where a non‐Federal Major Source is requesting a PSEL that exceeds the netting basis by an SER or more. If located within an attainment or unclassifiable area, Intel must demonstrate compliance with the NAAQS and PSD increments by conducting an air quality analysis demonstrating that the requested PSEL will not result in the exceedance of a NAAQS or PSD increment.7 Table 4‐3 compares requested PSELs to the netting basis.
6 On November 19, 2014, George Davis (DEQ) informed Stephanie Shanley (Intel) that 466 tons of NOx growth allowance and 2,057 tons of CO growth allowance currently are available for distribution.
7 OAR 340‐222‐0041(3)(b)(C)

SECTION 4 REGULATORY REQUIREMENTS
ES111914104811PDX 4-5
TABLE 4‐3 Comparison of Requested PSELs to Netting Basis
Pollutant Netting Basis
(tpy) Requested PSEL*
(tpy) Difference
(tpy) SER (tpy)
Modeling Required?
PM10 0 32 32 15 Yes
Direct PM2.5 5 28 23 10 Yes
PM2.5 Precursors 5 95 (NOX) 90 40 Yes
5 39 (SO2) 34 40 No
NOx 4 95 91 40 Yes
SO2 14 39 25 40 No
VOC 139 178 39 40 No
Fluorides 1 6.4 5.4 3 Yes
*Consistent with OAR 340‐222‐0070(1), PSELs do not include emissions from categorically insignificant activities.
As can be seen by Table 4‐3, modeling is required under the Minor NSR rules for PM10, PM2.5, NOx (as a PM2.5 precursor), NOx (as NO2) and Fluorides. Modeling comparing the proposed project emissions to the NAAQS and PSD increments was performed for PM10, PM2.5, and NO2. While not required by DEQ rules, emissions from certain categorically insignificant activities including cooling towers, emergency generators and natural gas‐fired equipment rated at less than or equal to 2.0 MMBtu/hr were included in the modeling demonstration in this application. No NAAQS or PSD increment has been established for Fluorides, and, therefore, no modeling is required in order to obtain the requested PSEL.
4.2 New Source Performance Standards (NSPS) EPA has promulgated pollutant performance standards for a broad range of source categories under 40 Code of Federal Regulations (CFR) Part 60. DEQ has adopted these NSPS requirements by reference.8 The following is a discussion of the NSPS regulations relevant to the Facility requested modifications:
4.2.1 NSPS Subpart A – General Provisions The general provisions set forth in Subpart A apply to owners or operators of stationary sources subject to NSPS. Because NSPS will apply to affected sources at the Facility, Intel will be subject to and comply with the applicable Subpart A provisions.
4.2.2 NSPS Subpart Dc – Standards of Performance for Industrial-Commercial-Institutional Steam Generating Units
The Subpart Dc NSPS applies to steam generating units with a maximum design heat input capacity between 10 and 100 MMBtu/hr that commence construction after June 9, 1989.9 Intel is proposing to add several natural‐gas‐fired boilers that are considered steam generating units and that will have a design heat input capacity between 10 and 100 MMBtu/hr heat input. The boilers addressed in this application will all commence construction after June 9, 1989. Therefore, the Subpart Dc NSPS will apply to the boilers being permitted as part of this application. Subpart Dc does not establish emission standards for natural gas‐fired units. Thus, the only Subpart Dc requirements applicable to the boilers included in the proposed project are
8 OAR 340‐238‐0060
9 40 CFR § 60, Subpart Dc

SECTION 4 REGULATORY REQUIREMENTS
4-6 ES111914104811PDX
an initial notification requirement and a requirement to keep records of the volume of natural gas fuel combusted in the unit.10
4.2.3 NSPS Subpart IIII – Standards of Performance for Stationary Compression Ignition Internal Combustion Engines
The Subpart IIII NSPS applies to stationary compression ignition internal combustion engines that commence construction after July 11, 2005 where the engine is either (a) manufactured after April 1, 2006 and is not a fire pump engine or, (b) manufactured as a certified national Fire Protection Association fire pump engine after July 1, 2006.11 The proposed project includes several stationary compression ignition internal combustion engines subject to Subpart IIII classified as “emergency” engines. The Facility will comply with Subpart IIII, for applicable engines, by purchasing engines certified by the manufacturer, by installing and configuring the engine per the manufacturer’s specifications, and by operating and maintaining the engine consistent with the manufacturer’s instructions. Further, the Facility will only burn low sulfur fuel (maximum sulfur content of 15 parts per million (ppm)) in these engines. Finally, the Facility will limit the use of these engines to emergency situations and as required for testing and maintenance.
4.3 National Emissions Standards for Hazardous Air Pollutants (NESHAP)
The NESHAP, as established in 40 CFR Part 63, control hazardous air pollutant (HAP) emissions from major and specified area sources. A HAP major source is a facility with the potential to emit 10 tpy of a single HAP or 25 tons of total HAPs. An area source is a source that is not a HAP major source. The Facility is, and after the proposed modifications, will remain an area source of HAP and, therefore, will not be subject to the NESHAP that are applicable to major HAP sources. The two area source NESHAP that are potentially applicable to the affected sources at the Facility are discussed below.
4.3.1 NESHAP Subpart ZZZZ NESHAP Subpart ZZZZ establishes emissions and operating limits for HAP emitted from stationary reciprocating internal combustion engines (RICE) located at major and area HAP sources.12 The proposed project includes stationary emergency RICE that are subject to Subpart ZZZZ. Consistent with 40 CFR § 63.6590(c), the Facility will satisfy Subpart ZZZZ requirements for these engines by meeting the NSPS Subpart IIII requirements for that unit.
4.3.2 NESHAP Subpart JJJJJJ NESHAP Subpart JJJJJJ applies to industrial, institutional, and commercial boilers at area sources.13 The boilers in the proposed project are potentially subject to Subpart JJJJJJ. However, because all of the Facility boilers meet the definition of “gas‐fired boilers” as defined in 40 CFR § 63.11237, none of the boilers are subject to Subpart JJJJJJ.14
10 40 CFR §§ 60.48c(a) and 60.48c(g)
11 40 CFR §60, Subpart IIII
12 40 CFR § 63, Subpart ZZZZ
13 40 CFR § 63, Subpart JJJJJJ
14 40 CFR § 63.11195(e)

SECTION 4 REGULATORY REQUIREMENTS
ES111914104811PDX 4-7
4.4 Oregon Title V Operating Permit Program (Implementing Title V of the Clean Air Act)
The Facility will be a major source of criteria air pollutants as defined by the CAA Title V. Intel submitted an Oregon Title V Operating Permit (Title V permit) application on April 12, 2012. A Title V operating permit has not yet been issued for the Facility. Intel intends to submit a revised application for a Title V permit after issuance of this air construction permit to reflect the changed conditions.15
4.5 Chemical Accident Prevention Program EPA’s Chemical Accident Prevention regulations, established pursuant to CAA Section 112(r), address the accidental release of regulated substances from stationary sources. EPA’s regulations apply to sources with processes that have more than a threshold quantity of the toxic and flammable substances listed under Section 112(r).
The Facility uses regulated chemicals in excess of the threshold quantity identified in Section 112(r) and complies with applicable portions of the Chemical Accident Prevention regulations including conducting a hazard assessment and implementing a prevention and emergency response program.
15 OAR 340‐218‐0040(1)(a)(B)

This page intentionally left blank

SECTION 5
ES111914104811PDX 5-1
Best Available Control Technology Analysis 5.1 Introduction This section provides a BACT analysis for the Facility. Generally, the information is presented as follows:
BACT Applicability
BACT Analysis for New Equipment
Summary of Proposed BACT for New Equipment
Retroactive BACT Analysis for Existing Equipment
Summary of Proposed BACT for Existing Equipment
5.2 BACT Applicability This section identifies the pollutants to which BACT applies and the emission units which generate those pollutants.
5.2.1 Applicable Pollutants DEQ’s Major NSR rules (OAR‐340‐224) include provisions for sources located in nonattainment areas (340‐340‐224‐0050), maintenance areas (340‐224‐0060), and attainment or unclassified areas (340‐224‐0070). To determine which pollutants are subject to BACT (or LAER), each of these sections need to be evaluated taking into consideration the area’s attainment status and the sources emission rate.
5.2.1.1 OAR 340-224-0050 Requirements for Sources in Nonattainment Areas The Facility is not located in an area that is classified as nonattainment area for any pollutant and so this section does not apply.
5.2.1.2 OAR 340-224-0060 Requirements for Sources in Maintenance Areas The Facility is located in a maintenance area for ozone and CO. Proposed major sources and major modifications involving a maintenance pollutant, including VOC or NOx, in a designated ozone maintenance area and CO in a designated CO maintenance area must apply BACT. A project that requests a PSEL that exceeds the netting basis by an amount equal to or greater than the SER is considered to be a major modification. Intel is requesting a PSEL that meets these criteria for NOx and CO and must apply BACT to those emissions.
5.2.1.3 OAR 340-224-0070 PSD Requirements for Sources in Attainment or Unclassified Areas
This section applies to “Federal Major Sources.” The Facility is not a federal major source so this section does not apply.
5.2.2 Criteria for Emission Unit BACT Applicability Discerning the affected emissions unit or pollutant emitting activity to which the BACT analysis applies requires an applicability determination based on the Oregon Administrative Rules. BACT applicability is described forthwith. For convenience and constructive understanding, the BACT applicability criteria is described in terms of certain equipment groupings as described below.

SECTION 5 BEST AVAILABLE CONTROL TECHNOLOGY ANALYSIS
5-2 ES111914104811PDX
“Project” Equipment
Oregon’s unique maintenance area NSR program requires that BACT be applied to each component of the major modification, which includes:
Equipment that was proposed for construction as part of the 2010 project construction approvals and additional equipment now being proposed to reflect refined information about Intel’s future plans for Facility site development.
Equipment for which a notice of intent to construct has not yet been submitted.
“Preproject” Equipment (Retroactive ‐BACT)
Oregon’s unique maintenance area NSR program also requires that BACT be applied to each existing emission unit that emits the maintenance pollutant (or precursor) and that meets one of the following two criteria:
The emission unit is not included in the most recent netting basis established for that pollutant; or
The emission unit is included in the most recent netting basis but has been modified and the modification resulted in an increase in actual emissions above the portion of the most recent netting basis attributable to the emissions unit or the maintenance pollutant or precursor(s)
Where an emission unit that emits the maintenance pollutant (or precursor) has been modified and the modifications to that individual emission unit increased the potential to emit of the maintenance pollutant (or precursor) by less than 10 percent of the SER, then the emission unit is not subject to retroactive BACT for the maintenance pollutant (or precursor) unless the emission unit meets one of the following criteria in OAR 340‐224‐0060 which indicates the following:
“Modifications to individual emissions units that increase the potential to emit less than 10 percent of the significant emission rate are exempt from this section unless:
a. The emission unit is not constructed yet;
b. The emission unit is part of a discrete, identifiable larger project that was constructed within the previous 5 years and it has the potential to emit equal to or greater than 10 percent of the significant emission rate; or
c. The emission unit was constructed without, or in violation of, the Department's approval.”
In addition, equipment that was permitted during the baseline period but not installed is not subject to the BACT requirement, unless it was subsequently modified
5.2.3 Evaluation of Equipment Requiring BACT Pollutants triggering a BACT analysis as a result of the modifications proposed in this application are CO and NOx. The following is an evaluation of BACT applicability to identify emission units subject to BACT applying the previously discussed criteria and information.
5.2.4 “New Project” Equipment Table 5‐1 identifies proposed new project equipment subject to BACT and their respective pollutants. A detailed equipment and emission unit list is provided in Appendix E.

SECTION 5 BEST AVAILABLE CONTROL TECHNOLOGY ANALYSIS
ES111914104811PDX 5-3
TABLE 5‐1 Proposed New Equipment Subject to BACT including Regulated Pollutants
Equipment NOx CO
Natural Gas‐fired Boilers X X
Natural Gas‐fired RCTOs X X
Diesel Fired Emergency Generators X X
TMXW Abatement System X X
Fab Tools Including Natural Gas‐fired Point‐of‐Use Abatement Devices
X X
Small Natural Gas‐fired Heating Units and Boilers (< 2 MMBTU)a
X X
a The Facility includes multiple small indirect natural gas‐fired comfort air heating systems and small natural gas hot water boilers. These units are used in personnel spaces and not to directly support manufacturing. Their overall emissions are negligible compared to manufacturing support systems. Proposed NOx and CO BACT for these units is the use of natural gas.
5.2.5 Preproject Equipment (Retroactive - BACT) As described in Section 5.2.2 BACT also applies to NOx and CO emissions for “preproject” equipment if modifications to individual emissions units increase the potential to emit more that 10 percent of the SER. Ten percent of the SER for NOx and CO is 4 tpy and 10 tpy, respectively. Table 5‐2 summarizes equipment level BACT applicability for preproject equipment. The BACT analyses for the equipment identified in Table 5‐2 is provided in Section 5.5. Using the same emission calculation methodologies described in Section 3, the calculated emission unit emission rates for preproject equipment is provided in Table 5‐3. Table 5‐3 indicates certain RCTOs, boilers, and Fab operations are subject to BACT for NOx and CO emissions.
TABLE 5‐2 Preproject Equipment Subject to BACT including Regulated Pollutants
Equipment NOx CO
RCTOs
Natural gas‐fired thermal oxidizers associated with Fab 20, RB1, D1C, RA1, RA2, D1D, and Fab 15 C4 (EU1, EU3, and EU5)
X X
Boilers
Natural gas‐fired boilers associated with Fabs F20, D1C, and D1D (EU8, EU10 and EU15)
X
BSSWa
Small natural gas‐fired thermal oxidizer associated with solvent waste abatement in D1C (EU1)
X X
TMXW Abatement System
Natural gas‐fired thermal catalytic ammonia abatement system associated with Fab D1D (EU3)
X X
Fab Tools
Fab Tools Including Natural Gas‐fired Point‐of‐Use Abatement Devices (EU1, EU3, and EU5)
X X
a This small, natural gas‐fired unit is a thermal oxidizer (0.51 MMBtu/hr each) used to control emissions from the BSSW solvent waste system. Proposed NOx and CO BACT for this unit is also the use of natural gas.

SECTION 5 BEST AVAILABLE CONTROL TECHNOLOGY ANALYSIS
5-4 ES111914104811PDX
5.3 BACT Analysis for New Project Equipment 5.3.1 Introduction BACT is defined in OAR‐340‐200‐0020(15) as follows:
“…an emission limitation, including, but not limited to, a visible emission standard, based on the maximum degree of reduction of each air contaminant subject to regulation under the Act which would be emitted from any proposed major source or major modification which, on a case‐by‐case basis, taking into account energy, environmental, and economic impacts and other costs, is achievable for such source or modification through application of production processes or available methods, systems, and techniques, including fuel cleaning or treatment or innovative fuel combustion techniques for control of such air contaminant. In no event may the application of BACT result in emissions of any air contaminant that would exceed the emissions allowed by any applicable new source performance standard or any standard for hazardous air pollutant. If an emission limitation is not feasible, a design, equipment, work practice, or operational standard, or combination thereof, may be required. Such standard must, to the degree possible, set forth the emission reduction achievable and provide for compliance by prescribing appropriate permit conditions.”
EPA’s New Source Review Workshop Manual: Prevention of Significant Deterioration and Nonattainment Area Permitting (EPA, 1990) provides a recommended methodology for performing a PSD BACT analysis and is referred to as the “top‐down” process. The process seeks to obtain the maximum reduction in the pollutant emission rate unless energy, environmental, and economic impacts of that choice justify its rejection. The five‐step process, as used by EPA for PSD permitting, is as follows:
1. Identify Available Control Options—identifying available BACT control options including the following categories:
a. Existing control technologies for sources of that type;
b. Technically feasible options that are used on other source categories, but not the one under review;
c. Inherently lower polluting production processes, fuels, and coatings that can be evaluated alone or in combination with other control devices; and
d. Specific design or operational parameters that may include such factors as combustion control techniques.
The manual states that multiple control options can provide BACT ‐ “Combinations of inherently lower‐polluting processes/practices (or a process made to be inherently less polluting) and add‐on controls are likely to yield more effective means of emission control than either approach alone.” Data for control options include engineering experience, EPA’s RBLC, existing EPA or state permits, equipment vendors, trade associations, permitting engineers, and technical papers and journals.
2. Eliminate Technically Infeasible Control Options—demonstration of technical infeasibility of a control option should be based on physical, chemical and engineering principles, the technical difficulty of which would preclude the successful use of the control option. Technically infeasible control option are eliminated from further consideration.
3. Rank Remaining Options Based on Pollutant Reduction—ranking of options includes a variety of performance metrics including control efficiency.
4. Eliminate Options that Fail Energy, Environmental, or Economic Criteria—after identification of available and technically feasible control options, the energy, environmental, and economic impacts are evaluated to determine a final level of control.
5. Determine BACT—the most effective option remaining, after the steps above have been taken, is determined to be BACT and the permitting agency establishes a corresponding emissions limit

SECTION 5 BEST AVAILABLE CONTROL TECHNOLOGY ANALYSIS
ES111914104811PDX 5-5
TABLE 5‐3 Calculated Emission Rates for Preproject Emission Units
Preproject Emission Unit ID Device/Process
Equipment and Totals for NOx (tpy) Equipment and Totals for CO (tpy)
RCTOs Boilers BSSW TMXW Fabs Total Threshold Retro BACT Required RCTOs Boilers BSSW TMXW Fabs Total Threshold
Retro BACT Required
EU 1 Fab 20 / RB1 / D1C / RA1 / RA2 1.80 NA 0.22 NA 10.25 12.27 4 yes 13.93 NA 0.18 NA 7.37 21.48 10 yes
EU 2 RP1 NA NA NA NA 0 0 4 no NA NA NA NA 0 0 10 no
EU 3 D1D 2.40 NA NA 1.5 3.07 6.98 4 yes 13.77 NA NA 0.14 2.89 16.80 10 yes
EU 5 Fab 15 C4 1.20 NA NA NA 6.55 7.75 4 yes 11.43 NA NA NA 3.51 14.94 10 yes
EU 6 AL4 Sort NA NA NA NA 0 0 4 no NA NA NA NA NA 0 10 no
EU 7 AL3 Die Prep NA NA NA NA 0 0 4 no NA NA NA NA NA 0 10 no
EU 8 (boilers) F20‐BLR115‐1‐200 F20‐BLR115‐2‐200 F20‐BLR115‐3‐200
NA 4.47 NA NA NA 4.47 4 yes NA 4.54 NA NA NA 4.54 10 no
EU 9 (boilers) RA2‐MECH‐HW‐B01 (BLR 115‐1‐300) RA2‐MECH‐HW‐B02 (BLR 115‐2‐300)
NA 0.40 NA NA NA 0.40 4 no NA 0.40 NA NA NA 0.40 10 no
EU 10 (boilers) CUB2‐BLR115‐1‐210 CUB2‐BLR115‐2‐210 CUB2‐BLR115‐3‐210
NA 7.60 NA NA NA 7.60 4 yes NA 4.63 NA NA NA 4.63 10 no
EU 11 (boiler) CUB2‐BLR115‐5‐210 NA 2.57 NA NA NA 2.57 4 no NA 1.57 NA NA NA 1.57 10 no
EU 12 (boilers) RP1‐BLR115‐1‐210 NA 0.33 NA NA NA 0.33 4 no NA 0.20 NA NA NA 0.20 10 no
EU 13 (boilers) RP1‐BLR115‐2‐210 RP1‐BLR115‐3‐210
NA 1.93 NA NA NA 1.93 4 no NA 1.18 NA NA NA 1.18 10 no
EU 14 (boiler) BLR‐115‐1‐210 NA 0.64 NA NA NA 0.64 4 no NA 0.39 NA NA NA 0.39 10 no
EU 15 (boiler) BLR‐115‐2‐210 BLR‐115‐3‐210
NA 5.15 NA NA NA 5.15 4 yes NA 3.14 NA NA NA 3.14 10 no
EU 16 (boiler) BLR‐115‐4‐210 NA 1.55 NA NA NA 1.55 4 no NA 1.57 NA NA NA 1.57 10 no
EU 17 (boiler) BLR‐115‐5‐210 NA 0.68 NA NA NA 0.68 4 no NA 0.69 NA NA NA 0.69 10 no
EU 21 (boilers) F5‐HW‐BLR01 F5‐HW‐BLR02 F5‐HW‐BLR03 F5‐HW‐BLR04
NA 3.40 NA NA NA 3.40 4 no NA 1.27 NA NA NA 1.27 10 no
NA = not applicable.

This page intentionally left blank.

SECTION 5 BEST AVAILABLE CONTROL TECHNOLOGY ANALYSIS
5-7 ES111914104811PDX
This section presents the maintenance area NSR BACT analysis for NOx and CO. As the proposed project does not trigger PSD permitting, the EPA process does not apply. However, the concepts outlined for a PSD BACT analysis are followed in this BACT analysis. The sources of NOx and CO these pollutants were assessed as part of this analysis include the following:
Natural gas‐fired industrial boilers
Natural gas‐fired thermal oxidizers
Diesel fired emergency standby generators
Fab tools including natural gas‐fired point of use abatement systems.
Small natural gas‐fired boilers (< 2.0 MMBTU/hr) provide domestic hot water for restrooms, kitchens and fitness centers. Small natural gas‐fired HVAC units (< 2.0 MMBtu/hr) provide personnel space heating. NOx and CO BACT for both of these types of units is proposed to be combustion of exclusively natural gas and operating and maintaining the units in accordance with the manufacturer’s recommendations. The emissions from these small units are negligible compared to manufacturing support systems. As such, a full top‐down BACT analysis for these units is not provided in the subsequent sections.
5.3.2 New Project Industrial Boiler NOx BACT Analysis The new project industrial natural gas‐fired hot water boilers range in size from approximately 6.7 MMBtu/hr to 30.6 MMBtu/hr. They will be located in buildings RP1, CUB1, CUB2, CUB4, CUB5, MBR, MBR2, and FAB15. A detailed equipment list of the new project boilers is provided with the emissions calculations in Appendix E. Facility site plans are shown in Figures 1‐2 and 1‐3.
The top‐down BACT analysis for NOx emissions from natural gas‐fired boilers consists of the following five steps:
Step 1: Identify all available control technologies.
Step 2: Eliminate technically infeasible options.
Step 3: Rank technically feasible options.
Step 4: Evaluate most effective controls and document results.
Step 5: Select BACT.
Each step is detailed below.
Step 1: Identify all available control technologies.
Available control technologies were identified from the technical literature and EPA’s RBLC database. A majority of the control technologies identified in the RBLC for the size and type of boilers considered in this analysis were low NOx burners or ultra‐low NOx burners. A summary of the results of the RBLC database query is provided in Appendix F.

SECTION 5 BEST AVAILABLE CONTROL TECHNOLOGY ANALYSIS
5-8 ES111914104811PDX
Available NOx Control Technologies for New Boilers
Control Type Control Technology Control Description
Post Selective Catalytic Reduction (SCR)
SCR systems reduce NOx emissions by injecting ammonia (NH3) into the exhaust gas stream upstream of a catalyst. NOx and NH3 react on the surface of the catalyst to form water and nitrogen. The most common catalysts are based on titanium and vanadium oxides however these
catalysts require gas temperatures in the range of 600 F to 800 F. In clean, low temperature (350‐550 F) applications, catalysts containing precious metals such as platinum and palladium are typically required. Such precious metal catalysts are much more expensive than base metal catalysts.
Flue gas temperatures from package boilers of the size used at the Facility
are typically 300 – 350 F. Control of NOx with a SCR system on these units would require reheating the flue gas to the temperature to utilize a low temperature SCR catalyst. Natural gas to reheat the flue gas would be required and would add to the annual operating cost of the control system.
SCR has two well‐documented environmental impacts associated with its use; ammonia emissions (ammonia slip) and disposal of spent catalyst.
Post Selective Noncatalytic Reduction (SNCR)
Selective noncatalytic reduction is also a post‐combustion NOx control technology based on the reaction of NH3 and NOx. SNCR involves injecting urea/NH3 into the combustion gas path to reduce the NOx to nitrogen and water. The required temperature range to achieve desired results is 1,600 to
2,000 F. Operation at temperatures below this range results in the emissions of unreacted NH3. Operation above this range results in oxidation of NH3, forming additional NOx. Also, the urea/ NH3 must have sufficient residence time, about 0.3 to 0.5 seconds or more, at the optimum operating temperatures for efficient NOx reduction. Therefore, the injection point is typically prior to or early in the convective heat recovery zone.
Pre Non Selective Catalytic Reduction (NSCR)
Non Selective Catalytic Reduction uses a catalyst without injected reagents to reduce NOx emissions in an exhaust gas stream. NSCR is typically used in automobile exhaust and rich‐burn stationary internal combustion engines, and employs a platinum/rhodium catalyst. NSCR is effective only in a stoichiometric or fuel‐rich environment where the combustion gas is nearly depleted of oxygen (< 0.5%), and this condition does not occur in the Facility boiler exhaust where the oxygen concentration is greater than 3%.
Pre Low NOx Burners with or without flue gas recirculation (FGR)
Low NOX burners reduce the formation of thermal NOx in the flame zone of a boiler utilizing low excess air, flue gas recirculation (FGR), or staged combustion principles. The current generation of Low‐ NOx burners utilized in factory built, package boilers can integrate exhaust gas recirculation while minimizing the amount of oxygen and peak flame temperature in the boiler or burners. Specific to the burners only, three proven design techniques currently are being used. Those techniques are staged combustion, enhanced heat transfer, and controlled second stage combustion. All three of these techniques control the amount of oxygen in the combustion zone and reduce the peak combustion temperatures in the two distinct flame zones.
The manufacturers of boilers in the size range used at the Facility offer boiler versions incorporating low‐NOx burners with and without exhaust gas recirculation producing NOx emission concentrations less than 9 parts per million volume dry (ppmvd).
Step 2: Eliminate technically infeasible options.
The technical feasibility of available NOx control technologies are described below.

SECTION 5 BEST AVAILABLE CONTROL TECHNOLOGY ANALYSIS
ES111914104811PDX 5-9
Evaluation of NOx Control Technology for Technical Feasibility for New Boilers
Control Technology Technical Feasibility Description
Selective Catalytic Reduction (feasible)
SCR is a technically feasible control technology. However, as previously described, flue gas temperatures from package boilers of this size are in the range 300 – 350 ºF. Control of NOx with a SCR system on these units would require reheating the flue gas to the temperature required to utilize the more expensive low temperature SCR catalyst. In addition the natural gas to reheat the flue gas would add to the annual operating cost of the control system.
Selective Noncatalytic Reduction (not feasible)
Achieving correct temperatures (1600 F – 2000 F) and residence times (0.3 – 0.5 seconds or more) is not technical feasible for package boilers of this size.
Other regulatory agencies16 have determined that it is not currently technically feasible to use SNCR as an add‐on control technology for package boilers since SNCR operates at a much higher temperature than the exhaust of this project. While it would be possible to raise the flue gas temperature to the level that would allow SNCR to operate, this is not practical given the broad gap in temperature requirements and the natural gas consumption would be significantly higher than needed to utilize SCR.
Nonselective Catalytic Reduction (not feasible)
As previously described, NSCR is effective only in a stoichiometric or fuel‐rich environment where the combustion gas is nearly depleted of oxygen (< 0.5%), and this condition does not occur in the Facility boiler exhausts where the oxygen concentration is approximately greater than 3 percent. For this reason, NSCR is inapplicable to and not technically feasible for application to Facility boiler operations.
Low NOx Burners with or without FGR (feasible)
Low NOx burners with or without flue gas recirculation is a technical feasible control technology and is incorporated into the design for the new project boilers.
Step 3: Rank technically feasible options.
This step involves ranking the technically feasible options identified in Step 2 according to overall control effectiveness.
Ranking of Technically Feasible Options
Control Technology Technical Feasibility Description and Removal Efficiency
Selective Catalytic Reduction
Reported NOx removal efficiencies for SCR are 95%.
Low NOx Burners with or without FGR
Compared to standard burners, low NOx burners with or without FGR can reduce NOx emissions by 40‐60%.
Step 4: Evaluate most effective controls and document results.
Selective Catalytic Reduction. The economic feasibility of SCR to control NOx emissions from small natural
gas‐fired boilers has been evaluated by other agencies17 and found to be cost prohibitive. The Washington Department of Ecology’s analysis of SCR for these types of boilers estimated a cost effectiveness of >$24,000 per ton of NOx removed. While this analysis was conducted in 2006, nothing in the cost profile for a similar system today would indicate a significantly reduced cost effectiveness. Earlier this year, DEQ reached the same conclusion, namely that for a 39.8 MMBtu/hr natural gas‐fired package boiler, SCR was
16 Suitability of Small Natural Gas Fueled Boilers for Air Quality General Order of Approval: Evaluation of Control Technology, Ambient Impacts, and Potential Approval Criteria, Washington Department of Ecology, February 1, 2006, pg 30.
17 Suitability of Small Natural Gas Fueled Boilers For Air Quality General Order of Approval: Evaluation Of Control Technology, Ambient Impacts, and Potential Approval Criteria, Washington Department of Ecology, February 1, 2006, pg 29‐37.

SECTION 5 BEST AVAILABLE CONTROL TECHNOLOGY ANALYSIS
5-10 ES111914104811PDX
not cost‐effective at $77,600 per ton of NOx removed.18 Further, as provided in Appendix F, the vast majority of the control technologies identified in the RBLC for the size and type of boilers considered in this analysis were low NOx burners or ultra‐low NOx burners.
Low NOx Burners With or Without FGR. Low NOx burners are technically and economically feasible for the new project boilers and are inherent in the facility design. The low NOx burners will use low excess air, staged combustion principles, and flue gas recirculation to achieve a NOx emission rate of approximately 0.011 lb‐NOx/MMBtu.
Step 5: Select BACT.
The final step in the top‐down BACT analysis process is to select BACT. The RBLC database was again consulted to assist in selecting BACT for this project. The emission limits provided in the RBLC database for natural gas‐fired boilers in the size range proposed for the project range from 0.011 lb NOx/MMBtu to 0.37 lb NOx/MMBtu. As such, Intel proposes BACT for NOx emissions from new project boilers to be low NOx burners utilizing low excess air, staged combustion principles and flue gas recirculation to achieve a NOx emission rate of approximately 0.011 lb‐NOx/MMBtu. This limit would not apply during periods of startup and shutdown. Specific BACT emission limits for the new project equipment are summarized in Section 5.4.
5.3.3 New Project Industrial Boiler BACT for CO The five‐step, top‐down BACT analysis for CO emissions from natural gas‐fired boilers is presented below.
Step 1: Identify all available control technologies.
Available control technologies were identified from technical literature, equipment suppliers, and the RBLC database and are summarized below.
Available CO Control Technologies for New Boilers
Control Type Control Technology Control Description
Post Catalytic oxidation (CatOx)
A catalytic oxidation system typically consists of a passive reactor fitted with a honeycomb grid of metal panels that are coated with a precious metal catalyst (usually platinum, palladium or rhodium). The catalyst promotes the oxidation of CO to CO2. Pressure drop across the grid system will reduce the efficiency of the boiler system, requiring additional fuel to be burned to achieve the same energy output resulting in higher emissions. CO catalysts may also plug or become deactivated with use. Therefore, it would be necessary to change‐out the catalyst on a routine basis. Changing the catalyst will generate a solid waste material that must be properly handled. Finally, oxidation catalysts for CO require a minimum temperature of 500 OF to achieve any appreciable conversion of CO to CO2. As such, this control technology is typically evaluated for steam boilers which operate at higher temperatures.
Pre Good combustion practices
Good combustion practices includes boiler operation in adherence with boiler manufacturer’s procedures and recommendations, and accepted industry practices. Implementation of proper burner design to achieve good combustion efficiency in heaters and boilers will minimize the generation of CO. Good combustion efficiency relies on both hardware design and operating procedures. Satisfactory burner design providing proper residence time, temperature and combustion zone turbulence, in combination with proper control of air‐to fuel ratio, are essential elements of a low‐LNB technology. Combustion modifications designed to limit CO emissions could result in higher NOx emissions as a result of driving the combustion reaction to CO2 formation at the expense of additional NOx formation. However,
18 Troutdale Energy Center BACT Determination; permit issued March 15, 2014.

SECTION 5 BEST AVAILABLE CONTROL TECHNOLOGY ANALYSIS
ES111914104811PDX 5-11
Available CO Control Technologies for New Boilers
Control Type Control Technology Control Description
proper burner design and operation should limit CO emissions while controlling the average NOx emission rate. Other than the CO – NOx emissions trade‐off, there are no other environmental issues related to combustion controls.
FGR technology recirculates a portion of the flue gas into the boiler and is mixed with the combustion air. The resultant dilution reduces flame temperature and available oxygen for combustion, thus lowering NOx formation. However, FGR can also result in increased fuel/air mixing, thus achieving lower CO emissions than without utilizing FGR. Therefore, use of FGR must be closely monitored and controlled in conjunction with proper burner design to achieve desired NOx emissions, while also promoting good combustion efficiency which can control CO emissions.
No environmental or energy costs are associated with good combustion practices for the boilers.
Step 2: Eliminate technically infeasible options.
The technical feasibility of available CO control technologies is described below.
Evaluation of CO Control Technology for Technical Feasibility for New Boilers
Control Technology Technical Feasibility Description
Catalytic oxidation (CatOx) (not feasible)
Implementation of add‐on controls, such as catalytic oxidation to the proposed boilers, is not technically feasible. The Facility boiler are used to produce hot water and not steam. Exhaust gas temperatures typically don’t exceed 350 OF which is well below the required minimum temperature of 500 OF required for technically feasible application of CatOx. While it would be possible to raise the flue gas temperature to the level that would allow CatOx to operate, this is not practical given the gap in temperature requirements.
Good combustion practices (feasible)
Implementation of good combustion controls is technically feasible.
Step 3: Rank technically feasible options.
This step involves ranking the technically feasible options identified in Step 2 according to overall control effectiveness. All technically feasible options have been incorporated into the project’s design.
Ranking of Technically Feasible Options
Control Technology Technical Feasibility Description and Removal Efficiency
Good combustion practices
Base case.
Step 4: Evaluate most effective controls and document results.
Good Combustion Practices. Good combustion practices includes boiler operation in adherence with boiler manufacturer’s procedures and recommendations, and accepted industry practices. Implementation of proper burner design to achieve good combustion efficiency in heaters and boilers will minimize the generation of CO. Good combustion efficiency relies on both hardware design and operating procedures. Satisfactory burner design providing proper residence time, temperature and combustion zone turbulence, in combination with proper control of air‐to fuel ratio, are essential elements of a low NOx burner technology which has already been incorporated into the project’s design. Combustion modifications designed to reduce CO emissions could result in higher NOx emissions. However, proper burner design and operation should limit CO emissions while controlling the average NOx emission rate. Other than the CO – NOx emissions trade‐off, there are no environmental issues related to combustion controls.

SECTION 5 BEST AVAILABLE CONTROL TECHNOLOGY ANALYSIS
5-12 ES111914104811PDX
As described in the BACT for NOx section, FGR technology recirculates a portion of the flue gas into the boiler and is mixed with the combustion air. The resultant dilution reduces flame temperature and available oxygen for combustion, thus lowering NOx formation. However, FGR can also result in increased fuel/air mixing, thus achieving lower CO emissions than without utilizing FGR. Therefore, use of FGR must be closely monitored and controlled in conjunction with proper burner design to achieve desired NOx emissions, while also promoting good combustion efficiency which can control CO emissions.
No environmental or energy costs are associated with good combustion practices for an auxiliary boiler.
Step 5: Select BACT.
The final step in the top‐down BACT analysis process is to select BACT. EPA’s RBLC database was again consulted to assist in selecting BACT for this project. The lowest CO emission rates found within the RBLC ranged from approximately 0.0073 pound per million British thermal units (lb/MMBtu) to 0.0173 lb/MMBtu for Harrah’s Operating Company for units installed in Las Vegas, NV, which is in a nonattainment area for ozone and PM10. The next lowest RBLC CO emission rates are comparable with the Facility boiler CO emission rate of 0.037 lb/MMBtu. Achieving an emission rate of 0.0073 lb/MMBtu would require the installation of a CatOx system, which is not technically feasible for hot water boilers. Therefore, use of pipeline natural gas and good combustion practices is BACT to control CO with a corresponding emission rate of 0.037 lb/MMBtu. This limit would not apply during periods of startup, shutdown, or malfunction.
5.3.4 New Project Thermal Oxidizer CO and NOx BACT Analysis The Facility uses RCTOs to control emissions of VOCs. The thermal oxidizers use natural gas combustion as a heat source similar to boiler operations previously discussed. A full detailed analysis for these devices would be redundant to the previous section, and therefore has not been included. Information compiled beyond the analysis for the boilers is described below.
The thermal oxidizers work by taking solvent‐laden air through a zeolite rotor concentrator where the VOCs are removed by adsorption. The rotor turns continuously transporting VOC‐laden zeolite into an isolated regeneration zone where heated air is used to desorb the VOCs. The desorbate is now a highly concentrated airstream (typically 5‐10% of the original exhaust volume) and is directed to a thermal oxidizer, which operates at temperatures in the combustion zone of approximately 1350OF. The system is equipped with heat exchangers to lower the amount of supplemental natural gas required and thereby reducing NOx and CO emissions compared to straight thermal oxidizer systems. The primary heat exchanger is used to preheat the process air prior to combustion. The secondary heat exchanger is used to heat a slip stream of the process air that is used to regenerate the zeolite rotor. As a result, exhaust gas temperatures are significantly lowered, typically to less than 750 OF.
The natural gas fuel requirement for the new project RCTOs ranges from 2.0 MMBtu/hr to 8.0 MMBtu/hr.
Low NOx burners and good combustion practices are technically feasible and are part of the project’s design. However it should be noted that the combustion mechanics inside the oxidation chamber, including the addition of the desorption air stream to the oxidizing chamber, are dissimilar to a pure heating device such as a boiler and the level of reduction in NOx and CO emissions are generally not comparable. Post‐oxidation controls, along with the technical and economic limitations, for NOx and CO would be the same as those identified in the boiler BACT section. However, the operating temperatures of the thermal oxidizers make SCR for NOx and catalytic oxidation for CO technically feasible and would provide the highest level of NOx and CO control from the RCTOs. The boiler BACT section demonstrated the economic infeasibility of SCR systems for packaged industrial boilers. However, in order to evaluate the economic feasibility of a catalyst type system for both NOx and CO control, one of the large RCTOs was evaluated and manufacturer cost information was retrieved. Operating conditions and capital cost data includes the following RCTO operating parameters:
Burner capacity: 8.0 MMBtu/hr

SECTION 5 BEST AVAILABLE CONTROL TECHNOLOGY ANALYSIS
ES111914104811PDX 5-13
Air flow: 7,600 scfm
Temperature: < 750 °F
NOx: 0.78 lb/hr
CO: 0.39 lb/hr
NOx/CO Dual Catalyst Control System Data Provided by Equipment Vendor:
NOx Control System: Selective Catalytic Reduction (SCR) to reduce NOx to 9 ppmvd
CO Control System: Catalytic Oxidation (CatOx) to reduce CO to 10 ppmvd
Tables 5‐4 and Table 5‐5 present estimated capital and annualized costs associated with achieving various levels of NOx and CO control for Facility RCTOs for cases with and without the dual catalyst system. Option 1 is the base case for the currently designed RCTOs. Option 2 includes the base case design plus the addition of the dual catalyst with target NOx emissions of 9.0 ppmvd and CO emissions of 10 ppmvd. Additional information pertaining to the cost estimates is provided in Appendix E.
TABLE 5‐4 NOx Control Cost Comparison
Cost Component Option 1 Base Case
Option 2 NOx Catalyst
Total Installed Capital Cost 0 $182,160
Total Annualized Costs 0 $87,544
Tons NOx Removed per Year 0 1.11
Cost Effectiveness per Ton NOx Removed 0 $78,750
Incremental Cost Effectiveness per Ton Additional NOx Removed
Base $78,750
TABLE 5‐5 CO Control Cost Comparison
Cost Component Option 1 Base Case
Option 2 CO Catalyst
Total Installed Capital Cost 0 $121,440
Total Annualized Costs 0 $69,208
Tons CO Removed per Year 0 0.15
Cost Effectiveness per Ton CO Removed 0 $463,108
Incremental Cost Effectiveness per Ton Additional CO Removed
Base $463,108
The cost‐effectiveness of operating a representative RCTO with a dual catalyst system is $78,750/ton for NOx and $463,108/ton for CO. These costs are excessive; therefore, installation of the dual catalyst system as BACT for the RCTOs is not economically justified.
Low NOx burners without FGR are technically feasible and are part of the project’s design. The burners provided with Facility new project RCTOs use direct spark ignition and an air/gas regulator to fire efficiently over a wide gas turndown range. In addition, the burner nozzle design allows for good mixing of air and fuel to reduce emissions. Intel will also optimize the thermal oxidation temperature to reduce CO emissions.

SECTION 5 BEST AVAILABLE CONTROL TECHNOLOGY ANALYSIS
5-14 ES111914104811PDX
EPA’s RBLC database was consulted to evaluate BACT for the RCTOs. The database was queried for process type “19.200 – Emission Control Afterburners and Incinerators (combustion gases only).” No semiconductor manufacturing related facilities and no concentrator type thermal oxidizer technologies were identified from the search. Of the seven facilities identified, four of the facilities were refinery operations or asphalt manufacturing and the remaining three facilities were plastics polymer manufacturers. None of these combustion burner technologies is comparable to the Facility VOC destruction units that desorb process gases from a zeolite concentrator. A summary of the RBLC database query is provided in Appendix F.
To control emissions of NOx and CO from RCTOs, Intel proposes BACT to be low NOx burners and good combustion practices including optimization of thermal oxidation set points to achieve corresponding emission rates from the new project RCTOs of 0.098 lb. NOx/MMBtu and 0.049 lb. CO/MMBtu. These emission rates are based on Intel’s recent work with equipment suppliers and engineering testing to optimize combustion practices in the RCTOs.
5.3.5 New Project Emergency Generator NOx and CO BACT Analysis There are 39 new project emergency generators ranging in size from 1500 kilowatt (kW) to 2500 kW. The generators are normally run up to 30 hours per year each for maintenance and readiness checks.
It is proposed that installation of the emergency engines compliant with the applicable portions of the NSPS for Stationary Compression Ignition Internal Combustion Engines (CI ICE) (40 CFR Part 60 Subpart IIII)) including “Tier 2” emissions controls for emergency generator engines, will satisfy the BACT requirement. In support of that proposal this application provides the following additional information:
The primary pollutants of concern for diesel combustion in compression ignition engines include NOx and PM.
EPA “Tier 4” standards, applicable to nonemergency engines, typically rely on SCR systems to control NOx and diesel particulate filters (DPF) to control PM.
SCR systems rely on hot combustion gases to heat a catalyst to support NOx reduction and this process typically takes about 20 minutes of generator operation at load to achieve desired catalyst temperatures. CatOx systems for CO have the same characteristic. The duration of most generator maintenance and readiness checks are only 30 to 60 minutes, making effective NOx control technically infeasible for intermittently operated sources.
While detailed cost data for SCR/DPF systems has not been collected for this project it has been CH2M HILL’s experience that these systems can have a capital cost of approximately $250,000 per generator. As evidenced by the sample calculation below, relative to the amount of pollutants removed during the most typical operating scenario for the generators (about one hour per month for testing) these costs are not economically feasible as the control cost well exceeds $10,000/ton of NOx removed.
Capital cost recovery for $250,000 (15 years, 7%): $27,450
3,680 hp unit @ 6 g NOx/hp‐hr operating 30 hour/year: 0.73‐tpy NOx
Assume 60% NOx control over operating range of test: 0.44‐tpy NOx reduction
$27,450/year ÷ 0.44‐tpy NOx = $62,386/ton of NOx removed.
Operation and maintenance costs associated with end‐of‐stack controls are not included in the sample calculation above and would significantly decrease cost effectiveness.
Further, as provided in Appendix F, a vast majority of the recent BACT determinations present in the RBLC did not include using additional control beyond those required under the CI ICE NSPS applicable to emergency generators.

SECTION 5 BEST AVAILABLE CONTROL TECHNOLOGY ANALYSIS
ES111914104811PDX 5-15
Engines compliant with applicable NSPS achieve air pollutant reductions through good operating and maintenance practices required by the NSPS and good combustion practices, which is presumed to be BACT for the new project emergency generators.
The NOx and CO emission limits established in the NSPS apply to the engines when tested through a cyclic loading regime. As such, the NSPS also provides a “Not‐to‐Exceed” (NTE) emission rate for engines running under full loads. The NTE emission rate is 1.25 times the stated NSPS emission rate. A summary of the NSPS emission limits applicable to the Facility new project emergency generators is provided in Table 5‐6.
TABLE 5‐6 Summary of CI ICE NSPS Applicable to Facility New Project Emergency Generators
Regulatory Citation Engine Data NOx CO NOx NTE
CO NTE
40 CFR Part 60 Subpart IIII
60.4202(a)(2) and 60.4205
Model year 2007 and later
<3000 hp
<10L displacement per cylinder
4.8 2.6 6.0 3.25
40 CFR Part 60 Subpart IIII
60.4202(b)(1) and 60.4205
Model year 2007‐2010
>3000 hp
<10L displacement per cylinder
6.9 8.5 8.6 10.6
40 CFR Part 60 Subpart IIII
60.4202(b)(2) and 60.4205
Model year 2011 and later
>3000 hp
<10L displacement per cylinder
4.8 2.6 6.0 3.25
Notes:
All values in g/hp‐hr
NTE = Not to Exceed rate per 40CFR60.4212
For new project emergency generators Intel proposes BACT to be compliance with applicable portions of 40 CFR Part 60 Subpart IIII including the purchase of certified engines and the NTE emission rates of 6.0 grams per horsepower‐hour (g/hp‐hr) for NOx and 3.25 g/hp‐hr for CO.
5.3.6 TMXW System NOx and CO BACT Analysis The TMXW system is an ammonia wastewater treatment system that includes gas‐phase ammonia abatement. There are seven new project systems proposed. A system description is as follows;
The air‐flow capacity of each system is 6,000 actual cubic feet per minute.
Ammonia wastewater is pH adjusted and fed to an ammonia stripper. The ammonia stripper is a desorption process that removes ammonium ions out of the water to produce gas‐phase ammonia.
The gas‐phase ammonia is exhausted to a two‐stage thermal catalytic oxidation/reduction system. Heat input to each system is accomplished with a relatively small natural gas‐fired burner (1.05 MMBTU/hr).
The first catalyst converts ammonia to NOx and carbon monoxide to carbon dioxide. While natural gas combustion byproducts are a source of CO and NOx, the primary source of NOx is the oxidation of ammonia.
The second catalyst converts NOx to nitrogen and water.
In the thermal catalytic zones, operating temperatures are approximately 450OF to 800OF.
While the system is in place primarily to treat wastewater, inherent in its design is treatment of NOx and CO.

SECTION 5 BEST AVAILABLE CONTROL TECHNOLOGY ANALYSIS
5-16 ES111914104811PDX
The five‐step, top‐down BACT analysis for NOx and CO emissions from the TMXW system is presented below.
Step 1: Identify all available control technologies.
Available control technologies were researched from technical literature equipment suppliers and EPA’s RBLC database and are summarized below. As described in Appendix F, the RBLC did not identify any control technology determinations for CO and NOx generated from a thermal catalytic ammonia air abatement system.
Available NOx and CO Control Technologies for TMXW Systems
Control Type Control Technology Control Description
Post Selective Catalytic Reduction (SCR) for NOx
See boiler BACT section.
Post Selective Noncatalytic Reduction (SNCR) for NOx
See boiler BACT section
Post Non Selective Catalytic Reduction (NSCR) for NOx
See boiler BACT section
Post Catalytic oxidation (CatOx) for CO
See boiler BACT section
Step 2: Eliminate technically infeasible options.
The technical feasibility of available NOx and CO control technologies are described below.
Evaluation of NOx and CO Control Technology for Technical Feasibility for TMXW Systems
Control Technology Technical Feasibility Description
Selective Catalytic Reduction (SCR) for NOx (feasible)
This option is technically feasible and is included in the project’s design. SCR is the second stage of the catalytic abatement system planned for the TMXW systems.
Selective Noncatalytic Reduction (SNCR) for NOx (not feasible)
This technology is not technically feasible. SNCR technologies require temperatures in the range of 1600 – 2000 OF, well above the required operating temperature of the two‐stage catalyst system’s required temperature of 450‐800OF.
Non Selective Catalytic Reduction (NSCR) for NOx (not feasible)
This technology is not technically feasible. As previously described, NSCR is effective only in a stoichiometric or fuel‐rich environment where the combustion gas is nearly depleted of oxygen (< 0.5%), and this condition does not occur in the exhaust stream from the ammonia stripper. For this reason, NSCR is inapplicable to and not technically feasible for application to Facility TMXW operations
Catalytic oxidation (CatOx) for CO (feasible)
This option is technically feasible and is included in the project’s design. The same catalyst used to oxidize ammonia can also oxidized the CO generated by the natural gas‐fired burner assembly used to heat the unit. Oxidation of CO improves with higher temperatures and the ammonia catalyst operates at approximately the minimum required temperature of 500OF for appreciable CO oxidations.
Step 3: Rank technically feasible options.
This step involves ranking the technically feasible options identified in Step 2 according to overall control effectiveness. All technically feasible options have been incorporated into the project’s design.

SECTION 5 BEST AVAILABLE CONTROL TECHNOLOGY ANALYSIS
ES111914104811PDX 5-17
Ranking of Technically Feasible Options
Control Technology Technical Feasibility Description and Removal Efficiency
Selective Catalytic Reduction (SCR) for NOx
Reported NOx removal efficiencies for SCR are 95%.
Catalytic oxidation (CatOx) for CO
Up to 90% CO removal for lower temperature oxidation systems.
Step 4: Evaluate most effective controls and document results.
As noted in Step 3, each technically feasible option identified has been selected for implementation
Step 5: Select BACT.
The final step in the top‐down BACT analysis process is to select BACT. EPA’s RBLC database was again consulted to assist in selecting BACT for this project. As described in Appendix F, the RBLC did not identify any control technology determinations for CO and NOx generated from a thermal catalytic ammonia air abatement system. The database did include NOx and CO BACT determination for straight thermal oxidation of ammonia (e.g., ammonia flares) flash drums and ammonia reformers but no such determination included additional add‐on controls. The sources of ammonia associated with these determinations are primarily fertilizer plants and ammonia production and the numerical emission limits provided are not comparable to abatement associated with wastewater treatment. As such, Intel proposes BACT for thermal catalytic control of ammonia occurring in each of the TMXW system to be as follows:
CO: An emission rate of 0.030 lb. CO/MMBTU.
NOx: An emission rate of 0.34 lb. NOx/hr.
These emission rates are based on the following:
0.30 lb. CO/MMBtu per burner manufacturer and 90% removal of CO across the catalyst.
0.06 lb. NOx/MMBtu per burner manufacturer and stoichiometric considerations assuming a maximum ammonia loading of 73.3 lb/hr and at least 90% removal of NOx across the catalyst.
5.3.7 Fab Tools Including POU Devices NOx and CO BACT Analysis A number of Fab process tool are paired with point‐of‐use (POU) abatement systems to combust process gases. Some of the POU devices use a small amount of natural gas, typically < 30 standard liters per minute. The gases are exhausted to centralized packed bed wet scrubber air pollution control systems. Schematically, the fab exhaust management system and its relation to the air pollution control systems is shown in Figure 5‐1.
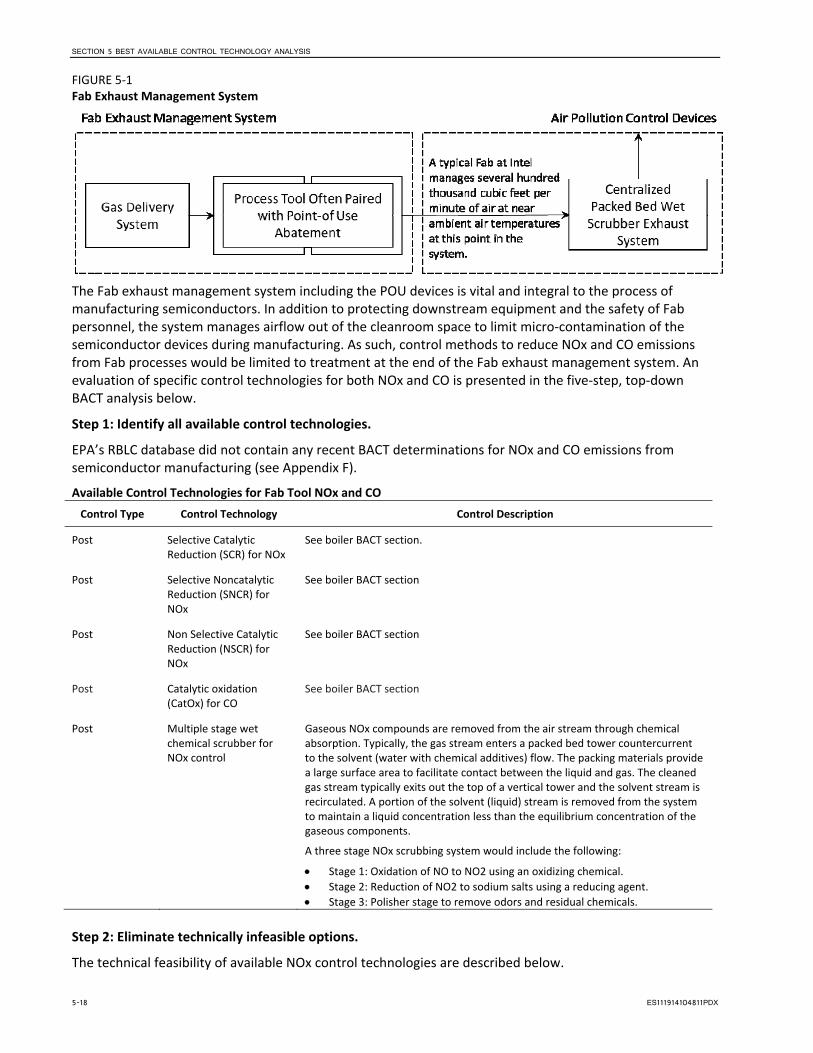
SECTION 5 BEST AVAILABLE CONTROL TECHNOLOGY ANALYSIS
5-18 ES111914104811PDX
FIGURE 5‐1 Fab Exhaust Management System
The Fab exhaust management system including the POU devices is vital and integral to the process of manufacturing semiconductors. In addition to protecting downstream equipment and the safety of Fab personnel, the system manages airflow out of the cleanroom space to limit micro‐contamination of the semiconductor devices during manufacturing. As such, control methods to reduce NOx and CO emissions from Fab processes would be limited to treatment at the end of the Fab exhaust management system. An evaluation of specific control technologies for both NOx and CO is presented in the five‐step, top‐down BACT analysis below.
Step 1: Identify all available control technologies.
EPA’s RBLC database did not contain any recent BACT determinations for NOx and CO emissions from semiconductor manufacturing (see Appendix F).
Available Control Technologies for Fab Tool NOx and CO
Control Type Control Technology Control Description
Post Selective Catalytic Reduction (SCR) for NOx
See boiler BACT section.
Post Selective Noncatalytic Reduction (SNCR) for NOx
See boiler BACT section
Post Non Selective Catalytic Reduction (NSCR) for NOx
See boiler BACT section
Post Catalytic oxidation (CatOx) for CO
See boiler BACT section
Post Multiple stage wet chemical scrubber for NOx control
Gaseous NOx compounds are removed from the air stream through chemical absorption. Typically, the gas stream enters a packed bed tower countercurrent to the solvent (water with chemical additives) flow. The packing materials provide a large surface area to facilitate contact between the liquid and gas. The cleaned gas stream typically exits out the top of a vertical tower and the solvent stream is recirculated. A portion of the solvent (liquid) stream is removed from the system to maintain a liquid concentration less than the equilibrium concentration of the gaseous components.
A three stage NOx scrubbing system would include the following:
Stage 1: Oxidation of NO to NO2 using an oxidizing chemical.
Stage 2: Reduction of NO2 to sodium salts using a reducing agent.
Stage 3: Polisher stage to remove odors and residual chemicals.
Step 2: Eliminate technically infeasible options.
The technical feasibility of available NOx control technologies are described below.

SECTION 5 BEST AVAILABLE CONTROL TECHNOLOGY ANALYSIS
ES111914104811PDX 5-19
Evaluation of NOx Control Technology for Technical Feasibility for Fab Tools CO and NOx
Control Technology Technical Feasibility Description
Selective Catalytic Reduction (not feasible)
This technology is not technically feasible. The NOx and CO molecules in the fab exhaust management system are entrained in an air flow of several hundred thousand cubic feet per minute at temperatures not exceeding 70OF. SCR technologies required temperatures of 450 – 800 OF.
Selective Noncatalytic Reduction (not feasible)
This technology is not technically feasible. The NOx and CO molecules in the fab exhaust management system are entrained in an air flow of several hundred thousand cubic feet per minute at temperatures not exceeding 70OF. SNCR technologies require temperatures of 1600 – 2000 OF.
Nonselective Catalytic Reduction (not feasible)
This technology is not technically feasible. The NOx and CO molecules in the fab exhaust management system are entrained in an air flow of several hundred thousand cubic feet per minute. NSCR systems require a fuel rich environment where oxygen concentration are < 0.5%.
Catalytic oxidation (CatOx)(not feasible)
Implementation of add‐on controls, such as catalytic oxidation to the fab exhaust management system, is not technically feasible. Exhaust temperatures are typically 60‐70 OF which is well below the required minimum temperature of 500 OF required for technically feasible application of CatOx.
Multiple Stage Scrubber for NOx (feasible)
This technology is technically feasible. However in addition to an oxidizing agent to oxidize NO to NO2 a reducing agent such as sodium hydroxide would be required to reduce NO2 to sodium salts. Almost all of the NaOH fed to the scrubbers would be consumed by reaction with airborne CO2 thereby generating a very a large amount of wastewater containing mostly Na2CO3.
Step 3: Rank technically feasible options.
Multiple stage scrubbing is the only technically feasible option available remaining and this option is evaluated in Step 4 below.
Step 4: Evaluate most effective controls and document results.
Multiple Stage Scrubbing. NOx is present in relatively low concentrations in Fab exhaust management systems. However, a larger proportion of NOx is found in the acid scrubbed exhaust. Due to economies of scale evaluating the largest exhaust system with the most amount of NOx would produce the most conservative (lowest cost per ton of pollutant removed) cost feasibility assessment. That system is one of the D1X fab acid scrubbed exhaust systems that conveys approximately 380,000 actual cubic feet per minute of air and about 1.14 lb/hr of NOx. Table 5‐7 summarizes the cost feasibility assessment and a detailed cost assessment is provided in Appendix E.
Table 5‐7 NOx Control Cost Comparison
Option 1 Option 2
Cost Component
NOx Base Case
No Additional Control 3‐Stage Wet Chemical Scrubbing
System
Total Capital Investment 0 $24,966,367
Total Annualized Costs 0 $3,827,106
Tons NOx Removed per Year 0 4.74
Cost Effectiveness per Ton NOx Removed 0 $806,804
Incremental Cost Effectiveness per Ton Additional NOx Removeda
Base $806,804
a Incremental cost effectiveness based on difference from base case.

SECTION 5 BEST AVAILABLE CONTROL TECHNOLOGY ANALYSIS
5-20 ES111914104811PDX
The multiple‐stage wet chemical scrubbing system is estimated to remove 4.74 tons of NOx per year, at a cost of $806,804 per ton removed. The control cost is excessive; therefore, the control system is not justified. As previously described, this cost feasibility assessment reviewed one of the largest exhaust systems with the greatest amount of NOx. Due to the higher cost economies‐of‐scale treatment of smaller Fab exhaust systems for NOx, this would result in a cost per ton removed effectiveness of at least as high as the D1X system evaluated.
Step 5: Select BACT.
EPA’s RBLC database did not contain any recent BACT determinations for NOx and CO emissions from semiconductor manufacturing (see Appendix F). Also, providing a wet chemical scrubbing system to control NOx emissions from Fab operations is not economically justified as shown in Table 5‐8. No technically feasible control options for CO were identified. As such, proposed BACT for NOx and CO emissions from Fab tools including POU devices is no additional control and the proposed BACT requirement is to maintain good work practices in operation of the fab.
5.4 Summary of Proposed BACT for New Project Equipment
TABLE 5‐8 Summary of Proposed BACT for New Project Equipment
Pollutant Large Natural
Gas‐fired Boilers Natural Gas‐fired Thermal Oxidizers
Diesel Emergency
Generators and Fire Water Pumps
Fab Tools Including POU
Devices TMXW Systems Small Natural Gas‐fired Units
NOx Low NOx burners with FGR to achieve a NOx emission rate of approximately 0.011 lb‐NOx/MMBtu
Low NOx burners and good combustion practices to achieve a NOx emission rate of approximately 0.098 lb. NOx/MMBtu.
Compliance with 40 CFR Part 60 Subpart IIII to achieve a NOx emission rate of 6.0 g/hp‐hr
No additional controls and good work practices
0.34 lb. NOx/hr Firing with natural gas and operating and maintaining the units in accordance with the manufacturer’s recommendations to achieve good combustion practices.
CO Good combustion practices to achieve a CO emission rate approximately 0.037 lb/MMBtu
Good combustion practices including optimization of thermal oxidation set points to achieve an emission rate of 0.049 lb. CO/MMBtu
Compliance with 40 CFR Part 60 Subpart IIII to achieve a CO emission rate of 3.25 g/hp‐hr
No additional controls and good work practices
0.030 lb. CO/MMBtu
Note:
Proposed BACT does not apply during periods of startup, shutdown, or malfunction.
5.5 BACT Analysis for Preproject Equipment Section 5.2.5 identified the type of preproject equipment subject to BACT for NOx and CO emissions. Section 5.4 provided the BACT analyses for project equipment. The same general “top‐down” BACT approach that was used to analyze project equipment is used for the preproject equipment analyses. However, because the same type of equipment is being evaluated, numerous references to the technical details and conclusions made in the new project equipment analysis are made.

SECTION 5 BEST AVAILABLE CONTROL TECHNOLOGY ANALYSIS
ES111914104811PDX 5-21
5.5.1 Preproject Industrial Boiler NOx BACT Analysis Preproject boilers subject to BACT for NOx emissions include the following:
EU8 ‐ Fab 20 Boilers #1, #2 and #3 (Identical)
F20 BLR‐115‐1‐200
F20 BLR‐115‐2‐200
F20 BLR‐115‐3‐200
EU10 ‐ Fab D1C Boilers #1, #2 and #3, (Identical)
CUB2‐BLR‐115‐1‐210
CUB2‐BLR‐115‐2‐210
CUB2‐BLR‐115‐3‐210
EU15 ‐ Fab D1D Boilers #2 and #3 (Identical)
BLR‐115‐2‐210
BLR‐115‐3‐210
All of these boilers are exclusively natural gas‐fired and have a maximum heat input rating of approximately 32 MMBtu/hr. As part of this current permitting effort, Intel has committed to retrofitting the burners associated with these boilers with low NOx burners to achieve NOx emission rates consistent with the new project boilers of 0.011 lb‐NOx/MMBtu. In addition, Intel is committing to burner retrofits on the following boilers that did not trigger the retro‐active BACT requirement:
EU11a ‐ Fab D1C Boiler #4
CUB2‐BLR‐115‐4‐210
EU16 ‐ Fab D1D Boiler #4
BLR‐115‐4‐210
The new project boiler NOx BACT analysis in Section 5.3.2 evaluated additional end‐of‐stack emission control methods including SCR, SNCR, and NSCR technologies. These technologies were found to be technically and/or economically infeasible to further control NOx emissions and as discussed below the same conclusion applies to evaluating such controls for the existing boilers.
SNCR and NSCR: The existing preproject boilers are hot water boilers similar to the new project boilers. These technologies are also not technically feasible due to the temperature and fuel‐rich limitations discussed in section 5.3.2.
SCR: Section 5.3.2 demonstrated that this technology is not economically feasible even for a new boiler installation. The existing boilers would need to be retro‐fitted and costs associated with demolition and new space configuration would increase costs beyond the new boiler case thereby decreasing cost effectiveness.
Because Intel has committed to retrofit the aforementioned boilers to low NOx burners with FGR, the best available technically and economically feasible control technology for NOx control has been selected. A summary of proposed BACT for preproject equipment is provided in Section 5.6.
5.5.2 Preproject Thermal Oxidizer CO and NOx BACT Analysis Preproject RCTOs subject to BACT for NOx and CO emissions include the following:
EU1 – Fab D1C RCTOs
D1C‐VOC 138‐1‐120
D1C‐VOC 138‐2‐120
D1C‐VOC 138‐3‐120

SECTION 5 BEST AVAILABLE CONTROL TECHNOLOGY ANALYSIS
5-22 ES111914104811PDX
EU3 ‐ Fab D1D RCTOs
VOC 138‐1‐120
VOC 138‐2‐120
VOC 138‐3‐120
VOC 138‐4‐120
EU5 ‐ Fab 15 RCTOs
F15‐AU138‐1‐10
F15‐AU138‐2‐10
Detailed emission calculations for the preproject RCTOs are provided in Appendix E. Table 5‐9 provides a summary of emissions data.
TABLE 5‐9 Preproject RCTO Emissions Data
Burner Capacity (MMBTU)
Annual Utilization Rate (%) NOx Emissions CO Emissions Remarks
2.0 each
70−100 0.098 lb/MMBtu
100 lb/MMCF
0.20 lb/hr
0.86 tpy
0.561‐0.932 lb/MMBtu
573‐971 lb/MMCF
1.1‐1.9 lb/hr
3.4‐6.6 tpy
NOx emission factor based on AP‐42 Table 1.4‐1. CO emission factor based on RCTO specific engineering testing.
In regards to NOx and CO emissions, the following comparative information is provided for the preproject and new project RCTOs:
Similar to the new RCTOs, the combustion mechanics inside the oxidation chamber of the preproject units, including the desorption air stream, are dissimilar from a pure heating device such as a boiler and the overall level of reduction in NOx and CO emissions are generally not comparable.
The calculated level of NOx emissions from the preproject RCTOs is the same as the new project RCTOs
Owing to older burner technology and smaller VOC oxidation chambers, the preproject RCTOs have higher CO emissions than the newer units
5.5.2.1 Preproject RCTO BACT for NOx Section 5.3.4 provided a BACT analysis for the new project RCTOs and concluded post‐oxidation controls including selective catalytic reduction for NOx (the highest level of NOx reduction available) was not economically feasible. The new project RCTO BACT analysis evaluated the largest RCTO (8.0 MMBtu). On a per unit of heat input basis, calculated NOx emission levels for the preproject RCTOs are the same as the new project RCTOs. As such, due to economies of scale, the same cost effectiveness determined for the new project RCTOs using SCR to control NOx would apply to the older units or an estimated cost effectiveness of $78,750/ton. Retrofit expenses would also result in a higher cost per ton of NOx removed. The cost effectiveness of operating the preproject RCTOs with post‐oxidation controls is excessive; therefore, installation of an SCR NOx control system as BACT for the RCTOs is not economically justified.
The next level of control identified in Section 5.3.4 was low NOx burners and good combustion practices and this technology is applicable and in use for the preproject RCTOs. Therefore, Intel proposes BACT to be low NOx burners and good combustion practices to achieve emission rates of 0.098 lb NOx/MMBtu.
5.5.2.2 Preproject RCTO BACT for CO From Section 5.3.4, the highest level of technically feasible control of CO from RCTO units is catalytic oxidation which could reduce CO levels to 10 ppmvd.

SECTION 5 BEST AVAILABLE CONTROL TECHNOLOGY ANALYSIS
ES111914104811PDX 5-23
Owing to older burner technology and smaller VOC oxidation chambers, the preproject RCTOs have higher CO emissions than the newer units. An increase in CO emissions reduction will occur should catalytic oxidation be added downstream of the VOC oxidation chamber. Section 5.3.4 provided the cost data for a CO catalytic oxidation system and Table 5‐10 summarizes a new cost effective evaluation reflecting the increase in CO emissions reduction. Detailed cost estimate data are provided in Appendix E.
TABLE 5‐10 CO Control Cost Comparison
Cost Component Option 1
Base Case No Additional Control Option 2
CO Catalyst
Total Installed Capital Cost 0 $124,315
Total Annualized Costs 0 $62,708
Tons CO Removed per Year 0 5.90
Cost Effectiveness per Ton CO Removed 0 $10,626
Incremental Cost Effectiveness per Ton Additional CO Removed Base $10,626
The cost effectiveness of operating a representative preproject RCTO with CatOx is $10,626/ton. These costs are excessive; therefore, installation of a CatOx system as BACT for the RCTOs is not economically justified.
The next highest level of control that could be applied to the preproject RCTOs would be to retrofit the burners and oxidizers with units similar to the new project RCTOs and potentially achieve similar CO emission levels. The existing VOC abatement system vendor provided capital cost information for such a retrofit and Table 5‐11 summarizes the cost effectiveness evaluation. Detailed cost estimate data are provided in Appendix E.
TABLE 5‐11 CO Control Cost Comparison
Cost Component
Option 1 Base Case No
Additional Control
Option 2 Retrofit w/ new oxidizer/burner
Total Installed Capital Cost 0 $884,925
Total Annualized Costs 0 $97,165
Tons CO Removed per Year 0 5.83
Cost Effectiveness per Ton CO Removed 0 $16,655
Incremental Cost Effectiveness per Ton Additional CO Removed Base $16,655
The cost effectiveness of retrofitting the preproject RCTOs with new oxidizers and burners is $16,655/ton. These costs are excessive; therefore, retrofitting the preproject RCTOs with new oxidizers and burners as BACT for the RCTOs is not economically justified.
The next level of CO control evaluated for the new project RCTOs was good combustion practices including optimizing thermal oxidation setpoints. These practices along with an emission rate of 0.049 lb CO/MMBtu is proposed as BACT for those units. The preproject RCTOs do employ good combustion practices and thermal oxidation setpoints are optimized, but as previously discussed the combustion mechanics of the

SECTION 5 BEST AVAILABLE CONTROL TECHNOLOGY ANALYSIS
5-24 ES111914104811PDX
older RCTOs do not allow for the same level of reduced CO emissions. As such, Intel proposes BACT for the preproject RCTO’s to be good combustion practices including optimizing thermal oxidation setpoints to achieve RCTO specific emission rates which range from 0.561‐0.932 lb. CO/MMBtu as reflected for each unit in the emission inventory in Appendix E.
5.5.3 Preproject TMXW System CO and NOx BACT Analysis The preproject TXMW system subject to BACT for NOx and CO emissions is associated with the D1D emission unit:
EU3 – Fab D1D‐TMXW‐1.
Section 5.3.6 presented the CO and NOx BACT analysis for the new project TMXW systems. As noted in that section there is one existing, i.e., preproject TMXW system and seven new project TMXW systems. In terms of emissions and the emission control system, the systems are identical and the BACT evaluation and conclusions presented in Section 5.3.6 for the new project TMXW systems are wholly applicable to the one preproject TMXW system.
As such, Intel proposes BACT for thermal catalytic control of ammonia occurring in the preproject TMXW system to be as follows:
CO: An emission rate of 0.030 lb CO/MMBTU.
NOx: An emission rate of 0.34 lb NOx/hr.
These emission rates are based on the following:
0.30 lb CO/MMBtu per burner manufacturer and 90% removal of CO across the catalyst.
0.06 lb NOx/MMBtu per burner manufacturer and stoichiometric considerations assuming a maximum ammonia loading of 73.3 lb/hr and at least 90% removal of NOx across the catalyst.
5.5.4 Preproject Fab Tools CO and NOx BACT Analysis The preproject Fab tools subject to BACT for NOx and CO emissions includes the following:
EU1
Fab 20
Fab D1C
RB1
EU3
Fab D1D
EU5
Fab 15 C4
Section 5.3.7 provided a CO and NOx BACT analysis for new project fab tools. The analysis provided estimated CO and NOx emissions for each of the fab exhaust management systems (preproject and new project) and evaluated one of the largest exhaust management systems which due to economies of scale would produce the most cost effective control technology evaluation. The preproject Fabs have very similar operational characteristics and NOx and CO emissions profiles as the new project Fabs. The evaluation in Section 5.3.7 is wholly applicable to the aforementioned preproject Fab CO and NOx emissions. As such, proposed BACT for NOx and CO emissions from preproject Fab tools is no additional control and the proposed BACT requirement is to maintain good work practices in operation of the fab.

SECTION 5 BEST AVAILABLE CONTROL TECHNOLOGY ANALYSIS
ES111914104811PDX 5-25
5.6 Summary of Proposed BACT for Preproject Equipment Table 5‐12 provides a summary of proposed BACT for preproject equipment.
TABLE 5‐12 Summary of Proposed BACT for Preproject Equipment
Pollutant Large Natural Gas‐fired
Boilers Natural Gas‐fired Thermal
Oxidizers
Fab Tools Including POU
Devices TMXW System
BSSW Small Natural Gas‐
fired Unit
NOx Low NOx burners with FGR to achieve a NOx emission rate of approximately 0.011 lb‐NOx/MMBtu
Low NOx burners and good combustion practices to an emission rates of 0.098 lb. NOx/MMBtu.
No additional controls
0.34 lb. NOx/hr Firing with natural gas and operating and maintaining the units in accordance with the manufacturer’s recommendations to achieve good combustion practices.
CO Good combustion practices to achieve a CO emission rate of approximately 0.037 lb/MMBtu
Good combustion practices including optimization of thermal oxidation set points to achieve RCTO specific emission rates for CO which range from 0.561‐0.932 lb. CO/MMBtu
No additional controls
0.030 lb. CO/MMBtu

This page intentionally left blank

SECTION 6
ES111914104811PDX 6-1
Ambient Air Quality Analysis for Criteria Pollutants This section summarizes the methodology and results of Intel’s analysis of the impacts of the combined Facility emissions, and it compares the results to the Class II PSD Increments, Class I PSD Increments, and NAAQS.
Intel’s protocol, dated November 2014 and entitled Air Dispersion Modeling Protocol for Class II Areas (Modeling Protocol), proposed the methodology and scope of the analysis presented in this section. A copy of the Modeling Protocol is provided in Appendix G. The Modeling Protocol identified the methodology used to conduct dispersion modeling for those criteria pollutants for which the requested PSEL exceeds the netting basis by a SER or more as required by OAR 340‐222‐0041(3)(b)(C) and 340‐224‐0060(3).
Appendix G contains a copy of the modeling protocol describing the modeling steps that were performed to support this Type 4 permit application. DEQ approved the modeling protocol in a Memorandum from Phil Allen to George Davis dated December 10, 2014, and a copy of the Memorandum is included in Appendix G. In accord with the approval Memorandum the emergency generators were modeled as existing and project surrogate generators. Both the maximum existing and maximum project surrogate generators were included for all pollutant and averaging periods except 1‐hour NO2 maximum modeled impacts. In addition, all emergency generators were modeled with operating hours from 8 am to 8 pm.
6.1 Standards and Criteria Levels The applicable air quality standards and criteria adopted by DEQ including the Oregon significant impact levels (SIL), NAAQS, and Class II PSD Increments are summarized in Table 6‐1.
TABLE 6‐1 Summary of Air Quality Standards and Applicable Criteria
Pollutant Averaging Period
Significant Impact Level (μg/m3)
Primary NAAQSe
(μg/m3) Class II PSD
Increment (μg/m3)Class I PSD
Increment (μg/m3) Secondary NAAQS
(μg/m3)
PM10 24‐Hour 1 150a 30b 8 150
PM10 Annual 0.2 ‐‐ 17 4 ‐‐
PM2.5 24‐Hour 1.2 35c 9b 2 35
PM2.5 Annual 0.3 12 4 1 15
NO2 Annual 1 100 25 2.5 100
NO2 1‐Hourf 7.56 188d ‐‐ ‐‐ ‐‐
CO 1‐Hour 2,000 40,000b ‐‐ ‐‐ ‐‐
CO 8‐Hour 500 10,000b ‐‐ ‐‐ ‐‐
aNot to be exceeded more than once per year on average over 3 years. bAllowed to be exceeded once per year. c3‐year average of the 98th percentile of the 24‐hour concentration d98th percentile averaged over 3 years. eThe national ambient air quality standards (NAAQS) for the pollutants included in this modeling analysis are equivalent to the Oregon state ambient air quality standards for those pollutants.
Notes: ‐‐ = no standard CO = carbon monoxide μg/m3 = microgram(s) per cubic meter NO2 = nitrogen dioxide PM10 = particulate matter less than 10 micrometers in aerodynamic diameter PM2.5 = particulate matter less than 2.5 micrometers in aerodynamic diameter

SECTION 6 AMBIENT AIR QUALITY ANALYSIS FOR CRITERIA POLLUTANTS
6-2 ES111914104811PDX
6.2 Modeling Approach The first step in the air quality analysis was to model the project emissions for each pollutant for comparison to the SIL defined in Table 6‐1. If the predicted impacts were not significant for that pollutant and averaging time (that is, less than the SIL), the modeling is complete for that pollutant under that averaging time and compliance with the NAAQS is demonstrated. If impacts were greater than the SIL, a more refined analysis was conducted as described below.
6.2.1 PM2.5 Modeling Approach As detailed in the Modeling Protocol, in recent guidance from EPA on PM2.5 modeling for comparison to NAAQS and PSD Increments, EPA indicated that when the sum of the design background concentration and the PM2.5 SIL are less than the PM2.5 NAAQS, the use of the SIL would be sufficient to conclude that a facility’s impact equal to or below the SIL will not cause or contribute to a violation of the NAAQS. The sum of the 1149 NE Grant Street EPA Air Quality System station design background PM2.5 concentration and the SIL are less than the NAAQS. Therefore, modeling will be complete and compliance with the NAAQS will be demonstrated if the modeled emission rates from emission sources added to the Facility on or after May 1, 2011, are below the SIL.
6.3 Significant Air Quality Impact Level Analysis Intel conducted the SIL analysis for project emissions of PM10, PM2.5, NO2, and CO. The modeled results compared to their respective SILs are displayed in Table 6‐2. The predicted impacts were above the SIL for 1‐hr CO, 1‐hr NO2, 24‐hr PM2.5, 24‐hr PM10, annual NO2, annual PM2.5, and annual PM10 , so a more refined analysis was conducted for those pollutants and averaging times as described in the Modeling Protocol and summarized below.
TABLE 6‐2 Results of Significant Impact Level Analysis
Pollutant Averaging Period
Significant Impact Level (µg/m³)
Maximum Modeled Concentration (µg/m³)
Above SIL?
PM10 24‐Hour 1 22.83 Yes
PM10 Annual 0.2 3.14 Yes
PM2.5 24‐Houra 1.2 4.14 Yes
PM2.5 Annual 0.3 0.99 Yes
NO2 1‐hra 7.56 99.87 Yes
NO2 Annualb 1 7.95 Yes
CO 1‐hr 2,000 4,710 Yes
CO 8‐hr 500 269.32 No
a Value represents the highest of the 5‐year averages of the maximum modeled concentration predicted each year
b OLM used to convert NOx to NO2
Notes: PM2.5 impacts include impacts associated with PM2.5 precursor NOx
µg/m³ = micrograms per cubic meter
6.4 Refined Analyses—Criteria Pollutants The project was determined to exceed the SIL for 1‐hr CO, 1‐hr NO2, 24‐hr PM2.5, 24‐hr PM10, annual NO2 annual PM2.5, and annual PM10. The refined analysis requires comparison to the NAAQS and Class II PSD Increments as outlined in the Modeling Protocol.

SECTION 6 AMBIENT AIR QUALITY ANALYSIS FOR CRITERIA POLLUTANTS
ES111914104811PDX 6-3
6.4.1 Refined Analyses—NAAQS For the NAAQS analysis, impacts from all Facility new project and preproject sources, plus nearby competing sources, were added to a representative background concentration and compared to the NAAQS for that pollutant and averaging time. DEQ identified nearby competing sources, including emissions and exhaust characteristics for those sources. A complete list was provided by DEQ. Ambient background concentration data used for this analysis are from two sites. All pollutants except PM2.5 are from the EPA Air Quality System station operated by DEQ in Portland, Oregon (5824 SE Lafayette St.), and PM2.5 background data are from the EPA Air Quality System station operated by DEQ in Hillsboro, Oregon (1149 NE Grant St.) The ambient background design values for the pollutants modeled were provided by DEQ. The SE Lafayette St. site was chosen because three years of consecutive data (2010‐2012) for the pollutants being modeled are available. The monitor site is approximately 28 kilometers (km) from the Facility and is therefore considered representative. The NE Grant St. PM2.5 monitor is located approximately 5 km from the Facility. Since this monitoring site is closer to the Facility and has recent PM2.5 data (2011‐2013), DEQ requires use of the data from this site for the PM2.5 background.
Table 6‐3 summarizes the model design ambient background concentrations used in the refined analyses. The 1‐hour NO2 ambient season‐hour background profile is summarized in Table 6‐4.
The May 2014 PM2.5 permit modeling guidance indicates that when a source’s secondary PM2.5 impacts are assessed as part of the modeling inventory, it is appropriate to add the modeled design value (the 98th percentile of the modeled daily concentration averaged over five years on a receptor by receptor basis) to the design background value. This is considered a First Tier approach. For this analysis, the Second Tier approach, using seasonal background values in place of the design value, was used to account for temporally varying monitored background concentrations. The Second Tier seasonal background values were calculated with Hare Field PM2.5 station data using the maximum value (removing the top two values from each year) by season per year and averaging over 3 years of data. The background concentrations used in this analysis are also shown in Table 6‐3. The Second Tier seasonal background values for 24‐hour PM2.5 are shown in Table 6‐5.
TABLE 6‐3 Ambient Background Concentrations (micrograms per cubic meter)
Pollutant Value Description 2010 2011 2012 Model Design Value Used
CO 1‐hour 3,200 3,886 4,229 4,229
8‐hour 2,743 2,971 2,629 2,971
PM2.5a 24‐hourb Using Seasonal Modeling Design Value Seasonal Model
Design Value (See Table 6‐5)
Annual 8.7 7.1 9.3 8.4
PM10 24‐hourc 35 52 46 52
NO2 1‐hour Using Season‐Hour‐of‐Day Profile Season‐Hour of Day Profile (See
Table 6‐4)
Annual 17 18 17 18
a PM2.5 values are for years 2011‐2013 from the NE. Grant St. station. b 98th percentile for values measured in the year. c Second‐highest value Notes: CO = carbon monoxide NO2 = nitrogen dioxide PM10 = particulate matter less than 10 micrometers in aerodynamic diameter PM2.5 = particulate matter less than 2.5 micrometers in aerodynamic diameter

SECTION 6 AMBIENT AIR QUALITY ANALYSIS FOR CRITERIA POLLUTANTS
6-4 ES111914104811PDX
TABLE 6‐4 1‐hour NO2 Ambient Season‐Hour Background Profile In parts per million
Hour Winter Spring Summer Fall
1 0.027 0.03 0.022 0.025
2 0.027 0.027 0.022 0.027
3 0.026 0.028 0.022 0.027
4 0.026 0.027 0.022 0.029
5 0.027 0.027 0.025 0.029
6 0.025 0.029 0.025 0.029
7 0.028 0.028 0.025 0.029
8 0.029 0.026 0.023 0.029
9 0.03 0.024 0.021 0.024
10 0.027 0.021 0.019 0.024
11 0.027 0.018 0.015 0.024
12 0.025 0.018 0.017 0.022
13 0.027 0.017 0.013 0.022
14 0.025 0.015 0.014 0.022
15 0.026 0.015 0.014 0.025
16 0.029 0.017 0.012 0.026
17 0.03 0.018 0.014 0.031
18 0.034 0.023 0.014 0.035
19 0.033 0.032 0.017 0.042
20 0.032 0.038 0.023 0.038
21 0.032 0.04 0.029 0.035
22 0.032 0.037 0.029 0.033
23 0.031 0.034 0.026 0.031
24 0.031 0.032 0.024 0.027

SECTION 6 AMBIENT AIR QUALITY ANALYSIS FOR CRITERIA POLLUTANTS
ES111914104811PDX 6-5
TABLE 6‐5 Seasonal 24‐hour PM2.5 Ambient Background Concentrations In micrograms per cubic meter
Season Corresponding Months 2011 2012 2013 Model Design Value
Winter Dec, Jan, Feb 36.20 17.20 36.40 29.93
Spring Mar, Apr, May 9.80 11.30 18.00 13.03
Summer Jun, July, Aug 4.60 10.80 6.20 7.2
Fall Sep, Oct, Nov 24.50 22.20 42.80 29.83
Table 6‐6 summarizes the results of the NAAQS analysis. The Facility will not cause or contribute to an exceedance of any NAAQS.
TABLE 6‐6 Results of NAAQS Analysis
Pollutant Averaging Period
Maximum Modeled Concentration
(µg/m³)c
Background Concentration
(µg/m3) Total Impact (µg/m3)
NAAQS (µg/m3)
Above NAAQS?
PM10 24‐Hour 19.27 52 71.27 150 No
PM2.5 24‐Houra 34.90 Included 34.90 35 No
PM2.5 Annual 1.73 8.4 10.13 12 No
CO 1‐Hour 4,483 4,229 8,712 40,000 No
NO2 Annualb 10.31 18.00 28.31 100 No
NO2 1‐hra 168.04 Included 168.04 188 No
a Value represents the highest of the 5‐year averages of the maximum modeled concentration predicted each year. b OLM method was used to convert annual NOx to NO2. c Includes competing sources.
Notes: µg/m³ = micrograms per cubic meter PM2.5 impacts include impacts associated with PM2.5 precursor NOx
6.4.2 Refined Analysis—Class II PSD Increment A similar methodology was used for the Class II PSD Increment analysis as for the NAAQS analysis. All Facility sources were considered increment consuming and were included in the increment analyses. A complete list of increment‐consuming competing sources, including emissions and exhaust characteristics, were provided by DEQ.
Table 6‐7 summarizes the results of the Class II PSD increment analyses. The Facility and increment‐consuming sources are less than the applicable Class II PSD Increments for all pollutants.

SECTION 6 AMBIENT AIR QUALITY ANALYSIS FOR CRITERIA POLLUTANTS
6-6 ES111914104811PDX
TABLE 6‐7 Results of Class II PSD Analysis
Pollutant Averaging Period
Maximum Modeled Concentration
(µg/m³)b
Class II PSD Increment (µg/m3)
Above Class II PSD
Increment?
PM10 24‐Hour 21.12 30 No
PM10 Annual 3.32 17 No
PM2.5 24‐Hour 7.41 9 No
PM2.5 Annual 1.80 4 No
NO2 Annuala 10.31 25 No
a OLM used to convert annual NOx to NO2
b Includes competing sources
Notes:
PM2.5 impacts include impacts associated with PM2.5 precursor NOx
µg/m³ = micrograms per cubic meter
6.5 Class I PSD Increment Analysis An analysis was performed to demonstrate that the Facility does not cause or contribute to a NAAQS or PSD increment exceedance in any Class I area. The Facility is located within 300 km of several Class I areas. The areas evaluated and the distance from the Facility are detailed in Table 6‐8.
TABLE 6‐8
Class I Distances
Class I Area
Distance to Ronler Acers
(km) Distance to Aloha (km)
Shortest Distance from Site to Class I (km)
Mount Hood Wilderness 80 76 76
Mount Jefferson Wilderness 116 111 111
Mount Washington Wilderness 145 144 144
Three Sisters Wilderness 163 158 158
Mt. Adams Wilderness 121 122 121
Goat Rocks Wilderness 145 147 145
Mt. Rainier National Park 153 156 153
Olympic National Park 276 278 276
OAR 340‐225‐0060(2)(a) states that a single source impact analysis is sufficient to show compliance with Class I increments if modeled impacts from emission increases equal to or greater than a significant emission rate above the netting basis due to the proposed source or modification being evaluated are demonstrated to be less than the Class I SILs. For the Class I increment analysis, impacts were calculated using AERMOD (v14134) model with receptors placed at a distance of 50 km. Class I areas within 300 km of the Facility were represented by a 50‐km radius ring of receptors placed at the highest overall elevation (4,392 meters) and the lowest overall elevation (0 meter). A third ring was placed at the elevation represented by the stable plume height for a centrally located boiler (114 meters, 51 meters above the

SECTION 6 AMBIENT AIR QUALITY ANALYSIS FOR CRITERIA POLLUTANTS
ES111914104811PDX 6-7
source base elevation). This representative height was determined from the SCREEN3 model under conditions of F stability, and a wind speed of 2.5 m/s. The receptor rings were placed every 2 degrees for each of the three heights at the 50 km distance from the Facility.
Maximum modeled concentrations were compared to the Class I SILs and Class I PSD Increments. The results are summarized in Table 6‐9. The maximum modeled impacts were below the Class I SIL for all modeled pollutants and averaging times. The Facility is not expected to cause or contribute to an exceedance of the Class I Increment.
TABLE 6‐9
Comparison of Modeled Concentrations with PSD Class I Significant Impact Levels and Increments
Pollutant Averaging Period Maximum Modeled
Concentration (µg/m3) Class I Significant Impact
Level (µg/m3) Class I Increment
(µg/m3)
NO2 Annual 0.0535 0.1 2.5
PM10 Annual 0.0100 0.2 4
24‐Hour 0.1678 0.3 8
PM2.5 Annual 0.0075 0.06 1
24‐Hour 0.0325 0.07 2
µg/m³ = micrograms per cubic meter

This page intentionally left blank

SECTION 7
ES111914104811PDX 7-1
References Reisman, Joel and Gordon Frisbie. 2002. “Calculating Realistic PM10 Emissions from Cooling Towers.” Presented at Air and Waste Management Association Annual Conference. Abstract No. 2016. Session No. AM‐1b. Greystone Environmental Consultants, Inc.
U.S. Environmental Protection Agency (EPA). 1990. New Source Review Workshop Manual: Prevention of Significant Deterioration and Nonattainment Area Permitting. October.
.

This page intentionally left blank

Appendix A Air Contaminant Discharge Permit Forms

This page intentionally left blank


FORM AQ101 ADMINISTRATIVE INFORMATION ANSWER SHEET
Oregon Department of Environmental Quality Page 2 Air Contaminant Discharge Permit Application Revised 3/4/10
FEE INFORMATION (Make the check payable to DEQ)
Note: The initial application fees and annual fees specified below (OAR 340-216-0020, Table 2, Parts 1 and 2) are only required for initial permit applications. These fees are not required for an application to renew or modify an existing permit. The appropriate specific activity fee(s) specified below (OAR 340-216-0020, Table 2, Part 3) applies to permit modifications or may be in addition to initial permit application fees.
OAR 340-216-0020, Table 2, Part 1 – INITIAL PERMITTING APPLICATION FEES:
Short Term Activity ACDP
Simple ACDP
Construction ACDP
Standard ACDP
Standard ACDP (PSD/NSR)
OAR 340-216-0020, TABLE 2, PART 2 - ANNUAL FEES:
Simple ACDP – Low fee class
Simple ACDP – High fee class
Standard ACDP
OAR 340-216-0020, TABLE 2, PART 3 - SPECIFIC ACTIVITY FEES:
Non-technical permit modification
Non-PSD/NSR basic technical permit modification
Non-PSD/NSR simple technical permit modification
Non-PSD/NSR moderate technical permit modification
Non-PSD/NSR complex technical permit modification
PSD/NSR modification
Modeling review (outside PSD/NSR)
Public hearing at applicant’s request
State MACT determination
TOTAL FEES
SUBMIT TWO COPIES OF THE COMPLETED APPLICATION TO:
New or Modified Permits (include fees): Permit Renewals (no fees):
Oregon Department of Environmental QualityBusiness Office811 SW Sixth AvenuePortland, OR 97204-1390
Oregon Department of Environmental QualityAir Quality Program, Northwest Region Office2020 SW 4th Avenue, Suite 400Portland, Oregon 97201-4987
$50,400
$50,400

FORM AQ102 FACILITY DESCRIPTION INSTRUCTIONS
Oregon Department of Environmental Quality Page 1 Air Contaminant Discharge Application Revised 10/07
1. Provide a text description of the facility processes. In describing the facility, and in preparing the permit application the applicant should always remember that the permit should be written to cover the facility as it will operate for the future permit term. A permit term is five or ten years depending on the type of permit issued. Providing information on future operations now may prevent the need for the additional cost of permit modifications in the future. The applicant should provide the information requested below.
• A description of the current processes that emit air pollutants; • The fuels used and products produced in these processes; • If this application is for a permit modification, a discussion of the proposed modification; • If this application is for a renewed ACDP, a description of any anticipated modifications to the
facility’s existing processes during the pending permit term that the ACDP will need to address; and
• If this application is for an initial or renewed ACDP, a description of any anticipated construction at the facility during the pending permit term that the ACDP will need to address.
2. Attach a plot plan showing the location of all stacks and vents though which regulated pollutants are released to the atmosphere.
3. Attach process flow diagram, which shows the air pollutant emitting processes at the facility. The diagram should illustrate the following. The applicant should ask the DEQ permit writer about the level of detail that is required.
• All regulated air pollutant-emitting devices and processes at the facility, labeled with the same identification numbers that the applicant assigned them in Form Series AQ200.
• Flow routes of contaminated air from processes to emission control equipment and emission points.
• All air pollution control devices at the facility, labeled with the same identification numbers that the applicant assigned them in Form Series AQ300.
• The location of all stacks and vents through which regulated pollutants are released to the atmosphere.
• Any materials handling activities that emit regulated pollutants (e.g., loading crushed rock, storage piles, etc.) not addressed in a Device/Process Form (series AQ200).
• Any fuel storage and piping systems on the facility property.
4. Attach a city map or drawing showing the facility location, property lines and its relation to nearby (i.e., within 1 mile) sensitive receptors such as residential areas, hospitals, schools, etc. If the facility is located in a rural area, the applicant should note distances on approaching roads and also mark the location of landmarks.
Print Form

FORM AQ102 FACILITY DESCRIPTION ANSWER SHEET
Oregon Department of Environmental Quality Page 2 Air Contaminant Discharge Application Revised 10/07
Facility Name: Permit Number:
1. Description of facility and processes:
3. Attach plot plan.
4. Attach process flow diagram.
5. Attach a city map or drawing showing the facility location.
Please see application text for plot plans, process flowdiagrams and facility location map.
Intel Corporation Aloha / Ronler Acres Campuses 34-2681-ST-01
Intel Corporation purchased the Aloha Campus property and began construction in 1973 of asemiconductor wafer fabrication facility (Fab), office building and support areas that began operation in1975. Primary operations involved R&D and manufacturing. Three fabs were built at this location goingby various names depending upon their business unit and purpose. These included Fab 4, Fab 5 / D1,and D1A / Fab 15. Most original operations had ceased by 2003/2004 when the focus shifted to back-endoperations (Die Prep, C4 and Sort). There were several wafer size conversions (3" to 4" to 6" to 8" to 12").Primary R&D and manufacturing operations moved to the Ronler Acres Campus when constructionbegan on office, support and wafer fab D1B (Fab 20) in 1994 with operations beginning in 1996.Additional office, support and fabs were built to include RB1, D1C, RP1, D1D and D1X (currently underconstruction).
Semiconductor manufacturing begins with a silicon wafer substrate. It then involves growth orapplication of various layers, patterning using photoresist, thermal diffusion, etching, doping,metalization, acid or solvent treatments and ultrapure water rinse steps. There are multiple processeswith unique "recipe" steps. Many of these steps are repeated multiple times in various sequences andwith variations in each step. There are significant technology revisions approximately every 2 years.

BOILERSFORM AQ208
ANSWER SHEET
Oregon Department of Environmental QualityAir Contaminant Discharge Permit Application
Page 1 of 1Revised 4/25/00
Facility Name: Intel Corporation Aloha Campus Permit Number: 34-2681-ST-01
1. Boiler Information:
Boiler identification F5-HW-BLR01 F5-HW-BLR02 F5-HW-BLR03 F5-HW-BLR04 F15-BLR28-1-1 F15-BLR28-1-2 F15-BLR28-1-3 F15-HW35-3 F15-HW35-4
Manufacturer Bryan / Flexible Tube Brian / Flexible Tube Cleaver Brooks Cleaver Brooks Cleaver Brooks Cleaver Brooks Cleaver Brooks Legend Aerco
Date manufactured (month/year) 1978 1978 1992 1992 2013 2013 2013 1997 2013
Date construction commenced (month/year)
approx. 1978 approx 1978 approx 1992 approx 1992 41640 41641 41642 1997 2013
Date installed (month/year) Jan-84 Jan-84 Jan-84 Jan-84 Jun-14 Jun-14 Jun-14 1998 2013
Rated design heat input capacity (million Btu per hour)
6.5000 6.5000 6.6940 6.6940 20.9220 20.9220 20.9220 1.0000 1.0000
Rated steam production capacity (pounds per hour)
N/A (Hot Water) N/A (Hot Water) N/A (Hot Water) N/A (Hot Water) N/A (Hot Water) N/A (Hot Water) N/A (Hot Water) N/A (Hot Water) N/A (Hot Water)
Primary fuel type Natural Gas Natural Gas Natural Gas Natural Gas Natural Gas Natural Gas Natural Gas Natural Gas Natural Gas
Max. fuel quantity used per hour (SCF/Hr)
6372.5 6372.5 6562.7 6562.7 20511.8 20511.8 20511.8 980.4 980.4
Max. fuel quantity used per year
(MMSCF/Yr)a 55.8 55.8 57.5 57.5 179.7 179.7 179.7 8.6 8.6
If oil is used, sulfur content (% by wt.) n/a n/a n/a n/a n/a n/a n/a n/a n/a
Secondary fuel type none none none none none none none none none
Max. fuel quantity used per hour (include units)
n/a n/a n/a n/a n/a n/a n/a n/a n/a
Max. fuel quantity used per year (include units)
n/a n/a n/a n/a n/a n/a n/a n/a n/a
If oil is used, sulfur content (% by wt.) n/a n/a n/a n/a n/a n/a n/a n/a n/a
Stack identification F51151 F51152 F51153 F51154 F151156 F151157 F151158 F151154 F151151
Stack height (feet) 75.5 75.5 75.5 75.5 47 47 47 75.53 75.5
Stack gas flow rate at maximum load (ACFM)
5726.66 5726.66 5726.66 5726.66 9509.16 9509.16 9509.16 390.18 5350.99
Control device(s) identification from AQ300 series form(s)
n/a n/a n/a n/a n/a n/a n/a n/a n/a
Continuous monitoring systems n/a n/a n/a n/a n/a n/a n/a n/a n/a
2. Describe how the boiler(s) is operated. (Refer to instructions for guidance)Gas fired, fire tube heating water boilers, forced draft.
a Maximum values are provided. Average annual operating capacity across all boilers is 30%.

This page intentionally left blank.

BOILERSFORM AQ208
ANSWER SHEET
Oregon Department of Environmental QualityAir Contaminant Discharge Permit Application
Page 1 of 8Revised 4/25/00
Facility Name: Intel Corporation Ronler Acres Campus Permit Number: 34-2681-ST-01
1. Boiler Information:
Boiler identification F20-BLR115-1-200 F20-BLR115-2-200 F20-BLR115-3-200 F20-BLR115-4-200 RA1-MECH-B01 RA1-MECH-B02 CUB2-BLR115-1-210 CUB2-BLR115-2-210
Manufacturer Johnson Johnson Johnson Cleaver Brooks AO Smith Company AO Smith Company Superior Superior
Date manufactured (month/year) 1995 1995 1995 2013 2009 1994 1998 1998
Date construction commenced (month/year)
1994 1994 1994 ~2013 2010 1995 ~1998 ~1998
Date installed (month/year) Nov-95 Nov-95 Nov-95 Nov-13 Oct-10 Nov-95 May-98 May-98
Rated design heat input capacity (million Btu per hour)
31.500 31.500 31.500 30.6150 0.7200 1.0000 32.1120 32.1120
Rated steam production capacity (pounds per hour)
N/A (Hot Water) N/A (Hot Water) N/A (Hot Water) N/A (Hot Water) N/A (Hot Water) N/A (Hot Water) N/A (Hot Water) N/A (Hot Water)
Primary fuel type Natural Gas Natural Gas Natural Gas Natural Gas Natural Gas Natural Gas Natural Gas Natural Gas
Max. fuel quantity used per hour (SCF/Hr)
30882.4 30882.4 30882.4 30014.7 705.9 980.4 31482.4 31482.4
Max. fuel quantity used per year
(MMSCF/Yr)a 270.5 270.5 270.5 262.9 6.2 8.6 275.8 275.8
If oil is used, sulfur content (% by wt.)
n/a n/a n/a n/a n/a n/a n/a n/a
Secondary fuel type None None None None None None None None
Max. fuel quantity used per hour (include units)
n/a n/a n/a n/a n/a n/a n/a n/a
Max. fuel quantity used per year (include units)
n/a n/a n/a n/a n/a n/a n/a n/a
If oil is used, sulfur content (% by wt.)
n/a n/a n/a n/a n/a n/a n/a n/a
Stack identification D1B1151 D1B1152 D1B1153 D1B1154 RA11151 RA11152 D1C1151 D1C1152
Stack height (feet) 99.00 99.00 99.00 99.00 95.00 95.00 70.00 70.00
Stack gas flow rate at maximum load (ACFM)
12,534 12,534 12,534 7,982 448 448 5,116 5,116
Control device(s) identification from AQ300 series form(s)
n/a n/a n/a n/a n/a n/a n/a n/a
Continuous monitoring systems n/a n/a n/a n/a n/a n/a n/a n/a
2. Describe how the boiler(s) is operated. (Refer to instructions for guidance)Gas fired, fire tube heating water boilers, forced draft.
a Maximum values are provided. Average annual operating capacity across all boilers is 30%.

BOILERSFORM AQ208
ANSWER SHEET
Oregon Department of Environmental QualityAir Contaminant Discharge Permit Application
Page 2 of 8Revised 4/25/00
1. Boiler Information:
Boiler identification
Manufacturer
Date manufactured (month/year)
Date construction commenced (month/year)
Date installed (month/year)
Rated design heat input capacity (million Btu per hour)Rated steam production capacity (pounds per hour)
Primary fuel type
Max. fuel quantity used per hour (SCF/Hr)Max. fuel quantity used per year
(MMSCF/Yr)a
If oil is used, sulfur content (% by wt.)
Secondary fuel type
Max. fuel quantity used per hour (include units)Max. fuel quantity used per year (include units)If oil is used, sulfur content (% by wt.)
Stack identification
Stack height (feet)
Stack gas flow rate at maximum load (ACFM) Control device(s) identification from AQ300 series form(s)
Continuous monitoring systems
Facility Name: Intel Corporation Ronler Acres Campus Permit Number: 34-2681-ST-01
CUB2-BLR115-3-210 CUB2-BLR115-4-210 CUB2-BLR115-5-210 RA4-BLR152-2-30 RA4-BLR152-1-30 RA4-BLR117-2-30 RA4-BLR117-1-30 BLR-115-1-210
Superior Cleaver Brooks Cleaver Brooks PVI Industries PVI Industries Hydro Therm Hydro Therm Cleaver Brooks
1998 2000 2012 2014 2014 2014 2014 2001
~1998 ~2000 ~2012 ~2014 ~2014 ~2014 ~2014 ~2001
May-98 May-00 July-12 Q3 2014 Q3 2014 Q3 2014 Q3 2014 May-01
32.1120 32.6590 29.3920 0.5000 0.5000 1.9990 1.9990 8.1650
N/A (Hot Water) N/A (Hot Water) N/A (Hot Water) N/A (Hot Water) N/A (Hot Water) N/A (Hot Water) N/A (Hot Water) N/A (Hot Water)
Natural Gas Natural Gas Natural Gas Natural Gas Natural Gas Natural Gas Natural Gas Natural Gas
31482.4 32018.6 28815.7 490.2 490.2 1959.8 1959.8 8004.9
275.8 280.5 252.4 4.3 4.3 17.2 17.2 70.1
n/a n/a n/a n/a n/a n/a n/a n/a
None None None None None None None None
n/a n/a n/a n/a n/a n/a n/a n/a
n/a n/a n/a n/a n/a n/a n/a n/a
n/a n/a n/a n/a n/a n/a n/a n/a
D1C1153 D1C1154 D1C1155 RA41154 RA41153 RA41152 RA41151 D1D1151
70.00 70.00 70.00 121.00 121.00 121.00 121.00 51.00
5,116 5,116 7,982 541 541 3,544 3,544 1,741
n/a n/a n/a n/a n/a n/a n/a n/a
n/a n/a n/a n/a n/a n/a n/a n/a
2. Describe how the boiler(s) is operated. (Refer to instructions for guidance)Gas fired, fire tube heating water boilers, forced draft.
a Maximum values are provided. Average annual operating capacity across all boilers is 30%.

BOILERSFORM AQ208
ANSWER SHEET
Oregon Department of Environmental QualityAir Contaminant Discharge Permit Application
Page 3 of 8Revised 4/25/00
1. Boiler Information:
Boiler identification
Manufacturer
Date manufactured (month/year)
Date construction commenced (month/year)
Date installed (month/year)
Rated design heat input capacity (million Btu per hour)Rated steam production capacity (pounds per hour)
Primary fuel type
Max. fuel quantity used per hour (SCF/Hr)Max. fuel quantity used per year
(MMSCF/Yr)a
If oil is used, sulfur content (% by wt.)
Secondary fuel type
Max. fuel quantity used per hour (include units)Max. fuel quantity used per year (include units)If oil is used, sulfur content (% by wt.)
Stack identification
Stack height (feet)
Stack gas flow rate at maximum load (ACFM) Control device(s) identification from AQ300 series form(s)
Continuous monitoring systems
Facility Name: Intel Corporation Ronler Acres Campus Permit Number: 34-2681-ST-01
BLR-115-2-210 BLR-115-3-210 BLR-115-4-210 BLR-115-5-210 RP1-BLR115-1-210 RP1-BLR115-2-210 RP1-BLR115-3-210 RP1-BLR115-4-210
Cleaver Brooks Cleaver Brooks Cleaver Brooks Cleaver Brooks Cleaver Brooks Cleaver Brooks Cleaver BrooksCleaver Brooks or
equivalent
2001 2001 ~2008 2009 2000 2000 2001 TBD
~2001 ~2001 ~2008 9/30/2008 ~2003 ~2003 ~2003 TBD
May-01 May-01 May-08 May-09 June-03 June-03 June-03 Future TBD
32.6590 32.6590 32.6590 14.2880 4.1840 12.2470 12.2470 11.7150
N/A (Hot Water) N/A (Hot Water) N/A (Hot Water) N/A (Hot Water) N/A (Hot Water) N/A (Hot Water) N/A (Hot Water) N/A (Hot Water)
Natural Gas Natural Gas Natural Gas Natural Gas Natural Gas Natural Gas Natural Gas Natural Gas
32018.6 32018.6 32018.6 14007.8 4102.0 12006.9 12006.9 11485.3
280.5 280.5 280.5 122.7 35.9 105.2 105.2 100.6
n/a n/a n/a n/a n/a n/a n/a n/a
None None None None None None None None
n/a n/a n/a n/a n/a n/a n/a n/a
n/a n/a n/a n/a n/a n/a n/a n/a
n/a n/a n/a n/a n/a n/a n/a n/a
D1D1152 D1D1153 D1D1154 D1D1155 RP1151 RP1152 RP1153 RP1154
51.00 51.00 51.00 51.00 42.00 42.00 42.00 42.00
6,964 6,964 3,047 4,402 909 909 909 909
n/a n/a n/a n/a n/a n/a n/a n/a
n/a n/a n/a n/a n/a n/a n/a n/a
2. Describe how the boiler(s) is operated. (Refer to instructions for guidance)Gas fired, fire tube heating water boilers, forced draft.
a Maximum values are provided. Average annual operating capacity across all boilers is 30%.

BOILERSFORM AQ208
ANSWER SHEET
Oregon Department of Environmental QualityAir Contaminant Discharge Permit Application
Page 4 of 8Revised 4/25/00
1. Boiler Information:
Boiler identification
Manufacturer
Date manufactured (month/year)
Date construction commenced (month/year)
Date installed (month/year)
Rated design heat input capacity (million Btu per hour)Rated steam production capacity (pounds per hour)
Primary fuel type
Max. fuel quantity used per hour (SCF/Hr)Max. fuel quantity used per year
(MMSCF/Yr)a
If oil is used, sulfur content (% by wt.)
Secondary fuel type
Max. fuel quantity used per hour (include units)Max. fuel quantity used per year (include units)If oil is used, sulfur content (% by wt.)
Stack identification
Stack height (feet)
Stack gas flow rate at maximum load (ACFM) Control device(s) identification from AQ300 series form(s)
Continuous monitoring systems
Facility Name: Intel Corporation Ronler Acres Campus Permit Number: 34-2681-ST-01
CUB4-BLR115-1-10 CUB4-BLR115-2-10 CUB4-BLR115-3-10 CUB4-BLR115-4-10 CUB4-BLR115-5-10 CUB4-BLR115-6-10 RAC5-BLR115-1 RAC5-BLR115-2
Cleaver Brooks Cleaver Brooks Cleaver Brooks Cleaver Brooks Cleaver Brooks Cleaver BrooksCleaver Brooks or
equivalentCleaver Brooks or
equivalent
2012 2012 2012 2012 2011 2011 TBD TBD
7/1/2010 7/1/2010 7/1/2010 7/1/2010 ~2011 ~2011 TBD TBD
July-13 July-13 July-13 July-13 ~2011 ~2011 Future TBD Future TBD
30.6150 30.6150 30.6150 30.6150 14.2870 30.6150 11.7150 30.6150
N/A (Hot Water) N/A (Hot Water) N/A (Hot Water) N/A (Hot Water) N/A (Hot Water) N/A (Hot Water) N/A (Hot Water) N/A (Hot Water)
Natural Gas Natural Gas Natural Gas Natural Gas Natural Gas Natural Gas Natural Gas Natural Gas
30014.7 30014.7 30014.7 30014.7 14006.9 30014.7 11485.3 30014.7
262.9 262.9 262.9 262.9 122.7 262.9 100.6 262.9
n/a n/a n/a n/a n/a n/a n/a n/a
None None None None None None None None
n/a n/a n/a n/a n/a n/a n/a n/a
n/a n/a n/a n/a n/a n/a n/a n/a
n/a n/a n/a n/a n/a n/a n/a n/a
CUB41151 CUB41152 CUB41153 CUB41154 CUB41155 CUB41156 CUB51157 CUB51158
86.50 86.50 86.50 86.50 86.50 86.50 51.00 51.00
7,182 13,189 13,189 13,189 13,189 13,189 7,182 13,189
n/a n/a n/a n/a n/a n/a n/a n/a
n/a n/a n/a n/a n/a n/a n/a n/a
2. Describe how the boiler(s) is operated. (Refer to instructions for guidance)Gas fired, fire tube heating water boilers, forced draft.
a Maximum values are provided. Average annual operating capacity across all boilers is 30%.

BOILERSFORM AQ208
ANSWER SHEET
Oregon Department of Environmental QualityAir Contaminant Discharge Permit Application
Page 5 of 8Revised 4/25/00
1. Boiler Information:
Boiler identification
Manufacturer
Date manufactured (month/year)
Date construction commenced (month/year)
Date installed (month/year)
Rated design heat input capacity (million Btu per hour)Rated steam production capacity (pounds per hour)
Primary fuel type
Max. fuel quantity used per hour (SCF/Hr)Max. fuel quantity used per year
(MMSCF/Yr)a
If oil is used, sulfur content (% by wt.)
Secondary fuel type
Max. fuel quantity used per hour (include units)Max. fuel quantity used per year (include units)If oil is used, sulfur content (% by wt.)
Stack identification
Stack height (feet)
Stack gas flow rate at maximum load (ACFM) Control device(s) identification from AQ300 series form(s)
Continuous monitoring systems
Facility Name: Intel Corporation Ronler Acres Campus Permit Number: 34-2681-ST-01
RAC5-BLR115-3 RAC5-BLR115-4RA2-MECH-HW-B01
(BLR 115-1-300)RA2-MECH-HW-B02 (BLR
115-2-300)MBR-BLR115-1 MBR-BLR115-2 MBR2-BLR115-1 MBR2-BLR115-2
Cleaver Brooks or equivalent
Cleaver Brooks or equivalent
Johnston JohnstonCleaver Brooks or
equivalentCleaver Brooks or
equivalentCleaver Brooks or
equivalentCleaver Brooks or
equivalent
TBD TBD 1997 1997 TBD TBD TBD TBD
TBD TBD 1998 1998 TBD TBD TBD TBD
Future TBD Future TBD Dec-98 Jan-99 Future TBD Future TBD Future TBD Future TBD
30.6150 30.6150 4.2000 4.2 6.694 6.694 6.694 6.694
N/A (Hot Water) N/A (Hot Water) N/A (Hot Water) N/A (Hot Water) N/A (Hot Water) N/A (Hot Water) N/A (Hot Water) N/A (Hot Water)
Natural Gas Natural Gas Natural Gas Natural Gas Natural Gas Natural Gas Natural Gas Natural Gas
30014.7 30014.7 4117.6 4117.6 6562.7 6562.7 6562.7 6562.7
262.9 262.9 36.1 36.1 57.5 57.5 57.5 57.5
n/a n/a n/a n/a n/a n/a n/a n/a
None None None None None None None None
n/a n/a n/a n/a n/a n/a n/a n/a
n/a n/a n/a n/a n/a n/a n/a n/a
n/a n/a n/a n/a n/a n/a n/a n/a
CUB51159 CUB511510 RA21151 RA21152 MBR1151 MBR1152 MBR21151 MBR21152
51.00 51.00 95.00 95.00 75.50 75.50 75.50 75.50
13,189 13,189 433 433 5,727 5,727 5,727 5,727
n/a n/a n/a n/a n/a n/a n/a n/a
n/a n/a n/a n/a n/a n/a n/a n/a
2. Describe how the boiler(s) is operated. (Refer to instructions for guidance)Gas fired, fire tube heating water boilers, forced draft.
a Maximum values are provided. Average annual operating capacity across all boilers is 30%.

BOILERSFORM AQ208
ANSWER SHEET
Oregon Department of Environmental QualityAir Contaminant Discharge Permit Application
Page 6 of 8Revised 4/25/00
1. Boiler Information:
Boiler identification
Manufacturer
Date manufactured (month/year)
Date construction commenced (month/year)
Date installed (month/year)
Rated design heat input capacity (million Btu per hour)Rated steam production capacity (pounds per hour)
Primary fuel type
Max. fuel quantity used per hour (SCF/Hr)Max. fuel quantity used per year
(MMSCF/Yr)a
If oil is used, sulfur content (% by wt.)
Secondary fuel type
Max. fuel quantity used per hour (include units)Max. fuel quantity used per year (include units)If oil is used, sulfur content (% by wt.)
Stack identification
Stack height (feet)
Stack gas flow rate at maximum load (ACFM) Control device(s) identification from AQ300 series form(s)
Continuous monitoring systems
Facility Name: Intel Corporation Ronler Acres Campus Permit Number: 34-2681-ST-01
RS4-BLR115-1 RS4-BLR115-2 RS4-BLR115-3 RS6-BLR115-1 RS6-BLR115-2 RS6-BLR115-3 CUB2-BLR115-6-210 RA5-BLR115-1
Cleaver Brooks or equivalent
Cleaver Brooks or equivalent
Cleaver Brooks or equivalent
Cleaver Brooks or equivalent
Cleaver Brooks or equivalent
Cleaver Brooks or equivalent
Cleaver Brooks or equivalent
Cleaver Brooks or equivalent
TBD TBD TBD TBD TBD TBD TBD TBD
TBD TBD TBD TBD TBD TBD TBD TBD
Future TBD Future TBD Future TBD Future TBD Future TBD Future TBD Future TBD Future TBD
2.00 2.00 0.50 2.00 2.00 0.50 29.392 1.99
N/A (Hot Water) N/A (Hot Water) N/A (Hot Water) N/A (Hot Water) N/A (Hot Water) N/A (Hot Water) N/A (Hot Water) N/A (Hot Water)
Natural Gas Natural Gas Natural Gas Natural Gas Natural Gas Natural Gas Natural Gas Natural Gas
1960.8 1960.8 490.2 1960.8 1960.8 490.2 28815.7 1951.0
17.2 17.2 4.3 17.2 17.2 4.3 252.4 17.1
n/a n/a n/a n/a n/a n/a n/a n/a
None None None None None None None None
n/a n/a n/a n/a n/a n/a n/a n/a
n/a n/a n/a n/a n/a n/a n/a n/a
n/a n/a n/a n/a n/a n/a n/a n/a
RS41151 RS41152 RS41153 RS61151 RS61152 RS61153 D1C1156 RA51151
54.00 54.00 121.00 54.00 54.00 121.00 46.00 54.00
3,544 3,544 541 3,544 3,544 541 7,982 3,544
n/a n/a n/a n/a n/a n/a n/a n/a
n/a n/a n/a n/a n/a n/a n/a n/a
2. Describe how the boiler(s) is operated. (Refer to instructions for guidance)Gas fired, fire tube heating water boilers, forced draft.
a Maximum values are provided. Average annual operating capacity across all boilers is 30%.

BOILERSFORM AQ208
ANSWER SHEET
Oregon Department of Environmental QualityAir Contaminant Discharge Permit Application
Page 7 of 8Revised 4/25/00
1. Boiler Information:
Boiler identification
Manufacturer
Date manufactured (month/year)
Date construction commenced (month/year)
Date installed (month/year)
Rated design heat input capacity (million Btu per hour)Rated steam production capacity (pounds per hour)
Primary fuel type
Max. fuel quantity used per hour (SCF/Hr)Max. fuel quantity used per year
(MMSCF/Yr)a
If oil is used, sulfur content (% by wt.)
Secondary fuel type
Max. fuel quantity used per hour (include units)Max. fuel quantity used per year (include units)If oil is used, sulfur content (% by wt.)
Stack identification
Stack height (feet)
Stack gas flow rate at maximum load (ACFM) Control device(s) identification from AQ300 series form(s)
Continuous monitoring systems
Facility Name: Intel Corporation Ronler Acres Campus Permit Number: 34-2681-ST-01
RA6-BLR115-1 N2-BLR117-2-30 N2-BLR117-1-30 RA5-BLR115-2 RA5-BLR115-3 RA5-BLR115-4 RA6-BLR115-2 RA6-BLR115-3
Cleaver Brooks or equivalent
Cleaver Brooks or equivalent
Cleaver Brooks or equivalent
Cleaver Brooks or equivalent
Cleaver Brooks or equivalent
Cleaver Brooks or equivalent
Cleaver Brooks or equivalent
Cleaver Brooks or equivalent
TBD TBD TBD TBD TBD TBD TBD TBD
TBD TBD TBD TBD TBD TBD TBD TBD
Future TBD Future TBD Future TBD Future TBD Future TBD Future TBD Future TBD Future TBD
1.999 1.999 1.999 1.999 1.99 1.99 1.99 1.99
N/A (Hot Water) N/A (Hot Water) N/A (Hot Water) N/A (Hot Water) N/A (Hot Water) N/A (Hot Water) N/A (Hot Water) N/A (Hot Water)
Natural Gas Natural Gas Natural Gas Natural Gas Natural Gas Natural Gas Natural Gas Natural Gas
1959.8 1959.8 1959.8 1959.8 1951.0 1951.0 1951.0 1951.0
17.2 17.2 17.2 17.2 17.1 17.1 17.1 17.1
n/a n/a n/a n/a n/a n/a n/a n/a
None None None None None None None None
n/a n/a n/a n/a n/a n/a n/a n/a
n/a n/a n/a n/a n/a n/a n/a n/a
n/a n/a n/a n/a n/a n/a n/a n/a
RA61151 N21152 N21151 RA51152 RA51153 RA51154 RA61152 RA61153
54.00 121.00 121.00 54.00 54.00 54.00 54.00 54.00
3,544 3,544 3,544 3,544 3,544 3,544 3,544 3,544
n/a n/a n/a n/a n/a n/a n/a n/a
n/a n/a n/a n/a n/a n/a n/a n/a
2. Describe how the boiler(s) is operated. (Refer to instructions for guidance)Gas fired, fire tube heating water boilers, forced draft.
a Maximum values are provided. Average annual operating capacity across all boilers is 30%.

BOILERSFORM AQ208
ANSWER SHEET
Oregon Department of Environmental QualityAir Contaminant Discharge Permit Application
Page 8 of 8Revised 4/25/00
1. Boiler Information:
Boiler identification
Manufacturer
Date manufactured (month/year)
Date construction commenced (month/year)
Date installed (month/year)
Rated design heat input capacity (million Btu per hour)Rated steam production capacity (pounds per hour)
Primary fuel type
Max. fuel quantity used per hour (SCF/Hr)Max. fuel quantity used per year
(MMSCF/Yr)a
If oil is used, sulfur content (% by wt.)
Secondary fuel type
Max. fuel quantity used per hour (include units)Max. fuel quantity used per year (include units)If oil is used, sulfur content (% by wt.)
Stack identification
Stack height (feet)
Stack gas flow rate at maximum load (ACFM) Control device(s) identification from AQ300 series form(s)
Continuous monitoring systems
Facility Name: Intel Corporation Ronler Acres Campus Permit Number: 34-2681-ST-01
RA6-BLR115-4
Cleaver Brooks or equivalent
TBD
TBD
Future TBD
1.99
N/A (Hot Water)
Natural Gas
1951.0
17.1
n/a
None
n/a
n/a
n/a
RA61154
54.00
3,544
n/a
n/a
2. Describe how the boiler(s) is operated. (Refer to instructions for guidance)Gas fired, fire tube heating water boilers, forced draft.
a Maximum values are provided. Average annual operating capacity across all boilers is 30%.

POWER SUPPLY GENERATORSFORM AQ213
ANSWER SHEET
Oregon Department of Environmental QualityAir Contaminant Discharge Permit Application
Page 1 of 1Revised 4/25/00
Facility Name: Intel Corporation Aloha Campus Permit Number: 34-2681-ST-01
Provide the requested information for each generator used to power the plant. If any one of several generators might
be used at the plant at any given time, describe the generator with the highest power rating. If more than onegenerator is permanently located at the plant, describe all of them.
Emergency Generator 1 Egen 2 Egen 3 Egen 4 Egen 5
ID No. F15-EG01 F15-EG02 F15-EG03 F15.5-EG01 F15.5-EG02
Manufacturer Detroit Diesel Detroit Diesel Detroit Diesel Caterpillar Caterpillar
Year manufactured 1992 1992 1992 2000 2000
Date Installed Jan-94 Jan-94 Jan-94 Aug-01 Jan-01
Size (KW) 1500 1500 1500 1500 1500
Type of fuels used #2 distillate fuel oil #2 distillate fuel oil #2 distillate fuel oil #2 distillate fuel oil #2 distillate fuel oil
Maximum amount of fuel to be used per
hour b (gallons)121 121 121 107.9 133.4
Projected maximum amount of fuel to be
used per year b (gallons)3630 3630 3630 3237 4002
Projected maximum number of hours to be operated in one year
up to 30 hours/year up to 30 hours/year up to 30 hours/year up to 30 hours/year up to 30 hours/year
Maintenance schedule c up to 30 hrs per year up to 30 hrs per year up to 30 hrs per year up to 30 hrs per year up to 30 hrs per year
Manufacturer's emission rates attached (yes/no)
see emission inventory see emission inventory see emission inventory see emission inventory see emission inventory
a. Units for generator size are either kilowatt or horsepower (kW or hp).
b. Provide the units for the amount of fuel (e.g., cubic feet, therms, gallons, etc.).
c. “Maintenance Schedule” refers to regularly scheduled maintenance only, i.e., annual, monthly, weekly, or none
Emission factors for #2 distillate fuel oil: (EPA FIRE version 6.22, SCC 2010020)
Pollutant
PM
PM10
NOx
CO
VOC
SO2
49.3
39.7
Distillate oil emission factor(lb/1000 gallons)
42.5
42.5
604
130

This page intentionally left blank.

POWER SUPPLY GENERATORSFORM AQ213
ANSWER SHEET
Oregon Department of Environmental QualityAir Contaminant Discharge Permit Application
Page 1 of 9Revised 4/25/00
Facility Name: Intel Corporation Ronler Acres Campus Permit Number: 34-2681-ST-01
Provide the requested information for each generator used to power the plant. If any one of several generators might
be used at the plant at any given time, describe the generator with the highest power rating. If more than onegenerator is permanently located at the plant, describe all of them.
Emergency Generator 1 Egen 2 Egen 3 Egen 4 Egen 5 Egen 6 Egen 7
ID No. F20-EPS-1 F20-EPS-2 F20-EPS-3 F20-CPS-1 D1C-CPS-GEN01 D1C-CPS-GEN02 D1C-CPS-GEN03
Manufacturer Detroit Diesel Cummins or equiv. Detroit Diesel Detroit Diesel Caterpillar Caterpillar Caterpillar
Year manufactured 1995 TBD 1997 1995 1998 5/1/1998 1999
Date Installed Apr-96 Future TBD May-96 stored Jun-98 Jun-98 Jun-98
Size (KWa) 2000 2000 2000 1500 1252 1252 1252
Type of fuels used #2 distillate fuel oil #2 distillate fuel oil #2 distillate fuel oil #2 distillate fuel oil #2 distillate fuel oil #2 distillate fuel oil #2 distillate fuel oil
Maximum amount of fuel to be used per
hour b (gallons)121 TBD 121 110 89.71 89.71 89.71
Projected maximum amount of fuel to be
used per year b (gallons)3630 TBD 3630 3300 2691.3 2691.3 2691.3
Projected maximum number of hours to be operated in one year
up to 30 hours/year up to 30 hours/year up to 30 hours/year up to 30 hours/year up to 30 hours/year up to 30 hours/year up to 30 hours/year
Maintenance schedule c up to 30 hrs per year up to 30 hrs per year up to 30 hrs per year up to 30 hrs per year up to 30 hrs per year up to 30 hrs per year up to 30 hrs per year
Manufacturer's emission rates attached (yes/no)
See emission inventory See emission inventory See emission inventory See emission inventory See emission inventory See emission inventory See emission inventory
a. Units for generator size are either kilowatt or horsepower (kW or hp).
b. Provide the units for the amount of fuel (e.g., cubic feet, therms, gallons, etc.).
c. “Maintenance Schedule” refers to regularly scheduled maintenance only, i.e., annual, monthly, weekly, or none
PollutantDistillate oil emission factor
(lb/1000 gallons)
PM 42.5
PM10 42.5
NOx 604
CO 130
VOC 49.3
SO2 39.7
Emission factors for #2 distillate fuel oil: (EPA FIRE version 6.22, SCC 2010020)

POWER SUPPLY GENERATORSFORM AQ213
ANSWER SHEET
Oregon Department of Environmental QualityAir Contaminant Discharge Permit Application
Page 2 of 9Revised 4/25/00
ID No.
Manufacturer
Year manufactured
Date Installed
Size (KWa)
Type of fuels used
Maximum amount of fuel to be used per
hour b (gallons)
Projected maximum amount of fuel to be
used per year b (gallons)Projected maximum number of hours to be operated in one year
Maintenance schedule c
Manufacturer's emission rates attached (yes/no)
Facility Name: Intel Corporation Ronler Acres Campus Permit Number: 34-2681-ST-01
Provide the requested information for each generator used to power the plant. If any one of several generators might
be used at the plant at any given time, describe the generator with the highest power rating. If more than onegenerator is permanently located at the plant, describe all of them.
Egen 8 Egen 9 Egen 10 Egen 11 Egen 12 Egen 13 Egen 14
D1C-EPS-GEN01 D1C-EPS-GEN02 EPS-GEN01 EPS-GEN02 EPS-GEN03 EPS-GEN04 EPS-GEN05
Detroit Diesel Detroit Diesel Caterpillar Caterpillar Caterpillar Caterpillar Caterpillar
1999 2000 2003 2001 2001 2001 2001
Jun-98 Jun-98 Jun-02 Jun-02 Jun-02 Jun-02 Jun-02
1600 1600 2000 2000 2000 2000 2000
#2 distillate fuel oil #2 distillate fuel oil #2 distillate fuel oil #2 distillate fuel oil #2 distillate fuel oil #2 distillate fuel oil #2 distillate fuel oil
129.38 129.38 147.46 147.46 147.46 147.46 147.46
3881.4 3881.4 4423.8 4423.8 4423.8 4423.8 4423.8
up to 30 hours/year up to 30 hours/year up to 30 hours/year up to 30 hours/year up to 30 hours/year up to 30 hours/year up to 30 hours/year
up to 30 hrs per year up to 30 hrs per year up to 30 hrs per year up to 30 hrs per year up to 30 hrs per year up to 30 hrs per year up to 30 hrs per year
See emission inventory See emission inventory See emission inventory See emission inventory See emission inventory See emission inventory See emission inventory
a. Units for generator size are either kilowatt or horsepower (kW or hp).
b. Provide the units for the amount of fuel (e.g., cubic feet, therms, gallons, etc.).
c. “Maintenance Schedule” refers to regularly scheduled maintenance only, i.e., annual, monthly, weekly, or none
PollutantDistillate oil emission factor
(lb/1000 gallons)
PM 42.5
PM10 42.5
NOx 604
CO 130
VOC 49.3
SO2 39.7
Emission factors for #2 distillate fuel oil: (EPA FIRE version 6.22, SCC 2010020)

POWER SUPPLY GENERATORSFORM AQ213
ANSWER SHEET
Oregon Department of Environmental QualityAir Contaminant Discharge Permit Application
Page 3 of 9Revised 4/25/00
ID No.
Manufacturer
Year manufactured
Date Installed
Size (KWa)
Type of fuels used
Maximum amount of fuel to be used per
hour b (gallons)
Projected maximum amount of fuel to be
used per year b (gallons)Projected maximum number of hours to be operated in one year
Maintenance schedule c
Manufacturer's emission rates attached (yes/no)
Facility Name: Intel Corporation Ronler Acres Campus Permit Number: 34-2681-ST-01
Provide the requested information for each generator used to power the plant. If any one of several generators might
be used at the plant at any given time, describe the generator with the highest power rating. If more than onegenerator is permanently located at the plant, describe all of them.
Egen 15 Egen 16 Egen 17 Egen 18 Egen 19 Egen 20 Egen 21
EPS-GEN06 D1D-GEN-7 D1X-GEN-1A D1X-GEN-1B D1X-GEN-1C D1X-GEN-2A D1X-GEN-2B
Caterpillar Cummins or equiv. Cummins Cummins Cummins Cummins Cummins
2002 TBD 2011 2011 2011 2011 2011
Jun-02 Future TBD Jan-12 Sep-13 Jan-12 Jan-12 Jan-12
2000 2000 2500 2500 2500 2500 2500
#2 distillate fuel oil #2 distillate fuel oil #2 distillate fuel oil #2 distillate fuel oil #2 distillate fuel oil #2 distillate fuel oil #2 distillate fuel oil
147.46 TBD 176 172.1 176 176 176
4423.8 TBD 5280 5163 5280 5280 5280
up to 30 hours/year up to 30 hours/year up to 30 hours/year up to 30 hours/year up to 30 hours/year up to 30 hours/year up to 30 hours/year
up to 30 hrs per year up to 30 hrs per year up to 30 hrs per year up to 30 hrs per year up to 30 hrs per year up to 30 hrs per year up to 30 hrs per year
See emission inventory See emission inventory See emission inventory See emission inventory See emission inventory See emission inventory See emission inventory
a. Units for generator size are either kilowatt or horsepower (kW or hp).
b. Provide the units for the amount of fuel (e.g., cubic feet, therms, gallons, etc.).
c. “Maintenance Schedule” refers to regularly scheduled maintenance only, i.e., annual, monthly, weekly, or none
PollutantDistillate oil emission factor
(lb/1000 gallons)
PM 42.5
PM10 42.5
NOx 604
CO 130
VOC 49.3
SO2 39.7
Emission factors for #2 distillate fuel oil: (EPA FIRE version 6.22, SCC 2010020)

POWER SUPPLY GENERATORSFORM AQ213
ANSWER SHEET
Oregon Department of Environmental QualityAir Contaminant Discharge Permit Application
Page 4 of 9Revised 4/25/00
ID No.
Manufacturer
Year manufactured
Date Installed
Size (KWa)
Type of fuels used
Maximum amount of fuel to be used per
hour b (gallons)
Projected maximum amount of fuel to be
used per year b (gallons)Projected maximum number of hours to be operated in one year
Maintenance schedule c
Manufacturer's emission rates attached (yes/no)
Facility Name: Intel Corporation Ronler Acres Campus Permit Number: 34-2681-ST-01
Provide the requested information for each generator used to power the plant. If any one of several generators might
be used at the plant at any given time, describe the generator with the highest power rating. If more than onegenerator is permanently located at the plant, describe all of them.
Egen 22 Egen 23 Egen 24 Egen 25 Egen 26 Egen 27 Egen 28
D1X-GEN-2C D1X-GEN-3A D1X-GEN-3B D1X-GEN-3C D1X-GEN-4A D1X-GEN-4B D1X-GEN-4C
Cummins Cummins Cummins Cummins Cummins Cummins Cummins
2011 2012 2012 2013 2013 2013 2012
Jan-12 Sep-13 Mar-12 Sep-13 Dec-13 Dec-13 Dec-13
2500 2500 2500 2500 2500 2500 2500
#2 distillate fuel oil #2 distillate fuel oil #2 distillate fuel oil #2 distillate fuel oil #2 distillate fuel oil #2 distillate fuel oil #2 distillate fuel oil
176 172.1 176 172.1 172.1 172.1 172.1
5280 5163 5280 5163 5163 5163 5163
up to 30 hours/year up to 30 hours/year up to 30 hours/year up to 30 hours/year up to 30 hours/year up to 30 hours/year up to 30 hours/year
up to 30 hrs per year up to 30 hrs per year up to 30 hrs per year up to 30 hrs per year up to 30 hrs per year up to 30 hrs per year up to 30 hrs per year
See emission inventory See emission inventory See emission inventory See emission inventory See emission inventory See emission inventory See emission inventory
a. Units for generator size are either kilowatt or horsepower (kW or hp).
b. Provide the units for the amount of fuel (e.g., cubic feet, therms, gallons, etc.).
c. “Maintenance Schedule” refers to regularly scheduled maintenance only, i.e., annual, monthly, weekly, or none
PollutantDistillate oil emission factor
(lb/1000 gallons)
PM 42.5
PM10 42.5
NOx 604
CO 130
VOC 49.3
SO2 39.7
Emission factors for #2 distillate fuel oil: (EPA FIRE version 6.22, SCC 2010020)

POWER SUPPLY GENERATORSFORM AQ213
ANSWER SHEET
Oregon Department of Environmental QualityAir Contaminant Discharge Permit Application
Page 5 of 9Revised 4/25/00
ID No.
Manufacturer
Year manufactured
Date Installed
Size (KWa)
Type of fuels used
Maximum amount of fuel to be used per
hour b (gallons)
Projected maximum amount of fuel to be
used per year b (gallons)Projected maximum number of hours to be operated in one year
Maintenance schedule c
Manufacturer's emission rates attached (yes/no)
Facility Name: Intel Corporation Ronler Acres Campus Permit Number: 34-2681-ST-01
Provide the requested information for each generator used to power the plant. If any one of several generators might
be used at the plant at any given time, describe the generator with the highest power rating. If more than onegenerator is permanently located at the plant, describe all of them.
Egen 29 Egen 30 Egen 31 Egen 32 Egen 33 Egen 34 Egen 35
D1X-GEN-5A D1X-GEN-5B D1X-GEN-5C D1X-GEN-6A D1X-GEN-6B D1X-GEN-6C D1X-GEN-7A
Cummins or equiv. Cummins or equiv. Cummins or equiv. Cummins or equiv. Cummins or equiv. Cummins or equiv. Cummins or equiv.
TBD TBD TBD TBD TBD TBD TBD
Future TBD Future TBD Future TBD Future TBD Future TBD Future TBD Future TBD
2500 2500 2500 2500 2500 2500 2500
#2 distillate fuel oil #2 distillate fuel oil #2 distillate fuel oil #2 distillate fuel oil #2 distillate fuel oil #2 distillate fuel oil #2 distillate fuel oil
176 176 176 176 176 176 176
5280 5280 5280 5280 5280 5280 5280
up to 30 hours/year up to 30 hours/year up to 30 hours/year up to 30 hours/year up to 30 hours/year up to 30 hours/year up to 30 hours/year
up to 30 hrs per year up to 30 hrs per year up to 30 hrs per year up to 30 hrs per year up to 30 hrs per year up to 30 hrs per year up to 30 hrs per year
See emission inventory See emission inventory See emission inventory See emission inventory See emission inventory See emission inventory See emission inventory
a. Units for generator size are either kilowatt or horsepower (kW or hp).
b. Provide the units for the amount of fuel (e.g., cubic feet, therms, gallons, etc.).
c. “Maintenance Schedule” refers to regularly scheduled maintenance only, i.e., annual, monthly, weekly, or none
PollutantDistillate oil emission factor
(lb/1000 gallons)
PM 42.5
PM10 42.5
NOx 604
CO 130
VOC 49.3
SO2 39.7
Emission factors for #2 distillate fuel oil: (EPA FIRE version 6.22, SCC 2010020)

POWER SUPPLY GENERATORSFORM AQ213
ANSWER SHEET
Oregon Department of Environmental QualityAir Contaminant Discharge Permit Application
Page 6 of 9Revised 4/25/00
ID No.
Manufacturer
Year manufactured
Date Installed
Size (KWa)
Type of fuels used
Maximum amount of fuel to be used per
hour b (gallons)
Projected maximum amount of fuel to be
used per year b (gallons)Projected maximum number of hours to be operated in one year
Maintenance schedule c
Manufacturer's emission rates attached (yes/no)
Facility Name: Intel Corporation Ronler Acres Campus Permit Number: 34-2681-ST-01
Provide the requested information for each generator used to power the plant. If any one of several generators might
be used at the plant at any given time, describe the generator with the highest power rating. If more than onegenerator is permanently located at the plant, describe all of them.
Egen 36 Egen 37 Egen 38 Egen 39 Egen 40 Egen 41 Egen 42
D1X-GEN-7B D1X-GEN-7C D1X-GEN-9A D1X-GEN-9B D1X-GEN-9C D1X-GEN-10A D1X-GEN-10B
Cummins or equiv. Cummins or equiv. Cummins or equiv. Cummins or equiv. Cummins or equiv. Cummins or equiv. Cummins or equiv.
TBD TBD TBD TBD TBD TBD TBD
Future TBD Future TBD Future TBD Future TBD Future TBD Future TBD Future TBD
2500 2500 2500 2500 2500 2500 2500
#2 distillate fuel oil #2 distillate fuel oil #2 distillate fuel oil #2 distillate fuel oil #2 distillate fuel oil #2 distillate fuel oil #2 distillate fuel oil
176 176 176 176 176 176 176
5280 5280 5280 5280 5280 5280 5280
up to 30 hours/year up to 30 hours/year up to 30 hours/year up to 30 hours/year up to 30 hours/year up to 30 hours/year up to 30 hours/year
up to 30 hrs per year up to 30 hrs per year up to 30 hrs per year up to 30 hrs per year up to 30 hrs per year up to 30 hrs per year up to 30 hrs per year
See emission inventory See emission inventory See emission inventory See emission inventory See emission inventory See emission inventory See emission inventory
a. Units for generator size are either kilowatt or horsepower (kW or hp).
b. Provide the units for the amount of fuel (e.g., cubic feet, therms, gallons, etc.).
c. “Maintenance Schedule” refers to regularly scheduled maintenance only, i.e., annual, monthly, weekly, or none
PollutantDistillate oil emission factor
(lb/1000 gallons)
PM 42.5
PM10 42.5
NOx 604
CO 130
VOC 49.3
SO2 39.7
Emission factors for #2 distillate fuel oil: (EPA FIRE version 6.22, SCC 2010020)

POWER SUPPLY GENERATORSFORM AQ213
ANSWER SHEET
Oregon Department of Environmental QualityAir Contaminant Discharge Permit Application
Page 7 of 9Revised 4/25/00
ID No.
Manufacturer
Year manufactured
Date Installed
Size (KWa)
Type of fuels used
Maximum amount of fuel to be used per
hour b (gallons)
Projected maximum amount of fuel to be
used per year b (gallons)Projected maximum number of hours to be operated in one year
Maintenance schedule c
Manufacturer's emission rates attached (yes/no)
Facility Name: Intel Corporation Ronler Acres Campus Permit Number: 34-2681-ST-01
Provide the requested information for each generator used to power the plant. If any one of several generators might
be used at the plant at any given time, describe the generator with the highest power rating. If more than onegenerator is permanently located at the plant, describe all of them.
Egen 43 Egen 44 Egen 45 Egen 46 Egen 47 Egen 48 Egen 49
D1X-GEN-10C D1X-GEN-11A D1X-GEN-11B D1X-GEN-11C D1X-GEN-12A D1X-GEN-12B D1X-GEN-12C
Cummins or equiv. Cummins or equiv. Cummins or equiv. Cummins or equiv. Cummins or equiv. Cummins or equiv. Cummins or equiv.
TBD TBD TBD TBD TBD TBD TBD
Future TBD Future TBD Future TBD Future TBD Future TBD Future TBD Future TBD
2500 2500 2500 2500 2500 2500 2500
#2 distillate fuel oil #2 distillate fuel oil #2 distillate fuel oil #2 distillate fuel oil #2 distillate fuel oil #2 distillate fuel oil #2 distillate fuel oil
176 176 176 176 176 176 176
5280 5280 5280 5280 5280 5280 5280
up to 30 hours/year up to 30 hours/year up to 30 hours/year up to 30 hours/year up to 30 hours/year up to 30 hours/year up to 30 hours/year
up to 30 hrs per year up to 30 hrs per year up to 30 hrs per year up to 30 hrs per year up to 30 hrs per year up to 30 hrs per year up to 30 hrs per year
See emission inventory See emission inventory See emission inventory See emission inventory See emission inventory See emission inventory See emission inventory
a. Units for generator size are either kilowatt or horsepower (kW or hp).
b. Provide the units for the amount of fuel (e.g., cubic feet, therms, gallons, etc.).
c. “Maintenance Schedule” refers to regularly scheduled maintenance only, i.e., annual, monthly, weekly, or none
PollutantDistillate oil emission factor
(lb/1000 gallons)
PM 42.5
PM10 42.5
NOx 604
CO 130
VOC 49.3
SO2 39.7
Emission factors for #2 distillate fuel oil: (EPA FIRE version 6.22, SCC 2010020)

POWER SUPPLY GENERATORSFORM AQ213
ANSWER SHEET
Oregon Department of Environmental QualityAir Contaminant Discharge Permit Application
Page 8 of 9Revised 4/25/00
ID No.
Manufacturer
Year manufactured
Date Installed
Size (KWa)
Type of fuels used
Maximum amount of fuel to be used per
hour b (gallons)
Projected maximum amount of fuel to be
used per year b (gallons)Projected maximum number of hours to be operated in one year
Maintenance schedule c
Manufacturer's emission rates attached (yes/no)
Facility Name: Intel Corporation Ronler Acres Campus Permit Number: 34-2681-ST-01
Provide the requested information for each generator used to power the plant. If any one of several generators might
be used at the plant at any given time, describe the generator with the highest power rating. If more than onegenerator is permanently located at the plant, describe all of them.
Egen 50 Egen 51 Egen 52 Egen 53 Egen 54 Egen 55 Egen 56
N2-GEN-1A N2-GEN-1B RA1-ELEC-CPS-GEN01 RA1-ELEC-CPS-GEN02 RA1-ELEC-CPS-GEN03 RA1-ELEC-CPS-GEN04 RB1-EPS-GEN01
Cummins or equiv. Cummins or equiv. Caterpillar Caterpillar Caterpillar Caterpillar Caterpillar
TBD TBD 10/1/1999 1/1/2001 10/1/1999 2/1/2001 1997
Future TBD Future TBD Apr-96 Apr-96 Apr-96 Apr-96 Jun-98
2500 2500 1500 1500 1500 1500 2000
#2 distillate fuel oil #2 distillate fuel oil #2 distillate fuel oil #2 distillate fuel oil #2 distillate fuel oil #2 distillate fuel oil #2 distillate fuel oil
TBD TBD 113.51 113.51 113.51 113.51 137.5
TBD TBD 3405.3 3405.3 3405.3 3405.3 4125
up to 30 hours/year up to 30 hours/year up to 30 hours/year up to 30 hours/year up to 30 hours/year up to 30 hours/year up to 30 hours/year
up to 30 hrs per year up to 30 hrs per year up to 30 hrs per year up to 30 hrs per year up to 30 hrs per year up to 30 hrs per year up to 30 hrs per year
See emission inventory See emission inventory See emission inventory See emission inventory See emission inventory See emission inventory See emission inventory
a. Units for generator size are either kilowatt or horsepower (kW or hp).
b. Provide the units for the amount of fuel (e.g., cubic feet, therms, gallons, etc.).
c. “Maintenance Schedule” refers to regularly scheduled maintenance only, i.e., annual, monthly, weekly, or none
PollutantDistillate oil emission factor
(lb/1000 gallons)
PM 42.5
PM10 42.5
NOx 604
CO 130
VOC 49.3
SO2 39.7
Emission factors for #2 distillate fuel oil: (EPA FIRE version 6.22, SCC 2010020)

POWER SUPPLY GENERATORSFORM AQ213
ANSWER SHEET
Oregon Department of Environmental QualityAir Contaminant Discharge Permit Application
Page 9 of 9Revised 4/25/00
ID No.
Manufacturer
Year manufactured
Date Installed
Size (KWa)
Type of fuels used
Maximum amount of fuel to be used per
hour b (gallons)
Projected maximum amount of fuel to be
used per year b (gallons)Projected maximum number of hours to be operated in one year
Maintenance schedule c
Manufacturer's emission rates attached (yes/no)
Facility Name: Intel Corporation Ronler Acres Campus Permit Number: 34-2681-ST-01
Provide the requested information for each generator used to power the plant. If any one of several generators might
be used at the plant at any given time, describe the generator with the highest power rating. If more than onegenerator is permanently located at the plant, describe all of them.
Egen 57 Egen 58 Egen 59 Egen 60 Egen 61
RP1-EPS-GEN01 RP1-GEN-2 RS4-ELEC-EG-4-1 RS6-ELEC-EG-6-1 RS6-GEN-2
Caterpillar Cummins or equivalent Caterpillar Caterpillar Cummins or equivalent
2000 TBD 2005 2005 TBD
Jun-00 Future TBD Oct-05 Oct-05 Future TBD
2000 2000 300 300 2000
#2 distillate fuel oil #2 distillate fuel oil #2 distillate fuel oil #2 distillate fuel oil #2 distillate fuel oil
145.4 TBD 22.9 22.9 TBD
4362 TBD 687 687 TBD
up to 30 hours/year up to 30 hours/year up to 30 hours/year up to 30 hours/year up to 30 hours/year
up to 30 hrs per year up to 30 hrs per year up to 30 hrs per year up to 30 hrs per year up to 30 hrs per year
See emission inventory See emission inventory See emission inventory See emission inventory See emission inventory
a. Units for generator size are either kilowatt or horsepower (kW or hp).
b. Provide the units for the amount of fuel (e.g., cubic feet, therms, gallons, etc.).
c. “Maintenance Schedule” refers to regularly scheduled maintenance only, i.e., annual, monthly, weekly, or none
PollutantDistillate oil emission factor
(lb/1000 gallons)
PM 42.5
PM10 42.5
NOx 604
CO 130
VOC 49.3
SO2 39.7
Other emergency equipment discussed in this application included diesel fueled fire water pumps. Equipment data associated with the fire water
pumps is included in Appendix C
Emission factors for #2 distillate fuel oil: (EPA FIRE version 6.22, SCC 2010020)

This page intentionally left blank.

MISCELLANEOUS PROCESS OR DEVICEFORM AQ230
ANSWER SHEET
Oregon Department of Environmental QualityAir Contaminant Discharge Permit Application
Page 1 of 1Revised 4/25/00
Facility Name: Intel Corporation Aloha / Ronler Acres Campuses Permit Number: 34-2681-ST-01
Process Information
1 ID NumberRACB2-TK266-1-40 RACB3-TK266-1-40 RAPB1A-TK266-1-40 RAPB1B-TK266-1-40 RAPB1C-TK266-1-40
2 Descriptive name Lime Silos Lime Silos Lime Silos Lime Silos Lime Silos
3 Existing or future? Existing Existing Existing Existing Existing
4 Date commenced 2000 2001 2012 2014 2014
5 Date installed/completed 2001 2002 Aug-12 Aug-14 Sep-14
6 Description of process
Operating Schedule
7 Seasonal or year-round?
8 Batch or continuous operation?
9 Projected maximum hours/day
10 Projected maximum hours/year
11 Process/device capacity:
Raw materials amount units amount units
Lime ~53,846 lbs/batch/silo 1,400,000 lbs/year/silo
Products
Lime used in wastewater treatment
12
Yes RACB2-FL266-1-48 RACB3-FL266-1-48 RAPB1A-FL266-1-48 RAPB1B-FL266-1-48 RAPB1C-FL266-1-48
Dry lime (calcium hydroxide) used in wastewater treatment operations is delivered to and stored in lime silos. During a lime delivery up to 53,846 pounds of lime is delivered to a silo in approximately one hour. Each silo is filled approximately 26 times per year.
See above
Control device(s) (yes/no?) If yes, provide the ID number and complete and attached the applicable series AQ300 form(s).
Short term capacity Annual usage
Year-round
Batch
1 hr/day
26 hrs/yr

This page intentionally left blank.

MISCELLANEOUS PROCESS OR DEVICEFORM AQ230
ANSWER SHEET
Oregon Department of Environmental QualityAir Contaminant Discharge Permit Application
Page 1 of 2Revised 4/25/00
Facility Name: Intel Corporation Aloha / Ronler Acres Campuses Permit Number: 34-2681-ST-01
Process Information
1 ID Number
2 Descriptive name
3 Existing or future?
4 Date commenced
5 Date installed/completed
6 Description of process
Operating Schedule
7 Seasonal or year-round?
8 Batch or continuous operation?
9 Projected maximum hours/day
10 Projected maximum hours/year
11 Process/device capacity:
Raw materials amount units amount units
ProductsR&D Technology, chips with functional circuits
12
See section 3.0 of the application.
Appendix C of the application provides emission unit IDs and device/process descriptions.
Semiconductor Manufacturing
Form AQ102 provides a description of the Facility development.
Year-round
Continuous
24
8760
Control device(s) (yes/no?) If yes, provide the ID number and complete and attached the applicable series AQ300 form(s).
See Appendix C of the application and the series AQ 300 forms
Confidential business information
Short term capacity Annual usage
See Appendix C of the application

MISCELLANEOUS PROCESS OR DEVICEFORM AQ230
ANSWER SHEET
Oregon Department of Environmental QualityAir Contaminant Discharge Permit Application
Page 2 of 2Revised 4/25/00
Facility Name: Intel Corporation Aloha / Ronler Acres Campuses Permit Number: 34-2681-ST-01
Process Information
1 ID Number
2 Descriptive name
3 Existing or future?
4 Date commenced
5 Date installed/completed
6 Description of process
Operating Schedule
7 Seasonal or year-round?
8 Batch or continuous operation?
9 Projected maximum hours/day
10 Projected maximum hours/year
11 Process/device capacity:
Raw materials amount units amount units
Products
12
Short term capacity Annual usage
See Appendix C of the application
Control device(s) (yes/no?) If yes, provide the ID number and complete and attached the applicable series AQ300 form(s).
Other devices discussed in this application include small natural gas fired HVAC units used for comfort heating and cooling towers that do not use chromium-based water treatment chemicals. Equipment data associated with these devices is provided in Appendix C.

OPERATION AND MAINTENANCE PRACTICESFORM AQ231
ANSWER SHEET
Oregon Department of Environmental QualityAir Contaminant Discharge Permit Application
Page 1 of 1Revised 3/11/02
1. Facility Name: Intel Corporation Aloha / Ronler Acres Campuses 2. Permit Number: 34-2681-ST-01
3. Emission Point or Fugitive Emission Source ID
4. Criteria Pollutants Emitted
5. Emission Level Depends on O&M (yes/no)
6. O&M Option Number(s) Selected
7. Describe specific O&M work practices or Emission Action Levels to ensure that the process, control device or fugitive emission source is operated and maintained at the highest reasonable efficiency and effectiveness to minimize emissions
Operation and maintenence activities associated with permit compliance are provided in Intel's existing ACDP. Section 5 of this application provides proposed BACT requirements.

This page intentionally left blank.

WET SCRUBBERCONTROL DEVICE INFORMATION
FORM AQ303ANSWER SHEET
Oregon Department of Environmental QualityAir Contaminant Discharge Permit Application
Page 1 of 3Revised 4/25/00
Facility Name: Ronler Acres and Aloha Permit Number: 34-2681-ST-01
1 Control Device ID D1C-SC142-3-100 D1C-SC142-4-100 D1C-SC142-5-100 SC-142-1-100 SC-142-2-100 SC-142-3-100 SC-142-4-100 SC-142-5-100 SC142-21-100
2 Process/Device(s) Controlled NH4+ exhaust NH4+ exhaust NH4+ exhaust NH4+ exhaust NH4+ exhaust NH4+ exhaust NH4+ exhaust NH4+ exhaust NH4+ exhaust
3 Year installed 6/1/2008 6/1/2008 6/1/2008 5/1/2002 5/1/2002 5/1/2002 5/1/2002 5/1/2002 12/31/2008
4 Manufacturer/Model No. HEE HEE HEE HEE HEE HEE HEE HEE HEE
5 Control Efficiency (%) ~90% for NH3 ~90% for NH3 ~90% for NH3 ~90% for NH3 ~90% for NH3 ~90% for NH3 ~90% for NH3 ~90% for NH3 ~90% for NH3
6 Type of scrubber Packed bed Packed bed Packed bed Packed bed Packed bed Packed bed Packed bed Packed bed Packed bed
7 Is water re-circulated? Yes Yes Yes Yes Yes Yes Yes Yes Yes
8 Design water flow rate (gpm) 408 408 408 109 109 109 109 109 354
9 Design water pressure (psig)40 to 60 psig in
industrial water feed system
40 to 60 psig in industrial water feed
system
40 to 60 psig in industrial water feed
system
40 to 60 psig in industrial water feed
system
40 to 60 psig in industrial water feed
system
40 to 60 psig in industrial water feed
system
40 to 60 psig in industrial water feed
system
40 to 60 psig in industrial water feed
system
40 to 60 psig in industrial water feed
system
10 Design inlet gas flow rate (acfm) 30,000 30,000 30,000 8,000 8,000 8,000 8,000 8,000 26,000
11 Design pressure drop (inches of water) 1.9 1.9 1.0 1.21 1.21 1.21 2.3 1.21 1.5
12Inlet gas pretreatment? (yes/no) If yes, list control device ID and complete a separate control device form
No No No No No No No No No
13Describe any water treatment systems * See below See below See below See below See below See below See below See below See below
* Attach additional pages if necessary.
Chemical injection for pH control.
Scrubber blowdown is discharged to onsite wastewater treatment system.

WET SCRUBBERCONTROL DEVICE INFORMATION
FORM AQ303ANSWER SHEET
Oregon Department of Environmental QualityAir Contaminant Discharge Permit Application
Page 2 of 3Revised 4/25/00
1 Control Device ID
2 Process/Device(s) Controlled
3 Year installed
4 Manufacturer/Model No.
5 Control Efficiency (%)
6 Type of scrubber
7 Is water re-circulated?
8 Design water flow rate (gpm)
9 Design water pressure (psig)
10 Design inlet gas flow rate (acfm)
11 Design pressure drop (inches of water)
12Inlet gas pretreatment? (yes/no) If yes, list control device ID and complete a separate control device form
13Describe any water treatment systems *
Facility Name: Ronler Acres and Aloha Permit Number: 34-2681-ST-01
SC142-22-100 SC142-23-100 D1X-SC142-1-11 D1X-SC142-2-11 D1X-SC142-3-11 D1X-SC142-4-11 D1XM2-SC142-1-00 D1XM2-SC142-2-00 D1XM2-SC142-3-00
NH4+ exhaust NH4+ exhaust NH4+ exhaust NH4+ exhaust NH4+ exhaust NH4+ exhaust NH4+ exhaust NH4+ exhaust NH4+ exhaust
12/31/2008 12/31/2008 5/31/2012 5/31/2012 11/15/2013 Future TBD 8/1/2014 8/8/2014 Future TBD
HEE HEE HEE HEE HEE HEE HEE HEE HEE
~90% for NH3 ~90% for NH3 ~90% for NH3 ~90% for NH3 ~90% for NH3 ~90% for NH3 ~90% for NH3 ~90% for NH3 ~90% for NH3
Packed bed Packed bed Packed bed Packed bed Packed bed Packed bed Packed bed Packed bed Packed bed
Yes Yes Yes Yes Yes Yes Yes Yes Yes
354 354 544 544 544 544 544 544 544
40 to 60 psig in industrial water feed
system
40 to 60 psig in industrial water feed
system
40 to 60 psig in industrial water feed
system
40 to 60 psig in industrial water feed
system
40 to 60 psig in industrial water feed
system
40 to 60 psig in industrial water feed
system
40 to 60 psig in industrial water feed
system
40 to 60 psig in industrial water feed
system
40 to 60 psig in industrial water feed
system
26,000 26,000 40,000 40,000 40,000 40,000 40,000 40,000 40,000
1.5 1.5 0.9 0.9 0.9 0.9 0.9 0.9 0.9
No No No No No No No No No
See below See below See below See below See below See below See below See below See below
* Attach additional pages if necessary.
Chemical injection for pH control.
Scrubber blowdown is discharged to onsite wastewater treatment system.

WET SCRUBBERCONTROL DEVICE INFORMATION
FORM AQ303ANSWER SHEET
Oregon Department of Environmental QualityAir Contaminant Discharge Permit Application
Page 3 of 3Revised 4/25/00
1 Control Device ID
2 Process/Device(s) Controlled
3 Year installed
4 Manufacturer/Model No.
5 Control Efficiency (%)
6 Type of scrubber
7 Is water re-circulated?
8 Design water flow rate (gpm)
9 Design water pressure (psig)
10 Design inlet gas flow rate (acfm)
11 Design pressure drop (inches of water)
12Inlet gas pretreatment? (yes/no) If yes, list control device ID and complete a separate control device form
13Describe any water treatment systems *
Facility Name: Ronler Acres and Aloha Permit Number: 34-2681-ST-01
D1XM2-SC142-4-00 D1XM3-SC142-1-00 D1XM3-SC142-2-00 D1XM3-SC142-3-00 D1XM3-SC142-4-00 RB1-SC-142-1-100 RB1-SC-142-2-100 RB1-SC-142-3-100
NH4+ exhaust NH4+ exhaust NH4+ exhaust NH4+ exhaust NH4+ exhaust NH4+ exhaust NH4+ exhaust NH4+ exhaust
Future TBD Future TBD Future TBD Future TBD Future TBD 1997 1997 Future TBD
HEE HEE or equivalent HEE or equivalent HEE or equivalent HEE or equivalent HEE Beverly Pacific HEE or equivalent
~90% for NH3 ~90% for NH3 ~90% for NH3 ~90% for NH3 ~90% for NH3 ~90% for NH3 ~90% for NH3 ~90% for NH3
Packed bed Packed bed Packed bed Packed bed Packed bed Packed bed Packed bed Packed bed
Yes Yes Yes Yes Yes Yes Yes Yes
544 544 544 544 544 340 517 517
40 to 60 psig in industrial water feed
system
40 to 60 psig in industrial water feed
system
40 to 60 psig in industrial water feed
system
40 to 60 psig in industrial water feed
system
40 to 60 psig in industrial water feed
system
40 to 60 psig in industrial water feed
system
40 to 60 psig in industrial water feed
system
40 to 60 psig in industrial water feed
system
40,000 40,000 40,000 40,000 40,000 25,000 25,000 25,000
0.9 0.9 0.9 0.9 0.9 1.5 1.0 1.5
No No No No No No No No
See below See below See below See below See below See below See below See below
* Attach additional pages if necessary.
Chemical injection for pH control.
Scrubber blowdown is discharged to onsite wastewater treatment system.

This page intentionally left blank.

WET SCRUBBERCONTROL DEVICE INFORMATION
FORM AQ303ANSWER SHEET
Oregon Department of Environmental QualityAir Contaminant Discharge Permit Application
Page 1 of 1Revised 4/25/00
Facility Name: Ronler Acres and Aloha Permit Number: 34-2681-ST-01
1 Control Device ID F15-SC7-1-1 F15-SC7-1-2 F15-SC7-1-3 F15-SC7-1-4 F15-SC7-1-5 F15-SC7-1-6 F15-SC7-1-7 F15-SC7-2-12
2 Process/Device(s) Controlled Corrosive exhaust Corrosive exhaust Corrosive exhaust Corrosive exhaust Corrosive exhaust Corrosive exhaust Corrosive exhaust Corrosive exhaust
3 Year installed 1992 1992 1992 1992 1992 1992 1992 1992
4 Manufacturer/Model No. Beverly Pacific Co. Harrington Industrial Harrington Industrial Harrington Industrial Harrington Industrial Beverly Pacific Co. Harrington Industrial Harrington Industrial
5 Control Efficiency (%) See below (1) See below (1) See below (1) See below (1) See below (1) See below (1) See below (1) See below (1)
6 Type of scrubber Packed bed Packed bed Packed bed Packed bed Packed bed Packed bed Packed bed Packed bed
7 Is water re-circulated? Yes Yes Yes Yes Yes Yes Yes Yes
8 Design water flow rate (gpm) 816 816 1156 1156 816 816 394 136
9 Design water pressure (psig) 40 to 50 psi 41 to 50 psi 42 to 50 psi 43 to 50 psi 44 to 50 psi 45 to 50 psi 50 to 70 psi 51 to 70 psi
10 Design inlet gas flow rate (cfm) 60,000 60,000 85,000 85,000 60,000 60,000 29,000 10,000
11 Design pressure drop (inches of water) (range) 0” – 2.0” WC 0” – 2.3” WC 0” – 2.1” WC 0” – 2.1” WC 0 – 2.3” WC 0” – 2.0” WC 0” – 2.6” WC 0” – 1.5” WC
12Inlet gas pretreatment? (yes/no) If yes, list control device ID and complete a separate control device form
no no no no no no no no
13Describe any water treatment systems * See below (2) See below (2) See below (2) See below (2) See below (2) See below (2) See below (2) See below (2)
* Attach additional pages if necessary.
(1) For HF and HCL, 90% removal for inlet concentration > 10 ppmv and <1 ppmv for inlet concentration <10 ppmv
(2) Chemical injection for pH control.
Scrubber blowdown is discharged to onsite wastewater treatment system.

This page intentionally left blank.

WET SCRUBBERCONTROL DEVICE INFORMATION
FORM AQ303ANSWER SHEET
Oregon Department of Environmental QualityAir Contaminant Discharge Permit Application
Page 1 of 11Revised 4/25/00
Facility Name: Ronler Acres and Aloha Permit Number: 34-2681-ST-01
1 Control Device ID F20-SC133-1-111 F20-SC133-2-111 F20-SC133-3-111 D1C-SC133-1-100 D1C-SC133-2-100 D1C-SC133-3-100 D1C-SC133-4-100
2 Process/Device(s) Controlled Corrosive exhaust Corrosive exhaust Corrosive exhaust Corrosive exhaust Corrosive exhaust Corrosive exhaust Corrosive exhaust
3 Year installed Jun-96 Jun-96 Jun-96 Jul-99 Jul-99 Jul-99 Jul-99
4 Manufacturer/Model No. HEE HEE HEE HEE HEE HEE HEE
5 Control Efficiency (%) See below (1) See below (1) See below (1) See below (1) See below (1) See below (1) See below (1)
6 Type of scrubber Packed bed Packed bed Packed bed Packed bed Packed bed Packed bed Packed bed
7 Is water re-circulated? Yes Yes Yes Yes Yes Yes Yes
8 Design water flow rate (gpm) 748 748 748 680 680 680 680
9 Design water pressure (psig)40 to 60 psig in industrial water
feed system40 to 60 psig in industrial water
feed system40 to 60 psig in industrial water
feed system40 to 60 psig in industrial water
feed system40 to 60 psig in industrial water
feed system40 to 60 psig in industrial water
feed system40 to 60 psig in industrial water
feed system
10 Design inlet gas flow rate (cfm) 55,000 55,000 55,000 50,000 50,000 50,000 50,000
11 Design pressure drop (inches of water) 1.7 1.7 1.7 1.93 1.93 1.93 1.93
12Inlet gas pretreatment? (yes/no) If yes, list control device ID and complete a separate control device form
no no no no no no no
13Describe any water treatment systems * See below (2) See below (2) See below (2) See below (2) See below (2) See below (2) See below (2)
* Attach additional pages if necessary.
(1) For HF and HCL, 90% removal for inlet concentration > 10 ppmv and <1 ppmv for inlet concentration <10 ppmv
(2) Chemical injection for pH control.

WET SCRUBBERCONTROL DEVICE INFORMATION
FORM AQ303ANSWER SHEET
Oregon Department of Environmental QualityAir Contaminant Discharge Permit Application
Page 2 of 11Revised 4/25/00
1 Control Device ID
2 Process/Device(s) Controlled
3 Year installed
4 Manufacturer/Model No.
5 Control Efficiency (%)
6 Type of scrubber
7 Is water re-circulated?
8 Design water flow rate (gpm)
9 Design water pressure (psig)
10 Design inlet gas flow rate (cfm)
11 Design pressure drop (inches of water)
12Inlet gas pretreatment? (yes/no) If yes, list control device ID and complete a separate control device form
13Describe any water treatment systems *
Facility Name: Ronler Acres and Aloha Permit Number: 34-2681-ST-01
SC-133-1-100 SC-133-2-100 SC-133-3-100 SC-133-4-100 SC-133-5-100 SC-133-6-100 D1X-SC133-1-00
Corrosive exhaust Corrosive exhaust Corrosive exhaust Corrosive exhaust Corrosive exhaust Corrosive exhaust Corrosive exhaust
May-02 Jun-03 Sep-02 Jan-04 May-00 May-00 Jun-12
HEE HEE HEE HEE HEE HEE HEE
See below (1) See below (1) See below (1) See below (1) See below (1) See below (1) See below (1)
Packed bed Packed bed Packed bed Packed bed Packed bed Packed bed Packed bed
Yes Yes Yes Yes Yes Yes Yes
680 680 680 680 680 680 1292
40 to 60 psig in industrial water feed system
40 to 60 psig in industrial water feed system
40 to 60 psig in industrial water feed system
40 to 60 psig in industrial water feed system
40 to 60 psig in industrial water feed system
40 to 60 psig in industrial water feed system
40 to 60 psig in industrial water feed system
50,000 50,000 50,000 50,000 50,000 50,000 95,000
2.1 2.1 2.1 2.1 2.2 1.0 1.0
no no no no no no no
See below (2) See below (2) See below (2) See below (2) See below (2) See below (2) See below (2)
* Attach additional pages if necessary.
(1) For HF and HCL, 90% removal for inlet concentration > 10 ppmv and <1 ppmv for inlet concentration <10 ppmv
(2) Chemical injection for pH control.

WET SCRUBBERCONTROL DEVICE INFORMATION
FORM AQ303ANSWER SHEET
Oregon Department of Environmental QualityAir Contaminant Discharge Permit Application
Page 3 of 11Revised 4/25/00
1 Control Device ID
2 Process/Device(s) Controlled
3 Year installed
4 Manufacturer/Model No.
5 Control Efficiency (%)
6 Type of scrubber
7 Is water re-circulated?
8 Design water flow rate (gpm)
9 Design water pressure (psig)
10 Design inlet gas flow rate (cfm)
11 Design pressure drop (inches of water)
12Inlet gas pretreatment? (yes/no) If yes, list control device ID and complete a separate control device form
13Describe any water treatment systems *
Facility Name: Ronler Acres and Aloha Permit Number: 34-2681-ST-01
D1X-SC133-2-00 D1X-SC133-3-00 D1X-SC133-4-00 D1X-SC133-5-00 D1XM2-SC133-1-00 D1XM2-SC133-2-00 D1XM2-SC133-3-00
Corrosive exhaust Corrosive exhaust Corrosive exhaust Corrosive exhaust Corrosive exhaust Corrosive exhaust Corrosive exhaust
Jun-12 Nov-13 Nov-13 Future TBD Jul-14 Aug-14 Aug-14
HEE HEE HEE HEE HEE HEE HEE
See below (1) See below (1) See below (1) See below (1) See below (1) See below (1) See below (1)
Packed bed Packed bed Packed bed Packed bed Packed bed Packed bed Packed bed
Yes Yes Yes Yes Yes Yes Yes
1292 1292 1292 1292 1292 1292 1292
40 to 60 psig in industrial water feed system
40 to 60 psig in industrial water feed system
40 to 60 psig in industrial water feed system
40 to 60 psig in industrial water feed system
40 to 60 psig in industrial water feed system
40 to 60 psig in industrial water feed system
40 to 60 psig in industrial water feed system
95,000 95,000 95,000 95,000 95,000 95,000 95,000
1.0 1.0 1.0 1.0 1.0 1.0 1.0
no no no no no no no
See below (2) See below (2) See below (2) See below (2) See below (2) See below (2) See below (2)
* Attach additional pages if necessary.
(1) For HF and HCL, 90% removal for inlet concentration > 10 ppmv and <1 ppmv for inlet concentration <10 ppmv
(2) Chemical injection for pH control.

WET SCRUBBERCONTROL DEVICE INFORMATION
FORM AQ303ANSWER SHEET
Oregon Department of Environmental QualityAir Contaminant Discharge Permit Application
Page 4 of 11Revised 4/25/00
1 Control Device ID
2 Process/Device(s) Controlled
3 Year installed
4 Manufacturer/Model No.
5 Control Efficiency (%)
6 Type of scrubber
7 Is water re-circulated?
8 Design water flow rate (gpm)
9 Design water pressure (psig)
10 Design inlet gas flow rate (cfm)
11 Design pressure drop (inches of water)
12Inlet gas pretreatment? (yes/no) If yes, list control device ID and complete a separate control device form
13Describe any water treatment systems *
Facility Name: Ronler Acres and Aloha Permit Number: 34-2681-ST-01
D1XM2-SC133-4-00 D1XM2-SC133-5-00 D1XM3-SC133-1-00 D1XM3-SC133-2-00 D1XM3-SC133-3-00 D1XM3-SC133-4-00 D1XM3-SC133-5-00
Corrosive exhaust Corrosive exhaust Corrosive exhaust Corrosive exhaust Corrosive exhaust Corrosive exhaust Corrosive exhaust
Aug-14 Future TBD Future TBD Future TBD Future TBD Future TBD Future TBD
HEE HEE HEE or equivalent HEE or equivalent HEE or equivalent HEE or equivalent HEE or equivalent
See below (1) See below (1) See below (1) See below (1) See below (1) See below (1) See below (1)
Packed bed Packed bed Packed bed Packed bed Packed bed Packed bed Packed bed
Yes Yes Yes Yes Yes Yes Yes
1292 1292 1292 1292 1292 1292 1292
40 to 60 psig in industrial water feed system
40 to 60 psig in industrial water feed system
40 to 60 psig in industrial water feed system
40 to 60 psig in industrial water feed system
40 to 60 psig in industrial water feed system
40 to 60 psig in industrial water feed system
40 to 60 psig in industrial water feed system
95,000 95,000 95,000 95,000 95,000 95,000 95,000
1.0 1.0 1.0 1.0 1.0 1.0 1.0
no no no no no no no
See below (2) See below (2) See below (2) See below (2) See below (2) See below (2) See below (2)
* Attach additional pages if necessary.
(1) For HF and HCL, 90% removal for inlet concentration > 10 ppmv and <1 ppmv for inlet concentration <10 ppmv
(2) Chemical injection for pH control.

WET SCRUBBERCONTROL DEVICE INFORMATION
FORM AQ303ANSWER SHEET
Oregon Department of Environmental QualityAir Contaminant Discharge Permit Application
Page 5 of 11Revised 4/25/00
1 Control Device ID
2 Process/Device(s) Controlled
3 Year installed
4 Manufacturer/Model No.
5 Control Efficiency (%)
6 Type of scrubber
7 Is water re-circulated?
8 Design water flow rate (gpm)
9 Design water pressure (psig)
10 Design inlet gas flow rate (cfm)
11 Design pressure drop (inches of water)
12Inlet gas pretreatment? (yes/no) If yes, list control device ID and complete a separate control device form
13Describe any water treatment systems *
Facility Name: Ronler Acres and Aloha Permit Number: 34-2681-ST-01
MBR-SC133-1 MBR-SC133-2 MBR2-SC133-1 MBR2-SC133-2 RA4-SC133-1 RP1-SC133-1-100 RP1-SC133-2-100
Corrosive exhaust Corrosive exhaust Corrosive exhaust Corrosive exhaust Corrosive exhaust Corrosive exhaust Corrosive exhaust
Q1 2016 Future TBD Future TBD Future TBD Future TBD Jun-03 Jun-03
HEE or equivalent HEE or equivalent HEE or equivalent HEE or equivalent HEE or equivalent Beverly Pacific HEE
See below (1) See below (1) See below (1) See below (1) See below (1) See below (1) See below (1)
Packed bed Packed bed Packed bed Packed bed Packed bed Packed bed Packed bed
Yes Yes Yes Yes Yes Yes Yes
272 272 272 272 272 544 544
40 to 60 psig in industrial water feed system
40 to 60 psig in industrial water feed system
40 to 60 psig in industrial water feed system
40 to 60 psig in industrial water feed system
40 to 60 psig in industrial water feed system
40 to 60 psig in industrial water feed system
40 to 60 psig in industrial water feed system
20,000 20,000 20,000 20,000 20,000 38,000 42,000
0.9 0.9 0.9 0.9 0.9 2.15 1.72
no no no no no no no
See below (2) See below (2) See below (2) See below (2) See below (2) See below (2) See below (2)
* Attach additional pages if necessary.
(1) For HF and HCL, 90% removal for inlet concentration > 10 ppmv and <1 ppmv for inlet concentration <10 ppmv
(2) Chemical injection for pH control.

WET SCRUBBERCONTROL DEVICE INFORMATION
FORM AQ303ANSWER SHEET
Oregon Department of Environmental QualityAir Contaminant Discharge Permit Application
Page 6 of 11Revised 4/25/00
1 Control Device ID
2 Process/Device(s) Controlled
3 Year installed
4 Manufacturer/Model No.
5 Control Efficiency (%)
6 Type of scrubber
7 Is water re-circulated?
8 Design water flow rate (gpm)
9 Design water pressure (psig)
10 Design inlet gas flow rate (cfm)
11 Design pressure drop (inches of water)
12Inlet gas pretreatment? (yes/no) If yes, list control device ID and complete a separate control device form
13Describe any water treatment systems *
Facility Name: Ronler Acres and Aloha Permit Number: 34-2681-ST-01
MSB-SC133-1 MSB-SC133-2 MSB-SC133-3 MSB2-SC133-1 MSB2-SC133-2 MSB2-SC133-3 MSB3-SC133-1
Corrosive exhaust Corrosive exhaust Corrosive exhaust Corrosive exhaust Corrosive exhaust Corrosive exhaust Corrosive exhaust
Future TBD Future TBD Future TBD Future TBD Future TBD Future TBD Future TBD
HEE or equivalent HEE or equivalent HEE or equivalent HEE or equivalent HEE or equivalent HEE or equivalent HEE or equivalent
See below (1) See below (1) See below (1) See below (1) See below (1) See below (1) See below (1)
Packed bed Packed bed Packed bed Packed bed Packed bed Packed bed Packed bed
Yes Yes Yes Yes Yes Yes Yes
1292 1292 1292 1292 1292 1292 1292
40 to 60 psig in industrial water feed system
40 to 60 psig in industrial water feed system
40 to 60 psig in industrial water feed system
40 to 60 psig in industrial water feed system
40 to 60 psig in industrial water feed system
40 to 60 psig in industrial water feed system
40 to 60 psig in industrial water feed system
95,000 95,000 95,000 95,000 95,000 95,000 95,000
1.0 1.0 1.0 1.0 1.0 1.0 1.0
no no no no no no no
See below (2) See below (2) See below (2) See below (2) See below (2) See below (2) See below (2)
* Attach additional pages if necessary.
(1) For HF and HCL, 90% removal for inlet concentration > 10 ppmv and <1 ppmv for inlet concentration <10 ppmv
(2) Chemical injection for pH control.

WET SCRUBBERCONTROL DEVICE INFORMATION
FORM AQ303ANSWER SHEET
Oregon Department of Environmental QualityAir Contaminant Discharge Permit Application
Page 7 of 11Revised 4/25/00
1 Control Device ID
2 Process/Device(s) Controlled
3 Year installed
4 Manufacturer/Model No.
5 Control Efficiency (%)
6 Type of scrubber
7 Is water re-circulated?
8 Design water flow rate (gpm)
9 Design water pressure (psig)
10 Design inlet gas flow rate (cfm)
11 Design pressure drop (inches of water)
12Inlet gas pretreatment? (yes/no) If yes, list control device ID and complete a separate control device form
13Describe any water treatment systems *
Facility Name: Ronler Acres and Aloha Permit Number: 34-2681-ST-01
MSB3-SC133-2 MSB3-SC133-3 RB1-SC-133-1-100 RB1-SC-133-2-100 RB1-SC-133-8-100 D1C-SC133-1-200 SC-133-1-200
Corrosive exhaust Corrosive exhaust Corrosive exhaust Corrosive exhaust Corrosive exhaust Corrosive exhaust Corrosive exhaust
Future TBD Future TBD May-97 May-97 May-00 Jun-01 Oct-01
HEE or equivalent HEE or equivalent HEE HEE HEE HEE Beverly Pacific
See below (1) See below (1) See below (1) See below (1) See below (1) See below (1) See below (1)
Packed bed Packed bed Packed bed Packed bed Packed bed Packed bed Packed bed
Yes Yes Yes Yes Yes Yes Yes
1292 1292 612 612 3313 68 136
40 to 60 psig in industrial water feed system
40 to 60 psig in industrial water feed system
40 to 60 psig in industrial water feed system
40 to 60 psig in industrial water feed system
40 to 60 psig in industrial water feed system
40 to 60 psig in industrial water feed system
40 to 60 psig in industrial water feed system
95,000 95,000 45,000 45,000 55,000 5,000 10,000
1.0 1.0 1.7 1.7 1.7 1.2 2.1
no no no no no no no
See below (2) See below (2) See below (2) See below (2) See below (2) See below (2) See below (2)
* Attach additional pages if necessary.
(1) For HF and HCL, 90% removal for inlet concentration > 10 ppmv and <1 ppmv for inlet concentration <10 ppmv
(2) Chemical injection for pH control.

WET SCRUBBERCONTROL DEVICE INFORMATION
FORM AQ303ANSWER SHEET
Oregon Department of Environmental QualityAir Contaminant Discharge Permit Application
Page 8 of 11Revised 4/25/00
1 Control Device ID
2 Process/Device(s) Controlled
3 Year installed
4 Manufacturer/Model No.
5 Control Efficiency (%)
6 Type of scrubber
7 Is water re-circulated?
8 Design water flow rate (gpm)
9 Design water pressure (psig)
10 Design inlet gas flow rate (cfm)
11 Design pressure drop (inches of water)
12Inlet gas pretreatment? (yes/no) If yes, list control device ID and complete a separate control device form
13Describe any water treatment systems *
Facility Name: Ronler Acres and Aloha Permit Number: 34-2681-ST-01
F20-SC-134-1-100 RP1-SC134-1-100 RB1-SC-133-4-100 RB1-SC-133-6-100 RB1-SC-133-7-100 D1C-SC134-1-100 D1C-SC134-2-100
Corrosive exhaust Corrosive exhaust Corrosive exhaust Corrosive exhaust Corrosive exhaust Corrosive exhaust Corrosive exhaust
Sep-95 Jun-03 May-00 May-00 May-00 Jul-99 Jul-99
HEE Beverly Pacific Beverly Pacific Beverly Pacific Beverly Pacific HEE HEE
See below (1) See below (1) See below (1) See below (1) See below (1) See below (1) See below (1)
Packed bed Packed bed Packed bed Packed bed Packed bed Packed bed Packed bed
Yes Yes Yes Yes Yes Yes Yes
748 571 612 612 612 408 680
40 to 60 psig in industrial water feed system
40 to 60 psig in industrial water feed system
40 to 60 psig in industrial water feed system
40 to 60 psig in industrial water feed system
40 to 60 psig in industrial water feed system
40 to 60 psig in industrial water feed system
40 to 60 psig in industrial water feed system
55,000 42,000 45,000 45,000 45,000 30,000 30,000
3.0 1.95 1.0 1.0 1.0 2.59 4.62
no no no no no no no
See below (2) See below (2) See below (2) See below (2) See below (2) See below (2) See below (2)
* Attach additional pages if necessary.
(1) For HF and HCL, 90% removal for inlet concentration > 10 ppmv and <1 ppmv for inlet concentration <10 ppmv
(2) Chemical injection for pH control.

WET SCRUBBERCONTROL DEVICE INFORMATION
FORM AQ303ANSWER SHEET
Oregon Department of Environmental QualityAir Contaminant Discharge Permit Application
Page 9 of 11Revised 4/25/00
1 Control Device ID
2 Process/Device(s) Controlled
3 Year installed
4 Manufacturer/Model No.
5 Control Efficiency (%)
6 Type of scrubber
7 Is water re-circulated?
8 Design water flow rate (gpm)
9 Design water pressure (psig)
10 Design inlet gas flow rate (cfm)
11 Design pressure drop (inches of water)
12Inlet gas pretreatment? (yes/no) If yes, list control device ID and complete a separate control device form
13Describe any water treatment systems *
Facility Name: Ronler Acres and Aloha Permit Number: 34-2681-ST-01
SC-134-1-100 SC-134-2-100 SC-134-3-100 D1X-SC134-1-00 D1X-SC134-2-00 D1X-SC134-3-00 D1X-SC134-4-00
Corrosive exhaust Corrosive exhaust Corrosive exhaust Corrosive exhaust Corrosive exhaust Corrosive exhaust Corrosive exhaust
Apr-02 Apr-02 Apr-02 May-12 May-12 May-12 May-12
HEE HEE HEE HEE HEE HEE HEE
See below (1) See below (1) See below (1) See below (1) See below (1) See below (1) See below (1)
Packed bed Packed bed Packed bed Packed bed Packed bed Packed bed Packed bed
Yes Yes Yes Yes Yes Yes Yes
680 680 680 544 544 544 544
40 to 60 psig in industrial water feed system
40 to 60 psig in industrial water feed system
40 to 60 psig in industrial water feed system
40 to 60 psig in industrial water feed system
40 to 60 psig in industrial water feed system
40 to 60 psig in industrial water feed system
40 to 60 psig in industrial water feed system
50,000 50,000 50,000 40,000 40,000 40,000 40,000
3.14 3.14 4.54 4.3 0.9 0.9 0.9
no no no no no no no
See below (2) See below (2) See below (2) See below (2) See below (2) See below (2) See below (2)
* Attach additional pages if necessary.
(1) For HF and HCL, 90% removal for inlet concentration > 10 ppmv and <1 ppmv for inlet concentration <10 ppmv
(2) Chemical injection for pH control.

WET SCRUBBERCONTROL DEVICE INFORMATION
FORM AQ303ANSWER SHEET
Oregon Department of Environmental QualityAir Contaminant Discharge Permit Application
Page 10 of 11Revised 4/25/00
1 Control Device ID
2 Process/Device(s) Controlled
3 Year installed
4 Manufacturer/Model No.
5 Control Efficiency (%)
6 Type of scrubber
7 Is water re-circulated?
8 Design water flow rate (gpm)
9 Design water pressure (psig)
10 Design inlet gas flow rate (cfm)
11 Design pressure drop (inches of water)
12Inlet gas pretreatment? (yes/no) If yes, list control device ID and complete a separate control device form
13Describe any water treatment systems *
Facility Name: Ronler Acres and Aloha Permit Number: 34-2681-ST-01
D1XM2-SC134-1-00 D1XM2-SC134-2-00 D1XM2-SC134-3-00 D1XM2-SC134-4-00 D1XM3-SC134-1-00 D1XM3-SC134-2-00 D1XM3-SC134-3-00
Corrosive exhaust Corrosive exhaust Corrosive exhaust Corrosive exhaust Corrosive exhaust Corrosive exhaust Corrosive exhaust
Jun-14 Jun-14 Jun-14 Jun-14 Future TBD Future TBD Future TBD
HEE HEE HEE HEE HEE or equivalent HEE or equivalent HEE or equivalent
See below (1) See below (1) See below (1) See below (1) See below (1) See below (1) See below (1)
Packed bed Packed bed Packed bed Packed bed Packed bed Packed bed Packed bed
Yes Yes Yes Yes Yes Yes Yes
544 544 544 544 544 544 544
40 to 60 psig in industrial water feed system
40 to 60 psig in industrial water feed system
40 to 60 psig in industrial water feed system
40 to 60 psig in industrial water feed system
40 to 60 psig in industrial water feed system
40 to 60 psig in industrial water feed system
40 to 60 psig in industrial water feed system
40,000 40,000 40,000 40,000 40,000 40,000 40,000
4.3 0.9 0.9 0.9 4.3 0.9 0.9
no no no no no no no
See below (2) See below (2) See below (2) See below (2) See below (2) See below (2) See below (2)
* Attach additional pages if necessary.
(1) For HF and HCL, 90% removal for inlet concentration > 10 ppmv and <1 ppmv for inlet concentration <10 ppmv
(2) Chemical injection for pH control.

WET SCRUBBERCONTROL DEVICE INFORMATION
FORM AQ303ANSWER SHEET
Oregon Department of Environmental QualityAir Contaminant Discharge Permit Application
Page 11 of 11Revised 4/25/00
1 Control Device ID
2 Process/Device(s) Controlled
3 Year installed
4 Manufacturer/Model No.
5 Control Efficiency (%)
6 Type of scrubber
7 Is water re-circulated?
8 Design water flow rate (gpm)
9 Design water pressure (psig)
10 Design inlet gas flow rate (cfm)
11 Design pressure drop (inches of water)
12Inlet gas pretreatment? (yes/no) If yes, list control device ID and complete a separate control device form
13Describe any water treatment systems *
Facility Name: Ronler Acres and Aloha Permit Number: 34-2681-ST-01
D1XM3-SC134-4-00 PUB1-SC133-1-00 PUB1-SC133-2-00
Corrosive exhaust Corrosive exhaust Corrosive exhaust
Future TBD May-12 May-12
HEE or equivalent HEE HEE or equivalent
See below (1) See below (1) See below (1)
Packed bed Packed bed Packed bed
Yes Yes Yes
544 272 272
40 to 60 psig in industrial water feed system
40 to 60 psig in industrial water feed system
40 to 60 psig in industrial water feed system
40,000 20,000 20,000
0.9 0.9 0.9
no no no
See below (2) See below (2) See below (2)
* Attach additional pages if necessary.
(1) For HF and HCL, 90% removal for inlet concentration > 10 ppmv and <1 ppmv for inlet concentration <10 ppmv
(2) Chemical injection for pH control.

This page intentionally left blank.
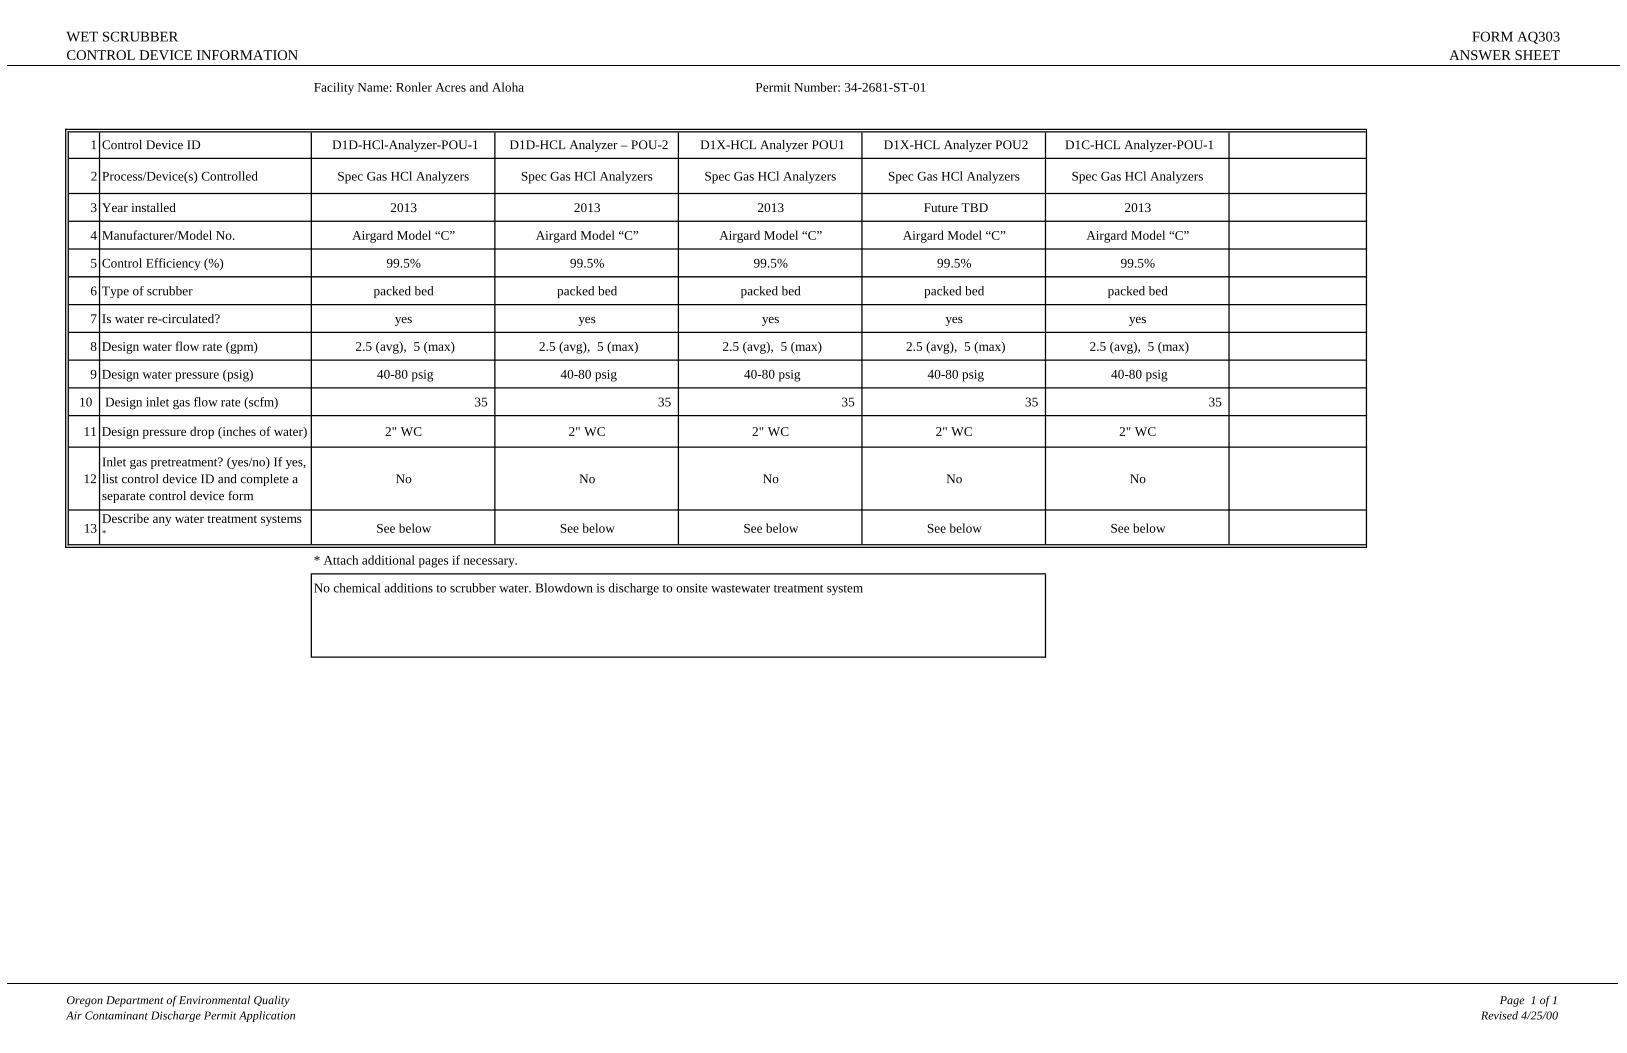
WET SCRUBBERCONTROL DEVICE INFORMATION
FORM AQ303ANSWER SHEET
Oregon Department of Environmental QualityAir Contaminant Discharge Permit Application
Page 1 of 1Revised 4/25/00
Facility Name: Ronler Acres and Aloha Permit Number: 34-2681-ST-01
1 Control Device ID D1D-HCl-Analyzer-POU-1 D1D-HCL Analyzer – POU-2 D1X-HCL Analyzer POU1 D1X-HCL Analyzer POU2 D1C-HCL Analyzer-POU-1
2 Process/Device(s) Controlled Spec Gas HCl Analyzers Spec Gas HCl Analyzers Spec Gas HCl Analyzers Spec Gas HCl Analyzers Spec Gas HCl Analyzers
3 Year installed 2013 2013 2013 Future TBD 2013
4 Manufacturer/Model No. Airgard Model “C” Airgard Model “C” Airgard Model “C” Airgard Model “C” Airgard Model “C”
5 Control Efficiency (%) 99.5% 99.5% 99.5% 99.5% 99.5%
6 Type of scrubber packed bed packed bed packed bed packed bed packed bed
7 Is water re-circulated? yes yes yes yes yes
8 Design water flow rate (gpm) 2.5 (avg), 5 (max) 2.5 (avg), 5 (max) 2.5 (avg), 5 (max) 2.5 (avg), 5 (max) 2.5 (avg), 5 (max)
9 Design water pressure (psig) 40-80 psig 40-80 psig 40-80 psig 40-80 psig 40-80 psig
10 Design inlet gas flow rate (scfm) 35 35 35 35 35
11 Design pressure drop (inches of water) 2" WC 2" WC 2" WC 2" WC 2" WC
12Inlet gas pretreatment? (yes/no) If yes, list control device ID and complete a separate control device form
No No No No No
13Describe any water treatment systems * See below See below See below See below See below
* Attach additional pages if necessary.
No chemical additions to scrubber water. Blowdown is discharge to onsite wastewater treatment system

This page intentionally left blank.

FUME INCINERATORCONTROL DEVICE INFORMATION
FORM AQ306ANSWER SHEET
Oregon Department of Environmental QualityAir Contaminant Discharge Permit Application
Page 1 of 1Revised 4/25/00
Facility Name: Ronler Acres and Aloha Permit Number: 34-2681-ST-01
1 Control Device ID AL3-AU-138-10 F15-AU138-1-10 F15-AU138-2-10 F15-VOC138-3
2 Process/Device(s) Controlled FAB VOC exhaust FAB VOC exhaust FAB VOC exhaust FAB VOC exhaust
3 Year installed Future TBD Jan-03 Jan-08 Future TBD
4 Manufacturer/Model No. Munter or equivalent Munter Munter Munter or equivalent
5 Control Efficiency (%) >95% >95% >95% >95%
6 Type of incinerator thermal oxidizer thermal oxidizer thermal oxidizer thermal oxidizer
7 Design temperature (°F) 1400 F 1400 F 1400 F 1400 F
8 Design residence time (sec.) >/= 0.5 second >/= 0.5 second >/= 0.5 second >/= 0.5 second
9 Design inlet gas flow rate (cfm) 35,000 23,000 23,000 23,000
10Inlet gas pretreatment? (yes/no) If yes, list control device ID and complete a separate control device form
no no no no
11 Fuel type natural gas natural gas natural gas natural gas
12Design maximum hourly amount (specify units)
2 MMBTU/hr 2 MMBTU/hr 2 MMBTU/hr 2 MMBTU/hr
13Projected maximum annual amount (specify units)
17,520 MMBTU/yr 17,520 MMBTU/yr 17,520 MMBTU/yr 17,520 MMBTU/yr

This page intentionally left blank.

FUME INCINERATORCONTROL DEVICE INFORMATION
FORM AQ306ANSWER SHEET
Oregon Department of Environmental QualityAir Contaminant Discharge Permit Application
Page 1 of 7Revised 4/25/00
Facility Name: Ronler Acres and Aloha Permit Number: 34-2681-ST-01
1 Control Device ID F20-VOC138-1-100 F20-VOC138-2-100 F20-VOC138-3-100 F20-VOC138-4-100 D1C-VOC138-1-120 D1C-VOC138-2-120
2 Process/Device(s) Controlled FAB VOC exhaust FAB VOC exhaust FAB VOC exhaust FAB VOC exhaust FAB VOC exhaust FAB VOC exhaust
3 Year installed Jul-13 Jul-13 Future TBD Future TBD Jun-01 Jun-01
4 Manufacturer/Model No. Munters Munters Munters or equivalent Munters or equivalent Munters Munters
5 Control Efficiency (%) greater than 95% greater than 95% greater than 95% greater than 95% greater than 95% greater than 95%
6 Type of incinerator thermal oxidizer thermal oxidizer thermal oxidizer thermal oxidizer thermal oxidizer thermal oxidizer
7 Design temperature (°F) 1400 F 1400 F 1400 F 1400 F 1400 F 1400 F
8 Design residence time (sec.) >/= 0.5 second >/= 0.5 second >/= 0.5 second >/= 0.5 second >/= 0.5 second >/= 0.5 second
9 Design inlet gas flow rate (cfm) 35,000 (1) 35,000 (1) 35,000 35,000 35,000 (1) 35,000 (1)
10Inlet gas pretreatment? (yes/no) If yes, list control device ID and complete a separate control device form
no no no no no no
11 Fuel type natural gas natural gas natural gas natural gas natural gas natural gas
12Design maximum hourly amount (specify units)
2.0 MMBTUH 2.0 MMBTUH 2.0 MMBTUH 2.0 MMBTUH 2.0 MMBTUH 2.0 MMBTUH
13Projected maximum annual amount (specify units)
17,520 MMBTU/yr 17,520 MMBTU/yr 17,520 MMBTU/yr 17,520 MMBTU/yr 17,520 MMBTU/yr 17,520 MMBTU/yr
(1) These units will be modified to increase flow rate capacity from 25,000 cfm to 35,000 cfm and will be operated at their design heat input capacity throughout the year.

FUME INCINERATORCONTROL DEVICE INFORMATION
FORM AQ306ANSWER SHEET
Oregon Department of Environmental QualityAir Contaminant Discharge Permit Application
Page 2 of 7Revised 4/25/00
1 Control Device ID
2 Process/Device(s) Controlled
3 Year installed
4 Manufacturer/Model No.
5 Control Efficiency (%)
6 Type of incinerator
7 Design temperature (°F)
8 Design residence time (sec.)
9 Design inlet gas flow rate (cfm)
10Inlet gas pretreatment? (yes/no) If yes, list control device ID and complete a separate control device form
11 Fuel type
12Design maximum hourly amount (specify units)
13Projected maximum annual amount (specify units)
Facility Name: Ronler Acres and Aloha Permit Number: 34-2681-ST-01
D1C-VOC138-3-120 D1C-VOC138-4-120 D1C-VOC138-5-120 VOC-138-1-120 VOC-138-2-120 VOC-138-3-120
FAB VOC exhaust FAB VOC exhaust FAB VOC exhaust FAB VOC exhaust FAB VOC exhaust FAB VOC exhaust
Jun-01 Future TBD Future TBD Feb-02 Mar-02 Feb-04
Munters Munters or equivalent Munters or equivalent Munters Munters Munters
greater than 95% greater than 95% greater than 95% greater than 95% greater than 95% greater than 95%
thermal oxidizer thermal oxidizer thermal oxidizer thermal oxidizer thermal oxidizer thermal oxidizer
1400 F 1400 F 1400 F 1400 F 1400 F 1400 F
>/= 0.5 second >/= 0.5 second >/= 0.5 second >/= 0.5 second >/= 0.5 second >/= 0.5 second
35,000 (1) 35,000 35,000 25,000 25,000 25,000
no no no no no no
natural gas natural gas natural gas natural gas natural gas natural gas
2.0 MMBTUH 2.0 MMBTUH 2.0 MMBTUH 2.0 MMBTUH 2.0 MMBTUH 2.0 MMBTUH
17,520 MMBTU/yr 17,520 MMBTU/yr 17,520 MMBTU/yr 17,520 MMBTU/yr 17,520 MMBTU/yr 17,520 MMBTU/yr
(1) These units will be modified to increase flow rate capacity from 25,000 cfm to 35,000 cfm and will be operated at their design heat input capacity throughout the year.

FUME INCINERATORCONTROL DEVICE INFORMATION
FORM AQ306ANSWER SHEET
Oregon Department of Environmental QualityAir Contaminant Discharge Permit Application
Page 3 of 7Revised 4/25/00
1 Control Device ID
2 Process/Device(s) Controlled
3 Year installed
4 Manufacturer/Model No.
5 Control Efficiency (%)
6 Type of incinerator
7 Design temperature (°F)
8 Design residence time (sec.)
9 Design inlet gas flow rate (cfm)
10Inlet gas pretreatment? (yes/no) If yes, list control device ID and complete a separate control device form
11 Fuel type
12Design maximum hourly amount (specify units)
13Projected maximum annual amount (specify units)
Facility Name: Ronler Acres and Aloha Permit Number: 34-2681-ST-01
VOC-138-4-120 VOC-138-5-120 D1X-VOC138-4-20 D1X-VOC138-1-20 D1X-VOC138-2-20 D1X-VOC138-3-20
FAB VOC exhaust FAB VOC exhaust FAB VOC exhaust FAB VOC exhaust FAB VOC exhaust FAB VOC exhaust
Feb-04 Future TBD Apr-14 May-12 May-12 Sep-13
Munters Munters or equivalent Munters Munters Munters Munters
greater than 95% greater than 95% greater than 95% greater than 95% greater than 95% greater than 95%
thermal oxidizer thermal oxidizer thermal oxidizer thermal oxidizer thermal oxidizer thermal oxidizer
1400 F 1400 F 1400 F 1400 F 1400 F 1400 F
>/= 0.5 second >/= 0.5 second >/= 0.5 second >/= 0.5 second >/= 0.5 second >/= 0.5 second
25,000 25,000 40,000 40,000 40,000 40,000
no no no no no no
natural gas natural gas natural gas natural gas natural gas natural gas
2.0 MMBTUH 2.0 MMBTUH 3.5 MMBTUH 3.5 MMBTUH 3.5 MMBTUH 3.5 MMBTUH
17,520 MMBTU/yr 17,520 MMBTU/yr 30,660 MMBTU/yr 30,660 MMBTU/yr 30,660 MMBTU/yr 30,660 MMBTU/yr

FUME INCINERATORCONTROL DEVICE INFORMATION
FORM AQ306ANSWER SHEET
Oregon Department of Environmental QualityAir Contaminant Discharge Permit Application
Page 4 of 7Revised 4/25/00
1 Control Device ID
2 Process/Device(s) Controlled
3 Year installed
4 Manufacturer/Model No.
5 Control Efficiency (%)
6 Type of incinerator
7 Design temperature (°F)
8 Design residence time (sec.)
9 Design inlet gas flow rate (cfm)
10Inlet gas pretreatment? (yes/no) If yes, list control device ID and complete a separate control device form
11 Fuel type
12Design maximum hourly amount (specify units)
13Projected maximum annual amount (specify units)
Facility Name: Ronler Acres and Aloha Permit Number: 34-2681-ST-01
- Anguil RCTO D1X-1 - Anguil RCTO D1X-2 - Anguil RCTO D1X-3 - Anguil RCTO D1X-4 - Anguil RCTO D1XM2-1 - Anguil RCTO D1XM2-2
FAB VOC exhaust FAB VOC exhaust FAB VOC exhaust FAB VOC exhaust FAB VOC exhaust FAB VOC exhaust
Future TBD Future TBD Future TBD Future TBD Future TBD Future TBD
Anguil Anguil Anguil Anguil Anguil Anguil
greater than 95% greater than 95% greater than 95% greater than 95% greater than 95% greater than 95%
thermal oxidizer thermal oxidizer thermal oxidizer thermal oxidizer thermal oxidizer thermal oxidizer
1400 F 1400 F 1400 F 1400 F 1400 F 1400 F
>/= 0.5 second >/= 0.5 second >/= 0.5 second >/= 0.5 second >/= 0.5 second >/= 0.5 second
90,000 90,000 90,000 90,000 90,000 90,000
no no no no no no
natural gas natural gas natural gas natural gas natural gas natural gas
8.0 MMBTUH 8.0 MMBTUH 8.0 MMBTUH 8.0 MMBTUH 8.0 MMBTUH 8.0 MMBTUH
70,080 MMBTU/yr 70,080 MMBTU/yr 70,080 MMBTU/yr 70,080 MMBTU/yr 70,080 MMBTU/yr 70,080 MMBTU/yr

FUME INCINERATORCONTROL DEVICE INFORMATION
FORM AQ306ANSWER SHEET
Oregon Department of Environmental QualityAir Contaminant Discharge Permit Application
Page 5 of 7Revised 4/25/00
1 Control Device ID
2 Process/Device(s) Controlled
3 Year installed
4 Manufacturer/Model No.
5 Control Efficiency (%)
6 Type of incinerator
7 Design temperature (°F)
8 Design residence time (sec.)
9 Design inlet gas flow rate (cfm)
10Inlet gas pretreatment? (yes/no) If yes, list control device ID and complete a separate control device form
11 Fuel type
12Design maximum hourly amount (specify units)
13Projected maximum annual amount (specify units)
Facility Name: Ronler Acres and Aloha Permit Number: 34-2681-ST-01
- Anguil RCTO D1XM2-3 - Anguil RCTO D1XM2-4 - Anguil RCTO D1XM2-5 D1XM2-VOC138-1-20 D1XM2-VOC138-2-20 D1XM2-VOC138-3-20
FAB VOC exhaust FAB VOC exhaust FAB VOC exhaust FAB VOC exhaust FAB VOC exhaust FAB VOC exhaust
Future TBD Future TBD Future TBD Sep-14 Sep-14 Sep-14
Anguil Anguil Anguil Munters Munters Munters
greater than 95% greater than 95% greater than 95% greater than 95% greater than 95% greater than 95%
thermal oxidizer thermal oxidizer thermal oxidizer thermal oxidizer thermal oxidizer thermal oxidizer
1400 F 1400 F 1400 F 1400 F 1400 F 1400 F
>/= 0.5 second >/= 0.5 second >/= 0.5 second >/= 0.5 second >/= 0.5 second >/= 0.5 second
90,000 90,000 90,000 40,000 40,000 40,000
no no no no no no
natural gas natural gas natural gas natural gas natural gas natural gas
8.0 MMBTUH 8.0 MMBTUH 8.0 MMBTUH 3.5 MMBTUH 3.5 MMBTUH 3.5 MMBTUH
70,080 MMBTU/yr 70,080 MMBTU/yr 70,080 MMBTU/yr 30,660 MMBTU/yr 30,660 MMBTU/yr 30,660 MMBTU/yr

FUME INCINERATORCONTROL DEVICE INFORMATION
FORM AQ306ANSWER SHEET
Oregon Department of Environmental QualityAir Contaminant Discharge Permit Application
Page 6 of 7Revised 4/25/00
1 Control Device ID
2 Process/Device(s) Controlled
3 Year installed
4 Manufacturer/Model No.
5 Control Efficiency (%)
6 Type of incinerator
7 Design temperature (°F)
8 Design residence time (sec.)
9 Design inlet gas flow rate (cfm)
10Inlet gas pretreatment? (yes/no) If yes, list control device ID and complete a separate control device form
11 Fuel type
12Design maximum hourly amount (specify units)
13Projected maximum annual amount (specify units)
Facility Name: Ronler Acres and Aloha Permit Number: 34-2681-ST-01
D1XM2-VOC138-4-20 - Anguil RCTO D1XM3-1 - Anguil RCTO D1XM3-2 - Anguil RCTO D1XM3-3 - Anguil RCTO D1XM3-4 - Anguil RCTO D1XM3-5
FAB VOC exhaust FAB VOC exhaust FAB VOC exhaust FAB VOC exhaust FAB VOC exhaust FAB VOC exhaust
Future TBD Future TBD Future TBD Future TBD Future TBD Future TBD
Munters Anguil Anguil Anguil Anguil Anguil
greater than 95% greater than 95% greater than 95% greater than 95% greater than 95% greater than 95%
thermal oxidizer thermal oxidizer thermal oxidizer thermal oxidizer thermal oxidizer thermal oxidizer
1400 F 1400 F 1400 F 1400 F 1400 F 1400 F
>/= 0.5 second >/= 0.5 second >/= 0.5 second >/= 0.5 second >/= 0.5 second >/= 0.5 second
40,000 90,000 90,000 90,000 90,000 90,000
no no no no no no
natural gas natural gas natural gas natural gas natural gas natural gas
3.5 MMBTUH 8.0 MMBTUH 8.0 MMBTUH 8.0 MMBTUH 8.0 MMBTUH 8.0 MMBTUH
30,660 MMBTU/yr 70,080 MMBTU/yr 70,080 MMBTU/yr 70,080 MMBTU/yr 70,080 MMBTU/yr 70,080 MMBTU/yr

FUME INCINERATORCONTROL DEVICE INFORMATION
FORM AQ306ANSWER SHEET
Oregon Department of Environmental QualityAir Contaminant Discharge Permit Application
Page 7 of 7Revised 4/25/00
1 Control Device ID
2 Process/Device(s) Controlled
3 Year installed
4 Manufacturer/Model No.
5 Control Efficiency (%)
6 Type of incinerator
7 Design temperature (°F)
8 Design residence time (sec.)
9 Design inlet gas flow rate (cfm)
10Inlet gas pretreatment? (yes/no) If yes, list control device ID and complete a separate control device form
11 Fuel type
12Design maximum hourly amount (specify units)
13Projected maximum annual amount (specify units)
Facility Name: Ronler Acres and Aloha Permit Number: 34-2681-ST-01
D1C-BSSW1
Basic specialty solvent waste
2010
CPI TPU or equivlalent
see below for BSSW
thermal oxidizer
1400 F
>/= 0.5 second
300
no
natural gas
130,000 BTU/hr
1.1 billion BTU/yr
BSSW Control Efficiency
NH3 <50 ppmv or >/= 98%
H2 >/= 98%
VOCs / HAPs >/= 98%

This page intentionally left blank.

MISCELLANEOUSCONTROL DEVICE INFORMATION
FORM AQ307ANSWER SHEET
Oregon Department of Environmental QualityAir Contaminant Discharge Permit Application
Page 1 of 2Revised 4/25/00
Facility Name: Ronler Acres and Aloha Permit Number: 34-2681-ST-01
1 Control Device ID MBR-SC132-1 MBR-SC132-2 MBR-SC132-3 MBR-SC132-4 MBR-SC132-5 MBR-SC132-6 MBR2-SC132-1 MBR2-SC132-2
2 Process/Device(s) Controlleddry scrubber for odor
controldry scrubber for odor
controldry scrubber for odor
controldry scrubber for odor
controldry scrubber for odor
controldry scrubber for odor
controldry scrubber for odor
controldry scrubber for odor
control
3 Year installed Future TBD Future TBD Future TBD Future TBD Future TBD Future TBD Future TBD Future TBD
4 Manufacturer/Model No. TBD TBD TBD TBD TBD TBD TBD TBD
5 Control Efficiency (%) 70-95% 70-95% 70-95% 70-95% 70-95% 70-95% 70-95% 70-95%
6 Design inlet gas flow rate (cfm) 10K - 20K 10K - 20K 10K - 20K 10K - 20K 10K - 20K 10K - 20K 10K - 20K 10K - 20K
7 Design parameter (s) TBD TBD TBD TBD TBD TBD TBD TBD
8Inlet gas pretreatment? (yes/no) If yes, list control device ID and complete a separate control device form
No No No No No No No No
9 Describe the Control Device See below See below See below See below See below See below See below See below
A Dry scrubber for odor control for wastewater treatment system. Design being finalized

MISCELLANEOUSCONTROL DEVICE INFORMATION
FORM AQ307ANSWER SHEET
Oregon Department of Environmental QualityAir Contaminant Discharge Permit Application
Page 2 of 2Revised 4/25/00
1 Control Device ID
2 Process/Device(s) Controlled
3 Year installed
4 Manufacturer/Model No.
5 Control Efficiency (%)
6 Design inlet gas flow rate (cfm)
7 Design parameter (s)
8Inlet gas pretreatment? (yes/no) If yes, list control device ID and complete a separate control device form
9 Describe the Control Device
Facility Name: Ronler Acres and Aloha Permit Number: 34-2681-ST-01
MBR2-SC132-3 MBR2-SC132-4 MBR2-SC132-5 MBR2-SC132-6
dry scrubber for odor control
dry scrubber for odor control
dry scrubber for odor control
dry scrubber for odor control
Future TBD Future TBD Future TBD Future TBD
TBD TBD TBD TBD
70-95% 70-95% 70-95% 70-95%
10K - 20K 10K - 20K 10K - 20K 10K - 20K
TBD TBD TBD TBD
No No No No
See below See below See below See below
A Dry scrubber for odor control for wastewater treatment system. Design being finalized

MISCELLANEOUSCONTROL DEVICE INFORMATION
FORM AQ307ANSWER SHEET
Oregon Department of Environmental QualityAir Contaminant Discharge Permit Application
Page 1 of 2Revised 4/25/00
Facility Name: Ronler Acres and Aloha Permit Number: 34-2681-ST-01
1 Control Device ID D1C-EF-140-1-100 EF-140-2-100 EF-140-1-100 MSB-EF140-1 MSB-EF140-2 MSB2-EF140-1
2 Process/Device(s) Controlled Arsenic Specialty Exhaust Arsenic Specialty Exhaust Arsenic Specialty Exhaust Arsenic Specialty Exhaust Arsenic Specialty Exhaust Arsenic Specialty Exhaust
3 Year installed May-98 Oct-02 Jun-02 Future TBD Future TBD Future TBD
4 Manufacturer/Model No. Flanders VFH406 or equivalent Flanders VFH406 or equivalent Flanders VFH406 or equivalent Flanders VFH406 or equivalent Flanders VFH406 or equivalent Flanders VFH406 or equivalent
5 Control Efficiency (%) up to 99.99% up to 99.99% up to 99.99% up to 99.99% up to 99.99% up to 99.99%
6 Design inlet gas flow rate (cfm) 6000 6000 6000 6000 6000 6000
7 Design parameter (s)Pressure drop across the filter
<3.0" wcPressure drop across the filter
<3.0" wcPressure drop across the filter
<3.0" wcPressure drop across the filter
<3.0" wcPressure drop across the filter
<3.0" wcPressure drop across the filter
<3.0" wc
8Inlet gas pretreatment? (yes/no) If yes, list control device ID and complete a separate control device form
no no no no no no
9 Describe the Control Device HEPA filters HEPA filters HEPA filters HEPA filters HEPA filters HEPA filters
HEPA - High Efficiency Particulate Air

MISCELLANEOUSCONTROL DEVICE INFORMATION
FORM AQ307ANSWER SHEET
Oregon Department of Environmental QualityAir Contaminant Discharge Permit Application
Page 2 of 2Revised 4/25/00
1 Control Device ID
2 Process/Device(s) Controlled
3 Year installed
4 Manufacturer/Model No.
5 Control Efficiency (%)
6 Design inlet gas flow rate (cfm)
7 Design parameter (s)
8Inlet gas pretreatment? (yes/no) If yes, list control device ID and complete a separate control device form
9 Describe the Control Device
Facility Name: Ronler Acres and Aloha Permit Number: 34-2681-ST-01
MSB2-EF140-2 MSB3-EF140-1 MSB3-EF140-2
Arsenic Specialty Exhaust Arsenic Specialty Exhaust Arsenic Specialty Exhaust
Future TBD Future TBD Future TBD
Flanders VFH406 or equivalent Flanders VFH406 or equivalent Flanders VFH406 or equivalent
up to 99.99% up to 99.99% up to 99.99%
6000 6000 6000
Pressure drop across the filter <3.0" wc
Pressure drop across the filter <3.0" wc
Pressure drop across the filter <3.0" wc
no no no
HEPA filters HEPA filters HEPA filters
HEPA - High Efficiency Particulate Air

MISCELLANEOUSCONTROL DEVICE INFORMATION
FORM AQ307ANSWER SHEET
Oregon Department of Environmental QualityAir Contaminant Discharge Permit Application
Page 1 of 1Revised 4/25/00
Facility Name: Ronler Acres and Aloha Permit Number: 34-2681-ST-01
1 Control Device ID RACB2-FL266-1-48 RACB3-FL266-1-48 RAPB1A-FL266-1-48 RAPB1B-FL266-1-48 RAPB1C-FL266-1-48
2 Process/Device(s) Controlled Lime Silo Filters Lime Silo Filters Lime Silo Filters Lime Silo Filters Lime Silo Filters
3 Year installed 2001 2002 2012 2014 2014
4 Manufacturer/Model No. C.P.E. Filters 60-MS-049-C C.P.E. Filters 60-MS-049-C C.P.E. Filters 60-MS-049-C C.P.E. Filters 60-MS-049-C C.P.E. Filters 60-MS-049-C
5 Control Efficiency (%)outlet grain loading = 0.02
grains/ft3outlet grain loading = 0.02
grains/ft3outlet grain loading = 0.02
grains/ft3outlet grain loading = 0.02
grains/ft3outlet grain loading = 0.02
grains/ft3
6 Design inlet gas flow rate (cfm) 700 700 700 700 700
7 Design parameter (s) none none none none none
8Inlet gas pretreatment? (yes/no) If yes, list control device ID and complete a separate control device form
no no no no no
9 Describe the Control Device Bin vent filter Bin vent filter Bin vent filter Bin vent filter Bin vent filter

This page intentionally left blank.

MISCELLANEOUSCONTROL DEVICE INFORMATION
FORM AQ307ANSWER SHEET
Oregon Department of Environmental QualityAir Contaminant Discharge Permit Application
Page 1 of 2Revised 4/25/00
Facility Name: Ronler Acres and Aloha Permit Number: 34-2681-ST-01
1 Control Device ID CUB2-OX293-0-70 CUB3 - OX293-0-70 PUB1A-OX293-0-70 PUB1B-OX293-0-70 PUB1C-OX293-0-70
2 Process/Device(s) Controlledammonia wastewater abatement
systemammonia wastewater abatement
systemammonia wastewater abatement
systemammonia wastewater abatement
systemammonia wastewater abatement
system
3 Year installed Future TBD 2008 2012 2014 2014
4 Manufacturer/Model No.System - CPI
Burner - MaxonSystem - CPI
Burner - MaxonSystem - CPI
Burner - MaxonSystem - CPI
Burner - MaxonSystem - CPI
Burner - Maxon
5 Control Efficiency (%) NH3 DRE >99.8% NH3 DRE >99.8% NH3 DRE >99.8% NH3 DRE >99.8% NH3 DRE >99.8%
6 Design inlet gas flow rate (cfm) 4000 - 6500 scfm 4000 - 6500 scfm 4000 - 6500 scfm 4000 - 6500 scfm 4000 - 6500 scfm
7 Design parameter (s)Burner – 1.05 MM BTU/Hr
Ammonia Loading – 90 lbs/hrBurner – 1.05 MM BTU/Hr
Ammonia Loading – 90 lbs/hrBurner – 1.05 MM BTU/Hr
Ammonia Loading – 90 lbs/hrBurner – 1.05 MM BTU/Hr
Ammonia Loading – 90 lbs/hrBurner – 1.05 MM BTU/Hr
Ammonia Loading – 90 lbs/hr
8Inlet gas pretreatment? (yes/no) If yes, list control device ID and complete a separate control device form
no no no no no
9 Describe the Control Device See below See below See below See below See below
Ammonia laden wastewater from the Fab is run through an air stripper to remove ammonia prior to the discharge of the wastewater. The resulting ammonia air stream is then heated by a Natural Gas fired burner prior to passing through an ammonia catalyst followed by a NOx catalyst prior and then released to the atmosphere.

MISCELLANEOUSCONTROL DEVICE INFORMATION
FORM AQ307ANSWER SHEET
Oregon Department of Environmental QualityAir Contaminant Discharge Permit Application
Page 2 of 2Revised 4/25/00
1 Control Device ID
2 Process/Device(s) Controlled
3 Year installed
4 Manufacturer/Model No.
5 Control Efficiency (%)
6 Design inlet gas flow rate (cfm)
7 Design parameter (s)
8Inlet gas pretreatment? (yes/no) If yes, list control device ID and complete a separate control device form
9 Describe the Control Device
Facility Name: Ronler Acres and Aloha Permit Number: 34-2681-ST-01
PUB1D-OX293-0-70 PUB1E-OX293-0-70 PUB1F-OX293-0-70
ammonia wastewater abatement system
ammonia wastewater abatement system
ammonia wastewater abatement system
Future TBD Future TBD Future TBD
System - CPIBurner - Maxon
System - CPIBurner - Maxon
System - CPIBurner - Maxon
NH3 DRE >99.8% NH3 DRE >99.8% NH3 DRE >99.8%
4000 - 6500 scfm 4000 - 6500 scfm 4000 - 6500 scfm
Burner – 1.05 MM BTU/HrAmmonia Loading – 90 lbs/hr
Burner – 1.05 MM BTU/HrAmmonia Loading – 90 lbs/hr
Burner – 1.05 MM BTU/HrAmmonia Loading – 90 lbs/hr
no no no
See below See below See below
Ammonia laden wastewater from the Fab is run through an air stripper to remove ammonia prior to the discharge of the wastewater. The resulting ammonia air stream is then heated by a Natural Gas fired burner prior to passing through an ammonia catalyst followed by a NOx catalyst prior and then released to the atmosphere.

Plant Site Emissions Detail SheetCurrent/Future Operations
Form AQ402Answer Sheet
Oregon Department of Environmental QualityAir Contaminant Discharge Permit Application
Page 1 of 2Revised 4/25/00
Facility Name: Ronler Acres Permit Number: 34-2681-ST-01
1. Emissions Point
2. Short-term (specify units)
3. Annual (Specify units) 4. Pollutant 5. Short-term 6. Long-term 7. Reference (s)
8. Short-term (specify units)
9. Annual (tons/year)
Example 200 tons of rock/hr400,000 tons PM 0.04 lb/ton 0.04 lb/ton DEQ 8.0 lb/hr 8.0
Production Rates Emissions Factors Emissions
See Emissions Summary in application text.

Plant Site Emissions Detail SheetCurrent/Future Operations
Form AQ402Answer Sheet
Oregon Department of Environmental QualityAir Contaminant Discharge Permit Application
Page 2 of 2Revised 4/25/00
Facility Name: Ronler Acres Permit Number: 34-2681-ST-01
1. Device/process ID2. PM10 PSEL (tons/year) 3. PM2.5 fraction (f) 4. Reference
5. PM2.5 PSEL (tons/hr)
Total:
See Emissions Summary in application text.

HAZARDOUS AIR POLLUTANT (HAP)EMISSIONS DETAIL SHEET
FORM AQ403ANSWER SHEET
Oregon Department of Environmental QualityAir Contaminant Discharge Permit Application
Page 1 of 1Revised 08/01/11
Facility Name: Ronler Acres Permit Number: 34-2681-ST-01
Emissions Data
1. Emissions Point
2. Annual Production Rate (specify units) 3. Pollutant 4. Emission Factor 5. EF Reference
6. Annual Emissions (tons/yr)
Applications for Standard ACDPs must also include the most recent Toxics Release Inventory report, if applicable (see instructions).
See Emissions Summary in application text.

This page intentionally left blank

Appendix B Land Use Compatibility Statements

This page intentionally left blank


Appendix C Emissions Calculations

This page intentionally left blank

Boilers
Table 1 ‐ Boiler Emission FactorsUltra‐low NOx Burners
9 ppm 0.0108 lbs/MMBtu 11.0 lbs/MMscfLow NOx Burner
30 ppm 0.0360 lbs/MMBtu 36.7 lbs/MMscfStandard Burner
50 ppm 0.0600 lbs/MMBtu 61.2 lbs/MMscfAP‐42
81.7 ppm 0.0980 lbs/MMBtu 100.0 lbs/MMscf 50 ppm performance
50 ppm 0.0365 lbs/MMBtu 37.3 lbs/MMscfAP‐42
112.7 ppm 0.0824 lbs/MMBtu 84.0 lbs/MMscfPM10 = PM2.5 = 2.5 lb/MMscf per current ACDPSO2 = 2.6 lb/MMscf per current ACDPVOC = 5.5 lb/MMscf per current ACDPLead = 0.0005 lb/MMscf per current AP‐42 Table 1.4‐2 * Conversion of lbs/MMBtu to ppm based on NOx conversion factor of 833 and CO conversion factor of 1368** Conversion of MMBtu to MMSCF based on a natural gas higher heating value of 1020 Btu/SCF
Annual Emissions based on % utilization rates30% Operating Capacity Annual Utilization Rate
Table 2 ‐ Boiler Emission RatesEF = 2.5 lb/MMscf EF = 2.5 lb/MMscf EF = 2.6 lb/MMscf EF = 0.0005 lb/MMscf
Emissions Unit Site BuildingEquipment
TypeSystem
EquipmentTags
StackID
Equipment Size
UnitInstall date mm/yy
Unit Emission Factor
lb/MMscf
Hourly emissions lb/hr
Annual Emissions ton/yr
Unit Emission Factor
lb/MMscf
Hourly emissions lb/hr
Annual Emissions ton/yr
Hourly emissions lb/hr
Annual Emissions ton/yr
Hourly emissions lb/hr
Annual Emissions ton/yr
Hourly emissions lb/hr
Annual Emissions ton/yr
Hourly emissions lb/hr
Annual Emissions ton/yr
EU8Ronler Acres
CUB1 Boiler HW F20‐BLR115‐1‐200 D1B115‐1 31,500 MBH Nov‐95 11.0 0.340 0.447 37.3 1.151 1.513 0.0772 0.101 0.077 0.101 0.080 0.106 0.000015 0.000020
EU8Ronler Acres
CUB1 Boiler HW F20‐BLR115‐2‐200 D1B115‐2 31,500 MBH Nov‐95 11.0 0.340 0.447 37.3 1.151 1.513 0.077 0.101 0.077 0.101 0.080 0.106 0.000015 0.000020
EU8Ronler Acres
CUB1 Boiler HW F20‐BLR115‐3‐200 D1B115‐3 31,500 MBH Nov‐95 11.0 0.340 0.447 37.3 1.151 1.513 0.077 0.101 0.077 0.101 0.080 0.106 0.000015 0.000020
EU8Ronler Acres
CUB1 Boiler HW F20‐BLR115‐4‐200 D1B115‐4 30,615 MBH Nov‐13 11.0 0.331 0.435 37.3 1.119 1.470 0.075 0.099 0.075 0.099 0.078 0.103 0.000015 0.000020
CIARonler Acres
RA1 Boiler HW RA1‐MECH‐B01 RA1115‐1 720 MBH Oct‐10 100.0 0.071 0.093 84.0 0.059 0.078 0.002 0.002 0.002 0.002 0.002 0.002 0.000000 0.000000
CIARonler Acres
RA1 Boiler HW RA1‐MECH‐B02 RA1115‐2 1,000 MBH Nov‐95 100.0 0.098 0.129 84.0 0.082 0.108 0.002 0.003 0.002 0.003 0.003 0.003 0.000000 0.000001
EU10Ronler Acres
CUB2 Boiler HW CUB2‐BLR115‐1‐210 D1C115‐1 32,112 MBH May‐98 11.0 0.347 0.456 37.3 1.174 1.542 0.079 0.103 0.079 0.103 0.082 0.108 0.000016 0.000021
EU10Ronler Acres
CUB2 Boiler HW CUB2‐BLR115‐2‐210 D1C115‐2 32,112 MBH May‐98 11.0 0.347 0.456 37.3 1.174 1.542 0.079 0.103 0.079 0.103 0.082 0.108 0.000016 0.000021
EU10Ronler Acres
CUB2 Boiler HW CUB2‐BLR115‐3‐210 D1C115‐3 32,112 MBH May‐98 11.0 0.347 0.456 37.3 1.174 1.542 0.079 0.103 0.079 0.103 0.082 0.108 0.000016 0.000021
EU11aRonler Acres
CUB2 Boiler HW CUB2‐BLR115‐4‐210 D1C115‐4 32,659 MBH May‐00 11.0 0.353 0.464 37.3 1.194 1.568 0.080 0.105 0.080 0.105 0.083 0.109 0.000016 0.000021
EU11Ronler Acres
CUB2 Boiler HW CUB2‐BLR115‐5‐210 D1C115‐5 29,392 MBH July‐12 11.0 0.318 0.417 37.3 1.074 1.412 0.072 0.095 0.072 0.095 0.075 0.098 0.000014 0.000019
CIARonler Acres
RA4 Boiler HW RA4‐BLR152‐2‐30 RA4115‐4 500 MBH Q3 2014 100.0 0.049 0.064 84.0 0.041 0.054 0.001 0.002 0.001 0.002 0.001 0.002 0.0000002 0.000000
CIARonler Acres
RA4 Boiler HW RA4‐BLR152‐1‐30 RA4115‐3 500 MBH Q3 2014 100.0 0.049 0.064 84.0 0.041 0.054 0.001 0.002 0.001 0.002 0.001 0.002 0.0000002 0.000000
CIARonler Acres
RA4 Boiler HW RA4‐BLR117‐2‐30 RA4115‐2 1,999 MBH Q3 2014 100.0 0.196 0.258 84.0 0.165 0.216 0.005 0.006 0.005 0.006 0.005 0.007 0.000001 0.000001
CIARonler Acres
RA4 Boiler HW RA4‐BLR117‐1‐30 RA4115‐1 1,999 MBH Q3 2014 100.0 0.196 0.258 84.0 0.165 0.216 0.005 0.006 0.005 0.006 0.005 0.007 0.000001 0.000001
EU14Ronler Acres
CUB3 Boiler HW BLR‐115‐1‐210 D1D115‐1 8,165 MBH May‐01 61.2 0.490 0.644 37.3 0.298 0.392 0.020 0.026 0.020 0.026 0.021 0.027 0.000004 0.000005
NOx
SO2 LeadNOx CO
CO
PM10 PM2.5Equipment Identification
Emission factors ("EF") are based on EPA's "Compilation of Air Pollutant Emission Factors, Volume I: Stationary Point and Area Sources," also known at AP‐42, Chapter 1, Section 1.4 Natural Gas Combustion, boiler manufacturers information or emission factors established in Intel's current ACDP which are based on Oregon DEQ Emission Factors identified within AQ‐EF05 as provided in Table 1.
1_Boilers12/29/2014 Page 1 of 3

Table 2 ‐ Boiler Emission RatesEF = 2.5 lb/MMscf EF = 2.5 lb/MMscf EF = 2.6 lb/MMscf EF = 0.0005 lb/MMscf
Emissions Unit Site BuildingEquipment
TypeSystem
EquipmentTags
StackID
Equipment Size
UnitInstall date mm/yy
Unit Emission Factor
lb/MMscf
Hourly emissions lb/hr
Annual Emissions ton/yr
Unit Emission Factor
lb/MMscf
Hourly emissions lb/hr
Annual Emissions ton/yr
Hourly emissions lb/hr
Annual Emissions ton/yr
Hourly emissions lb/hr
Annual Emissions ton/yr
Hourly emissions lb/hr
Annual Emissions ton/yr
Hourly emissions lb/hr
Annual Emissions ton/yr
SO2 LeadNOx CO
PM10 PM2.5Equipment Identification
EU15Ronler Acres
CUB3 Boiler HW BLR‐115‐2‐210 D1D115‐2 32,659 MBH May‐01 11.0 0.353 0.464 37.3 1.194 1.568 0.080 0.105 0.080 0.105 0.083 0.109 0.000016 0.000021
EU15Ronler Acres
CUB3 Boiler HW BLR‐115‐3‐210 D1D115‐3 32,659 MBH May‐01 11.0 0.353 0.464 37.3 1.194 1.568 0.080 0.105 0.080 0.105 0.083 0.109 0.000016 0.000021
EU16Ronler Acres
CUB3 Boiler HW BLR‐115‐4‐210 D1D115‐4 32,659 MBH May‐08 11.0 0.353 0.464 37.3 1.194 1.568 0.080 0.105 0.080 0.105 0.083 0.109 0.000016 0.000021
EU17Ronler Acres
CUB3 Boiler HW BLR‐115‐5‐210 D1D115‐5 14,288 MBH May‐09 36.7 0.515 0.676 37.3 0.522 0.686 0.035 0.046 0.035 0.046 0.036 0.048 0.000007 0.000009
EU12Ronler Acres
RP1 Boiler HW RP1‐BLR115‐1‐210 RP115‐1 4,184 MBH Jun‐03 61.2 0.251 0.330 37.3 0.153 0.201 0.010 0.013 0.010 0.013 0.011 0.014 0.000002 0.000003
EU13Ronler Acres
RP1 Boiler HW RP1‐BLR115‐2‐210 RP115‐2 12,247 MBH Jun‐03 61.2 0.735 0.966 37.3 0.448 0.588 0.030 0.039 0.030 0.039 0.031 0.041 0.000006 0.000008
EU13Ronler Acres
RP1 Boiler HW RP1‐BLR115‐3‐210 RP115‐3 12,247 MBH Jun‐03 61.2 0.735 0.966 37.3 0.448 0.588 0.030 0.039 0.030 0.039 0.031 0.041 0.000006 0.000008
EU13Ronler Acres
RP1 Boiler HW RP1‐BLR115‐4‐210 RP115‐4 11,715 MBH Future ‐ TBD 11.0 0.127 0.166 37.3 0.428 0.563 0.029 0.038 0.029 0.038 0.030 0.039 0.000006 0.000008
EU18Ronler Acres
CUB4 Boiler HW CUB4‐BLR115‐1‐10 CUB4115‐1 30,615 MBH Jul‐13 11.0 0.331 0.435 37.3 1.119 1.470 0.075 0.099 0.075 0.099 0.078 0.103 0.000015 0.000020
EU19Ronler Acres
CUB4 Boiler HW CUB4‐BLR115‐2‐10 CUB4115‐2 30,615 MBH Jul‐13 11.0 0.331 0.435 37.3 1.119 1.470 0.075 0.099 0.075 0.099 0.078 0.103 0.000015 0.000020
EU19Ronler Acres
CUB4 Boiler HW CUB4‐BLR115‐3‐10 CUB4115‐3 30,615 MBH Jul‐13 11.0 0.331 0.435 37.3 1.119 1.470 0.075 0.099 0.075 0.099 0.078 0.103 0.000015 0.000020
EU19Ronler Acres
CUB4 Boiler HW CUB4‐BLR115‐4‐10 CUB4115‐4 30,615 MBH Jul‐13 11.0 0.331 0.435 37.3 1.119 1.470 0.075 0.099 0.075 0.099 0.078 0.103 0.000015 0.000020
EU18aRonler Acres
CUB4 Boiler HW CUB4‐BLR115‐5‐10 CUB4115‐5 14,287 MBH 2011 11.0 0.154 0.203 37.3 0.522 0.686 0.035 0.046 0.035 0.046 0.036 0.048 0.000007 0.000009
EU19aRonler Acres
CUB4 Boiler HW CUB4‐BLR115‐6‐10 CUB4115‐6 30,615 MBH 2011 11.0 0.331 0.435 37.3 1.119 1.470 0.075 0.099 0.075 0.099 0.078 0.103 0.000015 0.000020
EU19aRonler Acres
CUB5 Boiler HW RAC5‐BLR115‐1 CUB5115‐7 11,715 MBH Future ‐ TBD 11.0 0.127 0.166 37.3 0.428 0.563 0.029 0.038 0.029 0.038 0.030 0.039 0.000006 0.000008
EU19aRonler Acres
CUB5 Boiler HW RAC5‐BLR115‐2 CUB5115‐8 30,615 MBH Future ‐ TBD 11.0 0.331 0.435 37.3 1.119 1.470 0.075 0.099 0.075 0.099 0.078 0.103 0.000015 0.000020
EU19aRonler Acres
CUB5 Boiler HW RAC5‐BLR115‐3 CUB5115‐9 30,615 MBH Future ‐ TBD 11.0 0.331 0.435 37.3 1.119 1.470 0.075 0.099 0.075 0.099 0.078 0.103 0.000015 0.000020
EU19aRonler Acres
CUB5 Boiler HW RAC5‐BLR115‐4 CUB5115‐10 30,615 MBH Future ‐ TBD 11.0 0.331 0.435 37.3 1.119 1.470 0.075 0.099 0.075 0.099 0.078 0.103 0.000015 0.000020
EU9Ronler Acres
RA2 Boiler HWRA2‐MECH‐HW‐B01 (BLR 115‐1‐300)
RA2115‐1 4,200 MBH Dec‐98 36.7 0.151 0.199 37.3 0.154 0.202 0.010 0.014 0.010 0.014 0.011 0.014 0.000002 0.000003
EU9Ronler Acres
RA2 Boiler HWRA2‐MECH‐HW‐B02 (BLR 115‐2‐300)
RA2115‐2 4,200 MBH Jan‐99 36.7 0.151 0.199 37.3 0.154 0.202 0.010 0.014 0.010 0.014 0.011 0.014 0.000002 0.000003
EU22Ronler Acres
MBR (EOP ‐ end of
Boiler HW MBR‐BLR115‐1 MBR115‐1 6,694 MBH Future ‐ TBD 11.0 0.072 0.095 37.3 0.245 0.321 0.016 0.022 0.016 0.022 0.017 0.022 0.000003 0.000004
EU22Ronler Acres
MBR (EOP ‐ end of
Boiler HW MBR‐BLR115‐2 MBR115‐2 6,694 MBH Future ‐ TBD 11.0 0.072 0.095 37.3 0.245 0.321 0.016 0.022 0.016 0.022 0.017 0.022 0.000003 0.000004
EU22Ronler Acres
MBR2 (EOP ‐ end
Boiler HW MBR2‐BLR115‐1 MBR2‐115‐1 6,694 MBH Future ‐ TBD 11.0 0.072 0.095 37.3 0.245 0.321 0.016 0.022 0.016 0.022 0.017 0.022 0.000003 0.000004
EU22Ronler Acres
MBR2 (EOP ‐ end
Boiler HW MBR2‐BLR115‐2 MBR2‐115‐2 6,694 MBH Future ‐ TBD 11.0 0.072 0.095 37.3 0.245 0.321 0.016 0.022 0.016 0.022 0.017 0.022 0.000003 0.000004
CIARonler Acres
RS4 Boiler HW RS4‐BLR115‐1 RS4115‐1 2,000 MBH Future ‐ TBD 36.7 0.072 0.095 37.3 0.073 0.096 0.005 0.006 0.005 0.006 0.005 0.007 0.000001 0.000001
CIARonler Acres
RS4 Boiler HW RS4‐BLR115‐2 RS4115‐2 2,000 MBH Future ‐ TBD 36.7 0.072 0.095 37.3 0.073 0.096 0.005 0.006 0.005 0.006 0.005 0.007 0.000001 0.000001
CIARonler Acres
RS4 Boiler HW RS4‐BLR115‐3 RS4115‐3 500 MBH Future ‐ TBD 36.7 0.018 0.024 37.3 0.018 0.024 0.001 0.002 0.001 0.002 0.001 0.002 0.000000 0.000000
CIARonler Acres
RS6 Boiler HW RS6‐BLR115‐1 RS6115‐1 2,000 MBH Future ‐ TBD 36.7 0.072 0.095 37.3 0.073 0.096 0.005 0.006 0.005 0.006 0.005 0.007 0.000001 0.000001
CIARonler Acres
RS6 Boiler HW RS6‐BLR115‐2 RS6115‐2 2,000 MBH Future ‐ TBD 36.7 0.072 0.095 37.3 0.073 0.096 0.005 0.006 0.005 0.006 0.005 0.007 0.000001 0.000001
CIARonler Acres
RS6 Boiler HW RS6‐BLR115‐3 RS6115‐3 500 MBH Future ‐ TBD 36.7 0.018 0.024 37.3 0.018 0.024 0.001 0.002 0.001 0.002 0.001 0.002 0.000000 0.000000
EU11Ronler Acres
CUB2 Boiler HW CUB2‐BLR115‐6‐210 D1C115‐6 29,392 MBH Future ‐ TBD 11.0 0.318 0.417 37.3 1.074 1.412 0.072 0.095 0.072 0.095 0.075 0.098 0.000014 0.000019
CIARonler Acres
RA5 Boiler hw RA5‐BLR115‐1 RA5115‐1 1,999 MBH Future ‐ TBD 100.0 0.196 0.258 84.0 0.165 0.216 0.005 0.006 0.005 0.006 0.005 0.007 0.000001 0.000001
CIARonler Acres
RA6 Boiler hw RA6‐BLR115‐1 RA6115‐1 1,999 MBH Future ‐ TBD 100.0 0.196 0.258 84.0 0.165 0.216 0.005 0.006 0.005 0.006 0.005 0.007 0.000001 0.000001
1_Boilers12/29/2014 Page 2 of 3
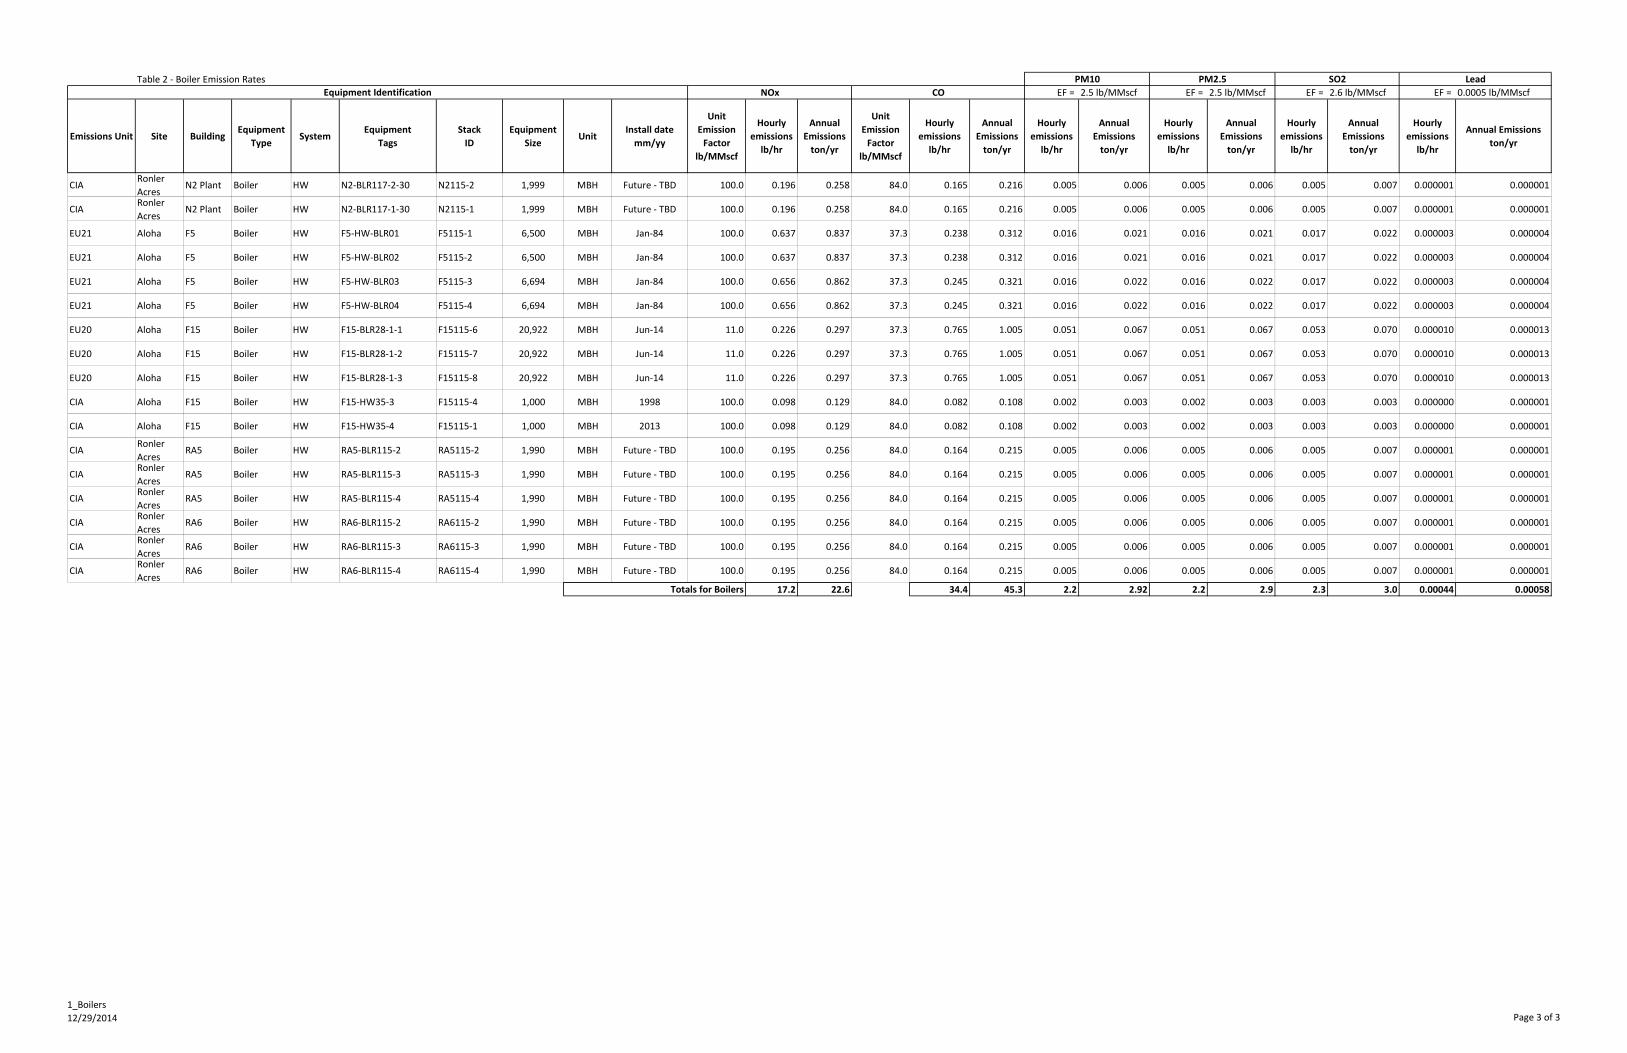
Table 2 ‐ Boiler Emission RatesEF = 2.5 lb/MMscf EF = 2.5 lb/MMscf EF = 2.6 lb/MMscf EF = 0.0005 lb/MMscf
Emissions Unit Site BuildingEquipment
TypeSystem
EquipmentTags
StackID
Equipment Size
UnitInstall date mm/yy
Unit Emission Factor
lb/MMscf
Hourly emissions lb/hr
Annual Emissions ton/yr
Unit Emission Factor
lb/MMscf
Hourly emissions lb/hr
Annual Emissions ton/yr
Hourly emissions lb/hr
Annual Emissions ton/yr
Hourly emissions lb/hr
Annual Emissions ton/yr
Hourly emissions lb/hr
Annual Emissions ton/yr
Hourly emissions lb/hr
Annual Emissions ton/yr
SO2 LeadNOx CO
PM10 PM2.5Equipment Identification
CIARonler Acres
N2 Plant Boiler HW N2‐BLR117‐2‐30 N2115‐2 1,999 MBH Future ‐ TBD 100.0 0.196 0.258 84.0 0.165 0.216 0.005 0.006 0.005 0.006 0.005 0.007 0.000001 0.000001
CIARonler Acres
N2 Plant Boiler HW N2‐BLR117‐1‐30 N2115‐1 1,999 MBH Future ‐ TBD 100.0 0.196 0.258 84.0 0.165 0.216 0.005 0.006 0.005 0.006 0.005 0.007 0.000001 0.000001
EU21 Aloha F5 Boiler HW F5‐HW‐BLR01 F5115‐1 6,500 MBH Jan‐84 100.0 0.637 0.837 37.3 0.238 0.312 0.016 0.021 0.016 0.021 0.017 0.022 0.000003 0.000004
EU21 Aloha F5 Boiler HW F5‐HW‐BLR02 F5115‐2 6,500 MBH Jan‐84 100.0 0.637 0.837 37.3 0.238 0.312 0.016 0.021 0.016 0.021 0.017 0.022 0.000003 0.000004
EU21 Aloha F5 Boiler HW F5‐HW‐BLR03 F5115‐3 6,694 MBH Jan‐84 100.0 0.656 0.862 37.3 0.245 0.321 0.016 0.022 0.016 0.022 0.017 0.022 0.000003 0.000004
EU21 Aloha F5 Boiler HW F5‐HW‐BLR04 F5115‐4 6,694 MBH Jan‐84 100.0 0.656 0.862 37.3 0.245 0.321 0.016 0.022 0.016 0.022 0.017 0.022 0.000003 0.000004
EU20 Aloha F15 Boiler HW F15‐BLR28‐1‐1 F15115‐6 20,922 MBH Jun‐14 11.0 0.226 0.297 37.3 0.765 1.005 0.051 0.067 0.051 0.067 0.053 0.070 0.000010 0.000013
EU20 Aloha F15 Boiler HW F15‐BLR28‐1‐2 F15115‐7 20,922 MBH Jun‐14 11.0 0.226 0.297 37.3 0.765 1.005 0.051 0.067 0.051 0.067 0.053 0.070 0.000010 0.000013
EU20 Aloha F15 Boiler HW F15‐BLR28‐1‐3 F15115‐8 20,922 MBH Jun‐14 11.0 0.226 0.297 37.3 0.765 1.005 0.051 0.067 0.051 0.067 0.053 0.070 0.000010 0.000013
CIA Aloha F15 Boiler HW F15‐HW35‐3 F15115‐4 1,000 MBH 1998 100.0 0.098 0.129 84.0 0.082 0.108 0.002 0.003 0.002 0.003 0.003 0.003 0.000000 0.000001
CIA Aloha F15 Boiler HW F15‐HW35‐4 F15115‐1 1,000 MBH 2013 100.0 0.098 0.129 84.0 0.082 0.108 0.002 0.003 0.002 0.003 0.003 0.003 0.000000 0.000001
CIARonler Acres
RA5 Boiler HW RA5‐BLR115‐2 RA5115‐2 1,990 MBH Future ‐ TBD 100.0 0.195 0.256 84.0 0.164 0.215 0.005 0.006 0.005 0.006 0.005 0.007 0.000001 0.000001
CIARonler Acres
RA5 Boiler HW RA5‐BLR115‐3 RA5115‐3 1,990 MBH Future ‐ TBD 100.0 0.195 0.256 84.0 0.164 0.215 0.005 0.006 0.005 0.006 0.005 0.007 0.000001 0.000001
CIARonler Acres
RA5 Boiler HW RA5‐BLR115‐4 RA5115‐4 1,990 MBH Future ‐ TBD 100.0 0.195 0.256 84.0 0.164 0.215 0.005 0.006 0.005 0.006 0.005 0.007 0.000001 0.000001
CIARonler Acres
RA6 Boiler HW RA6‐BLR115‐2 RA6115‐2 1,990 MBH Future ‐ TBD 100.0 0.195 0.256 84.0 0.164 0.215 0.005 0.006 0.005 0.006 0.005 0.007 0.000001 0.000001
CIARonler Acres
RA6 Boiler HW RA6‐BLR115‐3 RA6115‐3 1,990 MBH Future ‐ TBD 100.0 0.195 0.256 84.0 0.164 0.215 0.005 0.006 0.005 0.006 0.005 0.007 0.000001 0.000001
CIARonler Acres
RA6 Boiler HW RA6‐BLR115‐4 RA6115‐4 1,990 MBH Future ‐ TBD 100.0 0.195 0.256 84.0 0.164 0.215 0.005 0.006 0.005 0.006 0.005 0.007 0.000001 0.000001
17.2 22.6 34.4 45.3 2.2 2.92 2.2 2.9 2.3 3.0 0.00044 0.00058Totals for Boilers
1_Boilers12/29/2014 Page 3 of 3

This page intentionally left blank.

RCTOs
Table 3 ‐
Building AllocationTable 1 ‐ RCTO Emission Factors Table 2 ‐ Process PM‐10 & PM‐2.5 (tpy) PMCO RCTO specific. See data table below. Total to RCTO RB1 0NOx 100 lb/MMscf per AP‐42 10.4 D1B 50%PM10 2.5 lb/MMscf per current ACDP 10.7 D1C 50%SOX 2.6 lb/MMscf per current ACDP 1.91 D1D 25%PM2.5 2.5 lb/MMscf per current ACDP D1X 25%Lead 0.0005 lb/MMscf per AP‐42 Table 1.4‐2Assume 1 40K and 4 90K units in each mod
Annual Emissions based on % utilization rates70% Burner Max Fire Capacity for new 40 and 90K units100% Burner Max Fire Capacity for D1B and D1C units.
Table 4 ‐ RCTO Emission Rates
EF= 2.5 lb/MMscf EF= 2.5 lb/MMscf EF= 2.6 lb/MMscf EF= 0.0005 lb/MMscf
Emissions Unit
Site BuildingEquipment
TypeSystem
EquipmentTags
Install DateStackID
Burner Capacity
MMBTU/hr
Unit Emission Factor
lb/MMscf
Hourly emissions lbs/hr
Annual Emissions tons/yr
Unit Emission Factor
lb/MMscf
Hourly emissions lbs/hr
Annual Emissions tons/yr
Hourly emissions lbs/hr
Annual Emissions tons/yr
Hourly emissions lbs/hr
Annual Emissions tons/yr
Hourly emissions lbs/hr
Annual Emissions tons/yr
Hourly emissions lbs/hr
Annual Emissions tons/yr
Hourly emissions lbs/hr
Annual Emissions tons/yr
Hourly emissions lbs/hr
Annual Emissions tons/yr
Hourly emissions lbs/hr
Annual Emissions tons/yr
Hourly emissions lbs/hr
Annual Emissions tons/yr
EU1Ronler Acres
D1B Abatement EXVO F20‐VOC138‐1‐100 Jul‐13 D1B138‐3: 2.00 100 0.20 0.86 50 0.10 0.43 0.0049 0.021 0.0049 0.021 0.0051 0.022 1.19 5.19 1.19 5.19 1.19 5.21 1.19 5.21 0.0000010 0.0000043
EU1Ronler Acres
D1B Abatement EXVO F20‐VOC138‐2‐100 Jul‐13 D1B138‐4: 2.00 100 0.20 0.86 50 0.10 0.43 0.0049 0.021 0.0049 0.021 0.0051 0.022 0.0049 0.021 0.005 0.021 0.0000010 0.0000043
EU1Ronler Acres
D1B Abatement EXVO F20‐VOC138‐3‐100 Future ‐ TBD D1B138‐7: 2.00 100 0.20 0.86 50 0.10 0.43 0.0049 0.021 0.0049 0.021 0.0051 0.022 0.0049 0.021 0.005 0.021 0.0000010 0.0000043
EU1Ronler Acres
D1B Abatement EXVO F20‐VOC138‐4‐100 Future ‐ TBD D1B138‐8: 2.00 100 0.20 0.86 50 0.10 0.43 0.0049 0.021 0.0049 0.021 0.0051 0.022 0.0049 0.021 0.005 0.021 0.0000010 0.0000043
EU1Ronler Acres
D1C Abatement EXVO D1C‐VOC138‐1‐120 Jun‐01 D1C138‐3 2.00 100 0.20 0.86 772.6 1.51 6.64 0.0049 0.021 0.0049 0.021 0.0051 0.022 1.19 5.19 1.19 5.19 1.19 5.21 1.19 5.21 0.0000010 0.0000043
EU1Ronler Acres
D1C Abatement EXVO D1C‐VOC138‐2‐120 Jun‐01 D1C138‐4 2.00 100 0.20 0.86 772.6 1.51 6.64 0.0049 0.021 0.0049 0.021 0.0051 0.022 0.0049 0.021 0.005 0.021 0.0000010 0.0000043
EU1Ronler Acres
D1C Abatement EXVO D1C‐VOC138‐3‐120 Jun‐01D1C138‐5 (RCTO#3/oxidizer)
2.00 100 0.20 0.86 772.6 1.51 6.64 0.0049 0.021 0.0049 0.021 0.0051 0.022 0.0049 0.021 0.005 0.021 0.0000010 0.0000043
EU1Ronler Acres
D1C Abatement EXVO D1C‐VOC138‐4‐120 Future ‐ TBDD1C138‐6 (RCTO#4/oxidizer)
2.00 100 0.20 0.86 50 0.10 0.43 0.0049 0.021 0.0049 0.021 0.0051 0.022 0.0049 0.021 0.005 0.021 0.0000010 0.0000043
EU1Ronler Acres
D1C Abatement EXVO D1C‐VOC138‐5‐120 Future ‐ TBDD1C138‐7 (RCTO#5/oxidizer)
2.00 100 0.20 0.86 50 0.10 0.43 0.0049 0.021 0.0049 0.021 0.0051 0.022 0.0049 0.021 0.005 0.021 0.0000010 0.0000043
EU3
Ronler Acres
D1D Abatement EXVO VOC‐138‐1‐120 Feb‐02D1D138‐6 (VOC Combustion exhaust)
2.00100 0.20 0.60 572.7 1.12 3.44 0.0049 0.015 0.0049 0.015 0.0051 0.016 0.61 2.68 0.61 2.68 0.62 2.70 0.62 2.70 0.0000010 0.0000030
EU3
Ronler Acres
D1D Abatement EXVO VOC‐138‐2‐120 Mar‐02D1D138‐7 (VOC Combustion exhaust)
2.00100 0.20 0.60 572.7 1.12 3.44 0.0049 0.015 0.0049 0.015 0.0051 0.016 0.0049 0.015 0.005 0.015 0.0000010 0.0000030
EU3
Ronler Acres
D1D Abatement EXVO VOC‐138‐3‐120 Feb‐04D1D138‐8 (VOC Combustion exhaust)
2.00100 0.20 0.60 572.7 1.12 3.44 0.0049 0.015 0.0049 0.015 0.0051 0.016 0.0049 0.015 0.005 0.015 0.0000010 0.0000030
EU3
Ronler Acres
D1D Abatement EXVO VOC‐138‐4‐120 Feb‐04D1D138‐9 (VOC Combustion exhaust)
2.00100 0.20 0.60 572.7 1.12 3.44 0.0049 0.015 0.0049 0.015 0.0051 0.016 0.0049 0.015 0.005 0.015 0.0000010 0.0000030
EU3
Ronler Acres
D1D Abatement EXVO VOC‐138‐5‐120 Future ‐ TBDD1D138‐11 (VOC Combustion exhaust)
2.00100 0.20 0.60 572.7 1.12 3.44 0.0049 0.015 0.0049 0.015 0.0051 0.016 0.0049 0.015 0.005 0.015 0.0000010 0.0000030
EU4
Ronler Acres
D1X Abatement EXVO D1X‐VOC138‐1‐20 May‐12D1X138‐5 (VOC combustion exhaust)
3.50100 0.34 1.05 50 0.17 0.53 0.0086 0.026 0.0086 0.026 0.0089 0.027 0.61 2.68 0.61 2.68 0.62 2.71 0.62 2.71 0.0000017 0.0000053
EU4
Ronler Acres
D1X Abatement EXVO D1X‐VOC138‐2‐20 May‐12D1X138‐6 (VOC combustion exhaust)
3.50100 0.34 1.05 50 0.17 0.53 0.0086 0.026 0.0086 0.026 0.0089 0.027 0.0086 0.026 0.009 0.026 0.0000017 0.0000053
EU4
Ronler Acres
D1X Abatement EXVO D1X‐VOC138‐3‐20 Sep‐13D1X138‐7 (VOC combustion exhaust)
3.50100 0.34 1.05 50 0.17 0.53 0.0086 0.026 0.0086 0.026 0.0089 0.027 0.0086 0.026 0.009 0.026 0.0000017 0.0000053
EU4
Ronler Acres
D1X Abatement EXVOD1X‐VOC138‐4‐20
Apr‐14D1X138‐8 (VOC combustion exhaust)
0.00100 0 0 50 0 0 0 0 0 0 0 0 0 0 0 0 0 0
EU4
Ronler Acres
D1X Abatement EXVO D1XM2‐VOC138‐1‐20 Sep‐14D1XM2138‐5 (VOC combustion exhaust)
3.50100 0.34 1.05 50 0.17 0.53 0.0086 0.026 0.0086 0.026 0.0089 0.027 0.61 2.68 0.61 2.68 0.62 2.71 0.62 2.71 0.0000017 0.0000053
EU4
Ronler Acres
D1X Abatement EXVO D1XM2‐VOC138‐2‐20 Sep‐14D1XM2138‐6 (VOC combustion exhaust)
3.50100 0.34 1.05 50 0.17 0.53 0.0086 0.026 0.0086 0.026 0.0089 0.027 0.0086 0.026 0.009 0.026 0.0000017 0.0000053
EU4
Ronler Acres
D1X Abatement EXVO D1XM2‐VOC138‐3‐20 Sep‐14D1XM2138‐7 (VOC combustion exhaust)
3.50100 0.34 1.05 50 0.17 0.53 0.0086 0.026 0.0086 0.026 0.0089 0.027 0.0086 0.026 0.009 0.026 0.0000017 0.0000053
EU4
Ronler Acres
D1X Abatement EXVO D1XM2‐VOC138‐4‐20 Future ‐ TBDD1XM2138‐8 (VOC combustion exhaust)
3.50100 0.34 1.05 50 0.17 0.53 0.0086 0.026 0.0086 0.026 0.0089 0.027 0.0086 0.026 0.009 0.026 0.0000017 0.0000053
EU4Ronler Acres
D1X Abatement EXVO Anguil RCTO D1X‐1 Future ‐ TBD D1X138‐13 8.00 100 0.78 2.40 50 0.39 1.20 0.0196 0.060 0.0196 0.060 0.0204 0.063 0.020 0.060 0.020 0.060 0.0000039 0.0000120
Equipment Identification PM10 ‐ Totals PM 2.5 ‐ TotalsNOx CO PM 10 ‐ Process PM 2.5‐ Process
Building GroupsD1C/D1B/RB1D1D/XFab 15
LeadPM10 combustion PM2.5 combustion SO2 combustion
Emission factors ("EF") are based on EPA's "Compilation of Air Pollutant Emission Factors, Volume I: Stationary Point and Area Sources," also known at AP‐42, Chapter 1, Section 1.4 Natural Gas Combustion engineering test data or emission factors established in Intel's current ACDP as provided in Table 1 & 4. Process related emissions that are emitted through oxidizer stacks are based on previously approved DEQ emission factors. Totals are provided in Table 3 and building allocation to account for future conditions is provided in Table 4. Process related PM‐10 and PM‐2.5 are allocated to a single representative stack for that buildings exhaust system resulting in blank cells in the tabulation below.
2_ RCTOs ‐ Combustion12/29/2014 Page 1 of 2

Table 4 ‐ RCTO Emission Rates
EF= 2.5 lb/MMscf EF= 2.5 lb/MMscf EF= 2.6 lb/MMscf EF= 0.0005 lb/MMscf
Emissions Unit
Site BuildingEquipment
TypeSystem
EquipmentTags
Install DateStackID
Burner Capacity
MMBTU/hr
Unit Emission Factor
lb/MMscf
Hourly emissions lbs/hr
Annual Emissions tons/yr
Unit Emission Factor
lb/MMscf
Hourly emissions lbs/hr
Annual Emissions tons/yr
Hourly emissions lbs/hr
Annual Emissions tons/yr
Hourly emissions lbs/hr
Annual Emissions tons/yr
Hourly emissions lbs/hr
Annual Emissions tons/yr
Hourly emissions lbs/hr
Annual Emissions tons/yr
Hourly emissions lbs/hr
Annual Emissions tons/yr
Hourly emissions lbs/hr
Annual Emissions tons/yr
Hourly emissions lbs/hr
Annual Emissions tons/yr
Hourly emissions lbs/hr
Annual Emissions tons/yr
Equipment Identification PM10 ‐ Totals PM 2.5 ‐ TotalsNOx CO PM 10 ‐ Process PM 2.5‐ Process
LeadPM10 combustion PM2.5 combustion SO2 combustion
EU4Ronler Acres
D1X Abatement EXVO Anguil RCTO D1X‐2 Future ‐ TBD D1X138‐14 8.00 100 0.78 2.40 50 0.39 1.20 0.0196 0.060 0.0196 0.060 0.0204 0.063 0.020 0.060 0.020 0.060 0.0000039 0.0000120
EU4Ronler Acres
D1X Abatement EXVO Anguil RCTO D1X‐3 Future ‐ TBD D1X138‐15 8.00 100 0.78 2.40 50 0.39 1.20 0.0196 0.060 0.0196 0.060 0.0204 0.063 0.020 0.060 0.020 0.060 0.0000039 0.0000120
EU4Ronler Acres
D1XBack‐upAbatement
EXVO Anguil RCTO D1X‐4 Future ‐ TBD D1X138‐16 0.00 100 0 0 50 0 0 0 0 0 0 0 0 0 0 0 0 0 0
EU4Ronler Acres
D1X Abatement EXVO Anguil RCTO D1XM2‐1 Future ‐ TBD D1XM2138‐13 8.00 100 0.78 2.40 50 0.39 1.20 0.0196 0.060 0.0196 0.060 0.0204 0.063 0.020 0.060 0.020 0.060 0.0000039 0.0000120
EU4Ronler Acres
D1X Abatement EXVO Anguil RCTO D1XM2‐2 Future ‐ TBD D1XM2138‐14 8.00 100 0.78 2.40 50 0.39 1.20 0.0196 0.060 0.0196 0.060 0.0204 0.063 0.020 0.060 0.020 0.060 0.0000039 0.0000120
EU4Ronler Acres
D1X Abatement EXVO Anguil RCTO D1XM2‐3 Future ‐ TBD D1XM2138‐15 8.00 100 0.78 2.40 50 0.39 1.20 0.0196 0.060 0.0196 0.060 0.0204 0.063 0.020 0.060 0.020 0.060 0.0000039 0.0000120
EU4Ronler Acres
D1X Abatement EXVO Anguil RCTO D1XM2‐4 Future ‐ TBD D1XM2138‐16 8.00 100 0.78 2.40 50 0.39 1.20 0.0196 0.060 0.0196 0.060 0.0204 0.063 0.020 0.060 0.020 0.060 0.0000039 0.0000120
EU4Ronler Acres
D1X Abatement EXVO Anguil RCTO D1XM2‐5 Future ‐ TBD D1XM2138‐17 8.00 100 0.78 2.40 50 0.39 1.20 0.0196 0.060 0.0196 0.060 0.0204 0.063 0.020 0.060 0.020 0.060 0.0000039 0.0000120
EU4Ronler Acres
D1X Abatement EXVO Anguil RCTO D1XM3‐1 Future ‐ TBD D1XM3138‐13 8.00 100 0.78 2.40 50 0.39 1.20 0.0196 0.060 0.0196 0.060 0.0204 0.063 0.61 2.68 0.61 2.68 0.632 2.741 0.632 2.74 0.0000039 0.0000120
EU4Ronler Acres
D1X Abatement EXVO Anguil RCTO D1XM3‐2 Future ‐ TBD D1XM3138‐14 8.00 100 0.78 2.40 50 0.39 1.20 0.0196 0.060 0.0196 0.060 0.0204 0.063 0.020 0.060 0.020 0.060 0.0000039 0.0000120
EU4Ronler Acres
D1X Abatement EXVO Anguil RCTO D1XM3‐3 Future ‐ TBD D1XM3138‐15 8.00 100 0.78 2.40 50 0.39 1.20 0.0196 0.060 0.0196 0.060 0.0204 0.063 0.020 0.060 0.020 0.060 0.0000039 0.0000120
EU4Ronler Acres
D1X Abatement EXVO Anguil RCTO D1XM3‐4 Future ‐ TBD D1XM3138‐16 8.00 100 0.78 2.40 50 0.39 1.20 0.0196 0.060 0.0196 0.060 0.0204 0.063 0.020 0.060 0.020 0.060 0.0000039 0.0000120
EU4Ronler Acres
D1X Abatement EXVO Anguil RCTO D1XM3‐5 Future ‐ TBD D1XM3138‐17 8.00 100 0.78 2.40 50 0.39 1.20 0.0196 0.060 0.0196 0.060 0.0204 0.063 0.020 0.060 0.020 0.060 0.0000039 0.0000120EU5 Aloha F15 Abatement EXVO F15‐AU138‐2‐10 Jan‐08 F15138‐3 2.00 100 0.20 0.60 950.5 1.86 5.71 0.0049 0.015 0.0049 0.015 0.0051 0.016 0.44 1.91 0.44 1.91 0.44 1.93 0.44 1.93 0.0000010 0.0000030
EU5 Aloha F15 Abatement EXVOF15‐VOC138‐3
Future ‐ TBD F15138‐5 2.00 100 0.20 0.60 950.5 1.86 5.71 0.0049 0.015 0.0049 0.015 0.0051 0.016 0.005 0.015 0.0049 0.015 0.0000010 0.0000030EU5 Aloha AL3 Abatement EXVO AL3‐AU‐138‐10 Future ‐ TBD AL3‐138‐3 2.00 100 0.20 0.60 50 0.10 0.30 0.0049 0.015 0.0049 0.015 0.0051 0.016 0 0 0 0 0.005 0.015 0.0049 0.015 0.0000010 0.0000030
EU5 Aloha F15 Abatement EXVOF15‐AU138‐1‐10
Jan‐03 F15138‐2 2.00 100 0.20 0.60 950.5 1.86 5.71 0.0049 0.015 0.0049 0.015 0.0051 0.016 0 0 0 0 0.005 0.015 0.0049 0.015 0.0000010 0.000003016.13 51.77 22.74 76.45 0.40 1.29 0.40 1.29 0.42 1.35 5.26 23.02 5.26 23.02 5.66 24.32 5.66 24.32 0.000081 0.00026Totals for RCTOs
2_ RCTOs ‐ Combustion12/29/2014 Page 2 of 2

BSSW
Burner Natural Gas Consumption at Capacity 500 cf/hrAnnual Utilization 100%
BSSW Emission Factors
Hourly Emissions (lb/hr)
Annual Emission (ton/yr)
CO 84 lb/MMscf per AP‐42 0.042 0.18NOx 100 lb/MMscf per AP‐42 0.050 0.22PM 2.5 lb/MMscf per current ACDP 0.0013 0.0055PM2.5 2.5 lb/MMscf per current ACDP 0.0013 0.0055SO2 2.6 lb/MMscf per current ACDP 0.0013 0.0057Lead 0.0005 lb/MMscf per AP‐42 Table 1.4‐2 0.00000025 0.0000011
Emissions Unit Site BuildingEquipment
TypeSystem
EquipmentTags
StackID
Hourly emissions lbs/hr
Annual Emissions tons/yr
Hourly emissions lbs/hr
Annual Emissions tons/yr
Hourly emissions lbs/hr
Annual Emissions tons/yr
Hourly emissions lbs/hr
Annual Emissions tons/yr
Hourly emissions lbs/hr
Annual Emissions tons/yr
Hourly emissions lbs/hr
Annual Emissions tons/yr
EU1 Ronler Acres D1C Abatement EXVO D1C‐VOC138‐1‐120 D1C138‐1 0.014 0.061 0.017 0.073 0.00042 0.0018 0.00042 0.0018 0.00043 0.0019 0.000000083 0.00000037
EU1 Ronler Acres D1C Abatement EXVO D1C‐VOC138‐1‐120 D1C138‐2 0.014 0.061 0.017 0.073 0.00042 0.0018 0.00042 0.0018 0.00043 0.0019 0.000000083 0.00000037
EU1 Ronler Acres D1C Abatement EXVO D1C‐VOC138‐1‐120 D1C138‐8 0.014 0.061 0.017 0.073 0.00042 0.0018 0.00042 0.0018 0.00043 0.0019 0.000000083 0.00000037
0.042 0.18 0.050 0.22 0.0013 0.0055 0.0013 0.0055 0.0013 0.0057 0.00000025 0.0000011
LeadPM2.5 SO2Equipment Identification
Totals for BSSW
CO NOx PM10
Emission factors ("EF") are based on EPA's "Compilation of Air Pollutant Emission Factors, Volume I: Stationary Point and Area Sources," also known at AP‐42, Chapter 1, Section 1.4 Natural Gas Combustion or emission factors established in Intel's current ACDP as provided below. There is one BSSW thermal oxidizer which exhausts to a D1C RCTO. The RCTO has three stacks.
3_BSSW12/29/2014 Page 1 of 1

This page intentionally left blank.

Emergency Generators and Fire Water Pumps
s1 = % sulfur in fuel oils1 0.0015 per NSPS for new generatorsAnnual emissions based on:
30 hr/year egens Particulate Matter Emission Rates50 hr/year fire pumps Small Engines (<450 KW) Emission Factor 0.31 lbs/MMBtu AP‐42 Section 3.3
Emergency Generator and Fire Water Pump Emission Rates Large Engines (>450 KW) Emission Factor 0.1 lbs/MMBtu AP‐42 Section 3.4
Emissions Unit
Site BuildingEquipment
TypeEquipment
TagsStackID
Equipment Size
Unit BHpInstall date mm/yy
Manufacturer Emission Factor
UnitsHourly
emissions (lb/hr)
Ap‐42 Data‐EF (lb/Hp‐hr)
Annual Emissions (lb/yr)
Annual Emissions
(tpy)
Manufacturer Emission Factor
UnitsHourly
emissions (lb/hr)
Ap‐42 Data‐EF (lb/Hp‐hr)
Annual Emissions (lb/yr)
Annual Emissions
(tpy)
Manufacturer Emission Factor
UnitsHourly
emissions (lb/hr)
Annual Emissions (lb/yr)
Annual Emissions
(tpy)
Manufacturer Emission Factor
UnitsHourly
emissions (lb/hr)
Annual Emissions (lb/yr)
Annual Emissions
(tpy)
Ap‐42 Data‐EF (lb/Hp‐
hr)
Hourly emissions (lb/hr)
Annual Emissions (lb/yr)
Annual Emissions
(tpy)
CIA Ronler Acres RA1 Generator RA1‐ELEC‐CPS‐GEN01 RA1‐605‐1 1500 KW 2155 Apr‐9628.2 lb/hr 28.2 0.024 844.8 0.42 12.9 lb/hr 12.9 0.0055 387.9 0.19 1.28 lb/hr 1.28 38.4 0.019 1.28 lb/hr 1.28 38.4 0.019 0.000012 0.026 0.78 0.00039
CIA Ronler Acres RA1 Generator RA1‐ELEC‐CPS‐GEN02 RA1‐605‐2 1500 KW 2155 Apr‐9628.2 lb/hr 28.2 0.024 844.8 0.42 12.9 lb/hr 12.9 0.0055 387.9 0.19 1.28 lb/hr 1.28 38.4 0.019 1.28 lb/hr 1.28 38.4 0.019 0.000012 0.026 0.78 0.00039
CIA Ronler Acres RA1 Generator RA1‐ELEC‐CPS‐GEN03 RA1‐605‐3 1500 KW 2155 Apr‐9628.2 lb/hr 28.2 0.024 844.8 0.42 12.9 lb/hr 12.9 0.0055 387.9 0.19 1.28 lb/hr 1.28 38.4 0.019 1.28 lb/hr 1.28 38.4 0.019 0.000012 0.026 0.78 0.00039
CIA Ronler Acres RA1 Generator RA1‐ELEC‐CPS‐GEN04 RA1‐605‐4 1500 KW 2155 Apr‐9628.2 lb/hr 28.2 0.024 844.8 0.42 12.9 lb/hr 12.9 0.0055 387.9 0.19 1.28 lb/hr 1.28 38.4 0.019 1.28 lb/hr 1.28 38.4 0.019 0.000012 0.026 0.78 0.00039
CIA Ronler Acres D1C Generator D1C‐CPS‐GEN01 D1C‐605‐1 1252 KW 1764 Jun‐9839.4 lb/hr 39.4 0.024 1183.2 0.59 10.8 lb/hr 10.8 0.0055 325.2 0.16 1.6 lb/hr 1.60 48.0 0.024 1.60 lb/hr 1.60 48.0 0.024 0.000012 0.021 0.64 0.00032
CIA Ronler Acres D1C Generator D1C‐CPS‐GEN02 D1C‐605‐2 1252 KW 1764 Jun‐9839.4 lb/hr 39.4 0.024 1183.2 0.59 10.8 lb/hr 10.8 0.0055 325.2 0.16 1.6 lb/hr 1.60 48.0 0.024 1.60 lb/hr 1.60 48.0 0.024 0.000012 0.021 0.64 0.00032
CIA Ronler Acres D1C Generator D1C‐CPS‐GEN03 D1C‐605‐3 1252 KW 1764 Jun‐9839.4 lb/hr 39.4 0.024 1183.2 0.59 10.8 lb/hr 10.8 0.0055 325.2 0.16 1.6 lb/hr 1.60 48.0 0.024 1.60 lb/hr 1.60 48.0 0.024 0.000012 0.021 0.64 0.00032
CIA Ronler Acres D1C Generator D1C‐EPS‐GEN01 D1C‐604‐1 1600 KW 2561 Jun‐985.6 g/KW‐hr 23.4 0.024 701.3 0.35 0.8 g/KW‐hr 3.3 0.0055 98.6 0.049 0.19 g/KW‐hr 0.80 24.0 0.012 0.19 g/KW‐hr 0.80 24.0 0.012 0.000012 0.031 0.93 0.00047
CIA Ronler Acres D1C Generator D1C‐EPS‐GEN02 D1C‐604‐2 1600 KW 2561 Jun‐985.6 g/KW‐hr 23.4 0.024 701.3 0.35 0.8 g/KW‐hr 3.3 0.0055 98.6 0.049 0.19 g/KW‐hr 0.80 24.0 0.012 0.19 g/KW‐hr 0.80 24.0 0.012 0.000012 0.031 0.93 0.00047
CIA Ronler Acres RB1 Generator RB1‐EPS‐GEN01 RB1‐604‐1 2000 KW 2876 Jun‐9811.2 g/Hp‐hr 71.0 0.024 2130.4 1.07 0.8 g/Hp‐hr 4.9 0.0055 146.5 0.073 0.627 lb/hr 0.63 18.8 0.009 0.63 lb/hr 0.63 18.8 0.0094 0.000012 0.035 1.05 0.00052
CIA Ronler Acres RP1 Generator RP1‐EPS‐GEN01 RP1‐604‐1 2000 KW 2848 Jun‐0038.8 lb/hr 38.8 0.024 1164.9 0.58 6.9 lb/hr 6.9 0.0055 208.2 0.10 1.1 lb/hr 1.10 33.0 0.017 1.10 lb/hr 1.10 33.0 0.017 0.000012 0.035 1.04 0.00052
CIA Ronler Acres RP1 Generator RP1‐GEN‐2 RP1‐604‐2 2000 KW 2848 Future ‐ TBD37.0 0.013 1110.7 0.56 15.7 0.0055 469.9 0.23 0.4 lb/hr 0.40 12.0 0.006 0.40 lb/hr 0.40 12.0 0.006 0.000012 0.035 1.04 0.00052
CIA Ronler Acres D1D EGEN Generator EPS‐GEN01 D1D‐604‐1 2000 KW 2885 Jun‐0235.8 lb/hr 35.8 0.024 1072.5 0.54 5.3 lb/hr 5.3 0.0055 159.3 0.080 1.1 lb/hr 1.10 33.0 0.017 1.10 lb/hr 1.10 33.0 0.017 0.000012 0.035 1.05 0.00053
CIA Ronler Acres D1D EGEN Generator EPS‐GEN02 D1D‐604‐2 2000 KW 2885 Jun‐0235.8 lb/hr 35.8 0.024 1072.5 0.54 5.3 lb/hr 5.3 0.0055 159.3 0.080 1.1 lb/hr 1.10 33.0 0.017 1.10 lb/hr 1.10 33.0 0.017 0.000012 0.035 1.05 0.00053
CIA Ronler Acres D1D EGEN Generator EPS‐GEN03 D1D‐604‐3 2000 KW 2885 Jun‐0235.8 lb/hr 35.8 0.024 1072.5 0.54 5.3 lb/hr 5.3 0.0055 159.3 0.080 1.1 lb/hr 1.10 33.0 0.017 1.10 lb/hr 1.10 33.0 0.017 0.000012 0.035 1.05 0.00053
CIA Ronler Acres D1D EGEN Generator EPS‐GEN04 D1D‐604‐4 2000 KW 2885 Jun‐0235.8 lb/hr 35.8 0.024 1072.5 0.54 5.3 lb/hr 5.3 0.0055 159.3 0.080 1.1 lb/hr 1.10 33.0 0.017 1.10 lb/hr 1.10 33.0 0.017 0.000012 0.035 1.05 0.00053
CIA Ronler Acres D1D EGEN Generator EPS‐GEN05 D1D‐604‐5 2000 KW 2885 Jun‐0235.8 lb/hr 35.8 0.024 1072.5 0.54 5.3 lb/hr 5.3 0.0055 159.3 0.080 1.1 lb/hr 1.10 33.0 0.017 1.10 lb/hr 1.10 33.0 0.017 0.000012 0.035 1.05 0.00053
CIA Ronler Acres D1D EGEN Generator EPS‐GEN06 D1D‐604‐6 2000 KW 2885 Jun‐0235.8 lb/hr 35.8 0.024 1072.5 0.54 5.3 lb/hr 5.3 0.0055 159.3 0.080 1.1 lb/hr 1.10 33.0 0.017 1.10 lb/hr 1.10 33.0 0.017 0.000012 0.035 1.05 0.00053
CIA Ronler Acres D1D EGEN Generator D1D‐GEN‐7 D1D‐604‐7 2000 KW 2885 Future ‐ TBD35.8 lb/hr 35.8 0.024 1072.5 0.54 5.3 lb/hr 5.3 0.0055 159.3 0.080 1.1 lb/hr 1.10 33.0 0.017 1.10 lb/hr 1.10 33.0 0.017 0.000012 0.035 1.05 0.00053
CIA Ronler Acres RS4 Generator RS4‐ELEC‐EG‐4‐1 RS4‐604‐1 300 KW 449 Oct‐059.0 g/Hp‐hr 8.9 0.031 266.4 0.13 2.6 g/Hp‐hr 2.6 0.00668 76.9 0.038 0.75 lb/hr 0.75 22.5 0.011 0.75 lb/hr 0.75 22.5 0.011 0.000012 0.005 0.16 0.00008
CIA Ronler Acres RS6 Generator RS6‐ELEC‐EG‐6‐1 RS6‐604‐1 300 KW 449 Oct‐059.0 g/Hp‐hr 8.9 0.031 266.4 0.13 2.6 g/Hp‐hr 2.6 0.00668 76.9 0.038 0.75 lb/hr 0.75 22.5 0.011 0.75 lb/hr 0.75 22.5 0.011 0.000012 0.005 0.16 0.00008
CIA Ronler Acres RS6 Generator RS6‐GEN‐2 RS6‐604‐2 2000 KW 2885 Future ‐ TBD35.8 lb/hr 35.8 0.0 1072.5 0.54 5.3 lb/hr 5.3 0.0 159.3 0.080 1.1 lb/hr 1.1 33.0 0.017 1.1 lb/hr 1.1 33.0 0.017 0.000012 0.035 1.1 0.00053
CIA Ronler AcresD1X EGEN1
Generator D1X‐GEN‐1A D1X‐604‐1A 2500 KW 3680 Jan‐125.7 g/Hp‐hr 46.4 0.024 1392.2 0.70 0.2 g/Hp‐hr 1.5 0.0055 46.2 0.023 0.73 lb/hr 0.73 21.9 0.011 0.73 lb/hr 0.73 21.9 0.011 0.000012 0.045 1.34 0.00067
CIA Ronler AcresD1X EGEN1
Generator D1X‐GEN‐1B D1X‐604‐1B 2500 KW 3680 Sep‐135.7 g/Hp‐hr 46.4 0.024 1392.2 0.70 0.2 g/Hp‐hr 1.5 0.0055 46.2 0.023 0.73 lb/hr 0.73 21.9 0.011 0.73 lb/hr 0.73 21.9 0.011 0.000012 0.045 1.34 0.00067
CIA Ronler AcresD1X EGEN1
Generator D1X‐GEN‐1C D1X‐604‐1C 2500 KW 3680 Jan‐125.7 g/Hp‐hr 46.4 0.024 1392.2 0.70 0.2 g/Hp‐hr 1.5 0.0055 46.2 0.023 0.73 lb/hr 0.73 21.9 0.011 0.73 lb/hr 0.73 21.9 0.011 0.000012 0.045 1.34 0.00067
CIA Ronler AcresD1X EGEN1
Generator D1X‐GEN‐2A D1X‐604‐2A 2500 KW 3680 Jan‐125.7 g/Hp‐hr 46.4 0.024 1392.2 0.70 0.2 g/Hp‐hr 1.5 0.0055 46.2 0.023 0.73 lb/hr 0.73 21.9 0.011 0.73 lb/hr 0.73 21.9 0.011 0.000012 0.045 1.34 0.00067
CIA Ronler AcresD1X EGEN1
Generator D1X‐GEN‐2B D1X‐604‐2B 2500 KW 3680 Jan‐125.7 g/Hp‐hr 46.4 0.024 1392.2 0.70 0.2 g/Hp‐hr 1.5 0.0055 46.2 0.023 0.73 lb/hr 0.73 21.9 0.011 0.73 lb/hr 0.73 21.9 0.011 0.000012 0.045 1.34 0.00067
CIA Ronler AcresD1X EGEN1
Generator D1X‐GEN‐2C D1X‐604‐2C 2500 KW 3680 Jan‐125.7 g/Hp‐hr 46.4 0.024 1392.2 0.70 0.2 g/Hp‐hr 1.5 0.0055 46.2 0.023 0.73 lb/hr 0.73 21.9 0.011 0.73 lb/hr 0.73 21.9 0.011 0.000012 0.045 1.34 0.00067
CIA Ronler AcresD1X EGEN1
Generator D1X‐GEN‐3A D1X‐604‐3A 2500 KW 3680 Sep‐135.7 g/Hp‐hr 46.4 0.024 1392.2 0.70 0.2 g/Hp‐hr 1.5 0.0055 46.2 0.023 0.73 lb/hr 0.73 21.9 0.011 0.73 lb/hr 0.73 21.9 0.011 0.000012 0.045 1.34 0.00067
CIA Ronler AcresD1X EGEN1
Generator D1X‐GEN‐3B D1X‐604‐3B 2500 KW 3680 Mar‐125.7 g/Hp‐hr 46.4 0.024 1392.2 0.70 0.2 g/Hp‐hr 1.5 0.0055 46.2 0.023 0.73 lb/hr 0.73 21.9 0.011 0.73 lb/hr 0.73 21.9 0.011 0.000012 0.045 1.34 0.00067
CIA Ronler AcresD1X EGEN1
Generator D1X‐GEN‐3C D1X‐604‐3C 2500 KW 3680 Sep‐135.7 g/Hp‐hr 46.4 0.024 1392.2 0.70 0.2 g/Hp‐hr 1.5 0.0055 46.2 0.023 0.73 lb/hr 0.73 21.9 0.011 0.73 lb/hr 0.73 21.9 0.011 0.000012 0.045 1.34 0.00067
CIA Ronler AcresD1X EGEN1
Generator D1X‐GEN‐4A D1X‐604‐4A 2500 KW 3680 Dec‐135.7 g/Hp‐hr 46.4 0.024 1392.2 0.70 0.2 g/Hp‐hr 1.5 0.0055 46.2 0.023 0.73 lb/hr 0.73 21.9 0.011 0.73 lb/hr 0.73 21.9 0.011 0.000012 0.045 1.34 0.00067
CIA Ronler AcresD1X EGEN1
Generator D1X‐GEN‐4B D1X‐604‐4B 2500 KW 3680 Dec‐135.7 g/Hp‐hr 46.4 0.024 1392.2 0.70 0.2 g/Hp‐hr 1.5 0.0055 46.2 0.023 0.73 lb/hr 0.73 21.9 0.011 0.73 lb/hr 0.73 21.9 0.011 0.000012 0.045 1.34 0.00067
CIA Ronler AcresD1X EGEN1
Generator D1X‐GEN‐5C D1X‐604‐5C 2500 KW 3680 Dec‐135.7 g/Hp‐hr 46.4 0.024 1392.2 0.70 0.2 g/Hp‐hr 1.5 0.0055 46.2 0.023 0.73 lb/hr 0.73 21.9 0.011 0.73 lb/hr 0.73 21.9 0.011 0.000012 0.045 1.34 0.00067
PM2.5 SO2Equipment Identification NOx CO PM10
Emission factors ("EF") are based on EPA's "Compilation of Air Pollutant Emission Factors, Volume I: Stationary Point and Area Sources," also known at AP‐42, Chapter 3, Stationary Internal Combustion Sources, Sections 3.3 and 3.4 or manufacturer's information, i.e., in the tabluation below where the Manufacture Emission Factor is blank, an appropriate AP‐42 emission factor is used. The engines use ultra‐low sulfur fuel (0.0015% sulfur as indicated below). Annual emissions are based on the operating hours provided below.
4_ EGENs Fire Pumps12/29/2014 Page 1 of 2

s1 = % sulfur in fuel oils1 0.0015 per NSPS for new generatorsAnnual emissions based on:
30 hr/year egens Particulate Matter Emission Rates50 hr/year fire pumps Small Engines (<450 KW) Emission Factor 0.31 lbs/MMBtu AP‐42 Section 3.3
Emergency Generator and Fire Water Pump Emission Rates Large Engines (>450 KW) Emission Factor 0.1 lbs/MMBtu AP‐42 Section 3.4
Emissions Unit
Site BuildingEquipment
TypeEquipment
TagsStackID
Equipment Size
Unit BHpInstall date mm/yy
Manufacturer Emission Factor
UnitsHourly
emissions (lb/hr)
Ap‐42 Data‐EF (lb/Hp‐hr)
Annual Emissions (lb/yr)
Annual Emissions
(tpy)
Manufacturer Emission Factor
UnitsHourly
emissions (lb/hr)
Ap‐42 Data‐EF (lb/Hp‐hr)
Annual Emissions (lb/yr)
Annual Emissions
(tpy)
Manufacturer Emission Factor
UnitsHourly
emissions (lb/hr)
Annual Emissions (lb/yr)
Annual Emissions
(tpy)
Manufacturer Emission Factor
UnitsHourly
emissions (lb/hr)
Annual Emissions (lb/yr)
Annual Emissions
(tpy)
Ap‐42 Data‐EF (lb/Hp‐
hr)
Hourly emissions (lb/hr)
Annual Emissions (lb/yr)
Annual Emissions
(tpy)
PM2.5 SO2Equipment Identification NOx CO PM10
CIA Ronler AcresD1X EGEN1
Generator D1X‐GEN‐4C D1X‐604‐4C 2500 KW 3680 Future ‐ TBD5.7 g/Hp‐hr 46.4 0.024 1392.2 0.70 0.2 g/Hp‐hr 1.5 0.0055 46.2 0.023 0.73 lb/hr 0.73 21.9 0.011 0.73 lb/hr 0.73 21.9 0.011 0.000012 0.045 1.34 0.00067
CIA Ronler AcresD1X EGEN1
Generator D1X‐GEN‐5A D1X‐604‐5A 2500 KW 3680 Future ‐ TBD5.7 g/Hp‐hr 46.4 0.024 1392.2 0.70 0.2 g/Hp‐hr 1.5 0.0055 46.2 0.023 0.73 lb/hr 0.73 21.9 0.011 0.73 lb/hr 0.73 21.9 0.011 0.000012 0.045 1.34 0.00067
CIA Ronler AcresD1X EGEN1
Generator D1X‐GEN‐5B D1X‐604‐5B 2500 KW 3680 Future ‐ TBD5.7 g/Hp‐hr 46.4 0.024 1392.2 0.70 0.2 g/Hp‐hr 1.5 0.0055 46.2 0.023 0.73 lb/hr 0.73 21.9 0.011 0.73 lb/hr 0.73 21.9 0.011 0.000012 0.045 1.34 0.00067
CIA Ronler AcresD1X EGEN1
Generator D1X‐GEN‐6A D1X‐604‐6A 2500 KW 3680 Future ‐ TBD5.7 g/Hp‐hr 46.4 0.024 1392.2 0.70 0.2 g/Hp‐hr 1.5 0.0055 46.2 0.023 0.73 lb/hr 0.73 21.9 0.011 0.73 lb/hr 0.73 21.9 0.011 0.000012 0.045 1.34 0.00067
CIA Ronler AcresD1X EGEN1
Generator D1X‐GEN‐6B D1X‐604‐6B 2500 KW 3680 Future ‐ TBD5.7 g/Hp‐hr 46.4 0.024 1392.2 0.70 0.2 g/Hp‐hr 1.5 0.0055 46.2 0.023 0.73 lb/hr 0.73 21.9 0.011 0.73 lb/hr 0.73 21.9 0.011 0.000012 0.045 1.34 0.00067
CIA Ronler AcresD1X EGEN1
Generator D1X‐GEN‐6C D1X‐604‐6C 2500 KW 3680 Future ‐ TBD5.7 g/Hp‐hr 46.4 0.024 1392.2 0.70 0.2 g/Hp‐hr 1.5 0.0055 46.2 0.023 0.73 lb/hr 0.73 21.9 0.011 0.73 lb/hr 0.73 21.9 0.011 0.000012 0.045 1.34 0.00067
CIA Ronler AcresD1X EGEN1
Generator D1X‐GEN‐7A D1X‐604‐7A 2500 KW 3680 Future ‐ TBD5.7 g/Hp‐hr 46.4 0.024 1392.2 0.70 0.2 g/Hp‐hr 1.5 0.0055 46.2 0.023 0.73 lb/hr 0.73 21.9 0.011 0.73 lb/hr 0.73 21.9 0.011 0.000012 0.045 1.34 0.00067
CIA Ronler AcresD1X EGEN1
Generator D1X‐GEN‐7B D1X‐604‐7B 2500 KW 3680 Future ‐ TBD5.7 g/Hp‐hr 46.4 0.024 1392.2 0.70 0.2 g/Hp‐hr 1.5 0.0055 46.2 0.023 0.73 lb/hr 0.73 21.9 0.011 0.73 lb/hr 0.73 21.9 0.011 0.000012 0.045 1.34 0.00067
CIA Ronler AcresD1X EGEN1
Generator D1X‐GEN‐7C D1X‐604‐7C 2500 KW 3680 Future ‐ TBD5.7 g/Hp‐hr 46.4 0.024 1392.2 0.70 0.2 g/Hp‐hr 1.5 0.0055 46.2 0.023 0.73 lb/hr 0.73 21.9 0.011 0.73 lb/hr 0.73 21.9 0.011 0.000012 0.045 1.34 0.00067
CIA Ronler AcresD1X EGEN2
Generator D1X‐GEN‐9A D1X‐604‐9A 2500 KW 3680 Future ‐ TBD48.6 0.013 1457.3 0.73 20.2 0.0055 607.2 0.30 0.73 lb/hr 0.73 21.9 0.011 0.73 lb/hr 0.73 21.9 0.011 0.000012 0.045 1.34 0.00067
CIA Ronler AcresD1X EGEN2
Generator D1X‐GEN‐9B D1X‐604‐9B 2500 KW 3680 Future ‐ TBD48.6 0.013 1457.3 0.73 20.2 0.0055 607.2 0.30 0.73 lb/hr 0.73 21.9 0.011 0.73 lb/hr 0.73 21.9 0.011 0.000012 0.045 1.34 0.00067
CIA Ronler AcresD1X EGEN2
Generator D1X‐GEN‐9C D1X‐604‐9C 2500 KW 3680 Future ‐ TBD48.6 0.013 1457.3 0.73 20.2 0.0055 607.2 0.30 0.73 lb/hr 0.73 21.9 0.011 0.73 lb/hr 0.73 21.9 0.011 0.000012 0.045 1.34 0.00067
CIA Ronler AcresD1X EGEN2
Generator D1X‐GEN‐10A D1X‐604‐10A 2500 KW 3680 Future ‐ TBD48.6 0.013 1457.3 0.73 20.2 0.0055 607.2 0.30 0.73 lb/hr 0.73 21.9 0.011 0.73 lb/hr 0.73 21.9 0.011 0.000012 0.045 1.34 0.00067
CIA Ronler AcresD1X EGEN2
Generator D1X‐GEN‐10B D1X‐604‐10B 2500 KW 3680 Future ‐ TBD48.6 0.013 1457.3 0.73 20.2 0.0055 607.2 0.30 0.73 lb/hr 0.73 21.9 0.011 0.73 lb/hr 0.73 21.9 0.011 0.000012 0.045 1.34 0.00067
CIA Ronler AcresD1X EGEN2
Generator D1X‐GEN‐10C D1X‐604‐10C 2500 KW 3680 Future ‐ TBD48.6 0.013 1457.3 0.73 20.2 0.0055 607.2 0.30 0.73 lb/hr 0.73 21.9 0.011 0.73 lb/hr 0.73 21.9 0.011 0.000012 0.045 1.34 0.00067
CIA Ronler AcresD1X EGEN2
Generator D1X‐GEN‐11A D1X‐604‐11A 2500 KW 3680 Future ‐ TBD48.6 0.013 1457.3 0.73 20.2 0.0055 607.2 0.30 0.73 lb/hr 0.73 21.9 0.011 0.73 lb/hr 0.73 21.9 0.011 0.000012 0.045 1.34 0.00067
CIA Ronler AcresD1X EGEN2
Generator D1X‐GEN‐11B D1X‐604‐11B 2500 KW 3680 Future ‐ TBD48.6 0.013 1457.3 0.73 20.2 0.0055 607.2 0.30 0.73 lb/hr 0.73 21.9 0.011 0.73 lb/hr 0.73 21.9 0.011 0.000012 0.045 1.34 0.00067
CIA Ronler AcresD1X EGEN2
Generator D1X‐GEN‐11C D1X‐604‐11C 2500 KW 3680 Future ‐ TBD48.6 0.013 1457.3 0.73 20.2 0.0055 607.2 0.30 0.73 lb/hr 0.73 21.9 0.011 0.73 lb/hr 0.73 21.9 0.011 0.000012 0.045 1.34 0.00067
CIA Ronler AcresD1X EGEN2
Generator D1X‐GEN‐12A D1X‐604‐12A 2500 KW 3680 Future ‐ TBD48.6 0.013 1457.3 0.73 20.2 0.0055 607.2 0.30 0.73 lb/hr 0.73 21.9 0.011 0.73 lb/hr 0.73 21.9 0.011 0.000012 0.045 1.34 0.00067
CIA Ronler AcresD1X EGEN2
Generator D1X‐GEN‐12B D1X‐604‐12B 2500 KW 3680 Future ‐ TBD48.6 0.013 1457.3 0.73 20.2 0.0055 607.2 0.30 0.73 lb/hr 0.73 21.9 0.011 0.73 lb/hr 0.73 21.9 0.011 0.000012 0.045 1.34 0.00067
CIA Ronler AcresD1X EGEN2
Generator D1X‐GEN‐12C D1X‐604‐12C 2500 KW 3680 Future ‐ TBD48.6 0.013 1457.3 0.73 20.2 0.0055 607.2 0.30 0.73 lb/hr 0.73 21.9 0.011 0.73 lb/hr 0.73 21.9 0.011 0.000012 0.045 1.34 0.00067
CIA Ronler Acres D1B Generator F20‐EPS‐1 D1B‐604‐1 2000 KW 2682 199664.4 0.024 1931.0 0.97 14.8 0.0055 442.5 0.22 0.67 20.2 0.010 0.67 20.2 0.010 0.000012 0.033 0.98 0.00049
CIA Ronler Acres D1B Generator F20‐EPS‐2 D1B‐604‐2 2000 KW 2682 Future ‐ TBD34.9 0.013 1046.0 0.52 14.8 0.0055 442.5 0.22 0.40 g/KW‐hr 1.76 52.9 0.026 0.40 g/KW‐hr 1.76 52.9 0.026 0.000012 0.033 0.98 0.00049
CIA Ronler Acres D1B Generator F20‐EPS‐3 D1B‐604‐3 2000 KW 2012 199648.3 0.024 1448.6 0.72 11.1 0.0055 332.0 0.17 0.67 20.2 0.010 0.67 20.2 0.010 0.000012 0.024 0.73 0.00037
CIA Ronler Acres D1B Generator F20‐CPS‐1 D1B‐605‐1 1500 KW 2011 stored48.3 0.024 1447.7 0.72 11.1 0.0055 331.8 0.17 0.51 15.2 0.0076 0.51 15.2 0.0076 0.000012 0.024 0.73 0.00037
CIA Aloha F15 Generator F15‐EG01 F15604‐1 1500 KW 2012 Jan‐9426.2 0.013 784.7 0.39 11.1 0.0055 332.0 0.17 0.51 15.2 0.0076 0.51 15.2 0.0076 0.000012 0.024 0.73 0.00037
CIA Aloha F15 Generator F15‐EG02 F15604‐2 1500 KW 2012 Jan‐9426.2 0.013 784.7 0.39 11.1 0.0055 332.0 0.17 0.51 15.2 0.0076 0.51 15.2 0.0076 0.000012 0.024 0.73 0.00037
CIA Aloha F15 Generator F15‐EG03 F15604‐3 1500 KW 2012 Jan‐9426.2 0.013 784.7 0.39 11.1 0.0055 332.0 0.17 0.51 15.2 0.0076 0.51 15.2 0.0076 0.000012 0.024 0.73 0.00037
CIA Aloha F5 Generator F15.5‐EG01 F5604‐1 1500 KW 2153 Aug‐0154.9 lb/hr 54.9 0.024 1648.2 0.82 13.8 lb/hr 13.8 0.0055 414.6 0.21 0.58 lb/hr 0.58 17.4 0.0087 0.58 lb/hr 0.58 17.4 0.0087 0.000012 0.026 0.78 0.00039
CIA Aloha F5 Generator F15.5‐EG02 F5604‐2 1500 KW 2157 Jan‐0170.2 lb/hr 70.2 0.024 2106.9 1.05 10.2 lb/hr 10.2 0.0055 304.8 0.15 0.54 lb/hr 0.54 16.2 0.0081 0.54 lb/hr 0.54 16.2 0.0081 0.000012 0.026 0.79 0.00039
CIA Ronler AcresPump House #3
Fire Pump PH #3 RS4‐153‐1 97 KW 130 Pre‐project6.2 g/Hp‐hr 1.8 0.031 88.7 0.04 1.3 g/Hp‐hr 0.4 0.00668 19.2 0.010 0.03 1.6 0.0008 0.03 1.6 0.0008 0.000012 0.002 0.08 0.00004
CIA Ronler AcresPump House #2
Fire Pump PH #2 D1D153‐1 160 KW 215 Pre‐project2.7 g/Hp‐hr 1.3 0.031 63.6 0.03 1.2 g/Hp‐hr 0.6 0.00668 28.3 0.014 0.15 lb/hr 0.15 7.5 0.0037 0.149 lb/hr 0.15 7.5 0.0037 0.000012 0.003 0.13 0.00007
CIA Ronler AcresPump House #1
Fire Pump PH #1 D1B153‐1 155 KW 208 Pre‐project4.6 g/Hp‐hr 2.1 0.031 105.0 0.05 2.6 g/Hp‐hr 1.2 0.00668 59.6 0.030 0.115 lb/hr 0.11 5.7 0.0029 0.115 lb/hr 0.11 5.7 0.0029 0.000012 0.003 0.13 0.00006
CIA Ronler Acres N2 Plant Generator N2‐GEN‐1a N2‐604‐1 2500 KW 3680 Future ‐ TBD48.6 0.013 1457.3 0.73 20.2 0.0055 607.2 0.30 0.73 lb/hr 0.73 21.9 0.011 0.73 lb/hr 0.73 21.9 0.011 0.000012 0.045 1.34 0.00067
CIA Ronler Acres N2 Plant Generator N2‐GEN‐1b N2‐604‐2 2500 KW 3680 Future ‐ TBD48.6 0.013 1457.3 0.73 20.2 0.0055 607.2 0.30 0.73 lb/hr 0.73 21.9 0.011 0.73 lb/hr 0.73 21.9 0.011 0.000012 0.045 1.34 0.00067
2787.5 83728.0 41.9 592.6 17820.3 8.91 56.1 1687.5 0.84 56.1 1687.5 0.84 2.4 73.2 0.037Totals for Emergency Generators and Fire Water Pumps
4_ EGENs Fire Pumps12/29/2014 Page 2 of 2

Natural Gas Burning Equipment Rated < 2.0 MMBtu/hr
Annual Utilization rate: 50%
Natural Gas Burning Equipment < 2.0 MMBtu/hr Emission FactorsCO 84 lb/MMscf per AP‐42NOx 100 lb/MMscf per AP‐42PM10 2.5 lb/MMscf per current ACDPPM2.5 2.5 lb/MMscf per current ACDPSO2 2.6 lb/MMscf per current ACDPLead 0.0005 lb/MMscf per AP‐42 Table 1.4‐2
Natural Gas Burning Equipment Rated < 2.0 MMBtu/hr Emission Rates
Emissions Unit
Site BuildingEquipmen
tType
SystemEquipment
TagsEquipment
Size Unit
Install date mm/yy
Hourly emissions lbs/hr
Annual Emissions tons/yr
Hourly emissions lbs/hr
Annual Emissions tons/yr
Hourly emissions lbs/hr
Annual Emissions tons/yr
Hourly emissions lbs/hr
Annual Emissions tons/yr
Hourly emissions lbs/hr
Annual Emissions tons/yr
Hourly emissions lbs/hr
Annual Emissions tons/yr
CIA Ronler Acres RA3 Heater HW RA3‐MECH‐GWH‐01 1,990 MBH Jun‐03 0.16 0.36 0.20 0.43 0.0049 0.0107 0.0049 0.0107 0.0051 0.0111 0.00000098 0.0000021
CIA Ronler Acres RA3 Heater HW RA3‐MECH‐GWH‐02 1,990 MBH Jun‐03 0.16 0.36 0.20 0.43 0.0049 0.0107 0.0049 0.0107 0.0051 0.0111 0.00000098 0.0000021
CIA Ronler Acres RA3 Heater HW RA3‐MECH‐GWH‐03 1,990 MBH Jun‐03 0.16 0.36 0.20 0.43 0.0049 0.0107 0.0049 0.0107 0.0051 0.0111 0.00000098 0.0000021
CIA Ronler Acres RA3 Heater HW RA3‐MECH‐GWH‐04 1,990 MBH Jun‐03 0.16 0.36 0.20 0.43 0.0049 0.0107 0.0049 0.0107 0.0051 0.0111 0.00000098 0.0000021
CIA Ronler Acres RA3 Heater HW RA3‐MECH‐GWH‐05 1,990 MBH Jun‐03 0.16 0.36 0.20 0.43 0.0049 0.0107 0.0049 0.0107 0.0051 0.0111 0.00000098 0.0000021
CIA Ronler Acres RA3 Heater HW RA3‐MECH‐GWH‐06 1,990 MBH Jun‐03 0.16 0.36 0.20 0.43 0.0049 0.0107 0.0049 0.0107 0.0051 0.0111 0.00000098 0.0000021
CIA Ronler Acres RA3 Heater HW RA3‐MECH‐GWH‐07 1,990 MBH Jun‐03 0.16 0.36 0.20 0.43 0.0049 0.0107 0.0049 0.0107 0.0051 0.0111 0.00000098 0.0000021
CIA Ronler Acres RA3 Heater HW RA3‐MECH‐GWH‐08 1,990 MBH Jun‐03 0.16 0.36 0.20 0.43 0.0049 0.0107 0.0049 0.0107 0.0051 0.0111 0.00000098 0.0000021
CIA Ronler Acres RS4 Heater AH RTU‐1 850 MBH Pre‐project 0.07 0.15 0.08 0.18 0.0021 0.0046 0.0021 0.0046 0.0022 0.0047 0.00000042 0.0000009
CIA Ronler Acres RS4 Heater AH RTU‐2 850 MBH Pre‐project 0.07 0.15 0.08 0.18 0.0021 0.0046 0.0021 0.0046 0.0022 0.0047 0.00000042 0.0000009
CIA Ronler Acres RS4 Heater AH RTU‐3 350 MBH Pre‐project 0.03 0.06 0.03 0.08 0.0009 0.0019 0.0009 0.0019 0.00089 0.0020 0.00000017 0.0000004
CIA Ronler Acres RS4 Heater AH RTU‐4 350 MBH Pre‐project 0.03 0.06 0.03 0.08 0.0009 0.0019 0.0009 0.0019 0.00089 0.0020 0.00000017 0.0000004
CIA Ronler Acres RS4 Heater AH RTU‐5 150 MBH Pre‐project 0.01 0.03 0.01 0.03 0.00037 0.00081 0.00037 0.00081 0.00038 0.0008 0.00000007 0.0000002
CIA Ronler Acres RS4 Heater AH RTU‐6 80 MBH Pre‐project 0.01 0.01 0.01 0.02 0.00020 0.00043 0.00020 0.00043 0.00020 0.0004 0.00000004 0.0000001
CIA Ronler Acres RS4 Heater AH None 72 MBH Project 0.01 0.01 0.01 0.02 0.00018 0.00039 0.00018 0.00039 0.00018 0.0004 0.00000004 0.0000001
CIA Ronler Acres RS4 Heater AH None 72 MBH Project 0.01 0.01 0.01 0.02 0.00018 0.00039 0.00018 0.00039 0.00018 0.0004 0.00000004 0.0000001
CIA Ronler Acres RS4 Heater AH None 72 MBH Project 0.01 0.01 0.01 0.02 0.00018 0.00039 0.00018 0.00039 0.00018 0.0004 0.00000004 0.0000001
CIA Ronler Acres RS4 Heater AH None 72 MBH Project 0.01 0.01 0.01 0.02 0.00018 0.00039 0.00018 0.00039 0.00018 0.0004 0.00000004 0.0000001
CIA Ronler Acres RS4 Heater AH None 72 MBH Project 0.01 0.01 0.01 0.02 0.00018 0.00039 0.00018 0.00039 0.00018 0.0004 0.00000004 0.0000001
LeadEquipment Identification PM10 PM2.5 SO2CO NOx
Emission factors ("EF") are based on EPA's "Compilation of Air Pollutant Emission Factors, Volume I: Stationary Point and Area Sources," also known at AP‐42, Chapter 1, Section 1.4 Natural Gas Combustion or Intel's current ACDP which are based on Oregon DEQ Emission Factors identified within AQ‐EF05
5_Heaters12/29/2014 Page 1 of 3

Natural Gas Burning Equipment Rated < 2.0 MMBtu/hr Emission Rates
Emissions Unit
Site BuildingEquipmen
tType
SystemEquipment
TagsEquipment
Size Unit
Install date mm/yy
Hourly emissions lbs/hr
Annual Emissions tons/yr
Hourly emissions lbs/hr
Annual Emissions tons/yr
Hourly emissions lbs/hr
Annual Emissions tons/yr
Hourly emissions lbs/hr
Annual Emissions tons/yr
Hourly emissions lbs/hr
Annual Emissions tons/yr
Hourly emissions lbs/hr
Annual Emissions tons/yr
LeadEquipment Identification PM10 PM2.5 SO2CO NOx
CIA Ronler Acres RS4 Heater AH None 480 MBH Project 0.04 0.09 0.05 0.10 0.0012 0.0026 0.0012 0.0026 0.0012 0.0027 0.00000024 0.0000005
CIA Ronler Acres RS5 Heater AH AH‐200 850 MBH Pre‐project 0.07 0.15 0.08 0.18 0.0021 0.0046 0.0021 0.0046 0.0022 0.0047 0.00000042 0.0000009
CIA Ronler Acres RS5 Heater AH AH‐201 850 MBH Pre‐project 0.07 0.15 0.08 0.18 0.0021 0.0046 0.0021 0.0046 0.0022 0.0047 0.00000042 0.0000009
CIA Ronler Acres RS5 Heater AH AH‐202 850 MBH Pre‐project 0.07 0.15 0.08 0.18 0.0021 0.0046 0.0021 0.0046 0.0022 0.0047 0.00000042 0.0000009
CIA Ronler Acres RS5 Heater AH AH‐203 850 MBH Pre‐project 0.07 0.15 0.08 0.18 0.0021 0.0046 0.0021 0.0046 0.0022 0.0047 0.00000042 0.0000009
CIA Ronler Acres RS5 Heater AH AH‐204 500 MBH Pre‐project 0.04 0.09 0.05 0.11 0.0012 0.0027 0.0012 0.0027 0.0013 0.0028 0.00000025 0.0000005
CIA Ronler Acres RS5 Heater AH AH‐205 500 MBH Pre‐project 0.04 0.09 0.05 0.11 0.0012 0.0027 0.0012 0.0027 0.0013 0.0028 0.00000025 0.0000005
CIA Ronler Acres RS5 Heater AH AH‐206 500 MBH Pre‐project 0.04 0.09 0.05 0.11 0.0012 0.0027 0.0012 0.0027 0.0013 0.0028 0.00000025 0.0000005
CIA Ronler Acres RS5 Heater AH AH‐207 500 MBH Pre‐project 0.04 0.09 0.05 0.11 0.0012 0.0027 0.0012 0.0027 0.0013 0.0028 0.00000025 0.0000005
CIA Ronler Acres RS6 Heater AH RTU‐1 400 MBH Pre‐project 0.03 0.07 0.04 0.09 0.0010 0.0021 0.0010 0.0021 0.0010 0.0022 0.00000020 0.0000004
CIA Ronler Acres RS6 Heater AH RTU‐2 400 MBH Pre‐project 0.03 0.07 0.04 0.09 0.0010 0.0021 0.0010 0.0021 0.0010 0.0022 0.00000020 0.0000004
CIA Ronler Acres RS6 Heater AH RTU‐3 350 MBH Pre‐project 0.03 0.06 0.03 0.08 0.0009 0.0019 0.0009 0.0019 0.0009 0.0020 0.00000017 0.0000004
CIA Ronler Acres RS6 Heater AH RTU‐4 120 MBH Pre‐project 0.01 0.02 0.01 0.03 0.0003 0.0006 0.0003 0.0006 0.0003 0.0007 0.00000006 0.0000001
CIA Ronler Acres RS6 Heater AH RTU‐5 400 MBH Pre‐project 0.03 0.07 0.04 0.09 0.0010 0.0021 0.0010 0.0021 0.0010 0.0022 0.00000020 0.0000004
CIA Ronler Acres RS6 Heater AH None 72 MBH Project 0.01 0.01 0.01 0.02 0.00018 0.00039 0.00018 0.00039 0.00018 0.0004 0.00000004 0.0000001
CIA Ronler Acres RS6 Heater AH None 72 MBH Project 0.01 0.01 0.01 0.02 0.00018 0.00039 0.00018 0.00039 0.00018 0.0004 0.00000004 0.0000001
CIA Ronler Acres RS6 Heater AH None 72 MBH Project 0.01 0.01 0.01 0.02 0.00018 0.00039 0.00018 0.00039 0.00018 0.0004 0.00000004 0.0000001
CIA Ronler Acres RS6 Heater AH None 72 MBH Project 0.01 0.01 0.01 0.02 0.00018 0.00039 0.00018 0.00039 0.00018 0.0004 0.00000004 0.0000001
CIA Ronler Acres RS6 Heater AH None 72 MBH Project 0.01 0.01 0.01 0.02 0.00018 0.00039 0.00018 0.00039 0.00018 0.0004 0.00000004 0.0000001
CIA Ronler Acres RS6 Heater AH None 480 MBH Project 0.04 0.09 0.05 0.10 0.0012 0.0026 0.0012 0.0026 0.0012 0.0027 0.00000024 0.0000005
CIA Ronler Acres LT3 Heater AH None 1,200 MBH Project 0.10 0.22 0.12 0.26 0.0029 0.0064 0.0029 0.0064 0.0031 0.0067 0.00000059 0.0000013
CIA Ronler Acres LT3 Heater AH None 1,200 MBH Project 0.10 0.22 0.12 0.26 0.0029 0.0064 0.0029 0.0064 0.0031 0.0067 0.00000059 0.0000013
CIA Ronler Acres LT3 Heater AH None 1,200 MBH Project 0.10 0.22 0.12 0.26 0.0029 0.0064 0.0029 0.0064 0.0031 0.0067 0.00000059 0.0000013
CIA Ronler Acres LT3 Heater AH None 1,200 MBH Project 0.10 0.22 0.12 0.26 0.0029 0.0064 0.0029 0.0064 0.0031 0.0067 0.00000059 0.0000013
CIA Ronler Acres LT4 Heater AH None 125 MBH Project 0.010 0.023 0.012 0.027 0.00031 0.00067 0.00031 0.00067 0.00032 0.00070 0.00000006 0.0000001
CIA Ronler Acres LT4 Heater AH None 125 MBH Project 0.010 0.023 0.012 0.027 0.00031 0.00067 0.00031 0.00067 0.00032 0.00070 0.00000006 0.0000001
CIA Ronler Acres LT4 Heater AH None 125 MBH Project 0.010 0.023 0.012 0.027 0.00031 0.00067 0.00031 0.00067 0.00032 0.00070 0.00000006 0.0000001
CIA Ronler Acres LT4 Heater AH None 125 MBH Project 0.010 0.023 0.012 0.027 0.00031 0.00067 0.00031 0.00067 0.00032 0.00070 0.00000006 0.0000001
CIA Ronler Acres LT4 Heater AH None 125 MBH Project 0.010 0.023 0.012 0.027 0.00031 0.00067 0.00031 0.00067 0.00032 0.00070 0.00000006 0.0000001
CIA Ronler Acres LT4 Heater AH None 125 MBH Project 0.010 0.023 0.012 0.027 0.00031 0.00067 0.00031 0.00067 0.00032 0.00070 0.00000006 0.0000001
5_Heaters12/29/2014 Page 2 of 3

Natural Gas Burning Equipment Rated < 2.0 MMBtu/hr Emission Rates
Emissions Unit
Site BuildingEquipmen
tType
SystemEquipment
TagsEquipment
Size Unit
Install date mm/yy
Hourly emissions lbs/hr
Annual Emissions tons/yr
Hourly emissions lbs/hr
Annual Emissions tons/yr
Hourly emissions lbs/hr
Annual Emissions tons/yr
Hourly emissions lbs/hr
Annual Emissions tons/yr
Hourly emissions lbs/hr
Annual Emissions tons/yr
Hourly emissions lbs/hr
Annual Emissions tons/yr
LeadEquipment Identification PM10 PM2.5 SO2CO NOx
CIA Ronler Acres LT4 Heater AH None 125 MBH Project 0.010 0.023 0.012 0.027 0.00031 0.00067 0.00031 0.00067 0.00032 0.00070 0.00000006 0.0000001
CIA Ronler Acres LT4 Heater AH None 125 MBH Project 0.010 0.023 0.012 0.027 0.00031 0.00067 0.00031 0.00067 0.00032 0.00070 0.00000006 0.0000001
CIA Ronler Acres LT4 Heater AH None 125 MBH Project 0.010 0.023 0.012 0.027 0.00031 0.00067 0.00031 0.00067 0.00032 0.00070 0.00000006 0.0000001
CIA Ronler Acres LT4 Heater AH None 125 MBH Project 0.010 0.023 0.012 0.027 0.00031 0.00067 0.00031 0.00067 0.00032 0.00070 0.00000006 0.0000001
CIA Ronler Acres LT4 Heater AH None 125 MBH Project 0.010 0.023 0.012 0.027 0.00031 0.00067 0.00031 0.00067 0.00032 0.00070 0.00000006 0.0000001
CIA Ronler Acres LT4 Heater AH None 125 MBH Project 0.010 0.023 0.012 0.027 0.00031 0.00067 0.00031 0.00067 0.00032 0.00070 0.00000006 0.0000001
CIA Ronler Acres LT4 Heater AH None 125 MBH Project 0.010 0.023 0.012 0.027 0.00031 0.00067 0.00031 0.00067 0.00032 0.00070 0.00000006 0.0000001
CIA Ronler Acres LT4 Heater AH None 125 MBH Project 0.010 0.023 0.012 0.027 0.00031 0.00067 0.00031 0.00067 0.00032 0.00070 0.00000006 0.0000001
CIA Ronler Acres LT4 Heater AH None 125 MBH Project 0.010 0.023 0.012 0.027 0.00031 0.00067 0.00031 0.00067 0.00032 0.00070 0.00000006 0.0000001
CIA Ronler Acres LT4 Heater AH None 125 MBH Project 0.010 0.023 0.012 0.027 0.00031 0.00067 0.00031 0.00067 0.00032 0.00070 0.00000006 0.0000001
CIA Ronler Acres LT4 Heater AH None 125 MBH Project 0.010 0.023 0.012 0.027 0.00031 0.00067 0.00031 0.00067 0.00032 0.00070 0.00000006 0.0000001
CIA Ronler Acres LT4 Heater AH None 125 MBH Project 0.010 0.023 0.012 0.027 0.00031 0.00067 0.00031 0.00067 0.00032 0.00070 0.00000006 0.0000001
CIA Ronler Acres LT4 Heater AH None 125 MBH Project 0.010 0.023 0.012 0.027 0.00031 0.00067 0.00031 0.00067 0.00032 0.00070 0.00000006 0.0000001
CIA Ronler Acres LT4 Heater AH None 125 MBH Project 0.010 0.023 0.012 0.027 0.00031 0.00067 0.00031 0.00067 0.00032 0.00070 0.00000006 0.0000001
CIA Ronler Acres LT4 Heater AH None 125 MBH Project 0.010 0.023 0.012 0.027 0.00031 0.00067 0.00031 0.00067 0.00032 0.00070 0.00000006 0.0000001
CIA Ronler Acres LT4 Heater AH None 80 MBH Project 0.007 0.014 0.008 0.017 0.00020 0.00043 0.00020 0.00043 0.00020 0.00045 0.00000004 0.0000001
CIA Ronler Acres LT4 Heater AH None 80 MBH Project 0.007 0.014 0.008 0.017 0.00020 0.00043 0.00020 0.00043 0.00020 0.00045 0.00000004 0.0000001
CIA Ronler Acres LT4 Heater AH None 80 MBH Project 0.007 0.014 0.008 0.017 0.00020 0.00043 0.00020 0.00043 0.00020 0.00045 0.00000004 0.0000001
CIA Aloha AT‐4, AH1 Heater AH None 180 MBH Pre‐project 0.015 0.032 0.018 0.039 0.00044 0.00097 0.00044 0.00097 0.00046 0.0010 0.00000009 0.0000002
CIA Aloha AT‐4, AH 2 Heater AH None 125 MBH Pre‐project 0.010 0.023 0.012 0.027 0.00031 0.00067 0.00031 0.00067 0.00032 0.0007 0.00000006 0.0000001
CIA Aloha AT‐6, AH1 Heater AH None 180 MBH Pre‐project 0.015 0.032 0.018 0.039 0.00044 0.00097 0.00044 0.00097 0.00046 0.0010 0.00000009 0.0000002
CIA Aloha AT‐6, AH2 Heater AH None 180 MBH Pre‐project 0.015 0.032 0.018 0.039 0.00044 0.00097 0.00044 0.00097 0.00046 0.0010 0.00000009 0.0000002
CIA Aloha AT‐6, AH3 Heater AH None 180 MBH Pre‐project 0.015 0.032 0.018 0.039 0.00044 0.00097 0.00044 0.00097 0.00046 0.0010 0.00000009 0.0000002
CIA Aloha AT‐8, AH1 Heater AH None 180 MBH Pre‐project 0.015 0.032 0.018 0.039 0.00044 0.00097 0.00044 0.00097 0.00046 0.0010 0.00000009 0.00000022.96 6.49 3.53 7.73 0.088 0.19 0.088 0.19 0.092 0.20 0.000018 0.000039Totals for Natural Gas Burning Equipment < 2.0 MMBtu/hr
5_Heaters12/29/2014 Page 3 of 3

This page intentionally left blank.

TMXW
8,760 hours per year operation:Burner Heat Input: 1.05 MMBTU/hrRemoval of CO across catalyst: 90%
TMXW Emission FactorsNOx 0.34 lb/hrCO 0.3 lb/MMBtu per burner manufacturer (90% removal across catalyst)PM10 2.5 lb/MMscf per current ACDPPM2.5 2.5 lb/MMscf per current ACDPSO2 2.6 lb/MMscf per current ACDPLead 0.0005 lb/MMscf per AP‐42 Table 1.4‐2
TMXW System Emission RatesEF= 0.3 lb/MMscf EF= 2.5 lb/MMscf EF= 2.5 lb/MMscf EF= 2.6 lb/MMscf EF= 0.0005 lb/MMscf
Emissions Unit
Site BuildingEquipment
TypeSystem
EquipmentTags
StackID
Install date mm/yy
Hourly emissions lbs/hr
Annual Emissions tons/yr
Hourly emissions lbs/hr
Annual Emissions tons/yr
Hourly emissions lbs/hr
Annual Emissions tons/yr
Hourly emissions lbs/hr
Annual Emissions tons/yr
Hourly emissions lbs/hr
Annual Emissions tons/yr
Hourly emissions lbs/hr
Annual Emissions tons/yr
EU3 Ronler Acres CUB3 Abatement TMXW CUB3 ‐ OX293‐0‐70 D1D293‐1 2008 0.032 0.14 0.342 1.50 0.0026 0.011 0.0026 0.011 0.0027 0.012 0.00000051 0.0000023
EU3 Ronler Acres PUB1 Abatement TMXW PUB1A‐OX293‐0‐70 PUB293‐1 2012 0.032 0.14 0.34 1.50 0.0026 0.011 0.0026 0.011 0.0027 0.012 0.00000051 0.0000023
EU3 Ronler AcresPUB1
Abatement TMXW PUB1B‐OX293‐0‐70 PUB293‐2 2014 0.032 0.14 0.34 1.50 0.0026 0.011 0.0026 0.011 0.0027 0.012 0.00000051 0.0000023
EU3 Ronler AcresPUB1
Abatement TMXW PUB1C‐OX293‐0‐70 PUB293‐3 2014 0.032 0.14 0.34 1.50 0.0026 0.011 0.0026 0.011 0.0027 0.012 0.00000051 0.0000023
EU3 Ronler AcresPUB1
Abatement TMXW PUB1D‐OX293‐0‐70 PUB293‐4 Future ‐ TBD 0.032 0.14 0.34 1.50 0.0026 0.011 0.0026 0.011 0.0027 0.012 0.00000051 0.0000023
EU3 Ronler AcresPUB1
Abatement TMXW PUB1E‐OX293‐0‐70 PUB293‐5 Future ‐ TBD 0.032 0.14 0.34 1.50 0.0026 0.011 0.0026 0.011 0.0027 0.012 0.00000051 0.0000023
EU3 Ronler AcresPUB1
Abatement TMXW PUB1F‐OX293‐0‐70 PUB293‐6 Future ‐ TBD 0.032 0.14 0.34 1.50 0.0026 0.011 0.0026 0.011 0.0027 0.012 0.00000051 0.0000023
EU3 Ronler Acres CUB2 Abatement TMXW CUB2‐OX293‐0‐70 D1C293‐1 Future ‐ TBD 0.032 0.14 0.34 1.50 0.0026 0.011 0.0026 0.011 0.0027 0.012 0.00000051 0.00000230.25 1.10 2.74 12.0 0.021 0.09 0.021 0.090 0.021 0.094 0.0000041 0.000018
LeadPM2.5 SO2Equipment Identification
Totals for TXMW
CO NOx PM10
Each TMXW system includes a natural gas fired burner operated at 1.05 MMBtu/hr for thermal catalytic oxidation of ammonia and CO and thermal catalytic reduction of NOx.
CO & NOx emission rates are based on the following:0.30 lb. CO/MMBtu per burner manufacturer and 90% removal of CO across the catalyst.0.34 lb/hr NOx accounting for natural gas combustion, ammonia loading rate and reduction of NOx across the catalyst.
Other criteria pollutant emissions are based on natural gas combustion emission factor per Intels current ACDP or AP‐42.
6_TMXW12/29/2014 Page 1 of 1

This page intentionally left blank.

Cooling Towers
PM10 & PM2.5 Fractions
PM10 Factor Peak PM10 Factor Ave
0.478 0.816
PM2.5 Factor Peak PM2.5 Factor Ave
0.0017 0.0036
Cooling Tower Emission Rates
Emissions Units
Site BuildingEquipment
TypeEquipment
TagsStackID
Install date mm/yyDrift rate
%Peak gpm per pump
Peak TDS PPM
PM (lb/hr)
PM10 (lb/hr)
PM2.5 (lb/hr)
Avg Pump Recirculation (gpm)
Avg TDS PPM
PM (lb/yr)
PM (ton/yr)
PM10 Annual lb/yr
PM10 Annual (tpy)
PM2.5 Annual lb/yr
PM2.5 Annual (tpy)
CIA Ronler Acres CUB4 Cooling Towers RAC4‐CT114‐1 CUB4114‐1 Jul‐13 0.0005% 10723 3350 0.1 0.043 0.00015 5361 1057.3 124.2 0.062 101.4 0.051 0.45 0.00022
CIA Ronler Acres CUB4 Cooling Towers RAC4‐CT114‐2 CUB4114‐2 Jul‐13 0.0005% 10723 3350 0.1 0.043 0.00015 5361 1057.3 124.2 0.062 101.4 0.051 0.45 0.00022
CIA Ronler Acres CUB4 Cooling Towers RAC4‐CT114‐3 CUB4114‐3 Jul‐13 0.0005% 10723 3350 0.1 0.043 0.00015 5361 1057.3 124.2 0.062 101.4 0.051 0.45 0.00022
CIA Ronler Acres CUB4 Cooling Towers RAC4‐CT114‐4 CUB4114‐4 Jul‐13 0.0005% 10723 3350 0.1 0.043 0.00015 5361 1057.3 124.2 0.062 101.4 0.051 0.45 0.00022
CIA Ronler Acres CUB4 Cooling Towers RAC4‐CT114‐5 CUB4114‐5 Jul‐13 0.0005% 10723 3350 0.1 0.043 0.00015 5361 1057.3 124.2 0.062 101.4 0.051 0.45 0.00022
CIA Ronler Acres CUB4 Cooling Towers RAC4‐CT114‐6 CUB4114‐6 Jul‐13 0.0005% 10723 3350 0.1 0.043 0.00015 5361 1057.3 124.2 0.062 101.4 0.051 0.45 0.00022
CIA Ronler Acres CUB4 Cooling Towers RAC4‐CT114‐7 CUB4114‐7 Jul‐13 0.0005% 10723 3350 0.1 0.043 0.00015 5361 1057.3 124.2 0.062 101.4 0.051 0.45 0.00022
CIA Ronler Acres CUB4 Cooling Towers RAC4‐CT114‐8 CUB4114‐8 Jul‐13 0.0005% 10723 3350 0.1 0.043 0.00015 5361 1057.3 124.2 0.062 101.4 0.051 0.45 0.00022
CIA Ronler Acres CUB4 Cooling Towers RAC4‐CT114‐9 CUB4114‐9 Future ‐ TBD 0.0005% 10723 3350 0.1 0.043 0.00015 5361 1057.3 124.2 0.062 101.4 0.051 0.45 0.00022
CIA Ronler Acres CUB4 Cooling Towers RAC4‐CT114‐10 CUB4114‐10 Future ‐ TBD 0.0005% 10723 3350 0.1 0.043 0.00015 5361 1057.3 124.2 0.062 101.4 0.051 0.45 0.00022
CIA Ronler Acres CUB4 Cooling Towers RAC4‐CT114‐11 CUB4114‐11 Future ‐ TBD 0.0005% 10723 3350 0.1 0.043 0.00015 5361 1057.3 124.2 0.062 101.4 0.051 0.45 0.00022
CIA Ronler Acres CUB4 Cooling Towers RAC4‐CT114‐12 CUB4114‐12 Future ‐ TBD 0.0005% 10723 3350 0.1 0.043 0.00015 5361 1057.3 124.2 0.062 101.4 0.051 0.45 0.00022
CIA Ronler Acres CUB5 Cooling Towers RAC5‐CT115‐1 CUB5114‐13 Future ‐ TBD 0.0010% 10723 3350 0.2 0.086 0.00031 5361 1057.3 248.5 0.124 202.7 0.101 0.89 0.00045
CIA Ronler Acres CUB5 Cooling Towers RAC5‐CT115‐2 CUB5114‐14 Future ‐ TBD 0.0010% 10723 3350 0.2 0.086 0.00031 5361 1057.3 248.5 0.124 202.7 0.101 0.89 0.00045
CIA Ronler Acres CUB5 Cooling Towers RAC5‐CT115‐3 CUB5114‐15 Future ‐ TBD 0.0010% 10723 3350 0.2 0.086 0.00031 5361 1057.3 248.5 0.124 202.7 0.101 0.89 0.00045
CIA Ronler Acres CUB5 Cooling Towers RAC5‐CT115‐4 CUB5114‐16 Future ‐ TBD 0.0010% 10723 3350 0.2 0.086 0.00031 5361 1057.3 248.5 0.124 202.7 0.101 0.89 0.00045
CIA Ronler Acres CUB5 Cooling Towers RAC5‐CT115‐5 CUB5114‐17 Future ‐ TBD 0.0010% 10723 3350 0.2 0.086 0.00031 5361 1057.3 248.5 0.124 202.7 0.101 0.89 0.00045
CIA Ronler Acres CUB5 Cooling Towers RAC5‐CT115‐6 CUB5114‐18 Future ‐ TBD 0.0010% 10723 3350 0.2 0.086 0.00031 5361 1057.3 248.5 0.124 202.7 0.101 0.89 0.00045
CIA Ronler Acres CUB5 Cooling Towers RAC5‐CT115‐7 CUB5114‐19 Future ‐ TBD 0.0010% 10723 3350 0.2 0.086 0.00031 5361 1057.3 248.5 0.124 202.7 0.101 0.89 0.00045
CIA Ronler Acres CUB5 Cooling Towers RAC5‐CT115‐8 CUB5114‐20 Future ‐ TBD 0.0010% 10723 3350 0.2 0.086 0.00031 5361 1057.3 248.5 0.124 202.7 0.101 0.89 0.00045
CIA Ronler Acres CUB5 Cooling Towers RAC5‐CT115‐9 CUB5114‐21 Future ‐ TBD 0.0010% 10723 3350 0.2 0.086 0.00031 5361 1057.3 248.5 0.124 202.7 0.101 0.89 0.00045
CIA Ronler Acres CUB5 Cooling Towers RAC5‐CT115‐10 CUB5114‐22 Future ‐ TBD 0.0010% 10723 3350 0.2 0.086 0.00031 5361 1057.3 248.5 0.124 202.7 0.101 0.89 0.00045
Average Annual ConditionsShort Term Peak ConditionsEquipment Identification
Particulate matter emissions are based on EPA's "Compilation of Air Pollutant Emission Factors, Volume I: Stationary Point and Area Sources," also known at AP‐42, Chapter 13.4 ‐Wet Cooling Towers. PM10 and PM2.5 fractions are calculated based on Joel Reisman and Gordon Frisbie's "Calculating Realistic PM10 Emissions from Cooling Towers", Abstract No. 216 Session No. AM‐1b.
7_Cooling Towers12/29/2014 Page 1 of 3

Cooling Tower Emission Rates
Emissions Units
Site BuildingEquipment
TypeEquipment
TagsStackID
Install date mm/yyDrift rate
%Peak gpm per pump
Peak TDS PPM
PM (lb/hr)
PM10 (lb/hr)
PM2.5 (lb/hr)
Avg Pump Recirculation (gpm)
Avg TDS PPM
PM (lb/yr)
PM (ton/yr)
PM10 Annual lb/yr
PM10 Annual (tpy)
PM2.5 Annual lb/yr
PM2.5 Annual (tpy)
Average Annual ConditionsShort Term Peak ConditionsEquipment Identification
CIA Ronler Acres CUB5 Cooling Towers RAC5‐CT115‐11 CUB5114‐23 Future ‐ TBD 0.0010% 10723 3350 0.2 0.086 0.00031 5361 1057.3 248.5 0.124 202.7 0.101 0.89 0.00045
CIA Ronler Acres CUB5 Cooling Towers RAC5‐CT115‐12 CUB5114‐24 Future ‐ TBD 0.0010% 10723 3350 0.2 0.086 0.00031 5361 1057.3 248.5 0.124 202.7 0.101 0.89 0.00045
CIA Ronler Acres CUB5 Cooling Towers RAC5‐CT115‐13 CUB5114‐25 Future ‐ TBD 0.0010% 10723 3350 0.2 0.086 0.00031 5361 1057.3 248.5 0.124 202.7 0.101 0.89 0.00045
CIA Ronler Acres CUB5 Cooling Towers RAC5‐CT115‐14 CUB5114‐26 Future ‐ TBD 0.0010% 10723 3350 0.2 0.086 0.00031 5361 1057.3 248.5 0.124 202.7 0.101 0.89 0.00045
CIA Ronler Acres CUB5 Cooling Towers RAC5‐CT115‐15 CUB5114‐27 Future ‐ TBD 0.0010% 10723 3350 0.2 0.086 0.00031 5361 1057.3 248.5 0.124 202.7 0.101 0.89 0.00045
CIA Ronler Acres CUB5 Cooling Towers RAC5‐CT115‐16 CUB5114‐28 Future ‐ TBD 0.0010% 10723 3350 0.2 0.086 0.00031 5361 1057.3 248.5 0.124 202.7 0.101 0.89 0.00045
CIA Ronler Acres CUB5 Cooling Towers RAC5‐CT115‐17 CUB5114‐29 Future ‐ TBD 0.0010% 10723 3350 0.2 0.086 0.00031 5361 1057.3 248.5 0.124 202.7 0.101 0.89 0.00045
CIA Ronler Acres CUB3 Cooling Towers CT‐114‐1‐210 D1D114‐1 May‐01 0.0010% 7700 3350 0.1 0.062 0.00022 3850 1057.3 178.4 0.089 145.6 0.073 0.64 0.00032
CIA Ronler Acres CUB3 Cooling Towers CT‐114‐2‐210 D1D114‐2 May‐01 0.0010% 7700 3350 0.1 0.062 0.00022 3850 1057.3 178.4 0.089 145.6 0.073 0.64 0.00032
CIA Ronler Acres CUB3 Cooling Towers CT‐114‐3‐210 D1D114‐3 May‐01 0.0010% 7700 3350 0.1 0.062 0.00022 3850 1057.3 178.4 0.089 145.6 0.073 0.64 0.00032
CIA Ronler Acres CUB3 Cooling Towers CT‐114‐4‐210 D1D114‐4 May‐01 0.0010% 7700 3350 0.1 0.062 0.00022 3850 1057.3 178.4 0.089 145.6 0.073 0.64 0.00032
CIA Ronler Acres CUB3 Cooling Towers CT‐114‐5‐210 D1D114‐5 May‐01 0.0010% 7700 3350 0.1 0.062 0.00022 3850 1057.3 178.4 0.089 145.6 0.073 0.64 0.00032
CIA Ronler Acres RP1 Cooling Towers RP1‐CT114‐1‐200 RP114‐1 Jun‐03 0.0010% 3845 3350 0.1 0.031 0.00011 1922 1057.3 89.1 0.045 72.7 0.036 0.32 0.00016
CIA Ronler Acres RP1 Cooling Towers RP1‐CT114‐2‐200 RP114‐2 May‐01 0.0010% 3845 3350 0.1 0.031 0.00011 1922 1057.3 89.1 0.045 72.7 0.036 0.32 0.00016
CIA Ronler Acres RA4 Cooling Towers RA4‐CT113‐1‐10 RA4114‐1 Q3 2014 0.0010% 5600 3350 0.1 0.045 0.00016 2800 1057.3 129.8 0.065 105.9 0.053 0.47 0.00023
CIA Ronler Acres RA4 Cooling Towers RA4‐CT113‐2‐10 RA4114‐2 Future ‐ TBD 0.0010% 5600 3350 0.1 0.045 0.00016 2800 1057.3 129.8 0.065 105.9 0.053 0.47 0.00023
CIA Ronler Acres RA4 Cooling Towers RA4‐CT113‐3‐10 RA4114‐3 Future ‐ TBD 0.0010% 5600 3350 0.1 0.045 0.00016 2800 1057.3 129.8 0.065 105.9 0.053 0.47 0.00023
CIA Ronler Acres RA5 Cooling Towers RA5‐CT114‐1 RA5114‐1 Future ‐ TBD 0.0010% 10723 3350 0.2 0.086 0.00031 5361 1057.3 248.5 0.124 202.7 0.101 0.89 0.00045
CIA Ronler Acres RA6 Cooling Towers RA6‐CT114‐1 RA6114‐1 Future ‐ TBD 0.0010% 10723 3350 0.2 0.086 0.00031 5361 1057.3 248.5 0.124 202.7 0.101 0.89 0.00045
CIA Ronler Acres CUB2 Cooling Towers CUB2‐CT114‐1‐210 D1C114‐1 May‐98 0.0010% 12600 3350 0.2 0.101 0.00036 4000 1057.3 185.4 0.093 151.3 0.076 0.67 0.00033
CIA Ronler Acres CUB2 Cooling Towers CUB2‐CT114‐2‐210 D1C114‐2 May‐98 0.0010% 12600 3350 0.2 0.101 0.00036 4000 1057.3 185.4 0.093 151.3 0.076 0.67 0.00033
CIA Ronler Acres CUB2 Cooling Towers CUB2‐CT114‐3‐210 D1C114‐3 May‐98 0.0010% 12600 3350 0.2 0.101 0.00036 4000 1057.3 185.4 0.093 151.3 0.076 0.67 0.00033
CIA Ronler Acres CUB2 Cooling Towers CUB2‐CT114‐4‐210 D1C114‐4 May‐98 0.0010% 12600 3350 0.2 0.101 0.00036 4000 1057.3 185.4 0.093 151.3 0.076 0.67 0.00033
CIA Ronler Acres CUB2 Cooling Towers CUB2‐CT114‐5‐210 D1C114‐5 May‐98 0.0010% 12600 3350 0.2 0.101 0.00036 4000 1057.3 185.4 0.093 151.3 0.076 0.67 0.00033
CIA Ronler Acres CUB2 Cooling Towers CUB2‐CT114‐6‐210 D1C114‐6 May‐98 0.0010% 12600 3350 0.2 0.101 0.00036 4000 1057.3 185.4 0.093 151.3 0.076 0.67 0.00033
CIA Ronler Acres CUB2 Cooling Towers CUB2‐CT114‐7‐210 D1C114‐7 Jun‐00 0.0010% 12600 3350 0.2 0.101 0.00036 4000 1057.3 185.4 0.093 151.3 0.076 0.67 0.00033
CIA Ronler Acres CUB2 Cooling Towers CUB2‐CT114‐8‐210 D1C114‐8 Jun‐00 0.0010% 12600 3350 0.2 0.101 0.00036 4000 1057.3 185.4 0.093 151.3 0.076 0.67 0.00033
CIA Ronler Acres CUB2 Cooling Towers CUB2‐CT114‐9‐210 D1C114‐9 Jun‐00 0.0010% 12600 3350 0.2 0.101 0.00036 4000 1057.3 185.4 0.093 151.3 0.076 0.67 0.00033
CIA Ronler Acres CUB2 Cooling Towers CUB2‐CT114‐10‐10 D1C114‐10 Future ‐ TBD 0.0010% 12600 3350 0.2 0.101 0.00036 4000 1057.3 185.4 0.093 151.3 0.076 0.67 0.00033
CIA Ronler Acres CUB2 Cooling Towers CUB2‐CT114‐11‐10 D1C114‐11 Jul‐12 0.0010% 13000 3350 0.2 0.104 0.00037 4000 1057.3 185.4 0.093 151.3 0.076 0.67 0.00033
CIA Ronler Acres CUB2 Cooling Towers CUB2‐CT114‐12‐10 D1C114‐12 Jul‐12 0.0010% 13000 3350 0.2 0.104 0.00037 4000 1057.3 185.4 0.093 151.3 0.076 0.67 0.00033
CIA Ronler Acres CUB2 Cooling Towers CUB2‐CT114‐13‐10 D1C114‐13 Future ‐ TBD 0.0010% 13000 3350 0.2 0.104 0.00037 4000 1057.3 185.4 0.093 151.3 0.076 0.67 0.00033
CIA Ronler Acres CUB1 Cooling Towers F20‐CT114‐1‐210 D1B114‐1 Pre‐project 0.0010% 12600 3350 0.2 0.101 0.00036 4000 1057.3 185.4 0.093 151.3 0.076 0.67 0.00033
CIA Ronler Acres CUB1 Cooling Towers F20‐CT114‐2‐210 D1B114‐2 Pre‐project 0.0010% 12600 3350 0.2 0.101 0.00036 4000 1057.3 185.4 0.093 151.3 0.076 0.67 0.00033
7_Cooling Towers12/29/2014 Page 2 of 3

Cooling Tower Emission Rates
Emissions Units
Site BuildingEquipment
TypeEquipment
TagsStackID
Install date mm/yyDrift rate
%Peak gpm per pump
Peak TDS PPM
PM (lb/hr)
PM10 (lb/hr)
PM2.5 (lb/hr)
Avg Pump Recirculation (gpm)
Avg TDS PPM
PM (lb/yr)
PM (ton/yr)
PM10 Annual lb/yr
PM10 Annual (tpy)
PM2.5 Annual lb/yr
PM2.5 Annual (tpy)
Average Annual ConditionsShort Term Peak ConditionsEquipment Identification
CIA Ronler Acres CUB1 Cooling Towers F20‐CT114‐3‐210 D1B114‐3 Pre‐project 0.0010% 12600 3350 0.2 0.101 0.00036 4000 1057.3 185.4 0.093 151.3 0.076 0.67 0.00033
CIA Ronler Acres CUB1 Cooling Towers F20‐CT114‐4‐210 D1B114‐4 Pre‐project 0.0010% 12600 3350 0.2 0.101 0.00036 4000 1057.3 185.4 0.093 151.3 0.076 0.67 0.00033
CIA Ronler Acres CUB1 Cooling Towers F20‐CT114‐5‐210 D1B114‐5 Pre‐project 0.0010% 12600 3350 0.2 0.101 0.00036 4000 1057.3 185.4 0.093 151.3 0.076 0.67 0.00033
CIA Ronler Acres CUB1 Cooling Towers F20‐CT114‐6‐210 D1B114‐6 Pre‐project 0.0010% 12600 3350 0.2 0.101 0.00036 4000 1057.3 185.4 0.093 151.3 0.076 0.67 0.00033
CIA Ronler Acres CUB1 Cooling Towers F20‐CT114‐7‐210 D1B114‐7 Pre‐project 0.0010% 12600 3350 0.2 0.101 0.00036 4000 1057.3 185.4 0.093 151.3 0.076 0.67 0.00033
CIA Ronler Acres CUB1 Cooling Towers F20‐CT114‐8‐210 D1B114‐8 Pre‐project 0.0010% 12600 3350 0.2 0.101 0.00036 4000 1057.3 185.4 0.093 151.3 0.076 0.67 0.00033
CIA Ronler Acres CUB1 Cooling Towers F20‐CT114‐9‐210 D1B114‐9 Pre‐project 0.0010% 12600 3350 0.2 0.101 0.00036 4000 1057.3 185.4 0.093 151.3 0.076 0.67 0.00033
CIA Ronler Acres CUB1 Cooling Towers F20‐CT114‐10‐210 D1B114‐10 Future ‐ TBD 0.0010% 12600 3350 0.2 0.101 0.00036 4000 1057.3 185.4 0.093 151.3 0.076 0.67 0.00033
CIA Ronler Acres CUB1 Cooling Towers F20‐CT114‐11‐210 D1B114‐11 Future ‐ TBD 0.0010% 12600 3350 0.2 0.101 0.00036 4000 1057.3 185.4 0.093 151.3 0.076 0.67 0.00033
CIA Aloha F15 Cooling Towers F15‐CT29‐1‐1 F15114‐8 Jan‐92 0.0100% 3600 3350 0.6 0.288 0.0010 2340 1057.3 1084.5 0.542 884.9 0.44 3.90 0.0020
CIA Aloha F15 Cooling Towers F15‐CT29‐1‐2 F15114‐7 Jan‐92 0.0100% 3600 3350 0.6 0.288 0.0010 2340 1057.3 1084.5 0.542 884.9 0.44 3.90 0.0020
CIA Aloha F15 Cooling Towers F15‐CT29‐1‐3 F15114‐6 Jan‐92 0.0100% 6115 3350 1.0 0.490 0.0017 2340 1057.3 1084.5 0.542 884.9 0.44 3.90 0.0020
CIA Aloha F15 Cooling Towers F15‐CT29‐1‐4 F15114‐5 Jan‐92 0.0100% 6115 3350 1.0 0.490 0.0017 2340 1057.3 1084.5 0.542 884.9 0.44 3.90 0.0020
CIA Aloha F15 Cooling Towers F15‐CT29‐1‐5 F15114‐4 Jan‐92 0.0100% 6115 3350 1.0 0.490 0.0017 2340 1057.3 1084.5 0.542 884.9 0.44 3.90 0.0020
CIA Aloha F15 Cooling Towers F15‐CT29‐1‐6 F15114‐3 Jan‐92 0.0100% 1100 3350 0.2 0.088 0.00031 420 1057.3 194.6 0.097 158.8 0.079 0.70 0.00035
CIA Aloha F15 Cooling Towers F15‐CT29‐1‐7 F15114‐2 Jan‐92 0.0100% 1100 3350 0.2 0.088 0.00031 420 1057.3 194.6 0.097 158.8 0.079 0.70 0.00035
CIA Aloha F15 Cooling Towers F15‐CT29‐1‐8 F15114‐1 Jan‐92 0.0100% 1100 3350 0.2 0.088 0.00031 420 1057.3 194.6 0.097 158.8 0.079 0.70 0.00035
CIA Aloha AL4 Cooling Towers AL4‐CHW‐CT1 AL4114‐10 Feb‐91 0.0100% 0 3350 0.0 0 0 0 1057.3 0 0 0 0 0 0
CIA Aloha AL4 Cooling Towers AL4‐CHW‐CT2 AL4114‐11 Feb‐91 0.0100% 0 3350 0.0 0 0 0 1057.3 0 0 0 0 0 0
CIA Aloha F5 Cooling Towers F5‐CDW‐CT01 F5114‐1 Jan‐84 0.0100% 2160 3350 0.4 0.173 0.00062 485 1057.3 224.8 0.112 183.4 0.092 0.81 0.00040
CIA Aloha F5 Cooling Towers F5‐CDW‐CT02 F5114‐2 Jan‐84 0.0100% 2160 3350 0.4 0.173 0.00062 485 1057.3 224.8 0.112 183.4 0.092 0.81 0.00040
CIA Aloha F5 Cooling Towers F5‐CDW‐CT03 F5114‐3 Jan‐84 0.0100% 2160 3350 0.4 0.173 0.00062 485 1057.3 224.8 0.112 183.4 0.092 0.81 0.00040
CIA Aloha F5 Cooling Towers F5‐CDW‐CT04 F5114‐4 Jan‐84 0.0100% 2160 3350 0.4 0.173 0.00062 485 1057.3 224.8 0.112 183.4 0.092 0.81 0.00040
CIA Ronler Acres N2 Plant Cooling Towers N2‐CT114‐1 N2114‐1 Future ‐ TBD 0.0010% 10723 3350 0.2 0.086 0.00031 5361 1057.3 248.5 0.124 202.7 0.101 0.89 0.00045
CIA Ronler Acres N2 Plant Cooling Towers N2‐CT114‐2 N2114‐2 Future ‐ TBD 0.0010% 10723 3350 0.2 0.086 0.00031 5362 1057.3 248.5 0.124 202.8 0.101 0.89 0.00045
8.26 0.029 15930.3 7.97 70.3 0.035Totals for Cooling Towers
7_Cooling Towers12/29/2014 Page 3 of 3

This page intentionally left blank.

Gas Analyzers
Spec Gas Analyzer Emission Rates
Emission Unit
BuildingEquipment
TypeEquipment Tag Install Date
Max. HCl Flow (slm)
Max. HCl Loading (lb/hr)
Removal Efficiency (%)
HCl Emissions (lb/hr)
HCl Emission (tpy)
EU3 D1D Abatement D1D‐HCl‐Analyzer‐POU‐1 3/13 10 2.2 99.5% 0.011 0.047EU3 D1D Abatement D1D‐HCL Analyzer – POU‐2 4/13 10 2.2 99.5% 0.011 0.047EU4 D1X Abatement D1X‐HCL Analyzer POU1 10/13 10 2.2 99.5% 0.011 0.047EU4 D1X Abatement D1X‐HCL Analyzer POU2 Future ‐ TBD 10 2.2 99.5% 0.011 0.047EU1 D1C Abatement D1C‐HCL Analyzer‐POU‐1 12/13 10 2.2 99.5% 0.011 0.047
Totals 0.054 0.24Calculation ‐ Single Unit
HCltpy = 10 l 60 min mol 36.5 g 1 lb 0.50% 1 ton 8760 hrmin hr 22.4 l mol 453.59 grams 2000 lb yr
HCltpy = 0.047
This source includes the exhaust from five Spec Gas Hydrogen Chloride (HCl) Analyzers which are controlled by Ebara Airgard wet fume point of use abatement devices. The point of use device exhaust to the centralized acid exhaust system. Each analyzer has a dedicated Airgard water fume scrubber capable of removing HCl with an efficiency > 99%. Operating conditions and emission calculations are provided below.
8_HCl_POU12/29/2014 Page ‐ 1 of 1

This page intentionally left blank.

Arsenic Specialty Exhaust
As Specialty Exhaust Emission Rates
Emission Unit
BuildingEquipment
Type
Projected Arsine
Consumption (lb/yr)
Projected Arsenic
Generation (lb/yr)
Arsenic Removal
Efficiency (%)
Arsenic Emissions (lb/yr)
Arsenic Emissions
(tpy)
EU1 D1C Fab Tool 52 49.9 99.99% 0.0050 0.0000025EU3 D1D Fab Tool 29 27.8 99.99% 0.0028 0.0000014EU4 D1X Fab Tool 547 525.4 99.99% 0.0525 0.000026
Total 0.000030
Arsine gas is used in the manufacturing process. The arsine gas decomposes to arsenic particulate and remains upon certain manufacturing tool parts. During parts clean the residual particulate is vacummed and exhausted to High Efficiency Particulate Air (HEPA) filters. Estimated annual arsine consumption and arsenic emissions are provided in the table below.
10_As_Spec_Ex12/29/2014 Page 1 of 1

This page intentionally left blank

Lime Silos
Input Operating Parameters:Number silos 5 (D1C‐1, D1D‐1, D1X‐1 curent, 2 future)Duration of fill 60 min# fills per silo per year 26Outlet concentration 0.02 grains/ft3
Vent air flow rate 700 cfmPM‐2.5 fraction of PM‐10 54%
Lime Silo Emission Rates
Emission Unit BuildingEquipment
TypeEquipment Tag
Vent Filter Equipment Tag
Install DatePM‐10 (lb/hr)
PM‐10 (tpy)
PM‐2.5 (lb/hr)
PM‐2.5 (tpy)
EU1 D1C Lime Silo RACB2‐TK266‐1‐40 RACB2‐FL266‐1‐48 2001 0.12 0.0016 0.065 0.00084EU3 D1D Lime Silo RACB3‐TK266‐1‐40 RACB3‐FL266‐1‐48 2002 0.12 0.0016 0.065 0.00084EU4 D1X Lime Silo RAPB1A‐TK266‐1‐40 RAPB1A‐FL266‐1‐48 2012 0.12 0.0016 0.065 0.00084EU4 D1X Lime Silo RAPB1B‐TK266‐1‐40 RAPB1B‐FL266‐1‐48 2014 0.12 0.0016 0.065 0.00084EU4 D1X Lime Silo RAPB1C‐TK266‐1‐40 RAPB1C‐FL266‐1‐48 2014 0.12 0.0016 0.065 0.00084
Totals 0.60 0.0078 0.324 0.004212Calculation ‐ Single Unit
PM‐10lb/hr = 0.02 grains 700 ft3 60 min 1 lbft3 min hr 7000 grains
PM‐10lb/hr = 0.12 lb/hr
PM‐10tpy = 0.12 lb 26 load‐hr 1 tonhr yr 2000 lb
PM‐10tpy = 0.0016 tpy
PM‐2.5lb/hr 0.065 lb/hr
PM‐2.5tpy 0.00084 tpy
Dry lime (calcium hydroxide) used in wastewater treatment operations is delivered to and stored in lime silos. During filling, the silos are a source of particulate matter emissions as air is displaced by the lime being loaded. Each silo is equipped with vent controlled by a filter with an maximum average particulate outlet grain loading of 0.02 grains per cubic foot of air exhaust. Operating parameters and emission calculations are provided below. All emissions of particulate matter are assumed to be PM‐10 with 54% assumed to be PM‐2.5 in accordance with ODEQ guidance (ODEQ, Emission Factors, PM2.5 fractions of PM‐10, AQ‐EF08 for Portland Cement Kiln ‐ dry process with fabric filter.)
11_Lime Silo12/29/2014
Page 1of 1

This page intentionally left blank

H2S From MBR System
Input/Assumptions
H2S Outlet Conc. 0.1 ppmvAir Flow Rate 20000 cfm/unit# units 12Operating Hours 8760 hr/yr
Emission Unit BuildingEquipment
TypeEquipment Tag Install Date
H2S (lb/hr)
H2S (tpy)
EU22 MBR Abatement MBR‐SC132‐1 Future ‐ TBD 0.011 0.047
EU22 MBR Abatement MBR‐SC132‐2 Future ‐ TBD 0.011 0.047
EU22 MBR Abatement MBR‐SC132‐3 Future ‐ TBD 0.011 0.047
EU22 MBR Abatement MBR‐SC132‐4 Future ‐ TBD 0.011 0.047
EU22 MBR Abatement MBR‐SC132‐5 Future ‐ TBD 0.011 0.047
EU22 MBR Abatement MBR‐SC132‐6 Future ‐ TBD 0.011 0.047
EU22 MBR Abatement MBR2‐SC132‐1 Future ‐ TBD 0.011 0.047
EU22 MBR Abatement MBR2‐SC132‐2 Future ‐ TBD 0.011 0.047
EU22 MBR Abatement MBR2‐SC132‐3 Future ‐ TBD 0.011 0.047
EU22 MBR Abatement MBR2‐SC132‐4 Future ‐ TBD 0.011 0.047
EU22 MBR Abatement MBR2‐SC132‐5 Future ‐ TBD 0.011 0.047
EU22 MBR Abatement MBR2‐SC132‐6 Future ‐ TBD 0.011 0.047
Totals 0.13 0.56Calculation ‐ single unit
H2Slb/hr = 0.1 ft3 H2S 20000 ft3 1 lb‐mol 34.1 lb 60 min1000000 ft3 air min‐unit 385 ft3 lb‐mol hr
H2Slb/hr = 0.011
H2Stpy = 0.047
The MBR system is a planned future wastewater treatment system and will be a source of hydrogen sulfide (H2S) emissions. A dry scrubber is planned to be used for odor control. Emission calculations are provided below.
12_H2S12/29/2014 Page 1 of 1

This page intentionally left blank

Dust from Paved and Unpaved Roads
Unpaved Roads Paved Roads
Source PM2.5 PM10 PM PM2.5 PM10 PMTable 13.2.2‐2 k 0.15 1.5 4.9 lb/VMT k 0.00054 0.0022 0.011 lb/VMTTable 13.2.2‐2 a 0.9 0.9 0.7 sL 0.030 0.030 0.030 g/m2Table 13.2.2‐2 b 0.45 0.45 0.45 W 4.5 4.5 4.5WRAP Table 6.2 s 6.4 6.4 6.4 % P 180 180 180
W 2.4 2.4 2.4 tons N 365 365 365
0.0001 0.0002 0.0011 lb/VMTE 0.0771 0.7705 2.8542 worst case lb/vehicle mile
Figure 13.2.2‐1 P 180 180 180 498 498 498 <‐‐‐‐‐‐‐‐‐‐‐‐‐‐‐‐‐‐‐‐‐‐‐‐‐‐‐‐‐‐‐‐‐‐‐‐Eext 0.0391 0.3905 1.4467 Extrapolated Emission Factor 0.005 0.019 0.097 tons per year
Control Efficiency
CE 78% 78% 78%
Control for speed limit of equal to or less than 10 mph on plant roads
Ext 0.0391 0.3905 1.4467E 0.0087 0.0868 0.3215 lbs/VMT Paved Lots Ronler
25 25 25VMT/day (100 vehicles traveling ~.25 miles / day in the construction zone)
0.04 0.40 1.47 tons per year PM2.5 PM10 PMk 0.00054 0.0022 0.011 lb/VMT Table 13.2.1‐1
Unpaved Lots sL 0.030 0.030 0.030 g/m2 Table 13.2.1‐2W 2.4 2.4 2.4P 180 180 180
Source PM2.5 PM10 PM N 365 365 365Table 13.2.2‐2 k 0.15 1.5 4.9 lb/VMTTable 13.2.2‐2 a 0.9 0.9 0.7 0.00003 0.00011 0.00056 lb/VMTTable 13.2.2‐2 b 0.45 0.45 0.45
WRAP Table 6.2 s 6.4 6.4 6.4 %14542 14542 14542 VMT/Day (EE's travel .4 mi / day to
park; 18,178 paved parking spots)W 2.4 2.4 2.4 tons 0.07 0.30 1.49 tons per year
E 0.0771 0.7705 2.8542 worst case lb/vehicle mile Paved Lots AlohaFigure 13.2.2‐1 P 180 180 180
Eext 0.0391 0.3905 1.4467 Extrapolated Emission FactorPM2.5 PM10 PM
48.94 48.94 48.94VMT / day (EE's travel 0.01Mi/day to park in gravel lots; 2447 gravel spots) k 0.00054 0.0022 0.011 lb/VMT Table 13.2.1‐1
CE84% 84% 84%
84% control for annual dust suppression application to parking areas sL 0.030 0.030 0.030 g/m2 Table 13.2.1‐2
E 0.0062 0.0625 0.2315 lb/VMT0.06 0.56 2.07 tons per year W 2.4 2.4 2.4
P 180 180 180N 365 365 365
Pollutant Paved Unpaved TotalsPM 1.7 3.53 5.23PM10 0.34 0.95 1.29 0.00003 0.00011 0.00056 lb/VMTPM2.5 0.083 0.10 0.18
1062 1062 1062 VMT/Day (EE's travel .2 mi / day to park; 2656 paved parking spots)
0.01 0.02 0.11 tons per year
E = CE x Eext
VMT/Day (4 shuttles driving 1.89 miles every 15 minutes from 6AM to 8PM; 75 vehicles moving people or material around campus traveling ~1 mile / day)
E = k (s/12)^a (W/3)^b Ext = [k(sL)^0.91* (W)^1.02]*(1‐P/N)http://www.epa.gov/ttnchie1/ap42/ch13/final/c13s0202.pdf http://www.epa.gov/ttn/chief/ap42/ch13/bgdocs/b13s0201.pdf
Ext = E [(365‐P)/365]
http://www.epa.gov/ttn/chief/ap42/ch13/bgdocs/b13s0201.pdf
tpy
Ext = [k(sL)^0.91* (W)^1.02]*(1‐P/N)
http://www.epa.gov/ttn/chief/ap42/ch13/bgdocs/b13s0201.pdf
E = k (s/12)^a (W/3)^bhttp://www.epa.gov/ttnchie1/ap42/ch13/final/c13s0202.pdf
Ext = E [(365‐P)/365]
Ext = [k(sL)^0.91* (W)^1.02]*(1‐P/N)
This sheet provides the raw calculation for estimating fugitive dust emissions from vehicle travel on paved and unpaved roads. A detailed narrative of the methodologies and assumptions used to estimate emission is provided in a separate appendix.
13_Road_Dust_R212/29/2014 Page 1 of 1

This page intentionally left blank.

Manufacturing ‐ Scrubbers
BuildingsNOX (lb/hr)
Nox (tpy)
CO (lb/hr)
CO (tpy)
SO2 (tpy)
PM ‐ process to scrubbers
(tpy)D1C/D1B/RB1 4.04 17.7 5.61 24.6 3.9 0.0584D1D/X 4.90 21.45 8.79 38.5 7.4 0.129Fab 15 2.31 10.1 2.67 11.7 0 0.0067
Table 2 ‐ Building AllocationsBuildings SO2 PM
RB1 10% 0D1B 5% 25%D1C 85% 75%D1D 25% 25%D1X 75% 75%
Table 3 ‐ Exhaust System Allocated Emission Rates
UnitFluoride (lb/hr)
Fluoride (ton/yr)
HF (lb/hr)HF
(ton/yr)CO (lb/hr) CO (ton/yr)
Nox (lb/hr)
NOx (tons/yr)
Process PM10 (lb/hr)
Process PM10 (tpy)
Process PM2.5 (lb/hr)
Process PM2.5 (tpy)
Process SO2 (lb/hr)
Process SO2 (tpy)
D1D EXSC 0.253 1.11 0.179 0.784 2.20 9.63 1.14 4.99 0.0074 0.032 0.0074 0.032 0.42 1.85D1D EXAM 0.0010 0.0044 0.020 0.087 0 0 0.09 0.38 0 0 0 0 0 0D1X EXSC 0.759 3.33 0.537 2.351 6.59 28.88 3.42 14.96 0.022 0.097 0.022 0.097 1.27 5.55D1X EXAM 0.002 0.0067 0.060 0.261 0 0 0.26 1.13 0 0 0 0 0 0D1C EXSC 0.321 1.40 0.317 1.390 1.87 8.18 1.25 5.49 0.010 0.044 0.010 0.044 0.76 3.32D1C EXAM 0.00036 0.0016 0.048 0.211 0 0 0.14 0.62 0 0 0 0 0 0RP1 EXSC 0.00036 0.0016 0.023 0.101 0.56 2.47 0.07 0.30 0 0 0 0 0 0D1B EXSC 0.018 0.078 0.048 0.211 1.87 8.18 1.25 5.49 0.0033 0.015 0.0033 0.015 0.045 0.20D1B EXAM 0 0 0 0 0 0 0.09 0.41 0 0 0 0 0 0RB1 EXSC 0.017 0.075 0.094 0.410 1.87 8.18 1.25 5.49 0 0 0 0 0.11 0.49RB1 EXAM 0.00036 0.0016 0.023 0.101 0 0 0.09 0.41 0 0 0 0 0 0CUB 2 0 0 0 0 0 0 0.01 0.04 0 0 0 0 0 0CUB3 0 0 0 0 0 0 0.01 0.04 0 0 0 0 0 0PUB1 0 0 0 0 0 0 0.01 0.04 0 0 0 0 0 0F15 0.040 0.17 0.350 1.533 2.67 11.70 2.31 10.10 0.0015 0.0067 0.0015 0.0067 0 0
Note: MSB emissions are assumed to be 1/3 of F15 emissions.
Table 4 ‐ Reisman‐Frisbee PM10 and PM2.5 fractionsOR - EXSC OR - EXAM
0.618 0.051
0.002033 0.000819H2O Density: 8.34 lb/gal
Table 5 ‐ Abatement System/Stack Allocated Emission Rates
PM ‐ Drift
Emission Unit
Site BuildingEquipment
TypeSystem
EquipmentTags
StackID
Install date mm/yy
Drift Loss %Recir. Flow Rate gpm
TDS ‐ ppm
lb/hr ton/yr lb/hr ton/yr lb/hr ton/yr lb/hr ton/yr lb/hr ton/yr lb/hr ton/yr lb/hr ton/yr lb/hr ton/yr lb/hr ton/yr lb/hr ton/yr lb/hr lb/hr ton/yr lb/hr ton/yr lb/hr ton/yr lb/hr ton/yr lb/hr ton/yr lb/hr ton/yr
EU1Ronler Acres
D1B Abatement EXSC F20‐SC133‐1‐111 D1B133‐1 Jun‐96 0.001% 748 23450.018 0.078 0.048 0.211 0.0033 0.015 0.0033 0.015 0.045 0.195 1.87 8.18 1.253 5.487 0.008 0.037 0.008 0.037 0.0087 0.038 0.0088 0.0054 0.024 0.000018 0.000078 0.017 0.075 0.01171 0.05130 0.05322 0.23309 0.0000017 0.0000073
EU1Ronler Acres
D1B Abatement EXSC F20‐SC133‐2‐111 D1B133‐2 Jun‐96 0.001% 748 23450.0088 0.0054 0.024 0.000018 0.000078 0.0054 0.024 0.000018 0.000078
EU1Ronler Acres
D1B Abatement EXSC F20‐SC133‐3‐111 D1B133‐3 Jun‐96 0.001% 748 23450.0088 0.0054 0.024 0.000018 0.000078 0.0054 0.024 0.000018 0.000078
EU1Ronler Acres
D1B Abatement EXSC‐gas pad F20‐SC‐134‐1‐100 D1B133‐4 Sep‐95 0.001% 748 23450 0 0 0 0 0 0 0 0 0 0 0 0 0 0 0 0 0 0 0 0.0088 0.0054 0.024 0.000018 0.000078 0.0054 0.024 0.000018 0.000078 0 0 0 0
EU1 Ronler D1C Abatement EXSC D1C‐SC133‐1‐100 D1C133‐3 Jul‐99 0.001% 680 2345 0.321 1.404 0.317 1.390 0.010 0.044 0.010 0.044 0.757 3.315 1.87 8.18 1.253 5.487 0.0084 0.037 0.0084 0.037 0.0087 0.038 0.0080 0.0049 0.022 0.000016 0.000071 0.023 0.10 0.018 0.080 0.77 3.35 0.0000017 0.0000073EU1 Ronler D1C Abatement EXSC D1C‐SC133‐2‐100 D1C133‐4 Jul‐99 0.001% 680 2345 0.0080 0.0049 0.022 0.000016 0.000071 0.0049 0.022 0.000016 0.000071EU1 Ronler D1C Abatement EXSC D1C‐SC133‐3‐100 D1C133‐5 Jul‐99 0.001% 680 2345 0.0080 0.0049 0.022 0.000016 0.000071 0.0049 0.022 0.000016 0.000071EU1 Ronler D1C Abatement EXSC D1C‐SC133‐4‐100 D1C133‐6 Jul‐99 0.001% 680 2345 0.0080 0.0049 0.022 0.000016 0.000071 0.0049 0.022 0.000016 0.000071
EU1Ronler Acres
D1C Abatement EXAM D1C‐SC142‐3‐100
D1C142‐1, D1C142‐2, D1C142‐3, D1C142‐4, D1C142‐5 (3 scrubbers, 5 fans, 5 stacks)
Jun‐08 0.001% 408 12060
0.00036 0.0016 0.048 0.21 0 0 0 0 0 0 0 0 0.14 0.62 0 0 0 0 0 0 0.025 0.0013 0.0055 0.000020 0.000088 0.0013 0.0055 0.000020 0.000088 0 0 0 0
EU1Ronler Acres
D1C Abatement EXAM D1C‐SC142‐4‐100
D1C142‐1, D1C142‐2, D1C142‐3, D1C142‐4, D1C142‐5 (3 scrubbers, 5 fans, 5 stacks)
Jun‐08 0.001% 408 12060
0.025 0.0013 0.0055 0.000020 0.000088 0.0013 0.0055 0.000020 0.000088
EU1Ronler Acres
D1C Abatement EXAM D1C‐SC142‐5‐100
D1C142‐1, D1C142‐2, D1C142‐3, D1C142‐4, D1C142‐5 (3 scrubbers, 5 fans, 5 stacks)
Jun‐08 0.001% 408 12060
0.025 0.0013 0.0055 0.000020 0.000088 0.0013 0.0055 0.000020 0.000088
EU1Ronler Acres
D1C Abatement EXSC‐PSSS D1C‐SC134‐1‐100D1C133‐7, D1C133‐8, D1C133‐9, D1C133‐10 (2 scrubbers, 4 fans)
Jul‐99 0.001% 408 2345
0 0 0 0 0 0 0 0 0 0 0 0 0 0 0 0 0 0 0 0 0.0048 0.0030 0.013 0.000010 0.000043 0.0030 0.013 0.000010 0.000043 0 0 0 0
EU1Ronler Acres
D1C Abatement EXSC‐PSSS D1C‐SC134‐2‐100D1C133‐7, D1C133‐8, D1C133‐9, D1C133‐10 (2 scrubbers, 4 fans)
Jul‐99 0.001% 680 2345
0.0080 0.0049 0.022 0.000016 0.000071 0.0049 0.022 0.000016 0.000071EU1 Ronler RB1 Abatement EXSC‐Planar RB1‐SC‐133‐4‐100 RB133‐4 May‐00 0.001% 612 2345 0.0086 0.037 0.047 0.21 0 0 0 0 0.056 0.25 0.93 4.1 0.63 2.7 0.0042 0.018 0.0042 0.018 0.0043 0.019 0.0072 0.0044 0.019 0.000015 0.000064 0.0086 0.038 0.00420 0.01838 0.060 0.26 0.00000084 0.0000037EU1 Ronler RB1 Abatement EXSC‐Planar RB1‐SC‐133‐6‐100 RB133‐6, May‐00 0.001% 612 2345 0.0072 0.0044 0.019 0.000015 0.000064 0.0044 0.019 0.000015 0.000064EU1 Ronler RB1 Abatement EXSC‐Planar RB1‐SC‐133‐7‐100 RB133‐7 May‐00 0.001% 612 2345 0.0072 0.0044 0.019 0.000015 0.000064 0.0044 0.019 0.000015 0.000064EU1 Ronler RB1 Abatement EXSC‐C4 RB1‐SC‐133‐1‐100 RB133‐1 May‐97 0.001% 612 2345 0.0086 0.037 0.047 0.21 0 0 0 0 0.056 0.25 0.93 4.09 0.63 2.7 0.0042 0.018 0.0042 0.018 0.0043 0.019 0.0072 0.0044 0.019 0.000015 0.000064 0.0086 0.038 0.00420 0.01838 0.060 0.26 0.00000084 0.0000037EU1 Ronler RB1 Abatement EXSC‐C4 RB1‐SC‐133‐2‐100 RB133‐2 May‐97 0.001% 612 2345 0.0072 0.0044 0.019 0.000015 0.000064 0.0044 0.019 0.00001 0.00006EU1 Ronler RB1 Abatement EXSC‐C4 RB1‐SC‐133‐8‐100 RB133‐8 May‐00 0.001% 3313 2345 0.039 0.024 0.105 0.000079 0.000346 0.024 0.105 0.00008 0.00035
EU1Ronler Acres
RB1 Abatement EXAM RB1‐SC‐142‐1‐100RB142‐1: RB142‐2:
May‐97 0.001% 340 12060 0.00036 0.0016 0.023 0.10 0 0 0 0 0 0 0 0 0.094 0.41 0 0 0 0 0 0 0.021 0.0010 0.0046 0.000017 0.000074 0.0010 0.0046 0.000017 0.000074 0 0 0 0
EU1Ronler Acres
RB1 Abatement EXAM RB1‐SC‐142‐2‐100RB142‐1:RB142‐2:
May‐97 0.001% 517 12060 0.031 0.0016 0.0070 0.000026 0.000112 0.0016 0.0070 0.000026 0.00011
EU1Ronler Acres
RB1 Abatement EXAM RB1‐SC‐142‐3‐100RB142‐1RB142‐2
Future ‐ TBD 0.001% 517 12060 0.031 0.0016 0.0070 0.000026 0.000112 0.0016 0.0070 0.000026 0.00011
EU1Ronler Acres
CUB2 Abatement EXSC‐CUB D1C‐SC133‐1‐200 D1C133‐1 Jun‐01 0.001% 68 23450 0 0 0 0 0 0 0 0 0 0 0 0.0080 0.035 0 0 0 0 0 0 0.00080 0.00049 0.0022 0.000002 0.000007 0.00049 0.002 0.00000 0.00001 0 0 0 0
EU4Ronler Acres
RA4 Abatement EXSC RA4‐SC133‐1 RA4133‐1 Future ‐ TBD 0.001% 272 2345 0 0 0 0 0 0 0 0 0 0 0 0 0 0 0 0 0 0 0 0 0.0032 0.0020 0.0086 0.000006 0.000028 0.002 0.009 0.00001 0.00003 0 0 0 0
EU2Ronler Acres
RP1 Abatement EXSC RP1‐SC133‐1‐100RP133‐1RP133‐2
Jun‐03 0.001% 544 23450.00036 0.0016 0.023 0.10 0 0 0 0 0 0 0.56 2.47 0.069 0.30 0 0 0 0 0 0 0.0064 0.0039 0.017 0.000013 0.000057 0.0039 0.017 0.00001 0.00006 0 0 0 0
Fluoride HF PM 10 ‐ Process PM 2.5‐ Process SO2 Process PM10 ‐ Drift PM2.5 ‐ Drift Loss Total PM10 Total PM2.5 Total SO2CO ‐ Process/POU NOx ‐Process/POU PM10 ‐ POU PM2.5 POU SO2 ‐ POU
Table 1 ‐ Emission Factor Derived Emission Rates
PM10 Factors
PM2.5 Factors
Lead ‐ POUEquipment Identification
A detailed discussion of the stack test derived emission calculation methodolgy for Fluorides and HF is provided in Section 3 of the application.
Process related emissions of PM‐10, PM‐2.5, SO2, CO, and NOx are based on ODEQ approved emission factors and scaled for technology changes and production capacity changes (Table 1). In addition, to estimate emissions for future conditions, the emission factor derived emission rates are allocated to the appropriate building exhaust system based on Intel's anticipated future configuration of the Facility (Tables 2 & 3). Table 5 further allocates emissions to specific abatement systems. These abatement systems are operated in a manifold arrangement and certain emissions are allocated to a single representative stack as indicated in the shaded cells in the tabluation below.
Particulatematter emissions from wet scrubber drift loss are based on EPA's "Compilationof Air Pollutant Emission Factors, Volume I: Stationary Point and Area Sources," also known at AP‐42, Chapter 13.4 ‐Wet Cooling Towers. PM10 and PM2.5 fractions (Table 4) are calculated based on Joel Reisman and Gordon Frisbie's "Calculating Realistic PM10 Emissions from Cooling Towers", Abstract No. 216 Session No. AM‐1b.
PM‐10, PM‐2.5, and SO2 emissions from natural gas combustion in the POU devices are based on EPA's "Compilationof Air Pollutant Emission Factors, Volume I: Stationary Point and Area Sources," also known at AP‐42, Chapter 1, Section 1.4 Natural Gas Combustion.
Column heading explanations include the following:
‐ Process/POU: Emission rate includes process related emissions and natural gas combustion byproducts from POU devices‐ POU: Emission rate includes natural gas combustion byproducts from POU devices‐ Drift: Drift loss from wet fume scrubbers
= Emissions are tabulated in the single representative stack for that particular abatement system.
14_Manufacturing ‐ Scrubbers12/29/2014 Page 1 of 4

Table 5 ‐ Abatement System/Stack Allocated Emission Rates
PM ‐ Drift
Emission Unit
Site BuildingEquipment
TypeSystem
EquipmentTags
StackID
Install date mm/yy
Drift Loss %Recir. Flow Rate gpm
TDS ‐ ppm
lb/hr ton/yr lb/hr ton/yr lb/hr ton/yr lb/hr ton/yr lb/hr ton/yr lb/hr ton/yr lb/hr ton/yr lb/hr ton/yr lb/hr ton/yr lb/hr ton/yr lb/hr lb/hr ton/yr lb/hr ton/yr lb/hr ton/yr lb/hr ton/yr lb/hr ton/yr lb/hr ton/yr
Fluoride HF PM 10 ‐ Process PM 2.5‐ Process SO2 Process PM10 ‐ Drift PM2.5 ‐ Drift Loss Total PM10 Total PM2.5 Total SO2CO ‐ Process/POU NOx ‐Process/POU PM10 ‐ POU PM2.5 POU SO2 ‐ POU Lead ‐ POUEquipment Identification
EU2Ronler Acres
RP1 Abatement EXSC RP1‐SC133‐2‐100RP133‐1RP133‐2
Jun‐03 0.001% 544 23450 0 0 0 0 0 0 0 0 0 0 0 0 0 0 0 0 0 0 0 0.0064 0.0039 0.017 0.000013 0.000057 0.0039 0.017 0.00001 0.00006 0 0 0 0
EU2 Ronler RP1 Abatement EXSC‐gas pad RP1‐SC134‐1‐100 RP134‐1 Jun‐03 0.001% 571 2345 0 0 0 0 0 0 0 0 0 0 0 0 0 0 0 0 0 0 0 0 0.0067 0.0041 0.018 0.000014 0.000060 0.0041 0.018 0.00001 0.00006 0 0 0 0EU3 Ronler D1D Abatement EXSC SC‐133‐1‐100 D1D133‐6 May‐02 0.001% 680 2345 0.25 1.11 0.18 0.78 0.0074 0.032 0.0074 0.032 0.42 1.85 2.20 9.63 1.14 4.99 0.018 0.078 0.018 0.078 0.019 0.081 0.0080 0.0049 0.022 0.000016 0.000071 0.030 0.132 0.025 0.11 0.44 1.93 0 0EU3 Ronler D1D Abatement EXSC SC‐133‐2‐100 D1D133‐7 Jun‐03 0.001% 680 2345 0.0080 0.0049 0.022 0.000016 0.000071 0.0049 0.022 0.00002 0.00007EU3 Ronler D1D Abatement EXSC SC‐133‐3‐100 D1D133‐8 Sep‐02 0.001% 680 2345 0.0080 0.0049 0.022 0.000016 0.000071 0.0049 0.022 0.00002 0.00007EU3 Ronler D1D Abatement EXSC SC‐133‐4‐100 D1D133‐9 Jan‐04 0.001% 680 2345 0.0080 0.0049 0.022 0.000016 0.000071 0.0049 0.022 0.00002 0.00007EU3 Ronler D1D Abatement EXSC SC‐133‐5‐100 D1D133‐10 May‐00 0.001% 680 2345 0.0080 0.0049 0.022 0.000016 0.000071 0.0049 0.022 0.00002 0.00007EU3 Ronler D1D Abatement EXSC SC‐133‐6‐100 D1D133‐11 May‐00 0.001% 680 2345 0.0080 0.0049 0.022 0.000016 0.000071 0.0049 0.022 0.00002 0.00007
EU3Ronler Acres
D1D Abatement EXAM‐1 SC‐142‐1‐100
D1D142‐1, D1D142‐2, D1D142‐3, (scubbers are headered to common intake for 5 fans and 3 stacks)
Apr‐02 0.001% 109 12060
0.00050 0.0022 0.010 0.044 0 0 0 0 0 0 0 0 0.043 0.19 0 0 0 0 0 0 0.007 0.004 0.018 0.000013 0.000058 0.004 0.018 0.000013 0.000058 0 0 0 0
EU3Ronler Acres
D1D Abatement EXAM‐1 SC‐142‐2‐100
D1D142‐1, D1D142‐2, D1D142‐3, (scubbers are headered to common intake for 5 fans and 3 stacks)
Apr‐02 0.001% 109 12060
0.007 0.004 0.018 0.000013 0.000058 0.004 0.018 0.00001 0.00006
EU3Ronler Acres
D1D Abatement EXAM‐1 SC‐142‐3‐100
D1D142‐1, D1D142‐2, D1D142‐3, (scubbers are headered to common intake for 5 fans and 3 stacks)
Apr‐02 0.001% 109 12060
0.007 0.004 0.018 0.000013 0.000058 0.004 0.018 0.00001 0.00006
EU3Ronler Acres
D1D Abatement EXAM‐1 SC‐142‐4‐100
D1D142‐1, D1D142‐2, D1D142‐3, (scubbers are headered to common intake for 5 fans and 3 stacks)
May‐02 0.001% 109 12060
0.007 0.004 0.018 0.000013 0.000058 0.004 0.018 0.00001 0.00006
EU3Ronler Acres
D1D Abatement EXAM‐1 SC‐142‐5‐100
D1D142‐1, D1D142‐2, D1D142‐3, (scubbers are headered to common intake for 5 fans and 3 stacks)
May‐02 0.001% 109 12060
0.007 0.004 0.018 0.000013 0.000058 0.004 0.018 0.00001 0.00006
EU3Ronler Acres
D1D Abatement EXAM‐2 SC142‐21‐100D1D142‐4, D1D142‐5, D1D142‐6, D1D142‐7 (3 scrubbers, 4 fans)
Dec‐08 0.001% 354 12060
0.0005 0.0022 0.010 0.044 0 0 0 0 0 0 0 0 0.043 0.19 0 0 0 0 0 0 0.021 0.013 0.058 0.000043 0.000190 0.013 0.058 0.00004 0.00019 0 0 0 0
EU3Ronler Acres
D1D Abatement EXAM‐2 SC142‐22‐100D1D142‐4, D1D142‐5, D1D142‐6, D1D142‐7 (3 scrubbers, 4 fans)
Dec‐08 0.001% 354 12060
0.021 0.013 0.058 0.000043 0.000190 0.013 0.058 0.00004 0.00019
EU3Ronler Acres
D1D Abatement EXAM‐2 SC142‐23‐100D1D142‐4, D1D142‐5, D1D142‐6, D1D142‐7 (3 scrubbers, 4 fans)
Dec‐08 0.001% 354 12060
0.021 0.013 0.058 0.000043 0.000190 0.013 0.058 0.00004 0.00019
EU3Ronler Acres
D1D Abatement EXSC‐PSSS SC‐134‐1‐100
D1D133‐3, D1D133‐4, D1D133‐5 (scrubbers are headered to 3 fans with 3 stacks)
Apr‐02 0.001% 680 2345
0 0 0 0 0 0 0 0 0 0 0 0 0 0 0 0 0 0 0 0 0.0080 0.0049 0.022 0.000016 0.000071 0.0049 0.022 0.00002 0.00007 0 0 0 0
EU3Ronler Acres
D1D Abatement EXSC‐PSSS SC‐134‐2‐100
D1D133‐3, D1D133‐4, D1D133‐5 (scrubbers are headered to 3 fans with 3 stacks)
Apr‐02 0.001% 680 2345
0.0080 0.0049 0.022 0.000016 0.000071 0.0049 0.022 0.00002 0.00007
EU3Ronler Acres
D1D Abatement EXSC‐PSSS SC‐134‐3‐100
D1D133‐3, D1D133‐4, D1D133‐5 (scrubbers are headered to 3 fans with 3 stacks)
Apr‐02 0.001% 680 2345
0.0080 0.0049 0.022 0.000016 0.000071 0.0049 0.022 0.00002 0.00007EU3 Ronler CUB3 Abatement EXSC‐CUB SC‐133‐1‐200 D1D133‐1, D1D133‐2 Oct‐01 0.001% 136 2345 0 0 0 0 0 0 0 0 0 0 0 0 0.008 0.035 0 0 0 0 0 0 0.0016 0.0010 0.004 0.000003 0.000014 0.00099 0.004 0.00000 0.00001 0 0 0 0
EU4Ronler Acres
D1X Abatement EXSC D1X‐SC133‐1‐00 D1X133‐7 Jun‐12 0.001% 1292 2345 0.25 1.11 0.18 0.78 0.007 0.032 0.007 0.032 0.42 1.85 2.20 9.63 1.14 4.99 0.033 0.15 0.033 0.15 0.035 0.15 0.015 0.0094 0.041 0.000031 0.000135 0.050 0.220 0.041 0.18 0.46 2.00 0.0000067 0.000029
EU4Ronler Acres
D1X Abatement EXSC D1X‐SC133‐2‐00 D1X133‐8 Jun‐12 0.001% 1292 2345 0.015 0.0094 0.041 0.000031 0.000135 0.0094 0.041 0.000031 0.00014
EU4Ronler Acres
D1X Abatement EXSC D1X‐SC133‐3‐00 D1X133‐9 Nov‐13 0.001% 1292 2345 0.015 0.0094 0.041 0.000031 0.000135 0.0094 0.041 0.000031 0.00014
EU4Ronler Acres
D1X Abatement EXSC D1X‐SC133‐4‐00 D1X133‐10 Nov‐13 0.001% 1292 2345 0.015 0.0094 0.041 0.000031 0.000135 0.0094 0.041 0.000031 0.00014
EU4Ronler Acres
D1X Abatement EXSC D1X‐SC133‐5‐00 D1X133‐11 Future ‐ TBD 0.001% 1292 2345 0.015 0.0094 0.041 0.000031 0.000135 0.0094 0.041 0.000031 0.00014
EU4Ronler Acres
D1X Abatement EXSC D1XM2‐SC133‐1‐00 D1XM2133‐7 Jul‐14 0.001% 1292 2345 0.25 1.11 0.18 0.78 0.007 0.032 0.0074 0.032 0.42 1.85 2.20 9.63 1.14 4.99 0.033 0.15 0.033 0.15 0.035 0.15 0.015 0.0094 0.041 0.000031 0.000135 0.050 0.220 0.041 0.18 0.46 2.00 0.0000067 0.000029
EU4Ronler Acres
D1X Abatement EXSC D1XM2‐SC133‐2‐00 D1XM2133‐8 Aug‐14 0.001% 1292 2345 0.015 0.0094 0.041 0.000031 0.000135 0.009 0.041 0.000031 0.00014
EU4Ronler Acres
D1X Abatement EXSC D1XM2‐SC133‐3‐00 D1XM2133‐9 Aug‐14 0.001% 1292 2345 0.015 0.0094 0.041 0.000031 0.000135 0.009 0.041 0.000031 0.00014
EU4Ronler Acres
D1X Abatement EXSC D1XM2‐SC133‐4‐00 D1XM2133‐10 Aug‐14 0.001% 1292 2345 0.015 0.0094 0.041 0.000031 0.000135 0.009 0.041 0.000031 0.00014
EU4Ronler Acres
D1X Abatement EXSC D1XM2‐SC133‐5‐00 D1XM2133‐11 Future ‐ TBD 0.001% 1292 2345 0.015 0.0094 0.041 0.000031 0.000135 0.009 0.041 0.000031 0.00014
EU4Ronler Acres
D1X Abatement EXSC D1XM3‐SC133‐1‐00 D1XM3133‐7 Future ‐ TBD 0.001% 1292 2345 0.25 1.11 0.18 0.78 0.007 0.032 0.007 0.032 0.42 1.85 2.20 9.63 1.14 4.99 0.033 0.15 0.033 0.15 0.035 0.15 0.015 0.0094 0.041 0.000031 0.000135 0.050 0.220 0.041 0.18 0.46 2.00 0.0000067 0.000029
EU4Ronler Acres
D1X Abatement EXSC D1XM3‐SC133‐2‐00 D1XM3133‐8 Future ‐ TBD 0.001% 1292 2345 0.015 0.0094 0.041 0.000031 0.000135 0.009 0.041 0.000031 0.00014
EU4Ronler Acres
D1X Abatement EXSC D1XM3‐SC133‐3‐00 D1XM3133‐9 Future ‐ TBD 0.001% 1292 2345 0.015 0.0094 0.041 0.000031 0.000135 0.009 0.041 0.000031 0.00014
EU4Ronler Acres
D1X Abatement EXSC D1XM3‐SC133‐4‐00 D1XM3133‐10 Future ‐ TBD 0.001% 1292 2345 0.015 0.0094 0.041 0.000031 0.000135 0.009 0.041 0.000031 0.00014
EU4Ronler Acres
D1X Abatement EXSC D1XM3‐SC133‐5‐00 D1XM3133‐11 Future ‐ TBD 0.001% 1292 2345 0.015 0.0094 0.041 0.000031 0.000135 0.009 0.041 0.000031 0.00014
EU4Ronler Acres
D1X Abatement EXAM D1X‐SC142‐1‐11 D1X142‐1 May‐12 0.001% 544 12060 0.0005 0.0022 0.020 0.087 0 0 0 0 0 0 0 0 0.086 0.375 0 0 0 0 0 0 0.033 0.020 0.089 0.000067 0.000292 0.020 0.089 0.00007 0.00029 0 0 0 0
EU4Ronler Acres
D1X Abatement EXAM D1X‐SC142‐2‐11 D1X142‐2 May‐12 0.001% 544 12060 0.033 0.020 0.089 0.000067 0.000292 0.020 0.089 0.00007 0.00029
EU4Ronler Acres
D1X Abatement EXAM D1X‐SC142‐3‐11 D1X142‐3 Nov‐13 0.001% 544 12060 0.033 0.020 0.089 0.000067 0.000292 0.020 0.089 0.00007 0.00029
EU4Ronler Acres
D1X Abatement EXAM D1X‐SC142‐4‐11 D1X142‐4 Future ‐ TBD 0.001% 544 12060 0.033 0.020 0.089 0.000067 0.000292 0.020 0.089 0.00007 0.00029
EU4Ronler Acres
D1X Abatement EXAM D1XM2‐SC142‐1‐00 D1XM2142‐1 Aug‐14 0.001% 544 12060 0.00051 0.0022 0.020 0.087 0 0 0 0 0 0 0 0 0.086 0.375 0 0 0 0 0 0 0.033 0.020 0.089 0.000067 0.000292 0.020 0.089 0.00007 0.00029 0 0 0 0
EU4Ronler Acres
D1X Abatement EXAM D1XM2‐SC142‐2‐00 D1XM2142‐2 Aug‐14 0.001% 544 12060 0.033 0.020 0.089 0.000067 0.000292 0.020 0.089 0.00007 0.00029
EU4Ronler Acres
D1X Abatement EXAM D1XM2‐SC142‐3‐00 D1XM2142‐3 Future ‐ TBD 0.001% 544 12060 0.033 0.020 0.089 0.000067 0.000292 0.020 0.089 0.00007 0.00029
14_Manufacturing ‐ Scrubbers12/29/2014 Page 2 of 4

Table 5 ‐ Abatement System/Stack Allocated Emission Rates
PM ‐ Drift
Emission Unit
Site BuildingEquipment
TypeSystem
EquipmentTags
StackID
Install date mm/yy
Drift Loss %Recir. Flow Rate gpm
TDS ‐ ppm
lb/hr ton/yr lb/hr ton/yr lb/hr ton/yr lb/hr ton/yr lb/hr ton/yr lb/hr ton/yr lb/hr ton/yr lb/hr ton/yr lb/hr ton/yr lb/hr ton/yr lb/hr lb/hr ton/yr lb/hr ton/yr lb/hr ton/yr lb/hr ton/yr lb/hr ton/yr lb/hr ton/yr
Fluoride HF PM 10 ‐ Process PM 2.5‐ Process SO2 Process PM10 ‐ Drift PM2.5 ‐ Drift Loss Total PM10 Total PM2.5 Total SO2CO ‐ Process/POU NOx ‐Process/POU PM10 ‐ POU PM2.5 POU SO2 ‐ POU Lead ‐ POUEquipment Identification
EU4Ronler Acres
D1X Abatement EXAM D1XM2‐SC142‐4‐00 D1XM2142‐4 Future ‐ TBD 0.001% 544 12060 0.033 0.020 0.089 0.000067 0.000292 0.020 0.089 0.00007 0.00029
EU4Ronler Acres
D1X Abatement EXAM D1XM3‐SC142‐1‐00 D1XM3142‐1 Future ‐ TBD 0.001% 544 12060 0.00051 0.0022 0.020 0.087 0 0 0 0 0 0 0 0 0.086 0.375 0 0 0 0 0 0 0.033 0.020 0.089 0.000067 0.000292 0.020 0.089 0.00007 0.00029 0 0 0 0
EU4Ronler Acres
D1X Abatement EXAM D1XM3‐SC142‐2‐00 D1XM3142‐2 Future ‐ TBD 0.001% 544 12060 0.033 0.020 0.089 0.000067 0.000292 0.020 0.089 0.00007 0.00029
EU4Ronler Acres
D1X Abatement EXAM D1XM3‐SC142‐3‐00 D1XM3142‐3 Future ‐ TBD 0.001% 544 12060 0.033 0.020 0.089 0.000067 0.000292 0.020 0.089 0.00007 0.00029
EU4Ronler Acres
D1X Abatement EXAM D1XM3‐SC142‐4‐00 D1XM3142‐4 Future ‐ TBD 0.001% 544 12060 0.033 0.020 0.089 0.000067 0.000292 0.020 0.089 0.00007 0.00029
EU4Ronler Acres
D1X Abatement EXSC‐PSSS D1X‐SC134‐1‐00
D1X133‐3, D1X133‐4, D1X133‐5, D1X133‐6 (scrubbers are headered to 4 fans with 4 stacks)
May‐12 0.001% 544 2345
0 0 0 0 0 0 0 0 0 0 0 0 0 0 0 0 0 0 0 0 0.006 0.004 0.017 0.000013 0.000057 0.004 0.017 0.00001 0.00006 0 0 0 0
EU4Ronler Acres
D1X Abatement EXSC‐PSSS D1X‐SC134‐2‐00
D1X133‐3, D1X133‐4, D1X133‐5, D1X133‐6 (scrubbers are headered to 4 fans with 4 stacks)
May‐12 0.001% 544 2345
0.006 0.004 0.017 0.000013 0.000057 0.004 0.017 0.00001 0.00006
EU4Ronler Acres
D1X Abatement EXSC‐PSSS D1X‐SC134‐3‐00
D1X133‐3, D1X133‐4, D1X133‐5, D1X133‐6 (scrubbers are headered to 4 fans with 4 stacks)
May‐12 0.001% 544 2345
0.006 0.004 0.017 0.000013 0.000057 0.004 0.017 0.00001 0.00006
EU4Ronler Acres
D1X Abatement EXSC‐PSSS D1X‐SC134‐4‐00
D1X133‐3, D1X133‐4, D1X133‐5, D1X133‐6 (scrubbers are headered to 4 fans with 4 stacks)
May‐12 0.001% 544 2345
0.006 0.004 0.017 0.000013 0.000057 0.004 0.017 0.00001 0.00006
EU4Ronler Acres
D1X Abatement EXSC‐PSSS D1XM2‐SC134‐1‐00
D1XM2133‐3, D1XM2133‐4, D1XM2133‐5, D1XM2133‐6 (scrubbers are headered to 4 fans with 4 stacks)
Jun‐14 0.001% 544 2345
0 0 0 0 0 0 0 0 0 0 0 0 0 0 0 0 0 0 0 0 0.006 0.004 0.017 0.000013 0.000057 0.004 0.017 0.00001 0.00006 0 0 0 0
EU4Ronler Acres
D1X Abatement EXSC‐PSSS D1XM2‐SC134‐2‐00
D1XM2133‐3, D1XM2133‐4, D1XM2133‐5, D1XM2133‐6 (scrubbers are headered to 4 fans with 4 stacks)
Jun‐14 0.001% 544 2345
0.006 0.004 0.017 0.000013 0.000057 0.004 0.017 0.00001 0.00006
EU4Ronler Acres
D1X Abatement EXSC‐PSSS D1XM2‐SC134‐3‐00
D1XM2133‐3, D1XM2133‐4, D1XM2133‐5, D1XM2133‐6 (scrubbers are headered to 4 fans with 4 stacks)
Jun‐14 0.001% 544 2345
0.006 0.004 0.017 0.000013 0.000057 0.004 0.017 0.00001 0.00006
EU4Ronler Acres
D1X Abatement EXSC‐PSSS D1XM2‐SC134‐4‐00
D1XM2133‐3, D1XM2133‐4, D1XM2133‐5, D1XM2133‐6 (scrubbers are headered to 4 fans with 4 stacks)
Jun‐14 0.001% 544 2345
0.006 0.004 0.017 0.000013 0.000057 0.004 0.017 0.00001 0.00006
EU4Ronler Acres
D1X Abatement EXSC‐PSSS D1XM3‐SC134‐1‐00
D1XM3133‐3, D1XM3133‐4, D1XM3133‐5, D1XM3133‐6 (scrubbers are headered to 4 fans with 4 stacks)
Future ‐ TBD 0.001% 544 2345
0.006 0.004 0.017 0.000013 0.000057 0.004 0.017 0.00001 0.00006
EU4Ronler Acres
D1X Abatement EXSC‐PSSS D1XM3‐SC134‐2‐00
D1XM3133‐3, D1XM3133‐4, D1XM3133‐5, D1XM3133‐6 (scrubbers are headered to 4 fans with 4 stacks)
Future ‐ TBD 0.001% 544 2345
0.006 0.004 0.017 0.000013 0.000057 0.004 0.017 0.00001 0.00006
EU4Ronler Acres
D1X Abatement EXSC‐PSSS D1XM3‐SC134‐3‐00
D1XM3133‐3, D1XM3133‐4, D1XM3133‐5, D1XM3133‐6 (scrubbers are headered to 4 fans with 4 stacks)
Future ‐ TBD 0.001% 544 2345
0.006 0.004 0.017 0.000013 0.000057 0.004 0.017 0.00001 0.00006
EU4Ronler Acres
D1X Abatement EXSC‐PSSS D1XM3‐SC134‐4‐00
D1XM3133‐3, D1XM3133‐4, D1XM3133‐5, D1XM3133‐6 (scrubbers are headered to 4 fans with 4 stacks)
Future ‐ TBD 0.001% 544 2345
0.006 0.004 0.017 0.000013 0.000057 0.004 0.017 0.00001 0.00006
EU4Ronler Acres
PUB1Abatement EXSC‐PUB PUB1‐SC133‐1‐00
PUB133‐1PUB133‐2PUB133‐3
May‐12 0.001% 272 2345
0 0 0 0 0 0 0 0 0 0 0 0 0.008 0.035 0 0 0 0 0 0 0.003 0.002 0.000006 0.000028 0.002 0.000 0.00001 0.00003 0 0 0 0
EU4Ronler Acres
PUB1Abatement EXSC‐PUB PUB1‐SC133‐2‐00
PUB133‐1PUB133‐2PUB133‐3
May‐12 0.001% 272 23450 0 0 0 0 0 0 0 0 0 0 0 0 0 0 0 0 0 0 0 0.003 0.002 0.000006 0.000028 0.002 0.000 0.00001 0.00003
EU4Ronler Acres
MSB‐1 Abatement EXSC‐C4 MSB‐SC133‐1 MSB133‐1 Future ‐ TBD 0.001% 1292 2345 0.013 0.058 0.12 0.51 0.0005 0.0022 0.0005 0.0022 0 0 0.89 3.90 0.77 3.37 0.0065 0.028 0.0065 0.028 0.0067 0.030 0.015 0.009 0.041 0.000031 0.00014 0.016 0.072 0.007 0.031 0.007 0.030 0.0000013 0.0000057
EU4Ronler Acres
MSB‐1 Abatement EXSC‐C4 MSB‐SC133‐2 MSB133‐2 Future ‐ TBD 0.001% 1292 2345 0.015 0.009 0.041 0.000031 0.00014 0.009 0.041 0.00003 0.00014
EU4Ronler Acres
MSB‐1 Abatement EXSC‐C4 MSB‐SC133‐3 MSB133‐3 Future ‐ TBD 0.001% 1292 2345 0.015 0.009 0.041 0.000031 0.00014 0.009 0.041 0.00003 0.00014
EU4Ronler Acres
MSB‐2 Abatement EXSC‐C4 MSB2‐SC133‐1 MSB2133‐1 Future ‐ TBD 0.001% 1292 2345 0.013 0.058 0.12 0.51 0.0005 0.0022 0.0005 0.0022 0 0 0.89 3.90 0.77 3.37 0.0065 0.028 0.0065 0.028 0.0067 0.030 0.015 0.009 0.041 0.000031 0.00014 0.016 0.050 0.00702 0.03077 0.0067 0.030 0.0000013 0.0000057
14_Manufacturing ‐ Scrubbers12/29/2014 Page 3 of 4

Table 5 ‐ Abatement System/Stack Allocated Emission Rates
PM ‐ Drift
Emission Unit
Site BuildingEquipment
TypeSystem
EquipmentTags
StackID
Install date mm/yy
Drift Loss %Recir. Flow Rate gpm
TDS ‐ ppm
lb/hr ton/yr lb/hr ton/yr lb/hr ton/yr lb/hr ton/yr lb/hr ton/yr lb/hr ton/yr lb/hr ton/yr lb/hr ton/yr lb/hr ton/yr lb/hr ton/yr lb/hr lb/hr ton/yr lb/hr ton/yr lb/hr ton/yr lb/hr ton/yr lb/hr ton/yr lb/hr ton/yr
Fluoride HF PM 10 ‐ Process PM 2.5‐ Process SO2 Process PM10 ‐ Drift PM2.5 ‐ Drift Loss Total PM10 Total PM2.5 Total SO2CO ‐ Process/POU NOx ‐Process/POU PM10 ‐ POU PM2.5 POU SO2 ‐ POU Lead ‐ POUEquipment Identification
EU4Ronler Acres
MSB‐2 Abatement EXSC‐C4 MSB2‐SC133‐2 MSB2133‐2 Future ‐ TBD 0.001% 1292 2345 0.015 0.009 0.041 0.000031 0.00014 0.009 0.041 0.00003 0.00014
EU4Ronler Acres
MSB‐2 Abatement EXSC‐C4 MSB2‐SC133‐3 MSB2133‐3 Future ‐ TBD 0.001% 1292 2345 0.015 0.009 0.041 0.000031 0.00014 0.009 0.041 0.00003 0.00014
EU4Ronler Acres
MSB‐3 Abatement EXSC‐C4 MSB3‐SC133‐1 MSB3133‐1 Future ‐ TBD 0.001% 1292 2345 0.013 0.058 0.12 0.51 0.0005 0.0022 0.0005 0.0022 0 0 0.89 3.90 0.77 3.37 0.0065 0.028 0.0065 0.028 0.0067 0.030 0.015 0.009 0.041 0.000031 0.00014 0.016 0.072 0.00702 0.03077 0.0067 0.0295 0.0000013 0.0000057
EU4Ronler Acres
MSB‐3 Abatement EXSC‐C4 MSB3‐SC133‐2 MSB3133‐2 Future ‐ TBD 0.001% 1292 2345 0.015 0.009 0.041 0.000031 0.00014 0.009 0.041 0.00003 0.00014
EU4Ronler Acres
MSB‐3 Abatement EXSC‐C4 MSB3‐SC133‐3 MSB3133‐3 Future ‐ TBD 0.001% 1292 2345 0.015 0.009 0.041 0.000031 0.00014 0.009 0.041 0.00003 0.00014
EU22Ronler Acres
MBR Abatement EXSC MBR‐SC133‐1 MBR133‐1 Future ‐ TBD 0.001% 272 2345 0 0 0 0 0 0 0 0 0 0 0 0 0 0 0 0 0 0 0 0 0.003 0.002 0.009 0.000006 0.000028 0.002 0.009 0.00001 0.00003 0 0 0 0
EU22Ronler Acres
MBR Abatement EXSC MBR‐SC133‐2 MBR133‐2 Future ‐ TBD 0.001% 272 2345 0 0 0 0 0 0 0 0 0 0 0 0 0 0 0 0 0 0 0 0 0.003 0.002 0.009 0.000006 0.000028 0.002 0.009 0.00001 0.00003 0 0 0 0
EU22Ronler Acres
MBR2 Abatement EXSC MBR2‐SC133‐1 MBR2‐133‐1 Future ‐ TBD 0.001% 272 2345 0 0 0 0 0 0 0 0 0 0 0 0 0 0 0 0 0 0 0 0 0.003 0.002 0.009 0.000006 0.000028 0.002 0.009 0.00001 0.00003 0 0 0 0
EU22Ronler Acres
MBR2 Abatement EXSC MBR2‐SC133‐2 MBR2‐133‐2 Future ‐ TBD 0.001% 272 2345 0 0 0 0 0 0 0 0 0 0 0 0 0 0 0 0 0 0 0 0 0.003 0.002 0.009 0.000006 0.000028 0.002 0.009 0.00001 0.00003 0 0 0 0
EU5 Aloha F15 Abatement EXSC‐C4 F15‐SC7‐1‐1 F15133‐1 Jan‐92 0.001% 816 2345 0.04 0.17 0.35 1.53 0.0015 0.0067 0.0015 0.0067 0 0 2.67 11.70 2.31 10.10 0.019 0.085 0.019 0.085 0.020 0.089 0.010 0.006 0.026 0.000019 0.000085 0.027 0.118 0.02100 0.09199 0.02023 0.08861 0.0000039 0.000017
EU5 Aloha F15 Abatement EXSC‐C4 F15‐SC7‐1‐2 F15133‐2 Jan‐92 0.001% 816 2345 0.010 0.006 0.026 0.000019 0.000085 0.006 0.026 0.00002 0.00009
EU5 Aloha F15 Abatement EXSC‐C4 F15‐SC7‐1‐3 F15133‐3 Jan‐92 0.001% 1156 2345 0.014 0.008 0.037 0.000028 0.000121 0.008 0.037 0.00003 0.00012
EU5 Aloha F15 Abatement EXSC‐C4 F15‐SC7‐1‐4 F15133‐4 Jan‐92 0.001% 1156 2345 0.014 0.008 0.037 0.000028 0.000121 0.008 0.037 0.00003 0.00012
EU5 Aloha F15 Abatement EXSC‐C4 F15‐SC7‐1‐5 F15133‐5 Jan‐92 0.001% 816 2345 0.010 0.006 0.026 0.000019 0.000085 0.006 0.026 0.00002 0.00009
EU5 Aloha F15 Abatement EXSC‐C4 F15‐SC7‐1‐6 F15133‐6 Jan‐92 0.001% 816 2345 0.010 0.006 0.026 0.000019 0.000085 0.006 0.026 0.00002 0.00009
EU5 Aloha F15 Abatement EXSC‐RODI F15‐SC7‐2‐12 F15133‐8 Jan‐92 0.001% 136 2345 0 0 0 0 0 0 0 0 0 0 0 0 0 0 0 0 0 0 0 0 0.002 0.001 0.004 0.000003 0.000014 0.001 0.004 0.000003 0.00001 0 0 0 0
EU5 Aloha F15 Abatement EXSC‐gas pad F15‐SC7‐1‐7 F15133‐7 Jan‐92 0.001% 394 2345 0 0 0 0 0 0 0 0 0 0 0 0 0 0 0 0 0 0 0 0 0.005 0.003 0.013 0.000009 0.000041 0.003 0.013 0.00001 0.00004 0 0 0 01.45 6.4 2.05 8.97 20.3 88.9 13.6 59.6 0.18 0.80 0.18 0.80 0.19 0.83 1.0 4.44 0.23 1.01 2.79 12.23 0.000033 0.00014
Note:Scrubber emissions of CO and NOx include both process activities and natural gas combustion byproducts from POU devices. The estimated contribution of CO and Nox from natural gas combustion is as follows:
CO from combustion 50%Nox from combustion 80%
Totals ‐ Scrubbers
14_Manufacturing ‐ Scrubbers12/29/2014 Page 4 of 4

Emissions Unit Summary ‐ All Values in Tons Per Year
Pollutant EU1 EU2 EU3 EU4 EU5 EU6 EU7 EU8 EU9 EU10 EU11 EU11a EU12 EU13 EU14 EU15 EU16 EU17 EU18 EU18a EU19 EU19a EU20 EU21 EU22 EU23 TotalsProposed PSEL
PM 12.0 0.085 3.6 12.8 2.3 0 0 0.40 0.027 0.31 0.19 0.11 0.013 0.12 0.026 0.21 0.11 0.046 0.10 0.046 0.30 0.43 0.20 0.085 0.14 3.53 37.2 38
PM10 11.1 0.053 3.3 11.4 2.2 0 0 0.40 0.027 0.31 0.19 0.11 0.013 0.12 0.026 0.21 0.11 0.046 0.10 0.046 0.30 0.43 0.20 0.085 0.12 0.95 31.8 32
PM2.5 10.6 0.00017 2.9 9.1 2.0 0 0 0.40 0.027 0.31 0.19 0.11 0.013 0.12 0.026 0.21 0.11 0.046 0.10 0.046 0.30 0.43 0.20 0.085 0.086 0.10 27.5 28
SO2 4.2 0 2.0 6.6 0.063 0 0 0.42 0.028 0.32 0.20 0.11 0.014 0.12 0.027 0.22 0.11 0.048 0.10 0.048 0.31 0.45 0.21 0.088 0.090 0 15.8 39
CO 34.9 1.2 23.1 39.6 23.3 0 0 6.0 0.40 4.6 2.8 1.6 0.20 1.7 0.39 3.1 1.6 0.69 1.5 0.69 4.4 6.4 3.0 1.3 1.3 0 163.9 164
Nox 11.5 0.060 16.1 43.9 4.4 0 0 1.8 0.40 1.4 0.83 0.46 0.33 2.10 0.64 0.93 0.46 0.68 0.43 0.20 1.30 1.9 0.89 3.40 0.38 0 94.4 95
VOC 178
Fluorides 1.6 0.0016 1.1 3.5 0.17 0 0 0 0 0 0 0 0 0 0 0 0 0 0 0 0 0 0 0 0 0 6.4 6.4
HF 2.3 0.10 0.87 4.1 1.5 0 0 0 0 0 0 0 0 0 0 0 0 0 0 0 0 0 0 0 0 0 8.97 9
HAP Aggr. 24
CO2e 819000
Lead 0.000062 0 0.000033 0.00030 0.000029 0 0 0.000081 0.0000054 0.000062 0.000038 0.000021 0.000003 0.000023 0.0000053 0.000042 0.000021 0.0000092 0.000020 0.0000092 0.000059 0.000086 0.000040 0.000017 0.000017 0 0.00098 n/a
H2S 0 0 0 0 0 0 0 0 0 0 0 0 0 0 0 0 0 0 0 0 0 0 0 0 0.56 0 0.56 n/a
Notes:Intel is not requesting a revised PSEL for VOC, Aggregate HAPs or CO2e. The PSELs proposed in the table are the same as those provided in th Title V Permit Application no. 26799
Emissions Unit Descriptions ‐ (RA) indicates Ronler Acres Campus, (A) indicates Aloha Campus
Emissions Unit ID
Device/Process
Emissions Unit ID
Device/Process
Emissions Unit ID
Device/Process
Fab 15 C4
EU6 (RA)
EU15 (RA) EU16 (RA)
EU9 (RA)
RA2 BoilersRA2‐MECH‐HW‐B01(BLR 115‐1‐300)RA2‐MECH‐HW‐B01(BLR 115‐1‐300)
EU7 (RA)
EU17 (RA)
EU1 (RA)
D1B, RA1 Office, RB1, D1C, RA2 Office, RCTOs, BSSW
EU2 (RA)
RP1
EU3 (RA)
D1D, TMXW, RCTOs
EU4 (RA)
D1X, RCTOs, RA4, MSB1, MSB2, MSB3
EU5 (RA)
AL3 Die Prep
EU8 (RA)
D1B Boilers F20‐BLR115‐1‐200 F20‐BLR115‐2‐200 F20‐BLR115‐3‐200 F20‐BLR115‐4‐200
AL4 Sort
D1D Boiler BLR‐115‐1‐210
D1D Boilers BLR‐115‐2‐210 BLR‐115‐3‐210
D1D Boiler BLR‐115‐4‐210
D1D Boiler BLR‐115‐5‐210
EU10 (RA) EU11 (RA) EU11a (RA) EU12 (RA) EU13 (RA) EU14 (RA)
D1C Boilers CUB2‐BLR115‐1‐210 CUB2‐BLR115‐2‐210 CUB2‐BLR115‐3‐210
D1C Boilers CUB2‐BLR115‐5‐210 CUB2‐BLR115‐6‐210
D1C Boiler CUB2‐BLR115‐4‐210
RP1 Boiler RP1‐BLR115‐1‐210
RP1 Boilers RP1‐BLR115‐2‐210 RP1‐BLR115‐3‐210 RP1‐BLR115‐4‐210
EU21 (A) EU22 (RA) EU23 (RA)(A)
D1X Boiler CUB4‐BLR115‐1‐10
D1X Boiler CUB4‐BLR115‐5‐10
D1X Boilers CUB4‐BLR115‐1‐10 CUB4‐BLR115‐2‐10 CUB4‐BLR115‐3‐10 CUB4‐BLR115‐4‐10
D1X Boilers CUB4‐BLR115‐6‐10 RAC5‐BLR115‐1 RAC5‐BLR115‐2 RAC5‐BLR115‐3 RAC5‐BLR115‐4
Fab 15 Boilers F15‐BLR28‐1‐1 F15‐BLR28‐1‐2 F15‐BLR28‐1‐3
Fab 5 Boilers F5‐HW‐BLR01 F5‐HW‐BLR02 F5‐HW‐BLR03 F5‐HW‐BLR04
MBR Boilers MBR‐BLR115‐1 MBR‐BLR115‐2 MBR2‐BLR115‐1 MBR2‐BLR115‐2MBR H2S Units
Unpaved Roads
EU18 (RA) EU18a (RA) EU19 (RA) EU19a (RA) EU20 (A)
15_Total_PSEL_by_EU12/29/2014 Page 1 of 1

This page intentionally left blank.

Appendix D Road Dust Calculation Methodology

This page intentionally left blank

Intel Corporation
Calculations of Particulate Matter from Paved and Unpaved Surfaces

Calculations of Particulate Matter from Paved and Unpaved Surfaces Page 2
TABLE OF CONTENTS
1 CALCULATION METHODOLOGY ......................................................................................... 3
2 CALCULATION OF PM10 EMISSIONS .................................................................................. 4
2.1 Unpaved Roads ................................................................................................................. 4 2.1.1 Distances ................................................................................................................ 4 2.1.2 Assumptions ........................................................................................................... 4 2.1.3 Equation .................................................................................................................. 5 2.1.4 Calculations ............................................................................................................ 5
2.2 Unpaved Roads on Gravel Parking Lots ........................................................................... 8 2.2.1 Distances ................................................................................................................ 8 2.2.2 Assumptions ........................................................................................................... 8 2.2.3 Equation .................................................................................................................. 8 2.2.4 Calculations ............................................................................................................ 9
2.3 Paved Roads on Parking lot areas .................................................................................. 12 2.3.1 Distances .............................................................................................................. 12 2.3.2 Assumptions ......................................................................................................... 12 2.3.3 Equation ................................................................................................................ 12 2.3.4 Calculation ............................................................................................................ 13
2.4 Paved Roads on Manufacturing Areas ........................................................................... 16 2.4.1 Distances .............................................................................................................. 16 2.4.2 Assumptions ......................................................................................................... 16 2.4.3 Equation ................................................................................................................ 16 2.4.4 Calculation ............................................................................................................ 17

Calculations of Particulate Matter from Paved and Unpaved Surfaces Page 3
1 CALCULATION METHODOLOGY
Emission calculations are divided into four sections: Unpaved roads, Unpaved parking lots, Paved parking lot areas, and Paved roads throughout the manufacturing area. Total PM (PM30), PM10, and PM2.5 emissions from the unpaved roads are calculated based on AP 42, Chapter 13, Section 13.2.2. Total PM (PM30), PM10, and PM2.5 emissions from paved areas are calculated based on AP 42, Chapter 13, and Section 13.2.1. The Intel Aloha campus only contains multiple parking lots that surround the Aloha campus. Therefore only paved parking areas will be assessed for the Aloha campus. These emissions will be added into the Ronler and Aloha total. Calculations used distances based on December 2014 Google Earth images and corresponding distance scale of the Intel Ronler Acres site.
Fig.1 Intel Corporation, Ronler Acres Image. Courtesy: Google Earth.

Calculations of Particulate Matter from Paved and Unpaved Surfaces Page 4
Figure 2: Intel Corporation, Aloha Campus Image. Courtesy of Google Earth.
2 CALCULATION OF PM10 EMISSIONS
2.1 Unpaved Roads The unpaved roads on the Ronler Acres campus include pathways and roadways around the D1X construction site. This area is located on the southeastern section of the Ronler Acres property.
2.1.1 Distances The total length of unpaved roads on campus is calculated to be approximately 2 miles.
2.1.2 Assumptions The average number of days with 0.01” or more of precipitation annually used within the calculations is 180 based on Figure 13.2.2-1 within AP-42, Section 13.2.2 dated November 2006. The silt content of the unpaved roads is assigned to equal 6.4% as identified within Table 6-2 of the WRAP Fugitive Dust Handbook dated September 7, 2006 for gravel unpaved roads. It is assumed that a total of 100 vehicles are in operation on the unpaved roadways on the campus. Each vehicle travels approximately 0.25 miles per day. Thus the total VMT (Vehicle Miles Travelled) per year is calculated to be 9,125 miles. The weight per vehicle is assumed to be 2.4 tons based on the information from Section 13.2.2-6 of Chapter 13 in AP 42 as 99 percent of traffic on the campus are 2 ton cars/trucks while the remaining 1 percent consists of 20 ton trucks. The Ronler Acres site has posted and enforced speed limits on roads within the facility. The enforced speed limit is 10 miles per hour. As per WRAP Fugitive Dust Handbook, a linear relationship between emissions of PM and vehicle speed and an uncontrolled speed of 45 mph. Therefore, the control efficiency is calculated to be 78% [1 – 10mph/45mph].

Calculations of Particulate Matter from Paved and Unpaved Surfaces Page 5
2.1.3 Equation The equation to calculate E (lb/VMT) for unpaved industrial roads is taken from section 13.2.2-4 of Chapter 13 in AP 42. E = k (s/12) a (W/3) b
Where: k, a, and b are empirical constants from Table 13.2.2-2 Chapter 13 of AP- 42 E = size-specific emission factor (lb/VMT) s = surface material silt content (%) W = mean vehicle weight (tons)
Eext = E [(365-P)/365] Where:
Eext = annual size-specific EF extrapolated for natural mitigation, lb/VMT E = emission factor in lb/VMT P = number of days in a year with at least 0.254 mm (0.01 in) of precipitation
2.1.4 Calculations Total Suspended Particulate Matter (TSP/PM/PM30): Calculation of Emission Factor - E = k (s/12)a(W/3)b Where:
k = 4.9 for PM30 based on Table 13.2.2-2 of Chapter 13 in AP-42 a = 0.7 for PM30 based on Table 13.2.2-2 of Chapter 13 in AP-42 b = 0.45 for PM30 based on Table 13.2.2-2 of Chapter 13 in AP-42 s = 6.4% based on Table 6.2 of WRAP Fugitive Dust Handbook W = 2.4 Tons based on Section 13.2.2-6 of Chapter 13 in AP-42.
E = 4.9*(6.4/12)0.7(2.4/3)0.45 E = 2.8542 lb/VMT
Calculation of Extrapolated Emission Factor based on precipitation - Eext = E [(365-P)/365] Where:
E = 2.8542 lb/VMT based on calculation above P = 180 days based on Figure 13.2.2-1 of Chapter 13 in AP-42.
Eext = 2.8542 [(365-180)/365] Eext = 1.4467 lb/VMT
Calculation of Emission Factor with Control Efficiency based on speed restriction
E = CE x Eext Based on a linear relationship between emissions of PM to the controlled speed limit of
10 miles per hour (mph) and an uncontrolled speed limit of 45 mph based on WRAP Fugitive Dust Handbook [1.0 – 10mph/45mph = 0.78 or 78% control].
E = (1-78%) of Eext E = (1-78%) x 1.4467 lb/VMT E = 0.3215 lb/VMT
Calculation of PM based on Emission Factor
PM in tons per year (TPY) = [E x VMT]/2000 E = 0.3215 lb/VMT based on calculations above VMT/year = 9,125 miles based on assumptions above PM = [0.3215 x 9,125]/2000 PM = 1.47 TPY Thus, the estimated annual PM emissions from vehicle traffic on the unpaved roads at the Ronler Acres Site is calculated to be 1.47 TPY

Calculations of Particulate Matter from Paved and Unpaved Surfaces Page 6
PM10: Calculation of Emission Factor - E = k (s/12)a(W/3)b Where:
k = 1.5 for PM10 based on Table 13.2.2-2 of Chapter 13 in AP-42 a = 0.9 for PM10 based on Table 13.2.2-2 of Chapter 13 in AP-42 b = 0.45 for PM10 based on Table 13.2.2-2 of Chapter 13 in AP-42 s = 6.4% based on Table 6.2 of WRAP Fugitive Dust Handbook W = 2.4 Tons based on Section 13.2.2-6 of Chapter 13 in AP-42.
E = 1.5*(6.4/12)0.9(2.4/3)0.45 E = 0.7705 lb/VMT
Calculation of Extrapolated Emission Factor based on precipitation - Eext = E [(365-P)/365] Where:
E = 0.7705 lb/VMT based on calculation above P = 180 days based on Figure 13.2.2-1 of Chapter 13 in AP-42.
Eext = 0.7705 [(365-180)/365] Eext = 0.3905 lb/VMT
Calculation of Emission Factor with Control Efficiency based on speed restriction
E = CE x Eext Based on a linear relationship between emissions of PM to the controlled speed limit of
10 miles per hour (mph) and an uncontrolled speed limit of 45 mph based on WRAP Fugitive Dust Handbook [1.0 – 10mph/45mph = 0.78 or 78% control].
E = (1-78%) of Eext E = (1-78%) x 0.3905 lb/VMT E = 0.0868 lb/VMT
Calculation of PM10 based on Emission Factor
PM10 in tons per year (TPY) = [E x VMT]/2000 E = 0.0868 lb/VMT based on calculations above VMT/year = 9,125 miles based on assumptions above PM10 = [0.0868 x 9,125]/2000 PM10 = 0.40 TPY Thus, the estimated annual PM10 emissions from vehicle traffic on the unpaved roads at the Ronler Acres Site is calculated to be 0.40 TPY

Calculations of Particulate Matter from Paved and Unpaved Surfaces Page 7
PM2.5: Calculation of Emission Factor - E = k (s/12)a(W/3)b Where:
k = 0.15 for PM2.5 based on Table 13.2.2-2 of Chapter 13 in AP-42 a = 0.9 for PM2.5 based on Table 13.2.2-2 of Chapter 13 in AP-42 b = 0.45 for PM2.5 based on Table 13.2.2-2 of Chapter 13 in AP-42 s = 6.4% based on Table 6.2 of WRAP Fugitive Dust Handbook W = 2.4 Tons based on Section 13.2.2-6 of Chapter 13 in AP-42.
E = 0.15*(6.4/12)0.9(2.4/3)0.45 E = 0.0771 lb/VMT
Calculation of Extrapolated Emission Factor based on precipitation - Eext = E [(365-P)/365] Where:
E = 0.0771 lb/VMT based on calculation above P = 180 days based on Figure 13.2.2-1 of Chapter 13 in AP-42.
Eext = 0.0771 [(365-180)/365] Eext = 0.0391 lb/VMT
Calculation of Emission Factor with Control Efficiency based on speed restriction
E = CE x Eext Based on a linear relationship between emissions of PM to the controlled speed limit of
10 miles per hour (mph) and an uncontrolled speed limit of 45 mph based on WRAP Fugitive Dust Handbook [1.0 – 10mph/45mph = 0.78 or 78% control].
E = (1-78%) of Eext E = (1-78%) x 0.0391 lb/VMT E = 0.0087 lb/VMT
Calculation of PM10 based on Emission Factor
PM2.5 in tons per year (TPY) = [E x VMT]/2000 E = 0.0087 lb/VMT based on calculations above VMT/year = 9,125 miles based on assumptions above PM2.5 = [0.0087 x 9,125]/2000 PM2.5 = 0.04 TPY Thus, the estimated annual PM2.5 emissions from vehicle traffic on the unpaved roads at the Ronler Acres Site is calculated to be 0.04 TPY

Calculations of Particulate Matter from Paved and Unpaved Surfaces Page 8
2.2 Unpaved Roads on Gravel Parking Lots The Ronler Acres Campus has two gravel parking lots primarily used by trades to support the construction of the D1X facility. One lot is located on the northwest section of the property and the other is located at the southeastern section of the property across NW 229th Avenue.
2.2.1 Distances The total number of unpaved parking spots on the campus is 2,447. It is assumed that a total of 2,447 vehicles use the parking lot on the campus on a daily basis. A vehicle would travel approximately 0.01 miles twice a day (to and from) if it were to travel off of the paved road into the gravel lot to a parking spot. Thus the total VMT per year is calculated to be 17,422 miles.
2.2.2 Assumptions The average number of days with 0.01” or more of precipitation annually used within the calculations is 180 based on Figure 13.2.2-1 within AP-42, Section 13.2.2 dated November 2006. The silt content of the unpaved roads is assigned to equal 6.4% as identified within Table 6-2 of the WRAP Fugitive Dust Handbook dated September 7, 2006 for gravel unpaved roads. The weight per vehicle is assumed to be 2.4 tons based on the information from Section 13.2.2-6 of Chapter 13 in AP 42 as 99 percent of traffic on the campus are 2 ton cars/trucks while the remaining 1 percent consists of 20 ton trucks. Dust suppressant application to the unpaved parking areas occurs on an annual basis. As per WRAP Fugitive Dust Handbook, an appropriate control efficiency to represent this activity is 84%.
2.2.3 Equation The equation to calculate E (lb/VMT) for unpaved industrial roads is taken from section 13.2.2-4 of Chapter 13 in AP 42. E = k (s/12) a (W/3) b
Where: k, a, and b are empirical constants from Table 13.2.2-2 Chapter 13 of AP- 42 E = size-specific emission factor (lb/VMT) s = surface material silt content (%) W = mean vehicle weight (tons)
Eext = E [(365-P)/365] Where:
Eext = annual size-specific EF extrapolated for natural mitigation, lb/VMT E = emission factor in lb/VMT P = number of days in a year with at least 0.254 mm (0.01 in) of precipitation

Calculations of Particulate Matter from Paved and Unpaved Surfaces Page 9
2.2.4 Calculations Total Suspended Particulate Matter (TSP/PM/PM30): Calculation of Emission Factor - E = k (s/12)a(W/3)b Where:
k = 4.9 for PM30 based on Table 13.2.2-2 of Chapter 13 in AP-42 a = 0.7 for PM30 based on Table 13.2.2-2 of Chapter 13 in AP-42 b = 0.45 for PM30 based on Table 13.2.2-2 of Chapter 13 in AP-42 s = 6.4% based on Table 6.2 of WRAP Fugitive Dust Handbook W = 2.4 Tons based on Section 13.2.2-6 of Chapter 13 in AP-42.
E = 4.9*(6.4/12)0.7(2.4/3)0.45 E = 2.8542 lb/VMT
Calculation of Extrapolated Emission Factor based on precipitation - Eext = E [(365-P)/365] Where:
E = 2.8542 lb/VMT based on calculation above P = 180 days based on Figure 13.2.2-1 of Chapter 13 in AP-42.
Eext = 2.8542 [(365-180)/365] Eext = 1.4467 lb/VMT
Calculation of Emission Factor with Control Efficiency based on annual dust suppressant application
E = (1-CE) x Eext E = (1-84%) of Eext E = (1-84%) x 1.4467 lb/VMT E = 0.2315 lb/VMT
Calculation of PM based on Emission Factor
PM in tons per year (TPY) = [E x VMT]/2000 E = 0.2315 lb/VMT based on calculations above VMT/year = 17,863 miles based on assumptions above PM = [0.3215 x 17,863]/2000 PM = 2.07 TPY Thus, the estimated annual PM emissions from vehicle traffic on the unpaved parking lots at the Ronler Acres Site is calculated to be 2.07 TPY

Calculations of Particulate Matter from Paved and Unpaved Surfaces Page 10
PM10: Calculation of Emission Factor - E = k (s/12)a(W/3)b Where:
k = 1.5 for PM10 based on Table 13.2.2-2 of Chapter 13 in AP-42 a = 0.9 for PM10 based on Table 13.2.2-2 of Chapter 13 in AP-42 b = 0.45 for PM10 based on Table 13.2.2-2 of Chapter 13 in AP-42 s = 6.4% based on Table 6.2 of WRAP Fugitive Dust Handbook W = 2.4 Tons based on Section 13.2.2-6 of Chapter 13 in AP-42.
E = 1.5*(6.4/12)0.9(2.4/3)0.45 E = 0.7705 lb/VMT
Calculation of Extrapolated Emission Factor based on precipitation - Eext = E [(365-P)/365] Where:
E = 0.7705 lb/VMT based on calculation above P = 180 days based on Figure 13.2.2-1 of Chapter 13 in AP-42.
Eext = 0.7705 [(365-180)/365] Eext = 0.3905 lb/VMT
Calculation of Emission Factor with Control Efficiency based on annual dust suppressant application
E = (1-CE) x Eext E = (1-84%) of Eext E = (1-84%) x 0.3905 lb/VMT E = 0.0625 lb/VMT
Calculation of PM10 based on Emission Factor
PM10 in tons per year (TPY) = [E x VMT]/2000 E = 0.0625 lb/VMT based on calculations above VMT/year = 17,863 miles based on assumptions above PM10 = [0.0625 x 17,863]/2000 PM = 0.56 TPY Thus, the estimated annual PM10 emissions from vehicle traffic on the unpaved parking lots at the Ronler Acres Site is calculated to be 0.56 TPY

Calculations of Particulate Matter from Paved and Unpaved Surfaces Page 11
PM2.5: Calculation of Emission Factor - E = k (s/12)a(W/3)b Where:
k = 0.15 for PM2.5 based on Table 13.2.2-2 of Chapter 13 in AP-42 a = 0.9 for PM2.5 based on Table 13.2.2-2 of Chapter 13 in AP-42 b = 0.45 for PM2.5 based on Table 13.2.2-2 of Chapter 13 in AP-42 s = 6.4% based on Table 6.2 of WRAP Fugitive Dust Handbook W = 2.4 Tons based on Section 13.2.2-6 of Chapter 13 in AP-42.
E = 0.15*(6.4/12)0.9(2.4/3)0.45 E = 0.0771 lb/VMT
Calculation of Extrapolated Emission Factor based on precipitation - Eext = E [(365-P)/365] Where:
E = 0.0771 lb/VMT based on calculation above P = 180 days based on Figure 13.2.2-1 of Chapter 13 in AP-42.
Eext = 0.0771 [(365-180)/365] Eext = 0.0391 lb/VMT
Calculation of Emission Factor with Control Efficiency based on annual dust suppressant application
E = (1-CE) x Eext E = (1-84%) of Eext E = (1-84%) x 0.0391 lb/VMT E = 0.0062 lb/VMT
Calculation of PM10 based on Emission Factor
PM2.5 in tons per year (TPY) = [E x VMT]/2000 E = 0.0062 lb/VMT based on calculations above VMT/year = 17,863 miles based on assumptions above PM10 = [0.0062 x 17,863]/2000 PM = 0.06 TPY Thus, the estimated annual PM2.5 emissions from vehicle traffic on the unpaved parking lots at the Ronler Acres Site is calculated to be 0.06 TPY

Calculations of Particulate Matter from Paved and Unpaved Surfaces Page 12
2.3 Paved Roads on Parking lot areas Paved parking lot areas are located on the Ronler Acres Campus in front of the RA1, RA2, and RA3 buildings. Additional parking is over by the RS5 and RS6 facilities. Two parking structures have been added to the facility. There are approximately 18,178 paved parking spaces at the campus. At the Intel Aloha Campus there are parking lots that surround the outer perimeter of the campus. There are approximately 2,656 parking spaces located at the campus.
2.3.1 Distances The total length of paved parking lot roads on the Ronler Acres campus is calculated to be 1.52 miles. The total length of paved parking lot roads at the Aloha campus is calculated to be .45 miles.
2.3.2 Assumptions The average number of days with 0.01” or more of precipitation annually used within the calculations is 180 based on Figure 13.2.2-1 within AP-42, Section 13.2.2 dated November 2006. The silt content of the paved roads is assigned to equal 0.03 g/m2 for >10,000 ADT (Average Daily Traffic) based on Table 13.2.1-2 as identified within Chapter 13.2.1 of AP-42. The total number of paved parking spots on the Ronler Acres campus is 18,178. It is assumed that a total of 18,178 vehicles use the parking lot on the campus on a daily basis. A vehicle would travel approximately 0.4 miles twice a day (to and from) if it were to travel between the entry gate and a parking spot closest to the building. Thus the total VMT per year is calculated to be 5,307,976 miles. The total number of paved parking spots on the Aloha campus is 2,656. It is assumed that a total of 2,656 vehicles use the parking lot on the campus on a daily basis. A vehicle would travel approximately 0.2 miles twice a day (to and from) if it were to travel between the entry gate and a parking spot closest to the building. Thus the total VMT per year is calculated to be 387,776 miles.
The weight per vehicle is assumed to be 2.4 Tons based on the information from Section 13.2.1.3 of Chapter 13 in AP 42 as 99 percent of traffic on the road are 2 ton cars/trucks while the remaining 1 percent consists of 20 ton trucks.
2.3.3 Equation The equation to calculate E (lb/VMT) for paved roads is taken from section 13.2.1 of Chapter 13 in AP-42. The annual natural control due to precipitation is used in lieu of the daily or hourly natural control. Eext = [k(sL)0.91 (W)1.02] (1-P/N)
Where: k is an empirical constants from Table 13.2.1-1 Chapter 13 of AP-42 E = size-specific emission factor (lb/VMT) sL = surface material silt loading (g/m2) W = mean vehicle weight (tons) P = number of days in a year with at least 0.254 mm (0.01 in) of precipitation N = number of days in the averaging period (365 for annual)

Calculations of Particulate Matter from Paved and Unpaved Surfaces Page 13
2.3.4 Calculation Total Suspended Particulate Matter (TSP/PM/PM30): Calculation of Emission Factor - Eext = [k (sL)0.91(W)1.02] (1-P/N) Where:
k = 0.011 for PM30 based on Table 13.2.1-1 of Chapter 13 in AP-42 sL = 0.03 g/m2 based on Table 13.2.1-2 of Chapter 13 in AP-42 W = 2.4 Tons based on Section 13.2.1 of Chapter 13 in AP-42 P = 180 days based on Figure 13.2.1-2 of Chapter 13 in AP-42 N = 365 days
E = [0.011*(0.03)0.91(2.4)1.02]*(1-180/365) E = 0.00056 lb/VMT
Calculation of PM based on Emission Factor
PM in tons per year (TPY) = [E x VMT]/2000 Ronler Acres E = 0.00056 lb/VMT based on calculations above VMT/year = 5,307,976 miles based on assumptions above PM = [0.00056 x 5,307,976]/2000 PM = 1.49 TPY Thus, the estimated annual PM emissions from vehicle traffic on the paved parking lots at the Ronler Acres Site is calculated to be 1.49 TPY Aloha E = 0.00056 lb/VMT based on calculations above VMT/year = 387,776 miles based on assumptions above PM = [0.00056 x 387,776]/2000 PM = 0.11 TPY Thus, the estimated annual PM emissions from vehicle traffic on the paved parking lots at the Aloha Site is calculated to be 0.11 TPY

Calculations of Particulate Matter from Paved and Unpaved Surfaces Page 14
PM10: Calculation of Emission Factor - Eext = [k (sL)0.91(W)1.02] (1-P/N) Where:
k = 0.0022 for PM10 based on Table 13.2.1-1 of Chapter 13 in AP-42 sL = 0.03 g/m2 based on Table 13.2.1-2 of Chapter 13 in AP-42 W = 2.4 Tons based on Section 13.2.1 of Chapter 13 in AP-42 P = 180 days based on Figure 13.2.1-2 of Chapter 13 in AP-42 N = 365 days
E = [0.0022*(0.03)0.91(2.4)1.02]*(1-180/365) E = 0.00011 lb/VMT
Calculation of PM10 based on Emission Factor
PM in tons per year (TPY) = [E x VMT]/2000 Ronler Acres E = 0.00011 lb/VMT based on calculations above VMT/year = 5,307,976 miles based on assumptions above PM10 = [0.00011 x 5,307,976]/2000 PM10 = 0.30 TPY Thus, the estimated annual PM10 emissions from vehicle traffic on the paved parking lots at the Ronler Acres Site is calculated to be 0.30 TPY Aloha E = 0.00011 lb/VMT based on calculations above VMT/year = 387,776 miles based on assumptions above PM10 = [0.00011 x 387,776]/2000 PM10 = 0.02 TPY Thus, the estimated annual PM10 emissions from vehicle traffic on the paved parking lots at the Aloha Site is calculated to be 0.02 TPY

Calculations of Particulate Matter from Paved and Unpaved Surfaces Page 15
PM2.5: Calculation of Emission Factor - Eext = [k (sL)0.91(W)1.02] (1-P/N) Where:
k = 0.00054 for PM10 based on Table 13.2.1-1 of Chapter 13 in AP-42 sL = 0.03 g/m2 based on Table 13.2.1-2 of Chapter 13 in AP-42 W = 2.4 Tons based on Section 13.2.1 of Chapter 13 in AP-42 P = 180 days based on Figure 13.2.1-2 of Chapter 13 in AP-42 N = 365 days
E = [0.00054*(0.03)0.91(2.4)1.02]*(1-180/365) E = 0.00003 lb/VMT
Calculation of PM10 based on Emission Factor
PM in tons per year (TPY) = [E x VMT]/2000 Ronler Acres E = 0.00003 lb/VMT based on calculations above VMT/year = 5,307,976 miles based on assumptions above PM10 = [0.00003 x 5,307,976]/2000 PM10 = 0.07 TPY Thus, the estimated annual PM2.5 emissions from vehicle traffic on the paved parking lots at the Ronler Acres Site is calculated to be 0.07 TPY
Aloha E = 0.00003 lb/VMT based on calculations above VMT/year = 387,776 miles based on assumptions above PM10 = [0.00003 x 387,776]/2000 PM10 = 0.01 TPY Thus, the estimated annual PM2.5 emissions from vehicle traffic on the paved parking lots at the Aloha Site is calculated to be 0.01 TPY

Calculations of Particulate Matter from Paved and Unpaved Surfaces Page 16
2.4 Paved Roads on Manufacturing Areas Paved roads are located throughout the campus for vehicle traffic between office buildings, Fabs and associated service buildings.
2.4.1 Distances The total length of paved manufacturing area roads on campus is calculated to be 5.43 miles
2.4.2 Assumptions The average number of days with 0.01” or more of precipitation annually used within the calculations is 180 based on Figure 13.2.2-1 within AP-42, Section 13.2.2 dated November 2006. The silt content of the paved roads is assigned to equal 0.03 g/m2 for >10,000 ADT (Average Daily Traffic) based on Table 13.2.1-2 as identified within Chapter 13.2.1 of AP-42. The total number of vehicles used for transportation of personnel and materials between buildings on campus is assumed to be 75. On average, each vehicle travels approximately 365 miles per year. Additionally, the Ronler Acres Campus utilizes a shuttle service to transport personnel between various buildings on the campus. This service consists of four vehicles that travel a route of approximately 1.89 miles every 15 minutes. Thus the total VMT per year is calculated to be 181901.4 miles. The weight per vehicle is assumed to be 4.5 Tons due to the Intel shuttle vehicles used to transport people around the Ronler Acres Campus.
2.4.3 Equation The equation to calculate E (lb/VMT) for paved roads is taken from section 13.2.1 of Chapter 13 in AP-42. The annual natural control due to precipitation is used in lieu of the daily or hourly natural control. Eext = [k(sL)0.91 (W)1.02] (1-P/N)
Where: k is an empirical constants from Table 13.2.1-1 Chapter 13 of AP-42 E = size-specific emission factor (lb/VMT) sL = surface material silt loading (g/m2) W = mean vehicle weight (tons) P = number of days in a year with at least 0.254 mm (0.01 in) of precipitation N = number of days in the averaging period (365 for annual)

Calculations of Particulate Matter from Paved and Unpaved Surfaces Page 17
2.4.4 Calculation Total Suspended Particulate Matter (TSP/PM/PM30): Calculation of Emission Factor - Eext = [k (sL)0.91(W)1.02] (1-P/N) Where:
k = 0.011 for PM30 based on Table 13.2.1-1 of Chapter 13 in AP-42 sL = 0.03 g/m2 based on Table 13.2.1-2 of Chapter 13 in AP-42 W = 4.5 Tons based on Section 13.2.1 of Chapter 13 in AP-42 P = 180 days based on Figure 13.2.1-2 of Chapter 13 in AP-42 N = 365 days
E = [0.011*(0.03)0.91(4.5)1.02]*(1-180/365) E = 0.0011 lb/VMT
Calculation of PM based on Emission Factor
PM in tons per year (TPY) = [E x VMT]/2000 E = 0.0011 lb/VMT based on calculations above VMT/year = 181,901.4 miles based on assumptions above PM = [0.0011 x 181,901.4]/2000 PM = 0.097 TPY Thus, the estimated annual PM emissions from vehicle traffic on the paved roads on the Ronler Acres Site is calculated to be 0.097 TPY PM10: Calculation of Emission Factor - Eext = [k (sL)0.91(W)1.02] (1-P/N) Where:
k = 0.0022 for PM10 based on Table 13.2.1-1 of Chapter 13 in AP-42 sL = 0.03 g/m2 based on Table 13.2.1-2 of Chapter 13 in AP-42 W = 4.5 Tons based on Section 13.2.1 of Chapter 13 in AP-42 P = 180 days based on Figure 13.2.1-2 of Chapter 13 in AP-42 N = 365 days
E = [0.0022*(0.03)0.91(4.5)1.02]*(1-180/365) E = 0.0002 lb/VMT
Calculation of PM based on Emission Factor
PM in tons per year (TPY) = [E x VMT]/2000 E = 0.0002 lb/VMT based on calculations above VMT/year = 181,901.4 miles based on assumptions above PM10 = [0.0002 x 181,901.4]/2000 PM10 = 0.019 TPY Thus, the estimated annual PM10 emissions from vehicle traffic on the paved roads on the Ronler Acres Site is calculated to be 0.097 TPY

Calculations of Particulate Matter from Paved and Unpaved Surfaces Page 18
PM2.5: Calculation of Emission Factor - Eext = [k (sL)0.91(W)1.02] (1-P/N) Where:
k = 0.00054 for PM2.5 based on Table 13.2.1-1 of Chapter 13 in AP-42 sL = 0.03 g/m2 based on Table 13.2.1-2 of Chapter 13 in AP-42 W = 4.5 Tons based on Section 13.2.1 of Chapter 13 in AP-42 P = 180 days based on Figure 13.2.1-2 of Chapter 13 in AP-42 N = 365 days
E = [0.00054*(0.03)0.91(4.5)1.02]*(1-180/365) E = 0.0001 lb/VMT
Calculation of PM based on Emission Factor
PM in tons per year (TPY) = [E x VMT]/2000 E = 0.0001 lb/VMT based on calculations above VMT/year = 181,901.4 miles based on assumptions above PM2.5 = [0.0001 x 181,901.4]/2000 PM2.5 = 0.005 TPY Thus, the estimated annual PM2.5 emissions from vehicle traffic on the paved roads on the Ronler Acres Site is calculated to be 0.097 TPY

Appendix E BACT Cost Estimate and Calculation Data Sheets

This page intentionally left blank

Packed Bed Wet Scrubber System380,000 acfm Reference
DIRECT COSTSPurchased Equipment Cost (PEC) = 11,296,999$ HEE Environmental EngineeringInterconnecting ducting, control panelsinstrumentation panels, pumps, fans
Direct installation costs (DIC)Foundations & Supports 0.12(PEC) 1,355,640$ CCM Sect. 5.2, Ch. 1a
Handling and erection 0.40(PEC) 4,518,799$ CCM Sect. 5.2, Ch. 1Electrical 0.01(PEC) 112,970$ CCM Sect. 5.2, Ch. 1Piping 0.30(PEC) 3,389,100$ CCM Sect. 5.2, Ch. 1Insulation 0.01(PEC) 112,970$ CCM Sect. 5.2, Ch. 1Painting 0.01(PEC) 112,970$ CCM Sect. 5.2, Ch. 1
Site Preparation 0.01(PEC) 112,970$ EstimateBuildings ‐$ Not Required
TOTAL DIRECT COSTS (DC = PEC+DIC) = 21,012,417$ Calculated Total
INDIRECT COSTSIndirect Costs (installation)Engineering 0.10(PEC) 1,129,700$ CCM Sect. 5.2, Ch. 1a
Construction and field expenses 0.10(PEC) 1,129,700$ CCM Sect. 5.2, Ch. 1Contractor fees 0.10(PEC) 1,129,700$ CCM Sect. 5.2, Ch. 1Start‐up 0.01(PEC) 112,970$ CCM Sect. 5.2, Ch. 1Performance test 0.01(PEC) 112,970$ CCM Sect. 5.2, Ch. 1Contingencies 0.03(PEC) 338,910$ CCM Sect. 5.2, Ch. 1
TOTAL INDIRECT COSTS (IC) = 3,953,950$ Calculated Total
TOTAL CAPITAL INVESTMENT (TCI) (DC) + (IC) = 24,966,367$ Calculated Total
ANNUAL COSTSDirect Annual Costs, DACOperating LaborOperator 1/2 hr/shift @ $20/hr = 10,950$ CCM Sect. 5.2, Ch. 1Supervisor 15% of operator = 1,643$ CCM Sect. 5.2, Ch. 1
Operating MaterialsSolvent (water) $0.0037/gal & 8 gpm blowdown 15,558$ EstimateChemicals Not Estimated
Wastewater Disposal $0.0039/gal & 8 gpm blowdown = 16,399$ EstimateMaintenanceLabor 1/2 hr/shift @ $20/hr = 10,950$ CCM Sect. 5.2, Ch. 1Material 100% of maintenance labor = 10,950$ CCM Sect. 5.2, Ch. 1
Electricity Not Estimated
TOTAL DIRECT ANNUAL COSTS (DAC) = 66,449$ Calculated Total
Indirect Annual Costs, IACOverhead 60% of total labor & material 20,696$ CCM Sect. 5.2, Ch. 1Administrative Charges 0.02(TCI) 499,327$ CCM Sect. 5.2, Ch. 1Property Tax 0.01(TCI) 249,664$ CCM Sect. 5.2, Ch. 1Insurance 0.01(TCI) 249,664$ CCM Sect. 5.2, Ch. 1Capital recoveryb 0.1098(TCI) 2,741,307$ CCM Sect. 5.2, Ch. 1
TOTAL INDIRECT ANNUAL COSTS (IAC) = 3,760,657$ Calculated Total
TOTAL ANNUAL COSTS (TAC) (DAC) + (IAC) = 3,827,106$ Calculated Total
TOTAL TONS REMOVED PER YEAR (NOx) = 4.74 Based on NOx Removal CalculationC
COST EFFECTIVENESS ($ per ton of pollutant removed) = 806,804$ Calculated
Intel ‐ BACTCost Effectiveness Evaluation
Packed Bed Wet Scrubber for NOx Control
Notes:
a CCM Sect. 5.2, Ch. 1 = EPA Air Pollution Control Cost Manual - Sixth Edition (EPA 452/B-02-001). Section 5.2 Chapter 1 includes cost estimation concepts and methodology for Wet Scrubbers for Acid Gas.bCapital recovery assumes a 15-year life at 7%.cNOx removal based on a loading rate of 1.14 lb/hr or 4.74 tpy @ 95% DRE
12/29/2014 Page 1 of 7

Dual CatalystNox
Dual CatalystCO Reference
DIRECT COSTSCost of SCR/Catox System = 132,000$ 88,000$ Nationwide Boiler Incorporated
TOTAL DIRECT COSTS (TDC) = ‐$ 132,000$ 88,000$ Calculated Total=
INDIRECT COSTSGeneral Facilities, engineering, construction fees 0.20(TDC) = ‐$ 26,400$ 17,600$ CCMTOTAL INDIRECT COSTS (TIC) = ‐$ 26,400$ 17,600$ Calculated Total
TOTAL DIRECT AND INDIRECT COSTS (TDIC) (TDC) + (TIC) = ‐$ 158,400$ 105,600$ Calculated Total
Contingency 0.15 * (TDIC) = ‐$ 23,760$ 15,840$ CCM
TOTAL INSTALLED CAPITAL COSTS (TICC) = ‐$ 182,160$ 121,440$ Calculated Total
ANNUAL FIXED O&M COSTS =Operating, Adminstrative & Support Labor 50% of FTE * $20/hr = ‐$ 20,800$ 20,800$ EstimateMaintenance Labor and Materials 25% of FTE * $20/hr = ‐$ 10,400$ 10,400$ CCMParts and Materials (included in maintenance)
TOTAL FIXED O&M COSTS (FOM) = ‐$ 31,200$ 31,200$ Calculated Total
ANNUAL VARIABLE O&M COSTSAmmonia Reagent Cost = ‐$ 2,640$ ‐$ EstimateCatalyst Replacement Cost = ‐$ 19,800$ 13,200$ EstimateAuxilary Power Cost = ‐$ 6,616$ 6,616$ Estimate & CCM
TOTAL VARIABLE O&M COSTS (VOM) = ‐$ 29,056$ 19,816$ Calculated Total
TOTAL DIRECT COSTS (TDAC) (FOM) + (VOM) = ‐$ 60,256$ 51,016$ Calculated Total
INDIRECT COSTSOverhead Included in Fixed O&M costs ‐$ ‐$ ‐$ Property Tax 1% of (TICC) ‐$ 1,822$ 1,214$ OAQPS Control Cost ManualInsurance 1% of (TICC) ‐$ 1,822$ 1,214$ OAQPS Control Cost ManualG&A Charges 2% of (TICC) ‐$ 3,643$ 2,429$ OAQPS Control Cost ManualCapital Recovery 0.1098 of (TICC) ‐$ 20,001$ 13,334$ Estimate
TOTAL INDIRECT COSTS (TIAC) ‐$ 27,288$ 18,192$ Calculated Total
TOTAL ANNUALIZED COSTS (TDAC) + (TIAC) = ‐$ 87,544$ 69,208$ Calculated
TOTAL TONS REMOVED PER YEAR = 1.11 0.15 Nox & CO Removal Calculations
COST EFFECTIVENESS ($ per ton of pollutant removed) = 78,750$ 463,108$ Calculated
Notes:1 ‐ Capital recovery based on a 7% interest rate and equipment lifetime of 15 years2 ‐ Catalyst replacement cost estimated at 10% of the capital cost3 ‐ Ammonia reagent cost estimated at 2% of the capital cost4 ‐ Control system cost received from the manufacturer was for a dual system. 60% of the system capital cost was attributed to Nox control and 40% to CO control.5 ‐ CCM = CCM Sect. 4.0, Ch. 2 = EPA Air Pollution Control Cost Manual ‐ Sixth Edition (EPA 452/B‐02‐001). 6 ‐ Electrical power cost based on $0.075 kw‐hr, 17,140 acfm, delta P across catalyst = 3 inc. w.c. and fan/motor efficiency of 0.6 (see CCM Section 2, Ch. 1)7 ‐ Nox and CO removal calculations (see following pages) assumed the RCTO operates at capacity 8760 hours per year to evaluate maximum removal.
Intel ‐ BACT
Dual Catalyst System for Nox & CO Emissions from a Representative New Project 8.0 MMBtu/hr RCTOCost Effectiveness Evaluation
12/29/2014 Page 2 of 7

Nox Inlet (see emission tables):Nox Inlet (lb/hr) = 0.78 lb/hrNox Inlet (tpy) = 3.42 tpy
Nox Outlet (per equipment vendor)9.0 ppmdv
Nox Outlet (tpy) = 7600 ft3 9.0 ft3 Nox 1 mol 28.32 l 60 min 8760 hr 46 g 1 lb 1 Tmin 1E+06 ft3 air 22.4 l ft3 hr yr mol 453.59 g 2000 lb
Nox Outlet (tpy) = 2.30 tpy
Nox Removal(tpy) = 1.11 tpy
CO Inlet (see emission tables):CO Inlet (lb/hr) = 0.39 lb/hrCO Inlet (tpy) = 1.71 tpy
CO Outlet (per equipment vendor)10.0 ppmdv
CO Outlet (tpy) = 7600 ft3 10.0 ft3 Nox 1 mol 28.32 l 60 min 8760 hr 28 g 1 lb 1 Tmin 1E+06 Ft3 air 22.4 l ft3 hr yr mol 453.59 g 2000 lb
CO Outlet (tpy) = 1.56 tpy
CO Removal(tpy) = 0.15 tpy
Intel ‐ BACTCost Effectiveness Evaluation
Nox & CO Removal Calculation from a Representative Pre‐Project 8.0 MMBtu/hr RCTO w/ Dual Catalyst SystemRemoval Calculations
12/29/2014 Page 3 of 7

Dual CatalystCO Reference
DIRECT COSTSCost of Catox System = 56,750$ Nationwide Boiler Incorporated
TOTAL DIRECT COSTS (TDC) = ‐$ 56,750$ Calculated Total=
INDIRECT COSTSDemolition & Retrofit = ‐$ 40,000$ EstimateGeneral Facilities, engineering, construction fees 0.20(TDC) = ‐$ 11,350$ CCMTOTAL INDIRECT COSTS (TIC) = ‐$ 51,350$ Calculated Total
TOTAL DIRECT AND INDIRECT COSTS (TDIC) (TDC) + (TIC) = ‐$ 108,100$ Calculated Total
Contingency 0.15 * (TDIC) = ‐$ 16,215$ CCM
TOTAL INSTALLED CAPITAL COSTS (TICC) = ‐$ 124,315$ Calculated Total
ANNUAL FIXED O&M COSTS =Operating, Adminstrative & Support Labor 50% of FTE * $20/hr = ‐$ 20,800$ EstimateMaintenance Labor and Materials 25% of FTE * $20/hr = ‐$ 10,400$ CCMParts and Materials (included in maintenance)
TOTAL FIXED O&M COSTS (FOM) = ‐$ 31,200$ Calculated Total
ANNUAL VARIABLE O&M COSTS
Catalyst Replacement Cost = ‐$ 11,350$ EstimateAuxilary Power Cost = ‐$ 1,536$ Estimate & CCM
TOTAL VARIABLE O&M COSTS (VOM) = ‐$ 12,886$ Calculated Total
TOTAL DIRECT COSTS (TDAC) (FOM) + (VOM) = ‐$ 44,086$ Calculated Total
INDIRECT COSTSOverhead Included in Fixed O&M costs ‐$ ‐$ Property Tax 1% of (TICC) ‐$ 1,243$ OAQPS Control Cost ManualInsurance 1% of (TICC) ‐$ 1,243$ OAQPS Control Cost ManualG&A Charges 2% of (TICC) ‐$ 2,486$ OAQPS Control Cost ManualCapital Recovery 0.1098 of (TICC) ‐$ 13,650$ Estimate
TOTAL INDIRECT COSTS (TIAC) ‐$ 18,622$ Calculated Total
TOTAL ANNUALIZED COSTS (TDAC) + (TIAC) = ‐$ 62,708$ Calculated
TOTAL TONS REMOVED PER YEAR = 5.90 CO Removal Calculations
COST EFFECTIVENESS ($ per ton of pollutant removed) = 10,626$ Calculated
Notes:1 ‐ Capital recovery based on a 7% interest rate and equipment lifetime of 15 years2 ‐ Catalyst replacement cost estimated at 20% of the capital cost3 ‐ System cost provided by equipment vendor4 ‐ CCM = CCM Sect. 4.0, Ch. 2 = EPA Air Pollution Control Cost Manual ‐ Sixth Edition (EPA 452/B‐02‐001).5 ‐ Electrical power cost based on $0.075 kw‐hr, 3,980 acfm, delta P across catalyst = 3 inc. w.c. and fan/motor efficiency of 0.6 (see CCM Section 2, Ch. 1)6 ‐ Nox and CO removal calculations (see following pages) assumed the RCTO operates at capacity 8760 hours per year to evaluate maximum removal.
Intel ‐ BACTCost Effectiveness Evaluation
CatOx System for CO Emissions from a Representative Pre‐Project 2.0 MMBtu/hr RCTO
12/29/2014 Page 4 of 7

CO Inlet (see emission tables):CO Inlet (lb/hr) = 1.43 lb/hr (average of pre‐project RCTO emission rates)CO Inlet (tpy) = 6.26 tpy
CO Outlet (per equipment vendor):10.0 ppmdv
CO Outlet (tpy) = 1765 ft3 10.0 ft3 Nox 1 mol 28.32 l 60 min 8760 hr 28 g 1 lb 1 Tmin 1E+06 ft3 air 22.4 l ft3 hr yr mol 453.59 g 2000 lb
CO Outlet (tpy) = 0.36 tpy
CO Removal(tpy) = 5.90 tpy
CO Removal Calculation from a Representative pre‐project 2.0 MMBtu/hr RCTO w/ CaToxCost Effectiveness Evaluation
Intel ‐ BACT
12/29/2014 Page 5 of 7

Dual CatalystCO Reference
DIRECT COSTSCost of New Oxidizer & Burner = 570,000$ Munters
TOTAL DIRECT COSTS (TDC) = ‐$ 570,000$ Calculated Total=
INDIRECT COSTSDemolition & Retrofit 0.15(TDC) = ‐$ 85,500$ EstimateGeneral Facilities, engineering, construction fees 0.20(TDC) = ‐$ 114,000$ CCMTOTAL INDIRECT COSTS (TIC) = ‐$ 199,500$ Calculated Total
TOTAL DIRECT AND INDIRECT COSTS (TDIC) (TDC) + (TIC) = ‐$ 769,500$ Calculated Total
Contingency 0.15 * (TDIC) = ‐$ 115,425$ CCM
TOTAL INSTALLED CAPITAL COSTS (TICC) = ‐$ 884,925$ Calculated Total
ANNUAL FIXED O&M COSTS =Operating, Adminstrative & Support Labor = ‐$ ‐$ Maintenance Labor and Materials = ‐$ ‐$ Parts and Materials (included in maintenance)
TOTAL FIXED O&M COSTS (FOM) = ‐$ ‐$ Calculated Total
ANNUAL VARIABLE O&M COSTS
Auxilary Power Cost = ‐$
TOTAL VARIABLE O&M COSTS (VOM) = ‐$ ‐$ Calculated Total
TOTAL DIRECT COSTS (TDAC) (FOM) + (VOM) = ‐$ ‐$ Calculated Total
INDIRECT COSTSOverhead ‐$ ‐$ Property Tax ‐$ OAQPS Control Cost ManualInsurance ‐$ OAQPS Control Cost ManualG&A Charges ‐$ OAQPS Control Cost ManualCapital Recovery 0.1098 of (TICC) ‐$ 97,165$ Estimate
TOTAL INDIRECT COSTS (TIAC) ‐$ 97,165$ Calculated Total
TOTAL ANNUALIZED COSTS (TDAC) + (TIAC) = ‐$ 97,165$ Calculated
TOTAL TONS REMOVED PER YEAR = 5.83 CO Removal Calculations
COST EFFECTIVENESS ($ per ton of pollutant removed) = 16,655$ Calculated
Notes:1 ‐ Capital recovery based on a 7% interest rate and equipment lifetime of 15 years2 ‐ CCM = CCM Sect. 4.0, Ch. 2 = EPA Air Pollution Control Cost Manual ‐ Sixth Edition (EPA 452/B‐02‐001). 3 ‐ Nox and CO removal calculations (see following pages) assumed the RCTO operates at capacity 8760 hours per year to evaluate maximum removal.
Intel ‐ BACTCost Effectiveness Evaluation
Replace Oxidizer/Burner for CO Emissions from a Representative Pre‐Project 2.0 MMBtu/hr RCTO
12/29/2014 Page 6 of 7

CO Pre‐project RCTOs (see emission tables):CO Pre (lb/hr) = 1.43 lb/hr (average of pre‐project RCTO emission rates)CO Pre (tpy) = 6.26 tpy
CO new Project RCTOs50.0 lb/MMCF (assume modified RCTO can achieve CO emissions equivalent to new units)
CO New (tpy) = 2 MMBtu 1.0 ft3 50.0 lb 8760 hr 1 Thr 1020 Btu MMCF yr 2000 lb
CO New (tpy) = 0.43 tpy
CO Reduction(tpy) = 5.83 tpy
Intel ‐ BACTCost Effectiveness Evaluation
CO Removal Calculation from a Representative pre‐project RCTO w/ Oxidizer/Burner Replacement
12/29/2014 Page 7 of 7

This page intentionally left blank

Appendix F RBLC Review Results

This page intentionally left blank

Appendix F – RBLC Review Results
1
Searches were performed in USEPA’s Technology Transfer Network, Clean Air Technology Center – CACT/BACT/LAER Clearinghouse
(http://cfpub.epa.gov/rblc/index.cfm?Action=search.BasicSearch). All searches were conducted back to 2004, USA only. Other search criteria are indicated below.
Process code 99.011 Semiconductor Manufacturing – only determinations are pre‐1996. No determination for NOx and CO, including pre‐1996‐determinations.
Process code 99.999 “Cooling Tower” – no determinations for NOx or CO.
Fluoride – see stand‐alone analysis titled Fluoride Control Technology Assessment.
Natural Gas Boilers (Process 13.310), 5<50 MMBTU/H – NOx
Date Posted RBLC ID Company Boiler Size (MMBTU/H) Emission Limit Reported Derived Emission Limit in LB/MMBTU
Control Technology Date Accessed
7/16/2014 WY‐0075 BLACK HILLS POWER, INC, CHEYENNE PRAIRIE GENERATING STATION
25.06 MMBTU/H 0.0175 LB/MMBTU 0.4000 LB/H
0.0175 LB/MMBTU Ultra low NOx burners and flue gas recirculation
9/29/2014
12/17/2013 PA‐0296 BERKS HOLLOW ENERGY ASSOC LLC
40.00 MMBTU/H 1.0100 TPY 12‐MONTH rolling total
None listed 9/29/2014
4/23/2013 PA‐0291 HICKORY RUN ENERGY STATION
40.00 MMBTU/H 0.0110 LB/MMBTU 1.01 TPY 12 month rolling
0.0110 LB/MMBTU None listed 9/29/2014
9/5/2012 FL‐0335 KLAUSER HOLDING USA, INC. SUWANNEE MILL
46.00 MMBTU/H 0.0360 LB/MMBTU 0.0360 LB/MMBTU Low NOx Burner and Flue Gas Recirculation
9/26/2014
2/8/2012 SC‐0113 PYRAMAX CERAMICS, LLC 5.00 MMBTU/H None listed Good design and combustion practices, low NOx burners, combustion of natural gas/propane
9/26/2014
1/27/2012 GA‐0147 PYRAMAX CERAMICS, LLC 9.80 MMBTU/H 12.0000 PPM @ 3% 02 Low NOx combustion technology and practice
9/26/2014
6/21/2011 CA‐1192 AVENAL POWER CENTER LLC 37.40 MMBTU/H 9.0000 PPMVD Ultra low NOx burner, use PUC quality natural gas, operational restriction of 46, 675 MMBTU/YR
9/29/2014
10/14/2010 MI‐0393 CONSUMERS ENERGY, RAY COMPRESSOR STATION
12.25 MMBTU/H 0.4300 LB/H 0.0351 LB/MMBTU Low NOx burner 9/29/2014
6/14/2010 LA‐0240 FLOPAM INC. 25.10 MMBTU/H 0.3800 LB/H 0.0151 LB/MMBTU Ultra Low NOx Burners 9/26/2014
3/11/2010 CA‐1191 CITY OF VICTORVILLE, 2 HYBRID POWER PROJECT
35.00 MMBTU/H 9.0000 PPMVD 1‐HR AVG, @3% O2
Operational restriction of 500 HR/YR
9/29/2014
8/20/2009 NV‐0049 HARRAH'S OPERATING COMPANY, INC.
16.80 MMBTU/H 0.0300 LB/MMBTU 25.0000 PPMVD corrected to 3% O2
0.0300 LB/MMBTU Low‐NOx burner and blue gas recirculation
9/29/2014
8/20/2009 NV‐0049 HARRAH'S OPERATING COMPANY, INC.
35.40 MMBTU/H 0.0350 LB/MMBTU 29.0000 PPMVD corrected to 3% O2
0.0350 LB/MMBTU Low NOx burner 9/29/2014
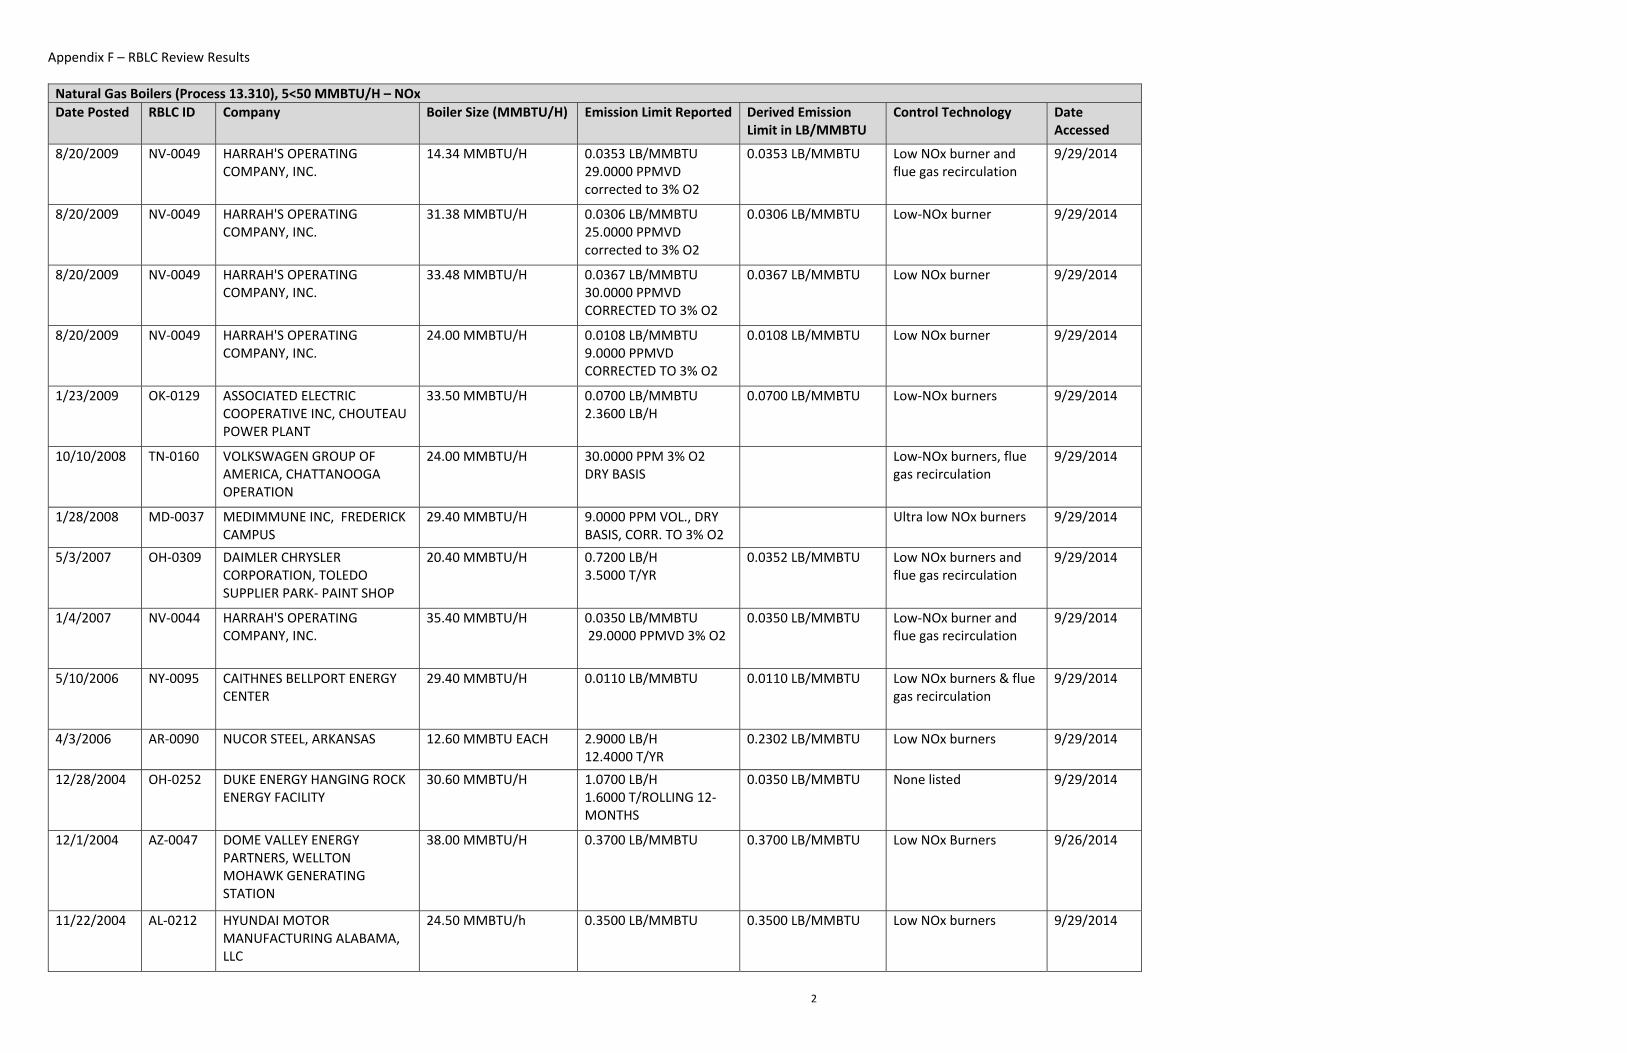
Appendix F – RBLC Review Results
2
Natural Gas Boilers (Process 13.310), 5<50 MMBTU/H – NOx
Date Posted RBLC ID Company Boiler Size (MMBTU/H) Emission Limit Reported Derived Emission Limit in LB/MMBTU
Control Technology Date Accessed
8/20/2009 NV‐0049 HARRAH'S OPERATING COMPANY, INC.
14.34 MMBTU/H 0.0353 LB/MMBTU 29.0000 PPMVD corrected to 3% O2
0.0353 LB/MMBTU Low NOx burner and flue gas recirculation
9/29/2014
8/20/2009 NV‐0049 HARRAH'S OPERATING COMPANY, INC.
31.38 MMBTU/H 0.0306 LB/MMBTU 25.0000 PPMVD corrected to 3% O2
0.0306 LB/MMBTU Low‐NOx burner 9/29/2014
8/20/2009 NV‐0049 HARRAH'S OPERATING COMPANY, INC.
33.48 MMBTU/H 0.0367 LB/MMBTU 30.0000 PPMVD CORRECTED TO 3% O2
0.0367 LB/MMBTU Low NOx burner 9/29/2014
8/20/2009 NV‐0049 HARRAH'S OPERATING COMPANY, INC.
24.00 MMBTU/H 0.0108 LB/MMBTU 9.0000 PPMVD CORRECTED TO 3% O2
0.0108 LB/MMBTU Low NOx burner 9/29/2014
1/23/2009 OK‐0129 ASSOCIATED ELECTRIC COOPERATIVE INC, CHOUTEAU POWER PLANT
33.50 MMBTU/H 0.0700 LB/MMBTU 2.3600 LB/H
0.0700 LB/MMBTU Low‐NOx burners 9/29/2014
10/10/2008 TN‐0160 VOLKSWAGEN GROUP OF AMERICA, CHATTANOOGA OPERATION
24.00 MMBTU/H 30.0000 PPM 3% O2 DRY BASIS
Low‐NOx burners, flue gas recirculation
9/29/2014
1/28/2008 MD‐0037 MEDIMMUNE INC, FREDERICK CAMPUS
29.40 MMBTU/H 9.0000 PPM VOL., DRY BASIS, CORR. TO 3% O2
Ultra low NOx burners 9/29/2014
5/3/2007 OH‐0309 DAIMLER CHRYSLER CORPORATION, TOLEDO SUPPLIER PARK‐ PAINT SHOP
20.40 MMBTU/H 0.7200 LB/H 3.5000 T/YR
0.0352 LB/MMBTU Low NOx burners and flue gas recirculation
9/29/2014
1/4/2007 NV‐0044 HARRAH'S OPERATING COMPANY, INC.
35.40 MMBTU/H 0.0350 LB/MMBTU 29.0000 PPMVD 3% O2
0.0350 LB/MMBTU Low‐NOx burner and flue gas recirculation
9/29/2014
5/10/2006 NY‐0095 CAITHNES BELLPORT ENERGY CENTER
29.40 MMBTU/H 0.0110 LB/MMBTU 0.0110 LB/MMBTU Low NOx burners & flue gas recirculation
9/29/2014
4/3/2006 AR‐0090 NUCOR STEEL, ARKANSAS 12.60 MMBTU EACH 2.9000 LB/H 12.4000 T/YR
0.2302 LB/MMBTU Low NOx burners 9/29/2014
12/28/2004 OH‐0252 DUKE ENERGY HANGING ROCK ENERGY FACILITY
30.60 MMBTU/H 1.0700 LB/H 1.6000 T/ROLLING 12‐MONTHS
0.0350 LB/MMBTU None listed 9/29/2014
12/1/2004 AZ‐0047 DOME VALLEY ENERGY PARTNERS, WELLTON MOHAWK GENERATING STATION
38.00 MMBTU/H 0.3700 LB/MMBTU 0.3700 LB/MMBTU Low NOx Burners 9/26/2014
11/22/2004 AL‐0212 HYUNDAI MOTOR MANUFACTURING ALABAMA, LLC
24.50 MMBTU/h 0.3500 LB/MMBTU 0.3500 LB/MMBTU Low NOx burners 9/29/2014
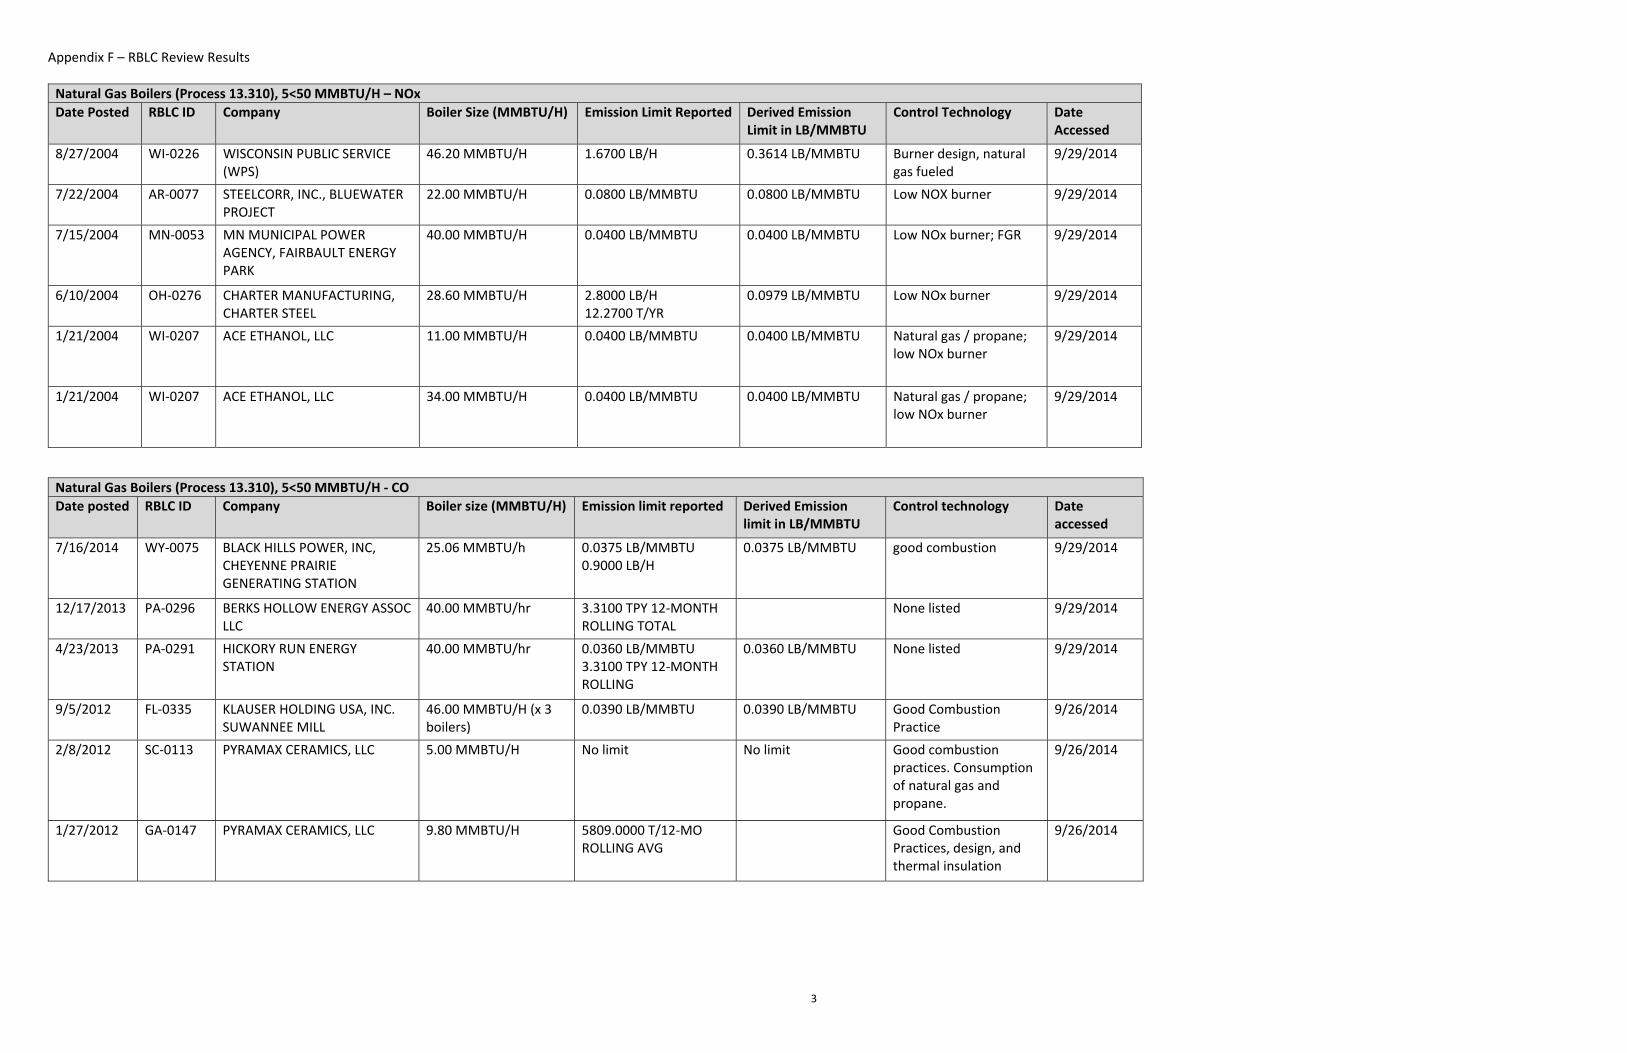
Appendix F – RBLC Review Results
3
Natural Gas Boilers (Process 13.310), 5<50 MMBTU/H – NOx
Date Posted RBLC ID Company Boiler Size (MMBTU/H) Emission Limit Reported Derived Emission Limit in LB/MMBTU
Control Technology Date Accessed
8/27/2004 WI‐0226 WISCONSIN PUBLIC SERVICE (WPS)
46.20 MMBTU/H 1.6700 LB/H 0.3614 LB/MMBTU Burner design, natural gas fueled
9/29/2014
7/22/2004 AR‐0077 STEELCORR, INC., BLUEWATER PROJECT
22.00 MMBTU/H 0.0800 LB/MMBTU 0.0800 LB/MMBTU Low NOX burner 9/29/2014
7/15/2004 MN‐0053 MN MUNICIPAL POWER AGENCY, FAIRBAULT ENERGY PARK
40.00 MMBTU/H 0.0400 LB/MMBTU 0.0400 LB/MMBTU Low NOx burner; FGR 9/29/2014
6/10/2004 OH‐0276 CHARTER MANUFACTURING, CHARTER STEEL
28.60 MMBTU/H 2.8000 LB/H 12.2700 T/YR
0.0979 LB/MMBTU Low NOx burner 9/29/2014
1/21/2004 WI‐0207 ACE ETHANOL, LLC 11.00 MMBTU/H 0.0400 LB/MMBTU 0.0400 LB/MMBTU Natural gas / propane; low NOx burner
9/29/2014
1/21/2004 WI‐0207 ACE ETHANOL, LLC 34.00 MMBTU/H 0.0400 LB/MMBTU 0.0400 LB/MMBTU Natural gas / propane; low NOx burner
9/29/2014
Natural Gas Boilers (Process 13.310), 5<50 MMBTU/H ‐ CO
Date posted RBLC ID Company Boiler size (MMBTU/H) Emission limit reported Derived Emission limit in LB/MMBTU
Control technology Date accessed
7/16/2014 WY‐0075 BLACK HILLS POWER, INC, CHEYENNE PRAIRIE GENERATING STATION
25.06 MMBTU/h 0.0375 LB/MMBTU 0.9000 LB/H
0.0375 LB/MMBTU good combustion 9/29/2014
12/17/2013 PA‐0296 BERKS HOLLOW ENERGY ASSOC LLC
40.00 MMBTU/hr 3.3100 TPY 12‐MONTH ROLLING TOTAL
None listed 9/29/2014
4/23/2013 PA‐0291 HICKORY RUN ENERGY STATION
40.00 MMBTU/hr 0.0360 LB/MMBTU 3.3100 TPY 12‐MONTH ROLLING
0.0360 LB/MMBTU None listed 9/29/2014
9/5/2012 FL‐0335 KLAUSER HOLDING USA, INC. SUWANNEE MILL
46.00 MMBTU/H (x 3 boilers)
0.0390 LB/MMBTU 0.0390 LB/MMBTU Good Combustion Practice
9/26/2014
2/8/2012 SC‐0113 PYRAMAX CERAMICS, LLC 5.00 MMBTU/H No limit No limit Good combustion practices. Consumption of natural gas and propane.
9/26/2014
1/27/2012 GA‐0147 PYRAMAX CERAMICS, LLC 9.80 MMBTU/H 5809.0000 T/12‐MO ROLLING AVG
Good Combustion Practices, design, and thermal insulation
9/26/2014

Appendix F – RBLC Review Results
4
Natural Gas Boilers (Process 13.310), 5<50 MMBTU/H ‐ CO
Date posted RBLC ID Company Boiler size (MMBTU/H) Emission limit reported Derived Emission limit in LB/MMBTU
Control technology Date accessed
6/21/2011 CA‐1192 AVENAL POWER CENTER LLC 37.40 MMBTU/H 50.0000 PPMVD 3‐HR AVG, @3% O2
Ultra low NOx burner, use puc quality natural gas, operational restriction of 46, 675 MMBTU/YR
9/29/2014
10/14/2010 MI‐0393 CONSUMERS ENERGY, RAY COMPRESSOR STATION
12.25 MMBTU/H No limit No limit None listed 9/29/2014
6/14/2010 LA‐0240 FLOPAM INC. 25.10 MMBTU/H 0.9300 LB/H 0.0370 LB/MMBTU Good equipment design and proper combustion practices
9/26/2014
3/11/2010 CA‐1191 CITY OF VICTORVILLE, 2 HYBRID POWER PROJECT
35.00 MMBTU/H 50.0000 PPMVD 1‐HR AVG, @3% O2
Operational restriction of 500 HR/YR
9/29/2014
8/20/2009 NV‐0049 HARRAH'S OPERATING COMPANY, INC.
16.80 MMBTU/H 0.0173 LB/MMBTU 23.0000 PPMVD CORRECTED TO 3% O2
0.0173 LB/MMBTU Flue gas recirculation 9/29/2014
8/20/2009 NV‐0049 HARRAH'S OPERATING COMPANY, INC.
35.40 MMBTU/H 0.0073 LB/MMBTU 29.0000 PPMVD CORRECTED TO 3% O2
0.0073 LB/MMBTU Operating in accordance with the manufacturer's specification
9/29/2014
8/20/2009 NV‐0049 HARRAH'S OPERATING COMPANY, INC.
14.34 MMBTU/H 0.0705 LB/MMBTU 95.0000 PPMVD CORRECTED TO 3% O2
0.0705 LB/MMBTU Flue gas recirculation 9/29/2014
8/20/2009 NV‐0049 HARRAH'S OPERATING COMPANY, INC.
31.38 MMBTU/H 0.0172 LB/MMBTU 23.0000 PPMVD CORRECTED TO 3% O2
0.0172 LB/MMBTU Operating in accordance with the manufacturer's specification
9/29/2014
8/20/2009 NV‐0049 HARRAH'S OPERATING COMPANY, INC.
33.48 MMBTU/H 0.0075 LB/MMBTU 30.0000 PPMVD CORRECTED TO 3% O2
0.0075 LB/MMBTU Operating in accordance with the manufacturer's specification
9/29/2014
8/20/2009 NV‐0049 HARRAH'S OPERATING COMPANY, INC.
24.00 MMBTU/H 0.0370 LB/MMBTU 50.0000 PPMVD CORRECTED TO 3% O2
0.0370 LB/MMBTU Operating in accordance with the manufacturer's specification
9/29/2014
1/23/2009 OK‐0129 ASSOCIATED ELECTRIC COOPERATIVE INC, CHOUTEAU POWER PLANT
33.50 MMBTU/H 5.0200 LB/H 0.1498 LB/MMBTU Good combustion 9/29/2014
10/10/2008 TN‐0160 VOLKSWAGEN GROUP OF AMERICA, CHATTANOOGA OPERATION
24.00 MMBTU/H No limit No limit None listed 9/29/2014
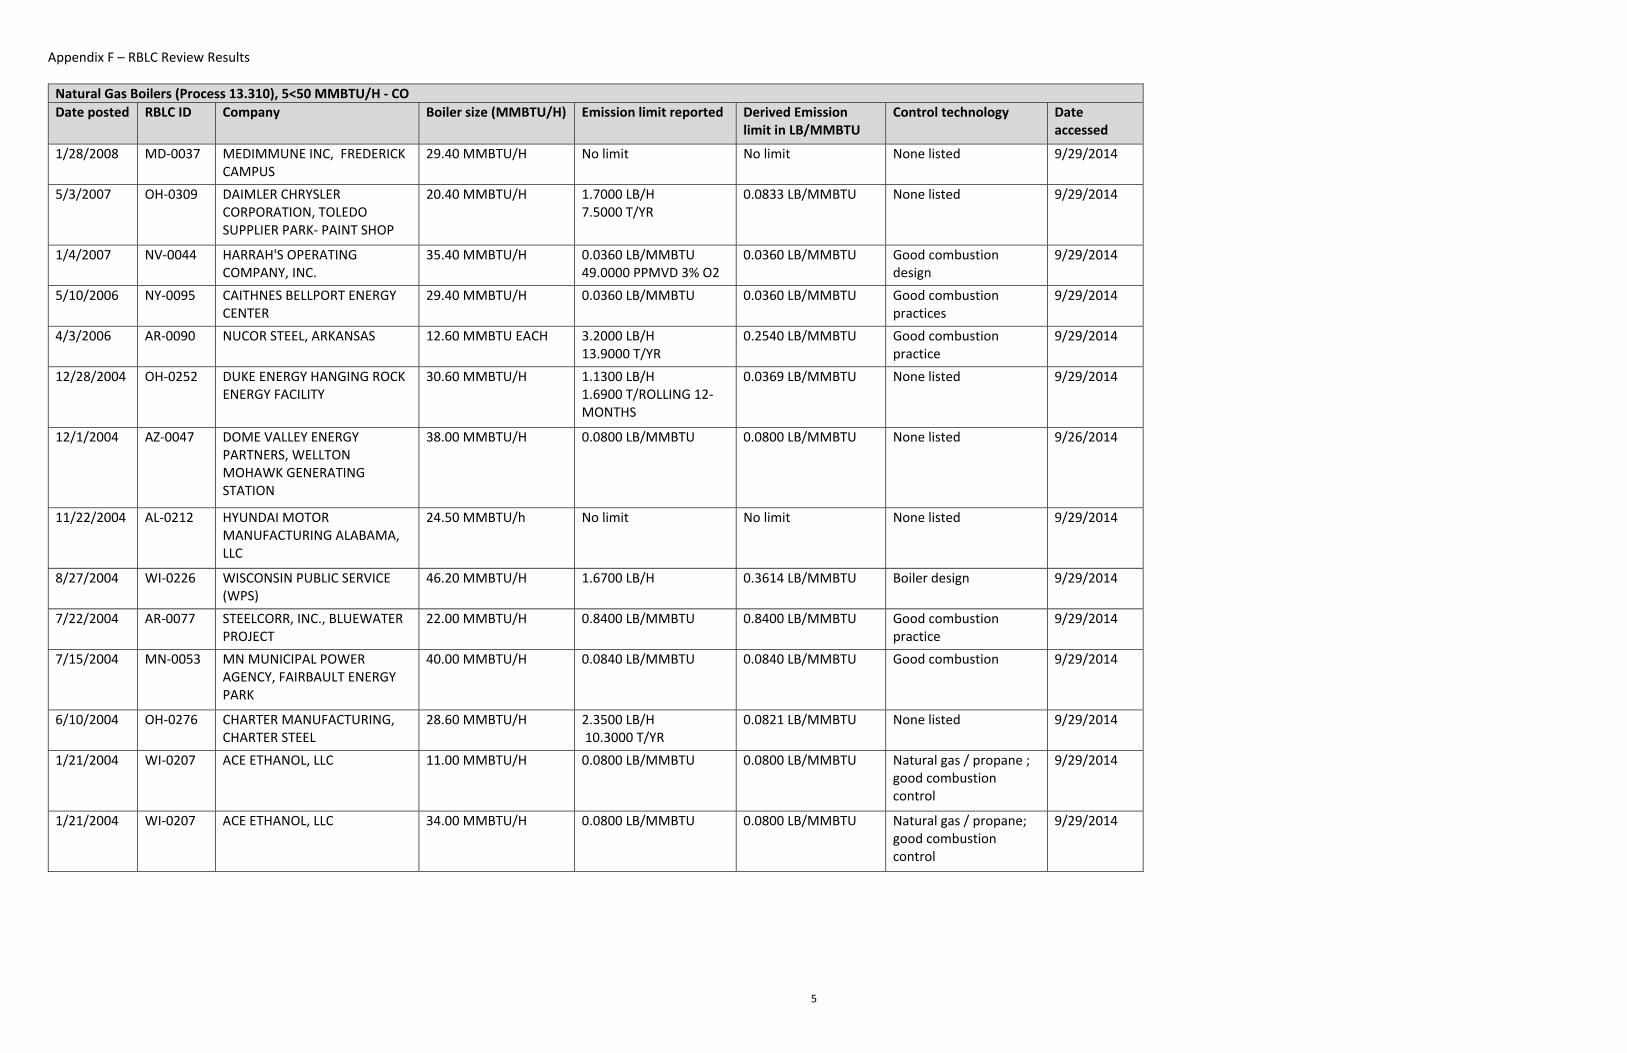
Appendix F – RBLC Review Results
5
Natural Gas Boilers (Process 13.310), 5<50 MMBTU/H ‐ CO
Date posted RBLC ID Company Boiler size (MMBTU/H) Emission limit reported Derived Emission limit in LB/MMBTU
Control technology Date accessed
1/28/2008 MD‐0037 MEDIMMUNE INC, FREDERICK CAMPUS
29.40 MMBTU/H No limit No limit None listed 9/29/2014
5/3/2007 OH‐0309 DAIMLER CHRYSLER CORPORATION, TOLEDO SUPPLIER PARK‐ PAINT SHOP
20.40 MMBTU/H 1.7000 LB/H 7.5000 T/YR
0.0833 LB/MMBTU None listed 9/29/2014
1/4/2007 NV‐0044 HARRAH'S OPERATING COMPANY, INC.
35.40 MMBTU/H 0.0360 LB/MMBTU 49.0000 PPMVD 3% O2
0.0360 LB/MMBTU Good combustion design
9/29/2014
5/10/2006 NY‐0095 CAITHNES BELLPORT ENERGY CENTER
29.40 MMBTU/H 0.0360 LB/MMBTU 0.0360 LB/MMBTU Good combustion practices
9/29/2014
4/3/2006 AR‐0090 NUCOR STEEL, ARKANSAS 12.60 MMBTU EACH 3.2000 LB/H 13.9000 T/YR
0.2540 LB/MMBTU Good combustion practice
9/29/2014
12/28/2004 OH‐0252 DUKE ENERGY HANGING ROCK ENERGY FACILITY
30.60 MMBTU/H 1.1300 LB/H 1.6900 T/ROLLING 12‐MONTHS
0.0369 LB/MMBTU None listed 9/29/2014
12/1/2004 AZ‐0047 DOME VALLEY ENERGY PARTNERS, WELLTON MOHAWK GENERATING STATION
38.00 MMBTU/H 0.0800 LB/MMBTU 0.0800 LB/MMBTU None listed 9/26/2014
11/22/2004 AL‐0212 HYUNDAI MOTOR MANUFACTURING ALABAMA, LLC
24.50 MMBTU/h No limit No limit None listed 9/29/2014
8/27/2004 WI‐0226 WISCONSIN PUBLIC SERVICE (WPS)
46.20 MMBTU/H 1.6700 LB/H 0.3614 LB/MMBTU Boiler design 9/29/2014
7/22/2004 AR‐0077 STEELCORR, INC., BLUEWATER PROJECT
22.00 MMBTU/H 0.8400 LB/MMBTU 0.8400 LB/MMBTU Good combustion practice
9/29/2014
7/15/2004 MN‐0053 MN MUNICIPAL POWER AGENCY, FAIRBAULT ENERGY PARK
40.00 MMBTU/H 0.0840 LB/MMBTU 0.0840 LB/MMBTU Good combustion 9/29/2014
6/10/2004 OH‐0276 CHARTER MANUFACTURING, CHARTER STEEL
28.60 MMBTU/H 2.3500 LB/H 10.3000 T/YR
0.0821 LB/MMBTU None listed 9/29/2014
1/21/2004 WI‐0207 ACE ETHANOL, LLC 11.00 MMBTU/H 0.0800 LB/MMBTU 0.0800 LB/MMBTU Natural gas / propane ; good combustion control
9/29/2014
1/21/2004 WI‐0207 ACE ETHANOL, LLC 34.00 MMBTU/H 0.0800 LB/MMBTU 0.0800 LB/MMBTU Natural gas / propane; good combustion control
9/29/2014

Appendix F – RBLC Review Results
6
Thermal Oxidizers (Process 19.200) – NOx and CO
Date posted RBLC ID Company Thermal Oxidizer Type Throughput Date accessed
Comments
6/4/2013 CO‐0067 KERR‐MCGEE GATHERING LANCASTER PLANT
Four Thermal Oxidizers 44.00 MMBTU/HR 9/29/2014 Refinery process. Combustion burner technology is not comparable to zeolite concentrator.
5/1/2013 LA‐0266 CROSSTEX PROCESSING SERVICES, LLC EUNICE GAS EXTRACTION PLANT
Regenerative Thermal Oxidizer (RTO) (EQT 0062)
31.20 MMBTU/H 9/29/2014 Refinery process. Combustion burner technology is not comparable to zeolite concentrator.
12/21/2010 LA‐0240 FLOPAM INC. Thermal Oxidizers 0 9/29/2014 Plastics polymer manufacturing. Combustion burner technology is not comparable to zeolite concentrator. NOx determination was for LAER CO determination was for PSD BACT
2/27/2009 LA‐0204 SHINTECH LOUISIANA LLC PLAQUEMINE PVC PLANT
Gas thermal oxidizers A & B (M‐5 & M‐6)
72.00 MMBTU/H 9/29/2014 Plastics polymer manufacturing. Combustion burner technology is not comparable to zeolite concentrator. Both determination were for PSD BACT
11/19/2008 MT‐0030 CONOCOPHILLIPS COMPANY BILLINGS REFINERY
WWTF thermal oxidizer
6500.00 BTU/H 9/29/2014 Refinery process. Combustion burner technology is not comparable to zeolite concentrator.
7/10/2008 LA‐0229 SHINTECH LOUISIANA LLC SHINTECH PLAQUEMINE PLANT 2
EQT126, EQT127 ‐ two thermal oxidizers (2M‐5, 2M‐6)
72.00 MMBTU/H 9/29/2014 Plastics polymer manufacturing. Combustion burner technology is not comparable to zeolite concentrator. Both determination were for PSD BACT.
6/14/2004 OH‐0288 OWENS CORNING OWENS CORNING MEDINA
Thermal incinerator, PCC
None listed 9/29/2014 Refinery process. Combustion burner technology is not comparable to zeolite concentrator. Thermal incinerator, JZ None listed 9/29/2014

Appendix F – RBLC Review Results
7
Emergency Generators and Emergency Fire Water Pumps (Processes 17.110 and 17.210, “emergency,” recent sample + unusual controls) ‐ NOx
Date posted RBLC ID Company Equipment Type Size Emission limit reported Control technology Date accessed
6/4/2014 IN‐0180 MIDWEST FERTILIZER CORPORATION
Generator 3600.00 BHP 4.4600 G/B‐HP‐H 3‐HR average
Good combustion practices 9/30/2014
3/4/2014 PA‐0298 FUTURE POWER PA/GOOD SPRINGS NGCC FACILITY
Generator 31.90 GAL/H None None 9/30/2014
12/17/2013 PA‐0296 BERKS HOLLOW ENERGY ASSOC LLC/ONTELAUNEE
Fire pump 16.00 GAL/H 0.0900 TPY based on 12‐month rolling total
None 10/1/2014
12/4/2013 MI‐0412 HOLLAND BOARD OF PUBLIC WORKS ‐ EAST 5TH STREET
Fire pump 165.00 HP 3.0000 G/HP‐H TEST protocol
Good combustion practices 10/1/2014
9/25/2013 IN‐0172 OHIO VALLEY RESOURCES, LLC Generator 4690.00 BHP 4.4600 G/BHP‐H 3‐HR average
Good combustion practices 9/30/2014
9/25/2013 IN‐0179 OHIO VALLEY RESOURCES, LLC Generator 4690.00 B‐HP 4.4600 G/B‐HP‐H 3‐HR average
Good combustion practices 9/30/2014
9/25/2013 IN‐0172 OHIO VALLEY RESOURCES, LLC Water pump 481.00 BHP 2.8600 G/BHP‐H 3‐HR average
Good combustion practices 10/1/2014
9/25/2013 IN‐0179 OHIO VALLEY RESOURCES, LLC Water pump 481.00 BHP 2.8600 G/B‐HP‐H 3‐HR average
Good combustion practices 10/1/2014
7/25/2013 MI‐0410 CONSUMERS ENERGY COMPANY, THETFORD GENERATING STATION
Fire pump 315.00 HP nameplate 3.0000 G/HP‐H test protocol will specify avg. Time.
Proper combustion design and ultra low sulfur diesel fuel.
10/1/2014
7/12/2013 IA‐0106 CF INDUSTRIES NITROGEN, LLC ‐ PORT NEAL NITROGEN COMPLEX
Generator 180.00 GAL/H None None 9/30/2014
6/18/2013 OH‐0352 ARCADIS, US, INC. OREGON CLEAN ENERGY CENTER
Generator 2250.00 KW 6.9500 T/YR per rolling 12‐months
Purchased certified to the standards in NSPS Subpart IIII
9/30/2014
6/18/2013 OH‐0352 ARCADIS, US, INC. OREGON CLEAN ENERGY CENTER
Fire pump 300.00 HP 1.7000 LB/H 0.4300 T/YR per rolling 12‐months
Purchased certified to the standards in NSPS Subpart IIII
10/1/2014
6/4/2013 CO‐0067 KERR‐MCGEE GATHERING LANCASTER PLANT
Generator 19950.00 GAL/YR None None 9/30/2014
4/23/2013 PA‐0291 HICKORY RUN ENERGY STATION
Generator 7.80 MMBTU/H 9.8900 LB/H 0.4900 T/YR 12‐month rolling total
None 9/30/2014
4/23/2013 PA‐0291 HICKORY RUN ENERGY LLC ENERGY STATION
Fire pump 3.25 MMBTU/H 1.8600 LB/H 0.0900 T/YR 12 month rolling total
None 10/1/2014
3/27/2013 LA‐0272 DYNO NOBEL LOUISIANA AMMONIA, LLC
Generator 1200.00 HP Standard emission limit: 6.4000 G/KW‐HR NOX + NMHC
Compliance with 40 CFR 60 Subpart IIII; good combustion practices.
9/30/2014

Appendix F – RBLC Review Results
8
Emergency Generators and Emergency Fire Water Pumps (Processes 17.110 and 17.210, “emergency,” recent sample + unusual controls) ‐ NOx
Date posted RBLC ID Company Equipment Type Size Emission limit reported Control technology Date accessed
12/3/2012 IN‐0158 ST. JOSEPH ENEGRY CENTER, LLC
Generator 1006.00 HP EACH (2) 4.8000 G/HP‐H 3 HOURS 500 hours of operation yearly
Combustion design controls and usage limits 9/30/2014
12/3/2012 IN‐0158 ST. JOSEPH ENEGRY CENTER, LLC
Generator 2012.00 HP 4.8000 G/HP‐H 3 hours 500 hours of operation yearly
Combustion design controls and usage limits 9/30/2014
11/1/2012 NJ‐0080 HESS NEWARK ENERGY CENTER, LLC
Generator 200.00 H/YR 18.5300 LB/H Use of ultra low sulfur diesel (ULSD) a clean fuel
10/1/2014
10/26/2012 IA‐0105 IOWA FERTILIZER COMPANY Generator 142.00 GAL/H 6.0000 G/KW‐H average of 3 stack test runs 6.6100 TONS/YR rolling 12 month total
Good combustion practices 10/1/2014
8/28/2012 WY‐0070 BLACK HILLS POWER, INC. CHEYENNE PRAIRIE GENERATING STATION
Generator 839.00 hp 0 EPA Tier 2 rated 10/1/2014
7/25/2012 NJ‐0079 CPV SHORE, LLC WOODBRIDGE ENERGY CENTER
Generator 100.00 H/YR 21.1600 LB/H Use of ULSD diesel oil 10/1/2014
7/13/2012 MI‐0395 GENERAL MOTORS TECHNICAL CENTER‐‐WARREN
Generator 3010.00 KW each (9) 5.9800 G/KW‐H each No add‐on controls, but ignition timing retardation (ITR) is good design. Engines are tuned for low‐NOx operation versus low CO operation.
10/1/2014
7/13/2012 MI‐0395 GENERAL MOTORS TECHNICAL CENTER‐‐WARREN
Generator 2500.00 KW each (4) 7.1300 G/KW‐H each No add‐on control, but ignition timing retardation (ITR) is good design. Engines are tuned for low‐NOx operation versus low CO operation.
10/1/2014
7/9/2012 SC‐0159 MICHELIN NORTH AMERICA, INC., US10 FACILITY
Generator 1000.00 KW None None 10/1/2014
6/27/2012 IN‐0166 INDIANA GASIFICATION, LLC Generator 1341.00 horsepower, EACH (2)
0 Good Combustion Practices And Limited Hours Of Non‐Emergency Operation
10/1/2014

Appendix F – RBLC Review Results
9
Emergency Generators and Emergency Fire Water Pumps (Processes 17.110 and 17.210, “emergency,” recent sample + unusual controls) ‐ NOx
Date posted RBLC ID Company Equipment Type Size Emission limit reported Control technology Date accessed
2/29/2012 MI‐0394 GENERAL MOTORS TECHNICAL CENTER‐WARREN
Generator 3010.00 KW each (9) 5.9800 G/KW‐H each No add‐on controls, but ignition timing retardation (ITR) is good design. Engines are tuned for low‐NOx operation versus low CO operation.
10/1/2014
2/29/2012 MI‐0394 GENERAL MOTORS TECHNICAL CENTER‐WARREN
Generator 2280.00 KW each (4) 6.9300 G/KW‐H each No add‐on controls, but ignition timing retardation (ITR) is good design. Engines are tuned for low‐NOx operation versus low CO operation.
10/1/2014
2/8/2012 SC‐0113 PYRAMAX CERAMICS, LLC Generator 757.00 HP each (8) 4.0000 GR/KW‐H Engines must be certified to comply with NSPS, Subpart IIII.
10/1/2014
2/8/2012 SC‐0113 PYRAMAX CERAMICS, LLC PYRAMAX CERAMICS, LLC
Emergency engines 29.00 HP (8) 7.5000 GR/KW‐H Purchase of certified engine 10/1/2014
10/27/2011 FL‐0328 ENI U.S. OPERATING COMPANY, INC., HOLY CROSS DRILLING PROJECT
Generator 0 0.4000 tons per year 12‐month rolling
Use of good combustion practices, based on the current manufacturer’s specifications for this engine
10/1/2014
10/27/2011 FL‐0328 ENI U.S. OPERATING COMPANY, INC., HOLY CROSS DRILLING PROJECT
Fire pump 0 0.0200 tons per year 12‐month rolling
Use of good combustion practices, based on the current manufacturer’s specifications for this engine
10/1/2014
10/18/2011 CA‐1212 CITY OF PALMDALE, HYBRID POWER PROJECT
Generator 2683.00 HP 6.4000 G/KW‐H 3‐HR AVG 4.8000 G/HP‐H 3‐HR AVG
None 10/1/2014
10/18/2011 CA‐1212 CITY OF PALMDALE HYBRID POWER PROJECT
Emergency engines 182.00 HP 4.0000 G/KW‐H 3‐HR AVG 3.0000 G/HP‐H 3‐HR AVG
None 10/1/2014
10/3/2011 CA‐1220 SAN DIEGO INTERNATIONAL AIRPORT
Generator 1881.00 BHP 3.9000 G/B‐HP‐H Tier 2 certified and 50 hr/y M&T limit 10/1/2014

Appendix F – RBLC Review Results
10
Emergency Generators and Emergency Fire Water Pumps (Processes 17.110 and 17.210, “emergency,” recent sample + unusual controls) ‐ NOx
Date posted RBLC ID Company Equipment Type Size Emission limit reported Control technology Date accessed
9/23/2011 FL‐0332 HIGHLANDS ENVIROFUELS (HEF), LLC, BIOREFINERY AND COGENERATION PLAN
Fire pump 600 HP 3.0000 G/HP‐H Compliance in accordance with the procedures given in NSPS 40 CFR 60, Subpart IIII.
10/1/2014
9/23/2011 FL‐0332 HIGHLANDS ENVIROFUELS (HEF), LLC, BIOREFINERY AND COGENERATION PLAN
Generator 2,000 kW 6.4000 G/KW‐H Compliance in accordance with the procedures given in NSPS 40 CFR 60, Subpart IIII.
10/1/2014
8/16/2011 LA‐0254 ENTERGY LOUISIANA LLC NINEMILE POINT ELECTRIC GENERATING PLANT
Generator 1250.00 HP 0.0014 LB/MMBTU Proper operation and good combustion practices
10/1/2014
8/16/2011 LA‐0254 ENTERGY LOUISIANA LLC NINEMILE POINT ELECTRIC GENERATING PLANT
Fire pump 350.00 HP 0.0014 LB/MMBTU Proper operation and good combustion practices
10/1/2014
6/29/2011 MI‐0400 WOLVERINE POWER SUPPLY COOPERATIVE, INC.
Generator 4000.00 HP None None 10/1/2014
6/21/2011 CA‐1192 AVENAL POWER CENTER LLC, ENERGY PROJECT
Fire pump 288.00 HP 3.4000 G/HP‐H Equipped w/ a turbocharger and an intercooler/aftercooler
10/1/2014
11/30/2009 NV‐0050 MGM MIRAGE Generator 2206.00 HP (2) 0.0131 LB/HP‐H 28.9800 LB/H
Turbocharging, after‐cooling, and lean‐burn technology
10/1/2014
1/28/2008 MD‐0037 MEDIMMUNE, INC FREDERICK CAMPUS
Generator 2500 KW (2) 0.6100 G/HP‐H except start‐up not to exceed 9 minutes
Selective catalytic reduction (scr) system for each generator
10/1/2014
12/29/2004 MO‐0067 AQUILA, INC., SOUTH HARPER PEAKING FACILITY
Fire pump 0.47 MMBTU/H Note: No emission limit, the permit requires pollution prevention only.
Ignition timing retard (ITR) 10/1/2014

Appendix F – RBLC Review Results
11
Emergency Generators and Emergency Fire Water Pumps (Processes 17.110 and 17.210, “emergency,” all results checked. Shown is a sample of most recent + unusual controls) – CO
Date posted RBLC ID Company Equipment Size Emission limit reported Control technology Date accessed
6/4/2014 IN‐0180 MIDWEST FERTILIZER CORPORATION
Generator 3600.00 BHP 2.6100 G/B‐HP‐H 3‐HR average
Good combustion practices 9/30/2014
3/4/2014 PA‐0298 FUTURE POWER PA/GOOD SPRINGS NGCC FACILITY
Generator 31.90 GAL/HR None None 9/30/2014
12/17/2013 PA‐0296 BERKS HOLLOW ENERGY ASSOC LLC/ONTELAUNEE
Fire pump 16.00 GAL/HR 0.0900 tpy based on 12‐month rolling total
None 10/1/2014
12/4/2013 MI‐0412 HOLLAND BOARD OF PUBLIC WORKS ‐ EAST 5TH STREET
Fire pump 165.00 HP 3.7000 G/HP‐H test protocol
Good combustion practices 10/1/2014
9/25/2013 IN‐0172 OHIO VALLEY RESOURCES, LLC Generator 4690.00 BHP 2.6100 G/BHP‐H 3‐HR average
Good combustion practices 9/30/2014
9/25/2013 IN‐0179 OHIO VALLEY RESOURCES, LLC Generator 4690.00 B‐HP 2.6100 G/B‐HP‐H 3‐HR average
Good combustion practices 9/30/2014
9/25/2013 IN‐0172 OHIO VALLEY RESOURCES, LLC Water pump 481.00 BHP 2.6000 G/BHP‐H 3‐HR average
Good combustion practices 10/1/2014
9/25/2013 IN‐0179 OHIO VALLEY RESOURCES, LLC Water pump 481.00 BHP 2.6000 G/B‐HP‐H 3‐HR average
Good combustion practices 10/1/2014
7/25/2013 MI‐0410 CONSUMERS ENERGY COMPANY, THETFORD GENERATING STATION
Fire pump 315.00 HP nameplate 2.6000 G/HP‐H test protocol will specify avg. time.
Proper combustion design and ultra low sulfur diesel fuel.
10/1/2014
7/12/2013 IA‐0106 CF INDUSTRIES NITROGEN, LLC ‐ PORT NEAL NITROGEN COMPLEX
Generator 180.00 GAL/H 3.5000 G/KW‐H average of 3 stack test runs 2.5200 TONS/YR rolling 12 month total
Good combustion practices 9/30/2014
6/18/2013 OH‐0352 ARCADIS, US, INC. OREGON CLEAN ENERGY CENTER
Generator 2250.00 KW 4.3400 T/YR per rolling 12‐months
Purchased certified to the standards in NSPS Subpart IIII
9/30/2014
6/18/2013 OH‐0352 ARCADIS, US, INC. OREGON CLEAN ENERGY CENTER
Fire pump 300.00 HP 1.7000 LB/H 0.4300 T/YR per rolling 12‐months
Purchased certified to the standards in NSPS Subpart IIII
10/1/2014
4/23/2013 PA‐0291 HICKORY RUN ENERGY STATION
Generator 7.80 MMBTU/H 5.7900 LB/H 0.2900 T/YR 12‐month rolling total
None 9/30/2014
4/23/2013 PA‐0291 HICKORY RUN ENERGY LLC ENERGY STATION
Fire pump 3.25 MMBTU/H 2.5800 LB/H 0.1300 T/YR 12‐month rolling total
None 10/1/2014
3/27/2013 LA‐0272 DYNO NOBEL LOUISIANA AMMONIA, LLC
Generator 1200.00 HP Standard Emission Limit: 3.5000 G/KW‐HR
Compliance with 40 CFR 60 Subpart IIII; good combustion practices.
9/30/2014
12/3/2012 IN‐0158 ST. JOSEPH ENEGRY CENTER, LLC
Generator 1006.00 HP each (2) 2.6000 G/HP‐H 500.0000 hours of operation yearly
Combustion design controls and usage limits 9/30/2014
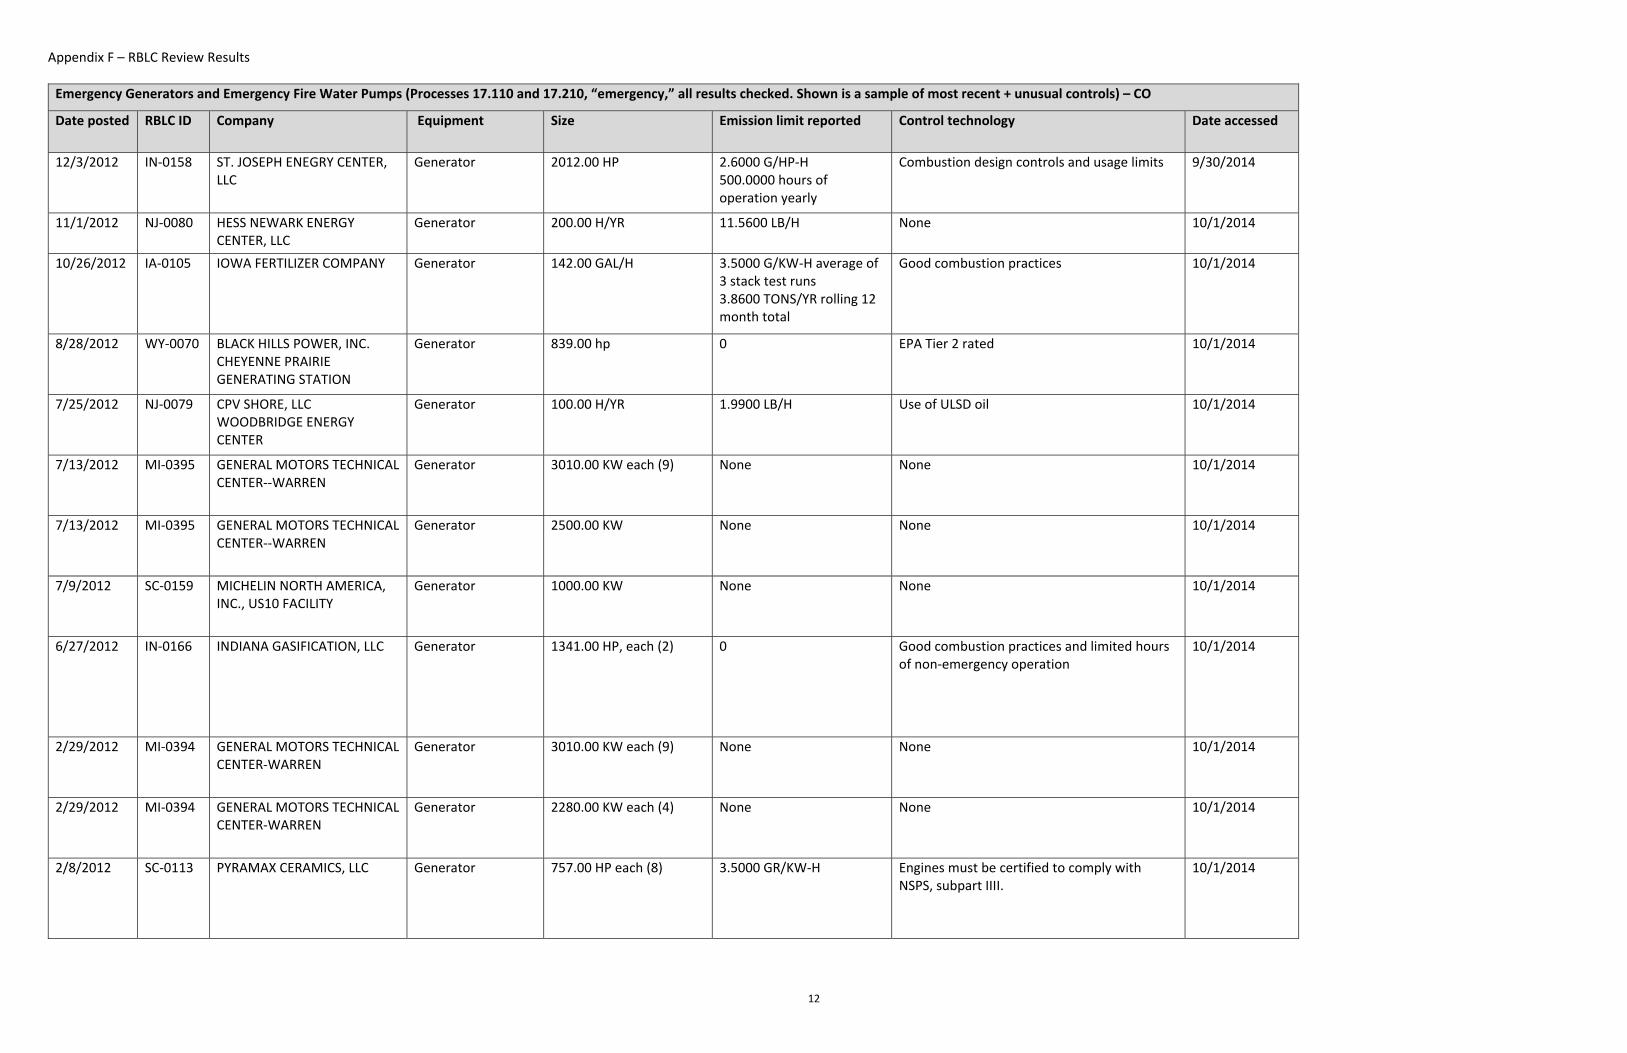
Appendix F – RBLC Review Results
12
Emergency Generators and Emergency Fire Water Pumps (Processes 17.110 and 17.210, “emergency,” all results checked. Shown is a sample of most recent + unusual controls) – CO
Date posted RBLC ID Company Equipment Size Emission limit reported Control technology Date accessed
12/3/2012 IN‐0158 ST. JOSEPH ENEGRY CENTER, LLC
Generator 2012.00 HP 2.6000 G/HP‐H 500.0000 hours of operation yearly
Combustion design controls and usage limits 9/30/2014
11/1/2012 NJ‐0080 HESS NEWARK ENERGY CENTER, LLC
Generator 200.00 H/YR 11.5600 LB/H None 10/1/2014
10/26/2012 IA‐0105 IOWA FERTILIZER COMPANY Generator 142.00 GAL/H 3.5000 G/KW‐H average of 3 stack test runs 3.8600 TONS/YR rolling 12 month total
Good combustion practices 10/1/2014
8/28/2012 WY‐0070 BLACK HILLS POWER, INC. CHEYENNE PRAIRIE GENERATING STATION
Generator 839.00 hp 0 EPA Tier 2 rated 10/1/2014
7/25/2012 NJ‐0079 CPV SHORE, LLC WOODBRIDGE ENERGY CENTER
Generator 100.00 H/YR 1.9900 LB/H Use of ULSD oil 10/1/2014
7/13/2012 MI‐0395 GENERAL MOTORS TECHNICAL CENTER‐‐WARREN
Generator 3010.00 KW each (9) None None 10/1/2014
7/13/2012 MI‐0395 GENERAL MOTORS TECHNICAL CENTER‐‐WARREN
Generator 2500.00 KW None None 10/1/2014
7/9/2012 SC‐0159 MICHELIN NORTH AMERICA, INC., US10 FACILITY
Generator 1000.00 KW None None 10/1/2014
6/27/2012 IN‐0166 INDIANA GASIFICATION, LLC Generator 1341.00 HP, each (2) 0 Good combustion practices and limited hours of non‐emergency operation
10/1/2014
2/29/2012 MI‐0394 GENERAL MOTORS TECHNICAL CENTER‐WARREN
Generator 3010.00 KW each (9) None None 10/1/2014
2/29/2012 MI‐0394 GENERAL MOTORS TECHNICAL CENTER‐WARREN
Generator 2280.00 KW each (4) None None 10/1/2014
2/8/2012 SC‐0113 PYRAMAX CERAMICS, LLC Generator 757.00 HP each (8) 3.5000 GR/KW‐H Engines must be certified to comply with NSPS, subpart IIII.
10/1/2014

Appendix F – RBLC Review Results
13
Emergency Generators and Emergency Fire Water Pumps (Processes 17.110 and 17.210, “emergency,” all results checked. Shown is a sample of most recent + unusual controls) – CO
Date posted RBLC ID Company Equipment Size Emission limit reported Control technology Date accessed
2/8/2012 SC‐0113 PYRAMAX CERAMICS, LLC PYRAMAX CERAMICS, LLC
Emergency engines 29.00 HP (8) 5.5000 GR/KW‐H Purchase of certified engine. Hours of operation limited to 100 hours for maintenance and testing.
10/1/2014
10/27/2011 FL‐0328 ENI U.S. OPERATING COMPANY, INC., HOLY CROSS DRILLING PROJECT
Generator 0 0.0900 tons per year 12‐month rolling
Use of good combustion practices, based on the current manufacturer’s specifications for this engine
10/1/2014
10/27/2011 FL‐0328 ENI U.S. OPERATING COMPANY, INC., HOLY CROSS DRILLING PROJECT
Fire pump 0 0.0050 tons per year 12‐month rolling
Use of good combustion practices, based on the current manufacturer’s specifications for this engine
10/1/2014
10/18/2011 CA‐1212 CITY OF PALMDALE, HYBRID POWER PROJECT
Generator 2683.00 HP 3.5000 G/KW‐H 2.6000 G/HP‐H
None 10/1/2014
10/18/2011 CA‐1212 CITY OF PALMDALE HYBRID POWER PROJECT
Emergency engines 182.00 HP 3.5000 G/KW‐H 2.6000 G/HP‐H
None 10/1/2014
10/3/2011 CA‐1220 SAN DIEGO INTERNATIONAL AIRPORT
Generator 1881.00 BHP None None 10/1/2014
9/23/2011 FL‐0332 HIGHLANDS ENVIROFUELS (HEF), LLC, BIOREFINERY AND COGENERATION PLAN
Fire pump 600 HP 2.6000 G/HP‐H Compliance in accordance with the procedures given in NSPS 40 CFR 60, Subpart IIII.
10/1/2014
9/23/2011 FL‐0332 HIGHLANDS ENVIROFUELS (HEF), LLC, BIOREFINERY AND COGENERATION PLAN
Generator 2,000 kW 3.5000 G/KW‐H Compliance in accordance with the procedures given in NSPS 40 CFR 60, Subpart IIII.
10/1/2014
8/16/2011 LA‐0254 ENTERGY LOUISIANA LLC NINEMILE POINT ELECTRIC GENERATING PLANT
Generator 1250.00 HP 2.6000 G/HP‐H annual average
Ultra low sulfur diesel and good combustion practices
10/1/2014

Appendix F – RBLC Review Results
14
Emergency Generators and Emergency Fire Water Pumps (Processes 17.110 and 17.210, “emergency,” all results checked. Shown is a sample of most recent + unusual controls) – CO
Date posted RBLC ID Company Equipment Size Emission limit reported Control technology Date accessed
8/16/2011 LA‐0254 ENTERGY LOUISIANA LLC NINEMILE POINT ELECTRIC GENERATING PLANT
Fire pump 350.00 HP 2.6000 G/HP‐H LB/MMBTU Ultra low sulfur diesel and good combustion practices
10/1/2014
6/29/2011 MI‐0400 WOLVERINE POWER SUPPLY COOPERATIVE, INC.
Generator 4000.00 HP None None 10/1/2014
6/21/2011 CA‐1192 AVENAL POWER CENTER LLC, ENERGY PROJECT
Fire pump 288.00 HP 0.4470 G/HP‐H Equipped w/ a turbocharger and an intercooler/aftercooler
10/1/2014
11/30/2009 NV‐0050 MGM MIRAGE Generator 2206.00 HP (2) 0.0018 LB/HP‐H 3.9500 LB/H
Turbocharger and good combustion practices 10/1/2014
1/28/2008 MD‐0037 MEDIMMUNE, INC FREDERICK CAMPUS
Generator 2500 KW (2) None None 10/1/2014
12/29/2004 MO‐0067 AQUILA, INC., SOUTH HARPER PEAKING FACILITY
Fire pump 0.47 MMBTU/H None None 10/1/2014

Appendix F – RBLC Review Results
15
Catalytic Ammonia Treatment System (Process “ammonia”) ‐ NOx
Date posted RBLC ID Company Equipment type Emission limit reported Control technology Comments Date accessed
6/4/2014 IN‐0180 MIDWEST FERTILIZER CORPORATION
Ammonia storage flare 0.0680 LB/MMBTU 3‐HR average 125.0000 LB/H, SSM venting 3‐HR average
Natural gas pilot, flare minimization practices 10/6/2014
9/25/2013 IN‐0172 OHIO VALLEY RESOURCES, LLC
Ammonia catalyst startup heater
183.7000 LB/MMCF 3‐HR average Natural gas combustion only, proper design and good combustion practices
10/6/2014
Back end ammonia flare 0.0680 LB/MMBTU 3‐HR average 624.9400 LB/H, SSM events 3‐HR average
Natural gas pilot, flare minimization practices 10/6/2014
Ammonia storage flare 0.0680 LB/MMBTU 3‐HR average 125.0000 LB/H, SSM venting 3‐HR average
Natural gas pilot, flare minimization practices 10/6/2014
9/25/2013 IN‐0179 OHIO VALLEY RESOURCES, LLC
Ammonia catalyst startup heater
183.7000 LB/MMCF 3‐HR average Natural gas combustion only, proper design and good combustion practices
10/6/2014
Back end ammonia flare 0.0680 LB/MMBTU 3‐HR average 624.9400 LB/H, SSM events 3‐HR average
Natural gas pilot, flare minimization practices 10/6/2014
Ammonia storage flare 0.0680 LB/MMBTU 3‐HR average 125.0000 LB/H, SSM venting 3‐HR average
Natural gas pilot, flare minimization practices 10/6/2014
03/27/2013 LA‐0272 DYNO NOBEL LOUISIANA AMMONIA, LLC, PRODUCTION FACILITY
Ammonia start‐up heater (102‐B)
14.6500 LB/H hourly maximum 3.0500 T/YR annual maximum
Good combustion practices: proper design of burner and firebox components; maintaining the proper air‐to‐fuel ratio, residence time, and combustion zone temperature.
10/6/2014
Ammonia storage flare (2202‐B)
0.0400 LB/H hourly maximum 0.1300 T/YR annual maximum
Comply with the minimum heat content and maximum tip velocity provisions of 40 CFR 63 subpart A or adhere to the requirements of 40 CFR 63.11(b)(6)(i); operate flare at all times emissions are being vented to it; operate with flame present at all times.
10/6/2014
10/26/2012 IA‐0105 IOWA FERTILIZER COMPANY
Urea Ammonia Nitrate (UAN) Mixing Tank
None None 10/6/2014
Ammonia Flare There is no numeric emission limit in the permit.
Work practice/good combustion practices 10/6/2014
3/3/2009 LA‐0236 C F INDUSTRIES, INC. DONALDSONVILLE NITROGEN COMPLEX ‐ AMMONIA PLANT
NO. 1, 2, 3, & 4 ammonia plant reformers
None None 10/6/2014
2/23/2009 OK‐0134
PRYOR PLANT CHEMICAL COMPANY
Condensate Steam Flash Drum (EUID 102, EUG 1, Ammonia Plant 4)
None None 10/6/2014
2/23/2009 OK‐0135
PRYOR PLANT CHEMICAL COMPANY
Condensate steam flash drum‐ammonia PLT 4
None None 10/6/2014
2/10/2009 ID‐0017 SOUTHEAST IDAHO ENERGY, LLC, POWER COUNTY ADVANCED ENERGY CENTER
Ammonia storage flare, SRC27
None Good combustion practices. Meet 40 CFR 60.18 10/6/2014

Appendix F – RBLC Review Results
16
Catalytic Ammonia Treatment System (Process “ammonia”) ‐ CO
Date posted
RBLC ID Company Equipment type Emission limit reported Control technology Comments Date accessed
6/4/2014 IN‐0180 MIDWEST FERTILIZER CORPORATION
Ammonia storage flare 0.3700 LB/MMBTU 3‐HR average Natural gas pilot, flare minimization practices 10/6/2014
9/25/2013 IN‐0172 OHIO VALLEY RESOURCES, LLC Ammonia catalyst startup heater
37.2300 LB/MMCF 3‐HR average Natural gas combustion only, proper design and good combustion practices
10/6/2014
Back end ammonia flare 0.3700 LB/MMBTU 3‐HR average 804.7600 LB/H, SSM venting 3‐HR average
Natural gas pilot, flare minimization practices 10/6/2014
Ammonia storage flare 0.3700 LB/MMBTU 3‐HR average Natural gas pilot, flare minimization practices 10/6/2014
9/25/2013 IN‐0179 OHIO VALLEY RESOURCES, LLC Ammonia catalyst startup heater
37.2300 LB/MMCF 3‐HR average Natural gas combustion only, proper design and good combustion practices
10/6/2014
Back end ammonia flare 0.3700 LB/MMBTU 3‐HR average 804.7600 LB/H, SSM venting 3‐HR average
Natural gas pilot, flare minimization practices 10/6/2014
Ammonia storage flare 0.3700 LB/MMBTU 3‐HR average Natural gas pilot, flare minimization practices 10/6/2014
03/27/2013
LA‐0272 DYNO NOBEL LOUISIANA AMMONIA, LLC, PRODUCTION FACILITY
Ammonia start‐up heater (102‐B)
2.9700 LB/H hourly maximum 0.6200 T/YR annual maximum
Good combustion practices: proper design of burner and firebox components; maintaining the proper air‐to‐fuel ratio, residence time, and combustion zone temperature.
10/6/2014
Ammonia storage flare (2202‐B)
0.2000 LB/H hourly maximum 0.7100 T/YR annual maximum
Comply with the minimum heat content and maximum tip velocity provisions of 40 CFR 63 subpart A or adhere to the requirements of 40 CFR 63.11(b)(6)(i); operate flare at all times emissions are being vented to it; operate with flame present at all times.
10/6/2014
10/26/2012 IA‐0105 IOWA FERTILIZER COMPANY Urea Ammonia Nitrate (UAN) Mixing Tank
None None 10/6/2014
Ammonia Flare There is no numeric emission limit in the permit.
Work practice/good combustion practices 10/6/2014
3/3/2009 LA‐0236 C F INDUSTRIES, INC. DONALDSONVILLE NITROGEN COMPLEX ‐ AMMONIA PLANT
NO. 1, 2, 3, & 4 ammonia plant reformers
303.4700 LB/H 301.2900 T/YR
BACT was determined to be optimum combustion control and the use of natural gas as fuel.
10/6/2014
2/23/2009 OK‐0134 PRYOR PLANT CHEMICAL COMPANY
Condensate Steam Flash Drum (EUID 102, EUG 1, Ammonia Plant 4)
None None 10/6/2014
2/23/2009 OK‐0135 PRYOR PLANT CHEMICAL COMPANY
Condensate steam flash drum‐ammonia PLT 4
None None 10/6/2014
2/10/2009 ID‐0017 SOUTHEAST IDAHO ENERGY, LLC, POWER COUNTY ADVANCED ENERGY CENTER
Ammonia storage flare, SRC27
None Good combustion practices. Meet 40 CFR 60.18. 10/6/2014

Appendix G Criteria Pollutant Modeling Protocol and
DEQ Approval

This page intentionally left blank

ES111914104811PDX
Air Dispersion Modeling Protocol for Class II Areas
Intel Corporation Hillsboro and Aloha, Oregon
Prepared for Oregon Department of Environmental Quality
November 2014
Prepared by

This page intentionally left blank
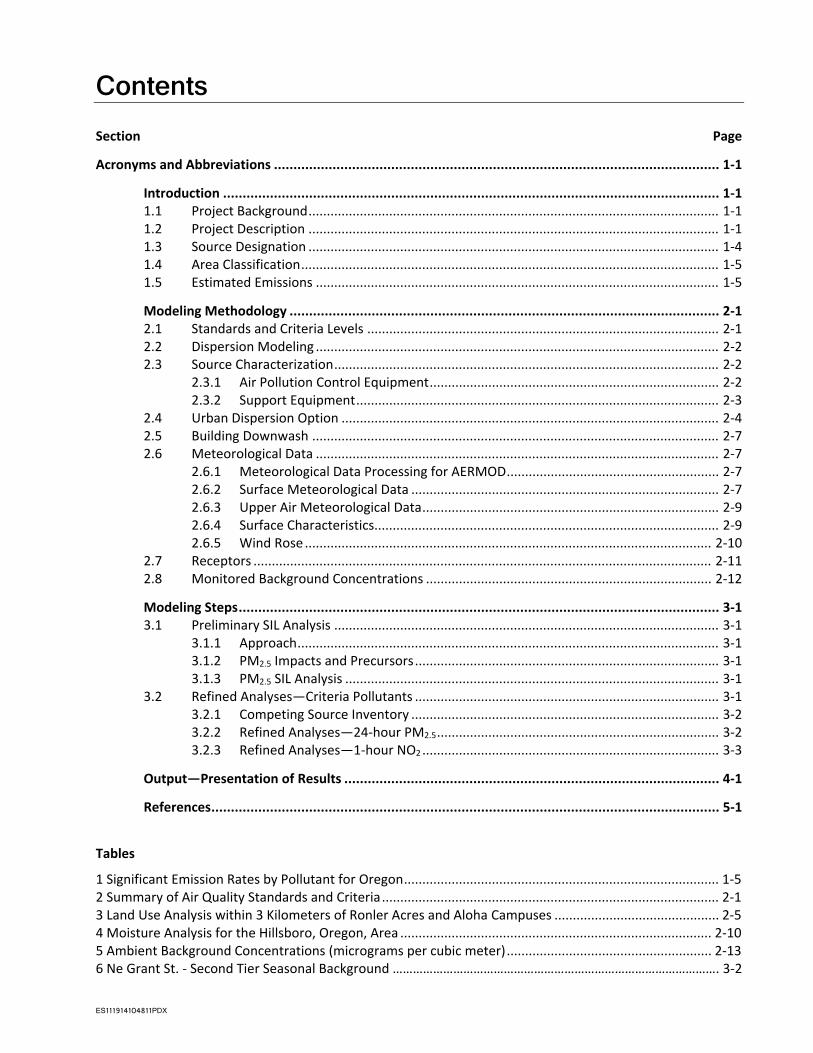
ES111914104811PDX
Contents Section Page
Acronyms and Abbreviations .................................................................................................................. 1‐1
Introduction ............................................................................................................................... 1‐11.1 Project Background ................................................................................................................ 1‐11.2 Project Description ................................................................................................................ 1‐11.3 Source Designation ................................................................................................................ 1‐41.4 Area Classification .................................................................................................................. 1‐51.5 Estimated Emissions .............................................................................................................. 1‐5
Modeling Methodology .............................................................................................................. 2‐12.1 Standards and Criteria Levels ................................................................................................ 2‐12.2 Dispersion Modeling .............................................................................................................. 2‐22.3 Source Characterization ......................................................................................................... 2‐2
2.3.1 Air Pollution Control Equipment ............................................................................... 2‐22.3.2 Support Equipment ................................................................................................... 2‐3
2.4 Urban Dispersion Option ....................................................................................................... 2‐42.5 Building Downwash ............................................................................................................... 2‐72.6 Meteorological Data .............................................................................................................. 2‐7
2.6.1 Meteorological Data Processing for AERMOD .......................................................... 2‐72.6.2 Surface Meteorological Data .................................................................................... 2‐72.6.3 Upper Air Meteorological Data ................................................................................. 2‐92.6.4 Surface Characteristics.............................................................................................. 2‐92.6.5 Wind Rose ............................................................................................................... 2‐10
2.7 Receptors ............................................................................................................................. 2‐112.8 Monitored Background Concentrations .............................................................................. 2‐12
Modeling Steps ........................................................................................................................... 3‐13.1 Preliminary SIL Analysis ......................................................................................................... 3‐1
3.1.1 Approach ................................................................................................................... 3‐13.1.2 PM2.5 Impacts and Precursors ................................................................................... 3‐13.1.3 PM2.5 SIL Analysis ...................................................................................................... 3‐1
3.2 Refined Analyses—Criteria Pollutants ................................................................................... 3‐13.2.1 Competing Source Inventory .................................................................................... 3‐23.2.2 Refined Analyses—24‐hour PM2.5 ............................................................................. 3‐23.2.3 Refined Analyses—1‐hour NO2 ................................................................................. 3‐3
Output—Presentation of Results ................................................................................................ 4‐1
References .................................................................................................................................. 5‐1
Tables
1 Significant Emission Rates by Pollutant for Oregon ...................................................................................... 1‐52 Summary of Air Quality Standards and Criteria ............................................................................................ 2‐13 Land Use Analysis within 3 Kilometers of Ronler Acres and Aloha Campuses ............................................. 2‐54 Moisture Analysis for the Hillsboro, Oregon, Area ..................................................................................... 2‐105 Ambient Background Concentrations (micrograms per cubic meter) ........................................................ 2‐136 Ne Grant St. ‐ Second Tier Seasonal Background ……………………………………………………………………………………. 3‐2

CONTENTS, CONTINUED
Section Page
ES111914104811PDX
Figures
1 Facility Location ............................................................................................................................................. 1‐22 Preliminary Site Plan for Ronler Acres ........................................................................................................... 1‐33 Preliminary Site Plan for Aloha ...................................................................................................................... 1‐44 Land Use Analysis within 3 Kilometers of the Ronler Acres and Aloha Campuses ....................................... 2‐65 Aerial Image Used in Land Use Analysis of the Ronler Acres and Aloha Campuses ...................................... 2‐76 Facility and Airport Weather Station Locations. ........................................................................................... 2‐87 Cumulative Wind Rose for Processed AERMET Data .................................................................................. 2‐108 AERMOD Receptor Grid ............................................................................................................................... 2‐12

ES111914104811PDX I
Acronyms and Abbreviations ACDP Air Contaminant Discharge Permit
AQS Air Quality System
ARM ambient ratio method
ARM2 ambient ratio method Version 2
ASOS Automated Surface Observing System
BPIP Building Profile Input Program algorithm
BSSW Basic Specialty Solvent Waste
CO carbon monoxide
DEQ (Oregon) Department of Environmental Quality
EPA United States Environmental Protection Agency
FAB semiconductor fabrication facility
H2SO4 sulfuric acid
Intel Intel Corporation
ISR in‐stack ratio
km kilometer
km2 square kilometer(s)
µg/m3 micrograms per cubic meter
m meter
m/s meter per second
MAO Mutual Agreement and Order
NAAQS national ambient air quality standards
NAD83 North American Datum 1983
NCDC National Climatic Data Center
NLCD National Land Cover Database
NOx nitrogen oxide
NSR new source review
NWS National Weather Service
OLM ozone‐limiting method
PM2.5 particulate matter less than 2.5 micrometers in aerodynamic diameter
PM10 particulate matter less than 10 micrometers in aerodynamic diameter
PRIME Plume Rise Model Enhancement
PSD prevention of significant deterioration
RCTO rotor concentrator thermal oxidizer(s)

ACRONYMS, CONTINUED
II ES111914104811PDX
SER significant emission rate
SIL significant impact level(s)
SO2 sulfur dioxide
TMXW Trimix Waste Treatment System
tpy ton(s) per year
USGS United States Geological Survey
VOC volatile organic compound(s)

SECTION 1
ES111914104811PDX 1-1
Introduction 1.1 Project Background Intel Corporation (Intel) operates the Aloha and Ronler Acres facilities in Washington County, Oregon. These two facilities constitute a single collocated source that are regulated under a single Standard Air Contaminant Discharge Permit (ACDP), 34‐2681‐SI‐01, issued by the Oregon Department of Environmental Quality (DEQ) in 2007. In March, 2014, DEQ entered into a Mutual Agreement and Order (MAO, No. AQ/AC‐NWR‐14‐027) with Intel. As part of the MAO, Intel is required to submit a Type 4 ACDP application by December 31, 2014. This application needs to include dispersion modeling for those criteria pollutants for which the requested Plant Site Emission Limit (PSEL) exceeds the netting basis by a significant emission rate (SER) or more as required by OAR 340‐222‐0041(3)(b)(C) and 340‐224‐0060(3). Additionally, the MAO requires dispersion modeling for fluorides and hydrogen fluoride including a comparison of accepted risk‐based chronic exposure thresholds to modeled concentrations at the nearest residences. The Type 4 application will include all sources at both facilities that began construction on or after February 14, 2011, other existing sources that have not been included in previous permit activities, and proposed future projects associated with the source expansion.
This modeling protocol describes the modeling steps that will be performed to support the Type 4 permit application and additional modeling required by the MAO.
1.2 Project Description Ronler Acres and Aloha are semiconductor manufacturing sites. The Aloha campus has been operating since 1976 while the Ronler Acres campus began operation in 1994. The campuses operate under a single, standard ACDP, permit no. 34‐2681‐ST‐01, issued on December 31, 2007. Semiconductor manufacturing begins with a silicon wafer substrate. It then involves growth or application of various layers, patterning using photoresist, thermal diffusion, etching, doping, metallization, acid or solvent treatments, and ultrapure water rinse steps. There are multiple processes with unique recipe steps. Many of these steps are repeated multiple times in various sequences with variations in each step. Significant technology revisions occur approximately every 2 years.
Emission sources exist in two distinct areas at the sites: the semiconductor fabrication facilities (FABs) and utility support systems. The manufacturing process takes place in a clean environment and the process involves several steps and process chemicals.
Modeled sources of regulated pollutants include the following:
Large natural gas‐fired boilers (>2.0 million British thermal units per hour)
Diesel‐fired emergency generators
Wet cell cooling towers
Natural gas‐fired rotor concentrator thermal oxidizers (RCTOs) used to control volatile organic compounds (VOC) emissions from the FABs
Small (<2.0 million British thermal units per hour) natural gas‐fired heating units and boilers
FAB tools controlled primarily by wet fume water scrubbers
A number of smaller sources associated with waste and wastewater treatment
The locations of the Ronler Acres and Aloha campuses are shown in Figure 1. The preliminary site plans are presented in Figures 2 and 3, respectively.

SECTION 1 INTRODUCTION
1-2 ES111914104811PDX
FIGURE 1 Facility Location

SECTION 1 INTRODUCTION
ES111914104811PDX 1-3
FIGURE 2 Preliminary Site Plan for Ronler Acres
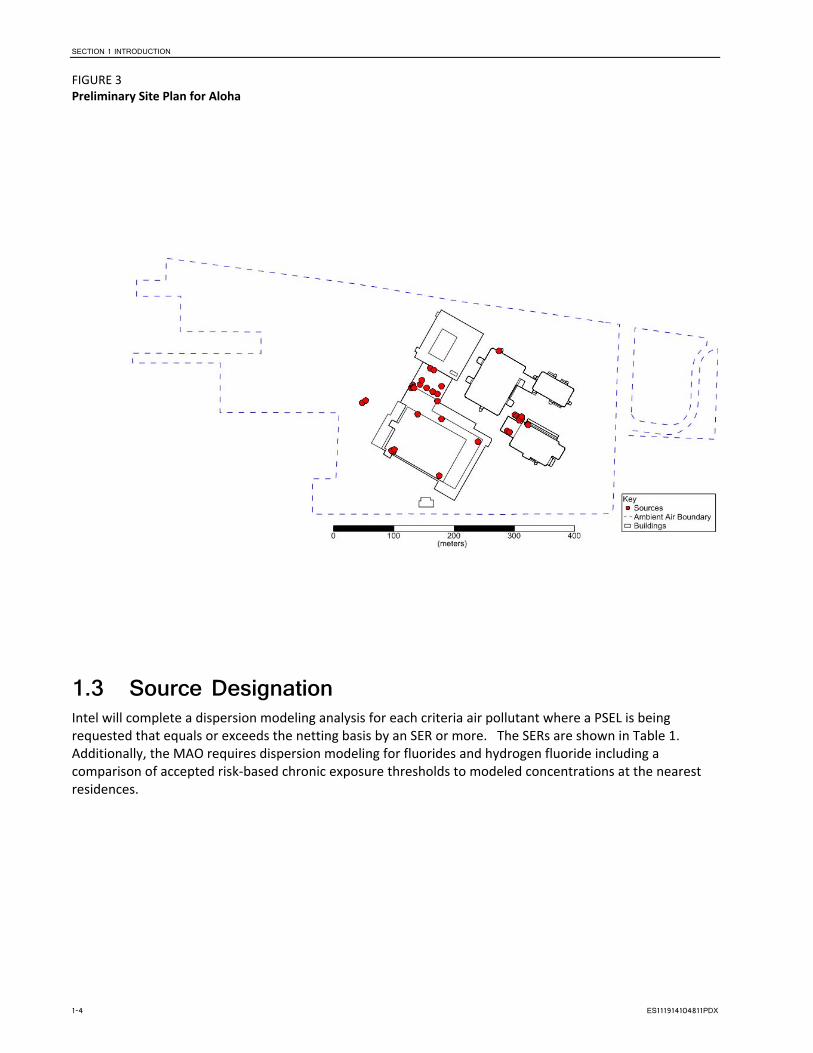
SECTION 1 INTRODUCTION
1-4 ES111914104811PDX
FIGURE 3 Preliminary Site Plan for Aloha
1.3 Source Designation Intel will complete a dispersion modeling analysis for each criteria air pollutant where a PSEL is being requested that equals or exceeds the netting basis by an SER or more. The SERs are shown in Table 1. Additionally, the MAO requires dispersion modeling for fluorides and hydrogen fluoride including a comparison of accepted risk‐based chronic exposure thresholds to modeled concentrations at the nearest residences.

SECTION 1 INTRODUCTION
ES111914104811PDX 1-5
TABLE 1 Significant Emission Rates by Pollutant for Oregon
Pollutant Significant Emission Rates (tpy)
Carbon Monoxide (CO) 100
Nitrogen Oxide (NOx) 40
Sulfur Dioxide (SO2) 40
Fine Particulate Matter (PM10) 15
Ultra‐Fine Particulate Matter (PM2.5) 10
Hydrogen Fluoride NA
Fluoride 3
Volatile Organic Compound (VOC)a 40
Sulfuric Acid Mista 7
Greenhouse Gasa 75,000
aThese additional new source review (NSR) pollutants are listed for reference; currently, there are no modeling requirements for these pollutants under Oregon’s NSR program.
Notes: tpy = tons per year PM10 = particulate matter less than 10 micrometers in aerodynamic diameter PM2.5 = particulate matter less than 2.5 micrometers in aerodynamic diameter
1.4 Area Classification The Ronler Acres and Aloha campusess are located in Washington County, Oregon. The area in which the campusess are located is designated as attainment or unclassified for all criteria pollutants except carbon monoxide (CO) and ozone, for which the area is designated as maintenance.
1.5 Estimated Emissions Criteria pollutants evaluated for modeling applicability are PM10, PM2.5, NOX, CO, and SO2. Based on preliminary emission estimates, an air dispersion modeling analysis would be required and is proposed for PM10, PM2.5, NOX, and CO. Additionally, modeling will be completed for hydrogen fluoride and total fluorides as required by the MAO.

This page intentionally left blank

SECTION 2
ES111914104811PDX 2-1
Modeling Methodology Modeled concentrations will be compared to the applicable Significant Impact Level (SIL) shown in Table 2. If the predicted impacts are not significant (that is, less than the SIL), the modeling is complete for that pollutant and averaging period and compliance with the NAAQS is demonstrated. If impacts are significant, a more refined analysis will be conducted for demonstration of compliance with the NAAQS.
For all pollutants other than PM2.5, the modeled emission rates used for comparison to the SIL will reflect the amount by which the requested PSEL exceeds the netting basis. For PM2.5, the modeled emission rates will reflect that equipment added to the source on or after May 1, 20111. PM2.5 emissions from equipment that predates the regulation and establishment of the PM2.5 netting basis is not included in the SIL analysis.
2.1 Standards and Criteria Levels The applicable criteria adopted by Oregon including the SIL and NAAQS are summarized in Table 2.
TABLE 2 Summary of Air Quality Standards and Criteria
Pollutant Averaging Period
Primary NAAQSe
(μg/m3) Significant Impact Level
(μg/m3) Secondary NAAQS
μg/m3
PM10 24‐Hour 150a 1 150
PM10 Annual ‐‐ 0.2 ‐‐
PM2.5 24‐Hour 35c 1.2 35
PM2.5 Annual 15 0.3 15
NO2 Annual 100 1 100
NO2 1‐Hourf 188d 7.8 ‐‐
CO 1‐Hour 40,000b 2,000 ‐‐
CO 8‐Hour 10,000b 500 ‐‐
aNot to be exceeded more than once per year on average over 3 years.
bAllowed to be exceeded once per year.
c3‐year average of the 98th percentile of the 24‐hour concentration
d98th percentile averaged over 3 years.
eThe national ambient air quality standards (NAAQS) for the pollutants included in this modeling analysis are equivalent to the Oregon state ambient air quality standards for those pollutants.
Note:
‐‐ = no standard CO = carbon monoxide μg/m3 = microgram(s) per cubic meter NO2 = nitrogen dioxide PM10 = particulate matter less than 10 micrometers in aerodynamic diameter PM2.5 = particulate matter less than 2.5 micrometers in aerodynamic diameter
1 All sources that are part of the Project beginning February 14, 2011 were installed on or after May 1, 2011, so all Project sources will be included in the PM2.5 modeling.

SECTION 2 MODELING METHODOLOGY
2-2 ES111914104811PDX
2.2 Dispersion Modeling The AERMOD model (Version 14134) will be used with regulatory default options as recommended in the United States Environmental Protection Agency (EPA) Guideline on Air Quality Models (EPA, 2005) The following supporting preprocessing programs for AERMOD will also be used:
BPIP‐Prime (Version 04274)
AERMET (Version 14134)
AERMAP (Version 11103)
AERMOD is a steady‐state Gaussian plume model that simulates air dispersion based on planetary boundary layer turbulence structure and scaling concepts, including treatment of both surface and elevated sources, and both simple and complex terrain. This model is recommended for short‐range (< 50 kilometers [km]) dispersion from the source. The model incorporates the Plume Rise Model Enhancement (PRIME) algorithm for modeling building downwash. AERMOD is designed to accept input data prepared by two specific preprocessor programs, AERMET and AERMAP. AERMOD will be run with the following options:
Regulatory default options
URBAN option as described in Section 2.4
Direction‐specific building downwash
Actual receptor elevations and hill‐height scales obtained from AERMAP
2.3 Source Characterization In February 2011, Intel began construction of the Ronler Acres campus expansion based on a Type 2 construction approval for the expansion issued December 20, 2010. As part of the March 2014 MAO, Intel is required to submit a Type 4 ACDP application for the combined Facility specifying the following:
Equipment identified in 2010
Any equipment existing or planned for which construction approval was not obtained
Any additional equipment reasonably identifiable at this time for the Ronler Acres campus expansion
For the SIL and NAAQS demonstration modeling, all relevant sources will be modeled as point sources in AERMOD. The emission sources fall into one of eight categories: Scrubbers, RCTOs, Boilers, Heaters, Emergency Generators, Cooling Towers, Trimix Waste Treatment System (TMXW), or Basic Specialty Solvent Waste (BSSW). A brief description of each source type and the properties is provided in Sections 2.3.1 and 2.3.2. In general, all of the emission rates and other source parameters will be determined from manufacturer’s data, source testing, EPA‐established emission factors, design plans, or a combination of methods. Final source characteristics and maximum emission rates will be presented in the Application.
2.3.1 Air Pollution Control Equipment 2.3.1.1 Packed-Bed Wet Chemical Scrubbers (Scrubbers) Exhaust air from the FABs contain primarily inorganic acids. Each FAB has several acid gas scrubbers to treat the FAB process exhaust. The exhaust passes through a packed bed with water flowing through. The gases in the exhaust are transferred out of the air stream into the water stream, which is sent to the Acid Waste Neutralization wastewater treatment system where it is neutralized. The treated exhaust streams are then sent out to the atmosphere via a manifold with between one and five stacks. For the air dispersion modeling analysis, the sum of emissions from all scrubbers exhausting to a given manifold will be modeled as emitting from one “pseudo‐stack” representing each set of scrubber stacks.
The scrubber emissions and stack properties were determined using the manufacturer’s engineering specifications, worst‐case engineering calculations, or site testing data.
SECTION 2 MODELING METHODOLOGY
ES111914104811PDX 2-3
2.3.1.2 Rotor Concentrator Thermal Oxidizers RCTOs consist of two main components: a concentrator that uses zeolite wheels to adsorb VOCs from the Fab exhaust and a thermal oxidizer that oxidizes the VOCs into water and carbon dioxide. The RCTOs overall efficiencies are above 90 percent and typically greater than 98 percent. The RCTOs are a source of natural gas combustion byproducts, CO2, and VOCs that are not adsorbed by the zeolite concentrator. Each RCTO stack will be included in the model as a point source.
The emissions and stack properties were determined using the manufacturer’s engineering specifications, worst‐case engineering calculations, or onsite testing data.
2.3.2 Support Equipment 2.3.2.1 Cooling Towers The facility has mechanically induced (i.e., fan‐driven) wet cell cooling towers that are open to the atmosphere. The cooling towers are used to dissipate the large heat loads generated by the factory and to condition the incoming air to the correct temperature required by the factory. The cooling towers are a source of particulate matter. Cooling towers will be modeled in two specific ways:
1. Cooling towers with a single fan will be modeled using one stack located in the fan center and the maximum design flow and actual fan diameter will be used for the stack parameters.
2. Multiple fans that are part of a single cooling tower assembly will be modeled using a single stack located in the center of the assembly. The maximum design flow from the cooling tower assembly will be divided by the number of fans to get the representative flow. The diameter for the representative stack will be the diameter of a single fan.
The cooling tower emissions were determined using the manufacturer’s engineering specifications, worst‐case engineering calculations, or onsite testing data.
2.3.2.2 Boilers The boilers supply hot water to the various buildings and manufacturing processes. All of Intel’s boilers are natural gas fired. Air emissions from the boilers are those associated with natural gas combustion.
Boiler emissions and stack properties were determined using the manufacturer’s engineering specifications, worst‐case engineering calculations, or onsite testing data.
2.3.2.3 Ammonia Treatment System (TMXW) The TMXW system is an ammonia wastewater treatment system that includes gas‐phase ammonia abatement. Ammonia wastewater is pH adjusted and fed to an ammonia stripper. The ammonia stripper is a desorption process that removes ammonium ions out of the water to produce gas‐phase ammonia. The gas‐phase ammonia is exhausted to a two‐stage thermal catalytic oxidation/reduction system. The first catalyst converts ammonia to NOx and CO to carbon dioxide. The second catalyst converts NOx to nitrogen and water. Air emissions from this system include natural gas combustion byproducts and ammonia. The air emissions exit to ambient air via a stack. Each emission point will be modeled separately.
The TMXW emissions and stack properties were determined using the manufacturer’s engineering specifications, worst‐case engineering calculations, or onsite testing data.
2.3.2.4 Basic Specialty Solvent Waste The BSSW treatment stabilizes a solvent waste prior to offsite shipment. The treatment occurs in a tank that is exhausted to a thermal processing unit to remove the VOCs. The air emissions from this system are associated with natural gas combustion and VOCs that are not removed.
BSSW emissions are exhausted to the RCTOs.

SECTION 2 MODELING METHODOLOGY
2-4 ES111914104811PDX
2.3.2.5 Emergency Generators In addition to backing up all critical Life Safety Systems, emergency generators back‐up systems required by code and business continuity needs at the Facility in the event of an unplanned primary power outage. The generators combust ultra‐low‐sulfur diesel and are routinely tested to ensure proper operation. For permitting purposes, air emissions are limited to periods when the emergency equipment is tested and maintained. Generator testing is limited to 30 hours per year or one hour per day for the emergency generators and 50 hours per year or one hour per day for the emergency fire pumps. Additional operating restrictions may be included to better represent the actual testing schedule as defined in the application.
Emergency generator emissions and stack properties were determined using manufacturer’s engineering specifications, regulatory guidance, worst‐case engineering calculations, or onsite testing data.
2.4 Urban Dispersion Option Urban areas have increased surface heating compared to neighboring rural areas because of human activities and the presence of structures that increase heat absorption and surface roughness. This phenomenon is called the urban heat island effect. This urban heat island effect typically causes a regional ‘convective‐like’ boundary layer to form during nighttime conditions, which impacts pollutant dispersion. The AERMOD implementation guide recommends modeling urban sources using the URBAN regulatory default model option to account for the dispersive nature of the urban heat island effect. When this option is used, AERMOD will enhance the turbulence for urban nighttime conditions over that which is expected in the nearby rural stable boundary layer. Additionally, the boundary layer height is defined to account for the limited mixing that typically occurs under these conditions. The magnitude of the heat island effect is driven by the urban‐rural temperature differences that develop during nighttime conditions.
To determine the urban/rural classification for Intel emission sources, a land use analysis was performed using the Auer land use methodology (Auer, 1978). This analysis results, shown in Table 3, have determined the dispersion environment surrounding the Facilities to be urban. This determination was made by analyzing specific land use categories based on the 2006 United States Geological Survey (USGS) National Land Cover Database (NLCD). Figure 4 presents the land use data within the 3‐km radius identified for each site. Figure 5 provides an aerial photograph of the same area for supporting documentation. The more recent aerial photo confirms that the 2006 land use data remain generally valid for these campuses.
The 2006 USGS NLCD data classify the land use for individual 30m x 30m cells into 16 primary land use categories. Of the 16 land use categories, the following three categories would be considered urban under the Auer Methodology for dispersion modeling purposes:
Developed, Low Intensity (NLDC Code 22) ‐ areas with a mixture of constructed materials and vegetation. Impervious surfaces account for 20 to 49 percent of total cover. These areas most commonly include single‐family housing units.
Developed, Medium Intensity (NLCD Code 23) – This classification includes areas with a mixture of constructed materials and vegetation. Impervious surfaces account for 50 to 79 percent of the total cover.
Developed, High Intensity (NLCD Code 24) – This classification includes highly developed areas where people reside or work in high numbers. Examples include apartment complexes, row houses and commercial/industrial. Impervious surfaces account for 80 to 100 percent of the total cover.
Table 3 shows that approximately 69 percent of the area within 3 km of the Ronler Acres campus, and 75 percent of the area within 3 km of the Aloha campus, are characterized by these urban land use types. Because the area within 3 km is more than 50 percent classified as urban land use, the URBAN option will be used for AERMOD modeling of the Facility and the urban population of the modeling domain should be used within the model as well. Typically, the population value should be equal to the population of the counties contained within the modeling domain. The modeling domain includes receptors in Washington, Clackamas,

SECTION 2 MODELING METHODOLOGY
ES111914104811PDX 2-5
Yamhill, and Multnomah counties. Since the grid does not cover the complete area of each of these counties, only the populations of Washington, Clackamas, and Multnomah counties were considered. Using the latest U.S. Census Bureau estimates of population (2010), the total population for these three counties is 1.7 million; this population will be input to AERMOD for use in the urban modeling of the Facility.
TABLE 3 Land Use Analysis within 3 Kilometers of Ronler Acres and Aloha Campuses
Auer Analysis – 3‐km Radius
NLCD2006 Code Description
Ronler Acres Aloha
Count Area (km2) Fraction of Total Area Count
Area (km2)
Fraction of Total Area
11 Open Water 42 0.04 0% 0 0.00 0%
21 Developed, Open Space 2583 2.32 8% 1630 1.47 5%
22 Developed, Low Intensity 8544 7.69 28% 10981 9.88 35%
23 Developed, Medium Intensity 8410 7.57 27% 10996 9.90 35%
24 Developed, High Intensity 4372 3.93 14% 1701 1.53 5%
41 Deciduous Forest 6 0.01 0% 315 0.28 1%
42 Evergeen Forest 64 0.06 0% 724 0.65 2%
43 Mixed Forest 13 0.01 0% 5 0.00 0%
52 Scrub/Shrub 47 0.04 0% 9 0.01 0%
71 Grassland/Herbaceous 275 0.25 1% 634 0.57 2%
81 Pasture/Hay 2580 2.32 8% 1110 1.00 4%
82 Cultivated Crops 3307 2.98 11% 2815 2.53 9%
90 Woody Wetlands 600 0.54 2% 489 0.44 2%
95 Emergent Herbaceous Wetlands 80 0.07 0% 10 0.01 0%
TOTAL 30923 27.8307 100% 31419 28.2771 100%
% Urban 69% 75%
Notes:
km = kilometer(s)
km2 = square kilometer(s)
Orange highlighting indicates “urban” land use category.
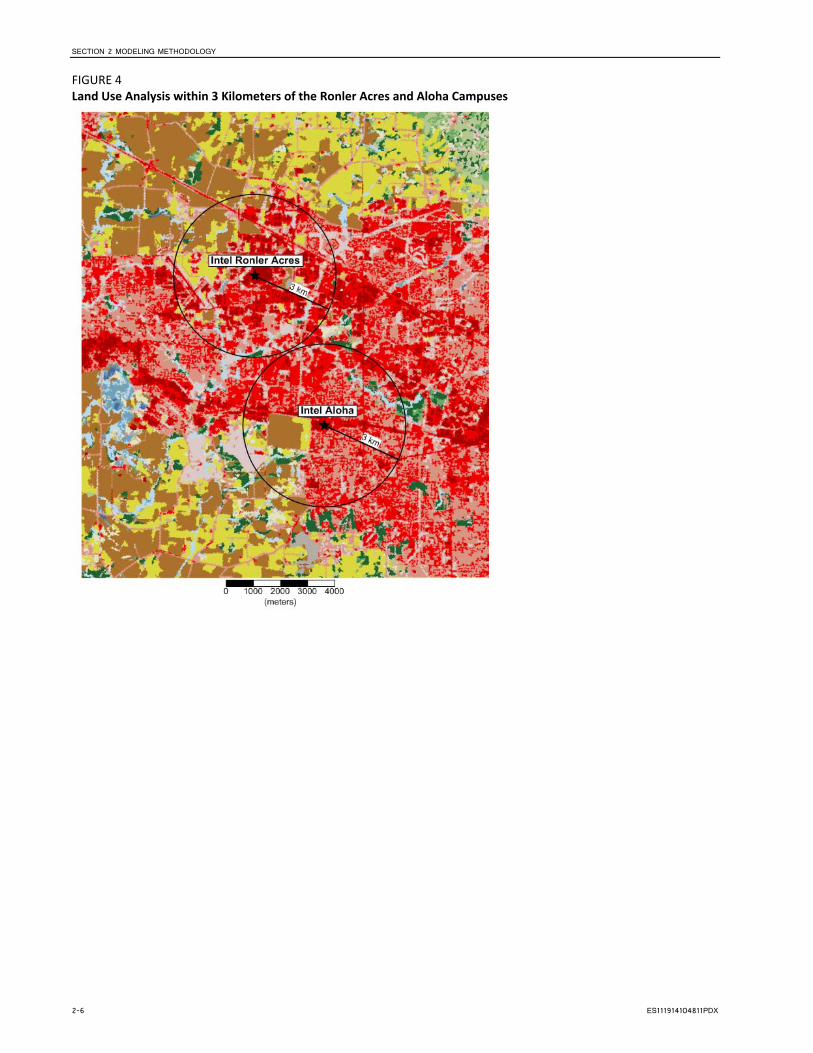
SECTION 2 MODELING METHODOLOGY
2-6 ES111914104811PDX
FIGURE 4 Land Use Analysis within 3 Kilometers of the Ronler Acres and Aloha Campuses

SECTION 2 MODELING METHODOLOGY
ES111914104811PDX 2-7
FIGURE 5 Aerial Image Used in Land Use Analysis of the Ronler Acres and Aloha Campuses
2.5 Building Downwash Building influences on stacks are calculated by incorporating the updated EPA Building Profile Input Program for use with the PRIME algorithm (BPIP‐PRIME). The stack heights used in the dispersion modeling will be the actual stack height or Good Engineering Practice stack height, whichever is less.
2.6 Meteorological Data 2.6.1 Meteorological Data Processing for AERMOD Meteorological data from 2009 through 2013 will be combined into AERMOD‐ready surface and upper air input files using the EPA‐approved meteorological data preprocessor for the AERMOD dispersion model, AERMET (v14134).
2.6.2 Surface Meteorological Data 2.6.2.1 Data Selection and Representativeness Both the Ronler Acres and Aloha campuses are located to the west of Portland, Oregon, as shown in Figure 6. The closest National Weather Service (NWS) station to the Facility is located at the Hillsboro Airport (USAF: 726986, WBAN: 94261), also shown in Figure 6. The Ronler Acres campus is approximately 3 km from the Hillsboro Airport and the Aloha campus is approximately 7 km from the airport. Prior to utilizing meteorological data collected at a NWS Station for air dispersion modeling, EPA recommends an analysis of the data collection site be conducted to determine if the NWS data are representative of the Facility.
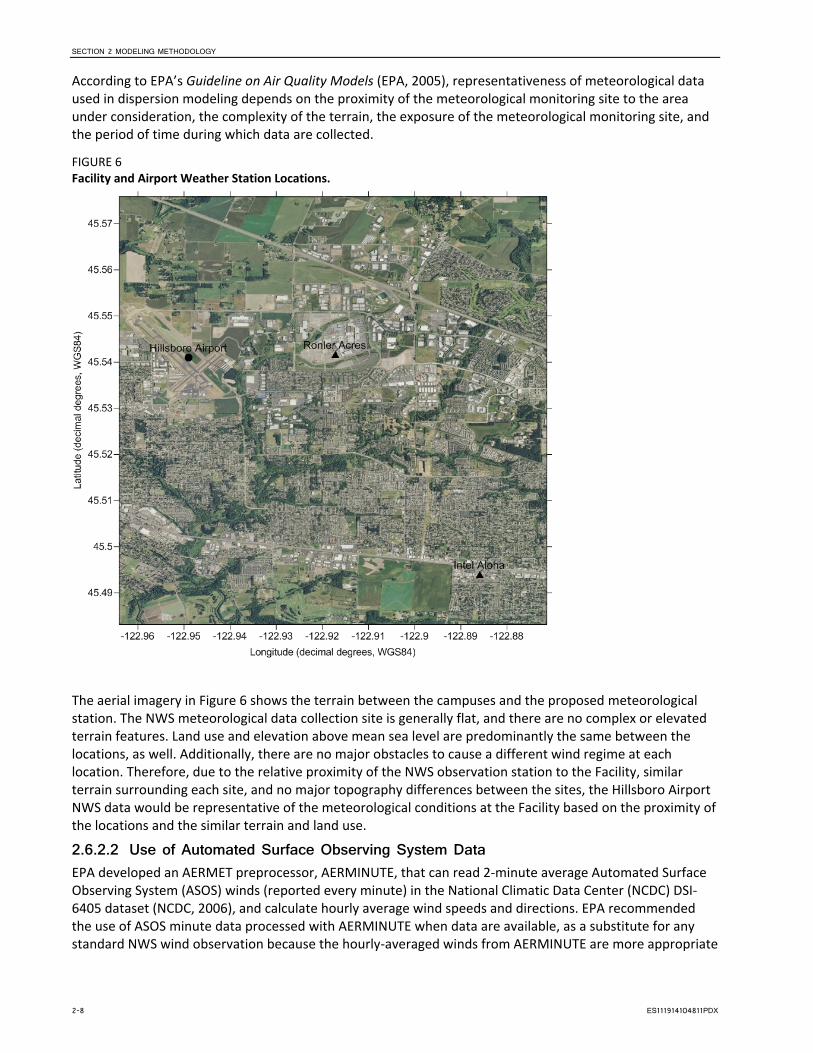
SECTION 2 MODELING METHODOLOGY
2-8 ES111914104811PDX
According to EPA’s Guideline on Air Quality Models (EPA, 2005), representativeness of meteorological data used in dispersion modeling depends on the proximity of the meteorological monitoring site to the area under consideration, the complexity of the terrain, the exposure of the meteorological monitoring site, and the period of time during which data are collected.
FIGURE 6 Facility and Airport Weather Station Locations.
The aerial imagery in Figure 6 shows the terrain between the campuses and the proposed meteorological station. The NWS meteorological data collection site is generally flat, and there are no complex or elevated terrain features. Land use and elevation above mean sea level are predominantly the same between the locations, as well. Additionally, there are no major obstacles to cause a different wind regime at each location. Therefore, due to the relative proximity of the NWS observation station to the Facility, similar terrain surrounding each site, and no major topography differences between the sites, the Hillsboro Airport NWS data would be representative of the meteorological conditions at the Facility based on the proximity of the locations and the similar terrain and land use.
2.6.2.2 Use of Automated Surface Observing System Data EPA developed an AERMET preprocessor, AERMINUTE, that can read 2‐minute average Automated Surface Observing System (ASOS) winds (reported every minute) in the National Climatic Data Center (NCDC) DSI‐6405 dataset (NCDC, 2006), and calculate hourly average wind speeds and directions. EPA recommended the use of ASOS minute data processed with AERMINUTE when data are available, as a substitute for any standard NWS wind observation because the hourly‐averaged winds from AERMINUTE are more appropriate

SECTION 2 MODELING METHODOLOGY
ES111914104811PDX 2-9
inputs for dispersion modeling2. ASOS data are available for the Hillsboro Airport during the years of interest (2009 to 2013) and will be obtained from the NCDC Web site3 and processed using the most recent version of AERMINUTE (Version 14237). The recommended value for the wind speed threshold of 0.5 meter per second (m/s) will be used in the AERMET stage 3 processing.
2.6.3 Upper Air Meteorological Data AERMET also requires concurrent daily upper air sounding data. The closest upper air station is located at the Salem, Oregon, airport (Station ID USAF: 72694, WBAN: 24232), which is located approximately 60 miles south of the Hillsboro Airport. Data from the Salem station from 2009 through 2013 will be obtained from the National Oceanic and Atmospheric Administration Web site for use in AERMET.
2.6.4 Surface Characteristics Additionally, the noontime albedo, daytime Bowen ratio, and surface roughness lengths are considered when conducting the stage 3 AERMET processing. Together these comprise the surface characteristics used by AERMET to calculate the boundary layer parameters. Surface characteristics can vary by month and sector around the data collection site. The midday albedo is the fraction of total incident solar radiation reflected by the surface back to space without absorption. The daytime Bowen ratio is an indicator of surface moisture, which is the ratio of the sensible heat flux to the latent heat flux. The Bowen ratio is used to determine the planetary boundary layer parameters for convective conditions. Surface roughness length is related to the height of obstacles to the wind flow and is the height at which the mean horizontal wind speed is zero.
The EPA has developed a computer program called AERSURFACE (Version 13016) to aid in obtaining realistic and reproducible surface characteristic values for the albedo, Bowen ratio, and surface roughness length for input to AERMET. The program uses publicly available national land cover datasets and look‐up tables of surface characteristics that vary by land cover type and season. Land cover data from the USGS NLCD92 will
be used for the modeling as recommended by the AERSURFACE user guide4. Because surface conditions can vary by season, the Monthly option is proposed for use in AERSURFACE. For the albedo and Bowen ratio characterization, a 10‐km radius will be used. Surface roughness can vary by direction or sector so a 1‐km radius circle split into 12 sectors is proposed for surface roughness determination. The surface characterization values from AERSURFACE will be used in stage 3 of AERMET processing based on the moisture classification of the particular model year.
2.6.4.1 Moisture Analysis In addition to location and land‐use, the AERSURFACE preprocessor requires characterization of the surface moisture for the meteorological year being processed. Total precipitation for each year processed was determined from the NWS data and compared to the 30th percentile and 70th percentile of the 30‐year precipitation record obtained from the Western Regional Climate Center5 for the Hillsboro, Oregon, COOP station (ID: 353908‐2). The yearly totals and moisture characterization for each year are summarized in Table 4.
2 http://www.epa.gov/scram001/guidance/clarification/20130308_Met_Data_Clarification.pdf
3 ftp://ftp.ncdc.noaa.gov/pub/data/asos‐onemin
4 http://www.epa.gov/ttn/scram/7thconf/aermod/aersurface_userguide.pdf
5 http://www.wrcc.dri.edu/cgi‐bin/cliMAIN.pl?or3908

SECTION 2 MODELING METHODOLOGY
2-10 ES111914104811PDX
TABLE 4 Moisture Analysis for the Hillsboro, Oregon, Area
Precipitation (inches) Moisture Classification
Historical Data 30‐Year 50th percentile 38.62 Average
30‐Year 30th percentile <34.36 Dry
30‐Year 70th percentile >42.08 Wet
Model Years 2009 29.01 Dry
2010 43.68 Wet
2011 30.72 Dry
2012 43.87 Wet
2013 24.16 Dry
2.6.5 Wind Rose A cumulative wind rose for data from years 2009 through 2013 of the AERMET processed surface files for the Hillsboro Airport is shown in Figure 7. The predominant wind direction is from the northwest and the 5‐year mean wind speed is 2.5 m/s.
FIGURE 7 Cumulative Wind Rose for Processed AERMET Data

SECTION 2 MODELING METHODOLOGY
ES111914104811PDX 2-11
2.7 Receptors The ambient air boundary will be defined by the property line surrounding the campuses. The selection of receptors in AERMOD will be as follows:
The first run will use a nested Cartesian grid as follows:
25‐meter (m) spacing along the ambient air boundary.
50‐m spacing from ambient air boundary to 500 m from the campus center
100‐m spacing from beyond 500 m to 1 km from the campus center
250‐m spacing from beyond 1 km to 5 km from the campus center
500‐m spacing from beyond 5 km to 10 km from the campus center
1,000‐m spacing from beyond 10 km to 20 km from the campus center
Each campus will have its own grid and the two grids will be joined halfway between the two campuses. This ensures fine coverage close in to the sites. The receptor grid is displayed in Figure 8.
A second run using a fine receptor grid will be centered on the point of maximum impact and rerun using a 100‐m grid spacing, unless the initial maximum occurs on the ambient air boundary or within the 100‐m grid.
Receptor elevations will be calculated by AERMAP..
AERMAP (Version 11103) will be used to process terrain elevation data for all sources and receptors using National Elevation Dataset files prepared by the USGS. AERMAP first determines the base elevation at each source and receptor. For complex terrain situations, AERMOD captures the physics of dispersion and creates elevation data for the surrounding terrain identified by a parameter called hill height scale. AERMAP creates hill height scale by searching for the terrain height and location that has the greatest influence on dispersion for each individual source and receptor. Both the base elevation and hill‐height scale data are produced for each receptor by AERMAP as a file or files that can be directly accessed by AERMOD.
All receptors and source locations will be expressed in the Universal Transverse Mercator North American Datum 1983 (NAD83), Zone 10 coordinate system.

SECTION 2 MODELING METHODOLOGY
2-12 ES111914104811PDX
FIGURE 8 AERMOD Receptor Grid
2.8 Monitored Background Concentrations Ambient background concentration data used for this analysis are from two sites, all pollutants except PM2.5 are from EPA AQS station in Portland, Oregon (5824 SE Lafayette St.), and PM2.5 background data are from the EPA AQS station in Hillsboro, Oregon (1149 NE Grant St.) The ambient background design values for the pollutants modeled were provided by DEQ. This SE Lafayette St. site was chosen because three years of consecutive data (2010‐2012) for the pollutants being modeled are available. The monitor site is approximately 28 km from the Facility and is therefore considered representative. The NE Grant St. PM2.5 monitor is located approximately 5 km from the Facility. Since this monitoring site is closer to the Facility and has recent PM2.5 data (2011‐2013), DEQ has requested the use of the data from this site for the PM2.5 background. Table 5 shows the monitored concentrations for CO, PM10, and nitrogen dioxide (NO2) from the SE Lafayette site and PM2.5 from the NE Grant St. site. Unless noted, all concentrations are the highest value for the monitored year.

SECTION 2 MODELING METHODOLOGY
ES111914104811PDX 2-13
TABLE 5 Ambient Background Concentrations (micrograms per cubic meter)
Pollutant Value Description 2010 2011 2012
CO 1‐hour 3,200 3,886 4,229
8‐hour 2,743 2,971 2,629
PM2.5a 24‐hourb 36.3 22.2 42.8
Annual 8.7 7.1 9.3
PM10 24‐hourc 35 52 46
NO2
1‐hour Using Season‐Hour‐of‐Day Profile
Annual 17 18 17
a PM2.5 values are for years 2011‐2013 from the NE. Grant St. station.
b 98th percentile for values measured in the year.
c Second‐highest value
CO = carbon monoxide NO2 = nitrogen dioxide PM10 = particulate matter less than 10 micrometers in aerodynamic diameter PM2.5 = particulate matter less than 2.5 micrometers in aerodynamic diameter

This page intentionally left blank

SECTION 3
ES111914104811PDX 3-1
Modeling Steps This section describes the preliminary SIL analysis and refined analyses proposed for each criteria pollutant.
3.1 Preliminary SIL Analysis 3.1.1 Approach The preliminary analysis of the project for each pollutant will be conducted as follows:
If the predicted impacts are not significant (that is, less than the SIL) for a criteria pollutant, the modeling is complete for that pollutant under that averaging time and compliance with NAAQS is demonstrated.
If impacts are significant, a more refined analysis will be conducted as described below.
3.1.2 PM2.5 Impacts and Precursors Oregon’s minor new source review rule OAR 340‐222‐0041(3)(b)(C) requires that in order to obtain a PSEL in excess of the netting basis by an SER or more, the source must demonstrate compliance with the NAAQS and PSD increments by conducting an air quality analysis in accordance with OAR 340‐225‐0050(1) and (2) and 340‐225‐0060. Both OAR 340‐225‐0050 and ‐0060 specify that this modeling includes the pollutant and its precursors. Precursors for PM2.5 are NOx and SO2. Consistent with these requirements, Intel proposes to include NOx in the PM2.5 air quality analysis because NOx is the only PM2.5 precursor that the Facility has the potential to emit at or greater than the SER over the netting basis. It would be overly conservative to assume that all of the Facility’s NOx emissions contribute to secondary PM2.5 impacts. Therefore, secondary PM2.5 emissions will be represented by the converted fraction of NOx to particulates (nitrates). The converted fraction will be determined by using the 100:1 NOx to PM2.5 interpollutant offset ratio specified in OAR 340‐225‐0090.
The emissions modeled for the PM2.5 analysis will consist of primary PM2.5 and secondary PM2.5 determined by the offset ratio defined above. The resulting ambient air concentrations will represent the total PM2.5 impacts predicted as a result of primary and secondary PM2.5 emissions.
3.1.3 PM2.5 SIL Analysis In May 2014, the EPA released guidance for PM2.5 permit modeling that provided additional guidance on demonstrating compliance with the PM2.5 NAAQS and PSD increments (EPA, 2014). This guidance incorporates changes resulting from the January 22, 2013 decision from the U.S. Court of Appeals for the District of Columbia Circuit on the screening assessment of primary and secondary PM2.5 using a SIL. The EPA indicated that when the sum of the design background concentration and the PM2.5 SIL are less than the PM2.5 NAAQS, the use of the SIL would be sufficient to conclude that a source impact equal to or below the SIL will not cause or contribute to a violation of the NAAQS. Since the sum of the NE Grant St. design background PM2.5 concentration and the SIL are less than the NAAQS, for this analysis, modeling will be complete and compliance with the NAAQS will be demonstrated if the modeled emission rates from equipment added to the source on or after May 1, 2011 are below the SIL.
3.2 Refined Analyses—Criteria Pollutants Comparison to the NAAQS and prevention of significant deterioration (PSD) Increments will involve the following:

SECTION 3 MODELING STEPS
3-2 ES111914104811PDX
For pollutants with concentrations greater than the respective SIL, the significant impact area (radius) will be defined. Preliminary modeling indicated that the Facility may be significant for the following pollutants and averaging periods:
1‐hr NO2, 24‐hr PM2.5, 24‐hr PM10, annual PM2.5, and annual PM10
The maximum modeled concentration will be determined and compared to the NAAQS and Class II Increments. For the NAAQS analysis, this maximum concentration will include contributions from the Facility, competing nearby sources, and general background concentrations (described in Section 2.7). For the PSD Class II Increment analysis, the maximum concentration will include contributions from the Facility and competing increment consuming sources.
DEQ will be contacted to identify competing nearby and increment consuming sources, and exhaust characteristics if available to be included in the refined analysis. Section 3.2.1 summarizes the approach to develop the competing source inventory.
3.2.1 Competing Source Inventory Intel understands that DEQ will develop a preliminary competing source inventory corresponding to pollutants and averaging periods for which the project’s emissions are expected to exceed the SIL.
Intel proposes to meet with DEQ after the preliminary competing source inventory is prepared to refine the inventory before it performs the competing source NAAQS analyses. Intel will apply the final, approved inventory of competing sources to complete the refined NAAQS analyses. Allowable emissions from the sources identified on the final inventory will be modeled. A
3.2.2 Refined Analyses—24-hour PM2.5 If modeled PM2.5 impacts are above the SIL, a NAAQS compliance demonstration that accounts for the combined impacts of the Project sources (both primary and secondary PM2.5 determined as outlined in section 3.1.2), near‐by sources (primary PM2.5 only) and the monitored background concentration (assumed to include near‐by sources not included in the modeling inventory and secondary PM2.5 from sources in the area and regional transport) will be required. The cumulative impacts will also be compared to Class II PSD increments to determine compliance. The May 2014 PM2.5 permit modeling guidance indicates that when a source’s secondary PM2.5 impacts are assessed as part of the modeling inventory, it is appropriate to add the modeled design value (the 98th percentile of the modeled daily concentration averaged over five years on a receptor by receptor basis) to the design background value. This is considered a First Tier approach and should be acceptable without further justification. For this analysis, the Second Tier approach, using seasonal background values in place of the design value, is proposed to account for temporally varying monitored background concentrations. The proposed Second Tier seasonal background PM2.5 concentrations were calculated following the guidance and are shown in Table 6.

SECTION 3 MODELING STEPS
ES111914104811PDX 3-3
TABLE 6
NE Grant St. ‐ Second Tier Seasonal PM2.5 Background
Season Corresponding
Months
2011 2012 2013 AVERAGE
Winter Dec, Jan, Feb 36.20 17.20 36.40 29.93
Spring Mar, Apr, May 9.80 11.30 18.00 13.03
Summer Jun, Jul, Aug 4.60 10.80 6.20 7.20
Autumn Sep, Oct, Nov 24.50 22.20 42.80 29.83
3.2.3 Refined Analyses—1-hour NO2 Preliminary modeling of the project indicated that impacts would be greater than the 1‐hour NO2 SIL of 7.5 microgram(s) per cubic meter (µg/m3). Therefore, more refined modeling is required to demonstrate that the combination of emissions modeled from the Facility, nearby facilities emitting NOx, and background concentrations would not exceed the NAAQS (cumulative modeling analysis). Receptors from the significant impact analysis below the SIL would be removed from the NAAQS analysis and only receptors exceeding the SIL of 7.5 µg/m3 would be included in the NAAQS analysis. The cumulative NAAQS analysis would follow the EPA‐recommended three‐tier approach to characterize the conversion of modeled total NOX to NO2 for comparison to the NAAQS (40 Code of Federal Regulations 51 Appendix W).
Initially, the Tier 1 method for NOX to NO2 conversion performed for the 1‐hour NO2 NAAQS modeling will assume that the modeled emissions of NOx will completely convert to NO2. This is an overly conservative assumption, so one of the Tier 2 modeling options may be used to refine the modeling impacts. The Tier 2 modeling options consist of the default Ambient Ratio Method (ARM) and the Ambient Ratio Method Version 2 (ARM2). ARM accounts for the conversion of NOx to NO2 by assuming a constant ratio of 0.75 for NO2/NOx for the annual predicted impacts and 0.8 for 1‐hr predicted impacts (EPA, 2010). ARM2 performs a similar conversion but the ambient ratio is based on an evaluation of the ambient ratios of NO2/NOx from EPA’s Air Quality System (AQS) record of ambient air quality data instead of a fixed value (RTP, 2013).
Because Intel has many point sources, it may be necessary to use the Tier 3 ozone‐limiting method (OLM) approach for 1‐hour NO2 modeling. OLM is the EPA‐recommended method for multiple sources in the same vicinity where individual plume overlap is likely to occur (EPA, 2011). Using the ARM2 or the Tier 3 OLM method would require DEQ consultation on the model inputs prior to submittal of the Air Permit Application.
ARM2 will be used if the project’s Tier 1 maximum modeled impacts for 1‐hour NO2 are between 150 to200 parts per billion (282 to 376 µg/m3) of NOx. If the ARM2 method is used, the default maximum NO2/NOx ratio of 0.9 for very low levels of NOx and a default minimum ratio of 0.2 for high levels of NOx will be used.
If additional refinements are necessary, Intel will perform the Tier 3 modeling using OLM. OLM assumes all ambient ozone is available for NO titration (i.e., instantaneous complete mixing with background air), regardless of the source or plume characteristics. OLM modeling would use the EPA‐recommended ‘OLMGROUP ALL’ option, which allows for competition of ozone when there are overlapping plumes to better characterize modeled impacts (EPA, 2011). OLM requires background ozone and background ambient NO2 data. Refined temporal pairing will be used to determine the multiyear averages of the 98th‐percentile of the available background 1‐hour NO2 concentrations from a nearby monitor by season and hour‐of‐day. Corresponding hourly ozone data will also be obtained from a nearby active ozone monitor and season‐hour profiles will be developed using the mean by season and hour of day. Tier 3 modeling also requires an in‐stack ratio (ISR) for all sources as an input to the model. While source‐specific data are preferred, EPA has established a general acceptance of 0.5 as a default NO2/NOx ISR for usage with OLM when source‐specific

SECTION 3 MODELING STEPS
3-4 ES111914104811PDX
data or data from similar source types are not available (EPA, 2014). Intel will use either recent onsite stack test data for a given source group or the conservative default ISR of 0.5.
As mentioned, if the Tier 3 OLM option is used to demonstrate compliance with the 1‐hr NO2 NAAQS, DEQ will be consulted for agreement on the general approach for the OLM modeling prior to submittal of the Air Permit Application.
To complete the refined 1‐hr NO2 NAAQS modeling analysis, hourly emissions from the nearby competing sources, identified on DEQ’s final inventory, will be modeled by apportioning each identified source’s permitted annual emissions evenly throughout the year, unless otherwise noted in the DEQ inventory. The ISR for the competing sources use the EPA recommendation for default ISR of 0.5 for all competing sources up to 1 km from the primary project site and an ISR of 0.2 for more distant competing sources (EPA, 2014).
If, after the Tier 3 analysis, modeled exceedances of the NAAQS still occur, then a contribution analysis of the Facility’s modeled concentration during the NAAQS exceedance would be conducted. For each modeled NAAQS exceedance, the Facility’s modeled contribution would be compared to the SIL of 7.5 µg/m3. If the Facility contribution is below the 7.5 µg/m3 SIL, then the Facility would be considered to have a less‐than‐significant impact during the modeled exceedance. Therefore, the Facility would not cause or contribute to a modeled exceedance of the NAAQS and would meet the modeling criteria.

SECTION 4
ES111914104811PDX 4-1
Output—Presentation of Results The results of the air dispersion modeling analyses will be presented as follows:
Description of modeling methodologies and input data
Summary of the results in tabular and, where appropriate, graphical and narrative form
Modeling files used for AERMOD provided with the application on compact disk
Description of any significant deviations from the methodology proposed in this protocol

This page intentionally left blank
SECTION 5
ES111914104811PDX 5-1
References Auer, A.H. 1978. “Correlation of Land Use and Cover with Meteorological Anomalies.” Journal of Applied Meteorology. No. 17, pages 636‐643.
EPA. See U.S. Environmental Protection Agency.
RTP Environmental Associates, Inc (RTP). 2013. Ambient Ratio Method Version 2 (ARM2) for use with AERMOD for 1‐hr NO2 Modeling. Development and Evaluation Report. September 20, 2013.
State of Oregon. OAR 225. Oregon Administrative Rules, Division 225, Air Quality Analysis Requirements. OAR 340‐225‐0010.
U.S. Environmental Protection Agency (EPA). 2005. Appendix W of 40 CFR Part 51—Guideline On Air Quality Models (Revised), Office of Air Quality Planning and Standards, Research Triangle Park, North Carolina, November.
U.S. Environmental Protection Agency (EPA). 2014. Guidance for PM2.5 Permit Modeling. Office of Air Quality Planning and Standards. May 20, 2014.
U.S. Environmental Protection Agency (EPA). 2010. EPA Guidance Concerning the Implementation of the 1‐Hour NO2 NAAQS for the PSD Program. EPA Office of Air Quality Planning and Standards. June 29.
U.S. Environmental Protection Agency (EPA). 2011. Additional Clarification Regarding Application of Appendix W Modeling Guidance for the 1‐Hour NO2 National Ambient Air Quality Standard. Tyler Fox. EPA Air Quality Modeling Group. March 1, 2011.
U.S. Environmental Protection Agency (EPA). 2014. Clarification on the Use of AERMOD Dispersion Modeling for Demonstrating Compliance with the NO2 National Ambient Air Quality Standard. Robert Chris Owen and Rodger Brode. Air Quality Modeling Group. September 30, 2014.
U.S. Geological Survey (USGS). 2006. National Land Cover Database 2006. Available from: http://www.mrlc.gov/nlcd06_data.php

This page intentionally left blank

State of Oregon
Department of Environmental Quality Memorandum ____________________________________________________________________________________________
Date: 10 December 2014 To: George Davis From: Phil Allen Subject: Intel Corporation Hillsboro and Aloha The Air Dispersion Modeling Protocol for Class II Areas (November 2014) as prepared by CH2MHill has been reviewed. We have the following additions to the protocol as submitted.
As a result of discussions on optimal approaches to conservatively characterize impacts from two
classes of intermittent sources at Intel, the follow methods will be used and incorporated into the protocol: 1) For the five lime silo bin vents, PM10 and PM2.5 emissions from all five sources will be modeled as a single volume source that will be located midpoint between the existing lime silo bin vents. The emission calculations and the source properties will be based on actual source properties, and will be provided in the modeling report. 2) The existing emergency generators at the Aloha campus, and the fire pumps from both Aloha and Ronler Acres, will be modeled for PM2.5 and PM10 based on operations for up to 1 hour during each 24-hr period 3) The emergency generators at the Ronler Acres campus include existing generators operational before May 1, 2011 and new and proposed generators (project generators) operational after May 1, 2011. Of these generators, a maximum of 10 will be tested per day for a period not greater than 1 hour each generator. For the most part, these generators are grouped in banks. A sensitivity analysis for PM2.5 and PM10 will be done by determining and evaluating impacts for the generator groups. This analysis will proceed as follows:
a. Four representative banks or groups of generators will be identified based on their location, and the likelihood that test runs of these generators would occur together in the same 24-hour period.
b. Emissions from each group will be characterized by a single stack, with stack parameters
representative of the bank of generators. The representative stack will be located in the center of each group.
c. Emissions from the representative stack in each group will be the total of emissions from 10
generators of the group averaged over 24 hours. d. Two of the groups have project generators, and two groups primarily have existing generators.
The sensitivity analysis will identify the highest impacts, separately, of the two groups of project generators, and the two groups of existing generators. The highest impacting project generator group, and the highest existing generator group will used in the subsequent competing source NAAQS modeling.
e. Emissions from both the highest project generator group and the highest existing generator
group will be included in the competing source modeling. Since both generator groups cannot operate

Memo to George Davis 10 December 2014 Page 2
simultaneously, only the highest modeled impact from these two groups at any receptor will be used in the NAAQS evaluation.
As the air quality analysis proceeds technical questions about the characterization of source
emissions and the evaluation of their impacts may arise. These questions should be addressed and resolved in discussions with DEQ prior to the submittal of the final report.
The Protocol is approved.