intellectual assessment of diverse learners: a review of

1
Madeline C. Rodriguez, B.S. and Kara M. Styck, Ph.D. Illinois School Psychology Association Convention, January 31, 2019, Springfield, IL Department of Psychology, Northern Illinois University Intellectual Assessment of Diverse Learners: A Review of the C-LIM Discussion Nomothetic vs. idiographic approaches Nomothetic approaches – focus on group differences Idiographic approaches – highlight individual differences Although the C-LIM was designed for making decisions about individual students, the structure of the C-LIM was designed based on group mean differences between CLD students and normative sample students who are not culturally and linguistically diverse. However, group differences are necessary but insufficient for making accurate decisions about individuals (Elwood; 1993). In other words, the C-LIM was created using an nomothetic approach which aims to examine group differences. The diagnostic utility studies by Styck and Watkins (2013, 2014) utilize an idiographic approach through sensitivity and specificity statistics. Sensitivity and specificity statistics Sensitivity – proportion of CLD students scores’ displaying the invalid profile 1-Specificity – proportion of monolingual English-speaking students scores’ displaying the valid profile The Culture-Language Interpretive Matrix The C-LIM was developed to help school psychologists assess the validity of intelligence test results for culturally and linguistically diverse learners. The C-LIM is meant to assist practitioners in interpreting the test scores of CLD students in order to determine if their students’ test scores are due to cultural or linguistic influences or due one their students’ true ability. Currently, there are 20 C-LIMs for different standardized tests of cognitive ability. The different C-LIMs were created by an expert consensus procedure in which developers used clinical judgment to categorize subtests as having low, medium, or high cultural and linguistic loading. Subtest scores from the tests are entered into a 3 x 3 matrix based on hypothesized increasing cultural and linguistic demand (i.e., low, medium, and high). When a student from a CLD background demonstrates subtest scores that decline down the matrix as the purported cultural and linguistic demand of Introduction The Culture-Language Interpretive Matrix (C- LIM; Flanagan, Ortiz, & Alfonso, 2013) was developed to help school psychologists determine whether scores from intelligence tests administered to culturally and linguistically diverse (CLD) students should be interpreted as reflecting cultural and linguistic difference (invalid) or a possible disorder (valid). A systematic pattern of decline across the C-LIM diagonal as the hypothesized cultural and linguistic demand of subtests increases indicates that “the [assessment] results can be said to be invalid because they are most likely to be reflections of the primary influence of cultural and linguistic influences, not the constructs the subtests were intended to measure” (p. 322; Flanagan et al., 2013). However, published empirical research does not fully support this conclusion. The resultant purpose of this poster session is to summarize what is currently known about the validity of C- LIM decisions and to describe alternative assessment approaches for CLD students. Overview of Studies The validity of C-LIM decisions has been investigated in three published studies (Kranzler, Flores, & Coady, 2010; Styck & Watkins, 2013, 2014). The first study included a sample of 46 students enrolled in English as a second language programming who were administered the Woodcock-Johnston Tests of Cognitive Abilities—Third Edition (Schrank, McGrew, Mather, & Woodcock, 2014). Participants’ mean scores systematically declined down the C-LIM diagonal (cell means of 99.3 > 83.7 > 83.1). However, scores from only 17 of the 46 participants followed the prescribed pattern despite 100% of participants having been identified as limited English proficient and culturally diverse. The remaining two studies compared scores Overview of Studies (continued) from a sample of English language learners (ELLs) who were administered the Wechsler Intelligence Scales for Children—Fourth Edition (WISC-IV; Wechsler, 2003) as part of special education evaluations with scores from various samples of native English-speaking students (Styck & Watkins, 2013, 2014). ELL participants’ mean scores generally declined as predicted by the C-LIM in both studies (cell means of 9.1 < 9.5 > 7.6 and cell means of 8.6 < 8.8 > 7, respectively). However, scores from only 4.3-10.5% of ELL participants followed the prescribed pattern compared to scores from 4.9% of the WISC-IV normative sample, 11.4% of native English-speaking students with autism, and 24.4% of a referred sample of native English-speaking students without disabilities. “Group differences are necessary, but insufficient for making accurate decisions about individuals” (Elwood, 1993) The Culture-Language Interpretive Matrix (continued) the subtests increases, any interpretation of the student’s scores are said to be invalid. If the student shows any other pattern of scores, the test scores can be interpreted as a valid measure of the student’s ability. Diagnostic Utility of the C-LIM The following values are suggested for interpreting the Area Under the Curve (AUC; Streiner & Cairney, 2007; Swets, 1988): values between 0.50 and 0.70 are categorized as low accuracy values between 0.70 and 0.90 are categorized as medium accuracy values between 0.90 and 1.00 are categorized as high accuracy Overall, these studies indicate that the C-LIM has low sensitivity and high specificity. Figure 1. Culture-Language Interpretive Matrix Diagonal Cell Means for Six Samples of Students Reported in the Three Published Studies Note. Bolded scores represent mean scores from CLD students. Values in red demonstrate the hypothesized systematic pattern of decline, albeit the cell means are not attenuated to the expected magnitude. a CLD participants’ mean scores from Kranzler et al. (2010). b CLD participants’ mean scores from Styck and Watkins (2013). bn Normative sample participants’ mean scores from Styck and Watkins (2013). c CLD participants’ mean scores from Styck and Watkins (2014). cr Referred English-speaking participants’ mean scores from Styck and Watkins (2014). ca Participants with Autism’s mean scores from Styck and Watkins (2014). Degree of Linguistic Demand Degree of Cultural Demand Low Moderate High Low 99.3 a 9.1 b 10.3 bn 8.6 c 9.8 cr 9.8 ca Moderate 83.7 a 9.5 b 10.3 bn 8.8 c 10.1 cr 9.0 ca High 83.1 a 7.6 b 10.3 bn 7.0 c 9.3 cr 9.0 ca Conclusion The potential bias in test results for CLD students is not contested. School psychologists are encouraged to note factors that explain individual differences in second language acquisition, such as with whom the student speaks English (e.g, family, friends), total exposure to native English speakers, and the phonetic dis/similarity of the student’s native language to English (Bosch & Ramon-Casas, 2014; Fennell & Byers-Heinlein, 2014; Jia, Chen, Kim, Chan, & Jeung, 2014; Place & Hoff, 2011). Bilingual testing in a student’s native language is preferred. However, nonverbal assessment is a viable alternative to testing in English. Figure 2. Diagnostic Utility Statistics From Three Published Studies on the C-LIM Sensitivity (i.e., true positive rate) 1-Specificity (i.e., false positive rate) AUC Kranzler et al. (2010) 37.0% - - Styck and Watkins (2013) 10.5% 4.9% 53.0% Styck and Watkins (2014) ELLs vs. ASD 4.3% 11.4% 46.5% ELLs vs. referred 21.4% 24.4% 48.5% Note. A receiver operating characteristic (ROC) curve was used to show the data in a manner that was not influenced by prevalence rates. The area under the curve (AUC) shows the probability that scores from a randomly selected individual in the CLD participant subgroup would be correctly classified by the C- LIM as invalid and scores from a randomly selected participant from the monolingual English-speaking comparison group would not.

Upload: others

Post on 29-Jan-2022

1 views

Category:

Documents


0 download

TRANSCRIPT

Madeline C. Rodriguez, B.S. and Kara M. Styck, Ph.D. Illinois School Psychology Association Convention, January 31, 2019, Springfield, ILDepartment of Psychology, Northern Illinois University

Intellectual Assessment of Diverse Learners: A Review of the C-LIM

DiscussionNomothetic vs. idiographic approaches• Nomothetic approaches – focus on group

differences • Idiographic approaches – highlight individual

differences Although the C-LIM was designed for making decisions about individual students, the structure of the C-LIM was designed based on group mean differences between CLD students and normative sample students who are not culturally and linguistically diverse. However, group differences are necessary but insufficient for making accurate decisions about individuals (Elwood; 1993). In other words, the C-LIM was created using an nomothetic approach which aims to examine group differences. The diagnostic utility studies by Styck and Watkins (2013, 2014) utilize an idiographic approach through sensitivity and specificity statistics.

Sensitivity and specificity statistics • Sensitivity – proportion of CLD students

scores’ displaying the invalid profile• 1-Specificity – proportion of monolingual

English-speaking students scores’ displaying the valid profile

The Culture-Language Interpretive MatrixThe C-LIM was developed to help school psychologists assess the validity of intelligence test results for culturally and linguistically diverse learners. The C-LIM is meant to assist practitioners in interpreting the test scores of CLD students in order to determine if their students’ test scores are due to cultural or linguistic influences or due one their students’ true ability. Currently, there are 20 C-LIMs for different standardized tests of cognitive ability. The different C-LIMs were created by an expert consensus procedure in which developers used clinical judgment to categorize subtests as having low, medium, or high cultural and linguistic loading. Subtest scores from the tests are entered into a 3 x 3 matrix based on hypothesized increasing cultural and linguistic demand (i.e., low, medium, and high). When a student from a CLD background demonstrates subtest scores that decline down the matrix as the purported cultural and linguistic demand of

Introduction

The Culture-Language Interpretive Matrix (C-LIM; Flanagan, Ortiz, & Alfonso, 2013) was developed to help school psychologists determine whether scores from intelligence tests administered to culturally and linguistically diverse (CLD) students should be interpreted as reflecting cultural and linguistic difference (invalid) or a possible disorder (valid). A systematic pattern of decline across the C-LIM diagonal as the hypothesized cultural and linguistic demand of subtests increases indicates that “the [assessment] results can be said to be invalid because they are most likely to be reflections of the primary influence of cultural and linguistic influences, not the constructs the subtests were intended to measure” (p. 322; Flanagan et al., 2013). However, published empirical research does not fully support this conclusion. The resultant purpose of this poster session is to summarize what is currently known about the validity of C-LIM decisions and to describe alternative assessment approaches for CLD students.

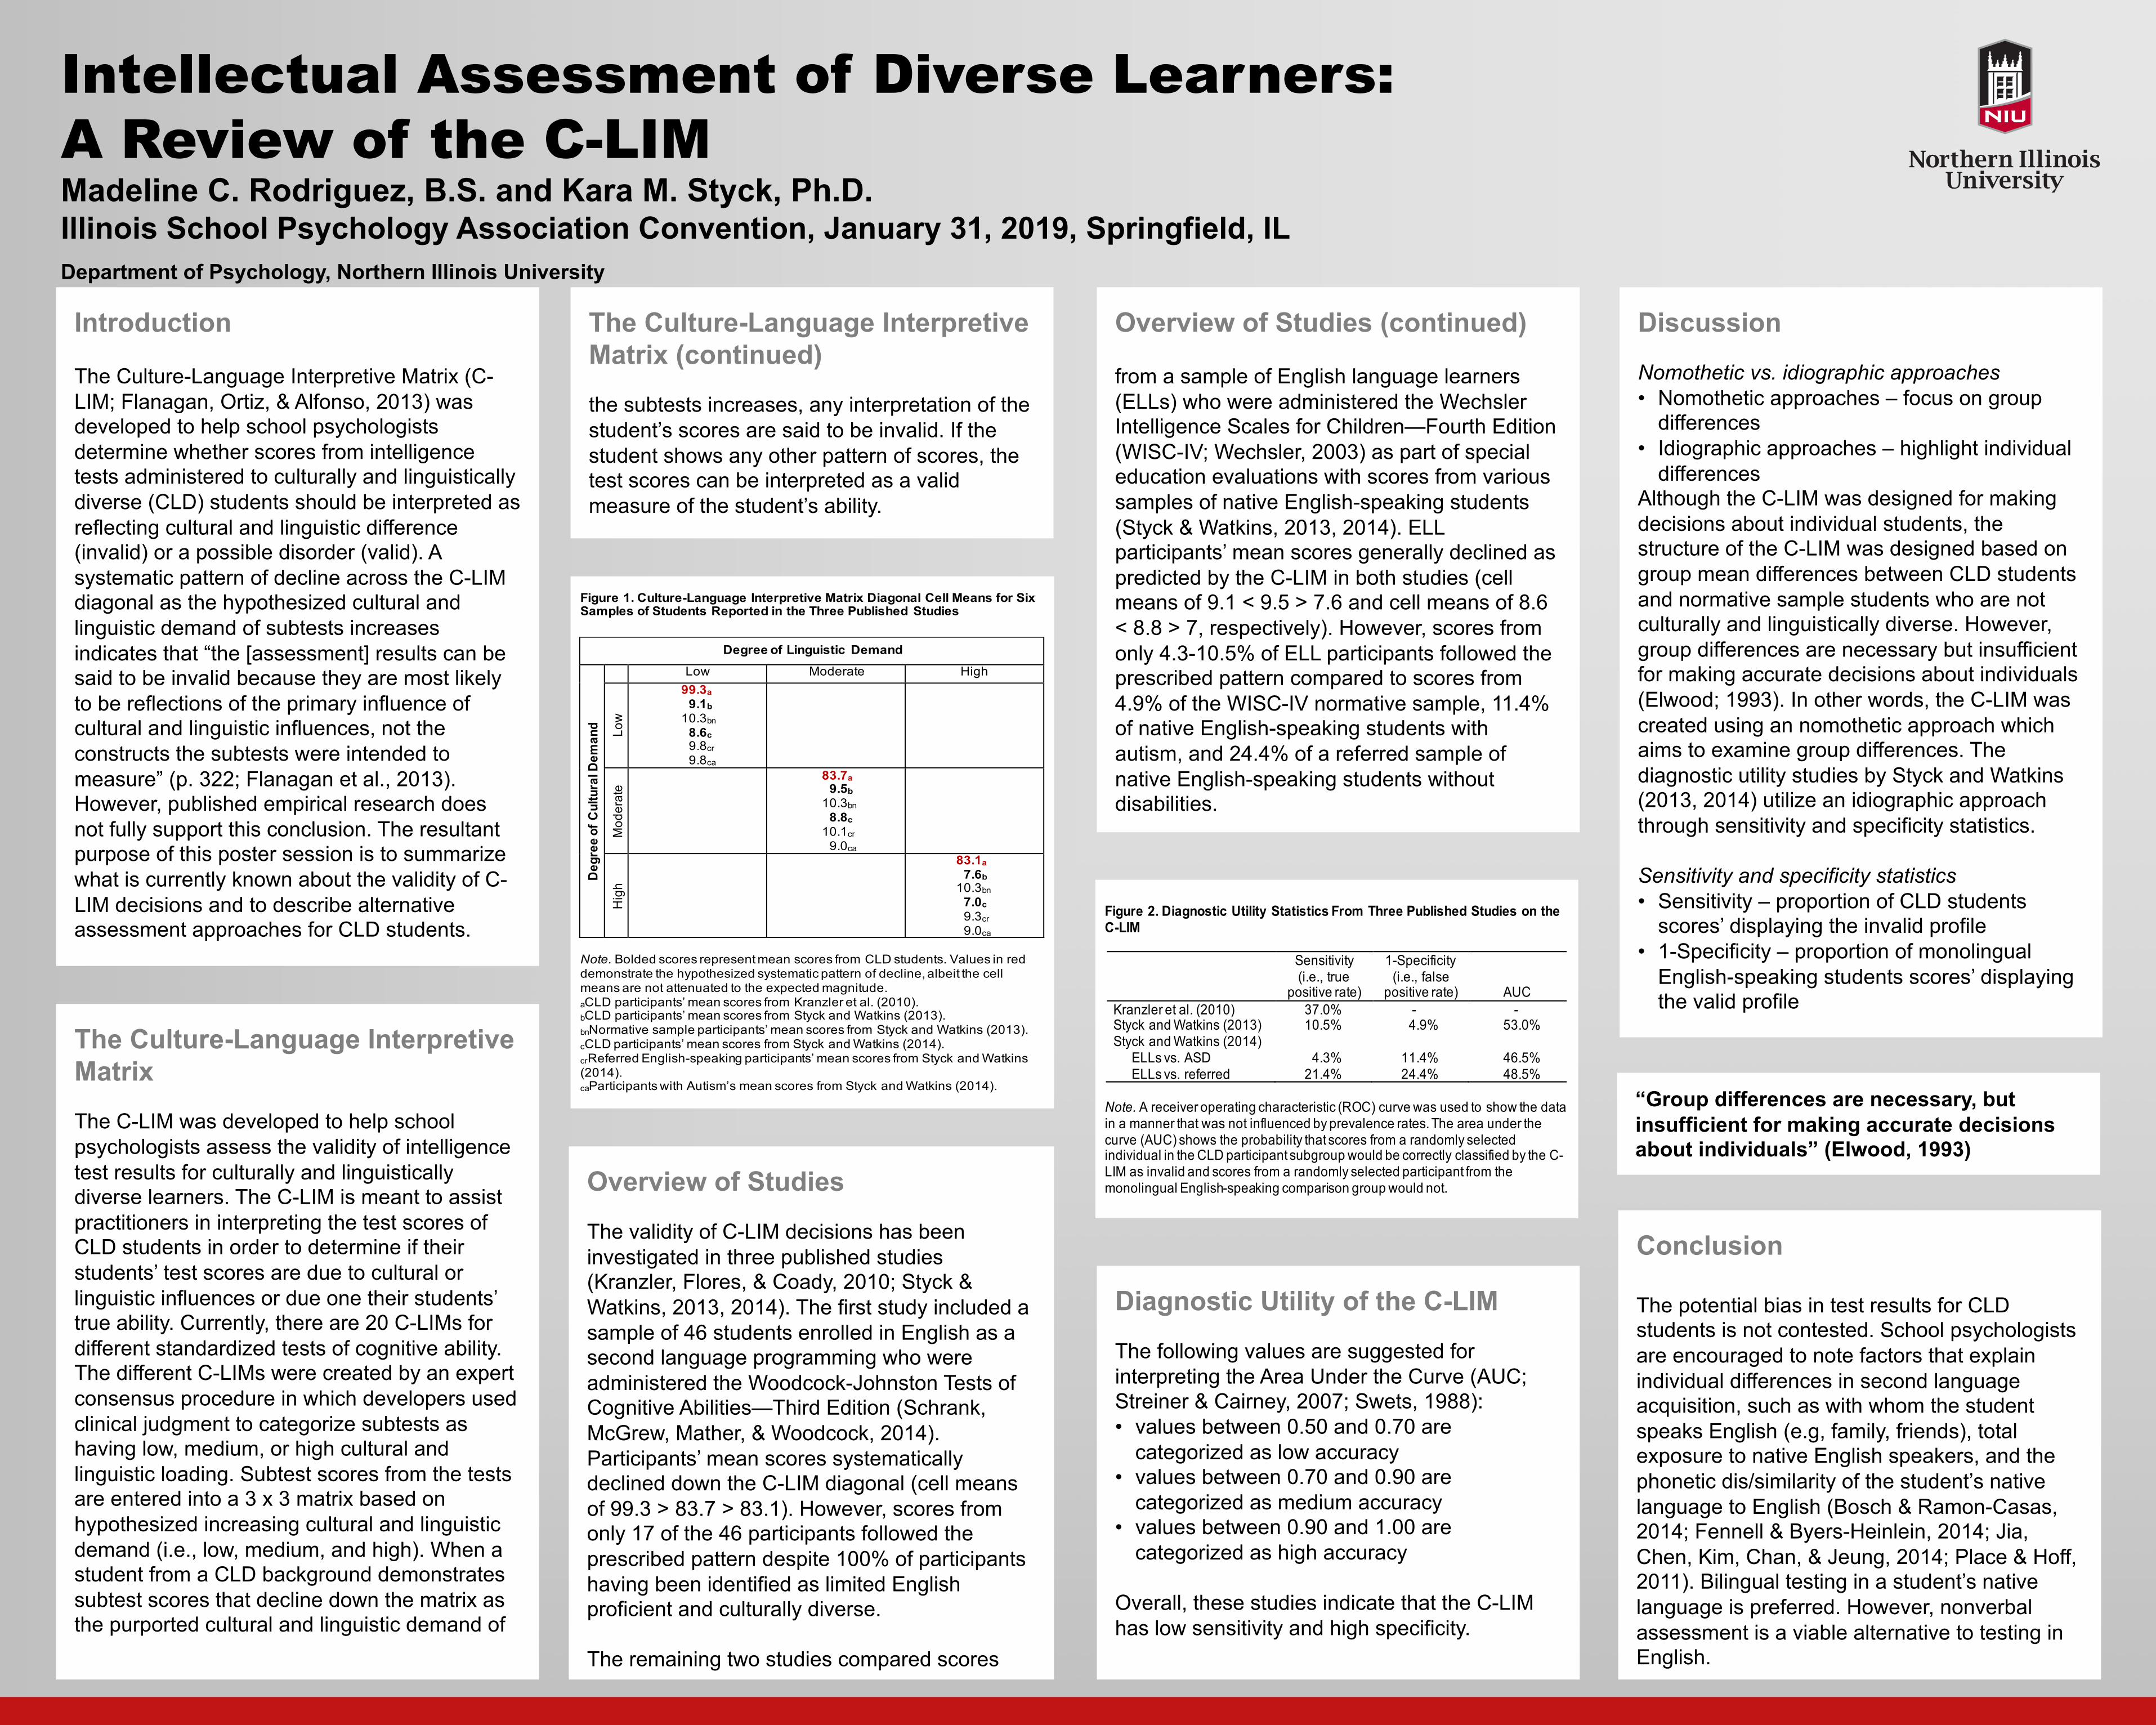
Overview of StudiesThe validity of C-LIM decisions has been investigated in three published studies (Kranzler, Flores, & Coady, 2010; Styck & Watkins, 2013, 2014). The first study included a sample of 46 students enrolled in English as a second language programming who were administered the Woodcock-Johnston Tests of Cognitive Abilities—Third Edition (Schrank, McGrew, Mather, & Woodcock, 2014). Participants’ mean scores systematically declined down the C-LIM diagonal (cell means of 99.3 > 83.7 > 83.1). However, scores from only 17 of the 46 participants followed the prescribed pattern despite 100% of participants having been identified as limited English proficient and culturally diverse.

The remaining two studies compared scores

Overview of Studies (continued)

from a sample of English language learners(ELLs) who were administered the Wechsler Intelligence Scales for Children—Fourth Edition (WISC-IV; Wechsler, 2003) as part of special education evaluations with scores from various samples of native English-speaking students (Styck & Watkins, 2013, 2014). ELL participants’ mean scores generally declined as predicted by the C-LIM in both studies (cell means of 9.1 < 9.5 > 7.6 and cell means of 8.6 < 8.8 > 7, respectively). However, scores from only 4.3-10.5% of ELL participants followed the prescribed pattern compared to scores from 4.9% of the WISC-IV normative sample, 11.4% of native English-speaking students with autism, and 24.4% of a referred sample of native English-speaking students without disabilities.

“Group differences are necessary, but insufficient for making accurate decisions about individuals” (Elwood, 1993)

The Culture-Language Interpretive Matrix (continued)the subtests increases, any interpretation of the student’s scores are said to be invalid. If the student shows any other pattern of scores, the test scores can be interpreted as a valid measure of the student’s ability.

Diagnostic Utility of the C-LIMThe following values are suggested for interpreting the Area Under the Curve (AUC; Streiner & Cairney, 2007; Swets, 1988):• values between 0.50 and 0.70 are

categorized as low accuracy• values between 0.70 and 0.90 are

categorized as medium accuracy• values between 0.90 and 1.00 are

categorized as high accuracy

Overall, these studies indicate that the C-LIM has low sensitivity and high specificity.

Figure 1. Culture-Language Interpretive Matrix Diagonal Cell Means for Six Samples of Students Reported in the Three Published Studies

Note. Bolded scores represent mean scores from CLD students. Values in red demonstrate the hypothesized systematic pattern of decline, albeit the cell means are not attenuated to the expected magnitude. aCLD participants’ mean scores from Kranzler et al. (2010). bCLD participants’ mean scores from Styck and Watkins (2013). bnNormative sample participants’ mean scores from Styck and Watkins (2013). cCLD participants’ mean scores from Styck and Watkins (2014). crReferred English-speaking participants’ mean scores from Styck and Watkins (2014). caParticipants with Autism’s mean scores from Styck and Watkins (2014).

Degree of Linguistic Demand

Deg

ree

of C

ultu

ral D

eman

d

Low Moderate High

Low

99.3a 9.1b

10.3bn 8.6c 9.8cr 9.8ca

Mod

erat

e

83.7a 9.5b

10.3bn 8.8c

10.1cr 9.0ca

Hig

h

83.1a 7.6b

10.3bn 7.0c 9.3cr 9.0ca

Conclusion

The potential bias in test results for CLD students is not contested. School psychologists are encouraged to note factors that explain individual differences in second language acquisition, such as with whom the student speaks English (e.g, family, friends), total exposure to native English speakers, and the phonetic dis/similarity of the student’s native language to English (Bosch & Ramon-Casas, 2014; Fennell & Byers-Heinlein, 2014; Jia, Chen, Kim, Chan, & Jeung, 2014; Place & Hoff, 2011). Bilingual testing in a student’s native language is preferred. However, nonverbal assessment is a viable alternative to testing in English.

Figure 2. Diagnostic Utility Statistics From Three Published Studies on the C-LIM

Sensitivity (i.e., true

positive rate)

1-Specificity (i.e., false

positive rate) AUC Kranzler et al. (2010) 37.0% - - Styck and Watkins (2013) 10.5% 4.9% 53.0% Styck and Watkins (2014) ELLs vs. ASD 4.3% 11.4% 46.5% ELLs vs. referred 21.4% 24.4% 48.5%

Note. A receiver operating characteristic (ROC) curve was used to show the data in a manner that was not influenced by prevalence rates. The area under the curve (AUC) shows the probability that scores from a randomly selected individual in the CLD participant subgroup would be correctly classified by the C-LIM as invalid and scores from a randomly selected participant from the monolingual English-speaking comparison group would not.