intellectual capital reporting in health care centers
TRANSCRIPT

MAGISTERUPPSATS HT 2003
Intellectual Capital Reporting in Health Care Centers – the Developing of a
Prototype Framework Handledare Författare Leif Edvinsson
Karl Hermansson Niklas Holberg Andreas Ringquist

Summary
Title: Intellectual Capital Reporting in Health Care Centers – the Developing of a Prototype Framework
Authors: Karl Hermansson, Niklas Holberg, Andreas Ringquist Tutor: Professor Leif Edvinsson Level: Master thesis Keywords Intellectual Capital, Intellectual Capital reporting, Intellectual
Capital measuring, Health Care Centers Problem discussion: What aspects of Intellectual Capital in health care centers are
relevant to report?
In what way are the different aspects of Intellectual Capital best measured?
How can anchoring and performance of an Intellectual Capital
reporting in health care centers be facilitated? Purpose: The purpose of this thesis is to develop a prototype framework
for Intellectual Capital reporting in health care centers. This will be achieved by utilizing Intellectual Capital reporting theories and studying two health care centers.
Method: This thesis is based on a qualitative method using a case study
approach. The explorative method is used, as this is appropriate due to the lack of research regarding intellectual capital reporting in health care centers.
Conclusion: Intellectual Capital reporting in a health care center needs to be
put in a greater context. The necessity of the reporting and its results need to be clarified and understood. The Intellectual Capital report needs to be combined with a guiding or navigation tool to be anchored at the center. Reporting needs to be easy performed. Gathering of data needed has to be possible even with limited resources.

- FOREWORD - First of all we would like to thank our tutor Professor Leif Edvinsson, for his advice and guidance. We also appreciate the assistance given to us by Henrik Weibull of Region Skåne, who helped us get in contact with the health care centers used in our study. Ulla Wikström and Patrik Midlöv, heads of Kärråkra and Tåbelund health care centers have given use advice and feedback. Finally, we would like to thank Anne Gyllenborg for taking the time to talk to us about her experiences of Intellectual Capital. Lund January 2004 Karl Hermansson Niklas Holberg Andreas Ringquist
1 ........................................................................................................................................7 - Introduction - ...............................................................................................................7
1.1 BACKGROUND ...................................................................................................7 1.1.1 Definitions ................................................................................................8
1.2 PROBLEM DISCUSSION ....................................................................................10 1.3 PURPOSE.........................................................................................................12
2 ......................................................................................................................................13 - Method - ......................................................................................................................13
2.1 CHOICE OF METHOD........................................................................................14 2.2 EMPIRICAL FRAMEWORK.................................................................................14
2.2.1 Interviews ...............................................................................................15 2.3 THEORETICAL FRAMEWORK............................................................................16
2.3.1 Criticism of Sources ...............................................................................18 3 ......................................................................................................................................19 -Theory- .........................................................................................................................19
3.1 THE SKANDIA NAVIGATOR..............................................................................19 3.1.1 The Financial Focus ...............................................................................20 3.1.2 The Customer Focus...............................................................................21 3.1.3 The Process Focus ..................................................................................22 3.1.4 The Renewal and Development Focus...................................................24 3.1.5 Human Focus..........................................................................................25
3.2 THE DANISH MINISTRY OF SCIENCE, TECHNOLOGY AND INNOVATION INTELLECTUAL
CAPITAL STATEMENT..................................................................................................26 3.2.1 Knowledge Narrative ............................................................................26 3.2.2 Management Challenges ........................................................................26 3.2.3 Initiatives ................................................................................................26 3.2.4 Indicators ................................................................................................27 3.2.5 The Intellectual Capital Statement Model..............................................27 3.2.6 The Analysis Model ...............................................................................28
3.3. IC RATINGTM ..................................................................................................30
3.3.1 Conceptual Framework ..........................................................................30 3.4 THE PENG-MODEL.........................................................................................32
3.4.1 The PENG- model in the Health Care Sector ........................................33 3.4.2 The Basic Model for Implementation of the PENG-model ...................33 Figure 8: The three phases of the PENG- model (Dahlgren et al, 2003) ...............34 3.4.3 The Preparation phase ............................................................................34 3.4.4 The Implementation Phase .....................................................................35 3.4.5 The Quality control phase ......................................................................36
3.5 THE CARDIO VASCULAR DIVISION OF LUND UNIVERSITY HOSPITAL MODEL .......36 3.5.1 The Intellectual Capital Indicators .........................................................38
CUSTOMER PERSPECTIVE PROCESS PERSPECTIVE ...................................................38 3.5.2 Nikis .......................................................................................................39
4 ......................................................................................................................................40 - Health Care Centers- .................................................................................................40
4.1 HEALTH CARE IN CHANGE ...............................................................................40 4.2 HEALTH CARE IN THE PROVINCE OF SKÅNE.....................................................41
4.2.1 Health care centers .................................................................................41 5 ......................................................................................................................................43 - Analysis -.....................................................................................................................43

5.1 THREE PERSPECTIVES OF INTELLECTUAL CAPITAL..........................................43 5.1.1 The Education and Development perspective ........................................44 5.1.3 The Work Environment Perspective ......................................................46 5.1.2 Patient Perspective .................................................................................47
5.2 TWO SUBGROUPS OF THE PERSPECTIVES .........................................................47 5.2.1 Challenges and Actions ..........................................................................47 5.2.2 Benefits and Risks ..................................................................................49
5.3 INDICATORS ....................................................................................................52 5.3.1 Indicators for the Education and Development Perspective ..................53 5.3.2 Indicators for the Work Environment Perspective .................................54 5.3.3 Indicators for the Patient Perspective.....................................................55
6 ......................................................................................................................................57 - Conclusions -...............................................................................................................57
6.1 FUTURE RESEARCH ...............................................................................................63 References ......................................................................................................................64 Appendix 1 .....................................................................................................................66 Appendix 2 .....................................................................................................................67

- FIGURES -
Figure 1: Model of Intellectual Capital (Edvinsson & Malone, 1997) 9 Figure 2: The thesis theoretical and empirical framework 15 Figure 3: The Skandia Navigator (Edvinsson & Malone, 1997) 18 Figure 4: The Intellectual Capital Statement Model 25
(The Danish Ministry of Science, Technology and Innovation Intellectual Capital Statement, 2003)
Figure 5: The Analysis Model 27
(The Danish Ministry of Science, Technology and Innovation Intellectual Capital Statement, 2003)
Figure 6: IC RatingTM Conceptual Framework (IC RatingTM, 2003) 28 Figure 7: Result of benefit analysis with the PENG-model 30
(Dahlgren et al, 2003) Figure 8: The Benefit Relation (Dahlgren et al, 2003) 31 Figure 9: The Cardio Vascular Division’s Balanced Score Card 35 Figure 10: The non financial part of the Cardio Vascular 36
Division’s annual report Figure 11: Organizational chart of the health care centers 40 (Interview with Patrik Midlöv, 2003) Figure 12: Three perspectives of Intellectual Capital 42 in health care centers

Figure 13: Step one in the development process of the Intellectual Capital 46 prototype Figure 14: Step two in the development process of the Intellectual Capital 47 prototype Figure 15: Intellectual Capital Prototype Framework 48
1
- Introduction - This chapter will introduce the reader to the concept of Intellectual Capital. Problem discussion, definition of Intellectual Capital and the purpose of the thesis will follow. The chapter ends with the thesis delimitations.
1.1 Background The global economy is changing. Deregulation of markets, globalization, the decreased costs and the increased volume of information flow due to new Information Technology are some of the factors that are changing the basis for competition and value creation for many firms.1 It has been called the rise of the new economy, the knowledge economy or the knowledge society. 2 It is an economy driven by information and knowledge, a shift from a manufacturing to a service oriented economy. This shift is reflected by the decline of traditional industries and the growth of the many new knowledge based companies.3 This explains the growing interest for Intellectual Capital as a business and research area.4 In the knowledge economy, knowledge is a strategic resource for a company’s competing in dynamic environments.5 Tangible assets have diminished in relative importance.6 Intellectual 1 Teece, D J, 2002, Managing Intellectual Capital, s 3, Oxford University Press. 2 Bontis, N, 1998, Intellectual Capital: an exploratory study that develops measures and models, Management Decision, vol 36, issue 2, s 2 3 Ibid. 4 Guthrie, J, 2001, the management, measurement and the reporting of Intellectual Capital, Journal of Intellectual Capital, vol. 2, issue 1, s 5-10 5 Ordóñez de Pablo, P, 2003, Intellectual Capital in Spain: a comparative view, Journal of Intellectual Capital, vol 4, issue 1, s 62
Capital is becoming an important resource for a company’s success and for value creation.7 One of the most profound changes of the new economy is that the law of diminishing returns has turned to be the law of increasing returns; a company with a head start can quick become the market leader and dominates a market. Ideas and knowledge has exponential potential.8 Health care is a knowledge intensive industry. Swedish health care is facing big challenges. The difference between resources and costs for health care is increasing; available resources must be used effectively.9 The Swedish population is getting older, and the number of patients will increase dramatically in the coming years. The need for care of elder people is calculated to increase by 70 percent by year 2030, hence the need for medical information and training and education of employees will increase. Medical research develops with high speed and there are growing expectations and demands from the population for health care. The possibility to receive care in all regions will lead to increased mobility among patients and employees. Patients want to receive treatment faster and are becoming more active and competent due to the fact that they are getting better information and documentation through the Internet. Different quality registers will give an increased transparency that increase expectations and higher demands of effective health care.10 1.1.1 Definitions There is no generally accepted definition of Intellectual Capital. Intellectual Capital is often used as a synonym to Intellectual Assets, Intangible Assets or Knowledge Assets.11 Many academics highlight the importance of the distinction between Intangible Assets and Intellectual Capital. Historically, the difference has been vague. The Organization for Economic Cooperation and Development’s (OECD) definition of Intellectual Capital makes a distinction by situating Intellectual Capital as a subset of, rather than the same as, the overall intangible asset base of a company. OECD describes Intellectual Capital as the economic value of two categories of intangible assets of a company: organizational (structural) Capital and human Capital. 12 An often used definition is Stewart’s (1997). He defines Intellectual Capital as the Intellectual material – knowledge, Information, Intellectual property, experience – that can be put to use to create wealth.13 Brooking (1996) advocates that Intellectual Capital is comprised of four types of assets: Market assets, Intellectual Property Assets, Human Centered Assets and Infrastructure Assets. Market Assets consist of brands, customers, distribution channels, and business relations. Intellectual Property Assets include patents and copyrights. Human Centered Assets include education and work related knowledge and competences.
6 Guthrie, J, 2001, The management, measurement and the reporting of Intellectual Capital, Journal of Intellectual Capital, vol. 2, issue, s 3 7 Zhou, A Z & Fink, D, 2003, The Intellectual Capital web: a systematic linking of Intellectual Capital and knowledge management, Journal of Intellectual Capital, vol 4, issue 1, s.34 8 Edvinsson, L, 2002, Navigating the Knowledge Economy, s 34, Bookhouse Publishing 9 www.skane.se, 2003-12-03 10 Dahlgren et al, 2003, Öka nyttan av IT inom vården, Ekerlids Förlag 11 Zhou, A Z & Fink, D, 2003, The Intellectual Capital web: a systematic linking of Intellectual Capital and knowledge management, Journal of Intellectual Capital, vol 4, issue 1, s.37 12 Guthrie, J, 2001, The management, measurement and the reporting of Intellectual Capital, Journal of Intellectual Capital, vol. 2, issue 1, s 3 13 Stewart, T, 1997, Intellectual Capital: the new wealth of organizations, Doubleday/Currency Cop
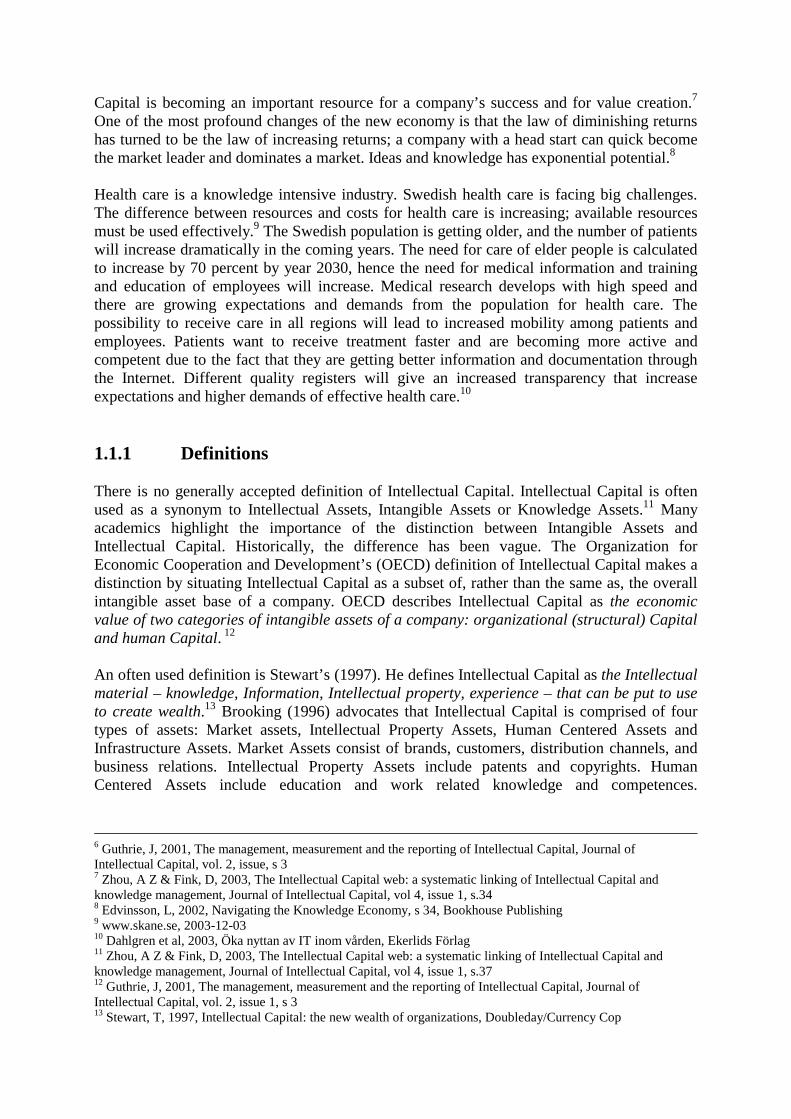
Infrastructure Assets includes management process, Information Technology systems and financial systems.14 Even though the definitions of Intellectual Capital are not identical, the field is starting to see a convergence in what Intellectual Capital encompasses.15 According to Edvinsson and Malone (1998) Intellectual Capital takes three basic forms: Human Capital, Structural Capital and Customer Capital.
Figure 1: Model of Intellectual Capital (Edvinsson & Malone, 1997) Human Capital is the combined knowledge, skill, innovativeness, and ability of the individual employees and managers in a company. The term also includes the dynamics of an intelligent organization and the creativity and innovativeness of the organization. A company cannot own Human Capital. Structural Capital includes factors such as the quality and reach of Information Technology systems, company images, hardware, software, databases, organizational structure, patents and trademarks. Structural Capital can be owned and traded by a company. 16 A company can have a high level of Human Capital, but if the organization has poor systems to track and manage the members of the organization, the overall Intellectual Capital will not reach its fullest potential.17 Structural Capital can be seen as being composed of three types of capital: organizational, innovation and process. Organizational Capital refers to the investments made by a company in systems, tools and operating philosophy that speeds the flow of knowledge within the organization. It is the systemized, packaged and codified competence of the organization. Innovation Capital refers to the renewal capability and the result of innovation in the form of protected commercial rights, intellectual property, and other intangible assets and talents used to create and rapidly bring to market new products and services. Process
14 http://www3.bus.osaka-cu.ac.jp/apira98/archives/pdfs/25.pdf, 2003-11-18 15 Ordóñez de Pablo, P, 2002, Evidence of Intellectual Capital measurement from Asia, Europe and the Middle East, Journal of Intellectual Capital, vol 3, issue 3, s 289 16 Edvinsson, L & Malone, M S, 1997, Intellectual Capital: the proven way to establish your company’s real value by measuring its hidden brainpower, s 11, Harper Business 17 Bontis, N, 1998, Intellectual Capital: an exploratory study that develops measures and models, Management Decision, vol 36, issue 2, s 5
Intellectual Capital
Human Capital Structural Capital
Organizational Capital
Customer Capital
Innovation Capital Process Capital

Capital is the work processes, technique, and employee program that enhance the efficiency of manufacturing or the delivery of services. 18 The third component, Customer Capital, is often placed under Structural Capital, though in some models it is a separate category, equivalent to Structural- and Human Capital. Customer Capital is the relationship capital developed with key customers. 19 It is the strength and loyalty of customer relations. The idea that Customer Capital is separate from Human- and Structural Capital indicates its central importance.20
1.2 Problem Discussion The traditional accounting methods are failing to keep up with the changes in the global economy and the emerging importance of Intellectual Capital. The core of the knowledge economy is investments in Human Capital and Information Technology. None of these appears as positive value in traditional accounting, even though they are important for value creation.21 Traditional accounting systems are not capable to measure or monitor most elements of Intellectual Capital.22 To understand the importance of why it is necessary to measure Intellectual Capital it is central to understand the concept of Tobin’s q. The ratio measures the relationship between a company’s market value and the replacement value of its assets.23 The gap between market value and the replacement value is systematic in the knowledge economy and wider than ever.24 Valuation of Intellectual Capital is therefore considered to be one of the greatest challenges for academic researchers.25 Another challenge is establishing consent about what to report and how to report it; few researchers have explored the actual reporting of Intellectual Capital.26 The lack of common practices for revealing and visualizing Intellectual Capital has negative effects on professionals, and is also a problem for small private investors, unable to obtain the right information and make correct investment decisions. Furthermore, an economy that cannot measure its value correctly cannot distribute or allocate its resources or reward its citizens accurately.27 The limitations of the existing financial reporting system for capital market and other stakeholders have led to the development of new ways of measuring and reporting Intellectual Capital. The goals of these new measurement tools are to combine financial and non-financial aspects of the company into one external report. Reports of Intellectual Capital can be traced back to the early 1990s. 18 Edvinsson, L & Malone, M S, 1997, Intellectual Capital: the proven way to establish your company’s real value by measuring its hidden brainpower, s 11, Harper Business 19 Edvinsson, L & Malone, M S, 1997, Intellectual Capital: the proven way to establish your company’s real value by measuring its hidden brainpower, s 11, Harper Business 20 http://www3.bus.osaka-cu.ac.jp/apira98/archives/pdfs/25.pdf, 2003-11-18 21 Edvinsson, L & Malone, M S, 1997, Intellectual Capital: the proven way to establish your company’s real value by measuring its hidden brainpower, s 12, Harper Business 22 http://www3.bus.osaka-cu.ac.jp/apira98/archives/pdfs/25.pdf, 2003-11-18 23 Bontis, N, 1998, Intellectual Capital: an exploratory study that develops measures and models, Management Decision, vol 36, issue 2, s 3 24 Edvinsson, L & Malone, M S, 1997, Intellectual Capital: the proven way to establish your company’s real value by measuring its hidden brainpower, s 1-8, Harper Business 25 Bontis, N, 1998, Intellectual Capital: an exploratory study that develops measures and models, Management Decision, vol 36, issue 2, s 2 26 Guthrie, J, 2001, The management, measurement and the reporting of Intellectual Capital, Journal of Intellectual Capital, vol. 2, issue 1, s 3-6 27 Edvinsson, L & Malone, M S, 1997, Intellectual Capital: the proven way to establish your company’s real value by measuring its hidden brainpower, s 1-8, Harper Business

The Swedish insurance company Skandia was the pioneer company and published the first Intellectual Capital report in 1994.28 The limitations of the traditional accounting system are evident in the health care sector. Today there is no systematic survey that is thoroughly enough. Knowledge at the health care centers is not measured. A survey of the intellectual capital can be a powerful and important tool. It is of high priority for management to know the competence of the centers. It is really important to have the same knowledge in all the Swedish health care centers as it is stated in the Swedish law that Swedish health care should be on equal terms. There has to be a specific type of competence in all health care centers. It is highly important to measure that competence in the centers. It is important for the management as well as employees and patients. The management must know if they are running and governing the centers in the right direction and in the right way. Measuring intellectual capital can be a way to audit the competence of a center. Measurement of intellectual capital can improve the conditions for better health care and can show if the health care centers have the competence needed available. It is also important to measure if all types of necessary competence are available at the centers, for example if there is enough staff and enough nurses with special knowledge. It is also of high importance to measure if there is good knowledge to support the doctors and if the centers have access to the special competence needed to run a center. The management set goals and the measurement of intellectual capital can be a way to measure if the centers have the competence needed to achieve the goals. And if the centers are managed better and more effective health care can actually get cheaper at the same time. Better care with less cost. It is also important to keep in mind that health care cost and society costs goes hand in hand. Today they are treated separately and it is valid to show that if the centers are management more properly and have the right competence the cost for the society will be decreased.29 Health care is not a traditional industry. Important factor such as the number of patients treated and the quality of the care received are not reported in traditional accounting. As stated in a report by the Federation of Swedish County Councils there are currently no good indicators of productivity in the health care sector.30 Hence we have formulated the following questions:
• What aspects of Intellectual Capital in health care centers are relevant to report?
• In what way are the different aspects of Intellectual Capital best measured?
• How can anchoring and performance of an Intellectual Capital reporting in health care centers be facilitated?
28 Guthrie, J, 2001, The management, measurement and the reporting of Intellectual Capital, Journal of Intellectual Capital, vol. 2, issue 1-3, s 29 Interview with Henrik Weibull 2004-05-05 30 ”Swedish Health Care in the 1990s”, 2002, Federation of Swedish County Councils

1.3 Purpose The purpose of this thesis is to develop a prototype framework for Intellectual Capital Reporting in health care centers. This will be achieved by utilizing Intellectual Capital Reporting theories and studying two health care centers.

2
- Method - This chapter encompasses the method used in the thesis. The chapter begins with an introduction and discussion of chosen method. Advantages and disadvantages of the chosen method will then be discussed. The chapter ends with the theoretical framework of the thesis that includes an introduction of the theories described in chapter three.
2.1 Initial Approach Our first contact with the concept of Intellectual Capital was through the master course Strategic Management at Lund University. Professor Leif Edvindsson´s lectures on the subject, made us interested in this relatively new subject. There is an increasing demand among organizations in different fields around the world, to visualize and measure the Intellectual Capital within the organization. The Swedish insurance company Skandia is one of the pioneer companies to visualize the non financial values of the company, and to show it both internal and external. The Danish Government has well developed guidelines for reporting Intellectual Capital that has its roots in the Skandia Navigator, developed by Professor Leif Edvindsson. After discussions with Leif Edvindsson on possible approaches on the subject, we decided to make a study on the Swedish health care sector. We also contacted leading employees of two health care centers in the region of Skåne, who confirmed the need for a tool for measuring and reporting intellectual capital in Swedish health care generally. The Cardio Vascular division of Lund University Hospital is one of the leading institutes in Sweden in reporting Intellectual Capital, and the responsible employees provided us with valuable information. This study has followed the hermeneutic spiral. 31 The spiral begins with the previous knowledge that the individual has. This knowledge will than serve as the foundation for hypothesis, formulated questions and ideas formulate by the investigator. The next point will be to begin a dialog with the investigated material, since it is about a two- way communication. The researcher asks questions and there will be a reaction between the questions asked and the answers, interpreted by the researcher. This will lead do a deeper understanding, which in turn will lead to new questions.
31 Wiederheim-Paul F & Eriksson L T,1997, ”Att utreda forska och rapportera”

2.1 Choice of Method Most research is being classified on basis on how much the researcher knows about the studied are before the research are started. In case of limited knowledge in the studied area the research will be investigating. These kinds of examinations are called explorative. The primary purpose of explorative studies is to obtain as much information as possible regarding the selected problem area. This means that the researcher tries to give a comprehensive view of the studied area. Since the purpose of explorative studies in most cases is to obtain knowledge usable for future studies, wealth of ideas and creativity are important. In an explorative study several different tools for information gathering are being used. 32 This is an explorative study since there have not been many studies of health care centers regarding Intellectual Capital and there is not much academic theory about the field. In an explorative study the researcher encounters new questions and a greater understanding of the studied field is achieved during the work process. 33 There are two main methodical approaches, the deductive and the inductive. The inductive method can be seen as the route of discovery, i.e. the creation of theory through the use of empery. The deductive method on the contrary starts with a theory, which the study tries to prove.34 When an explorative study is chosen an adductive method can be suitable. The adductive method is a combination of the inductive and deductive method, as it allows the use of both the inductive and deductive method. The adductive method will be used in our study, as it allows use to change focus between theory and empery. This is especially useful in the analysis of a new process. We have chosen a qualitative case study as the method for this thesis. Qualitative methods involve little normalization. The method has primary the purpose to understand and not to examine general validity. When working with qualitative methods the principle for crating knowledge is closeness to the units of the research. It is about facing the situation that the examined unit is in. The advantages of qualitative data and methods are that it visualizes the total situation. Such an overall picture makes an increased understanding of the social processes a context possible (system perspective). The closeness to the examined units, made possible by such examining methods are also enabling better picture of the situation in life of the individual (participant perspective). 35 The qualitative method increases the possibility of capturing the unique features of the process.36 Qualitative data has the advantage of delivering in-depth information.37 A quantitative method would not be appropriate for this thesis as it is important to closely study the health care centers.
2.2 Empirical Framework Personal interviews with Ulla Wikström, doctor and head of Kärråkra health care center and Patrik Midlöv, doctor and head of Tåbelund health care center have been conducted. The
32 Patel R & Davidsson B, 1991, ”Att planera, genomföra och rapportera en undersökning” 33 Wiederheim-Paul F & Eriksson L T,1997, ”Att utreda forska och rapportera” 34 Holme, I M & Solvang, B K, 1997, ”Forskningsmetodik – om kvalitativa och kvantitativa metoder” 35 Ibid. 36 Patton, M, 1990, ”Qualitative Evaluation and Research Methods” 37 Holme, I M & Solvang, B K, 1997, ”Forskningsmetodik – om kvalitativa och kvantitativa metoder”

dialog has continued via e- mail. During the work process the two heads have provided feedback on the study. Furthermore an interview with Henrik Weibull of Region Skåne has also been conducted. An interview with Ann Gyllenborg at the Cardio Vascular Division of Lund University Hospital has also been done. Ann Gyllenborg was in charge of the implementation of the Intellectual Capital report system at the division. Besides these interviews several sources have been analyzed, such as web pages concerning Intellectual Capital and health care, Intellectual Capital reports and Intellectual Capital and health care brouchers. 2.2.1 Interviews Interviews are common elements of an explorative study. Interviews can be divided into structured or non structured, and standardized or non standardized interviews. The interviews performed have been semi standardized. A number of questions were prepared in advance and complemented with a number of additional questions during the interviews. The order of the questions was decided before the interviews were performed. Interviews with a lower degree of standardization have the advantages that the respondents´ answers can be more carefully balanced.38 We consider semi standardized interviews to be appropriate for this essay. Hence one of the aims with the interviews was to give the respondents time to develop and express their own opinions and answers. Interviews that are standardized are always structured while non standardized interviews can be either structured or none structured. Structured interviews are oriented towards information. The interviews conducted were none structured. The objective was to obtain balanced answers about the respondents´ areas of expertise; this was clarified for the respondents before the interviews. The questions were meant to encourage a dialogue, and were formulated to support a systematic survey of the areas of interest. 39 It is important to explain the purpose of the interview for the respondents. It is also of importance to explain why the respondents’ contributions are meaningful and how they will be used in the essay.40 We have tried to motivate the respondents and create a closer relationship by informing about the purpose of the thesis and what the benefits are for the respondents. An interview should start and end with neutral questions. The in-between questions should deal with the precise area of interest.41 We have used a cone approach42, which implies that the first questions should be wide and open, and the later ones more precise and specific. This technique is considered motivating and activating due to the fact that the respondents get the opportunity to answer the questions independently.43 The initial questions dealt with the respondents´ general views on Intellectual Capital and health care and could be considered neutral. We wanted the respondents to feel relaxed and not effected by earlier answers. The later questions could be defined as specific, as they dealt with the respondents’ personal views on the importance of Intellectual Capital Reporting and measuring.
38 Holme, I M & Solvang, B K, 1997 ”Forskningsmetodik – om kvalitativa och kvantitativa metoder” 39Ibid. 40 Patel, R & Davidsson, B, 1994, Forskningsmetodikens grunder, s 63, Studentlitteratur, andra upplagan. 41 Patel, R & Davidsson, B, 1994, Forskningsmetodikens grunder, s 63, Studentlitteratur, andra upplagan. 42 Our translation: Swedish ”Tratt principen” 43 Patel, R & Davidsson, B, 1994, Forskningsmetodikens grunder, s 64-65, Studentlitteratur, andra upplagan.

2.3 Theoretical Framework Five different theoretical viewpoints have been used: the Skandia Navigator, the Danish Intellectual Capital Statement Model (The Danish Model), IC RatingTM, the PENG-Model and the Cardio Vascular Department of Lund University Hospital Model (The Cardio Vascular model). Leif Edvinsson developed the Skandia Navigator for the Swedish insurance company Skandia in 1994. The Navigator was a pioneer model in the field of Intellectual Capital. It is a tool for Intellectual Capital measuring and reporting in private sector companies. The model consists of five areas of focus that captures different parts of a company’s Intellectual Capital. We find the Skandia Navigator to be useful in this thesis. The measurements tools developed in the Navigator for reporting a company’s Intellectual Capital has worked as a basis for this thesis, even though originally developed for the private sector. In the year 2003 The Danish Ministry of Science, Technology and Innovation published the two publications: Intellectual Capital Statements - the New Guideline and Analyzing Intellectual Capital Statements. The former one is written as a guide for the preparation of Intellectual Capital statements. The guideline also shows how to communicate the results in the external Intellectual Capital statement. The ministry’s second publication is an analysis model, which helps to structure information and data in the Intellectual Capital statements. We have used significant parts of the Danish Model in this study, as it is a well developed tool for Intellectual Capital reporting. The model consists of four elements, all of which have been helpful in the analysis part of the thesis.

The PENG- model is an evaluation tool of Information Technology investments in the health care sector. It evaluates the benefits of potential investment. The model consists of three phases and ten steps. We think that the implementation phase in the PENG- model where benefits are identified structured and evaluated is useful for Intellectual Capital reporting in health care centers. The Cardio Vascular Division of Lund University Hospital first Intellectual Capital report was published in 2002 as a subset of the annual report. The Intellectual Capital report has its origin in the Skandia Navigator and is part of the divisions Balanced Score Card. The report is divided into five areas and includes 20 indicators that measure the Intellectual Capital. The Cardio Vascular Model deals with similar subject as those studied by us. The indicators developed by the division have been of interest for Intellectual Capital reporting in health care centers. IC RatingTM is developed by Intellectual Capital Sweden AB. IC RatingTM is a tool for measuring and describing of Intellectual Capital. IC RatingTM has theories of Intellectual Capital as a starting point. IC RatingTM has been endorsed through empirical analyses of a large number of companies. The results of an IC RatingTM are presented from 3 different perspectives. A result of the rating is an evaluation of the risk. That evaluation has been valuable for this thesis.
Figure 2: The thesis theoretical and empirical framework
PENG-Model
Skandia Navigator
Cardio Vascular Department
Danish Guidelines
IC RatingTM
Theory
Health Care Center Kärråkra
Health Care Center Tåbelund
Empirics

2.3.1 Criticism of Sources In our analysis of primary and secondary data we have applied the following criteria: Validity- does the source measure what it is supposed to? Is the information valid? 44 In a qualitative study with interviews it is important to ask the following question: How valid is the information received from the respondents? Sometimes the respondent answers questions to make a good impression. The interviewer’s personality and work method can also affect the result of the interview. 45 We believe that the validity of the information received in our interviews is high. The biases for this assumption are that the people we have interviewed are heads of health care centers and have experience and knowledge of the daily work in a health care center. They are qualified to identify important aspects of health car centers’ Intellectual Capital. There can be a risk that the questions asked did not capture all aspects of the unexplored area. It would have been desirable to conduct follow up interviews in a later stage of the explorative process. The theory consisting of five models has different levels of validity. The Danish Model and The Skandia Navigator have high validity in this thesis, since they are well developed and consider many valuable aspects of Intellectual Capital reporting. Considering the PENG- model and IC RatingTM are foremost developed for practical use and has limited scientific value. Despite this, the model contributed with important insight regarding benefit valuation. Reliability- Is the source reliable?46 Is the respondent truthful? Do the respondents have personal interest in giving one-sided information? If people with high levels of knowledge in the studied area are interviewed there is a risk for one-sided information. By the use of several different sources the reliability of a study can be increased. 47 We believe that the reliability of the thesis is satisfying. Two different health care centers have bee used. A larger number of health care centers would have been desirable as it would have improved the reliability further, but due to lack of time this was not possible. The respondents are to be considered reliable. There are few reasons for giving one-sided information, since there are no obvious advantages to be gained. If a greater number of respondents with different areas of responsibility had been interviewed, the reliability of the study would have been improved even more. Limited resources and time available made this impossible. The reliability concerning the theory used in the thesis is considered high. Several of the theoretical models are developed by acclaimed Intellectual Capital researchers and have been widely used both in practice and theory.
44 Wiedersheim-Paul F & Eriksson L T, 1997,”Att utreda forska och rapportera” 45 Halvorsen, K, 1992, ”Samhällsvetenskaplig metod” 46 Wiederheim-Paul F & Eriksson L T, 1997,”Att utreda forska och rapportera” 47 Holme, I M & Solvang, B K, 1997, ”Forskningsmetodik – om kvalitativa och kvantitativa metoder”

3
-Theory- This chapter includes theory used, and describes five models of Intellectual Capital reporting: The Skandia Navigator, The Danish Model, IC Rating TM, the PENG Model and The Cardio Vascular Model. These models will be applied in the analysis chapter.
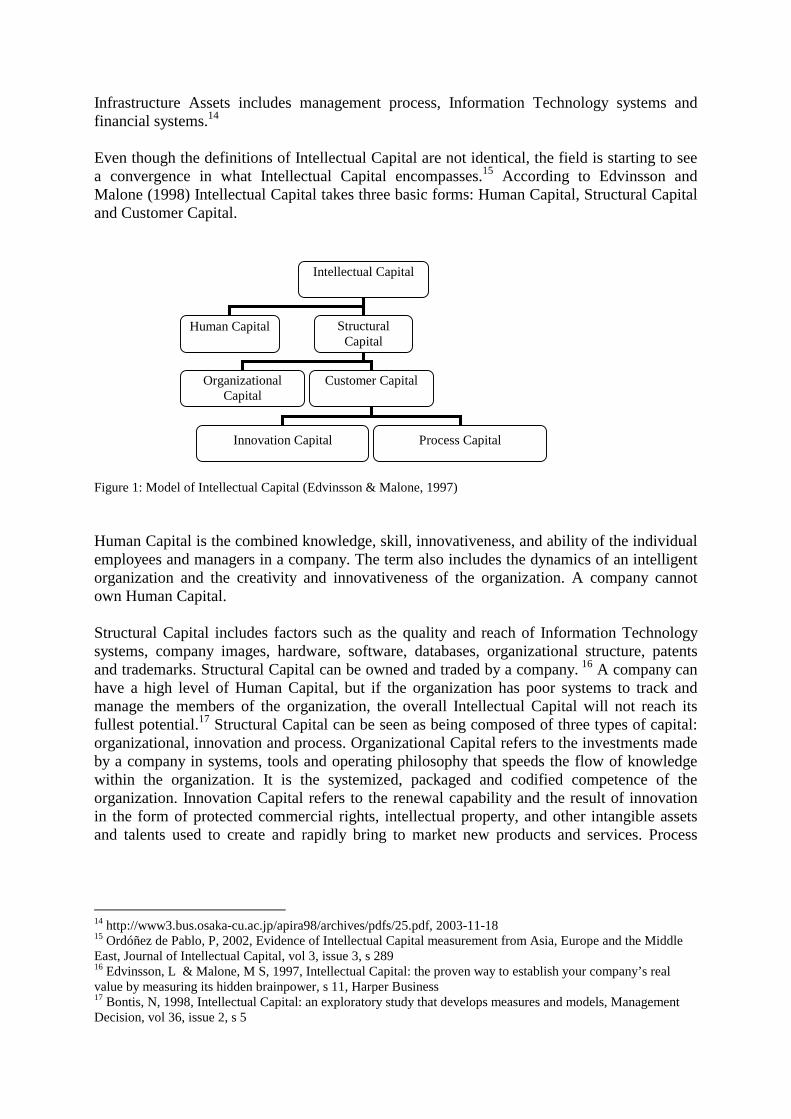
3.1 The Skandia Navigator The Skandia Navigator was developed in 1994 for the Swedish insurance company Skandia. The Skandia Navigator is constructed to be a starting point for organizational Intellectual Capital reporting. The Navigator consists of five areas of focus: Financial Focus, Customer Focus, Process Focus, Renewal and Development Focus, and Human Focus. Company attention on these areas creates value from the company’s Intellectual Capital. The Skandia Navigator includes 111 indicators and three types of measurements: direct counts, dollar amounts and percentages. 48An effective Intellectual Capital Navigator should accomplish three tasks:
• The Navigator must act as a guide to the right types of measurements, link them by category and tie them together.
• The Navigator must also be able to process data to a number of figures that can be
used for an evaluation of a company’s Intellectual Capital and for comparison.
• The Navigator must be easily understood and comprehensive.49
48 Edvinsson, L & Malone, M S, 1997, Intellectual Capital: the proven way to establish your company’s real value by measuring its hidden brainpower, s 178, Harper Business 49 Edvinsson, L & Malone, M S, 1997, Intellectual Capital: the proven way to establish your company’s real value by measuring its hidden brainpower, s 70, Harper Business
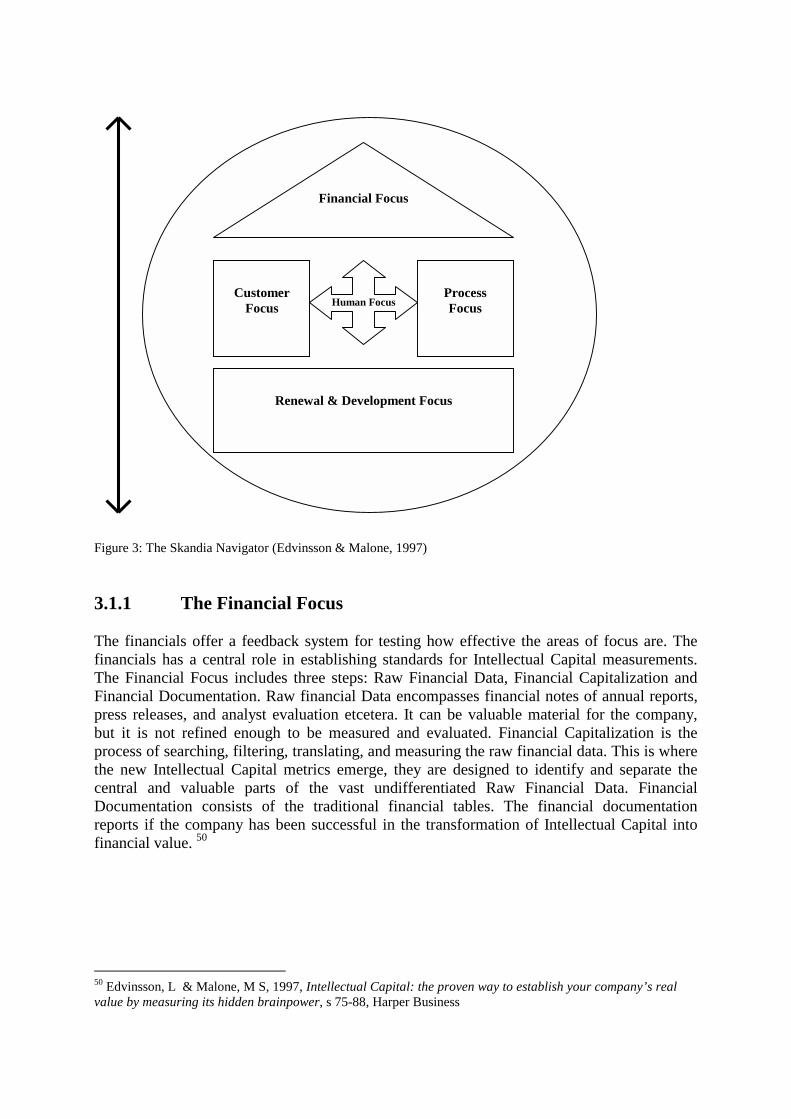
Figure 3: The Skandia Navigator (Edvinsson & Malone, 1997) 3.1.1 The Financial Focus The financials offer a feedback system for testing how effective the areas of focus are. The financials has a central role in establishing standards for Intellectual Capital measurements. The Financial Focus includes three steps: Raw Financial Data, Financial Capitalization and Financial Documentation. Raw financial Data encompasses financial notes of annual reports, press releases, and analyst evaluation etcetera. It can be valuable material for the company, but it is not refined enough to be measured and evaluated. Financial Capitalization is the process of searching, filtering, translating, and measuring the raw financial data. This is where the new Intellectual Capital metrics emerge, they are designed to identify and separate the central and valuable parts of the vast undifferentiated Raw Financial Data. Financial Documentation consists of the traditional financial tables. The financial documentation reports if the company has been successful in the transformation of Intellectual Capital into financial value. 50
50 Edvinsson, L & Malone, M S, 1997, Intellectual Capital: the proven way to establish your company’s real value by measuring its hidden brainpower, s 75-88, Harper Business
Financial Focus
Customer
Focus
Process Focus
Renewal & Development Focus
Human Focus
The Financial Focus Indicators:51
• Total assets (£) • Total assets/employee (£) • Revenues/total assets (%) • Profits/total assets (£) • Revenues resulting from new business operations (£) • Profits resulting from new business operations (£) • Revenues/employee • Customer time/employee attendance (%) • Profits/employee (£) • Lost business revenues compared to market average (%) • Revenues from new customers/total revenues (%) • Market value (£) • Return on net asset value (%) • Return on net assets resulting from new business operations (£) • Value added/employee (£) • Value added/IT-employee (£) • Investments in IT (£) • Value added/customer (£)
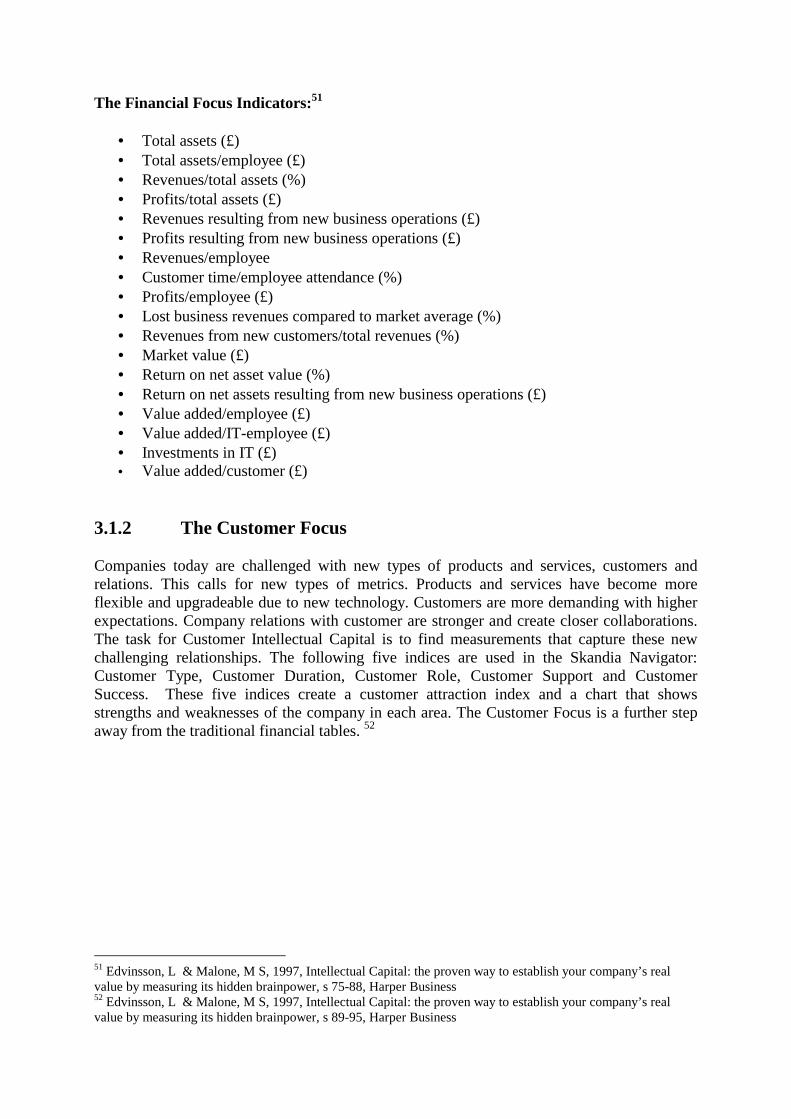
3.1.2 The Customer Focus Companies today are challenged with new types of products and services, customers and relations. This calls for new types of metrics. Products and services have become more flexible and upgradeable due to new technology. Customers are more demanding with higher expectations. Company relations with customer are stronger and create closer collaborations. The task for Customer Intellectual Capital is to find measurements that capture these new challenging relationships. The following five indices are used in the Skandia Navigator: Customer Type, Customer Duration, Customer Role, Customer Support and Customer Success. These five indices create a customer attraction index and a chart that shows strengths and weaknesses of the company in each area. The Customer Focus is a further step away from the traditional financial tables. 52
51 Edvinsson, L & Malone, M S, 1997, Intellectual Capital: the proven way to establish your company’s real value by measuring its hidden brainpower, s 75-88, Harper Business 52 Edvinsson, L & Malone, M S, 1997, Intellectual Capital: the proven way to establish your company’s real value by measuring its hidden brainpower, s 89-95, Harper Business

Customer Focus Indicators:53
• Market share (%) • Numbers of customers (no.) • Annual sales/customers (£) • Customer lost (no.) • Average duration of customer relationship (no.) • Average customer size (£) • Customer rating (%) • Customer visits to the company (no.) • Days spent visiting customers (no.) • Customer/employee (£) • Field salespeople (no.) • Field sales management (no.) • Average time from customer contact to sales response (no.) • Ratio of sales contacts to sales closed (%) • Satisfied customer index (%) • IT investment/salesperson (£) • IT investment/service and support employee (£) • Support expense/customer (£) • Service expense/customer/year (£) • Service expense/customer/contact (£)
3.1.3 The Process Focus The Process Focus deals with technology as a tool for supporting company value creation. It is a risk to adopt a new technology. A company can be able to get a head start and obtain a competitive advantage over its competitors if the chosen technology becomes a standard. If the technology does not become a standard it can cause the company sever damage. The most expensive technology mistake is having the wrong adopting philosophy when implementing a new technology in the company. An open ended implementation philosophy has neither established goals that can be measured nor can it guide the company. The result is that success is measured through the financials, not through evaluating the outcome of the new technology.
53 Edvinsson, L & Malone, M S, 1997, Intellectual Capital: the proven way to establish your company’s real value by measuring its hidden brainpower, s 89-95, Harper Business
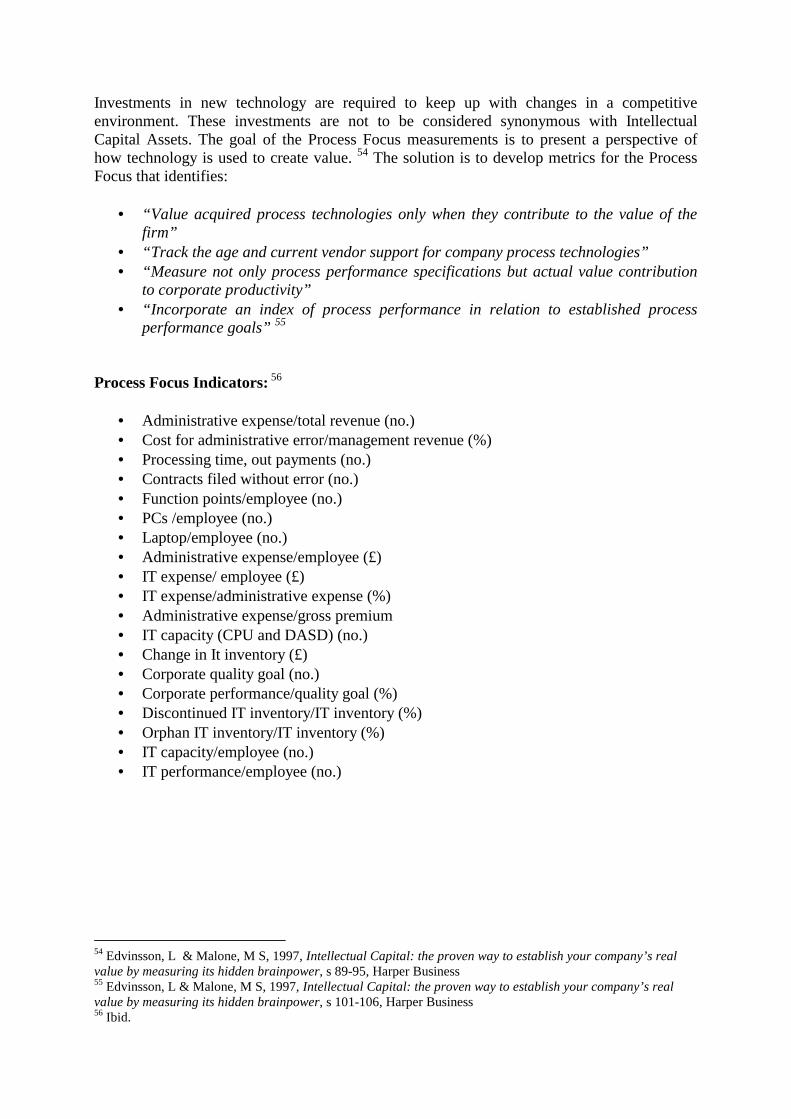
Investments in new technology are required to keep up with changes in a competitive environment. These investments are not to be considered synonymous with Intellectual Capital Assets. The goal of the Process Focus measurements is to present a perspective of how technology is used to create value. 54 The solution is to develop metrics for the Process Focus that identifies:
• “Value acquired process technologies only when they contribute to the value of the firm”
• “Track the age and current vendor support for company process technologies” • “Measure not only process performance specifications but actual value contribution
to corporate productivity” • “Incorporate an index of process performance in relation to established process
performance goals” 55 Process Focus Indicators: 56
• Administrative expense/total revenue (no.) • Cost for administrative error/management revenue (%) • Processing time, out payments (no.) • Contracts filed without error (no.) • Function points/employee (no.) • PCs /employee (no.) • Laptop/employee (no.) • Administrative expense/employee (£) • IT expense/ employee (£) • IT expense/administrative expense (%) • Administrative expense/gross premium • IT capacity (CPU and DASD) (no.) • Change in It inventory (£) • Corporate quality goal (no.) • Corporate performance/quality goal (%) • Discontinued IT inventory/IT inventory (%) • Orphan IT inventory/IT inventory (%) • IT capacity/employee (no.) • IT performance/employee (no.)
54 Edvinsson, L & Malone, M S, 1997, Intellectual Capital: the proven way to establish your company’s real value by measuring its hidden brainpower, s 89-95, Harper Business 55 Edvinsson, L & Malone, M S, 1997, Intellectual Capital: the proven way to establish your company’s real value by measuring its hidden brainpower, s 101-106, Harper Business 56 Ibid.

3.1.4 The Renewal and Development Focus The Renewal and Development Focus identifies the opportunities that will shape a company’s future. The task of the focus is to find the unexploited potential of a company’s Intangible Assets. The focus establishes what activities the company is undertaking to organize itself for the future. The Skandia Navigator identifies six areas by within a company can prepare for future changes: Customers, Attractiveness on the market, Products and Services, Strategic Partners, Infrastructure and Employees. 57 The Renewal and Development Indicators:
• Competence development expense/employee (£) • Satisfied Employee Index (no.) • Marketing expense/customer (£) • Share of training hours (%) • Share of development hours (%) • Opportunity share (%) • R&D expense/administrative expense (%) • Training expense/employee (%) • Training expense/administrative expense (%) • Business development • Expense/administrative expense (%) • Share of employee below age 40 (%) • IT development expense/IT expense (%) • IT expenses on training/IT expense (%) • R & D resources/total resources (%) • Customer opportunity base captured (no.) • Average customer age, education and income (no.) • Average customer duration with company per month (no.) • Educational investment (customer (£) • Direct communications to customer/year (no,) • Non-product-related expense/customer/year (£) • New markets development investment (£) • Structural Capital development investment (£) • Value of EDI system (£) • Upgrades to EDI system (£) • Capacity of EDI system (no.) • Ratio of new products (less that two years) to • Full company product family (%) • R & D invested in basic research (%) • R & D invested in product design (%) • R & D invested in applications (%) • Investment in new product support and training (£) • Average age of company patents (no.)
57 Edvinsson, L & Malone, M S, 1997, Intellectual Capital: the proven way to establish your company’s real value by measuring its hidden brainpower, s 111-115, Harper Business

• Patents pending (no.) 3.1.5 Human Focus Measuring Human Focus is the most difficult part of the Skandia Navigator. There is no simple method to measure Human Capital. A challenge is the new and changing labor force, management styles and organizations that demand new types of information. The virtual corporations create and coexist with new kinds of employees: office goers, telecommuters and corporate gypsies are some examples. To measure Human Capital there has to be a general agreement on objectives, metrics and value. Intellectual Capital can provide a format for measurement of Human Capital. 58 The Human Focus Indicators:
• Leadership index (%) • Motivation index (%) • Empowerment Index (no.) • Number of employees (no.) • Employee turnover (%) • Average years of service with company (no.) • Number of managers (no.) • Number of female managers (no,) • Average age of employee (no.) • Time in training (days/year) (no.) • It-literacy of staff (no.) • Number of full time/permanent employees (no.) • Average age of full time/permanent employee (no.) • Average years with company of full time/permanent employee (no.) • Annual turnover of full time permanent (no.) • Per capita annual cost of training, communication, and support programs for full time
permanent employee (£) • Full time permanent / employees who spend less than 50 percent of worth hours at a
corporate facility • Number of full time temporary employees. • Average years with company of full time temporary employees. • Per capita annual cost of training and support programs • for full time temporary employees (£) • Number of part time employees/ non full time contractors (no.) • Average duration of contracts (no.) • Percentage of company managers with advanced degrees in business, science and
engineering, liberal arts (%)
58 Edvinsson, L & Malone, M S, 1997, Intellectual Capital: the proven way to establish your company’s real value by measuring its hidden brainpower, s 123-137 Harper Business

3.2 The Danish Ministry of Science, Technology and Innovation Intellectual Capital Statement According to The Danish Ministry of Science, Technology and Innovation, the Intellectual Capital statement consists of four elements that together express a company’s knowledge management. This model is based on the Skandia Navigator and is a further development of the model. The users of a company´ s goods or services are linked with the company’s need for knowledge resources through the four elements. They include the establishment of the need for knowledge management, a set of initiatives to improve knowledge management and a set of indicators to define measure and follow up initiatives. 3.2.1 Knowledge Narrative The first element, the Knowledge Narrative, states a company’s ambition to increase the value a user receives from a company’s goods or services. A set of knowledge resources are needed to create this value and the Knowledge Narrative identifies which knowledge resources required. A narrative is created because this ambition together with the user’s and the company’s knowledge resources are being merged. 3.2.2 Management Challenges The knowledge resources needed to be strengthened through in-house development or externally is highlighted by the second element, a set of Management Challenges. By intensified co-operation with innovative customers, by developing greater expertise in specific fields or by acquiring better insight into the company’s control process this can be achieved. Management Challenges such, as these usually do not change every year. They are closely linked to the Knowledge Narrative and therefore to the individual knowledge resources within the company. Changing existing Knowledge Resources could be the starting point for the Management Challenges. It could also be introducing new types of knowledge resources that are currently not found within the company. 3.2.3 Initiatives The third element is a set of Initiatives that can be taken to change the Management Challenges. The Initiatives compose, develop and procure knowledge resources and monitor their extent and effects. This might be investing in IT, hiring more R&D consultants or launching training programs. To increase employee satisfaction social activities can be introduced. These actions are all short-term. Even if specific types of initiatives are repeated over several years, when comparing one year with the next, initiatives must be seen to work. 59
59 http://www.videnskabsministeriet.dk/cgi-bin/doc-show.cgi?doc_id=138091&leftmenu=PUBLIKATIONER. 2003-11-28

3.2.4 Indicators The fourth element consists of a set of Indicators. They make it possible to follow up whether the Initiatives have been launched or whether the Management Challenges are being met. Indicators make Initiatives measurable and visible. It is therefore possible to determine whether an initiative has been launched and its effect. Some indicators are directly related to specific Initiatives such as training days or amounts invested in IT. Others are related only indirectly to specific initiatives such as number of R&D consultants or newly appointed software engineers. 3.2.5 The Intellectual Capital Statement Model The four elements are interrelated and the relevance only becomes clear when put into context. The elements work together. The Indicators show how Initiatives are being launched and put into effect. The Initiatives formalize the problems identified as Management Challenges. The Management Challenges single out what has to be done if knowledge resources are to be developed. The Knowledge Narrative sums up, communicates and re-orientates the company’s skills and capacity, and which knowledge resources are needed. The analysis can be presented in the Intellectual Capital Statement Model. The interrelationship between the elements is indicated by the structure of the model.60
Figure 4: The Intellectual Capital statement model (The Danish Ministry of Science, Technology and Innovation Intellectual Capital statement, 2003)
60 http://www.videnskabsministeriet.dk/cgi-bin/doc-show.cgi?doc_id=138091&leftmenu=PUBLIKATIONER. 2003-11-28
Knowledge Narrative
Management Challenges
Initiatives Indicators

A company’s Intellectual Capital Statement should be systematically read. The following three general questions regarding the company’s knowledge management should be answered.61
• Resources: How is the company’s knowledge resource comprised? • Activities: What has the company done to strengthen its knowledge resources? • Effects: What are the effects of the company’s knowledge management work?
The Intellectual Capital Statement content is determined by the characteristics of a company. Intellectual Capital statements show wide variations, it reflect the differences in how companies use their knowledge resources to create value for their users. The Knowledge Narrative, Management Challenges, Initiatives and Indicators are unique to each company. 3.2.6 The Analysis Model To analytically read the Intellectual Capital statements it is important to develop a method for understanding the common characteristics. The analysis model is an accounting system where Intellectual Capital statement indicators are positioned with respect to two dimensions. One dimension concerns the four types of knowledge resources: employees, customers, processes and technologies. The other dimension concerns the three evaluation criteria that arise out of the analysis questions.
61 http://www.videnskabsministeriet.dk/cgi-bin/doc-show.cgi?doc_id=138091&leftmenu=PUBLIKATIONER. 2003-11-28
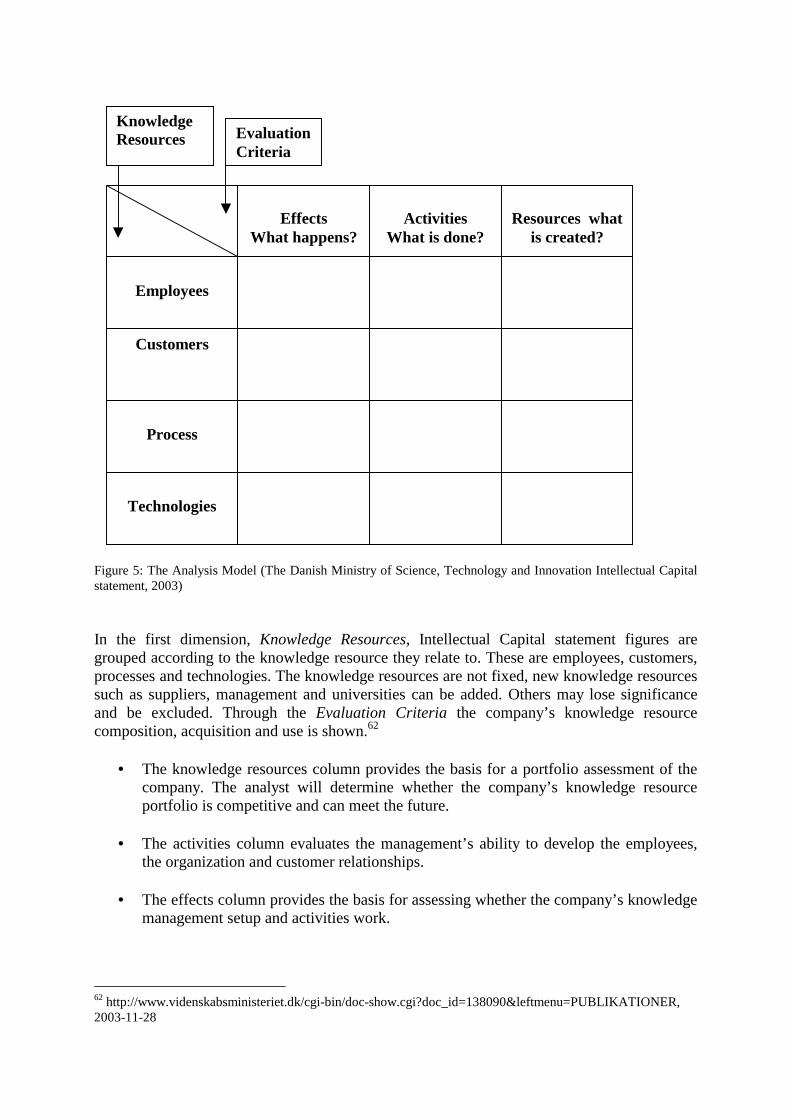
Figure 5: The Analysis Model (The Danish Ministry of Science, Technology and Innovation Intellectual Capital statement, 2003) In the first dimension, Knowledge Resources, Intellectual Capital statement figures are grouped according to the knowledge resource they relate to. These are employees, customers, processes and technologies. The knowledge resources are not fixed, new knowledge resources such as suppliers, management and universities can be added. Others may lose significance and be excluded. Through the Evaluation Criteria the company’s knowledge resource composition, acquisition and use is shown.62
• The knowledge resources column provides the basis for a portfolio assessment of the company. The analyst will determine whether the company’s knowledge resource portfolio is competitive and can meet the future.
• The activities column evaluates the management’s ability to develop the employees,
the organization and customer relationships.
• The effects column provides the basis for assessing whether the company’s knowledge management setup and activities work.
62 http://www.videnskabsministeriet.dk/cgi-bin/doc-show.cgi?doc_id=138090&leftmenu=PUBLIKATIONER, 2003-11-28
Customers
Process
Technologies
Employees
Effects
What happens?
Activities
What is done?
Resources what
is created?
Knowledge Resources Evaluation
Criteria

3.3. IC RatingTM
IC RatingTM is a tool for measuring Intellectual Capital. It decides the ability of knowledge based companies to create value. IC RatingTM functioning as:
• A modern business control system with measurable maximizing future profit ability. In order to measure achievement this analysis can be repeated.
• A foundation for improving and changing activities which can be used on both
operational and management levels. Through the IC RatingTM areas that can be improved can be identified and changes can be made.
• A structured image of value creating assets to be used in the organization as well as in
market communications, where it creates a new basis and a new language for internal aspects important to the activity.
3.3.1 Conceptual Framework
Figure 6: IC RatingTM Conceptual Framework (IC RatingTM, 2003)
Business recipe is composed of a company’s business idea and strategy in combination with its environment. The strength of a company’s business recipe is decided by how well the company is differentiated.63 Organizational Capital is a result of the employees’ attempts to transfer knowledge to the company. Intellectual Properties are a company’s packaged and protected knowledge. The goal of the Process Capital is to make it possible for the employees to increase the financial return on their knowledge. The goal is achieved by increasing the conditions of the employees to focus on its core competence. 63 www.IntellectualCapital.se, 2004-01-06
Intellectual Capital
Business Recipe
Organization Capital
Human Capital
Relation Capital
Intellectual Properties
Process Capital
Management Employees Network Brand Customers

Human Capital consists of the employees and can be controlled by the company, for example by contracts. Management is responsible for the overall development of the Intellectual Capital. The Relational Capital includes the main contributors to the value of a company’s Relational Capital. It consists of contacts and collaborations, reputation, customer relations and customer potential. The network of a company consists of all the networks of importance to a company. Brand is defined by a company’s reputation and by how well the company is differentiated. The Customers have other positive functions, except from generating revenues. They can also serve as references of the ability of a company. The most important aspect is the ability to maintain and attract developing customers. The working conditions for the other parts of the Intellectual Capital are formed by the Business Recipe. Business concept and strategy are assessed on their own. The assessment also considers the conditions for the Human- and the Structural Capital in the context that the Business Recipe provides. The value of the Intellectual Capital is a combination between the strength of the business recipe and the efficiency of the Human- and Structural Capital. IC RatingTM is based upon data collected from external as well as external interest groups related to the company such as quantifiable interviews with management, employees, and customers’ etcetera. The results of an IC RatingTM are presented from 3 different perspectives:64
• “An assessment of the present efficiency of the Intellectual Capital” • “An assessment of the company's efforts to renew and develop its Intellectual Capital” • “An assessment of the risk that the present efficiency will decrease”
An IC RatingTM results in quantified measurements of the resources that are of critical importance for the company's long term profitability. This result can be used as a foundation for change and also as a tool in daily activities.65
64 www.IntellectualCapital.se 2004-01-06 65 Ibid.

3.4 The PENG-model The PENG- model is created by Dahlgren et al, and is a tool for measuring benefit. This is done with a structural method to evaluate in dollars the value of the benefit. The benefit is divided in to three different categories: Direct benefit, indirect benefit and Intangible benefit. The Direct benefit is the easiest to measure and is defined as benefit directly affects the results of the organization, such as lowered costs due to employee redundancy. The Indirect benefit is harder to measure and can be benefits such as higher quality in the work produced. The Intangible benefit is the most difficult to measure and is often benefit such as improved image, with are difficult to measure. The PENG – model is especially useful in the measurements of “soft” benefits that are not traditionally evaluated in dollars and cents. Examples of “soft” benefits are: improved customer visits, fewer complaints and reliable delivers etc. The benefit analysis is usually presented in the form of diagrams. The net benefit is defined as gross benefit minus the cost of the benefit.66 Figure 7: Result of benefit analysis with the PENG-model (Dahlgren et al, 2003) A PENG benefit evaluation must be done with actual, concrete situations that can be described and cannot be done “in principle”. According to Dahlgren et al the most important outcomes of a benefit evaluation with PENG are:
- A process that involves people and leads to a situation where the participants “speak the same language”.
- A foundation for decision-making that portrays the size of the net benefits achieved.
- An increased potential for a successful investment.
66 Dahlgren et al, 1997, Make IT Profitable, Ekerlids Förlag
Intangible
Benefit
Indirect Benefit
Direct Benefits
Cost of Benefit
Net Benefit
Gross Benefit
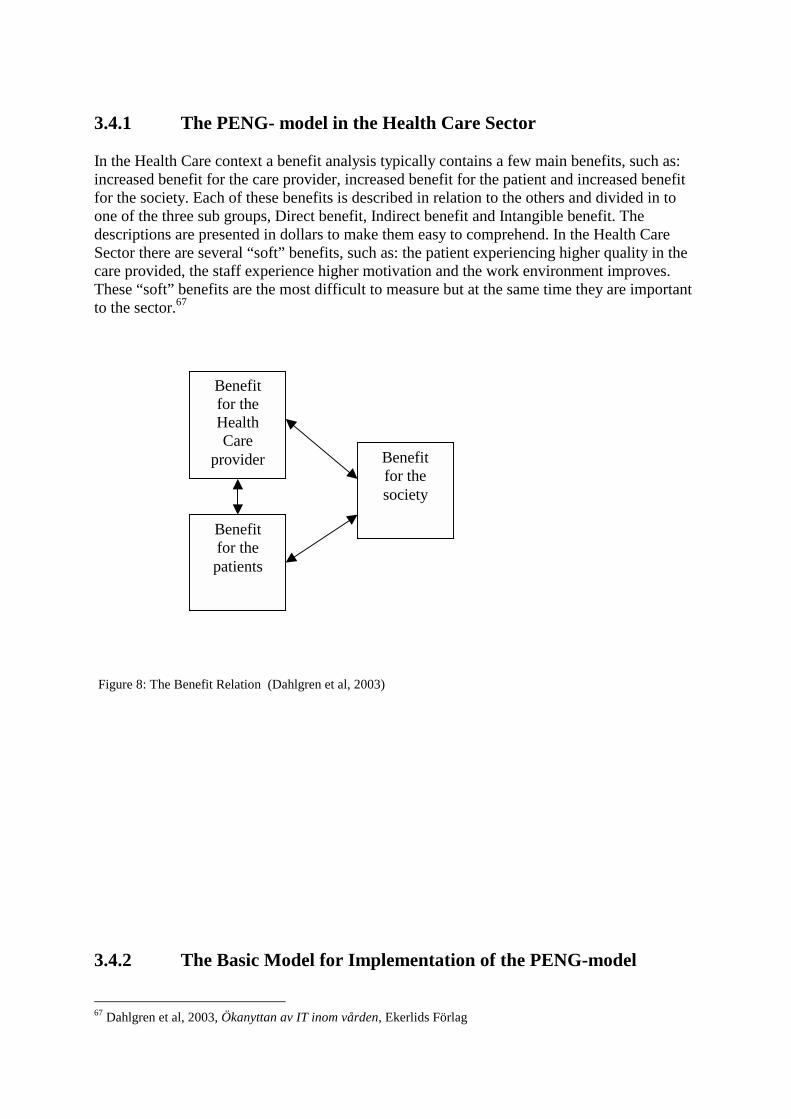
3.4.1 The PENG- model in the Health Care Sector In the Health Care context a benefit analysis typically contains a few main benefits, such as: increased benefit for the care provider, increased benefit for the patient and increased benefit for the society. Each of these benefits is described in relation to the others and divided in to one of the three sub groups, Direct benefit, Indirect benefit and Intangible benefit. The descriptions are presented in dollars to make them easy to comprehend. In the Health Care Sector there are several “soft” benefits, such as: the patient experiencing higher quality in the care provided, the staff experience higher motivation and the work environment improves. These “soft” benefits are the most difficult to measure but at the same time they are important to the sector.67
Figure 8: The Benefit Relation (Dahlgren et al, 2003) 3.4.2 The Basic Model for Implementation of the PENG-model 67 Dahlgren et al, 2003, Ökanyttan av IT inom vården, Ekerlids Förlag
Benefit for the patients
Benefit for the Health Care
provider Benefit for the society
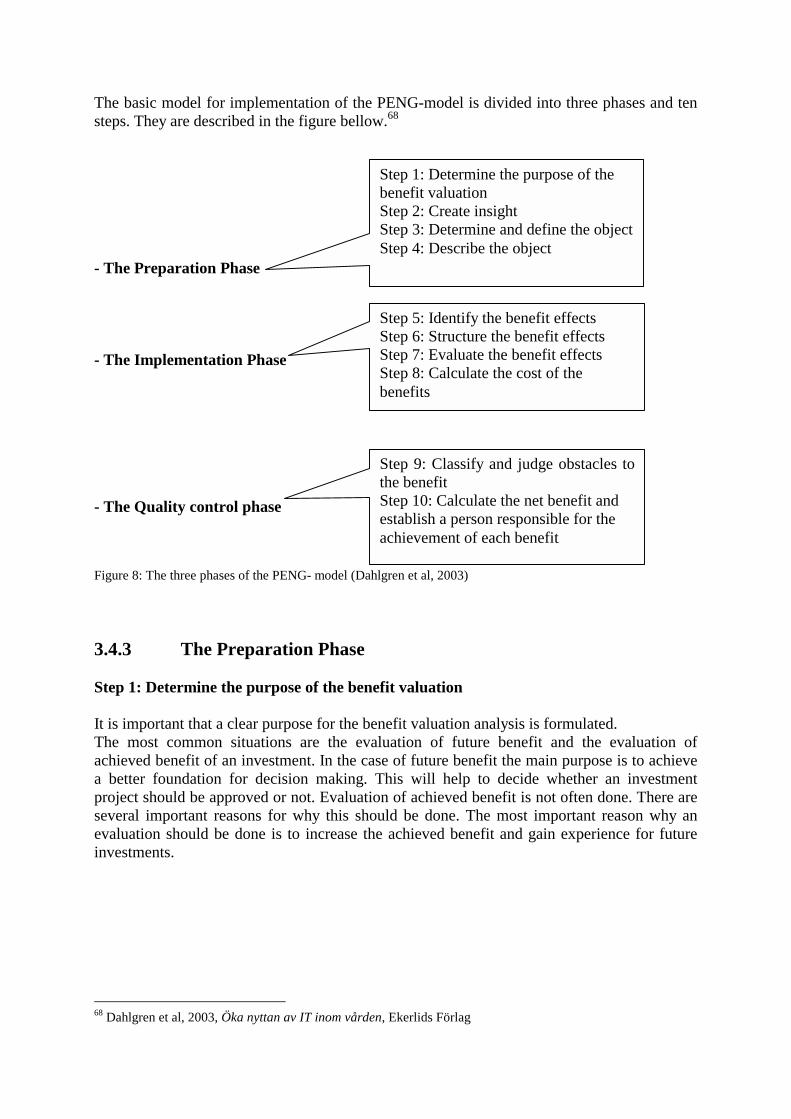
The basic model for implementation of the PENG-model is divided into three phases and ten steps. They are described in the figure bellow.68 - The Preparation Phase - The Implementation Phase - The Quality control phase Figure 8: The three phases of the PENG- model (Dahlgren et al, 2003) 3.4.3 The Preparation Phase Step 1: Determine the purpose of the benefit valuation It is important that a clear purpose for the benefit valuation analysis is formulated. The most common situations are the evaluation of future benefit and the evaluation of achieved benefit of an investment. In the case of future benefit the main purpose is to achieve a better foundation for decision making. This will help to decide whether an investment project should be approved or not. Evaluation of achieved benefit is not often done. There are several important reasons for why this should be done. The most important reason why an evaluation should be done is to increase the achieved benefit and gain experience for future investments.
68 Dahlgren et al, 2003, Öka nyttan av IT inom vården, Ekerlids Förlag
Step 1: Determine the purpose of the benefit valuation Step 2: Create insight Step 3: Determine and define the object Step 4: Describe the object
Step 9: Classify and judge obstacles tothe benefit Step 10: Calculate the net benefit and establish a person responsible for the achievement of each benefit
Step 5: Identify the benefit effects Step 6: Structure the benefit effects Step 7: Evaluate the benefit effects Step 8: Calculate the cost of the benefits
Step 2: Create insight A team led by a team leader implements the benefit analysis. Usually the group is composed of 5-8 employees. Experience has shown that the most difficult part is creating a competent team. The team has to have knowledge about the area being evaluated and be able to commit sufficient time to the project. Experience has shown that the PENG-analysis is often done to late in the investment process, which effects demand specification and cost level. The benefit analysis should be done at regular intervals during the project as shown by the points marked DP in figure 7. Step 3: Determine and define the object The benefit analysis can be used on all types of investments. The PENG-model has foremost been applied for the evaluation of IT investments, but has been used in other types of investments such as in education. Step 4: Describe the object The ability to describe the new investment process in a pedagogical fashion can be decisive for the quality of the benefit analysis. 3.4.4 The Implementation Phase Step 5: Identify the benefit effects The analysis team must start by achieving a common view of the area of benefits that are to be achieved. The different benefit effects are then written down for the following step. Step 6: Structure the benefit effects In the sixth step different benefit effects are structured according to area and type. The benefit effects that are found to be the most interesting are chosen and taken to the next step. Step 7: Value the benefit effects This is one of the most difficult steps but also one of the more important. In step seven the benefit effect has to be evaluated and measured. Experience has shown that even though this seems difficult an evaluation that all in the team can agree upon almost always is achieved. The valuation agreed upon does not have to be of accounting standards.69 Step 8: Calculate the cost of the benefit
69 Dahlgren et al, 2003, Öka nyttan av IT inom vården, Ekerlids Förlag

The cost for the project is normally not calculated by the analysis group, but by somebody selected for this task. It is of importance that all cost that is associated with the project is included, i.e. yield, deductions etcetera, in accordance to normal financial routines. 3.4.5 The Quality Control Phase Step 9: Classify and estimate obstacles to the benefit The valuation must in step nine be critically analyzed. The different benefits are categorized in three classes: direct result influencing benefit, indirect result influencing benefits and benefit that is hard to value. There can be several obstacles to the achievement of benefit, for example insufficient evolvement of the leadership or a negative attitude among staff. Step 10: Calculate the net benefit and establish a person responsible for the achievement of each benefit The benefit analysis is usually presented in the form of diagrams. The net benefit is defined as gross benefit minus the cost of the benefit and the net factor is defined as the net benefit divided with the cost of the benefit. An example of this is shown in figure 9. A well done analysis is not a guaranty for success. To safe guard success one person must be responsible for the achievement of each benefit.70
3.5 The Cardio Vascular Division of Lund University Hospital Model
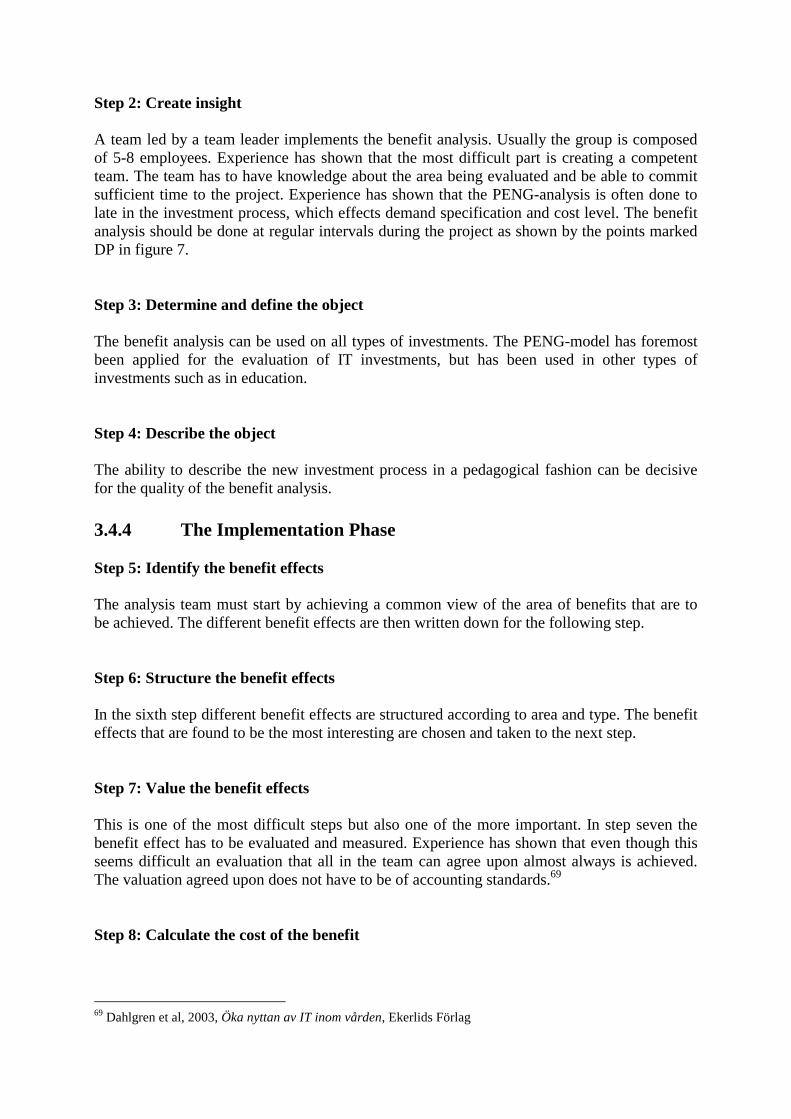
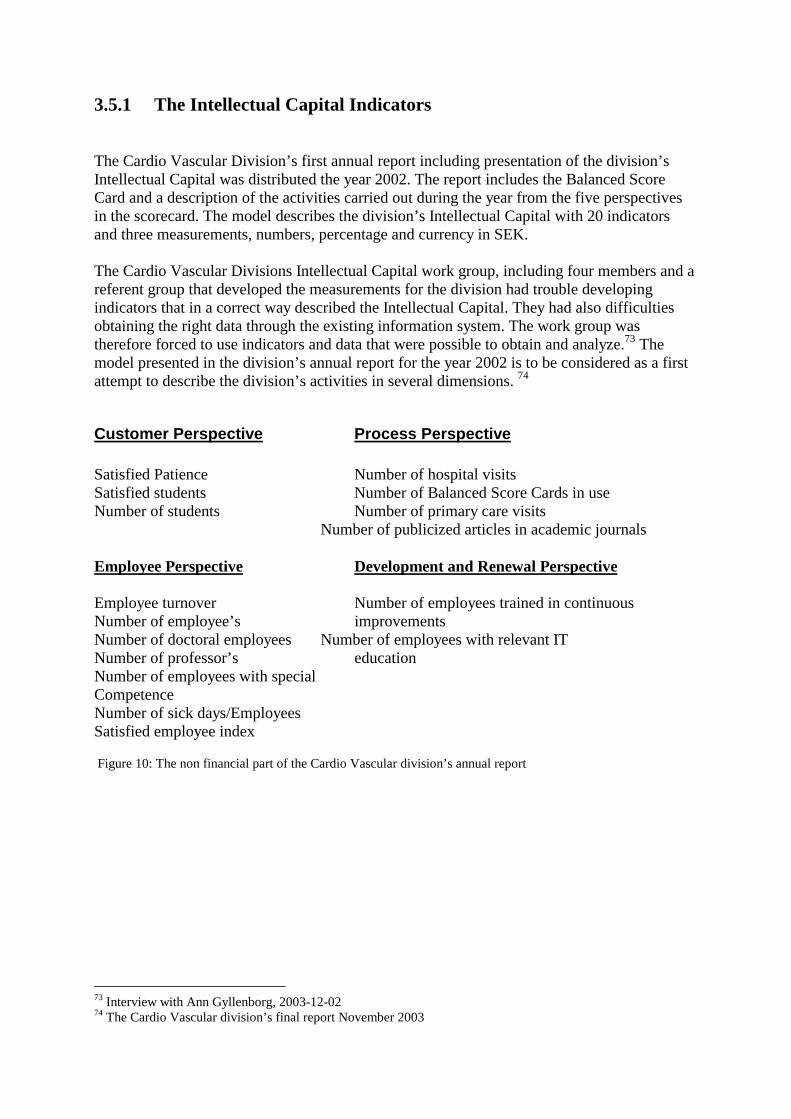
The Cardio Vascular Division of Lund University Hospital was founded in April 2000 to bring together the specialized care of patience with Cardio Vascular problems into one unit. A new matrix organization was developed where the activity areas were based on the patient disease instead of areas of medical expertise.71 Since the year 2000 the division has worked with a Balanced Score Card. The division was looking for a tool that could create guidance and direction for the new organization and a feedback system that captured both the financial and Intellectual Capital perspective. The Cardio Vascular Division is running knowledge intense and highly specialized care and was eager to find and develop methods that could make the division’s Intellectual Capital visible and presentable.72 The divisions Balanced Score Card is based on the Skandia Navigator and consists of the same five perspectives. On the top of the model is the division’s vision: Own choice - The Cardio Vascular division. This is followed by the five perspectives, the strategic goals of each perspective and the key factors for achieving success in each perspective.
70 Dahlgren et al, 2003, Öka nyttan av IT inom vården, Ekerlids Förlag 71 Interview with Ann Gyllenborg, 2003-12-02 72 The Cardio Vascular division’s Annual Report 2002
Vision
Strategic goals for each perspective
Customer Process Employee Renewal & Financial
Perspective Perspective Perspective Development Perspective Perspective
Figure 9: The Cardio Vascular Divisions Balanced Score Card
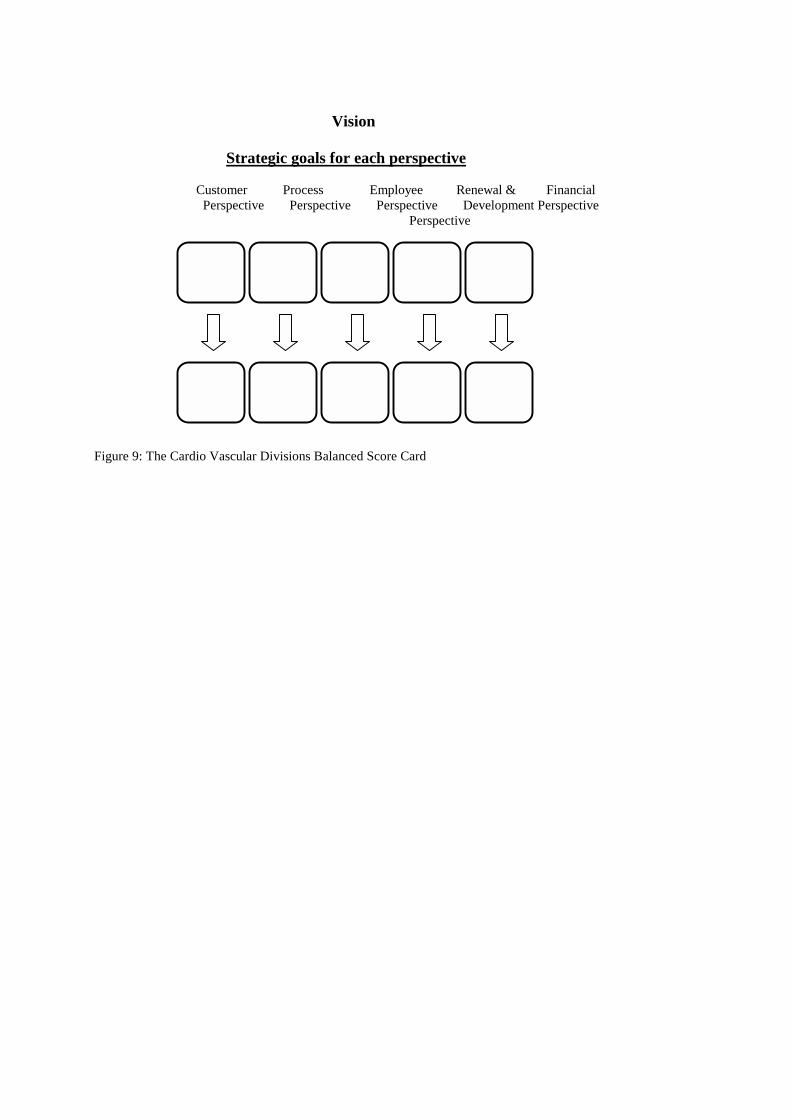
3.5.1 The Intellectual Capital Indicators The Cardio Vascular Division’s first annual report including presentation of the division’s Intellectual Capital was distributed the year 2002. The report includes the Balanced Score Card and a description of the activities carried out during the year from the five perspectives in the scorecard. The model describes the division’s Intellectual Capital with 20 indicators and three measurements, numbers, percentage and currency in SEK. The Cardio Vascular Divisions Intellectual Capital work group, including four members and a referent group that developed the measurements for the division had trouble developing indicators that in a correct way described the Intellectual Capital. They had also difficulties obtaining the right data through the existing information system. The work group was therefore forced to use indicators and data that were possible to obtain and analyze.73 The model presented in the division’s annual report for the year 2002 is to be considered as a first attempt to describe the division’s activities in several dimensions. 74
Customer Perspective Process Perspective Satisfied Patience Number of hospital visits Satisfied students Number of Balanced Score Cards in use Number of students Number of primary care visits
Number of publicized articles in academic journals Employee Perspective Development and Renewal Perspective Employee turnover Number of employees trained in continuous Number of employee’s improvements Number of doctoral employees Number of employees with relevant IT Number of professor’s education Number of employees with special Competence Number of sick days/Employees Satisfied employee index Figure 10: The non financial part of the Cardio Vascular division’s annual report
73 Interview with Ann Gyllenborg, 2003-12-02 74 The Cardio Vascular division’s final report November 2003
3.5.2 Nikis The division developed the indicators above with help from the Network for Intellectual Capital in Health Care (NIKiS).75 NIKiS was founded in the year 1998 and consists of members from the health and medical sector and members with expertise in Intellectual Capital reporting, management and development. It is an independent network for people interested in Intellectual Capital in the Swedish Health Care Sector. The network tries to find new methods and tools to capture Intellectual Capital in the sector. NIKiS consists of members from the Health Care Sector with different backgrounds and includes external Intellectual Capital expertise. Four clinics at the university hospitals in Linköping, Göteborg, Stockholm and Lund is part of the network and have since 1999 carried out studies within the area. NIKis tries to establish and create health care sector framework that makes tangible and intangible assets visible and balance their connections. With the framework as a starting point is the goal to create better conditions for the describing of the sectors knowledge intensive activities. Another goal of NIKiS is through active and outgoing work engaged the employees and managers in the health care sector that deals with Intellectual Capital to create health care that have higher quality and is more cost effective.76 NIKiS have developed 250 indicators that measure Intellectual Capital in the health care sector. The NIKiS indicators have their origins in the Skandia Navigator and if further developed by the network. The indicators cover different aspects of Intellectual Capital in the health care sector and can be used as a starting point for the reporting of intellectual capital in the sector.
75 Interview with Ann Gyllenborg, 2003-12-02 76 www.nikis.net 2003-12-02

4
- Health Care Centers- This chapter includes a description of the Swedish health care development during the last decade. A presentation of the health care in the province of Skåne follows and the chapter ends with an account of the two health care centers Kärråkra and Tåbelund.
4.1 Health Care in Change The Swedish health care underwent a period of change during the 1990’s. Due to economic crises the health care sector had to reduce its costs. After years of regular budget increases this was a major adjustment, with a reduction of the number of employees by 25 percent. During the same period the cost of medicines more then doubled adding to the strained budget. The Swedish population was getting older and the need fore health care increased. These changes led to a number of reforms. The main task of the reforms was to shift from the more expensive inpatient care to the more cost effective outpatient care. The Ädel reform was approved by the Parliament the year 1992. The responsibility of providing medical care in special homes, excluding the work done by doctors, was transferred from the County Councils77 to the Municipality. At present the majority of the Municipalities have agreements with the County Councils under which they are responsible for providing medical care in patients’ homes. Further reforms in the 1990’s changed the patients’ relation to the medical services. Legislation on the health and medical services was intensified. The health care was to provide the patients with information on health status and alternative forms of treatment. The influence of patient’s choices between alternative forms of treatment and obtaining supplementary assessments from other doctors increased. 78 In the beginning of the 1990’s, patients where referred to one specific health care center or hospital. Since the year 2000 almost all County Councils have implemented recommendations from the Federation of County Councils that give patients possibilities to seek care through out the entire country. 77 Swedish: Landsting. For definition see chapter 4.2 78 Swedish health care in the 1990s, 2002, ” Federation of Swedish County councils
The Dagmar agreement between the Government and the County Councils, introduced a care guaranty. The agreement had the intention of reducing waiting times for 12 different procedures. The patients covered by the agreement where to be offered treatment within three months. Patients that could not be offered treatment within the time frame where offered care by another care provider. A national agreement concerning primary care was implemented during the 1990´s. It stated that the primary care is responsible for the first contact with the patients and shall offer care the same day as the health care center is contacted. The patient shall within eight days be offered a doctor visit and specialists shall be offered within three months. If not possible the patient shall be offered care by another provider in another County Council without any additional costs. There are no comprehensive statistics on outpatient care. The reports on a national level only show the number of visits to different care providers. Hence an operation performed in outpatient care is reported as a normal doctor visit. The reports do not measure the content of the health care provided. The number of patients treated in primary care is estimated to be 20 million a year. There was a major increase in the number of operations in the 1990’s. People were getting older and had more medical problems. Treatment was given earlier which lead to improvement of quality of life for elderly people. The 1990’s health care was characterized by the possibility to provide improved treatment for new groups of patients.79
4.2 Health Care in the Province of Skåne The population of the Province of Skåne is getting older. Hence the need for health care is increasing. The Province of Skåne primary care is the foremost preference for the majority of the population. The primary care is growing rapidly and will be more important in the future. More than financial resources are necessary and it is essential to retain and recruit competent employees.80 Most Government run health care in Sweden is organized according to geographical location and is named County Councils. Politicians elected in local elections run each County Council. The politicians form a local parliament that decides how the County Council is run and the tax level. In the Province of Skåne a different model is used. Several County Councils have been grouped into one larger organization named Region Skåne. In Region Skåne there are different types of institutions that offer health care. Emergency health care, complicated health care and care of in-house patients are the responsibility of hospitals. More basic health care is the responsibility of health care centers. 4.2.1 Health Care Centers Health care centers are small in size and more numerous than hospitals. Region Skåne has about 28 000 employees and the primary care is organized in 110 health care centers. A health care center only takes care of outpatients. Patients in need of more care are sent to hospitals.
79 ”Swedish Health Care in the 1990s” Federation of Swedish County councils, 2002 80 www.skane.se, 2003-11-29

Most health care centers offer services such as doctors’ surgery, nurses’ surgery, rehabilitation service and pediatric care.81 Kärråkra health care center and Tåbelund health care center are located in the town of Eslöv. Kärråkra has 40 employees and Tåbelund has 30 employees. The centers are similarly organized, as described in the figure 12. The main task is treatment of patients, education of new doctors, nurses, physiotherapists and others is another important task. The health care centres have 12500 doctor visits, 5000 Physiotherapy visits and 11 000 nurse visits each year.
Figure 11: Organizational chart of the health care centers (Interview with Patrik Midlöv, 2003) The head of the centers is a doctor. The next level consists of doctors, head of medical department and physiotherapy. The doctors are organized separately even though they work in the medical department. The largest group is the medical department, which is run by a nurse. The third group is the physiotherapy department also headed by a nurse.82
81 www.skane.se, 2003-12-07 82 Interview with Patrik Midlöv, 2003-12-17
Physiotherapy Head of Medical Department
Doctors
Nurse assistants Senior Nurses Secretaries Nurses
Physiotherapists Nurse assistants
Head of Center
5
- Analysis -
This chapter includes an analysis of Intellectual Capital in health care centers. Three perspectives of Intellectual Capital and four subgroups are created. The theories described in chapter three are used as a tool for analysis and for developing an Intellectual Capital mode for health care centers.
5.1 Three Perspectives of Intellectual Capital Based on the interviews and the five theoretical models described in the theory chapter, three areas of Intellectual Capital central for health care centers are identified: education and development of employees, the work environment, and the patients’ attitudes towards the health care center. The areas are defined as Perspectives as those capture different viewpoints on Intellectual Capital in the health care centers. The perspectives have their origins in the Skandia Navigator and in the Danish Model. The perspectives are named as follows: The Education and Development Perspective, The Work Environment Perspective and The Patient Perspective. The Financial Focus, which is used in the Skandia Navigator, has been omitted in our analysis since the financial information is available in the current accounting reports.

Figure 12: Three perspectives of Intellectual Capital in health care centers (Our model) 5.1.1 The Education and Development Perspective The Swedish population is getting older and the need for professional health care will increase the next few years. The Province of Skåne primary care is the preference for the majority of the population. The primary care is growing rapidly and will be more important in the future. More than financial resources are necessary and it is essential to recruit competent employees. If the health care centers competence is improved and developed, the possibility of coping challenges in the future will increase. Education and development is important because it strengthens the health care centers competence. Since the year 2000 have patients’ the possibility to choose where to be treated. Patients are likely not to choose on location solely. Prestige and reputation will affect the choice of health care centre. In order to attract patients’ health care centers will have to invest in education and development.
The Patient Perspective
The Work Environment Perspective
The Education and Development Perspective
Intellectual Capital in health care
centers

“I consider education and training of employees a top priority” “Satisfied employees make both employees and patients happy” Ulla Wikström Ulla Wikström believes that education is one of the most important factors in motivating the employees and increasing their skills.83 Education can increase employee moral. The confidence is increased and the incentives to do better work are enhanced. Education and development can also create better conditions to launch initiatives for improvement of the health care centre. Information Technology is a tool for effective health care. Health care is a knowledge and information industry that demands investments that can be evaluated. There is an increasing need for Information Technology in the health care sector, thus an IT aspect of education and development has been included “IT can be difficult to evaluate. Investments in IT depend on many different factors, not only updating and improvement of current systems.” Patrik Midlöv IT is also an important aspect because of the increased patient mobility that will increase the demand for secure Information Technology and for common solutions between health care centers. IT implementation is important to keep up with the increasing competition with other health care centers and to stay attractive for patients, medical students and job applicants. The Education and Development Perspective has its counterpart in the Skandia Navigators Renewal and Development Focus and the Process Focus, and the knowledge resource Technologies in the Danish Model. The perspective establishes what actions are taken in the health care centre in order to be well prepared for the future. As the Renewal and Development Focus the Education and Development Perspective task is to find the untapped potential of a company’s Intangible Assets. The perspective identifies what activities the company is undertaking to organize itself for the future. The similarities with the Process Focus are the technology aspect of the perspective. The Education and Development Perspective should emphasize the importance of an accurate adopting philosophy when implementing a new technology in the health care center. It is central that the success of an implementation is measured through the outcome of the new technology, not the financials. The goal of the technology aspect of the perspective is to present how technology is used to create value in the health care center.
83 Interview with Ulla Wikström 2003-12-08

5.1.3 The Work Environment Perspective The Work Environment Perspective has similarities with the Human Focus in the Skandia Navigator, but it puts a stronger emphasis on the work environment. Satisfied employees make both employees and patients happy. Health care centers are a demanding work environment. The Work Environment Perspective capture the importance of a well functioned and structured health care centre and the importance of identifying and nurture key employees. “Limited financial resources and greater pressure from patients create a need for a work environment that best suits the employees’ needs and wants.” Ulla Wikström The number of sick days has increased in the health care sector, especially among woman. Insufficient work environment is one of the reasons. Working environment is a prioritized area, and many health care centres are working to improve the situation.84 The primary care has an increased responsibility and a greater number of patients with more sever deceases of patients to treat. The primary care has not been given the resources needed which have resulted in quality and coordination problems. Patients that demand continuous care and support are treated to a larger extend in the primary care. 85 ”Health care centers are small units with limited resources” Patrik Midgård Patrik Midgård implies that there is a lack of manpower and money and that the implementation of an Intellectual Capital reporting system must be possible with limited funding.86 Health care centers are small units with about 40 employees. As shown in figure 12 the health care centers are traditionally organized in a hierarchic way with the highly educated doctors on top and the nurse assistants at the bottom of the organization. There are a number of negative effects of the hierarchic organizations, such as lack of information flow due to distances between different employee categories. This makes it even more difficult to implement a new reporting system in the center, such as Intellectual Capital reporting. There is a risk that each employee category forms its own group and that there are less incentives to make own decisions and initiatives. In each category there are employees that have a higher influence than others. Ulla Wikström highlights the importance of identifying these. .“Key employees are employees that have greater impact on other employees. These persons have an impact on the work moral of their colleagues”. Ulla Wikström The key employees have an important role in a hierarchic organization as they can communicate between different employee categories. Their influence on other employees’ moral and work ambition is also a central aspect.
84 http://www.lf.se/ag/arbetsomraden/arbetsmiljo/arbetsmiljo.htm 85 www.av.se/publikationer/rapporter/RAP2003_11.pdf 86 Interview with Patrik Midlöv 2003-12-12

5.1.2 Patient Perspective Health care centers are challenged with a new type of patients. Patients are getting more demanding. Easy access to medical and health information improves patients’ knowledge about treatment and health care methods. This leads to patients with higher expectations, demanding more and better care. If the patients are not satisfied another health care center would be chosen. Health care centers have less knowledge advantage than before. The Patient Perspective has similarities with the Customer Focus in the Skandia navigator and the knowledge resource Customers in The Danish Model. The similarities with the Customer Focus is the consideration that a health care centers patient is getting more demanding and have higher expectations. Since the 1990´s it is stated that health care centers shall offer care the same day as the center is contacted. Patients want to receive treatment faster. The centers relationships with patients are stronger and create closer collaborations. The goal for the Patient Perspective is to find aspects that capture these new challenging relationships. The Patient Perspective focuses on the health care centre service ambition and not only on the medical treatment of the patient. The perspective includes considerations as patient waiting time and other indicators that points out how satisfied the patients are with the center.
5.2 Two Subgroups of the Perspectives For each Perspective two subgroups have been developed, entitled Challenges and Actions, and Benefits and Risks. 5.2.1 Challenges and Actions “Reports such as Intellectual Capital reports must be anchored among the employees of the health care centers, otherwise there is a risk that they are easily forgotten.” Ulla Wikström Challenges has its roots in The Danish Model. Challenges is a combination of Knowledge Narratives and Management Challenges. The subgroup identifies which knowledge resources are required and shall express the centers ambition to make improvements in the perspective. Challenges work as a navigation tool for the health care centre in each perspective. They highlight the factors in each perspective that are of higher priority and that needs to be strengthen in the health care centre. Challenges make areas of importance more visible and needs to be closely linked to the overall ambition of the health care center. The concept of Actions has its origins in The Initiatives of The Danish Model. Actions conclude what are to be done to improve the factors that are highlighted by the Challenges in each Perspective. Some Actions are to be repeated over several years and some may be short-termed.

Figure 13: Step one in the development process of the prototype framework (Our model). Based on the performed field studies the following actions and challenges have been empirically identified for each perspective.87 Education and development perspective - Challenges
• To increase the level of competence among the employees within the prioritized patient categories.
• To formulate clear short and long term goals for the health care center.
• To use the available employee competences in an efficient way.
Education and development perspective – Actions
• Create development and training days concerning external and internal education connected to the overall goals.
• Work continuously with realizing, developing and evaluating the overall goals. • Map the special competences that exist at the centers. Communicate and revise the
competences to all employees after performed training.
87 Interviews with Patrik Midlöv, Ulla Wikström, Henrik Weibull and Ann Gyllenborg.
Perspective
Challenges &
Actions
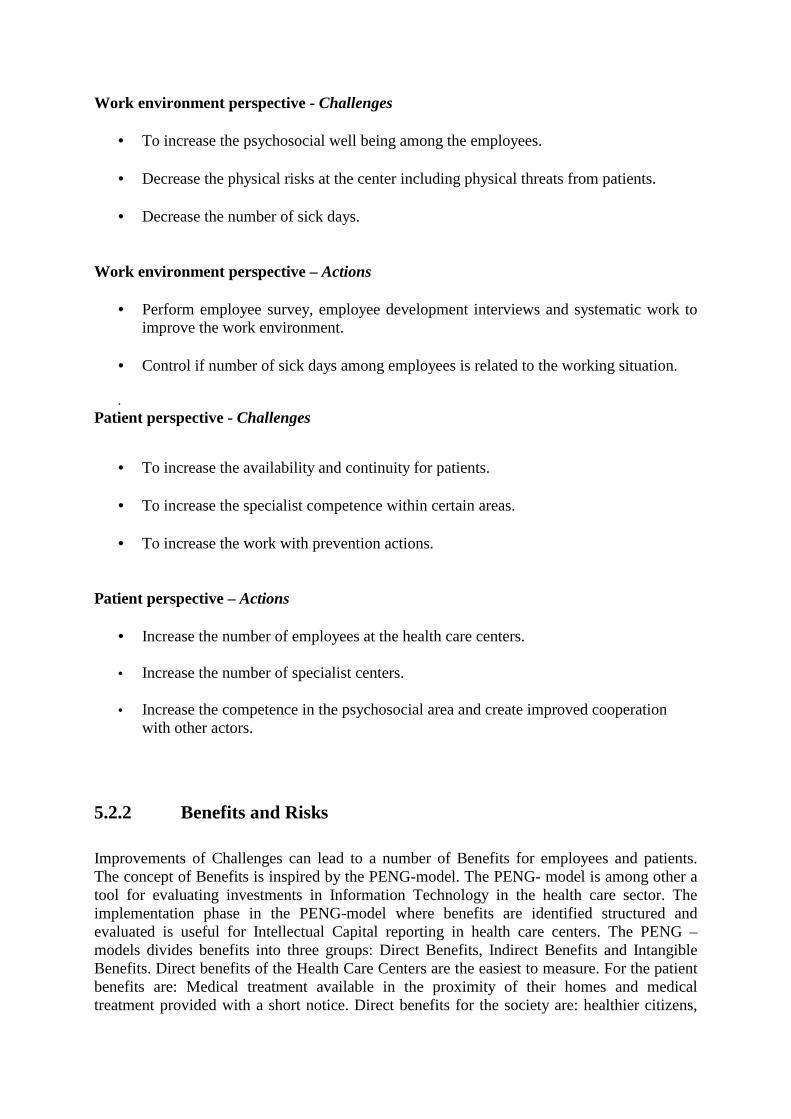
Work environment perspective - Challenges
• To increase the psychosocial well being among the employees.
• Decrease the physical risks at the center including physical threats from patients.
• Decrease the number of sick days.
Work environment perspective – Actions
• Perform employee survey, employee development interviews and systematic work to
improve the work environment. • Control if number of sick days among employees is related to the working situation. .
Patient perspective - Challenges
• To increase the availability and continuity for patients.
• To increase the specialist competence within certain areas.
• To increase the work with prevention actions. Patient perspective – Actions
• Increase the number of employees at the health care centers.
• Increase the number of specialist centers.
• Increase the competence in the psychosocial area and create improved cooperation with other actors.
5.2.2 Benefits and Risks
Improvements of Challenges can lead to a number of Benefits for employees and patients. The concept of Benefits is inspired by the PENG-model. The PENG- model is among other a tool for evaluating investments in Information Technology in the health care sector. The implementation phase in the PENG-model where benefits are identified structured and evaluated is useful for Intellectual Capital reporting in health care centers. The PENG – models divides benefits into three groups: Direct Benefits, Indirect Benefits and Intangible Benefits. Direct benefits of the Health Care Centers are the easiest to measure. For the patient benefits are: Medical treatment available in the proximity of their homes and medical treatment provided with a short notice. Direct benefits for the society are: healthier citizens,
less sick days and control over the spread of medical diseases. Indirect benefits for the patients are: less problems resulting to sickness due to receive medical treatment, effective treatment and treatment provided in an efficient way. For the society the Indirect benefits are: less costs for sick leave, increased productivity due to sick people been treated and cured and less risk of the spread diseases. Intangible benefits for the patients are: feeling of security due to the fact that one can receive the medical care needed and satisfaction that money paid for medical care gives a result. For the society the benefits are: Increased will to pay taxes and increased trust in the government.
Based on the qualitative study the following Benefits and Risks for the perspectives are identified.88
The Education and Development Perspective – Benefits and Risks
• Saving of resources if all employees are striving towards the same goals.
• Performing the actions needed is time consuming.
• Risk of collision between the overall goals and the goals of the individual employee.
The Work Environment Perspective – Benefits and Risks
• There are several benefits to be gained, but the actions needed are time consuming and resource demanding.
Patient Perspective - Benefits and Risks
• It is of importance that the availability is good, especially for the prioritized groups, because the increased work demands more resources.
The health care center must achieve a common view of the benefits that improvement in the Challenges can result in. The different benefits are then structured according to Perspective. The Benefits has to be evaluated in a way that the employees of the health care center can agree upon.
“It is very important that the employees understand what use they have of the Intellectual Capital measurement system. Otherwise it will not be used.”
Ann Gyllenborg
88 Interviews with Henrik Weibull, Patrik Midlöv, Ulla Wikström and Ann Gyllenborg
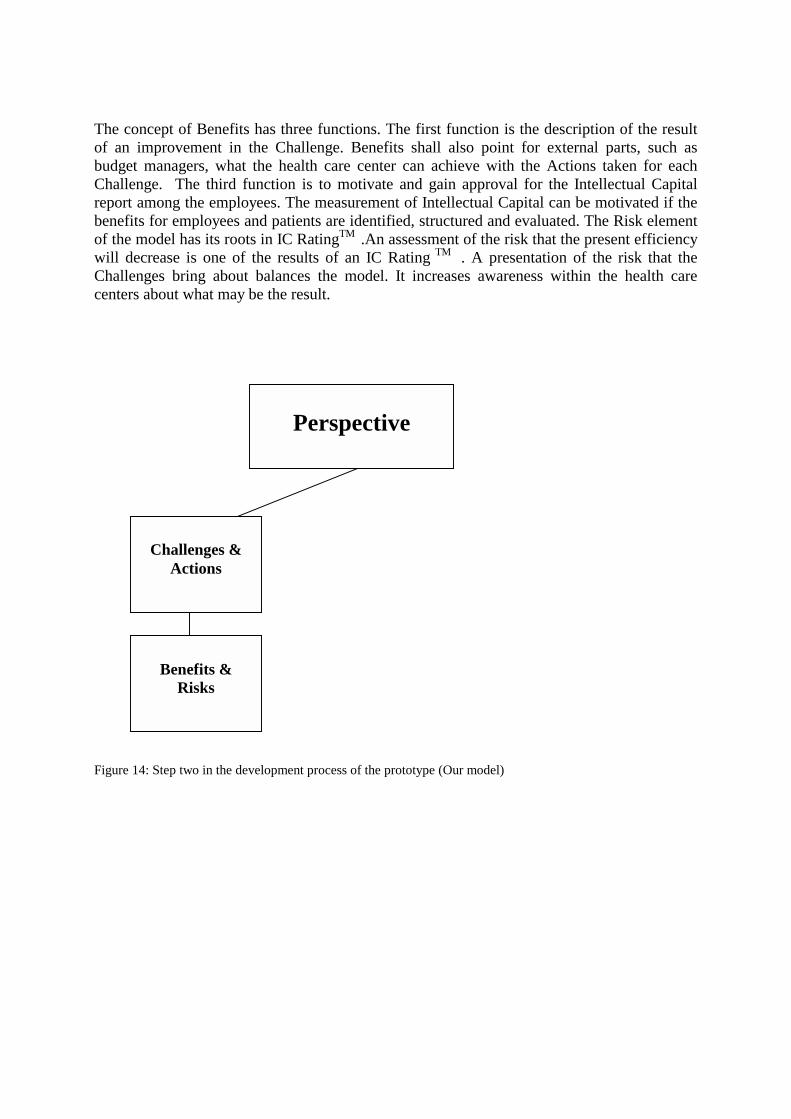
The concept of Benefits has three functions. The first function is the description of the result of an improvement in the Challenge. Benefits shall also point for external parts, such as budget managers, what the health care center can achieve with the Actions taken for each Challenge. The third function is to motivate and gain approval for the Intellectual Capital report among the employees. The measurement of Intellectual Capital can be motivated if the benefits for employees and patients are identified, structured and evaluated. The Risk element of the model has its roots in IC RatingTM .An assessment of the risk that the present efficiency will decrease is one of the results of an IC Rating TM . A presentation of the risk that the Challenges bring about balances the model. It increases awareness within the health care centers about what may be the result.
Figure 14: Step two in the development process of the prototype (Our model)
Perspective
Challenges &
Actions
Benefits &
Risks

5.3 Indicators Indicators have been developed for measuring and reporting Intellectual Capital in each of the chosen perspectives. The data needed is relatively easy to obtain. The Intellectual Capital report should be easy to create, read and understand. Patrik Midgård argues that an Intellectual Capital report that is too complicated will not be updated.89 “Simplicity is of great importance for the Intellectual Capital report” Patrik Midgård The indicators show how the health care centre is performing within each Challenge. The Indicators have two different roles. Apart from being an evaluation tool for the health care center employees, they are an external report for patients and others. The indicators are developed with help from the Skandia Navigator, the indicators developed by NIKiS and the indicators used in The Cardio Vascular Model. The selection of indicators was made based on NIKiS and the Skandia Navigator in cooperation with Ulla Wikström and Patrik Midlöv. Through e- mail contact and during the interviews adequate indicators were confirmed and irrelevant indicators were rejected. The financial indicators initially chosen by us, for example, were rejected in collaboration with the doctors. Their opinion is that the financial aspects of the Health Care Center are measured in a better way in other types of reports. We believe that it might have been preferable to test the indicators selected on other Health Care Centers. The fact that the two doctors are well experienced, though, with great knowledge in the health care sector makes the indicators relevant. The indicators are created in order to be simple and easily available to the employees, since that is one of the most important factors, according to respondents. Ann Gyllenborg, as well as Ulla Wikström and Patrik Midlöv, expresses that too many non- financial questionnaires are being made, with ambiguous purposes and vague evaluations. The indicators chosen are deliberately made general to suit the Health Care Centers’ consisting data- no new data should be needed. Ann Gyllenborg believes that the measurement made in the Cardio Vascular Division, Lund University, is incomplete since data needed for the research was sometimes difficult to obtain. The Indicators for each Perspective are divided into three types: Efficiency, Renewal and Risk Indicators. The categorization is inspired from IC Rating and establishes the health care centers position in relation to each type. The efficiency and renewal indicators points out measurements that is central for the Health Care Centers to perform well in. High figures in the two types are to be considered a condition to be an effective and prepared center for future challenges, for example the indicator the measure how much time the doctor is spending with each patient. The indicators that are categories as risk indicators cover areas that the centers need to treat carefully and that can create future problems if not dealt with. For example indicators that points out the employee turnover or the relation between total number of training hours and total number of work hours can be used to create awareness in the center about an unsatisfying development within the two areas.
89 Interview with Patrik Midlöv, 2003-12-12

Figure 15: The Intellectual Capital reporting prototype (Our model)
5.3.1 Indicators for the Education and Development Perspective Indicators for the Education and Development Perspective report and measure how well the health care center is doing in educating and developing its employees. This is of great importance as education and development of employees is considered central. The following indicators are the Efficiency indicators for the perspective. The indicators can also be used as a figure for annual comparison of how education is prioritized. The indicators report a central part of how well the health care center’s management takes care of its employees. It visualizes managers’ attempts to develop and get to know the employees. The indicators that put focus on the technological aspect of the perspective are reporting and measuring the Information Technology development at the health care centre. They report the updating and renewal of the IT- equipment, and if the employees knowledge about IT is consistent with the present technology at the health care centre.
• Number of employees that have had personal evaluation meetings • Level of IT competence among employees
• Educational expense/Employee
The following indicators show the renewal indicators for the perspective. Health care centers are knowledge intensive industries. The indicators below points out how much expenses and time the center is spending on education in total and per employee category. It can be more valuable to report and measure how much time is being spent on education rather than the
Perspective
Challenges &
Actions
Benefits &
Risks
Indicators
total expenses for education, as educational cost may vary from year to year. It is also of interest to point out and measure how much education time is being spent on each employee category to find out how educational time is divided.
• Number of educational trainee posts for doctors, nurses and other medical Care staff • Time in education (days per year)/Category (doctor, nurse, other Health Care staff)
• Educational expense/Total expense
• Updating and development cost for IT
The following indicators are the risk indicators for the Education and Development perspective. The indicator shown below measure and report how well prepared the organization is for future educational challenges. The educational expense/administrative expense indicator shows if education expenses are in proportion to the administrative costs
• Educational expense/Administrative expense
• Total number of training hours/ Total number of work hours
5.3.2 Indicators for the Work Environment Perspective The indicators beneath are the efficiency indicators for the Work Environment Perspective. The indicators show the experience level of the employees, and can be used as indicators of how well prepared the centre is for new and more demanding work tasks. The index for satisfied employees is highly important though it is a tool for comparing the satisfaction among employees from one year to another.
• Average time of employment • Index for satisfied employees
• Number of years in the profession per employee
The following indicators are defined as the renewal indicators for the perspective. The following indicators report and measure how attractive the health care centre is for current and potential employees. It also includes the basic indicator for reporting the number of employees at the health care centre
• Number of applicants per job opportunity
• Expected future need for different employee categories • Total number of employees
• Number of employees per category (doctor, nurse, other Health Care staff) The following are the risk indicators. They report the general well being of the employees of health care centre and measure the centers level of satisfying work environment among employees and attraction among professionals. There are defined as risk indicators as high figures in for example employee turnover and total number days absence due to illness may act as an awareness signal for the center and point out the limitations of the current work environment.
• Average age of employees • Employee turnover • Number of days absence due to illness per employee
• Total number days absence due to illness
• Over time per employee
5.3.3 Indicators for the Patient Perspective The indicators developed for the Patient Perspective reflect the changing health care centre work force. Patients are getting better educated and have higher demands on health care centers and treatment. The Perspectives efficiency indicators are shown below. The indicators can foremost be used for annual comparison. They report if the health care centre is treating a greater number of patients from one year to another. They also indicate what resources expected to be needed the next year to come.
• Average time that doctors spends with each patient • Patients per employee
The renewal indicators for the perspective are shown below. The patient satisfaction index shows how the health care centre is handling new expectations from patients from year to year. It can also be used to create awareness in the health care center about changing patients’ opinions and attitudes towards the health care centre. Queue time is defined as the time from patients’ first contact with health care center to the doctor visit.
• Percentage of work time that the reception is used
• Average queue time per patient
• Patient satisfaction index
The risk indicators shown below report and measure how well the health care centre is coping with the increased number of patients that visit health care centers. They also show if patients’ time with doctors is effected by the increasing demand. The indicators can be used to show how much doctoral work time is being spent on patients and the actual relation between employees and patients. They point out an important aspect of the patients view on the health care centre. Patient time is the actual time that the doctor spends with each patient.
• Number of patients/year • Time spent at the center / Patient
• Number of patients sent to special care

6
- Conclusions - This last chapter contains the conclusions of the thesis. The questions formulated in chapter one are answered. A discussion about the prototype framework is performed and suggestions for future research are given. The purpose of this thesis was to develop a prototype framework for Intellectual Capital reporting in health care centers. Intellectual Capital is an essential resource for health care centers, but measuring and reporting of intellectual capital in health care is an unexplored area. Hence, it is a challenge to decide what to report and how to report it. The following questions were put forward in the problem formulation:
• What aspects of Intellectual Capital in health care centers are relevant to report? Three relevant aspects of Intellectual Capital reporting in health care centers were identified. The aspects were named Perspectives as they captured different important viewpoints of Intellectual Capital in health care centers. The Perspectives were developed based on primary and secondary data, consisting of interviews and theoretical models. The Perspectives were named The Education and Development Perspective, The Work Environment Perspective, and The Patient Perspective. The Education and Development Perspective emphasizes the importance of employee education. It is central as it strengthens the health care centers competence and increases the employee moral. It is also important because of the patients’ right to choose where to be treated geographically, which will lead to increased mobility. Investments in education and development are necessary if a health care center is to be considered attractive. The Work Environment Perspective captures the importance of a well functioning and structured health care centre and the importance of identifying and taking care of key employees. Limited financial resources and greater pressure from patients creates a need for a work environment that better suits the employees. The Patient Perspective focuses on the health care centers service ambition, not only on the medical treatment of the patient, but the total impression the patient gets from the centre. The

Swedish population is getting older; the number of patients that visits health care centers will increase the following years. Health care centers patients are getting more demanding due to easy access to medical and health information. This creates patients with higher expectations who want more and better care. The second question was:
• How can anchoring and performance of an Intellectual Capital reporting in health care centers be facilitated?
Two subgroups to the Perspectives have been developed and named Challenges and Actions, and Benefits and Risks. The two subgroups have different functions in facilitating the anchoring and performance of the Intellectual Capital reporting. Challenges highlight what parts of each Perspective that are prioritized and need to be improved in the health care centre. Challenges work as a guiding tool and make areas of importance in the Perspectives more visible. They shall also express the centers ambition to improve important part of the Perspectives. Actions conclude what is to be done to improve the factors highlighted by the Challenges in each Perspective. The Actions are concrete steps needed for improvement of the Challenges. Some Actions may be performed continuously and some may be performed on single occasions. The second subgroup to the Perspectives, Benefits and Risks, shall describe the result of an improvement in a Challenge and the risks connected. Stating of Benefits anchors the Intellectual Capital reporting in the health care center. Benefits shall also point for external parts, such as budget managers, what the health care center can achieve with the Actions taken for each Challenge. Challenges and Actions and Benefits and Risks are to be formulated on an annual basis by the employees and the managers of the health care centers. It is central that an understanding and consensus of the content of the two subgroups is reached. Otherwise there is a risk that the reporting of Intellectual Capital is not prioritized. The subgroup is to work as a motivating and approval tool for the reporting among employees in the center. The main task of the two subgroups is to facilitate the measurement and reporting of Intellectual Capital. The third question formulated was:
• In what way are the difference aspects of Intellectual Capital best measured? The central aspects of Intellectual Capital are best measured through Indicators especially developed for each Perspective. The data needed should be relatively easy to obtain. The Indicators show how the health care centre is performing within each Challenge. The two functions of the Indicators are: An evaluation tool for the health care center employees and an external report for patients and others. The Indicators for the Education and Development Perspective report and measure how the health care center is doing in educating and developing its employees and can be used for annual comparison of how education is prioritized. The indicators that show educational expenses are of great importance as education and development of employees is considered central. The indicators that put focus on the

technological aspect of the perspective are reporting and measuring the Information Technology development at the health care centre The Indicators developed for the Work Environment Perspective put focus on the well being of the employees. Indicators report the number of employees at the health care centre and show the experience level of the employees. The Indicators can be used for examining how well prepared the centre is for new and more demanding work tasks. The Indicators developed for the Patient Perspective measure and report how the health care center is dealing with the more demanding patients of today. Patients are getting better educated and have higher expectations on their treatment. The indicators show how well the health care centre is coping with the increased number of patients that visits health care centers and if patients’ time with doctors is affected. A patient satisfaction index can point out how the health care centre is handling new demands from patients. A conclusion of this thesis is that if Intellectual Capital reporting is to be implemented in a health care center it has to be put in a greater context. The necessity of the reporting and its results needs to be clarified and understood among employees and managers. The report must be anchored in the centers to be implemented and performed. Otherwise there is a risk that the report is seen as just another health care inquiry without a clear purpose. We believe that the Intellectual Capital report has to be combined with a guiding or navigation tool, for example a Balanced Score Card. This is a way of anchoring the reporting system among employees in the center and to clarify why the reporting is necessary. It is obvious that Intellectual Capital reporting in health care centers needs to be easy to perform. The gathering of data has to be possible even with limited resources. The report must be seen as a tool for improvement and development, not a time consuming obstacle that puts pressure on an already constrained budget. Measuring and reporting of Intellectual Capital in the health care sector can be a method to give a more nuanced picture of a financial situation. It can point out what activities are performed at the centers to improve weaknesses and patient benefits. A prototype framework of the Intellectual Capital report can be seen below.

The Education and Development Perspective Challenges
Actions
Benefits and Risks Direct Indirect Intangible
Indicators Efficiency Indicator/Year 2003 2004 2005 Educational expense/ Employee
Number of employees that have had personal evaluation meetings
Level of IT competence among employees
Renewal Indicator/Year 2003 2004 2005 Time in education (days per year)/ Employee category
Number of trainee posts / Employee category
Educational Expense/Total Expense
Updating and development cost for IT
Risk Indicator/Year 2003 2004 2005 Education expense/Administrative expense
Total number of training hours/Total number of work hours
1. 2. 3.
A. B. C.
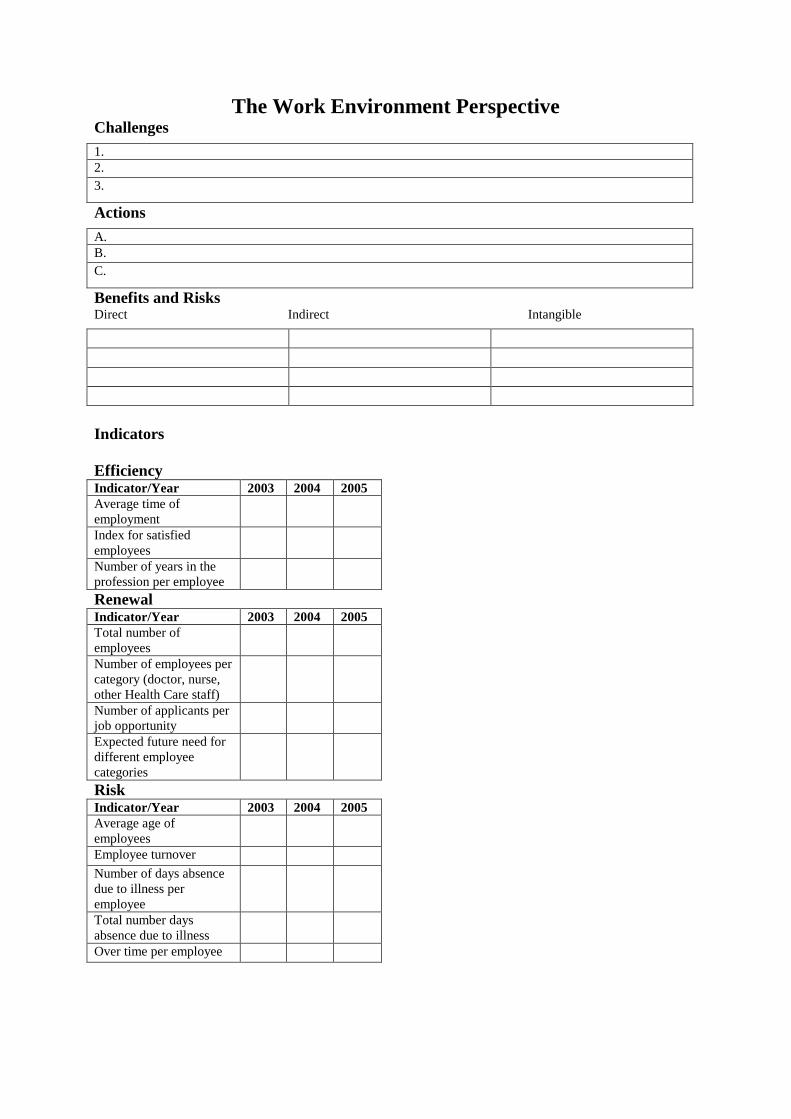
The Work Environment Perspective Challenges
Actions
Benefits and Risks Direct Indirect Intangible
Indicators Efficiency Indicator/Year 2003 2004 2005 Average time of employment
Index for satisfied employees
Number of years in the profession per employee
Renewal Indicator/Year 2003 2004 2005 Total number of employees
Number of employees per category (doctor, nurse, other Health Care staff)
Number of applicants per job opportunity
Expected future need for different employee categories
Risk Indicator/Year 2003 2004 2005 Average age of employees
Employee turnover Number of days absence due to illness per employee
Total number days absence due to illness
Over time per employee
1. 2. 3.
A. B. C.

The Patient Perspective Challenges
Actions
Benefits and Risks Direct Indirect Intangible
Indicators Efficiency Indicator/Year 2003 2004 2005 Average time that doctors spends with each patient
Patients per employee Renewal Indicator/Year 2003 2004 2005 Percentage of work time that the reception is used
Average queue time per patient
Patient satisfaction index Risk Indicator/Year 2003 2004 2005 Number of patients/year Number of patients sent to special care
Time spent at the center/Patient
1. 2. 3.
A. B. C.

6.1 Future Research One first suggestion of future research would be to actually measure the Intellectual Capital indicators that this thesis has found to be of interest in health care centers. We ourselves could not do this due to the limited time available for this study. A comparison between the two health care centers would be an interesting first step. Followed up by a quantities study of health care centers using our Intellectual Capital indicators. Furthermore it would be interesting to apply the findings of our thesis on other health care services such as hospitals.

-
References Printed Sources Alvesson, M & Sköldberg, K, 1994, Tolkning och reflektion - vetenskapsfilosofi och kvalitativ metod, Studentlitteratur Bontis, N, 1998, Intellectual Capital: an exploratory study that develops measures and models, Management Decision, vol 36, issue 2 Dahlgren et al, 2003, Öka nyttan av IT inom vården, Ekerlids Förlag Dahlgren et al, 1997, Make IT Profitable, Ekerlids Förlag Edvinsson, L, 2002, Navigating the Knowledge Economy, Bookhouse Publishing Edvinsson, L & Malone, M S, 1997, Intellectual Capital: the proven way to establish your company’s real value by measuring its hidden brainpower, Harper Business Eriksson, L-T, & Wiedersheim-Paul, F, 2001, Att utreda, forska och rapportera, Liber ekonomi, sjunde upplagan. Guthrie, J, 2001, the management, measurement and the reporting of Intellectual Capital, Journal of Intellectual Capital, vol. 2, issue 1 Halvorsen, K, 1992, Samhällsvetenskaplig metod, Studentlitteratur Holme, I M & Solvang, B K, 1997, ”Forskningsmetodik – om kvalitativa och kvantitativa metoder”, Studentlitteratur Patel, R, Davidsson, B, 1994, Forskningsmetodikens grunder – Att planera, genomföra och rapportera en undersökning”, Studentlitteratur Patton, M, 1990, Qualitative Evaluation and Research Methods, London: Sage

Ordóñez de Pablo, P, 2003, Intellectual Capital in Spain: a comparative view, Journal of Intellectual Capital, vol 4, issue 1 Ordóñez de Pablo, P, 2002, Evidence of Intellectual Capital measurement from Asia, Europe and the Middle East, Journal of Intellectual Capital, vol 3, issue 3 Stewart, T, 1997, Intellectual Capital: the new wealth of organizations, Doubleday/Currency Cop 2002, Swedish Health Care in the 1990s, Federation of Swedish County Councils Teece, D J, 2002, Managing Intellectual Capital, Oxford University Press. 2002, The Cardio Vascular division’s Annual Report, The Cardio Vascular division Lund University Hospital Zhou, A Z & Fink, D, 2003, The Intellectual Capital web: a systematic linking of Intellectual Capital and knowledge management, Journal of Intellectual Capital, vol 4, issue 1 Wiederheim-Paul F & Eriksson L T, 1997, Att utreda forska och rapportera, Liber Ekonomi Electronic Media http://www3.bus.osaka-cu.ac.jp/apira98/archives/pdfs/25.pdf, 2003-11-18 Intellectual Capital Sweden AB www.IntellectualCapital.se, 2004-01-06 Network for Intellectual Capital in the health care sector www.nikis.net, 2003-12-02 Region Skåne, www.skane.se, 2003-12-03 Danish Ministry of Technology & Science, http://www.videnskabsministeriet.dk/cgi-bin/doc-show.cgi?doc_id=138091&leftmenu=PUBLIKATIONER, 2003-11-28 Interviews Ann Gyllenborg, Cardio Vascular division of Lund University Hospital Ulla Wikström, doctor and head of Kärråkra Health Care center Patrik Midlöv, doctor and head of Tåbelund Health Care center Henrik Weibull, doctor at Region Skåne

Appendix 1 Questionnaire for the Health Care Center
1. Do you feel that your current accounting report and other reports give an adequate picture of your health care center?
2. What are your most important resources?
3. How is the health care center organized?
4. What are the health care centers areas of medical responsibility?
5. How is your performance as head of the health care center monitor by your superiors?
6. Do you feel that Intellectual Capital is important for a health care center?
7. What improvements to your current reporting systems would you like to see?
8. Which are the most relevant indicators to measure regarding Intellectual Capital in a
health care center?
9. What different categories of employees do you have?
10. Do you give your employees any regular education?
11. Which are the greatest problems and challenges facing the health care centers?
12. Do you have any difficulties recruiting staff?

Appendix 2 Questionnaire for the Cardio Vascular Division
1. Why did the Division implement an Intellectual Capital reporting system?
2. Who took the initiative to the IC reporting system?
3. What are the important elements of your IC reporting system?
4. Which different theories is the Divisions´ IC reporting model based on?
5. How was the IC reporting system implemented?
6. Which where the most difficult parts of the implementation process?
7. Was their any opposition among employees to the IC reporting system?
8. What was your role in the implementation process?
9. What has the Division gained from the IC reporting system?
10. Do you feel that it was worth going through the process of starting an IC reporting system?
11. What computer programs did the Division use in the implementation process?
12. How has the IC reporting system been received in the hospital?
13. How where the interest from the subordinates for the IC reporting system?