intelligent pixels of interest selection with application
TRANSCRIPT
HAL Id: hal-00804171https://hal.inria.fr/hal-00804171
Submitted on 29 Sep 2018
HAL is a multi-disciplinary open accessarchive for the deposit and dissemination of sci-entific research documents, whether they are pub-lished or not. The documents may come fromteaching and research institutions in France orabroad, or from public or private research centers.
L’archive ouverte pluridisciplinaire HAL, estdestinée au dépôt et à la diffusion de documentsscientifiques de niveau recherche, publiés ou non,émanant des établissements d’enseignement et derecherche français ou étrangers, des laboratoirespublics ou privés.
Intelligent pixels of interest selection with application tofacial expression recognition using multilayer perceptron
Taner Danisman, Ioan Marius Bilasco, Jean Martinet, Chaabane Djeraba
To cite this version:Taner Danisman, Ioan Marius Bilasco, Jean Martinet, Chaabane Djeraba. Intelligent pixels of in-terest selection with application to facial expression recognition using multilayer perceptron. SignalProcessing, Elsevier, 2013, Special issue on Machine Learning in Intelligent Image Processing, 93 (6),pp.1547-1556. �10.1016/j.sigpro.2012.08.007�. �hal-00804171�
Intelligent Pixels of Interest Selection with Application
to Facial Expression Recognition using Multilayer
Perceptron
Taner Danisman1,∗, Ioan Marius Bilasco, Jean Martinet, Chabane Djeraba
Lille University of Science and Technology, CNRS UMR 8022, Parc Scientifique de laHaute Borne, 50 Avenue Halley, 59655 Villeneuve D’Ascq - France
Abstract
This paper presents an automatic way to discover pixels in a face image thatimproves the facial expression recognition results. Main contribution of ourstudy is to provide a practical method to improve classification performanceof classifiers by selecting best pixels of interest. Our method exhaustivelysearches for the best and worst feature window position from a set of faceimages among all possible combinations using MLP. Then, it creates a non-rectangular emotion mask for feature selection in supervised facial expressionrecognition problem. It eliminates irrelevant data and improves the classifica-tion performance using backward feature elimination. Experimental studieson GENKI, JAFFE and FERET databases showed that the proposed systemimproves the classification results by selecting the best pixels of interest.
Keywords: Facial expression recognition, multi layer perceptron, featureselection.
∗Corresponding authorEmail addresses: [email protected] (Taner Danisman),
[email protected] (Ioan Marius Bilasco), [email protected](Jean Martinet), [email protected] (Chabane Djeraba)
1Present address: University of Angers, LISA Laboratory, 62 Avenue Notre Dame duLac, 49000 Angers - France.
Preprint submitted to Signal Processing September 29, 2018
1. Introduction
Facial expression recognition (FER) is a hot research topic and a challeng-ing problem on different domains including face recognition, human computerinteraction, facial animation as well as social interaction. In the last decade,researchers from various disciplines focused on efficient, accurate and fastrecognition of facial expressions. Emotions can be detected from physicalsensors, image and video. Each sensor type has its own challenges such asnoisy signals, high dimensionality and quality of selected features. Thereare many automatic FER studies achieving high accuracy on well-defineddatasets. However, these studies still perform poor results under real worldsituations. Therefore there is still a considerable accuracy gap for realis-tic classification scenarios. One solution for this problem is to improve theclassification results in terms of objective measures. Among others, featureselection is an important step towards better classifiers. Feature selectionand reduction strategies are used to select relevant features to create robustmodels. In this scope, majority of the previous studies on FER consideredthe face and facial features as a combination of coarse rectangular units [1, 2].These units are used to locate or extract valuable facial feature information.Although its implementation simplicity, it includes useless and noisy data forthe machine learning step. Therefore there is a need to find local pixel ofinterests (POI) to be used in FER. Group of POI provide non-rectangularmasks that can be used to improve the classification performance.
Selection of the best variable and feature become the focus in classificationresearch where there are thousands of different possibilities. Feature selec-tion is the technique for selecting a subset of relevant features from originaldata to reduce feature size while maximizing the classifier output. Wrapperand filter based feature selection are the most common two approaches in thefield. Wrappers evaluates the importance of specific features considering aparticular learning algorithm [3] whereas filter based methods reduce the fea-tures space using a specific filter. Regardless of the fact that computationalcomplexity of wrapper based methods put aside, the facial area used in FERis a small region that can be represented by regions as small as 20 × 20 to50× 50 pixels for vision based algorithms.
In this study, we used an analytic approach that performs wrapper basedfeature selection by exhaustive searching of all possible set of feature win-dows to find informative pixels to improve the results of FER. For a givenemotion class, we created corresponding emotion mask to improve the Multi-
2

layer Perceptron (MLP) model’s performance. Our experiments on differentdatasets showed that proposed method gives better results than full frameand the best traditional feature window based classification.
The rest of this paper is organized as follows. In Section 2, we brieflyoverview related works. Database material, mask generation and its applica-tion to FER is described in Section 3. Experimental results and discussionare presented in Section 4, followed by the conclusion.
2. Related Works
Considering either analytic or holistic classification problem, there is aneed to eliminate redundant and noisy information. Analytic approaches arewidely use in face recognition domain and they are based on the detectionof specific facial features such as eyes, eyebrows, nose, mouth and the lo-cations of facial fiducial points such as corner positions of eye, mouth andtheir geometric relationships. Here a system is solved by considering its sub-parts and how they work together to produce particular results. For thisreason, researchers use high level features of the face such as position of eyes,eyebrow, noise and mouth corners [4]. Among others, Nonnegative MatrixFactorization (NMF) is a popular dimension-reduction method that approx-imates a nonnegative matrix by the product of two other low-rank matrices.NMF distinguishes from others by its use of the non-negativity property. Incontrast to holictic methods, NMF is able to learn parts of image. LocalBinary Patterns (LBP)[5] is another analytic method used in texture classifi-cation and face recognition [6] which summarizes local structure of an image.LBP is a powerful gray-scale invariant texture feature providing more dis-criminative and invariant features for the recognition phase. Here the inputface is divided into non-overlapping regions to compute an enhanced featurehistogram.
Holistic approaches consider the encoding of the entire facial image into apoint on a high dimensional space. In holistic methods, the problem can notbe solved by its subcomponents. Instead, the problem as a whole involves thesolution. In the literature, Principal Component Analysis (PCA)[7], LinearDiscriminant Analysis LDA [8] and Independent Component Analysis (ICA)[9] are common holistic methods extensively used for finding more informativefeatures which reduce the dimensionality of original data by rejecting lowvariance features. For example PCA reduces the dimensionality by assumingthat variance implies the importance and finds the reduced set of features
3

that mimics the original data. However, ability to reduce original data is notappropriate for all problem scenarios. For the supervised FER problem weneed local representative areas and pixels in a face image that can be usedfor the recognition.
[10] proposed an efficient online NMF variant called OR-NMF that canbe applied to large-scale datasets. Slow convergence problem is adressedby use of NeNMF [11] and MD-NMF [12]. [13] analysed the relationshipbetween the input space and feature space using discriminant analysis andprovided an input variable selection method. They selected variables thatcontain large amount of discriminative information and less discriminativeinformation is discarded. [14] used LBP to obtain more complete descriptionof the face using shifted and scaled sub-windows over the face images. [15]propose a pattern recognition method and its application to face recognitionproblem. In their method, extracted features are analyzed in the originalspace using feature feedback and then they identify the important segmentsof the original data that affects the classification performance. [16] presenta holistic method to analyze facial expressions by focusing on the regionssuch as eyes, mouth etc. whose geometries are mostly affected by variationin facial expressions. They used PCA to recognize different parts of the face.
FER algorithms can be classified as feature-based and appearance-basedmethods. Feature based methods first detects facial feature points then clas-sification is performed by considering geometric information. Appearance-based methods generally use the texture information for the classification.Hybrid methods like image ratio features [17] combine both the local textureinformation and the geometric information. [18] studied geometry and gabor-wavelet based FER using MLP and observed that gabor coefficients are morepowerful than geometric positions.[19] proposed an efficient local appearancefeature extraction method based on Steerable Pyramid(S-P) wavelet trans-form for face recognition problem.
In a recent study, [20] showed that FER is an analytic rather than holisticprocess. They used an elliptical mask to remove useless background pixelsfrom the face image as a preprocessing step before their classification method.This type of masks eliminates the appearance of the hair and neck fromthe face image as seen on Figure 1. However, there exists many other non-informative skin pixels on this masked image which behaves like a noisy pixelin future processing steps. Therefore additional masks or methods are neededto eliminate these pixels during the preprocessing step. Figure 2 shows dif-ferent masks generated by using different feature selection algorithms for
4

smiling and non-smiling classification.
Figure 1: Elliptical mask for faces from JAFFE dataset [34]
(A) (B) (F)(E)(D)(C)
Figure 2: Different feature subsets created using the GENKI dataset for smiling and non-smiling classification. Left to right: (A) Correlation-based Feature Subset Selection. (B)Filtered Las Vegas algorithm. (C) Gain ratio attribute evaluator (200 attributes) usingrandom subsamples. (D) Gain ratio attribute evaluator (100 attributes) using randomsubsamples. (E) OneR classifier based attribute selector. (F) The mask created by ourmethod.
Correlation-based Feature Subset Selection (CFS) shown on Figure 2(A)uses a search algorithm along with a function to evaluate the merit of thefeature subsets [21]. In this method usefulness of individual features dependson the level of inter-correlation among them. Low correlation with the classshows an irrelevant features for the selection. Filtered Las Vegas algorithmshown on Figure 2(B), make probabilistic choices to guide to a correct so-lution [22]. It uses the randomness property in the search process to find aguaranteed correct solution. This behavior is similar to the random pivot se-lection in Quicksort algorithm. Attribute evaluators seen on Figure 2 (C) and(D) produces similar results using random subsample of the datasets whichevaluates the worth of an attribute by measuring the information gain withrespect to the class. OneR classifier based feature selection shown on Figure2(E) evaluates the worth of an attribute by using the OneR classifier [23].The classifier selects one-by-one attributes from a dataset and generates adifferent set of rules based on the error rate from the training set. Attributeshaving the minimum error rate is selected. Figure 2(F) shows result of ourmethod which uses MLP classifier to select pixels of interest.
5

[24, 20] studied the contribution of the upper and lower face regions inhappy and sad facial expression classification. They used morphed faces todetect the intensity of a particular emotion on either the upper or lower face.In order to highlight important features they used multidimensional signaldetection theory. Their study also shows that happy/sad classification is ananalytic rather than a holistic process.
[25] defined Visual Context Patterns (VCP) for eye detection problem.Similar to our method, they searched for the smallest region of reference(ROR) rectangle that maximizes a quality function by satisfying maximalstable appearance while preserving less unstable appearance. Similarly inour method we search for the subregions that maximize and minimize theclassification performance. On the other hand, in our method instead ofselecting the smallest region, we used statistical elimination of regions byconsidering the variance value as explained in Eq.5. In terms of learningmethodology they employed selective sampling based semi-supervised boost-ing method where false positive samples feed back to update the classifierin each training step. In our case, we create our classifier at the end of theprocess by considering intermediate classification results.
3. Material and Methods
In this paper, we make use of non-rectangular emotion masks for facialemotion recognition problem to improve overall classification results. Figure3 shows general flow diagram of our method.
Input ImagesPreprocessing
Face Detection
Eye Detection
Orientation Correction
ScalingHistogram
Equalization
Update ROI(width, height)
Feature Extraction
Neural Network
Training Set
Intensity Values
Network ModelTest
Update cumulative min and max images
Update ROI (x,y )position
Detection
Test Set
Max (x,y) reached?
No
Yes
Max (width,height)
reached?
No
Create weighted face mask
Yes
Figure 3: Flow diagram of our method.
6

Our proposed method exhaustively searches for the best feature windowposition from a set of static images among all possible combinations usingan Artificial Neural Network (ANN) and creates a non-rectangular mask fora given emotion class. As the emotion recognition problem is a non-linearproblem, the most common type of ANN, the Multi-Layer Perceptron (MLP)was chosen for this study.
3.1. Preprocessing
We adopted similar preprocessing steps explained in [26]. OpenCV libraryis used to detect and segment out faces from static images based on frontalface detector [2].
Original image size in GENKI dataset [27] is approximately 180 × 192which reduces the face detection rate because of the small facial area. There-fore we performed linear interpolation to increase each image size to 450×480by preserving the aspect ratio. In this case OpenCV detects 3980 faces outof 4000 individual face images ( 99.5% accuracy). After that, eye detectionis performed to find the locations of the pupil centers. This step is necessaryto correct the orientation of the face according to the vertical position of leftand right pupil. For this reason, we used the neural network-based eye de-tector [28] available in the Stacked Trimmed Active Shape Model (STASM)[29] library to locate the positions of the pupils.
After the eye detection, we correct the orientation of the face using thevertical positions of both eyes. After that, the face is scaled down to 50× 50grayscale image considering the Inter Pupillary Distance (IPD). Face imagex, y, width and height values are computed using the following equations.
Fx = EyeLeftx − IPD/3 (1)
Fy = EyeLefty − IPD/2.5 (2)
Fw = IPD × 1.6 (3)
Fh = IPD × 1.9 (4)
where Fx, Fy, Fw and Fh represents the x, y, width and height of theface. EyeLeftx and EyeLefty are the x and y positions of the left eye withrespect to upper left origin of the image. Note that initial location of theOpenCV face detection results are updated here according to the IPD dis-tance. Scalar values 1.6 and 1.9 of the IPD for the width and height areselected according to the experimental tests. Finally, histogram equalization
7

is applied to increase the contrast. Figure 4 shows the initial and croppedface region after the use of Eq. (1), (2), (3) and (4).
(A) (B) (C) (D) (E)
Figure 4: Preprocessing steps for the sample images from GENKI dataset. (A) Originalimage. (B) OpenCV face detection output. (C) Rotating and reshaping the face dimen-sions considering IPD distance. (D) Normalizing face size to 50 × 50. (E) Histogramequalization.
After preprocessing step, our training set consists of 1,976 smiling and1,746 non-smiling faces.
3.2. Methods
We have performed smiling/non-smiling classification experiments on dif-ferent datasets. In this study, any class other than pure ”smiling” is definedas ”non-smiling”.
Consider a set of m windows Rk = {x, y, w, h}, k = {1, ..,m} where x, y,w and h represents top left x, y, width and height value for the rectangle.Let assume that MLP (Rk) = A(Rk) where A(Rk) is the validation accuracyof the MLP for a given input rectangle Rk. In order to represent the inputfeatures, a feature vector Fk is calculated in each window Rk. All possiblewindow positions are feed into a parallel backpropogation neural networkhaving 2 hidden layers as shown in Figure 5 to find the best A(Rk)b andworst A(Rk)w window location for a given feature window.
For each Rk, the training set is constructed by selecting equal number ofimages ( 50% training, 50% testing) from each emotion class. In order toovercome inherent disadvantages of the gradient-descent method, the batchRPROP (Resilient PROPagation) algorithm [30] which is a direct adaptivemethod for fast backpropogation learning is used to train the MLP. RPROPalgorithm is a learning heuristics which considers only the sing of the partialderivative for the current epoch to determine the next value of the each
8

Preprocessed image
width height 20 neurons 15 neurons 2 neurons
- Smiling
- Non-Smiling
Classification
width
he
igh
t
Figure 5: MLP architecture having two hidden layers. The number of neurons in the inputlayer is dynamically determined by the current size (width , height) of the search window.
weight. As the weight updates depend only on the sequence of the errorsigns and not the magnitude of the error, all weights have equal chance tolearn. We selected to use the maximum number of allowed iterations and theepsilon value as 200 and 0.001 respectively for the RPROP algorithm.
Since the wrapper based feature selection methods have high computa-tional complexity, we parallelized our code to reduce computational time. Inorder to speed up the exhaustive search process we employed data-paralleldivide-and-conquer method for the neural network training step where eachof the 8 physical processor is assigned to specific window size and position.In addition, we horizontally and vertically skipped every 3 pixels to reducecomputational time.
Let A(Rk)b and A(Rk)w be the mean of results obtained from best andworst performing windows from a distribution with mean µb, µw and vari-ance V (µb), V (µw) respectively. Then, the mask C is created consideringthe variance as shown in Eq. (5). Good results obtained in worst windowsand bad results obtained in best windows are eliminated. The predictionpower of the Rk is measured in terms of corresponding error rate on thetraining set. The mask C is then applied to normalized face images obtainedin section 3.1. The approach is extendable to serve as a tool to make exper-imental investigation to find best feature window locations for different set
9

of emotions.
C = (A(Rk)b > A(Rk)b +V (µb))∧ (255− (A(Rk)w < A(Rk)w−V (µw))) (5)
3.3. Datasets
We used 50% of the GENKI dataset as the training set. JAFFE andFERET dataset has been used for the test and evaluation purposes. Trainingand test sets are strictly separated.
3.3.1. GENKI Dataset
The MPLab GENKI-4K dataset [27] is a two class database of imagescontaining ”smiling” and ”non-smiling” faces spanning a wide range of illu-mination conditions, geographical locations, personal identity, and ethnicity.It contains 4000 labeled face images by human coders. The pose of the facesis approximately frontal.
3.3.2. JAFFE Dataset
JAFFE [31] is the Japanese Female Facial Expression dataset which con-tains 213 images of 7 facial expressions (6 basic facial expressions + 1 neutral)posed by 10 Japanese female models.
3.3.3. FERET Dataset
FERET [32] is an online Facial Expression Image Database includingindividuals from different genders, ethnicities and age groups with differentfacial expressions on their faces. The database contains 1,564 sets of imagesfor a total of 14,126 images that includes 1,199 individuals. We used fafbsubset in our experiments.
4. Results and Discussion
For a 50×50 face image we considered (m = 224) different search windowRk which yields 14,490 different neural networks. When all possible windowssizes feed into the neural network the outputs are the set of best and worstwindow locations as shown in Figure 6.
It took approximately 23 hours to process the GENKI dataset. For eachRk, we stored the x and y position giving the highest and lowest accuracyin test phase. Average training accuracy of 14,490 different neural networkis 93.6% with a standard deviation of 14.1%. On the other hand, average
10

Min MaxSearch Window
1.
2.
224.
…… ……
Figure 6: Minimum and maximum accuracy window location for different window sizes.
accuracy on the test set is 71.7% and standard deviation is 8.71%. 46.7%(6,773/14,490) of all neural networks performs error rate of less than 1% .
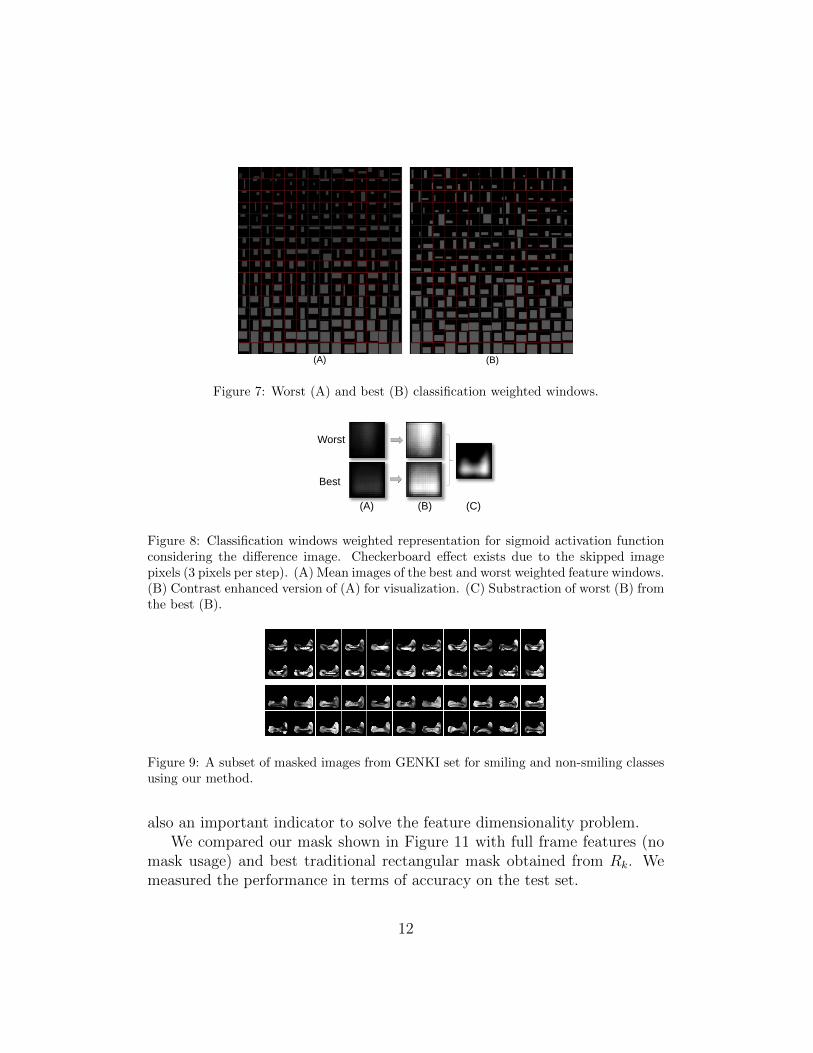
Figure 7 (A) and (B) shows 224 different Rk giving the worst and bestclassification results when sigmoid activation function used on 50 × 50 faceimages. Note that brighter intensity values represents higher accuracy ofMLP classifier for the given Rk. Minimum values usually located on theupper face and forehead region whereas maximum values are located nearthe mouth and middle area of the face. This is because the positive emotionsare likely to persist in the lower face more than in the upper part of theface where the negative emotions occur in the upper part of the face. InFigure 7(A), from left to right and top to bottom the classification accuracyincreases from 33.1% to 85.7%. On the other hand in Figure 7 (B), thesevalues are between 74.9% to 87.8%.
Figure 8 presents the result of Eq. (5) on GENKI dataset. By convention,we assume that a high accuracy is an indication of a valuable window andlow accuracy is an indication of a worthless window. Sample use of the maskis shown on Figure 9.
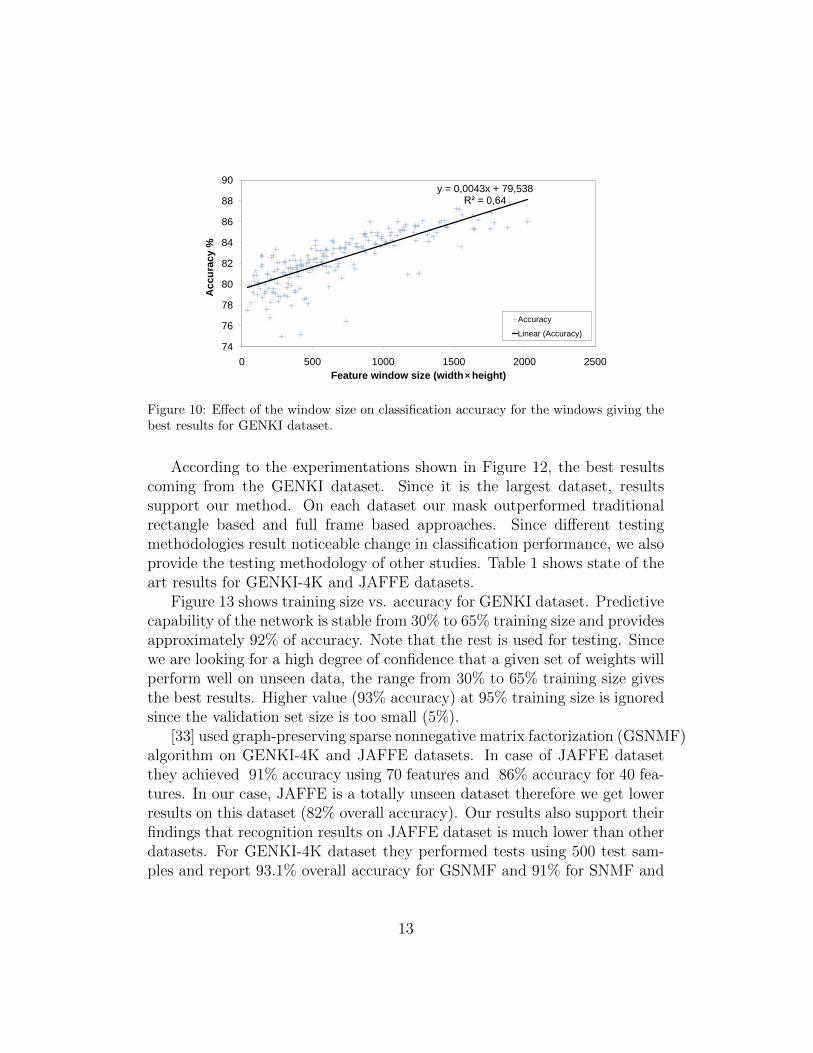
According to the Figure 10, it is clear that increased window size leadsto better accuracy. In order to quantify the strength of the relationshipbetween the feature size and corresponding best accuracy value, we computedthe square of the sample correlation coefficient between the feature size andtheir corresponding accuracy values. Approximately 64% of the variation inthe accuracy can be explained by the feature size and the remaining 36% canbe explained by unknown (r2 = 0.64) as shown in Figure 10. Similarly, someof the smaller windows gives better accuracy than large windows which is
11
(A) (B)
Figure 7: Worst (A) and best (B) classification weighted windows.
Worst
Best
(A) (B) (C)
Figure 8: Classification windows weighted representation for sigmoid activation functionconsidering the difference image. Checkerboard effect exists due to the skipped imagepixels (3 pixels per step). (A) Mean images of the best and worst weighted feature windows.(B) Contrast enhanced version of (A) for visualization. (C) Substraction of worst (B) fromthe best (B).
Figure 9: A subset of masked images from GENKI set for smiling and non-smiling classesusing our method.
also an important indicator to solve the feature dimensionality problem.We compared our mask shown in Figure 11 with full frame features (no
mask usage) and best traditional rectangular mask obtained from Rk. Wemeasured the performance in terms of accuracy on the test set.
12
y = 0,0043x + 79,538R² = 0,64
74
76
78
80
82
84
86
88
90
0 500 1000 1500 2000 2500
Accu
racy %
Feature window size (width height)
Accuracy
Linear (Accuracy)
Figure 10: Effect of the window size on classification accuracy for the windows giving thebest results for GENKI dataset.
According to the experimentations shown in Figure 12, the best resultscoming from the GENKI dataset. Since it is the largest dataset, resultssupport our method. On each dataset our mask outperformed traditionalrectangle based and full frame based approaches. Since different testingmethodologies result noticeable change in classification performance, we alsoprovide the testing methodology of other studies. Table 1 shows state of theart results for GENKI-4K and JAFFE datasets.
Figure 13 shows training size vs. accuracy for GENKI dataset. Predictivecapability of the network is stable from 30% to 65% training size and providesapproximately 92% of accuracy. Note that the rest is used for testing. Sincewe are looking for a high degree of confidence that a given set of weights willperform well on unseen data, the range from 30% to 65% training size givesthe best results. Higher value (93% accuracy) at 95% training size is ignoredsince the validation set size is too small (5%).
[33] used graph-preserving sparse nonnegative matrix factorization (GSNMF)algorithm on GENKI-4K and JAFFE datasets. In case of JAFFE datasetthey achieved 91% accuracy using 70 features and 86% accuracy for 40 fea-tures. In our case, JAFFE is a totally unseen dataset therefore we get lowerresults on this dataset (82% overall accuracy). Our results also support theirfindings that recognition results on JAFFE dataset is much lower than otherdatasets. For GENKI-4K dataset they performed tests using 500 test sam-ples and report 93.1% overall accuracy for GSNMF and 91% for SNMF and
13

Table 1: State of the art results on JAFFE and GENKI dataset. * For more detail,please refer to referenced article. ** Training performed on GENKI dataset. No trainingperformed on JAFFE dataset. *** Randomly select two images for each expression perperson.
Author Methodology Dataset Classification Acc. Classes
[35] leave-one-out* JAFFE Gabor filters 88.1% 2[35] leave-one-out* JAFFE DNMF 85.2% 2[36] 65% train-35% test JAFFE NN+DNMF 56.4% 7[36] 65% train-35% test JAFFE SVM+DNMF 60.0% 7Our method 100%** test JAFFE NN+Mask 82.0% 2[33] 65%*** train-35% test JAFFE GSNMF 92.0% 7[33] 25% train-75% test GENKI GSNMF 93.1% 2[33] 25% train-75% test GENKI SNMF 92.0% 2[33] 25% train-75% test GENKI Laplacian 89.9% 2Our method 25% train-75% test GENKI NN+Mask 88.7% 2
Our method 50% train-50% test GENKI NN+Mask 92.0% 2
we obtained 92% overall accuracy using 2000 test samples.
5. Conclusion
In order to find the best feature window position and size, we performedexhaustive search on facial area. Although the bigger windows size have thehigher accuracy, our experiments showed that location and size of the win-dows has a great effect on the emotion classification problem. Experimentsshowed that, in many cases, smaller feature windows have more accurateresults than larger feature windows. In addition, for the same windows sizethere is a high accuracy difference in very close windows which supports theimportance of our study. In this study we showed that proposed methodimproves the classification results by selecting the best pixels of interest onvariety of well known databases. Since we used wrapper based method, themask creation phase is time consuming task. However, that recognition phaseusing our mask runs at real-time (30 images per second for GENKI dataset).Therefore, among other methods, proposed method is an alternate solutionto real-time facial expression recognition problem. A future work has beenplanned to create additional masks for the rest of the basic emotion classes.
14
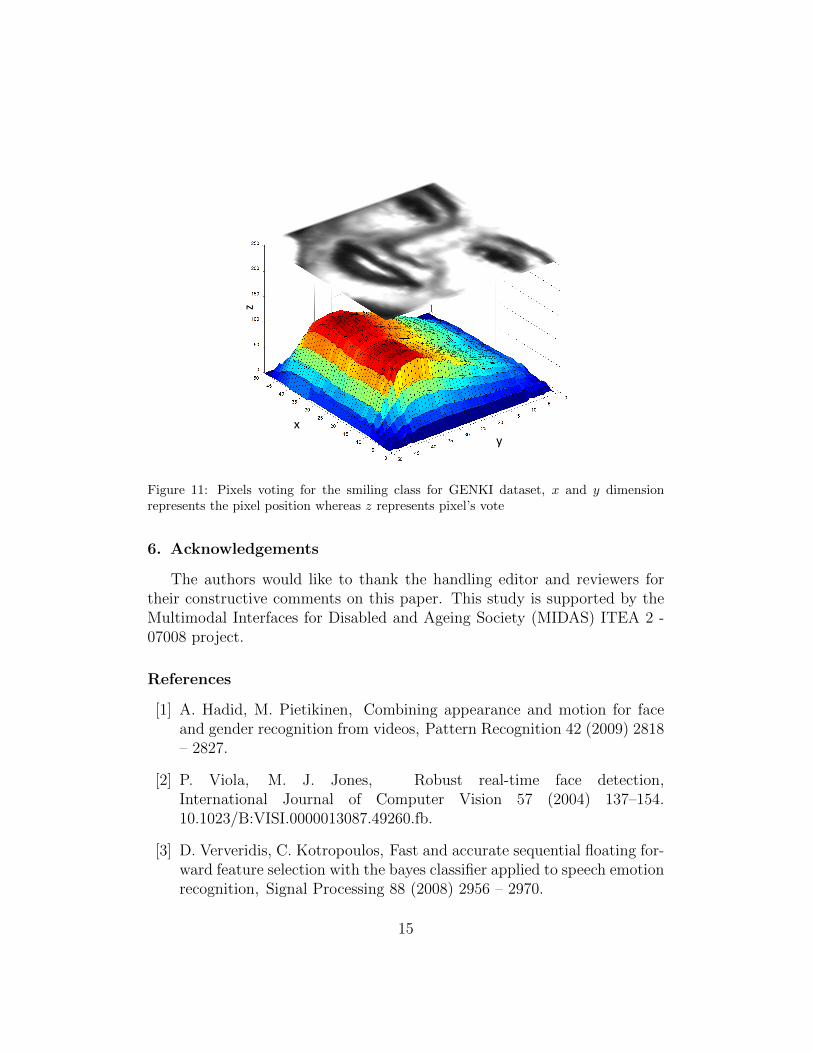
xy
z
Figure 11: Pixels voting for the smiling class for GENKI dataset, x and y dimensionrepresents the pixel position whereas z represents pixel’s vote
6. Acknowledgements
The authors would like to thank the handling editor and reviewers fortheir constructive comments on this paper. This study is supported by theMultimodal Interfaces for Disabled and Ageing Society (MIDAS) ITEA 2 -07008 project.
References
[1] A. Hadid, M. Pietikinen, Combining appearance and motion for faceand gender recognition from videos, Pattern Recognition 42 (2009) 2818– 2827.
[2] P. Viola, M. J. Jones, Robust real-time face detection,International Journal of Computer Vision 57 (2004) 137–154.10.1023/B:VISI.0000013087.49260.fb.
[3] D. Ververidis, C. Kotropoulos, Fast and accurate sequential floating for-ward feature selection with the bayes classifier applied to speech emotionrecognition, Signal Processing 88 (2008) 2956 – 2970.
15

60
65
70
75
80
85
90
95
FERET
GENKI
JAFFE
88
84
70
89
87
82
9192
82
Accura
cy
FERET GENKI JAFFE
Full frame 88 84 70
Best rectangular window 89 87 82
Our mask 91 92 82
Classification Performance
Figure 12: Experimental results on different databases.
Figure 13: Training size vs. accuracy for GENKI dataset.
[4] K.-M. Lam, H. Yan, An analytic-to-holistic approach for face recog-nition based on a single frontal view, Pattern Analysis and Machine
16

Intelligence, IEEE Transactions on 20 (1998) 673 –686.
[5] T. Ojala, M. Pietikinen, D. Harwood, A comparative study of texturemeasures with classification based on featured distributions, PatternRecognition 29 (1996) 51 – 59.
[6] H. Tang, B. Yin, Y. Sun, Y. Hu, 3d face recognition using local binarypatterns, Signal Processing (2012) –.
[7] M. Turk, A. Pentland, Eigenfaces for recognition, Journal of CognitiveNeuroscience 3 (1991) 71–86.
[8] K. Etemad, R. Chellappa, Discriminant analysis for recognition of hu-man face images, in: J. Bign, G. Chollet, G. Borgefors (Eds.), Audio-and Video-based Biometric Person Authentication, volume 1206 of Lec-ture Notes in Computer Science, Springer Berlin / Heidelberg, 1997, pp.125–142. 10.1007/BFb0015988.
[9] A. Hyvrinen, E. Oja, Independent component analysis: algorithms andapplications, Neural Networks 13 (2000) 411 – 430.
[10] N. Guan, D. Tao, Z. Luo, B. Yuan, Online nonnegative matrix fac-torization with robust stochastic approximation, Neural Networks andLearning Systems, IEEE Transactions on PP (2012) 1.
[11] N. Guan, D. Tao, Z. Luo, B. Yuan, Nenmf: An optimal gradient methodfor nonnegative matrix factorization, Signal Processing, IEEE Transac-tions on 60 (2012) 2882 –2898.
[12] N. Guan, D. Tao, Z. Luo, B. Yuan, Manifold regularized discrimina-tive nonnegative matrix factorization with fast gradient descent, ImageProcessing, IEEE Transactions on 20 (2011) 2030 –2048.
[13] S.-I. Choi, J. Oh, C.-H. Choi, C. Kim, Input variable selection for featureextraction in classification problems, Signal Processing 92 (2012) 636 –648.
[14] S. Gong, P. W. McOwan, C. Shan, Conditional mutual informationbased boosting for facial expression recognition, in: British MachineVision Conference, volume 1, Guide Share Europe, Berlin, 2005, pp.399–408.
17
[15] G.-M. Jeong, H.-S. Ahn, S.-I. Choi, N. Kwak, C. Moon, Pattern recog-nition using feature feedback: Application to face recognition, Interna-tional Journal of Control, Automation and Systems 8 (2010) 141–148.10.1007/s12555-010-0118-7.
[16] V. Praseeda Lekshmi, S. Kumar, D. Vidyadharan, S. Naveen, Analysisof facial expressions using pca on half and full faces, in: Audio, Languageand Image Processing, 2008. ICALIP 2008. International Conference on,pp. 1379 –1383.
[17] M. Song, D. Tao, Z. Liu, X. Li, M. Zhou, Image ratio features for fa-cial expression recognition application, Systems, Man, and Cybernetics,Part B: Cybernetics, IEEE Transactions on 40 (2010) 779 –788.
[18] Z. Zhang, M. Lyons, M. Schuster, S. Akamatsu, Comparison betweengeometry-based and gabor-wavelets-based facial expression recognitionusing multi-layer perceptron, in: Automatic Face and Gesture Recog-nition, 1998. Proceedings. Third IEEE International Conference on, pp.454 –459.
[19] M. E. Aroussi, M. E. Hassouni, S. Ghouzali, M. Rziza, D. Aboutajdine,Local appearance based face recognition method using block based steer-able pyramid transform, Signal Processing 91 (2011) 38 – 50.
[20] M.-Y. Chen, C.-C. Chen, The contribution of the upper and lower facein happy and sad facial expression classification, Vision Research 50(2010) 1814 – 1823.
[21] M. Hall, Feature subset selection: A correlation based filter approach,1997.
[22] H. Liu, R. Setiono, A probabilistic approach to feature selection - a filtersolution, in: ICML, pp. 319–327.
[23] R. C. Holte, Very simple classification rules perform well onmost commonly used datasets, Machine Learning 11 (1993) 63–90.10.1023/A:1022631118932.
[24] M. Pantic, L. Rothkrantz, Toward an affect-sensitive multimodalhuman-computer interaction, Proceedings of the IEEE 91 (2003) 1370– 1390.
18
[25] M. Song, D. Tao, Z. Sun, X. Li, Visual-context boosting for eye de-tection, Systems, Man, and Cybernetics, Part B: Cybernetics, IEEETransactions on 40 (2010) 1460 –1467.
[26] T. Danisman, I. M. Bilasco, N. Ihaddadene, C. Djeraba, Automaticfacial feature detection for facial expression recognition, in: VISAPP(2), pp. 407–412.
[27] http://mplab.ucsd.edu, The MPLab GENKI Database, GENKI-4KSubset, 2011.
[28] H. Rowley, S. Baluja, T. Kanade, Neural network-based face detection,Pattern Analysis and Machine Intelligence, IEEE Transactions on 20(1998) 23 –38.
[29] S. Milborrow, F. Nicolls, Locating facial features with an extended activeshape model, in: D. Forsyth, P. Torr, A. Zisserman (Eds.), ComputerVision ECCV 2008, volume 5305 of Lecture Notes in Computer Science,Springer Berlin / Heidelberg, 2008, pp. 504–513.
[30] M. Riedmiller, H. Braun, A direct adaptive method for faster back-propagation learning: the rprop algorithm, in: Neural Networks, 1993.,IEEE International Conference on, pp. 586 –591 vol.1.
[31] M. Lyons, J. Budynek, S. Akamatsu, Automatic classification of singlefacial images, Pattern Analysis and Machine Intelligence, IEEE Trans-actions on 21 (1999) 1357 –1362.
[32] P. Phillips, H. Moon, S. Rizvi, P. Rauss, The feret evaluation method-ology for face-recognition algorithms, Pattern Analysis and MachineIntelligence, IEEE Transactions on 22 (2000) 1090 – 1104.
[33] R. Zhi, M. Flierl, Q. Ruan, W. Kleijn, Graph-preserving sparse nonneg-ative matrix factorization with application to facial expression recog-nition, Systems, Man, and Cybernetics, Part B: Cybernetics, IEEETransactions on 41 (2011) 38 –52.
[34] Y. Shinohara, N. Otsu, Facial expression recognition using fisher weightmaps, 2004.
19

[35] I. Kotsia, I. Buciu, I. Pitas, An analysis of facial expression recognitionunder partial facial image occlusion, Image and Vision Computing 26(2008) 1052 – 1067.
[36] Z. Liang, Y. Li, T. Zhao, Projected gradient method for kernel dis-criminant nonnegative matrix factorization and the applications, SignalProcessing 90 (2010) 2150 – 2163.
20