intensity data for earthquakes at landor · intensity data for earthquakes at landor (17 june 1969)...
TRANSCRIPT

BMR Record 1971/80
c.4
•
Record 1971/80
INTENSITY DATA FOR EARTHQUAKES AT LANDOR (17 JUNE 1969) AND CALINGIRI (10 MARCH 1970) AND
THEIR RELATIONSHIP TO PREVIOUS WESTERN AUSTRALIAN OBSERVATIONS
by
LB. Everingham and A. Parkes

I I I I I I I I I I I I I I I I I I I I
RECORD 1971/80
INTENSITY DATA FOR EARTHQUAKES AT
LANDOR (17 JUNE 1969)
AND
CALINGIRI (10 MARCH 1970)
AND THEIR RELATIONSHIP TO PREVIOUS WESTERN AUSTRALIAN OBSERVATIONS
by
LB. EVERINGHAM
and
A. PARKES

I I I I I I I I I I I I I I I I I I I I
1.
2.
3.
4.
5.
SUMMARY
INTRODUCTION
ISOSEISMAL MAPS
Landor earthquake
Calingiri earthquake
DISCUSSION
Useful formulas
CONTENTS
Geological effects
Intensity/distance, maximum intensity
Hagnitude/intensity
CONCLUSIONS AND RECOMHENDATIONS
REFERENCES
APPENDIX A: Questionnaire Sheet
APPENDIX B: Table for Evaluation of Intensity
ILLUSTRATIONS
3~
3-" 3
5 6
6
G
8
10
10
Plate 1. Regions of seismicity, Western Australia (WA/B9-3)
Plate 2.
Plate 3.
Plate 4.
Plate 5.
Plate 6a.
Plate 6b.
Tectonic Units of Western Australia
Isoseismal map of the Landor earthquake
(WA/B9-5A)
<WA/B9-4)
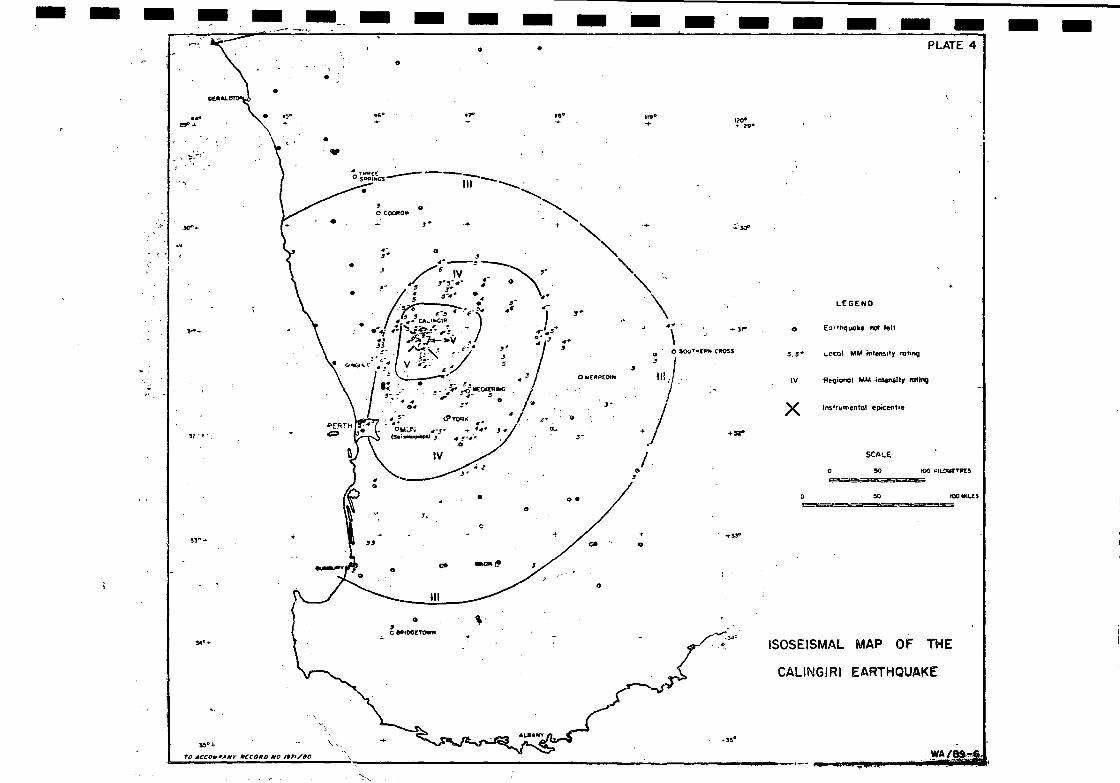
Isoseismal map of the Calingiri earthquake (WA/B9-6)
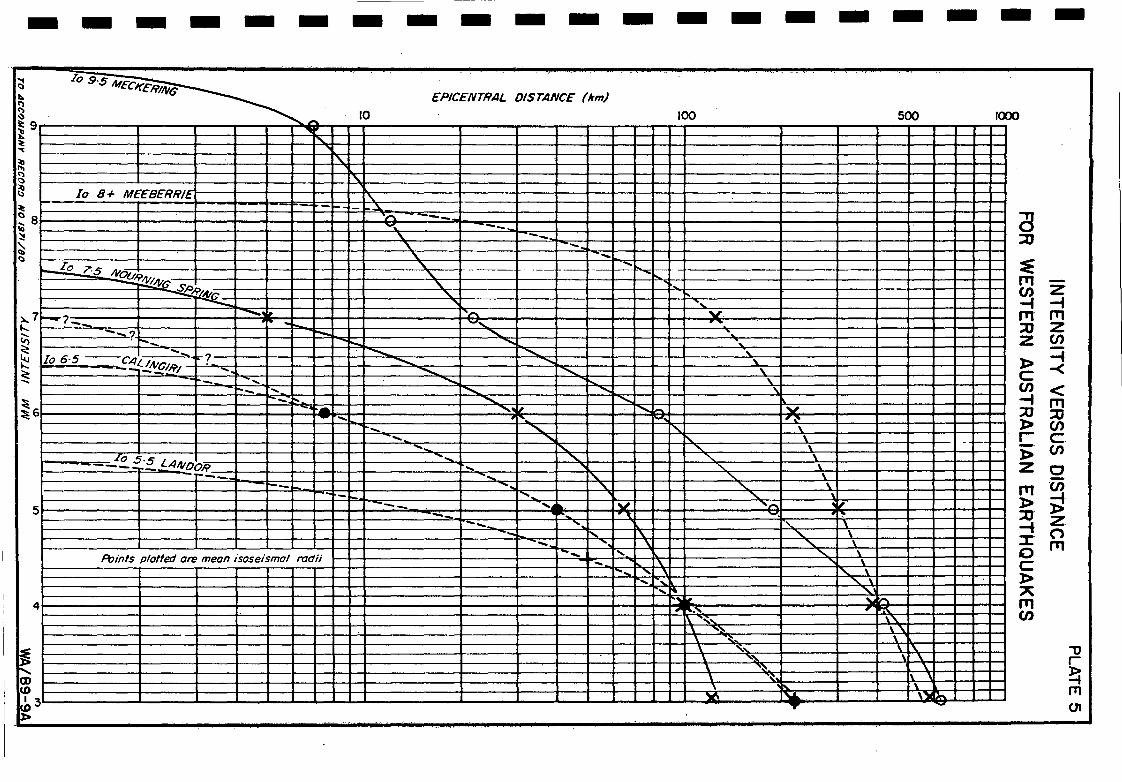
In tensi ty versus distance curves for Western Australian earthquakes (WA/B9-9A)
10 - I versus epicentral distance curves
10 - I versus epicentral distance curves
(WA/B9-7A)
(WA/B9-8A)

I I I I I I I I I I I I I I I I I I I I
SUMMARY
Intensity data for earthquakes at Landor (17 June 1969) and Calingiri (10 March 1970) are presented and discussed along with previous Western Australian results.
The data show that the Meckering (1968), Landor (1969), and Calingiri (1970) earthquake intensity radiation patterns were similar, but different from those of the Nourning Spring (1963) and Meeberrie (1941) earthquakes. Intensities at Landor may have been increased by geological or source effects.
Examination of the relationships between isoseismals and focal depths, propagation efficiency, and magnitudes suggests that it is not possible to predict accurately intensities for use in earthquake risk analysis.
It is strongly recommended that networks of strong-motion instruments be established in Western Australia.

I I I I I I I I I I I I I I I I I I I I
1. INTRODUCTION
The pu::-pose of this repIJrt- is to present- macroseismic dat.a from larger Western Australian earthquakes which occurred during the period January 1968 to June 1970 9 and to discuss these observations along wi th previous results obtair.ad from the WoA. earthquakes which took place at Meeberrie (1941)~ Nour-r.ing Spring (~963)9 and Meckering (1968)~ See Clarke g Prider & Teichert (:955); Everingham (1968), Everingham & Gregson (1970). Localities are shown in Plates 1 and 2.
The results are of i:1terest g because of the relationship of earthquake risk to the depth and magnitude of the event5 9 and to geological structure.
The distrit'ltior. of the macroseismic effects? Le. the earthquakes! effects observed on a large scale without instrumental aid ll is represented by isoseismals 9 which indicate boundaries between regions of successive ratings of intensity estimated on the Modified Mercalli (MM) scale described by Richter (1958).
During the period 1968 through June '1970 9 the three earthquakes listed below were felt over wide areas of the State.
EPICENTRE
DATE ORIGIN LAT LONG DEPTH m m MS TIME (UT) Os °E kIn CGS
1969 Jun 17 195434 25.0 11608 5.7
(Landor)
1970 Mar 10 17151102 31.11 116.47 1 5.7* 6.2 501
(Calingiri)
Mar 24 103522* 22.0* 126.7* 33R* 6.2* 5.9 5.9* (East Canning Basin)
In this list tha USCGS data are siarred 1 the MS value for the Calingiri event was determined from the Port Moresby and Riverview WWSSS seismograms~ and the remaining data were determined at the Mundaring Observatory.

-3-
Isoseismals for ·the largest event of the three were not obtained, because the epicentre was in.a remote and uninhabited area of the State, from which very little observational data were available. The maximum known intensity of MM5 was 9bserved'at Fitzroy Crossing, which is about 500 km from theepicentre. The earthquake was also clearly felt in tall buildings at Perth (distance 1500 ~ (MM1' or 2).
Isoseismal surveys were conducted for' the Landcirand Calingiri earthquakes, both of which occurred in Precambrian regions' with a recent history of seismic activity. The active regions as outlined 'by Everingham & Gregson (1970) ar.e shown, slightly mod:Lfied~ .in Plat;e 1, and the main tectonic units for Western Australia are shown in Plate 2 together with epicentres of the earthquakes under discussion.
2. ISOSEISMAL MAPS
The isoseismal questionnaire used for the Calingiri earthquake is shown in Appendix Ao' The same questionnaire was used for the Landor shock, but with appropriate changes in the general remarks section.
Both events occurred during darkness in ~he very early morning when. most people were sleeping. The ratings of intensity were difficult to assess, because too few people were awake or else they were awakened during the tremor too dazed to know just what was happening. Furthermore, the damage, being very slight, .could not be used as acri terion.· To assist in evaluating intensities, a chart was designed (Appendix B) to obtain average intensities from what had been felt or hearc,i and according to the proportion of people awakened at any' point. It was most useful for estimating intensities of less than MM6 where damage was negligible. Where several reports were assessed for small areas around a'particular townShip the intensity range obtained from this method was rarely more than one and a half units. Normally a range of at least one unit of intensity could be expected because of sub::"soil varia:tions,' so that the results tend to show the . consistency of the.averaging method using the· chart.
Places at which observers rep~rtedthat the earthquake was not felt are marked in. Plates .3 and 4, because the ratio of· 'not felt' . reports to 'felt' reportsprovides'a factor for comparison: with other results.
The Landor earthquake
The isoseismal map is shown in PI'ate 3.
Fifty-two replies were received f~omabout ·seventy questionnaires sent to every homestead (HoS.) and township within a 300 km radius of the epicentre.
I I I I I I I I I I I I I I I I I I I I

I I I I I I I I I I I I I I I I I I I I
-4-
Reports of damage \vere: 1100rarie H. S. t lightly cracked old brick wall; Yinnietharra H.S., mud brick chimney fell in an abandoned hut; Da.iry Creek H. S., ceiling shifted; Heekatharra, tank slightly cracked. The maximum intensity vias assessed as NI15+. Em'lever, because of the large distance between homesteads (usually 30-50 km) a zone of high intensity could have remained undiscovered.
The largest aftershock (presumably in the same position as the main event) was heard at Landor and at four homesteads to the south, which suggests that the instrumentally determined epicentre indicated in Plate 3 is too far north. The epicentre could have been situated in the centre of the region ".,i th greatest intensities.
The Calingiri earthquake
The isoseismal map is shown in Plate 4.
Three hundred and sixty replies ,',ere received from about 420 questionnaires circulated vIi thin a 300 kIn radius of the earthquake epicentre. Each intensity rating is sho~m in Plate 4~
Although the earthquake caused an arcuate shallow eastdipping thrust fault over a distance of about 5 kIn, \"here the surface was uplifted by as much as 30 cm. Major damage to buildings did not occur at Calingiri only 3 km from the fault. No building stradd.led the faul t, where the only damage \<1as the shortening and misaligI1JTIent of wire fences and a bump in a road. where the fault scarp crossed it.
Close to the epicentre individual intensities rated from questionnaires were in the range 111M4+ to 1I1j1-16+. The authors, on a very brief visit to Calingiri, conc:Luded that the intensity there was fI'IM6. The 1968 l'1eckering earthquake had caused some slight cracking of walls in the area, so that it was not easy to assess the damage effects from the Calingiri event.
Here it should be noted that the authors' rating of intensity (MH6) is based largely on cracking of \'lal18 in older homes~ 'l;Thich because of their age, were considered to be in the 'MasonrJ D' group as defined by Richter. However, G.A. Eiby (DSIR 1 NZ) (pers. comm.) considered that, because the local standard of building was generally higher than in areas described by Richter, these types of buildings could be classified_ as IHasonry C' f and that accordingly the authors' rating ".,ould tend to be too low.

-5-
3. DISCUSSION
Useful formulas
Several useful relationships between intensity, magnitude, and distance from the hypocentre are given below:
Formula 1 (Gutenberg & Richter, 1956)
10 = 1.5 (M-1)
(For crustal shocks, fits formula 2 for h - 20 km)
F'ormula 2 (She bal in, 1956 )
10 = 1.5 M - 3.5 log h + 3.
Formula 3 (see Ergin, 1969)
10 - I = n log r:x2: h2)*] + (absorption term)
where 10 = maximum r-U'1 in tensi ty
I = intensity at horizontal distance x from epicentre
1-1 = magnitude HS
h = focal depth
n = empirical constant
log = log arithon to the base 10
Formula 'I, a standard formula used fer many years, relates magnitude and maximum intensity. It applies to events with hypocentres in the mid-crustal regio~ (Le. about 20 km deep). However, it is obvious that maximum intensity is a function of focal depth, and formula 2 should be used for earthquakes with depths appreciably different from 20 km. For a magnitude 3.0 event at a depth of 1.0 km, formula 2 suggests that 10 = 7.5; which appears to be unrealistic. Possibly formu.la 2 is not applicable for depths less than 10 km or 'leg h' should read lleg (h + C), ,",here c is some small constant (see later discussion).
Formula 3 relating intensity, distance from hypocentre, and focal depth may be used for depth determination, and for comparing intensity effects in differing regions, or from different events (Ergi.n, 1969). The equation is the equivalent of an expression given by Blake (1941), which has been used for the determination of depths of a few Australian earthquakes, including one at Nourning Spring (Everingham, 1968) •
I I I I I I I I I I I I I I I I I I I I

I I I I I I I I I I I I I I I I I I I I
-6-
Geological effects
Plate 5 shows that the mean radii of the t1H3 and HN4 isoseisrnals observed from the Calingiri earthquake are almost equal to those obtained from the Landor event. Normally this would indicate equality of magnitudes, but instrumental evidence clearly suggests a smaller magnitude for the Landor event. Therefore it must be assumed, that either the sub-soil conditions for the region around Landor (relative to those on the shield near Calingiri)resulted in increased intensities or that the mechanisms at the sources were different.
An effect definitely associated with geological structure, which may be seen by reference to Plates 2 and 3, is the elongation of Landor earthquake isoseismals in the SE-NW direction parallel to the regional geological strike of the northern Gascoyne Block and western part of the Bangemall Basin. A similar effect occurred with the 1941 Meeberrie earthquake, 200 km to the south of Landor. In this event the isoseismals were elongated in the NE-SW direction roughly parallel to the contact between Yilgarn and Gascoyne Blocks.
For higher intensities, the propaga.tion from the Calingiri earthquake was more efficient to the east. A similar phenomenon was observed from the 1968 Meckering earthquake (Everingham & Gregson, 1970). As for the M~ckering event, propagation at lower levels of intensity was more efficient to the south southwest.
The explanation for these features could be that more ener~J was radiated to the east, because of the mechanism at the source, but attenuation was least to the southwest and therefore at distances of, say, 200 km; this effect outweighed the source effect. Further explanation in terms of geology would be highly speculative.
Intensity/distaDce, maximum intensity
Ergin (1969), using sets of curves derived from formula 3 with various values of the constant (n) and depth (h) found that the intensity/distance relationship for a number of earthquakes indicated values of either 3 or 5 for n. He concluded that the difference in his observed values of n could be the result of different types of motion at the focus or the different crustal structure of the regions. In obtaining his value of n Ergin ignored the 'absorption factor', which, particularly at small distances, was considered negligible.
Plate 6a shows a set of Ergin's master curves for n = 3 for various focal depths and with intensity data for the Landor, Calingiri, and Meckering earthquakes. The latter were scaled from intensity/ distance curves based on mean isoseismal radii as plotted in Plate 5. These Western Australian results fit the n = 3 curves well, but the depths indicated appear to be too great for the Calingiri and Meckering events. Both were extremely shallow, possibly less than 5 km deep, whereas depths of 15 k~ or more are suggested by Ergin's curves.

-7-
The discrepan.cy may be explained if the local values 01' 10 were too lowj alternatively formula 3 may require modification for ',vestern Australian conditions.
The master curve for h = I indicates how rapidly intensities decrease in moving away from the epicentre of shallow ever-ts. At a distance of about 2 km the intensity decreases by one unit. Accordingly, the maximum intensity for the Calingiri event could easily have been underestimated by this amount, because the nearest building was about 3 kro from the centre of the earthquake fault (the epicentre). This type of underestimate does not apply for the Meckering earthquake, wher~ many buildings were close to the fault trace. Increasing the Calingiri 10 for the above reason results in a better agreement between the Calingiri and Heckering curves, but depths of 15 km are still indicated.
It has been suggested previously (Everingham & Gregson, 1970) that intensities experienced from earthquakes on the western Yilgarn Block are lower than from similar earthquakes in other regions, because of the different sub-soil conditions. The Ii/estern Yilgarn Block is commonly covered by oply a few feet of soil and clay above solid granite, whereas the average sub-soil layer elsewhere is likely to be thicker and underlain by layers of unconsolidated or weakly consolidated sedimentary rock. However, even if intensity ratings were all raised by some amount to allow for this, the curves would still remain in the same position, when plotted in Plate 6aj and to make the observed data fit Ergin's curves for very shallow depth, an increase of 10 alone by two units would be required. The experimental results do not justify such an increase of 10, and to fit the observed data of the Calingiri and i'leckering events, formula 3 would require modification to:
[2 21' J 10 - I = 3 log lX + (h + 4) /2/(h +~. + (3.bsorption term).
This formula would give a depth of about 15 km for the Landor earthquake.
It is interesting to compare these results with results of the Meeberrie (1941) and Nourning Spring (1963) isoseismal surveys carried out independently. Isoseismal radii for these events are shown in Plate 5 and values of (10 - I) along with Ergin's curves of formula 2 for n = 5 are shown in Plate 6b.
The curves for each event are different from those for the three earthquakes plotted in Plate 6a, and indicate an n value nearer 5 than 3. Depths suggested by the Plate 6b plots are 20 km and 60 km respectively for the Nourning Spring and Heeberrie events. If Ergin's standard curves are modified as suggested by the Plate 6a results, depths woul:i be about 13 knl and 60 km. The depths determined from the seismograms were 18 km (from possible pP phases) for the Nourning Spring earthquake and 32 km (from travel-times) for the Heeberrie earthquake (Everingham, 1968).
I I I I I I I I I I I I I I I I I I I I

I I I I I I I I I I I I I I I I I I I I
-8-
Different focal depth or mechanism could explain the differences in propagation (n values) for the two sets of earthquakes. However, insofar as risk is concerned, we are faced wi th yet another unknown., namely which type of earthquake propagation data (e.g. those for Nourning Springs or those for Calingiri), should be used in predicting earthquake shaking effects.
In assessing risk from earthquakes, Everingham & Gregson (1970) listed isoseismal radii (based mainly on the Meeberrie, Nourning Spring, and Meckering data) which indicated an n value of 3.3; i.e. the radius of each successive isoseismal is doubled.
Blake .( 1941) suggested that values were in the range 3 to 6, and it appears that values cannot be predicted with better precision. To be on the safe side, a ,low value of n should be used in risk estimates and Everingham & Gregson's (1970) tables wi th a value of 3.3 seem reasonable .•
Nagnitude/intensity
The magnitude and maximum intensity data for Western Australian earthquakes are tabulated below:
EVENT
1 Jvieckering
2 Calingiri
3· Smaller Locals
4 Landor
5(a) Meeberrie
(b) Neeberrie
6 Nourning Spring
DEPTH (km)
5
1
1
15
60
30
15
10 elvIN)
9.5
7
5
5.5
8.2
8.2
7.5
MAGNITUDE (MS)
from from 10 seismograms
(a) (b)
6 .• 8 5·.9 7.2
5.1 2.7 5.0 (5.7)
(3.5) 1.3 3.6
(5.1) 4.4 5.3
6 .. 8 7.7 8.4 (7 .. 3)
6 .• 8 6.9 7.7
4.1 5·7 6.6 ( 5.})

-9-
10 obtained from Flate 5
() derived from HL or mb
(a). ~1agni tude determined via formula 2
10 = 1.5M - 3.5 log h + 3
(b) Magnitude determined via
10 = 1.5M - 3.5 log (h + 4) + 2
• Small events in the Calingiri, Heckering, and Nourning Spring area •
Magnitudes were first determined from 10 and depth h using formula 2. Then by means of another formul~ in which firstly the observed 10 (see Plate 5) was increased by one unit to allow for the lowered intensities caused by the shield sub-soil condition; and secondly, 'h' was replaced by 'h + 4' in accordance with the empirical results discussed in the previous section.
For events 1-4 magnitudes determined from instrumental information agree fairly well with the magnitudes obtained from the modified formula 2; whereas magnitudes found using formula 2, unmodified are far too low. For event 4 (Landor) a reduction of 10 by half an intensity unit h.e. assuming thesub'-soil effect is somewhere between that for the shield ~~d for 'normal' conditions) would make magnitudes determined by instrumental data match those obtained from formula 2, modified. The differences between the Calingiri and Landor magnitudes determined in each manner would be consistent.
For the Nourning Spring event magnitudes determined from 10 seem too large, which suggests that 10 has been over-estimated, or the depth is too great. A reconsideration of the macroseismic evidence along with that from the Calingiri and Meckering events suggests that the maximum observed intensities could have been MH6, much the same as at Calingiri. If this was so, the magni tudes derived from Io from modi tied formula 2 are still higher than the instrumental magnitudes, and the Nourning Spring event appears to haVe different propagation characteristics from events 1-4.
'rhe Hee'berrie earthquake also appears to have different propagation characteristics from events 1-4. There was not sufficient evidence available to determine whether 10 for the Heeberrie earthquake was incorrect, although, as with the Landor earthquake, the maximum observed intensity may possibly have been slightly higher than for a similar event beneath the shield further south. 'rhe magnitudes determined from both formula 2 and its modification and the magnitude derived from the body waves are all higher than the magnitude determined from surface waves. This lends support to the assumption of Everingham & Gregson (1970) that the event was deeper than normal, and hence the magnitude determined from surface waves was underestimated.
I I I I I I I I I I I I I I I I I I I I

I I I I I I I I I I I I I I I I I I I
-10-
4. CONCLUSIONS Al'JD RECONHENDATIONS
The intensity results from the five earthquakes discussed appear to fall into two categories similar to those fOUJ."1d by Er·gin (1969) for earthqua..l{es in other regions. However, magnitude/in tensi ty., intensity gradient/distance, and depth formulas appear to need modification to fit the Western ·Australian result.s. Two provisivnally modified formulae are:
Ca) Ie - 1.5M - 3.5 log (h + 4) + 2
(t) 10 - I = n log hx2 + (h·+ 4)2)}~/(h +~] + (absorbtion term) where n = 3 or 5 .
The discussion clearly shows the uncertainty of the intensity information a..'ld the difficulty in predicti.ng shaking effects of earthquakes.
Eiby (1965) and others have pointed out that although isoseismals c~~ be dravm to delineate clearly the margin of an area over which a . certain intensity level Vias reached, only the order of the acceleratlon associated with such an inten~ity level may be known. Reporters may differ by as much as two units in assessing int.snsities, because of the quality of the data and the interpretation of the intensity scale. The Western Australian results show that empirical formulas from other regions must not be relied upon.
In order to make the intensity information more reliable and modernize the method of gathering intensity information., it is urgently necessary to set up arrays of strong-motion recorders. For example, a line of say six equally spaced instruments in the area extending about 200 km SSE from Calir.giri would provide good intensity/distance data in the event of a larger than normal earthquake happening in this relatively active seismic zone. Consideration should also be given to the installation of strong-motion recorders in larger centres of population in the State and in regions where earthquake swarms are in progress.
5. REFERENCES
BLAKE, A., 1941 - On the estimation of focal depth from macroseismic data. Bull. seismol. Soc. Amer. 31, 225-231 .•
CLARKE, E. de C., PRIDER, R.T., and TEICHERT, C., 1955 - Elements of geology for Western Au.stralian students. 3rdEci.. Perth University, Vi.A. Press.
DANIELS, J.L., and HORWITZ, R.C., 1968 - Precambrian tectonic units of Western Australia. Geol. Surv. West. Aust. Annual Report 1968, 37-38.

-11-
BIBY, G.A., 1965 - The Assessment of earthquake felt intensities. Seis. Obs. Wellington Bull. S132.
ERGIN, K., 1969 - Observed in'tensi ty-epicentral dista..l'lce relations in earthquakes. Bull.seismol. Soc. Amer. 59, 1227-1238.
EVERINGHAM, LB., 1968 - Seismicity of Western Australia. Bur. Hiner. Resour. Aust. Rep. 132.
EVERINGHAM, LB., and GREGSON, P.J., 19'70 - Heckering earthquake intensities and notes on earthquake risk for 'iiestern Australia. Proceedings of Institution of Engineers, Australia and the Australian Institute of Physics. Earthquake Engineering' §y-mposium, Melbourne, October 1969.
GUTENBERG, B" and RICHTER, C.F., 1956 - Hagni tude and energy of earthquakes. Ann. Geofis. 9, 1-15.
RICHTER, C.F" 1958 - EWIENTARY SEISJvlOLOGY. San Francisco, W.H. Freeman & Co.
SHEBALIN, N.V., 1956 - The relationship between intensity and magnitude of an earthquake with respect to focal depth. Akad. Nauk. SSSR Soviet Po Sysmologii Bull. 6, 122-126.
I I I I I I 1 1 1 I 1 1 1 1 1 I I I I I,

I
I I I I I I I I I I I I I I I I I I
-12-
APPENDIX A
EARTH TREMOR REPORT
Please underline suitable words and fill in answers where applicable as soon as possible while your memory is clearest o Also return report if not felt as that information is also important.
1. PLACE (St~tiQ~.Qr.tQwu~~ip) .•.•...•.•••....•••••.•.•••.•.•.••••
2.
4.
6.
8.
9.
TREMOR FELT Yes No
and/or ~ Yes No
INTEN$ITY OR ST~~GTH was faint, moderate, strong.
MOTION - rapid, slow LASTED FOR •••••••••••••• sec.
FELT LIKE - sudden jolt, passing heavy truck, slow vibration, swaying.
Remarks •••••••••••••••••••••••••• °0 ••••••••••••••••••••••••••
LOUDNESS (if heard) - faint, moderate, very loud.
NOISES - low rumbling, passing truck, passing train, thunder, I
distant explosion, und~rground explosion, building being struck, creaking of building structure, loud roaring, a bang.
Remarks •••••• 0 .............................................. .
DIRECTION - tremor appeared to come from N, NE, E, SE, S, SW, W, NW, can't say.
DIRECTION OF SHAKING was •••••••••••••
YOUR LOCATION was - outdoors, indoors •••••••••••••••••• , ••
walking, standing, sitting, sleeping •••••••••.•••••••••••••
Rem~rks •••••••••••••••••••••••••••••••••••••••••••••••••••••
TYPE OF BUILDING was - concrete, stone, modern brick, older brick, brick veneer, fibro, weather-board.
AGE OF BUILDING - 5, 10, 20, 40, 80, years, more.
GROUND BENEATH LOCATION was - rock, soil, sand, loose, compact, filled in, marshy, unknown.
NUMBER OF OBSERVERS was - you only, two, several, many, everyone in house, almost whole neighbourhood, everyone.
AWAKENED - no one, few, many, everyone.
Remarks .....................................................

I I I I I I I I I I I I I I I I I I I I
10.
-13-
EFFECTS ON OBJECTS
Rattling of windows, doo~s, crockery.
Creaking of walls~ frames of buildingso
Swinging produced in lights, doors. Swung N, NE ....... , . Splashed water out of tank, trough.
Shifted fur~iture, small objects, vases.
Overturned - furniture, small objects, vases.
Fall of - books, small objects, pictures, pl~ster, monuments, walls, chimneys.
Cracked - plaster, windows, walls, chimneys, ground.
11. DAMAGE - none, slight, moderate, considerable, great.
to - chi~~eys, walls, columns, water tanks, plaster, furniture, crockery.
Type of structure damaged - concrete, thick. stone, modern brick, older brick, brick veneer, fibro, weather-board.
12. GENERAL REMARKS
Were smaller shocks felt:
(a) before main tremor Yes/No. How many ............ ~ . , .. (b) after main tremor Yes/No. How many ••• ".;,0 ••••••••••
(c) during previous 12 months. Yes/No ..o •••••• oO •• ,:t ••••
(d) describe miscellaneous effects below.
Name w •••••••••••• G •••••• ~
Address ••.••••••••••.••••
.................... . " ....
. . . . . . . . . . . . . . .. . . . . . . . . . . .

-----.---------------
EFFECT
FELT
HEARD (rumbling)
HEARD (other sounds)
AWOKE
DAHAGE
APPENDIX B .
TABLE FOR ~VALUATION OF INTENSITY
M.M. INTENSITY
II III IV
Probably Nil Faint Moderate
Faint Faint but Moderate distinct
Nil or earthquake Faint rattle Windows, not recognised of windows, ery etc.
house creaks building
No one Few Many
Nil Nil Nil
V VI
Strong Very strong
Strong Very strong
crock- As for IV As for V rattle, creaks
objects objects fall move
, All except All, alarm some childre"
Any, light ie. Obvious cracks nlillor plc . .:3tcr i;e::'lr'~ rrlc:.sC:lr~:l
falls

1 I I I I I I I I I I I
.'j I I I I. I I I
110"
,0"
OAMPI~. /I '?\ M
ONSLOW \\ \?
24
<!JMEEKATHARRA
PLATE I
i . -!~ '0· I i I I i
'~"~h SCA~.,~~ ' .. ~"".£sj' 100 0 ~~-.=:.~-j :mo KILOMETRES
WA/89-3 ---

I I I I I I I I I I I I I I I I I I I I
ISO
28° NOHrHAftlPrON
Bl.OCK
,zo
120"
rlLGAHN BLOCK
KALGOORLI£ 0
• Mtlclrering
• Nourning Spring
1140 1170 1200 1230
______ ----L-____ ._....L. ____ -.----l _______ L.
LEGEND
~. Phonerozoic bosins
Unconformity
Tectonic contact
Metamorphic or Igneous contact
• Epicentre
SCALE
~ 0 !>O 100 200 300 MILES ~lmasl __ ~'~~I __ ~~' __ ~~'
T~CTONIC
WESTERN
( PrHcombrion units after Doniels and Horwitz ,1968)
TO AccnMPANr "FCOR/) NO 19"/80
126" I
PLATE 2
129"
56° 129" I
UNITS OF
AUSTRALIA
WA/B9-5

- -
<:: ~ \.) C)
<:: <:t ..... .:::J <::-"-
.... ; (
~
\,,"~"". , ~ ~ ~ ~ \'
\ \
\
\\ ,~ \
"'\~J , \)11 '\." 0 , -:;1
"'-.
'["I ;. \" \
"'" \ '" \
c
• • -;.
• I ..
. ~'
+
•
•
•
•
.. ~
,~ "
~ '-- .... ~~---------
•
.. -
- Z~
.00
.~-.~.-
- z"·"-
LEGEND
• " .,," Locol MM mtensity rating
SCALe 100
iSOSEISMAL MAP OF THE
- 2P' .:t f
LANDOR EARTHQUAKE
COO P'1../lN[,lQfs
WMB9-4
- - -- -...-=~=-==.~~-.:::=-I." ==~=:=----":===---==--==--==---===-----===-===---==:::"-''''''::::::::':''''--=~:;.:rr41 ~ PLATE 4 .. •
• .. . .~
\ • •
•
~z .~- .
SO'·
~o+- \".\
... ...
..
... +
.e· ...
4 TMOr£ _________ _
o S""~GS III - __ .
.. ',,-. "-
·t "-J" ....
"-'\.
'" \ LEGEND
["''''luake not leI!
IV
x Instrt.tmental epic:enhe
/ SCALE
" o
" :.0 rooMIUS
..
ISOSEISMAL MAP OF THE
CALINGIRI EARTHQUAKE
1-~T;D~.:C;C:OM~PA~N~Y~R~C~CD~R~D~N~D~/~._~~/_._D ________ ' ________________________________________________________ ~ ____ --____________ .. ~ .. ~---
- -
- - - - - - - - - - - - - - - - - - - -,. -
~ I095·~ .. ..-
b. MECI(EHING'
£PIC£NTHAL DISTANC£ (lrm) <"I C') ~ 10 100 500 1000 '=9 ~ ~
1'10. "C
~ l'\. <"I ~ I' ~ 10 8+ MEE8EHHIE ,'\. ~ - t- ~
~ 8 ',... --- ~ 10 "":. --::! '\. --~ '\. .... ::u ~ '\. -_fo 70S 4'OU,-9. " .... :E ----
........ ~ItIG '\.
" fT1 -~.IilAlr. ~ en z --- -... ...... -f -f
)...7 ~?-- """. "'"", v. ~
.. '"', .~ fT1 fTI ..... --? ~ :::0 Z 11) t-_
'~
~ ...... ...... " z en - .........
~ 10 6·5 ? ...... .: -..E'2'!..A/.EIHI
......... ........ -f .... '\. 1>
~ ......... ............. " ~ .... - .... ......... "
C ~- ..... ...... ........ -, en <
~ -~ ........ ........ ~ ~6
........ , ~ ........: - fTI - .... I', r-, I~
:::0 :::0 .... '- I" \. 1> en .... '" \. r c .... I' .... \.
.. 1-- t- -,Io 5·S £4 .... - ...... ...... \ 1> en
---. _ /IIOOH .... ...... \. Z 0 r--_ " "\.. " \.
~- ........ '\. " \ 'en - ...... " fT1 ~ 5 --- .... I~ ' ..... " 1> -- -.. 'l. ...... I'!' :::0
"'- "- r, \ Z - "- I' "\.. l -t (") - '. " ~ \ Z· fT1 PtJinfs plotted are mean isoseismal radii -- "- ~ \. D .... 1'- \ C ........ , I" \. .... -, ..... 1>
,~ "\.. " 4 ~1It. " h fTI ~ ~.,
, :\.
" \'\ en . \ ,~ . \.,
\ -~. \
~ \ "" \ 1'- "1J \ ''l.. ''\: \ ,). \ r
m \ '~. ~ U) \. \.
I :3 'V\ I"'" \.'"loI r.;;;. ITI U)
...,.. ..... (J1 1>

-
2
..... 4 I () .....
6
8
0
- --
-- -- - ............
- - -
- r-. -r-- - f-- -I-...
........... --~ --
~
- -......
- - - - - - - - - - - -10 EPICENTRAL DISTANCE (km) 100 500
- ------- EARTHQUAKE 10
--.-- Landor 5·5
---e--- Colingiri 6·5
---x--- Meckering 9·5
---0-- Calingiri 7·5 - Curve for n = 3 - -- h Focal depth in kilometres _ r- -, -~=-===-- 4 ~ ~-"'":~~ - --- ---j ts --- -- -----,.--, r-....... 11=15--
.... ~ t---
-- ~
~~-~- -- - r---;.:.
" ... - -.......... -- r-
-..... - ... - -~
"-=' -.",." -... ............ 11=40 1"-...:. ......... t--, ~ 1'""'.-- .... -.........
r-_ :---. -- ..... ........... -........ 1- ~- '"-- ....... ....... ~~.:: -... -, .......
....... h = 1 ....... ....- ..... ....... ....... -~ .... ~ ..... t..... ....... " -':..- _ ......... - ......
r-.. ..... '"-....... ,.... ..... - ....... ---..... ........... "-..... --......... ....... '" ....... ........... i""",
-....... ........... - ...... ~ .......
~~ " ---..... ~,
..... ....... ..... i'-. --.... ~
r-..... ..... ~ ..... ---..... "'v
....... ~..; ....... i""-.. -..... -....... .......
f".... ---.....
-....... - ....... -....... r--. .
"I'-.
Io - I VERSUS EPICENTRAL DISTANCE (Master-curves after Er in 1969)
-1000
r-... ........
-- f-
.......
-.......
-
-0 r !:j rn en o

~ ...... (II to I
CD l>
-
2
4
6
8
0
-..
--
• 0
h
- -r--- -- ......
......... I'""-..
........ .......
EARTHQUAKE 10
Nourning Spring 7·5
Meeberrie 8·2
Curve for n "5
Focal depth in kilometres
-. - - -.- - - - - -.- -10
EPICENTRAL DISTANCE (km) 100 500
I-~ --. ..... ~ -- --....... --... i"'o..
........ - ........ ... ........ --- ........... ::--, ......
.......... - ......... ....... " ........ " ...... ..... .......... -... ::--.. r-... ' ... .... -. :- ...........
.......... .......... -.... I'.. """ K. , ~ ..........h=40 , '" ........ .... " ....... ,
..... h =/0 ..... "- , ....... ....... ... ....... ',...
"- "- ..... 1'""', ........ """ . " ....... ........ , , ~ '.
....... , '" ........ , "- ."0.. .... "- ..,...
........ , ~
........ ....... \. ........ h=20 .... ~ ....... '- '\ " ....... . ...
....... , , , ....... " .... ....... " "'" ..... - ..... .....,
"h=3 ........ ....... , , ....... ........ ....... ....... .....
........ " .... ..... ........ , ....
["0.. ........ .......
" ....... i"'-.. I"'- .......
.... ....... :..... , ....... I". ..... .....
'" " ..... , I"- " "- I' "- .......
.......
" ~ ....... I".
........
....... , ..... .....
10-I VERSUS EPICENTRAL DISTANCE (Moster curves ofter Ergin· 1969f
'-
- -1000
-
-
'1J r ~ ITI m 0"