interaction metrics | 3...
TRANSCRIPT

107 SE Washington St. Suite 162, Portland, OR 97214 | 503.205.7003 | InteractionMetrics.com | © Interaction Metrics 2017
Interaction Metrics’ Point-of-Purchase (POP) Survey Study sparked 3 innovations:
Innovation #1: Interaction Metrics shed light on serious methodological issues that plague the nations’ largest retailers. It’s likely these issues result from the fact that the majority of the retailers studied outsource their surveys to software vendors. The core competence of software companies is scalability based on repeatability, the scourge of excellent survey methodology. Meaningful customer listening requires a nuanced approach—an approach that’s usually not profitable for software vendors.
Innovation #2: Among researchers, Interaction Metrics opened up a discussion about POP survey design. Facilitating dialogue about best practices and standards, is one way that Interaction Metrics acts on its mission to improve customer experiences everywhere. Along these lines, Martha Brooke (founder) regularly contributes to CustomerThink, sometimes taking a controversial stand, but always with the goal of encouraging CX practitioners to prioritize accuracy and actionability. Her syndicated articles include:- Shortfalls of Net Promoter Score- CX: Use the Right Metrics- 6 Steps to Improve Your Customer Satisfaction Survey
Innovation #3: With its POP Survey Study, Interaction Metrics provided CX practitioners a way to evaluate their own surveys, and even put a metric on them. The survey criteria that’s at the back of the Study Report, shows how each survey in the study was evaluated and is a tool for evaluating the quality of other VoC surveys. The criteria consists of 4 dimensions (Ease of Access, Customer Engagement, Information Accuracy, and Branding Cues), which are comprised of 15 elements, including Survey Length, Use of Jargon, and Question Relevance, among others.
11-27-2017Interaction Metrics | 3 Innovations
Document Contents:
2-14 POP Survey Report
15 POP Report Summary

503.205.7003InteractionMetrics.com
107 SE Washington St., Suite 162, Portland, OR 97214
2016 FINDINGS REPORTTHE STATE OF POP RETAIL SURVEYSIn 2016, Interaction Metrics conducted an independent, first-of-its kind study of retailer point-of-purchase (POP) surveys. Without ties (financial or otherwise) to the retailers in this study, we were simply interested to know: were surveys as prevalent as they seemed and are POP surveys conducted in a way that’s worth the customer’s time?
We found that yes, the vast majority of the nation's largest retailers, run POP surveys. We also found that the vast majority of these surveys are critically flawed. They don’t engage customers and they don’t collect accurate information. So, if you’re a customer wondering whether there’s value in taking that survey (usually found at the bottom of your receipt)—there’s not. Retailers’ POP surveys, at the time of this study, are not used for meaningful customer listening.

107 SE Washington St. Suite 162, Portland, OR 97214 | 503.205.7003 | InteractionMetrics.com | © Interaction Metrics 2017
Background
The largest retailers issue millions of point-of-purchase surveys everyday. This study sought to evaluate two main areas of survey quality:
1. Information Accuracy: the ability to collect unbiased, representative data about customers experiences.
2. Engagement: the ability to demonstrate appreciation for customers’ time and opinions.
In 2014, Bruce Temkin, chairman of the CXPA, observed that most companies do not get nearly the value they should from their customer listening efforts—and he pointed to poor survey design as a critical problem area. This study confirms this observation.
Results Summary
We found that while most large retailers offer point-of-purchase surveys, only a few (like 7-Eleven) succeed at capturing quality information. Most (like Wal-Mart and Kohl’s) use leading questions and biased language.
In fact, no survey was fully engaging and scientific. One was ok, 12 were of poor quality, and the majority (28) were useless—not worth the time they took to complete.
There is tremendous opportunity forretailers to improve their point-of-purchase surveys and, in the process, improve the quality of their customer listening overall.
Customer satisfaction surveys are a billion-dollar industry, and this study highlights how easy and common it is to produce a flawed survey. Therefore, the findings should be considered by any company with a customer listening program.

107 SE Washington St. Suite 162, Portland, OR 97214 | 503.205.7003 | InteractionMetrics.com | © Interaction Metrics 2017
We studied the 51 largest retailers of the 2015 National Retail Federation (NRF) list, omitting supermarket and membership stores. The actual surveys were collected between June 23 and July 27, 2016.
• 41 (80%) ran surveys we could score.
• 8 (16%) ran randomly distributed surveys which we were not offered.
• 2 (4%) did not run surveys, as indicated both by employees and the company website.
• To obtain surveys, we made purchases in stores and online. For online purchases, we waited until the product arrived, then took any survey offered. For in-store purchases, we took surveys shortly after the visit.
• We answered all survey questions as neutrally as possible.
• If the survey URL was broken, we tried a total of 3 times over the course of the day, then scored it 0 (3 retailers had broken links: Rite Aid, Ross, and Walgreen’s).
• When the NRF listed a holding company (e.g. YUM! Brands), we chose one subsidiary retailer to study (in this case, Taco Bell).
• The surveys were evaluated using objective scoring criteria (see the back of this report for details).
Protocols
Since companies collect feedback in various ways, we defined a survey as a customer questionnaire with two or more questions about the customer’s experience.
Definition
51 Retailers NRF Largest Retailers
NRF Rank Company Sector
1 Wal-Mart Stores Department/Discount
2 The Kroger Co. (Fred Meyer) Department/Discount
4 The Home Depot Home Improvement
5 Walgreens Drugstore
6 Target Department/Discount
8 Lowe's Companies Home Improvement
9 Amazon.com Department/Discount
12 McDonald's Fast Food
14 Apple Store / iTunes Tech/Telcomm
16 Rite Aid Drugstore
18 Sears Holdings Department/Discount
19 TJX (TJ Maxx) Department/Discount
21 YUM! Brands (Taco Bell) Fast Food
23 Kohl's Department/Discount
24 Dollar General Department/Discount
28 Ace Hardware Home Improvement
31 Doctor's Assoc. / Subway Fast Food
32 Nordstrom Department/Discount
33 Gap Specialty Retail
34 AT&T Wireless Tech/Telcomm
35 J.C. Penney Co. Department/Discount
39 7-Eleven Specialty Retail
40 Ross Stores Department/Discount
41 Verizon Wireless Tech/Telcomm
43 Family Dollar Stores Department/Discount
46 Menards Home Improvement
48 Wendy's Fast Food
49 Burger King Worldwide Fast Food
50 Dollar Tree Department/Discount
53 Dunkin' Brands Group Fast Food
55 AutoZone Specialty Retail
56 Toys "R" Us Specialty Retail
58 O'Reilly Automotive Specialty Retail
59 DineEquity (Red Lobster) Restaurant
62 Dick's Sporting Goods Specialty Retail
64 Office Depot Specialty Retail
66 Good Neighbor Pharmacy Drugstore
67 Darden Restaurants (Applebee's) Restaurant
68 GameStop Specialty Retail
69 PetSmart Specialty Retail
73 Tractor Supply Co. Specialty Retail
7 CVS Caremark Drugstore
11 Best Buy Specialty Retail
15 Macy's Department/Discount
45 L Brands (Victoria's Secret) Specialty Retail
61 Sherwin-Williams Specialty Retail
63 Staples Specialty Retail
70 QVC Specialty Retail
71 Chick-fil-A Fast Food
42 Starbucks Fast Food
65 Dillard's Department/Discount

-101-34
-3000
214
1925
3536373839
414242
464747
5151515252
5859
61626363
6565
6871
74747576
85
-110-100 -90 -80 -70 -60 -50 -40 -30 -20 -10 0 10 20 30 40 50 60 70 80 90 100
Family DollarGap
Wal-MartRoss
Rite AidWalgreens
AceFred Meyer
Lowe'sGood Neighbor Pharmacy
AutoZoneRed LobsterMcDonald's
Tractor SupplyTJ Maxx
Dick'sWendy's
Office DepotDunkin' Donuts
JC PenneyKohl's
Dollar GeneralO'Reilly Automotive
AppleToys "R" UsBurger King
Taco BellMenards
AT&TPet Smart
TargetGamestop
AmazonDollar TreeNordstrom
Home DepotSubway
Applebee'sSears
Verizon7-Eleven
Surveys Ranked
The average survey scored 43 on a 100 point scale.
That’s a lot of useless data captured in unengaging ways.
GapFamily Dollar
Score Based on 15 Elements—See the Back of this Report
Wal-Mart -3
Family Dollar

107 SE Washington St. Suite 162, Portland, OR 97214 | 503.205.7003 | InteractionMetrics.com | © Interaction Metrics 2017
0
10
20
30
40
50
60
70
80
90
100
Ease of Access Branding Cues CustomerEngagement
Information Quality
EngagementWorth 35% of the survey quality score, engagement consists of 6 elements:• Thoughtful Welcome
• Use of Jargon
• Length
• Sets & Meets Expectations
• Progress Transparency
• Customization
Score
57
AccuracyWorth 50% of the survey quality score, accuracy consists of 6 elements:• Leading Questions
• Biased Language
• Double-Barreled Questions
• Title Neutrality
• Question Relevance
• Faulty Scales
Score69
AccessWorth 5% of the survey quality score, access measures how easy it is to locate and begin the survey.
Branding Worth 10% of the survey quality score, branding consists of 2 elements:• Style
• Spelling & Grammar
Score
67
Retailers’ surveys were weakest when it came to Accuracy—the most important aspect of survey design. And they scored best on Access—a less important aspect of survey design.
Score
27
Scores Broken Out
107 SE Washington St. Suite 162, Portland, OR 97214 | 503.205.7003 | InteractionMetrics.com | © Interaction Metrics 2017
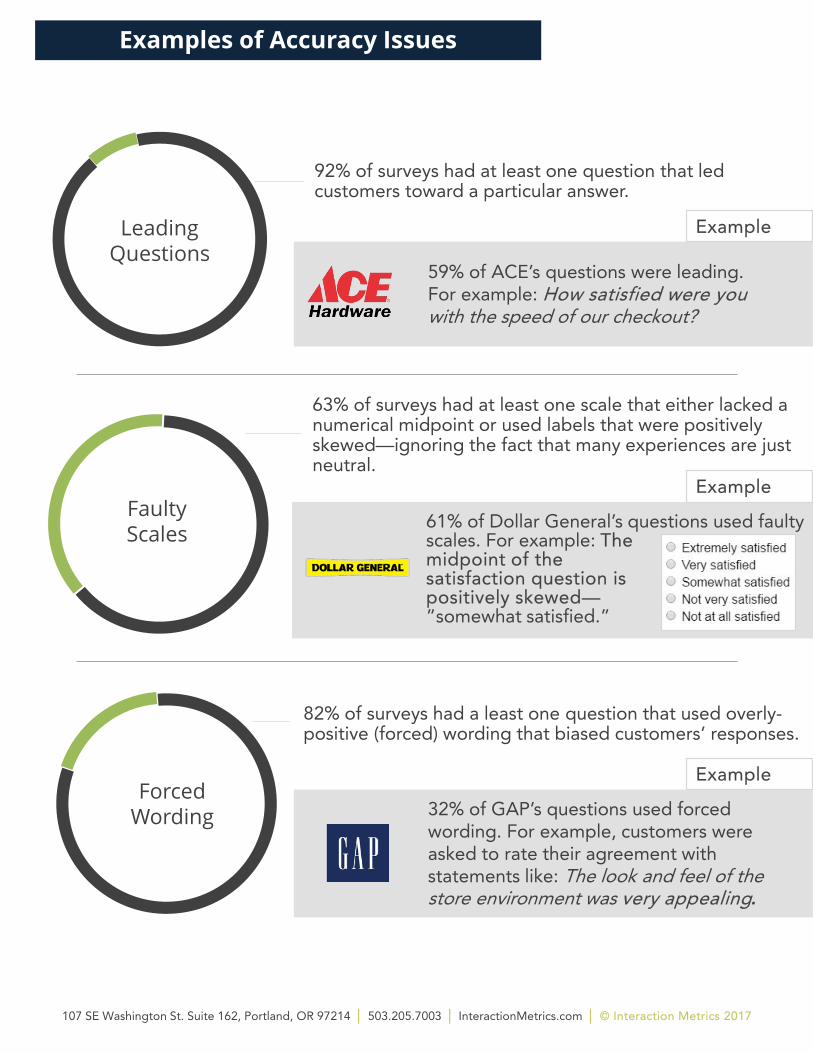
32% of GAP’s questions used forced wording. For example, customers were asked to rate their agreement with statements like: The look and feel of the store environment was very appealing.
61% of Dollar General’s questions used faulty scales. For example: The midpoint of the satisfaction question is positively skewed—”somewhat satisfied.”
59% of ACE’s questions were leading. For example: How satisfied were youwith the speed of our checkout?
63% of surveys had at least one scale that either lacked a numerical midpoint or used labels that were positively skewed—ignoring the fact that many experiences are just neutral.
82% of surveys had a least one question that used overly-positive (forced) wording that biased customers’ responses.
ForcedWording
Faulty Scales
Leading Questions
Example
Example
Example
92% of surveys had at least one question that led customers toward a particular answer.
Examples of Accuracy Issues

107 SE Washington St. Suite 162, Portland, OR 97214 | 503.205.7003 | InteractionMetrics.com | © Interaction Metrics 2017
Nordstrom advertised their survey as 2 minutes—yet it had 25 questions, and took 4-5 minutes to complete.
Walmart asked 4 introductory questions irrelevant to the customer’s experience, andrequired the input of 2 receipt codes. Plain and simple, that’s a hassle.
Setting Expectations
-1-0.9-0.8-0.7-0.6-0.5-0.4-0.3-0.2-0.100.10.20.30.40.50.60.70.80.91
0 10 20 30 40 50 60 700
Ease of Access
13% of surveys were excessively difficult to access.
8% set expectations for the survey’s length, but failed to meet them.
The average number of questions per survey was 23. Ironically, for many companies, the survey took longer than the shopping experience itself.
Example
Example
Survey Length
Number of Survey Questionsquestionsquestions
More Issues

107 SE Washington St. Suite 162, Portland, OR 97214 | 503.205.7003 | InteractionMetrics.com | © Interaction Metrics 2017
Survey Scoring CriteriaWe developed criteria so that we could objectively measure each survey consistently. For the company data, contact Interaction Metrics [email protected]

107 SE Washington St. Suite 162, Portland, OR 97214 | 503.205.7003 | InteractionMetrics.com | © Interaction Metrics 2017
Ease of Access5%
Use of Jargon
10%
Progress Transparency
2%
Thoughtful Welcome
5%
Customization5%
Length10%
Sets/Meets Expectations
3%
Style10%
Double-Barreled Questions
7%
Question Relevance
5% Forced Wording
10%
Title Neutrality
3%
FaultyScales10%
Leading Questions
15%
Spelling, Grammar & Distancing Cues (Subtractive)
Criteria | Weighting
ENGAGEMENT 35%
BRANDING 10% ACCURACY50%
ACCESS5%

107 SE Washington St. Suite 162, Portland, OR 97214 | 503.205.7003 | InteractionMetrics.com | © Interaction Metrics 2017
Leading Questions | 15 points:Does the question use phrasing or sentence structure that prompts for a positive or negative response? EXAMPLE: “How satisfied were you…” assumes the customer is satisfied in the first place.
Rules(-3) For each leading question.
(Full points) All questions use non-leading phrasing and sentence structure.
NOTE: “What is the likelihood…” is NOT a leading question. “How likely are you…” IS a leading question.
Forced Wording | 10 points:Does the question use positive or negative adjectives to describe the topic? EXAMPLE: “friendly” or “excellent service.”
Rules(-1) For each question with non-neutral language.
(Full points) All questions use neutral language.
NOTE: This is difficult to score but we generally decided that non-neutral language included overly flowery or loaded terms that were out of sync with how a customer would normally talk about a product or experience in a given industry.
Double-Barreled Questions | 7 points:Does the question ask about more than one topic, making it difficult to know what the customer really thinks about each?
Rules(-2) For each double-barreled question.
(Full points) All questions ask about one topic only.
Title Neutrality | 3 points:Does the survey title use positive or negative language? EXAMPLE: “Satisfaction Survey” rather than “Customer Survey.”
Rules(-3) The title uses non-neutral language.
(Full points) The title uses neutral language.
Question Relevance | 5 points:Does the question possibly not apply to every customer, yet requires a response without including an N/A option?
Rules(-2) For each required question that asks about situations the customer might not have experienced and doesn’t allow for a N/A answer.
(Full points) All required questions apply to every survey respondent, OR include an N/A option.
Faulty Scales | 10 points:Does the question use an unbalanced scale with an even number of response options, and thus no neutral midpoint? EXAMPLE: A 1-10 has an even number of response options, so “5” has 4 numbers before it and 5 numbers after it.
Rules(-2) For each question that has an unbalanced or otherwise faulty scale. The starting anchor should be 0 and the midpoint exactly half of the end point. The anchor words are inversely related and not skewed in any direction.
(Full points) All scales are balanced with a neutral midpoint.
ACCURACY
How We Scored: Accuracy

107 SE Washington St. Suite 162, Portland, OR 97214 | 503.205.7003 | InteractionMetrics.com | © Interaction Metrics 2017
Welcoming | 5 points: Do the survey invitation and welcome page show appreciation for the customer’s time and opinions?
Rules(-5) The invitation (such as on a receipt) and welcome page are both generic and unengaging, showing no appreciation for the customer and their feedback. EXAMPLE: Tell us what you think!
(-2) The invitation OR welcome page shows appreciation for the customer, OR both are partially there and lack a clear hand-off. EXAMPLE: We value your opinion, etc.
(Full points) Both the invitation and welcome page show appreciation for the customer.
NOTE: Does not include incentive.
Use of Jargon | 10 points:Do the questions use insider terms and company jargon that could be unclear to customers?
Rules(-10) More than one question uses insider terms or jargon. Customers have to parse apart what the questions mean.
(-5) One question uses insider terms or jargon. The customer would have to spend a little time thinking about what the question meant.
(Full points) All questions use clear terms any customer would immediately understand.
NOTE: Does not include names of products or rewards programs.
Survey Length | 10 points:How many questions does the survey have?
Rules(-10) Over 15 questions.
(-5) 8 to 15 questions.
(Full points) 7 questions or fewer.
NOTE: When there are questions like “Rate your satisfaction with…” and then a list of 10 items to rate, each item in the list counts as one question. Question count starts after receipt information is entered.Question count stops at “can we ask you a few more questions” OR when asking for sweepstakes information.
ENGAGEMENT
How We Scored: Engagement

107 SE Washington St. Suite 162, Portland, OR 97214 | 503.205.7003 | InteractionMetrics.com | © Interaction Metrics 2017
Customization | 5 points:Does the survey use dynamic logic to customize the questions, making it more conversational?
Rules(-5) All questions are standard and generic. There is no evidence of dynamic logic.
(Full points) At least one question relates or refers to information from a prior answer.
Sets/Meets Expectations | 3 points:Does the survey set expectations for how long it will take, and then fulfill that promise?
Rules(-3) The survey does not set expectations, OR fails to meet them by more than 2 questions or 1 minute.
(Full points) The survey clearly sets and meets expectations.
NOTE: Default to full points if the survey is all on one screen or page, and requires minimal scrolling.
Progress Transparency | 2 points:Does the survey have a clear progress bar showing X/X questions completed, or a percentage?
Rules(-2) There is no progress bar.
(Full points) There is a progress bar.
NOTE: Default to full points if the survey is all on one screen or page, and requires minimal scrolling.
ENGAGEMENT
How We Scored: Engagement
107 SE Washington St. Suite 162, Portland, OR 97214 | 503.205.7003 | InteractionMetrics.com | © Interaction Metrics 2017
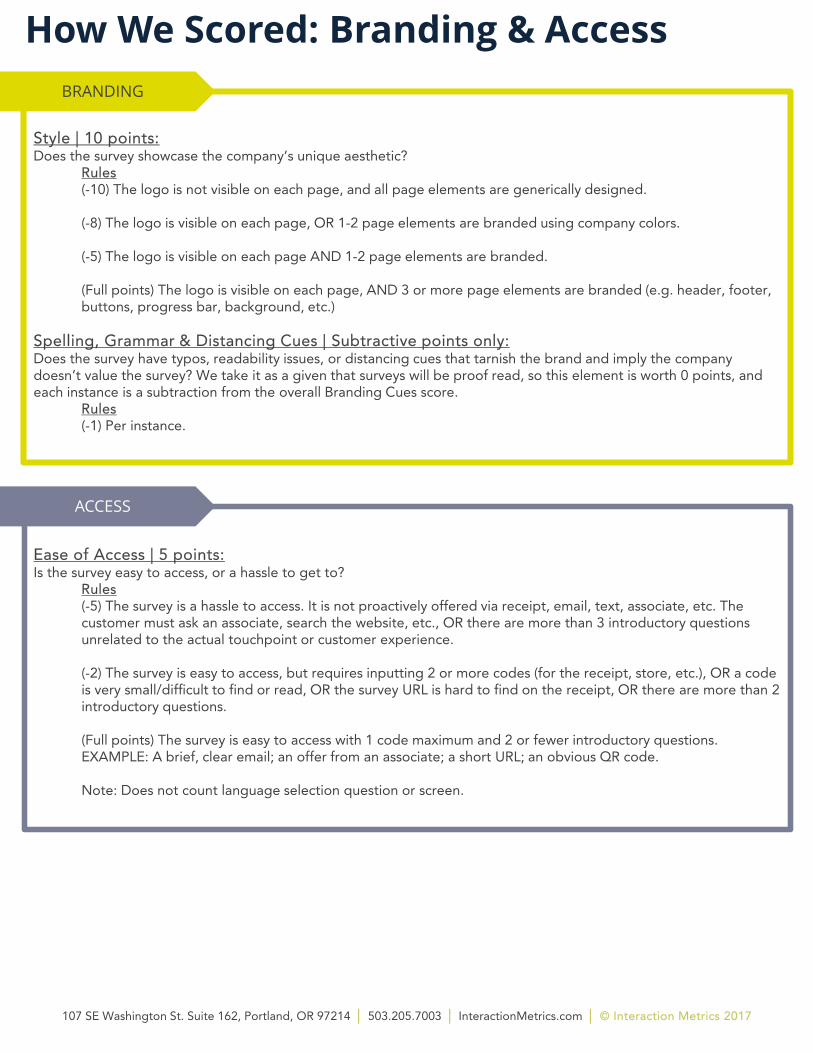
Style | 10 points: Does the survey showcase the company’s unique aesthetic?
Rules(-10) The logo is not visible on each page, and all page elements are generically designed.
(-8) The logo is visible on each page, OR 1-2 page elements are branded using company colors.
(-5) The logo is visible on each page AND 1-2 page elements are branded.
(Full points) The logo is visible on each page, AND 3 or more page elements are branded (e.g. header, footer, buttons, progress bar, background, etc.)
Spelling, Grammar & Distancing Cues | Subtractive points only: Does the survey have typos, readability issues, or distancing cues that tarnish the brand and imply the company doesn’t value the survey? We take it as a given that surveys will be proof read, so this element is worth 0 points, and each instance is a subtraction from the overall Branding Cues score.
Rules(-1) Per instance.
BRANDING
Ease of Access | 5 points: Is the survey easy to access, or a hassle to get to?
Rules(-5) The survey is a hassle to access. It is not proactively offered via receipt, email, text, associate, etc. The customer must ask an associate, search the website, etc., OR there are more than 3 introductory questions unrelated to the actual touchpoint or customer experience.
(-2) The survey is easy to access, but requires inputting 2 or more codes (for the receipt, store, etc.), OR a code is very small/difficult to find or read, OR the survey URL is hard to find on the receipt, OR there are more than 2 introductory questions.
(Full points) The survey is easy to access with 1 code maximum and 2 or fewer introductory questions. EXAMPLE: A brief, clear email; an offer from an associate; a short URL; an obvious QR code.
Note: Does not count language selection question or screen.
ACCESS
How We Scored: Branding & Access

107 SE Washington St. Suite 162, Portland, OR 97214 | 503.205.7003 | InteractionMetrics.com | © Interaction Metrics 2017
Portland, Oregon: In the first study of its kind, Interaction Metrics examined the point-of-purchase surveys for 51 of the largest retailers (companies like Lowe’s, Ace Hardware and Wal-Mart). The study found that 96% of these retailers run point-of purchase (customer satisfaction) surveys—and 98% of the surveys were useless or poor.
The two most common problems were: biased questions and a failure to engage with customers and show customer listening.
Methodology: Interaction Metrics had shoppers buy products from retailers, save their survey receipts and take the surveys. Then, Interaction Metrics’ analysts used a set of 15 criteria to evaluate the surveys. The criteria included survey length, question relevance, and question bias.
A few of the specific findings:
• With 23 questions on average, the surveys were excessively long.
• 32% of all questions were leading—they prompted customers to give a positive answer.
• 7-Eleven had the best survey—it was just 13 questions, none of which were leading, irrelevant, or used forced wording. In addition, 7-Eleven’s satisfaction survey was customized to the customer’s feedback, whether that was a complaint, compliment or question.
Martha Brooke, Chief Analyst and Founder of Interaction Metrics states, “To get value from their surveys, the largest retailers need to strengthen their survey science—and show they are genuinely interested in listening to their customers and finding out about the experiences they had.”
This study highlights how easy it is to produce a flawed survey. These findings should be considered by any company with a customer feedback program.
The retailers selected for the Point-of-Purchase Survey Study were the top retailers by 2015 sales volume as determined by the National Retail Federation (NRF), omitting supermarkets and membership stores. The surveys were collected between June 23 and July 27, 2016. Interaction Metrics was able to evaluate the surveys for 41 of the 51 retailers: 2 didn’t run a survey and 8 administered their survey randomly, and the Interaction Metrics’ shopper was not among those randomly chosen.
POP Survey Study | In Brief
Interaction Metrics dramatically boosts the value of customer feedback programs, customer service evaluations, and customer service skills coaching. Get facts. And insights. Deliver a great customer experience.
About Interaction Metrics:
InteractionMetrics.com InteractionMetrics.com/insights/