interactions between thalassia testudinum banks...
TRANSCRIPT
1
INTERACTIONS BETWEEN THALASSIA TESTUDINUM BANKS EX KOENIG AND HALIMEDA INCRASSATA (ELLIS) LAMOUROUX AND THEIR EFFECTS ON
CARBON DYNAMICS IN A SHALLOW, TROPICAL LAGOON
By
SAVANNA C. BARRY
A THESIS PRESENTED TO THE GRADUATE SCHOOL OF THE UNIVERSITY OF FLORIDA IN PARTIAL FULFILLMENT
OF THE REQUIREMENTS FOR THE DEGREE OF MASTER OF SCIENCE
UNIVERSITY OF FLORIDA
2012

2
© 2012 Savanna C. Barry

3
To my mom and dad
4
ACKNOWLEDGMENTS
I thank my parents for always being supportive and helping me believe in my
abilities and I thank my grandmother for inspiring me to be a stronger woman. I also
thank all of the University of Virginia graduate students that inspired me to pursue
graduate education. I appreciate logistical support provided by Morgan Edwards, Neil
van Niekerk, Sky Notestein, Darlene Saindon, and Jessica Frost. I thank the staff of the
Little Cayman Research Center for additional logistical support during the course of the
study. I am grateful to the Cayman Islands Department of Environment and Marine
Conservation Board for making this work possible. I also thank my advisory committee
for guiding me through this experience and fostering my growth as a scientist.
5
TABLE OF CONTENTS page
ACKNOWLEDGMENTS .................................................................................................. 4
LIST OF TABLES ............................................................................................................ 6
LIST OF FIGURES .......................................................................................................... 7
LIST OF ABBREVIATIONS ............................................................................................. 8
ABSTRACT ..................................................................................................................... 9
CHAPTER
1 INTRODUCTION .................................................................................................... 11
2 METHODS AND MATERIALS ................................................................................ 15
Study Site ............................................................................................................... 15 Densities of Macrophytes and Site Selection .......................................................... 15 Water Quality Measurements ................................................................................. 16
Field Procedures and Laboratory Processing ......................................................... 16 Metrics of Production and Calcification ................................................................... 18
Statistical Analyses ................................................................................................. 19
3 RESULTS ............................................................................................................... 24
Densities of Macrophytes and Site Selection .......................................................... 24 Water Chemistry ..................................................................................................... 24 Rates of Production ................................................................................................ 25
Calcification ............................................................................................................ 27
4 DISCUSSION ......................................................................................................... 38
LIST OF REFERENCES ............................................................................................... 42
BIOGRAPHICAL SKETCH ............................................................................................ 47
6
LIST OF TABLES
Table page 3-1 Results of PERMANOVA analyses based on environmental data. ..................... 30
3-2 Results of ANOVAs based on rates of production for Thalassia testudinum and Halimeda incrassata. ................................................................................... 32
3-3 Back-transformed mean rates of production for Thalassia testudinum shoots and Halimeda incrassata thalli ............................................................................ 32
3-4 Results of ANOVA based on rates of production for Halimeda incrassata standardized to initial sizes of thalli .................................................................... 34
3-5 Mean rates of production for Halimeda incrassata standardized to initial sizes of thalli ................................................................................................................ 34
3-6 Results of ANOVAs based on rates of areal production for Thalassia testudinum and Halimeda incrassata. ................................................................. 34
3-7 Mean areal rates of production for Thalassia testudinum and Halimeda incrassata standardized to initial sizes of thalli ................................................... 35
3-8 Results of ANOVAs based ratios of calcium carbonate content to organic matter in thalli of Halimeda incrassata ................................................................ 37
3-9 Mean and back-transformed mean ratios of calcium carbonate content to organic matter in thalli of Halimeda incrassata. .................................................. 37
3-10 Results of an ANOVA based proportions of calcium carbonate in thalli of Halimeda incrassata ........................................................................................... 37
3-11 Back-transformed mean proportions of calcium carbonate in thalli of Halimeda incrassata ........................................................................................... 37

7
LIST OF FIGURES
Figure page 2-1 Location of Little Cayman Island and Grape Tree Bay. ...................................... 21
2-2 Halimeda incrassata morphological characteristics. ........................................... 22
2-3 Regressions for inorganic and organic content versus total dry weight of Halimeda incrassata as determined by acidification and ashing......................... 23
3-1 Plot of Halimeda incrassata thalli density against Thalassia testudinum shoot density for the sites chosen to represent treatments .......................................... 29
3-2 Mean dissolved oxygen concentrations (mg L-1) among treatments on a 24-hour basis. .......................................................................................................... 30
3-3 Mean pH levels by treatment .............................................................................. 31
3-4 Back-transformed mean rates of production. ...................................................... 33
3-5 Mean areal rates of production. .......................................................................... 36

8
LIST OF ABBREVIATIONS
A-D Anderson-Darling test for normality
B-F Brown-Forsythe test for homoscedacity
CaCO3 Calcium carbonate
CL Confidence limit
CO2 Carbon dioxide
CO32- Carbonate ion
DO Dissolved oxygen
DW Dry weight
H+ Hydrogen ion
HHLT High Halimeda, Low Thalassia
LHHT Low Halimeda, High Thalassia
MHMT Medium Halimeda, Medium Thalassia
OA Ocean acidification
OM Organic matter
SD Standard deviation
9
Abstract of Thesis Presented to the Graduate School of the University of Florida in Partial Fulfillment of the Requirements for the Degree of Master of Science
INTERACTIONS BETWEEN THALASSIA TESTUDINUM BANKS EX KOENIG AND
HALIMEDA INCRASSATA (ELLIS) LAMOUROUX AND THEIR EFFECTS ON CARBON DYNAMICS IN A SHALLOW, TROPICAL LAGOON
By
Savanna C. Barry
August 2012
Chair: Thomas K. Frazer Major: Fisheries and Aquatic Sciences
Ocean acidification poses a serious threat to a broad suite of calcifying organisms.
Scleractinian corals and calcareous algae that occupy shallow, tropical waters around
the globe are vulnerable to global changes in ocean chemistry because they already are
subject to stressful and variable carbonate dynamics at the local scale. For example,
net heterotrophy increases carbon dioxide concentrations, and pH varies with diurnal
fluctuations in photosynthesis and respiration. Few researchers, however, have
investigated the possibility that carbon dioxide consumption during photosynthesis by
non-calcifying photoautotrophs, such as seagrasses, can ameliorate deleterious effects
of ocean acidification on sympatric calcareous algae. Naturally occurring variations in
the density of seagrasses and associated calcareous algae provide an ecologically
relevant test of the hypothesis that diel fluctuations in water chemistry driven by cycles
of photosynthesis and respiration within seagrass beds create microenvironments that
enhance macroalgal calcification. In Grape Tree Bay off Little Cayman Island BWI, we
quantified net production and characterized calcification for thalli of the calcareous
green alga Halimeda incrassata growing in beds of Thalassia testudinum with varying
10
shoot densities. Results indicated that individual H. incrassata thalli were ~6% more
calcified in dense seagrass beds. On an areal basis, however, far more calcium
carbonate was produced by H. incrassata in areas where seagrasses were less dense
due to higher rates of production. In addition, diel pH regimes in vegetated and
unvegetated areas were not significantly different, suggesting a high degree of water
exchange and mixing throughout the lagoon. These results suggest that, especially in
well-mixed lagoons, carbonate production by calcareous algae may be more related to
biotic interactions between seagrasses and calcareous algae than to seagrass-
mediated changes in local water chemistry.

11
CHAPTER 1 INTRODUCTION
Acidification of the world’s oceans generated by a global rise in carbon dioxide
(CO2) emissions represents a major ecological concern (Skirrow and Whitfield, 1975;
Kleypas et al., 1999). As atmospheric CO2 is absorbed by seawater, it alters the
carbonate cycle primarily leading to lower concentrations of carbonate ions (CO32-) and
higher concentrations of hydrogen ions (H+), which translates into lower pH values
(McClendon, 1917, 1918; Guinotte and Fabry, 2008; Doney et al., 2012). These
changes in concentrations of CO32- and H+ potentially interfere with sequestration of
calcium carbonate (CaCO3) by a broad suite of marine organisms that use this
compound to form skeletons, shells, otoliths, statoliths and other key structures
(Kleypas et al., 1999; Hoegh-Guldburg et al., 2007; Kroeker et al., 2009).
In shallow tropical waters, corals and calcareous algae, two key ecosystem
components that sequester CaCO3, are particularly vulnerable to an altered equilibrium
because they already are subjected to other stresses mediated by a varying carbonate
cycle. For example, diurnal fluctuations in seawater chemistry are driven by the relative
intensities of photosynthesis and respiration, and heterotrophic conditions dominate,
which means release of CO2 through remineralization of organic matter exceeds
consumption of CO2 during photosynthesis (Andersson and Mackenzie, 2012). Other
shallow-water organisms, however, are expected to be less affected and some may, in
fact, benefit from changes in ocean chemistry driven by increased atmospheric CO2.
Seagrasses, for example, are likely to experience an increase in production, especially
in those areas where dissolved inorganic carbon is presently limiting (e.g., Palacios and
Zimmerman, 2007). Moreover, seagrasses, which consume CO2 during photosynthesis,
12
may serve to mediate and possibly ameliorate the deleterious effects of ocean
acidification on a large number of sympatric species (Semesi et al., 2009a, 2009b;
Kleypas et al., 2011).
In shallow water, including tropical seas, seagrass beds represent a predominant
source of production and serve also as a key structural habitat (Duarte et al., 2010). In
fact, seagrass beds are among the most productive habitats on the planet, with global
estimates of seagrass production on the order of 21–101 Tg C y-1 depending on
estimates of seagrass areal coverage (Duarte et al., 2010). Thus, seagrasses are more
productive than North American wetlands and undisturbed Amazonian rainforest
(Duarte et al., 2010). Seagrasses can exist as extensive beds or a complex mosaic of
patches, and they provide both refuge and a habitat for foraging used by myriad
species, including a large number of commercially and recreationally important finfishes
(Orth et al., 1984; Thayer et al., 1984; Virnstein and Howard, 1987). In addition,
seagrasses sequester carbon, stabilize bottom sediments, dampen wave action, reduce
turbulence, increase water clarity and reduce shoreline erosion (Duarte, 1995;
Fourqurean, et al. 2012).
In the tropics, seagrasses often coexist with other ecologically important
photoautotrophs (Littler and Littler, 1988, 1994; Dahlgren and Marr, 2004; Fong and
Paul, 2011). Among the co-occurring species, representatives of the phylum
Chlorophyta, i.e., green algae, are common (Littler, 1976; Littler and Littler, 1988, 1994).
Calcareous green algae such as Halimeda spp. and Penicillus spp. are among the most
cosmopolitan and well-studied species because they perform a number of important
ecological functions. For example, photosynthetic production by Halimeda incrassata in
13
Florida Bay was 20% of that attributed to the dominant seagrass, Thalassia testudinum
(Davis and Fourqurean, 2001). In addition, several species of Halimeda serve as a key
food source and are, in fact, a preferred food of several coral reef fishes (Overholtzer
and Motta, 1999; Mantyka & Bellwood, 2007). More importantly, however, Halimeda
spp. and other calcareous algae play critical roles in the formation of CaCO3 (Vroom et
al., 2003; Nelson, 2009). In the Bahamas, for example, rates of CaCO3 production by
Halimeda spp. are nearly equal to rates estimated for coral reefs (Milliman & Droxler,
1996). In fact, green, calcifying algae can account for 35–40% of the carbonates
generated in shallow, tropical marine waters, with corals and red, coralline algae
accounting for an additional 50–55% (Lee and Carpenter, 2001). Furthermore,
Halimeda spp. are known to be important producers of coarse-grained sediments in the
Bahamas and elsewhere (Freile et al., 1995), and spalling of calcified plates is a primary
mechanism by which sand is formed in tropical seas (Littler, 1976; Littler and Littler,
1988, 1994).
Seagrasses and calcified algae are known to compete for nutrients in oligotrophic
waters, with competition reported to favor seagrasses (see Davis and Fourqurean,
2001). Few investigators, however, have studied potential positive interactions whereby
seagrasses might promote the existence and co-occurrence of key calcareous algae by
raising pH, which alters the stoichiometry of calcification by enhancing release of
hydrogen ions formed as byproducts (Semesi et al., 2009a, 2009b). In this scenario, diel
fluctuations in water chemistry within seagrass beds driven by cycles of photosynthesis
and respiration are hypothesized to create microenvironments that are conducive to the
calcification of algae (Semesi et al., 2009a, 2009b). Sites with varying densities of both
14
seagrasses and rhizophytic, calcareous algae provide opportunities to test this
hypothesis in situ.
In this study, sites with varying densities of T. testudinum and H. incrassata were
identified in Grape Tree Bay off Little Cayman Island. At these sites, production for T.
testudinum and production and calcification for H. incrassata were measured to
determine if significant interactions existed. Measures of key water quality parameters
provided data to assess potential causes of variations in production or calcification.
Thus, the calcification rate of H. incrassata in dense seagrass was hypothesized to be
increased relative to sites with less seagrass due to a favorable pH regime.
15
CHAPTER 2 METHODS AND MATERIALS
Study Site
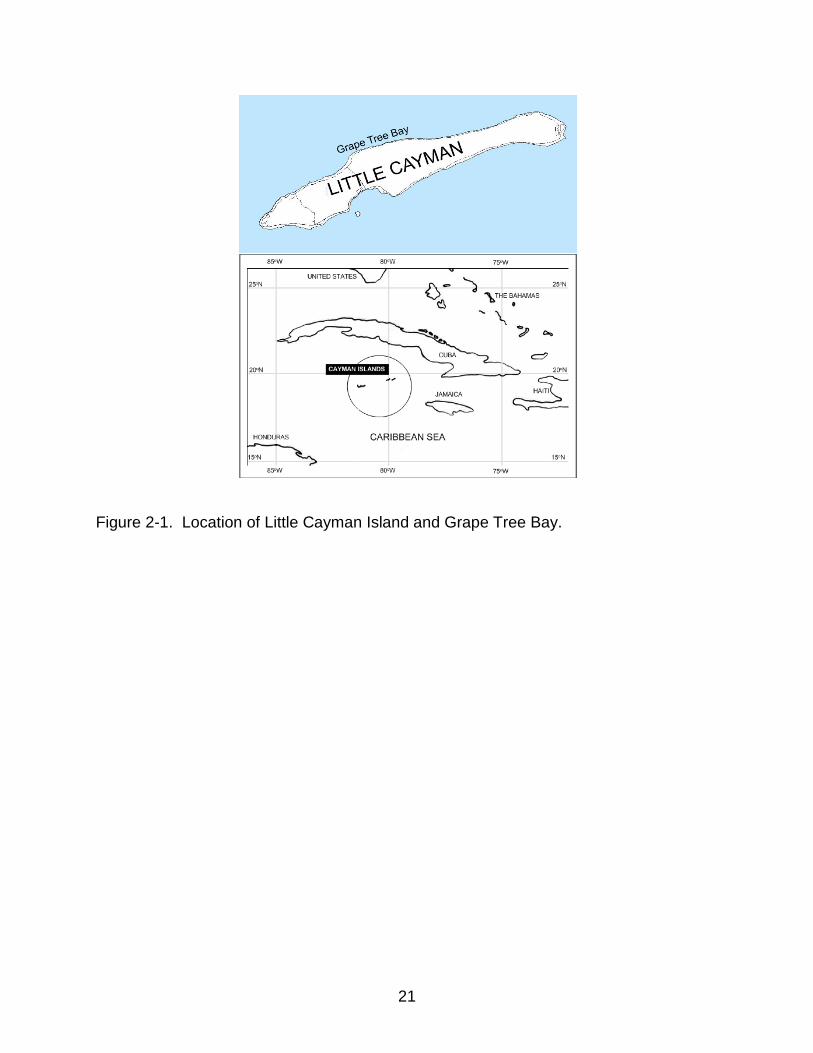
Grape Tree Bay is a shallow lagoon on the north coast of Little Cayman Island,
BWI (Figure 2-1). A mixed seagrass and calcareous algal assemblage extends offshore
for approximately 60–100 m where it is bounded by a fringing reef. The fringing reef
delineates the seaward edge of Grape Tree Bay, which spans approximately 1.6 km of
shoreline. Based on data from a National Oceanic and Atmospheric Administration
Integrated Coral Reef Observation Network (ICON) station located just outside the
fringing reef, ocean temperature ranged from 28.0 °C to 30.6 °C and salinity averaged
35.8‰ (range 33.0 to 36.1‰) during the period of this study.
Densities of Macrophytes and Site Selection
To select sites with differing densities of T. testudinum and H. incrassata, benthic
vegetation in Grape Tree Bay was surveyed within a systematic grid. Forty points along
the shoreline were marked with GPS waypoints, and these points, which were
separated by 10 m, served as the origins for transects that ran offshore to the fringing
reef. Along each transect, a 0.25-m2 quadrat was placed at the 10-m mark and also at
every successive 10-m mark. Thus, 6–10 quadrats were sampled along each transect
depending on the distance between the shoreline and the fringing reef.
Within each quadrat, thalli of all algal taxa were counted. Subsequently, a 0.0625-
m2 subquadrat was thrown within each 0.25-m2 quadrat. Within each subquadrat,
shoots of all seagrass species were counted separately.
Sites for measurements of production for T. testudinum and production and
calcification for H. incrassata were selected by comparing densities of shoots and thalli.
16
The goal was to identify sets of three replicate experimental sites that spanned the
natural gradient in Grape Tree Bay. Three levels, termed treatments, were targeted, i.e.,
i) low density Halimeda combined with high density Thalassia (LHHT), ii) medium
density Halimeda and Thalassia (MHMT), and iii) high density Halimeda combined with
low density Thalassia (HHLT). At each experimental site, shoot and thalli counts were
repeated to verify densities were appropriate.
Water Quality Measurements
During the course of the field experiment, a YSI 600R data sonde with a YSI 650
MDS data logger was deployed at each of the nine treatment sites and at an additional
three unvegetated sites for at least 24 h. Temperature, salinity, dissolved oxygen, and
pH were recorded at 30-min intervals throughout each 24-h period. Measurements were
taken at a height of approximately 5 cm above the sediment to document conditions
within the seagrass canopy, when seagrass was present.
Field Procedures and Laboratory Processing
Two methods were used to measure production for T. testudinum and H.
incrassata. Thalassia testudinum production was measured by the leaf marking
technique (Zieman, 1974), with a needle forced through all blades in a shoot just above
their basal meristems and marked shoots allowed to grow in situ for 7 d. Halimeda
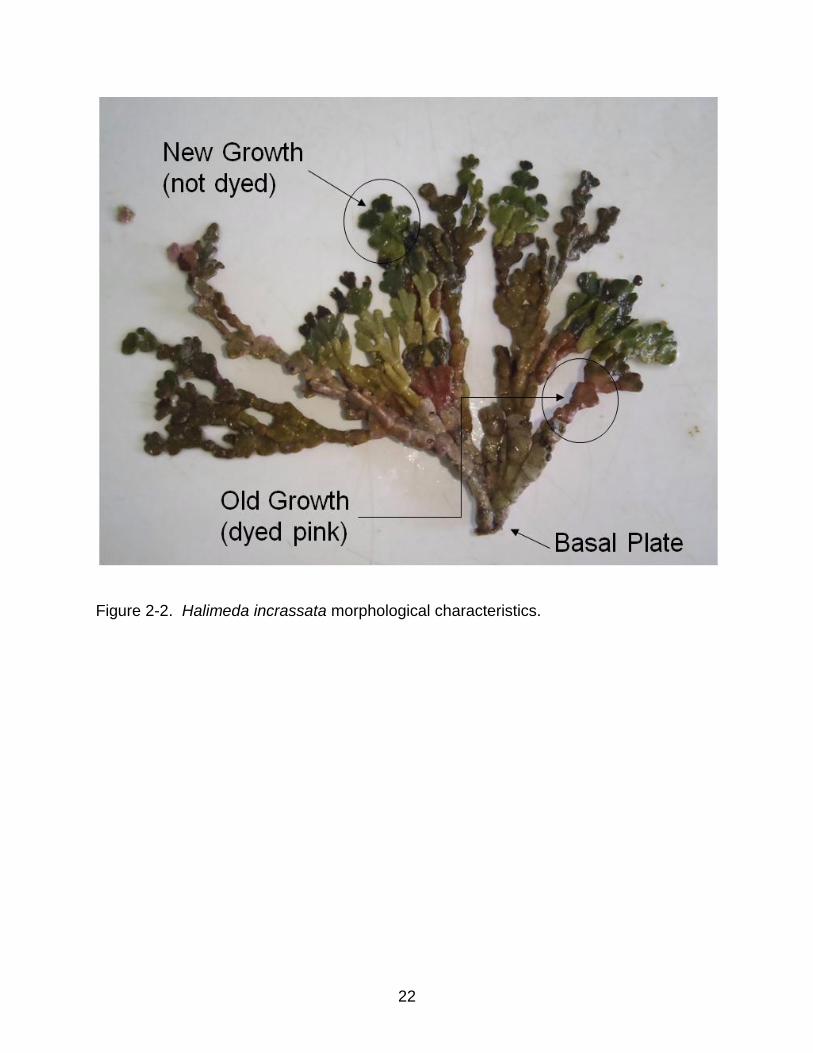
incrassata production was measured using incorporation of Alizarin-S dye (Figure 2-2;
Wefer, 1980; Multer, 1988; Davis & Fourqurean, 2001; Vroom et al., 2003). The dye
stained existing tissue red, which allowed new (unstained) algal biomass to be
distinguished from tissue present at the start of the 7-d, in situ growth period. When
possible, 40 shoots and 25 thalli were marked within each experimental site; however,
some sites did not contain 25 thalli, so all available thalli were marked.
17
After 7 d, marked macrophytes were harvested. Halimeda incrassata thalli were
harvested by removing their basal holdfasts from the sediment. Thalassia testudinum
shoots were harvested at the node where the short shoot meets the rhizome so that the
entire sheath was retained. Individual algal thalli and seagrass shoots were placed in
separate, labeled bags and frozen until processing.
Individual T. testudinum shoots were rinsed in freshwater, scraped with a razor
blade to remove epiphytic material and briefly rinsed in freshwater again. For each
blade with a hole, new and old growth were separated by cutting through the hole with a
razor blade. Unmarked blades were considered new growth. Old and new materials
were placed in separate borosilicate glass vials and dried at 50 °C to a constant weight.
Individual Halimeda incrassata thalli were rinsed with freshwater using the focused
stream from a wash bottle to remove sand, debris, and epiphytic material. New or
unstained plates and old, stained plates were separated, counted, placed into tared
borosilicate glass vials, and dried at 50 °C to a constant weight.
In addition to production, calcification was quantified for H. incrassata to evaluate
the influence of biogeochemical effects mediated by T. testudinum. Two methods were
available to differentiate organic and inorganic content of H. incrassata: acidification and
ashing. Three consecutive exposures of dried algal tissue to 5% hydrochloric acid
removed the inorganic (CaCO3) fraction of plates (Vroom et al., 2003). This method
relied on acid penetrating all of the tissue, which could be problematic for large samples
(S. Barry, pers. obs.). The alternative method subjected algal tissue to 500 °C for 3 h in
a muffle furnace to remove the organic fraction of plates (Davis and Fourqurean, 2001).
To test the methods, a known number of H. incrassata plates with a known dry weight
18
were ashed and a similar set of plates were acidified. Dry weights of the resulting
material yielded estimates of both organic and inorganic carbon for each set of samples.
Analyses of covariance (ANCOVAs) tested for significant relationships between weights
of organic matter and CaCO3 fractions and total dry weights, with method being a
covariate. The ANCOVAs indicated a significant difference between the methods for
both organic matter and CaCO3 fractions (organic: F1, 19 = 9.84, p = 0.005; CaCO3: F1, 19
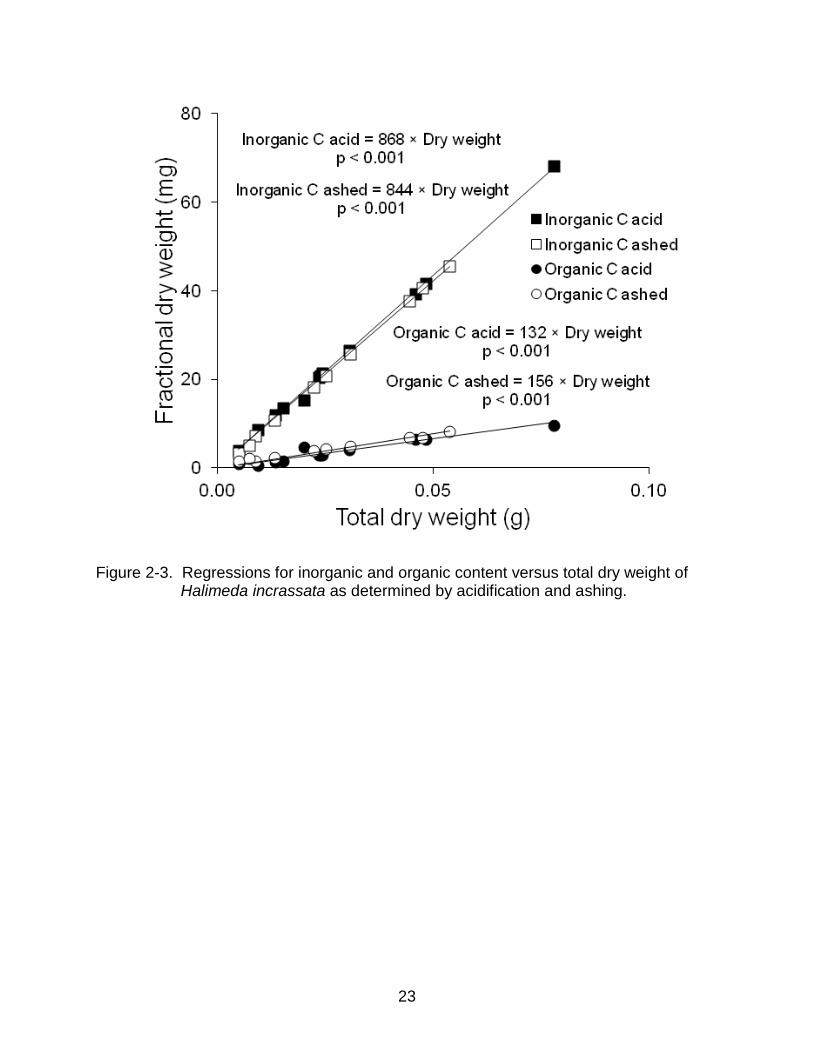
= 9.84, p = 0.005). Linear regressions fitted to each set of measurements showed that
acidification yielded higher estimates of CaCO3 content and lower estimates of organic
matter content (Figure 3-3), potentially due to loss of organic content, which has been
reported previously (Roberts et al., 1973; Byers et al., 1978). Therefore, ashing was
chosen as the method for this study.
After consistent dry weights were obtained, samples of H. incrassata plates were
transferred into pre-weighed aluminum dishes, ashed for 3 h at 500 °C, and allowed to
cool before being weighed to determine quantities of inorganic carbon, i.e., CaCO3. For
the purposes of this study, contributions from silicon and other trace elements that might
have remained after ashing were considered negligible. Organic content was estimated
by subtracting the inorganic fraction from the total, pre-ashing dry weight of a sample.
Metrics of Production and Calcification
Dry weights (DW) were used to calculate metrics that would elucidate interactions
between H. incrassata and T. testudinum. Metrics characterized production for T.
testudinum and H. incrassata, as well as calcification for H. incrassata.
Dry weights yielded measures of production for shoots of T. testudinum (mg DW
shoot-1 d-1) and thalli of H. incrassata (mg DW thallus-1 d-1) directly, and multiplying
these individual growth rates by the appropriate mean density generated estimates of
19
net areal production (mg DW m-2 d-1). For H. incrassata, dry weights of thalli, organic
tissue and CaCO3 were measured separately; therefore, relative rates of production
were calculated by standardizing increases in these weights to their initial values.
Relative rates of production provided insights into growth performance.
Calcification for H. incrassata thalli was characterized by the ratio of CaCO3 to
organic matter because the photosynthetic activity of living, organic tissue is responsible
for calcification of the thallus (Borowitzka and Larkum, 1976a, 1977; de Beer and
Larkum, 2001). Estimates were calculated separately for entire thalli and new growth.
Statistical Analyses
Statistically significant differences in water chemistry at experimental and
unvegetated sites were assessed with multivariate permutation analyses of variance
(PERMANOVAs, Anderson et al., 2008). Analyses were based on range standardized
mean water temperatures, salinities, dissolved oxygen concentrations and hydrogen ion
concentrations calculated over 30-min intervals throughout the 24-h periods. Due to
anomalies caused by two days of bad weather, data from one MHMT site and one
LHHT site were excluded from the analysis. In total, three PERMANOVAs were
performed, with the first examining differences among treatments (LHHT, MHHT, HHLT
and unvegetated sand) for all environmental data. Two other analyses examined
differences among treatments for i) hydrogen ion concentrations across full 24-h periods
and ii) hydrogen ion concentrations during daytime periods in order to assess changes
driven by photosynthesis.
Univariate analyses of variance (ANOVAs) were used to evaluate growth rates
and data characterizing calcification. Normality was evaluated with Anderson-Darling
tests, and homoscedasticity was evaluated with Brown-Forsythe tests. If necessary,
20
data were transformed to meet the assumptions. Areal production was analyzed with a
one-way ANOVA with treatment considered a fixed effect. All other growth rates and
calcification data were analyzed using nested ANOVAs with treatment as a fixed effect
and sites nested within treatments. Ryan-Einot-Gabriel-Welsch Q multiple comparisons
were employed to discern differences among treatments. For unbalanced ANOVAs, the
Tukey-Kramer adjustment was applied to generate degrees of freedom for the post hoc
tests.
21
Figure 2-1. Location of Little Cayman Island and Grape Tree Bay.
22
Figure 2-2. Halimeda incrassata morphological characteristics.
23
Figure 2-3. Regressions for inorganic and organic content versus total dry weight of Halimeda incrassata as determined by acidification and ashing.
24
CHAPTER 3 RESULTS
Densities of Macrophytes and Site Selection
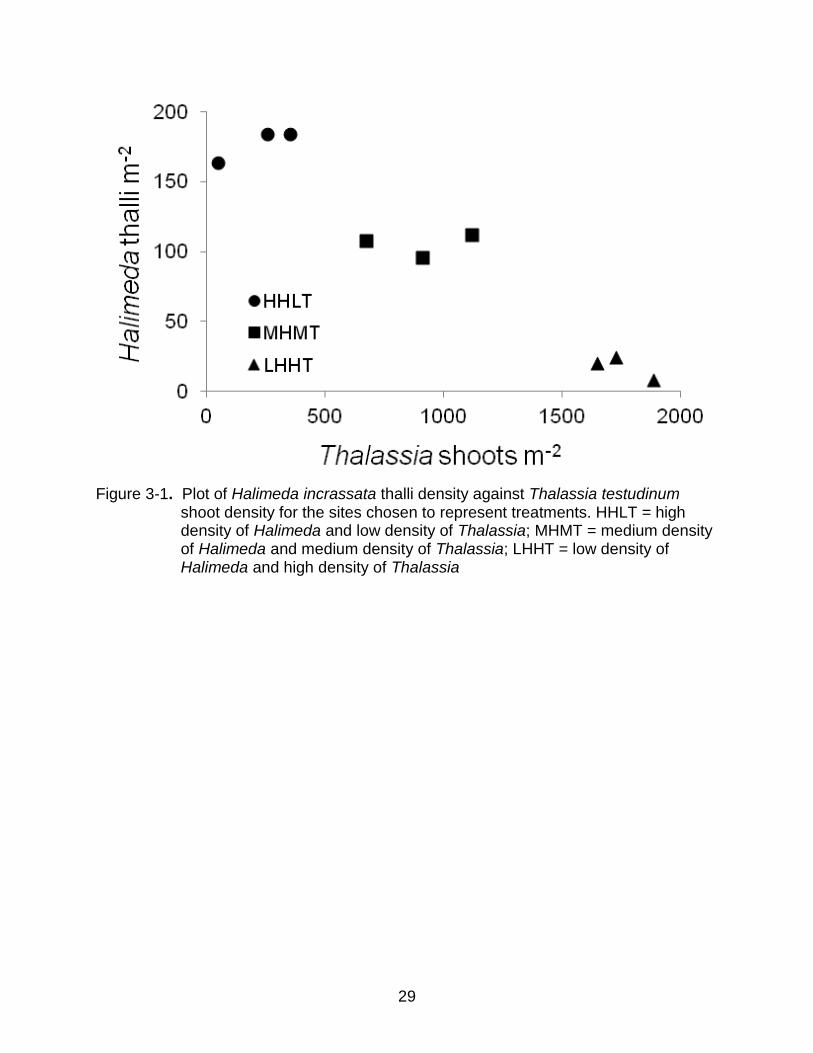
The maximum shoot density of T. testudinum in Grape Tree Bay was greater than
that of H. incrassata thalli by approximately an order of magnitude. The shoot density of
T. testudinum ranged from 0 to 1900 shoots m-2 whereas the H. incrassata thallus
density ranged from 0 to 246 thalli m-2. Sites for measurements of productivity for T.
testudinum and H. incrassata were selected to span the density gradient in Grape Tree
Bay. A total of nine sites were chosen, with three replicate sites in each of three
treatments (Low Halimeda, High Thalassia = LHHT; Medium Halimeda, Medium
Thalassia = MHMT; and High Halimeda, Low Thalassia = HHLT; Figure 3-1).
Water Chemistry
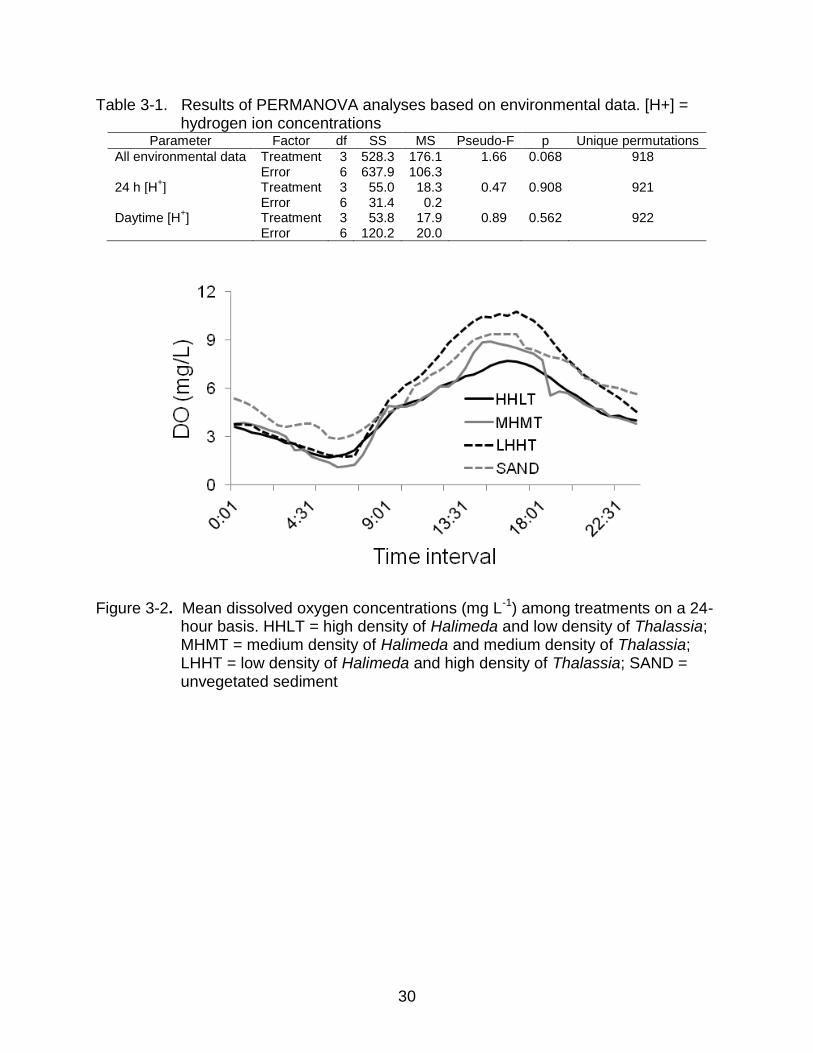
PERMANOVAs indicated that the time series for all environmental variables and
hydrogen ion concentrations did not differ significantly among treatments (Table 3-1).
Thus, macrophytes at all sites were subjected to similar temporal variation in
environmental conditions. Although not significantly different, patterns in DO and pH
were of interest because they could potentially affect interactions between T.
testudinum and H. incrassata.
The highest mean DO concentrations were recorded during the day for the LHHT
treatment sites (Figure 3-2), which would be expected given photosynthesis by T.
testudinum. Also, as expected, sites where seagrass was less dense (including
unvegetated sites) exhibited less pronounced diel variations in DO concentrations
(Figure 3-2).
25
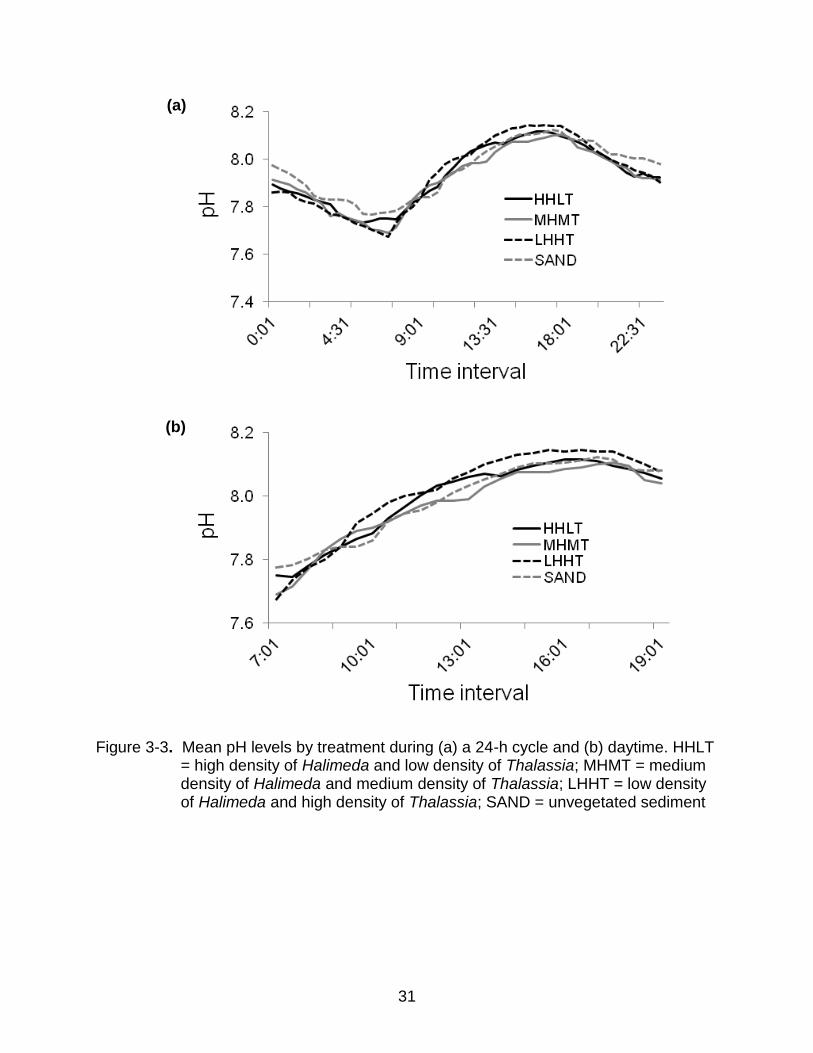
Diel patterns for pH paralleled those of DO (Figure 3-3); increasing throughout the
daylight hours and decreasing at night. The dense seagrass treatment (LHHT) exhibited
a higher mean pH during the day and a slightly lower mean pH at night (Figure 3-3a).
As a consequence, H. incrassata thalli within the LHHT treatment experienced, on
average, slightly more variation in pH within a 24-h period than did thalli in other
treatments. The mean pH values in the dense seagrass (LHHT) areas ranged from 7.68
at night to 8.15 during the daytime. These pH values corresponded to a mean [H+] of
21.17 nmol L-1 seawater at night and a mean of 7.22 nmol L-1 seawater during the day,
a 98.3% difference over the course of approximately 12 h. In addition, pH for the LHHT
treatment increased faster during the morning, which resulted in a slightly higher value
than that in the other treatments by about 10:00 AM (Figure 3-3b). These patterns in pH
were driven by metabolic activity.
Rates of Production
Rates of T. testudinum production (mg DW shoot-1 d-1) were homoscedastic and
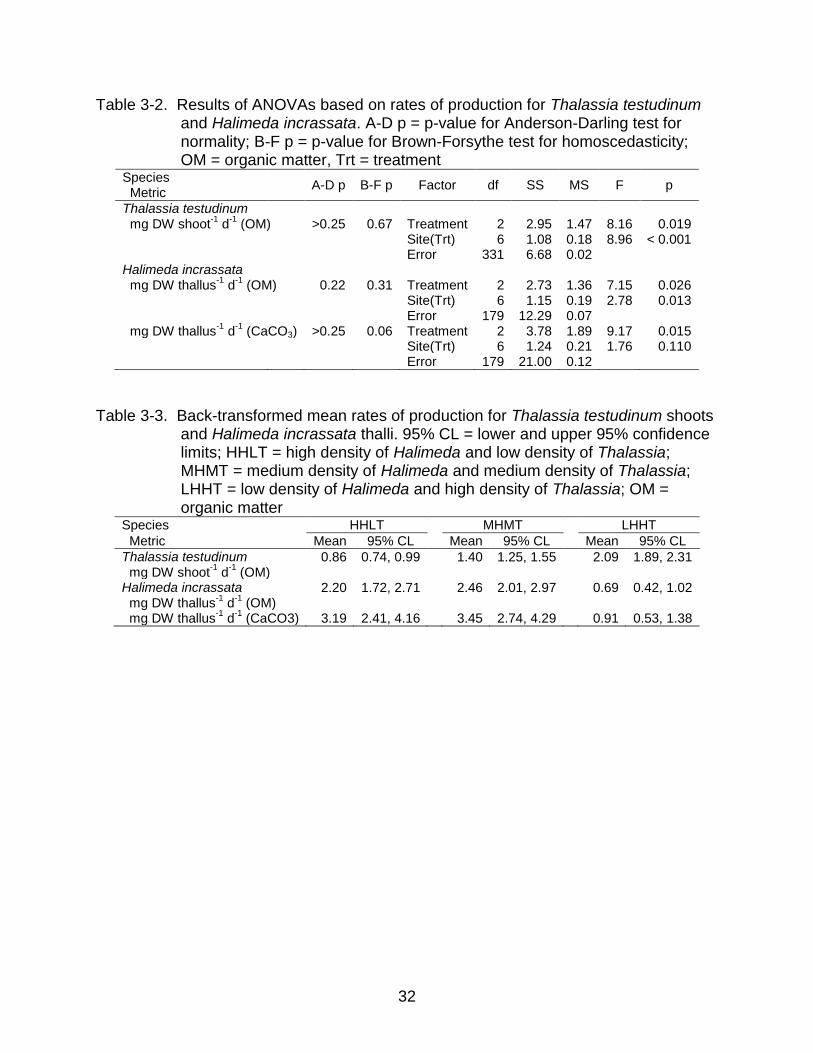
normal when log-transformed (Table 3-2). Production rates differed significantly among
treatments and also among sites (Table 3-2). Variation among treatments was of
greater biological interest, and post hoc, pairwise comparisons, with a Tukey-Kramer
adjustment, showed that T. testudinum production increased with increasing shoot
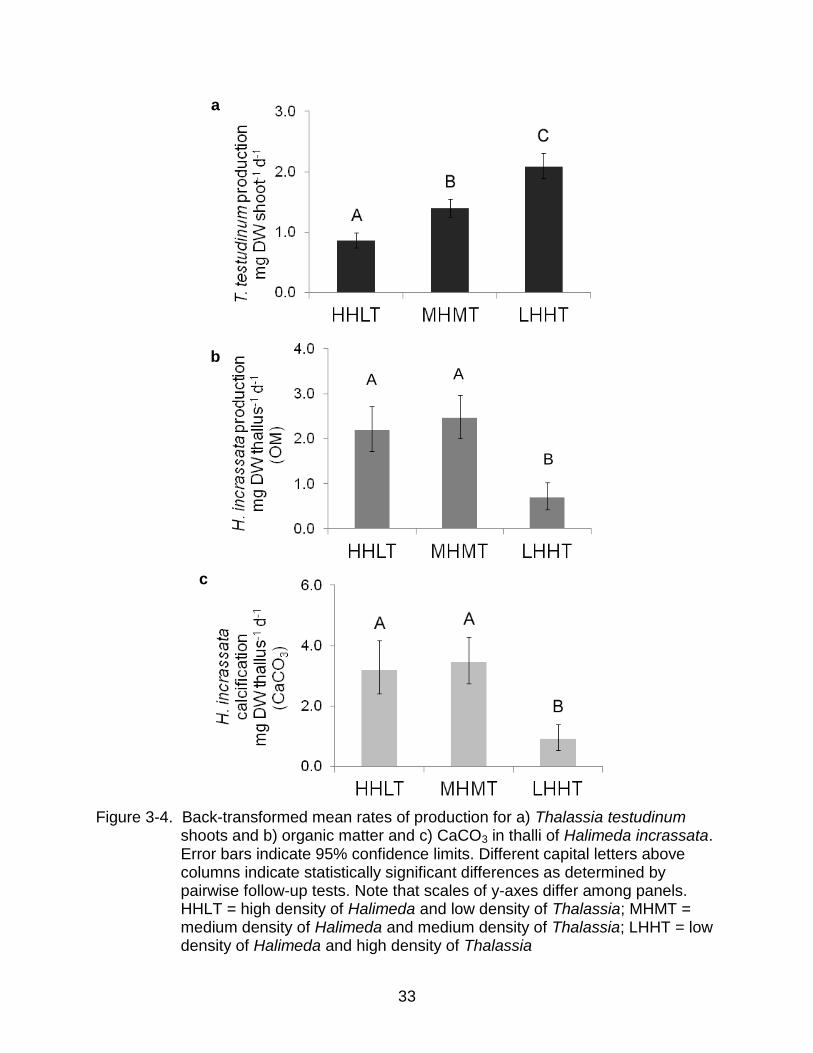
density (Table 3-3). Shoots in the treatment with the highest density (LHHT) were ~2.4
times more productive than shoots in treatment with the lowest density (Figure 3-4a).
For H. incrassata, rates of production (mg DW thallus-1 d-1) in terms of both
organic material and CaCO3 were homoscedastic and normal (Table 3-2) after log-
transformation. Rates of production for organic and inorganic material differed among
treatments (Table 3-2). The rate at which organic matter was produced also varied

26
significantly among sites within treatments (Table 3-2), but these results were not
explored further. Post hoc, pair-wise comparisons showed that thalli produced organic
matter and CaCO3 at statistically equal rates in treatments with low and intermediate T.
testudinum density (HHLT and MHMT), and thalli produced significantly less of both
types of carbon d-1 in the treatment with the densest T. testudinum (LHHT). In fact, thalli
in the LHHT treatment were roughly 3.5 times less productive than thalli in other
treatments (Table 3-3; Figure 3-4b, c).
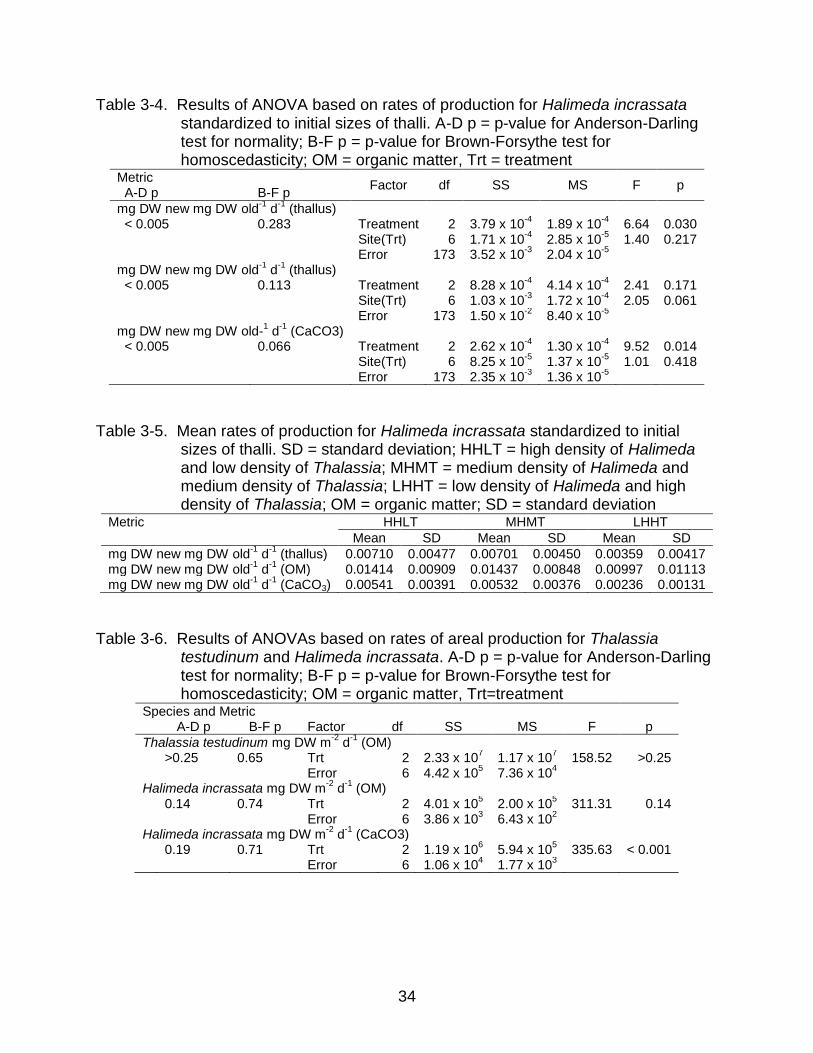
Growth rates for H. incrassata, whether standardized by total dry weight, organic
matter or CaCO3, were homoscedastic without transformation (Table 3-4). However,
after repeated attempts at transforming data, normality could not be achieved. The
untransformed data were analyzed, and results were interpreted with caution.
Standardized growth rates based on total weights and CaCO3 were significantly
different among treatments, but rates based on organic matter were not statistically
different (Table 3-4). Post hoc comparisons showed that mean standardized growth
rates of thalli in dense seagrass (LHHT) were lower than rates recorded for other
treatments in the case of total weight and CaCO3 (Table 3-5). The mean standardized
growth rate of thalli in dense seagrass treatments was 50% or 44% of that recorded for
thalli in other treatments when expressed versus total weight or CaCO3, respectively
(Table 3-5).
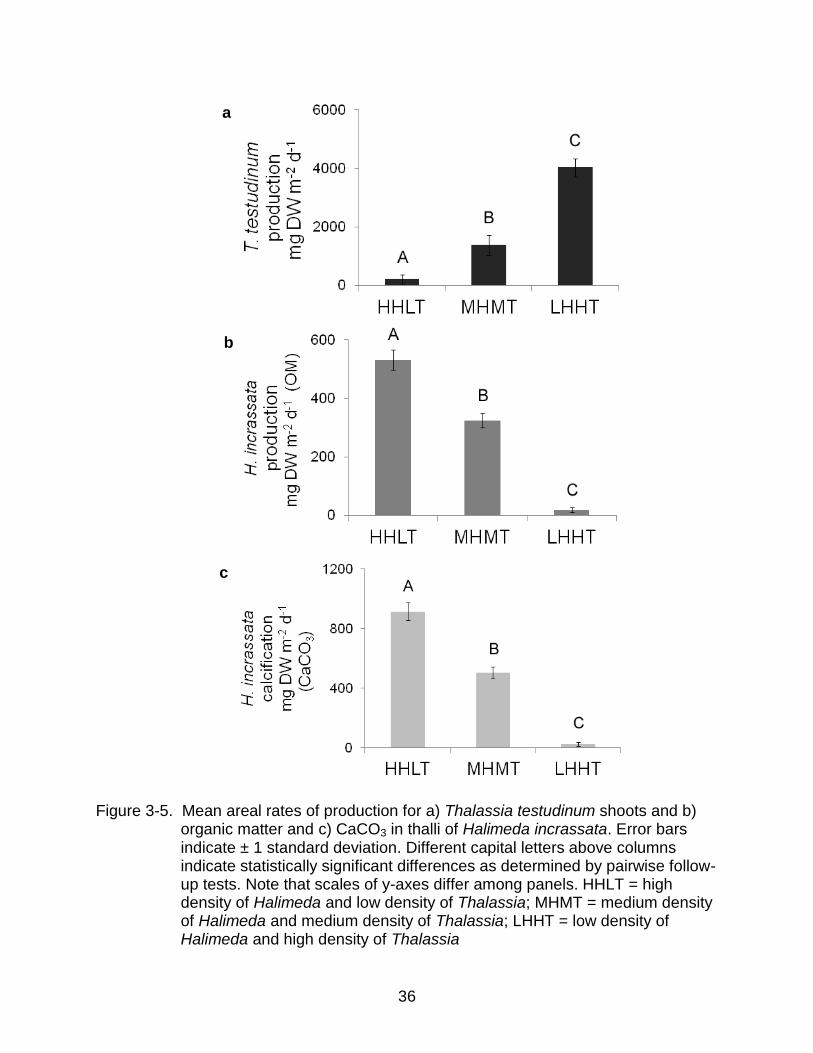
When rates of production for individual shoots and thalli were scaled to 1 m2 using
the mean number of individuals m-2 in a given treatment, the resulting rates of areal
production were homoscedastic and normal (Table 3-6). Areal production was
significantly different among treatments for T. testudinum shoots, H. incrassata organic
27
matter and H. incrassata CaCO3 content (Table 3-6). For T. testudinum, post hoc
multiple comparisons showed sites with dense seagrass yielded significantly greater
areal production and production decreased significantly with decreasing density (Figure
3-5a). Rates of areal production of organic matter and CaCO3 for H. incrassata
exhibited similar trends, with significant increases in production as density of T.
testudinum decreased (Figure 3-5b, c). Mean rates of areal production for T. testudinum
and H. incrassata spanned an order of magnitude (Table 3-7).
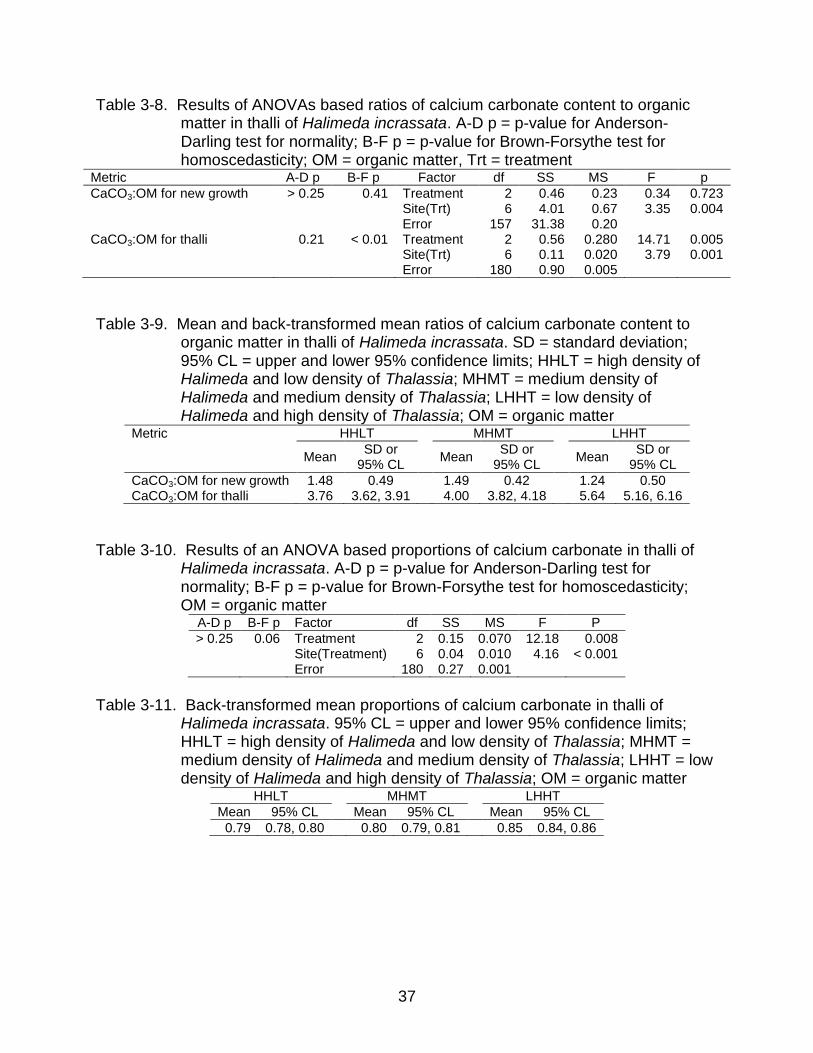
Calcification
Ratios of CaCO3 to organic material (CaCO3:OM) in the new growth of H.
incrassata were normal and homoscedastic (A-D and B-F test p > 0.05) without
transformation. These ratios were not significantly different among treatments, although
there was significant variation among sites within treatments (Table 3-8). Thus, the
CaCO3 content of new plates varied among thalli but did not differ consistently among
treatments.
Ratios of CaCO3:OM for whole thalli were normal after log-transformation, but the
data remained heteroscedastic so the results of the ANOVA were interpreted cautiously
(Table 3-8). Ratios of CaCO3:OM in whole thalli differed significantly among treatments
and among sites within treatments (Table 3-8). Post hoc multiple comparisons indicated
that thalli in the sites with the densest seagrass (LHHT) had higher CaCO3:OM ratios
than thalli in other treatments (Table 3-9), which indicated that relatively more
calcification had occurred.
The proportions of whole thalli comprising CaCO3 were normal and homoscedastic
after arcsine-transformation (Table 3-10). Thalli from different treatments exhibited
significant differences in their CaCO3 content, and thalli from different sites within
28
treatments also differed significantly (Table 3-10). Post hoc multiple comparison tests,
with Tukey-Kramer adjustments, showed that thalli in the dense seagrass treatment
contained proportionately more CaCO3 than thalli in other treatments. Thalli growing in
dense seagrass were 5–6% more calcified than thalli growing in areas with sparse
seagrass (Table 3-11).
29
Figure 3-1. Plot of Halimeda incrassata thalli density against Thalassia testudinum
shoot density for the sites chosen to represent treatments. HHLT = high density of Halimeda and low density of Thalassia; MHMT = medium density of Halimeda and medium density of Thalassia; LHHT = low density of Halimeda and high density of Thalassia
30
Table 3-1. Results of PERMANOVA analyses based on environmental data. [H+] = hydrogen ion concentrations
Parameter Factor df SS MS Pseudo-F p Unique permutations
All environmental data Treatment 3 528.3 176.1 1.66 0.068 918 Error 6 637.9 106.3
24 h [H+] Treatment 3 55.0 18.3 0.47 0.908 921
Error 6 31.4 0.2
Daytime [H
+] Treatment 3 53.8 17.9 0.89 0.562 922
Error 6 120.2 20.0
Figure 3-2. Mean dissolved oxygen concentrations (mg L-1) among treatments on a 24-hour basis. HHLT = high density of Halimeda and low density of Thalassia; MHMT = medium density of Halimeda and medium density of Thalassia; LHHT = low density of Halimeda and high density of Thalassia; SAND = unvegetated sediment
31
(a)
(b)
Figure 3-3. Mean pH levels by treatment during (a) a 24-h cycle and (b) daytime. HHLT = high density of Halimeda and low density of Thalassia; MHMT = medium density of Halimeda and medium density of Thalassia; LHHT = low density of Halimeda and high density of Thalassia; SAND = unvegetated sediment
32
Table 3-2. Results of ANOVAs based on rates of production for Thalassia testudinum and Halimeda incrassata. A-D p = p-value for Anderson-Darling test for normality; B-F p = p-value for Brown-Forsythe test for homoscedasticity; OM = organic matter, Trt = treatment
Species Metric
A-D p B-F p Factor df SS MS F p
Thalassia testudinum
mg DW shoot-1
d-1
(OM) >0.25 0.67 Treatment 2 2.95 1.47 8.16 0.019 Site(Trt) 6 1.08 0.18 8.96 < 0.001 Error 331 6.68 0.02
Halimeda incrassata
mg DW thallus
-1 d
-1 (OM) 0.22 0.31 Treatment 2 2.73 1.36 7.15 0.026
Site(Trt) 6 1.15 0.19 2.78 0.013 Error 179 12.29 0.07
mg DW thallus
-1 d
-1 (CaCO3) >0.25 0.06 Treatment 2 3.78 1.89 9.17 0.015
Site(Trt) 6 1.24 0.21 1.76 0.110 Error 179 21.00 0.12
Table 3-3. Back-transformed mean rates of production for Thalassia testudinum shoots and Halimeda incrassata thalli. 95% CL = lower and upper 95% confidence limits; HHLT = high density of Halimeda and low density of Thalassia; MHMT = medium density of Halimeda and medium density of Thalassia; LHHT = low density of Halimeda and high density of Thalassia; OM = organic matter
Species HHLT MHMT LHHT
Metric Mean 95% CL Mean 95% CL Mean 95% CL
Thalassia testudinum 0.86 0.74, 0.99 1.40 1.25, 1.55 2.09 1.89, 2.31 mg DW shoot
-1 d
-1 (OM)
Halimeda incrassata 2.20 1.72, 2.71 2.46 2.01, 2.97 0.69 0.42, 1.02
mg DW thallus-1
d-1
(OM)
mg DW thallus-1
d-1
(CaCO3) 3.19 2.41, 4.16 3.45 2.74, 4.29 0.91 0.53, 1.38
33
a
b
c
Figure 3-4. Back-transformed mean rates of production for a) Thalassia testudinum
shoots and b) organic matter and c) CaCO3 in thalli of Halimeda incrassata. Error bars indicate 95% confidence limits. Different capital letters above columns indicate statistically significant differences as determined by pairwise follow-up tests. Note that scales of y-axes differ among panels. HHLT = high density of Halimeda and low density of Thalassia; MHMT = medium density of Halimeda and medium density of Thalassia; LHHT = low density of Halimeda and high density of Thalassia
A A
B
34
Table 3-4. Results of ANOVA based on rates of production for Halimeda incrassata standardized to initial sizes of thalli. A-D p = p-value for Anderson-Darling test for normality; B-F p = p-value for Brown-Forsythe test for homoscedasticity; OM = organic matter, Trt = treatment
Metric A-D p
B-F p
Factor df SS MS F p
mg DW new mg DW old-1
d-1
(thallus)
< 0.005 0.283 Treatment 2 3.79 x 10⁻⁴
1.89 x 10⁻⁴
6.64 0.030 Site(Trt) 6 1.71 x 10
-4 2.85 x 10
-5 1.40 0.217
Error 173 3.52 x 10⁻³
2.04 x 10⁻⁵
mg DW new mg DW old-1
d-1
(thallus)
< 0.005 0.113 Treatment 2 8.28 x 10⁻⁴
4.14 x 10⁻⁴
2.41 0.171 Site(Trt) 6 1.03 x 10
-3 1.72 x 10
-4 2.05 0.061
Error 173 1.50 x 10⁻²
8.40 x 10⁻⁵
mg DW new mg DW old-1 d
-1 (CaCO3)
< 0.005 0.066 Treatment 2 2.62 x 10
-4 1.30 x 10
-4 9.52 0.014
Site(Trt) 6 8.25 x 10⁻⁵
1.37 x 10⁻⁵
1.01 0.418 Error 173 2.35 x 10
-3 1.36 x 10
-5
Table 3-5. Mean rates of production for Halimeda incrassata standardized to initial sizes of thalli. SD = standard deviation; HHLT = high density of Halimeda and low density of Thalassia; MHMT = medium density of Halimeda and medium density of Thalassia; LHHT = low density of Halimeda and high density of Thalassia; OM = organic matter; SD = standard deviation
Metric HHLT MHMT LHHT
Mean SD Mean SD Mean SD
mg DW new mg DW old-1
d-1
(thallus) 0.00710 0.00477 0.00701 0.00450 0.00359 0.00417 mg DW new mg DW old
-1 d
-1 (OM) 0.01414 0.00909 0.01437 0.00848 0.00997 0.01113
mg DW new mg DW old-1
d-1
(CaCO3) 0.00541 0.00391 0.00532 0.00376 0.00236 0.00131
Table 3-6. Results of ANOVAs based on rates of areal production for Thalassia testudinum and Halimeda incrassata. A-D p = p-value for Anderson-Darling test for normality; B-F p = p-value for Brown-Forsythe test for homoscedasticity; OM = organic matter, Trt=treatment
Species and Metric
A-D p B-F p Factor df SS MS F p
Thalassia testudinum mg DW m-2
d-1
(OM)
>0.25 0.65 Trt 2 2.33 x 10⁷ 1.17 x 10
7 158.52 >0.25
Error 6 4.42 x 10⁵ 7.36 x 10
4
Halimeda incrassata mg DW m
-2 d
-1 (OM)
0.14 0.74 Trt 2 4.01 x 10
5 2.00 x 10
5 311.31 0.14
Error 6 3.86 x 10³ 6.43 x 10
2
Halimeda incrassata mg DW m
-2 d
-1 (CaCO3)
0.19 0.71 Trt 2 1.19 x 10
6 5.94 x 10
5 335.63 < 0.001
Error 6 1.06 x 10⁴ 1.77 x 10
3
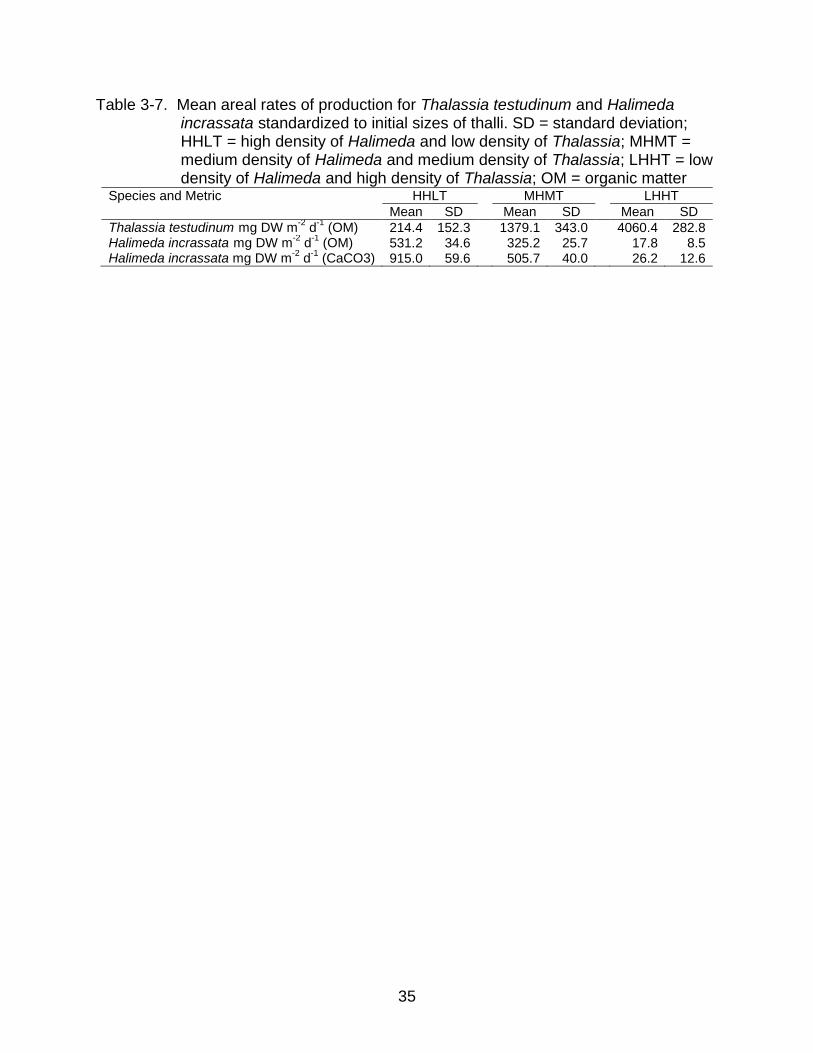
35
Table 3-7. Mean areal rates of production for Thalassia testudinum and Halimeda incrassata standardized to initial sizes of thalli. SD = standard deviation; HHLT = high density of Halimeda and low density of Thalassia; MHMT = medium density of Halimeda and medium density of Thalassia; LHHT = low density of Halimeda and high density of Thalassia; OM = organic matter
Species and Metric HHLT MHMT LHHT
Mean SD Mean SD Mean SD
Thalassia testudinum mg DW m-2
d-1
(OM) 214.4 152.3 1379.1 343.0 4060.4 282.8 Halimeda incrassata mg DW m
-2 d
-1 (OM) 531.2 34.6 325.2 25.7 17.8 8.5
Halimeda incrassata mg DW m-2
d-1
(CaCO3) 915.0 59.6 505.7 40.0 26.2 12.6
36
a
b
c
Figure 3-5. Mean areal rates of production for a) Thalassia testudinum shoots and b) organic matter and c) CaCO3 in thalli of Halimeda incrassata. Error bars indicate ± 1 standard deviation. Different capital letters above columns indicate statistically significant differences as determined by pairwise follow-up tests. Note that scales of y-axes differ among panels. HHLT = high density of Halimeda and low density of Thalassia; MHMT = medium density of Halimeda and medium density of Thalassia; LHHT = low density of Halimeda and high density of Thalassia
37
Table 3-8. Results of ANOVAs based ratios of calcium carbonate content to organic matter in thalli of Halimeda incrassata. A-D p = p-value for Anderson-Darling test for normality; B-F p = p-value for Brown-Forsythe test for homoscedasticity; OM = organic matter, Trt = treatment
Metric A-D p B-F p Factor df SS MS F p
CaCO3:OM for new growth > 0.25 0.41 Treatment 2 0.46 0.23 0.34 0.723 Site(Trt) 6 4.01 0.67 3.35 0.004 Error 157 31.38 0.20
CaCO3:OM for thalli 0.21 < 0.01 Treatment 2 0.56 0.280 14.71 0.005 Site(Trt) 6 0.11 0.020 3.79 0.001 Error 180 0.90 0.005
Table 3-9. Mean and back-transformed mean ratios of calcium carbonate content to organic matter in thalli of Halimeda incrassata. SD = standard deviation; 95% CL = upper and lower 95% confidence limits; HHLT = high density of Halimeda and low density of Thalassia; MHMT = medium density of Halimeda and medium density of Thalassia; LHHT = low density of Halimeda and high density of Thalassia; OM = organic matter
Metric HHLT MHMT LHHT
Mean SD or
95% CL Mean
SD or 95% CL
Mean SD or
95% CL
CaCO3:OM for new growth 1.48 0.49 1.49 0.42 1.24 0.50 CaCO3:OM for thalli 3.76 3.62, 3.91 4.00 3.82, 4.18 5.64 5.16, 6.16
Table 3-10. Results of an ANOVA based proportions of calcium carbonate in thalli of Halimeda incrassata. A-D p = p-value for Anderson-Darling test for normality; B-F p = p-value for Brown-Forsythe test for homoscedasticity; OM = organic matter
A-D p B-F p Factor df SS MS F P
> 0.25 0.06 Treatment 2 0.15 0.070 12.18 0.008 Site(Treatment) 6 0.04 0.010 4.16 < 0.001 Error 180 0.27 0.001
Table 3-11. Back-transformed mean proportions of calcium carbonate in thalli of
Halimeda incrassata. 95% CL = upper and lower 95% confidence limits; HHLT = high density of Halimeda and low density of Thalassia; MHMT = medium density of Halimeda and medium density of Thalassia; LHHT = low density of Halimeda and high density of Thalassia; OM = organic matter
HHLT MHMT LHHT
Mean 95% CL Mean 95% CL Mean 95% CL
0.79 0.78, 0.80 0.80 0.79, 0.81 0.85 0.84, 0.86
38
CHAPTER 4 DISCUSSION
Predicting the potential impact of ocean acidification on organisms that rely on
CaCO3 requires an understanding of their responses to local variations in factors
affecting the carbonate cycle and physiological carbon dynamics. For example,
seawater chemistry in shallow, tropical lagoons tends to vary across 24-h periods
because rates of photosynthesis and respiration vary. Furthermore, seagrasses and
sympatric macroalgae interact ecologically in positive and negative ways. By measuring
in situ rates of production and calcification at sites with different densities of T.
testudinum and H. incrassata, this study contributes insights into the relative importance
of biotic and abiotic factors at the local scale.
Biotic interactions between T. testudinum and H. incrassata include facilitation and
competition. Halimeda incrassata and other rhizophytic algae can successfully colonize
and persist in unstable, nutrient-poor sediments due to their ability to anchor themselves
and more efficiently garner scarce nutrients (Hillis-Colinvaux, 1980; Williams, 1981;
Demes et al., 2010). Thus, rhizophytic algae can facilitate colonization and growth of T.
testudinum and other seagrasses by stabilizing sediments, increasing the accumulation
of nutrients in the sediment as thalli decompose, and reducing transfer of nutrients into
the water column by protecting sediments from turbulence (McRoy and McMillan 1977;
Orth, 1977; Williams, 1984a, 1990). After colonization and establishment by seagrass,
calcifying macroalgae often decrease in abundance because seagrasses tend to be
superior competitors for space, light or nutrients. In fact, T. testudinum represents a
particularly strong competitor, and it dominates many tropical seagrass beds via
exploitative competition (Zieman and Wetzel, 1980; Williams, 1987, 1990). Furthermore,
39
T. testudinum has been shown to compete for nitrogen with H. incrassata when present
at densities of 400–800 shoots m-2 (Davis and Fourqurean, 2001), and T. testudinum
densities as low as 200 shoots m-2 were associated with a decline in the abundance of
rhizophytic algae (Williams, 1990). In the present study, no significant negative effect on
H. incrassata production was observed at seagrass densities up to 1312 shoots m-2 (i.e.,
HHLT and MHMT treatments). However, rates of production were reduced at seagrass
densities at or above 1650 shoots m-2 (i.e., LHHT treatment), suggesting that some level
of competition (sensu Davis and Fourqurean, 2001) occurs at high seagrass densities in
Grape Tree Bay. Given light regimes in clear, shallow, tropical waters, such competition
is likely to be for nutrients rather than light (Davis and Fourqurean, 2001). Therefore,
biotic interactions, i.e., competition, could affect the dynamics of CaCO3 production by
H. incrassata at scales similar to Grape Tree Bay.
As thalli grow, Halimeda spp. produce both organic matter and CaCO3, where
production of CaCO3 is driven by photosynthesis in the thallus. Jensen et al. (1985)
reported that 77% of the variation in calcification of H. copiosa, H, cryptica, H.
discoidea, and H. lacrimosa could be explained by variation in the rate of
photosynthesis. In addition, net carbonate accretion by Halimeda spp. does not occur in
the dark (Borowitzka and Larkum, 1976a, 1976b, 1976c, 1977; de Beer and Larkum,
2001), which further demonstrates the link between calcification and photosynthesis.
Thus, ratios of CaCO3 to organic matter (OM) yield insights into the dynamics of
calcification.
When only new growth of H. incrassata was considered, CaCO3:OM ratios were
not significantly different regardless of the density of T. testudinum surrounding the
40
algae, with the range of ratios across densities of seagrass being 0.25. In contrast, the
maximum difference among CaCO3:OM ratios for whole thalli, i.e., ratios including older
plates, was 1.88, which is 7 times the range observed for new growth, suggesting that
continued CaCO3 accumulation varied significantly among sites with different densities
of seagrass. In fact, the highest CaCO3:OM ratio was recorded for H. incrassata
growing among the highest density of T. testudinum. In combination, these results
indicate that new H. incrassata plates, i.e., those less than 7 d old, are produced with a
relatively constant CaCO3:OM ratio and CaCO3 content continues to increase in older
plates, especially for thalli in dense seagrass (LHHT). Previously, van Tussenbroek and
van Dijk (2007) found that mature, basal plates of H. incrassata were heavier than
newly produced plates, and other studies have documented an increase in CaCO3
content as plates age (Borowitzka and Larkum, 1976a, 1977; Multer, 1988). This is the
first study to report that accumulation of CaCO3 may depend on the density of
surrounding seagrasses. Competition for nutrients represents a potential influence on
calcification if thalli amid dense seagrass continue to photosynthesize and produce
CaCO3 in existing tissues without the nutrients required to synthesize new living tissue.
Some investigators have reported abiotic influences on calcification, with
seagrasses or fleshy macroalgae creating seawater chemistry favorable to algal and
coral calcification (Semesi et al., 2009a, b; Anthony et al., 2011; Kleypas et al., 2011).
These results were obtained under naturally (Kleypas et al., 2011) or artificially (Semesi
et al., 2009a, b; Anthony et al., 2009) low mixing conditions (high water residence time).
Findings here suggest that abiotic effects may not be very significant in well-mixed
conditions, because (1) the pH regime in the seagrass canopy did not differ significantly
41
from unvegetated areas in Grape Tree Bay and (2) growth rates for H. incrassata in
dense T. testudinum beds were significantly lower, which further indicates that biotic
interactions, e.g., competition, between these macrophytes could represent a key factor.
Collectively, the results presented here suggest that enhancement of calcification
will depend on water residence time (Anthony et al., 2011; Kleypas et al., 2011) and
ecological processes, such as competition (Davis and Fourqurean, 2001) and
succession (Williams, 1990), that affect both the abundances of macrophytes and their
ability to garner resources (van Tussenbroek and van Dijk, 2007).
Further research combining manipulative and mensurative experiments is needed
to elucidate the outcomes of positive and negative interactions between seagrasses,
like T. testudinum, and rhizophytic, calcareous algae, like H. incrassata, in oceans that
are becoming increasingly acidic. Data on local hydrodynamics and diel variations in
seawater chemistry also will be important in furthering our understanding of biotic and
abiotic influences on calcium carbonate production.
42
LIST OF REFERENCES
Anderson, R., Gorley, R.N., Clarke, K.R., 2008. PERMANOVA+ for PRIMER: guide to software and statistical methods. PRIMER-E, Plymouth, UK.
Andersson, A.J., Mackenzie, F.T., 2012. Revisiting four scientific debates in ocean acidification research. Biogeosciences 9, 893–905.
Anthony, K.R.N., Kleypas, J.A., Gattuso, J., 2011. Coral reefs modify their seawater carbon chemistry – implications for impacts of ocean acidification. Glob. Change Biol. 17, 3655–3666.
Borowitzka, M.A., Larkum, A.W.D., 1976a. Calcification in the green alga Halimeda. II. Exchange of Ca2+ and occurrence of age gradients in calcification and photosynthesis. J. Exp. Bot. 27, 864–878.
Borowitzka, M.A., Larkum, A.W.D., 1976b. Calcification in the green alga Halimeda. III. Sources of inorganic carbon for photosynthesis and calcification and a model of mechanism of calcification. J. Exp. Bot. 27, 879–893.
Borowitzka, M.A., Larkum, A.W.D., 1976c. Calcification in the green alga Halimeda. IV. Action of metabolic inhibitors on photosynthesis and calcification. J. Exp. Bot. 27, 894–907.
Borowitzka, M.A., Larkum, A.W.D., 1977. Calcification in the green alga Halimeda. I. Ultrastructure study of thallus development. J. Phycol. 13, 6–16.
Byers, S.C., Mills, E.L., Stewart, P.L., 1978. Comparison of methods of determining organic carbon in marine sediments, with suggestions for a standard method. Hydrobiologia 58, 43–47.
Dahlgren, C., Marr, J., 2004. Back reef systems: Important but overlooked components of tropical marine ecosystems. Bull. Mar. Sci. 75, 145–152.
Davis, B.C., Fourqurean, J.W., 2001. Competition between the tropical alga, Halimeda incrassata, and the seagrass, Thalassia testudinum. Aquat. Bot. 71, 217–232.
de Beer, D., Larkum, A.W.D., 2001. Photosynthesis and calcification in the calcifying algae Halimeda discoidea studied with microsensors. Plant Cell Environ. 24, 1209–1217.
Demes, K.W., Littler, M.M., Littler, D.S., 2010. Comparative phosphate acquisition in giant-celled rhizophytic algae (Bryopsidales, Chlorophyta): Fleshy vs. calcified forms. Aquat. Bot. 92, 157-160.
43
Doney, S.C., Ruckelshaus, M., Duffy, J.E., Barry, J.P., Chan, F., English, C.A., Galindo, H.M., Grebmeier, J.M., Hollowed, A.B., Knowlton, N., Polovina, J., Rabalais, N.N., Sydeman, W.J., Talley, L.D., 2012. Climate change impacts on marine ecosystems. Annu. Rev. Mar. Sci. 4, 11–37.
Duarte, C.M., 1995. Submerged aquatic vegetation in relation to different nutrient regimes. Ophelia 41, 87–112.
Duarte, C.M., Marba, N., Gacia, E., Fourqurean, J.W., Beggins, J., Barron, C., Apostolaki, E.T., 2010. Seagrass community metabolism: Assessing the carbon sink capacity of seagrass meadows. Global Biogeochem. Cy. 24, GB4032.
Fong, P., Paul, V.J., 2011. Coral reef algae, in: Dubinsky, Z., Stambler, N. (Eds.), Coral reefs: An Ecosystem in Transition. Springer, Dordrecht, Netherlands, pp. 241–272.
Fourqurean, J.W., Duarte, C.M., Kennedy, H., Marba, N., Holmer, M., Mateo, M.A., Apostolaki, E.T., Kendrick, G.A., Krause-Jensen, D., McGlathery, K.J., Serrano, O., 2012. Seagrass ecosystems as a globally significant carbon stock. Nature Geosci. advance online publication, 1–5.
Freile, D., Milliman, J.D., Hillis, L., 1995. Leeward bank margin Halimeda meadows and draperies and their sedimentary importance on the western Great Bahama Bank slope. Coral Reefs 14, 27–33.
Guinotte, J.M., Fabry, V.J., 2008. Ocean acidification and its potential effects on marine ecosystems. Ann. NY Acad. Sci. 1134, 320–342.
Hillis-Colinvaux, L., 1980. Ecology and taxonomy of Halimeda: primary producer of coral reefs. Adv. Mar. Biol. 17, 1–327.
Hoegh-Guldberg, O., Mumby, P.J., Hooten, A.J., Steneck, R.S., Greenfield, P., Gomez, E., Harvell, C.D., Sale, P.F., Edwards, A.J., Caldeira, K., Knowlton, N., Eakin, C.M., Iglesias-Prieto, R., Muthiga, N., Bradbury, R.H., Dubi, A., Hatziolos, M.E., 2007. Coral reefs under rapid climate change and ocean acidification. Science 318, 1737–1742.
Jensen, P.R., Gibson, R.A., Littler, M.M., Littler, D.S., 1985. Photosynthesis and calcification in 4 deep-water Halimeda species (Chlorophyceae, Caulerpales). Deep-Sea Res. 32, 451–464.
Kleypas, J.A., Anthony, K.R.N., Gattuso, J., 2011. Coral reefs modify their seawater carbon chemistry–case study from a barrier reef (Moorea, French Polynesia). Glob. Change Biol. 17, 3667–3678.
Kleypas, J.A., Buddemeier, R.W., Archer, D., Gattuso, J-P., Langdon, C., Opdyke, B.N., 1999. Geochemical consequences of increased atmospheric CO2 on coral reefs. Science 284, 118–120.
44
Kroeker, K.J., Kordas, R.L., Crim, R.N., Singh, G.G., 2010. Meta-analysis reveals negative yet variable effects of ocean acidification on marine organisms. Ecol. Lett. 13, 1419–1434.
Lee, D., Carpenter, S.J., 2001. Isotopic disequilibrium in marine calcareous algae. Chem. Geol. 172, 307–329.
Littler, M.M., 1976. Calcification and its role among the macroalgae. Micronesica 12, 27–41.
Littler, M.M., Littler, D.S., 1988. Structure and role of algae in tropical reef communities, in: Lembi, C.A., Waaland, J.R. (Eds.), Algae and Human Affairs. Cambridge University Press, Cambridge, pp. 29–55.
Littler, M.M., Littler, D.S., 1994. Tropical reefs as complex habitats for diverse macroalgae, in: Lobban, C.S., Harrison, P.J. (Eds.), Seaweed Ecology and Physiology. Cambridge University Press, New York, pp. 72–75.
Mantyka, C.S., Bellwood, D.R., 2007. Macroalgal grazing selectivity among herbivorous coral reef fishes. Mar. Ecol. Prog. Ser. 352, 177–185.
McClendon, J.F., 1917. Physical Chemistry of Vital Phenomena for Students and Investigators in the Biological and Medical Sciences. Princeton University Press, Princeton.
McClendon, J.F., 1918. On changes in the sea and their relation to organisms, in: Papers from the Department of Marine Biology. Carnegie Institution, Washington, pp. 213–259.
McRoy, C.P., McMillan, C., 1977. Production ecology and physiology of seagrasses, in: McRoy, C.P., Helfferich, C. (Eds.), Seagrass Ecosystems: a Scientific Perspective. Marcel Dekker, New York, pp. 53–87.
Milliman, J.D., Droxler, A.W., 1996. Neritic and pelagic carbonate sedimentation in the marine environment: Ignorance is not bliss. Geol. Rundsch. 85, 496–504.
Multer, H.G., 1988. Growth rate, ultrastructure and sediment contribution of Halimeda incrassata and Halimeda monile, Nonsuch and Falmouth Bays, Antigua, WI. Coral Reefs 6, 179–186.
Nelson, W.A., 2009. Calcified macroalgae–critical to coastal ecosystems and vulnerable to change: a review. Mar. Freshwater Res. 60, 787–801.
Orth, R.J., 1977. Effect of nutrient enrichment on growth of eelgrass Zostera marina in Chesapeake Bay, Virginia, USA. Mar. Biol. 44, 187–194.
45
Orth, R.J., Heck, K.L., van Montfrans, J., 1984. Faunal communities in seagrass beds–a review of the influence of plant structure and prey characteristics on predator prey relationships. Estuaries 7, 339–350.
Overholtzer, K.L., Motta, P.J., 1999. Comparative resource use by juvenile parrotfishes in the Florida Keys. Mar. Ecol. Prog. Ser. 177, 177–187.
Palacios, S.L., Zimmerman, R.C., 2007. Response of eelgrass Zostera marina to CO2 enrichment: possible impacts of climate change and potential for remediation of coastal habitats. Mar. Ecol. Prog. Ser. 344, 1–13.
Roberts, A.A., Palacas, J.G., Frost, I.C., 1973. Determination of organic carbon in modern carbonate sediments. J. Sediment. Petrol. 43, 1157-1159.
Semesi, I.S., Beer, S., Bjork, M., 2009b. Seagrass photosynthesis controls rates of calcification and photosynthesis of calcareous macroalgae in a tropical seagrass meadow. Mar. Ecol. Prog. Ser. 382, 41–47.
Semesi, I.S., Kangwe, J., Bjork, M., 2009a. Alterations in seawater pH and CO2 affect calcification and photosynthesis in the tropical coralline alga, Hydrolithon sp. (Rhodophyta). Estuar. Coast. Shelf Sci. 84, 337–341.
Skirrow, G., Whitfield, M., 1975. Effect of increases in atmospheric carbon dioxide content on carbonate ion concentration of surface ocean water at 25 °C. Limnol. Oceanogr. 20, 103–108.
Thayer, G.W., Bjorndal, K.A., Ogden, J.C., Williams, S.L., Zieman, J.C., 1984. Role of larger herbivores in seagrass communities. Estuaries 7, 351–376.
van Tussenbroek, B.I., van Dijk, J.K., 2007. Spatial and temporal variability in biomass and production of psammophytic Halimeda incrassata (Bryopsidales, Chlorophyta) in a Caribbean reef lagoon. J. Phycol. 43, 69–77.
Virnstein, R.W., Howard, R.K., 1987. Motile epifauna of marine macrophytes in the Indian River Lagoon, Florida. I. Comparisons among 3 species of seagrasses from adjacent beds. Bull. Mar. Sci. 41, 1–12.
Vroom, P.S., Smith, C.M., Coyer, J.A., Walters, L.J., Hunter, C.L., Beach, K.S., Smith, J.E., 2003. Field biology of Halimeda tuna (Bryopsidales, Chlorophyta) across a depth gradient: comparative growth, survivorship, recruitment, and reproduction. Hydrobiologia 501, 149–166.
Wefer, G., 1980. Carbonate production by the algae Halimeda, Penicillus and Padina. Nature 285, 323–324.
Williams, S.L., 1981. Caulerpa cupressoides: the relationship of the uptake of sediment ammonium and of algal decomposition to seagrass bed colonization. Dissertation. University of Maryland, College Park, Maryland, USA.
46
Williams, S.L., 1984. Decomposition of the tropical macroalga Caulerpa cupressoides (West) C. Agardh: Field and laboratory studies. J. Exp. Mar. Biol. Ecol. 80, 109–124.
Williams, S.L., 1987. Competition between the seagrasses Thalassia testudinum and Syringodium filiforme in a Caribbean lagoon. Mar. Ecol. Prog. Ser. 35, 91–98.
Williams, S.L., 1990. Experimental studies of Caribbean seagrass bed development. Ecol. Monogr. 60, 449–469.
Zieman, J.C., 1974. Methods for study of growth and production of turtle grass, Thalassia testudinum Konig. Aquaculture 4, 139–143.
Zieman, J.C., Wetzel, R.G., 1980. Productivity in seagrasses: methods and rates, in: Phillips, R.C., McRoy, C.P. (Eds.), Handbook of Seagrasses Biology: an Ecosystem Perspective. Garland STPM, New York, NY, pp. 87–116.
47
BIOGRAPHICAL SKETCH
Savanna Barry grew up in central Virginia and attended Patrick Henry High
School, where she graduated as Valedictorian in 2006. She studied biology at the
University of Virginia and held multiple internships at the Anheuser-Busch Coastal
Research Center in Oyster, VA. She graduated from UVA with honors in 2010 entered
the University of Florida Fisheries and Aquatic Sciences Master of Science program in
the fall of the same year. Her graduate work was completed in Little Cayman, BWI and
she plans to enroll in a Doctor of Philosophy program at the University of Florida in the
fall of 2012.