interactions of polymers and energetic materials
TRANSCRIPT
University of Rhode Island University of Rhode Island
DigitalCommons@URI DigitalCommons@URI
Open Access Master's Theses
2017
Interactions of Polymers and Energetic Materials Interactions of Polymers and Energetic Materials
Rebecca M. Levine University of Rhode Island, [email protected]
Follow this and additional works at: https://digitalcommons.uri.edu/theses
Recommended Citation Recommended Citation Levine, Rebecca M., "Interactions of Polymers and Energetic Materials" (2017). Open Access Master's Theses. Paper 1026. https://digitalcommons.uri.edu/theses/1026
This Thesis is brought to you for free and open access by DigitalCommons@URI. It has been accepted for inclusion in Open Access Master's Theses by an authorized administrator of DigitalCommons@URI. For more information, please contact [email protected].
INTERACTIONS OF POLYMERS AND ENERGETIC
MATERIALS
BY
REBECCA M. LEVINE
A THESIS SUBMITTED IN PARTIAL FULFILLMENT OF THE
REQUIREMENTS FOR THE DEGREE OF
MASTER
OF
SCIENCE
IN CHEMISTRY
UNIVERSITY OF RHODE ISLAND
2017
MASTER OF SCIENCE
IN CHEMISTRY
THESIS
OF
REBECCA M. LEVINE
APPROVED:
Thesis Committee:
Major Professor Jimmie Oxley
Co-Major Professor James Smith
Brenton DeBoef
Otto Gregory
Nasser H. Zawia
DEAN OF THE GRADUATE SCHOOL
UNIVERSITY OF RHODE ISLAND
2017
ABSTRACT
Trace explosive detection is the primary way for quick and easy sampling of
various surfaces in a check-point environment, e.g. an airport. The swabs used for
commercial explosive detectors, such as ion mobility spectrometers, are made of
various materials. The difficulty in collection and analysis of explosive traces is that
the swabs must be effective at adsorbing as well as desorbing materials, i.e. pickup
from the surface and release into the detection device. This dichotomy results in a
tradeoff for development of new swabs. Generally, desorption is considered to be the
more desirable property; therefore, Teflon is one choice for commercial swabs. It
would be ideal to develop a swab with both enhanced adsorption and desorption. One
way to accomplish this is to apply an electrostatic charge to commercial swabs. This
enhances their attraction to explosive particles, but once the swab is placed in the inlet
of commercial detection instrument, the charge is dissipated, and desorption of the
particles into the instrument proceeds as usual.
Methods of generating electrostatically charge swabs was determined;
triboelectric charging vs corona charging was compared examining magnitude of the
charge, reproducibility and stability, and effects of humidity. The magnitude of charge
necessary for enhanced collection of particles was evaluated using an electrostatic
voltmeter to measure charge and various means to measure particle pickup. Corona
charging was determined to be more effective. Enhancement of collection was judged
by comparing results of corona charging swabs to those achieved by contact swabbing.
Two variables were examined: the analyte and the substrate from which the analyte is
removed. The swab material was Nomex. In each case but three, collection of an
analyte by an electrostatically enhanced swab outperformed the traditional contact
swabbing. Evaluation was determined by a rigorous quantification by mass
spectrometry of the analyte picked up by the swab and the analyte remaining on the
substrate after swabbing. When analytical protocol was not amenable to a particular
analyte or substrate a commercial explosive trace detection instrument was used. It
was found that the substrate morphology played a bigger role in pickup of analyte than
the particular analyte.
In order to eliminate biological warfare agents, both heat and halides are used.
Ideally, these agents would be destroyed without dispersing them. The approach to
create a polymeric-sprayable matrix would allow dispersion of an iodine-producing
pyrotechnic, without dispersing the biological weapon, and when initiated would
produce both heat and iodine gas. This matrix will provide iodine vapor and a long-
lasting flame, not an explosion, to control dispersion of the threat.
A two-part foam was formulated based on polyurethane chemistry, i.e. a
diisocyanate combined with polyol to produce a urethane linkage. Each component of
the foam (e.g. isocyanate, polyol, catalyst, blowing agent, surfactant) was
experimentally adjusted to achieve the best foam based on expansion, structural
integrity, and cell uniformity. Since the polyol is the most adjustable component in
the foam, an investigation of commercial and synthesized energetic polyols was
performed. The structures of the energetic polyols were verified by LC-MS and FTIR
and characterized for heat flow by DSC. Once the structures of the energetic polyols
had been proven, it was formulated into a polyurethane foam which was characterized
for heat of decomposition, by SDT, for heat of combustion by bomb calorimetry, and
structurally by FTIR. Documenting heat flow with SDT helped to determine that the
structural modification increased heat release and lowered ignition temperature
compared to the standard polyurethane foam. The formulated polyurethane foam was
then tested for expansion against increased solids loading. When optimal solids
loading was determined (>70%), the pyrotechnic foam was ignited in a bomb
calorimeter. The heat released and iodine production was quantified.

v
ACKNOWLEDGMENTS
Thank you to my advisors Dr. Jimmie Oxley and Dr. James Smith for accepting
me into their research group and giving me the opportunity to be exposed to some
great unique research. To the funding agencies: Department of Homeland Security
(DHS) and Defense Threat Reduction Agency (DTRA) for funding this research. To
my entire research group (past and present) sharing lab space with me and for their
help with various projects. A particular thank you to Austin Brown for being my guide
in the lab and always there with a helping hand. In addition, Dr. Matt Porter for his
assistance with the DTRA project. I would especially like to thank Dr. Joe Brady for
mentoring me through some real interesting science and your boisterous laugh always
kept me going through hard times.
To my family for encouraging me through graduate school even when things
were tough and supporting my decisions. To my closest friends, Jaclyn Herbst, Ashli
Simone, Laura Hendrickson-Rabin, and Julie Whelan for your countless hours of
listening to my struggles and always loving me and being there for me. I couldn’t ask
for better friends. To my fiancé, Dr. Matt Mullen, we have grown together through
some of the best times and worst times during graduate school. Thank you for always
supporting me and recognizing my potential as a chemist. I don’t think I would have
made it through this without you. I love you with all my heart and I can’t wait to spend
the rest of my life with you. Lastly, a special thanks to my wonderful animals: Penny
Lane, Bunsen, and Jasmine. Your unconditional love has helped me through this
journey more than your little fluffy minds will ever comprehend.
vi
PREFACE
This thesis is prepared in the manuscript format. Chapter 1 is titled
Electrostatically-enhanced swabbing for near field sampling; this work was funded by
DHS. Chapter 2, Potential Biocides: Polymer Packaging of Iodine containing
Pyrotechnics was funded by DTRA through grant HDTRA1-14-0027 and part of the
manuscript is in preparation for publication. This document is written in Manuscript
Format. Guidelines for formatting have been followed here and in the entirety of this
document.

vii
TABLE OF CONTENTS
ABSTRACT ................................................................................................................... ii
ACKNOWLEDGMENTS ............................................................................................. v
PREFACE .................................................................................................................... ivi
TABLE OF CONTENTS ............................................................................................. vii
LIST OF TABLES ...................................................................................................... viii
LIST OF FIGURES ..................................................................................................... xii
CHAPTER 1 ....................................................................................................................
Electrostatically Enhanced Swabbing for Near-Field Sampling…….…………1
CHAPTER 2 ....................................................................................................................
Potential Biocides: Polymer Packaging of Iodine containing Pyrotechnics…51
viii
LIST OF TABLES
TABLE PAGE
Table 1.1. Conditions for HESI source of mass spec (V=voltage & AU= arbitrary unit)
____________________________________________________________________ 8
Table 1.2. MRM transitions for organic explosive analytes
____________________________________________________________________ 9
Table 1.3. Bulk Measurements of mass pickup of sucrose & NaCl on charged swabs
___________________________________________________________________ 13
Table 1.4. Bulk measurements pickup of sucrose and NaCl on uncharged swabs
___________________________________________________________________ 13
Table 1.5. Potential Surface for Charging Station tested with PTFE and Nomex swabs
___________________________________________________________________ 15
Table 1.6. Two-swab stack charged together & separated after lifting together in air
(left) or separated with one remained in surface contact (right) (experiment performed
in triplicate)
___________________________________________________________________19
Table 1.7. Nomex swab charged inductively & stored stacked on Al foil for 24 hr
___________________________________________________________________21
Table 1.8. PTFE swab charged inductively & stored stacked on Al foil for 24 hr
___________________________________________________________________21
Table 1.9. Nomex swabs inductively charged & stored stack on Al foil for 24 hr
___________________________________________________________________21
Table 1.10. Nomex contact & electrostatic swabbing for PETN from polycarbonate
___________________________________________________________________24
ix
Table 1.11. Nomex contact and electrostatic swabbing for PETN from cardboard
___________________________________________________________________25
Table 1.12. Nomex contact and electrostatic swabbing for PETN from Bytac®
___________________________________________________________________26
Table 1.13. Nomex contact and electrostatic swabbing for PETN from ABS
___________________________________________________________________27
Table 1.14. Nomex contact and electrostatic swabbing for PETN from PTFE
___________________________________________________________________28
Table 1.15. Nomex contact and electrostatic swabbing for TNT from PTFE
___________________________________________________________________29
Table 1.16. Nomex contact and electrostatic swabbing for PETN from HDPE
___________________________________________________________________30
Table 1.17. Nomex contact and electrostatic swabbing for TNT from HDPE
___________________________________________________________________31
Table 1.18. Nomex contact and electrostatic swabbing for PETN from cotton
___________________________________________________________________32
Table 1.19. Nomex contact and electrostatic swabbing for TNT from cotton
___________________________________________________________________33
Table 1.20. Nomex contact and electrostatic swabbing for RDX from cotton
___________________________________________________________________33
Table 1.21 Nomex contact and electrostatic swabbing for PETN from Ohio Zipper
___________________________________________________________________35
Table 1.22. Nomex contact and electrostatic swabbing for TNT from Ohio Zipper
___________________________________________________________________35
x
Table 1.23. Nomex contact and electrostatic swabbing for RDX from Ohio Zipper
___________________________________________________________________36
Table 1.24. Nomex contact and electrostatic swabbing for PETN from Al foil using
the direct deposit method
___________________________________________________________________37
Table 1.25. Nomex contact and electrostatic swabbing for PETN from Al foil
___________________________________________________________________38
Table 1.26. Nomex contact and electrostatic swabbing for TNT from Al foil
___________________________________________________________________38
Table 1.27 Nomex contact and electrostatic swabbing for RDX from Al foil.
___________________________________________________________________39
Table 1.28. Nomex contact and electrostatic swabbing for PETN from Ballistic Nylon
___________________________________________________________________40
Table 1.29. Nomex contact and electrostatic swabbing for PETN from packing tape
___________________________________________________________________41
Table 1.30. IMS responses of contact vs electrostatically enhanced swabs
___________________________________________________________________44
Table 1.31. Positive and negative charging to pick up RDX from a C-4 fingerprint
___________________________________________________________________45
Table 1.32. Quantification as % Recoveries comparing pickup of explosives using
contact vs electrostatic swabs at 5 to 40% RH
___________________________________________________________________47
Table 1.33. IMS response comparing pickup of explosives on contact vs electrostatic
swabs
___________________________________________________________________47

xi
Table 2.1. Components of polyurethanes prepared with special monomers
___________________________________________________________________71
Table 2.2 Bomb calorimetric results for pyrotechnic-loaded foams under oxygen
___________________________________________________________________75
xii
LIST OF FIGURES
FIGURE PAGE
Figure 1.1. The Triboelectric Series
____________________________________________________________________ 4
Figure 1.2. Chemical structures of PETN, TNT, RDX
____________________________________________________________________ 6
Figure 1.3. Example of a calibration curve for PETN
____________________________________________________________________9
Figure 1.4. Setup for the dry transfer of analyte to each substrate
___________________________________________________________________10
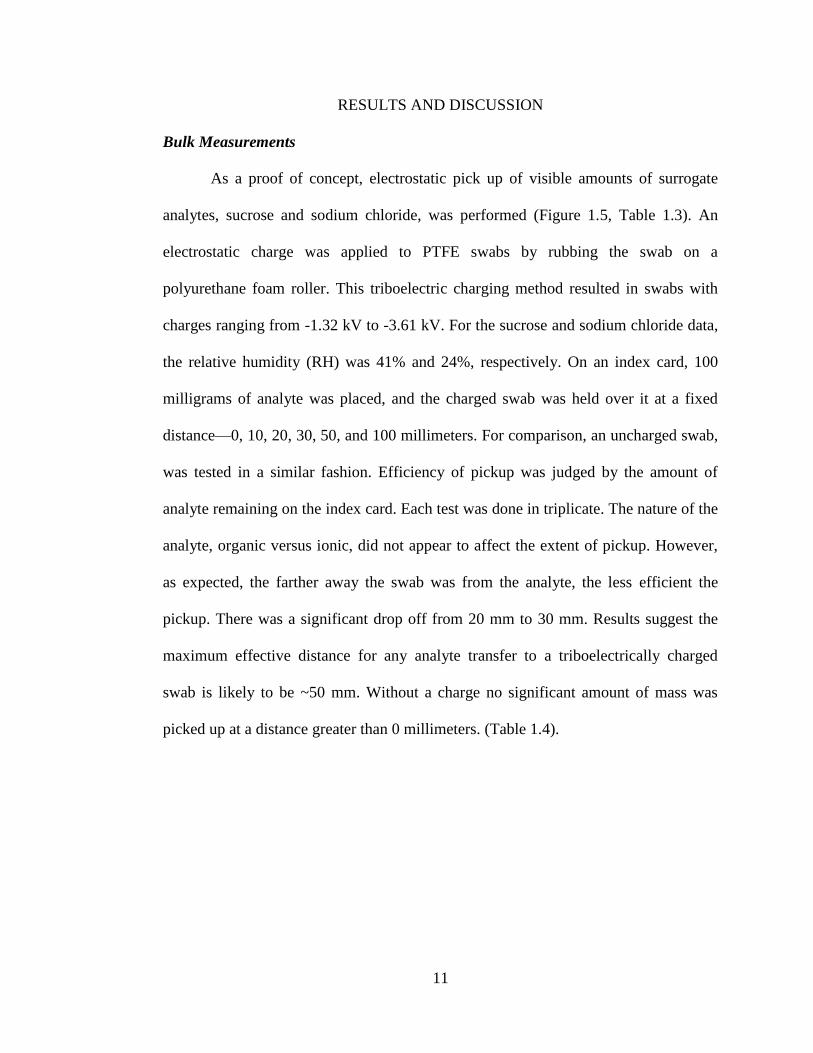
Figure 1.5. Decrease of sucrose (A) and sodium chloride (B) pickup as a function of
distance
___________________________________________________________________12
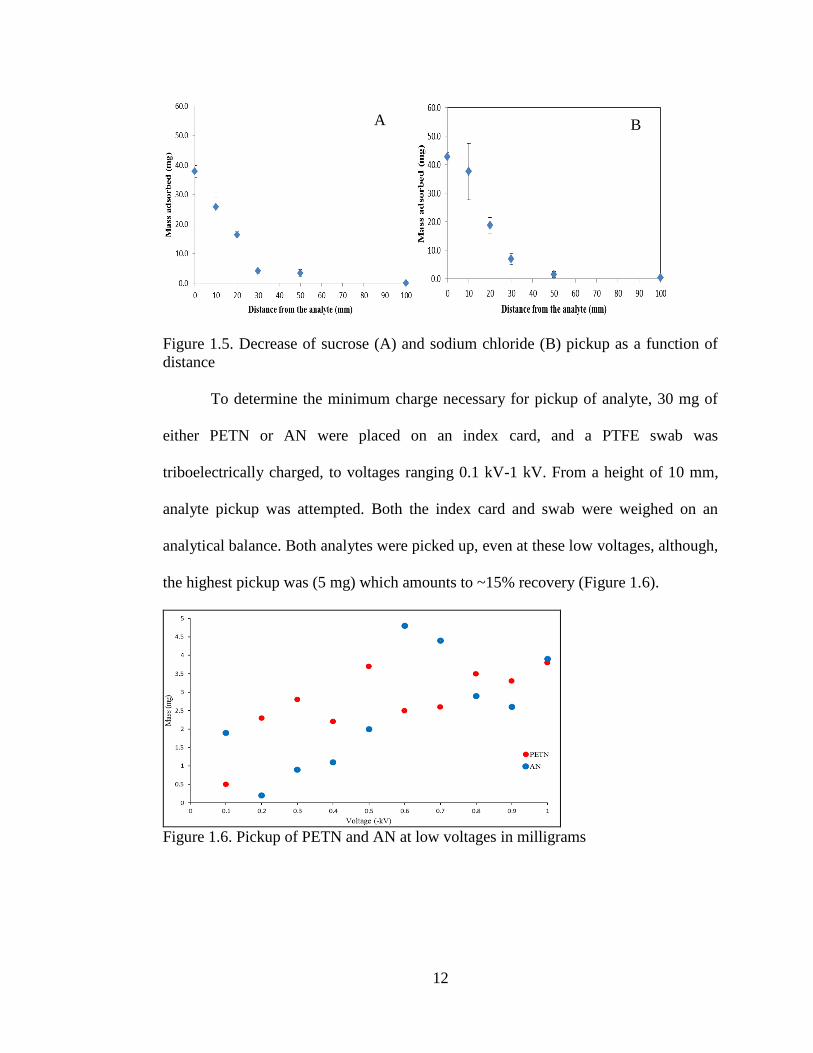
Figure 1.6. Pickup of PETN and AN at low voltages in milligrams
___________________________________________________________________ 12
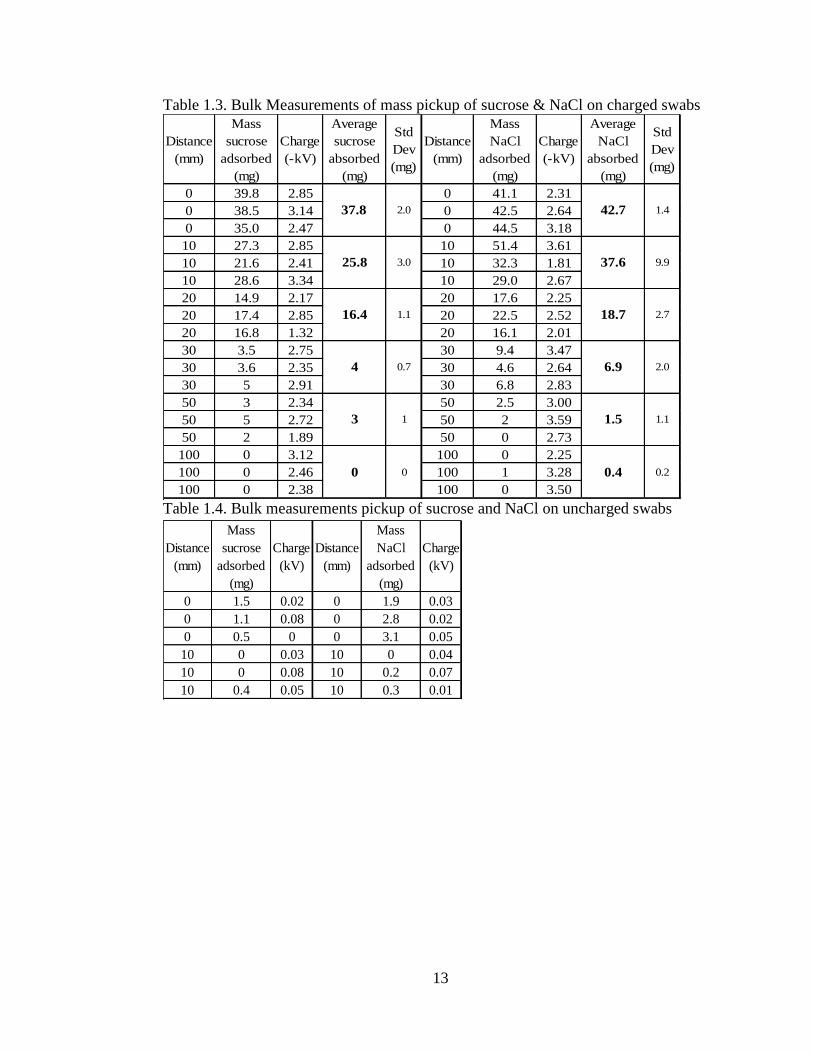
Figure 1.7. SEM micrographs of select substrates (top rows) and swabs (bottom row)
___________________________________________________________________14
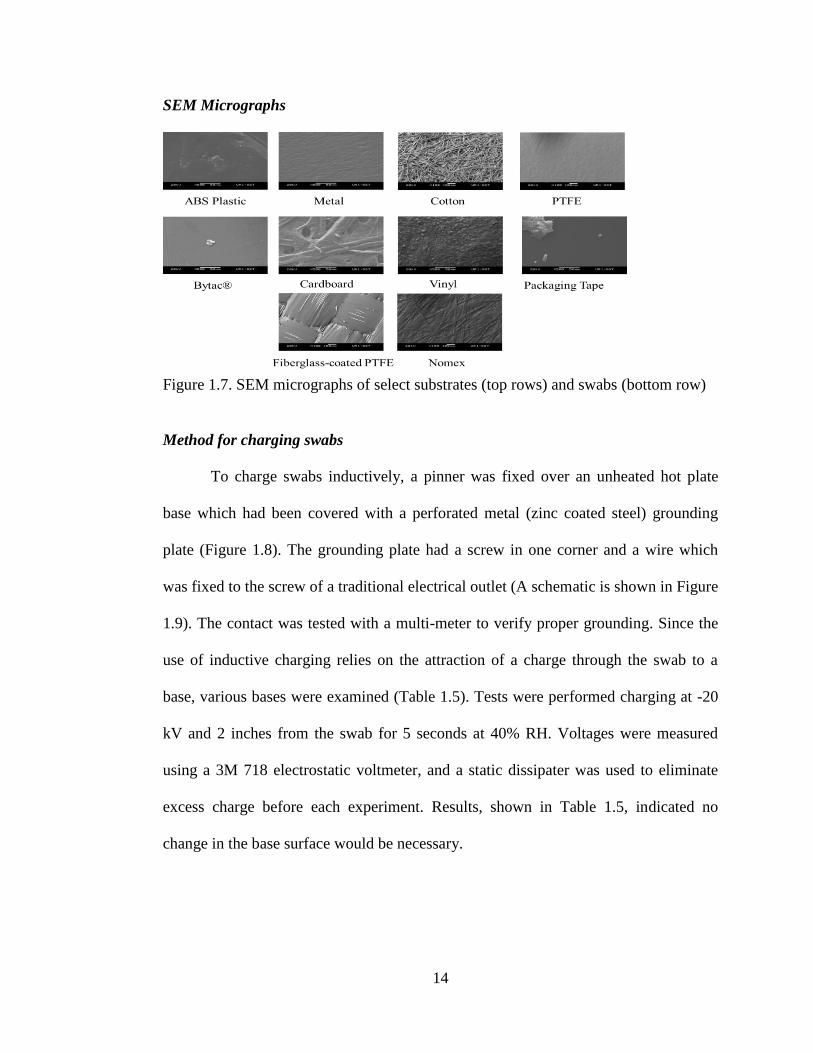
Figure 1.8. Hot plate with grounding wire and the grounding connection at outlet
___________________________________________________________________15
Figure 1.9. Schematic of the inductive charger
___________________________________________________________________15
Figure 1.10. PTFE-coated fiberglass swab effective voltage with increasing humidity
___________________________________________________________________ 17
xiii
Figure 1.11. FLIR NOMEX swab effective voltage with increasing humidity
___________________________________________________________________17
Figure 1.12. FLIR PTFE swab effective voltage with increasing humidity
___________________________________________________________________17
Figure 1.13. DSA Cotton swab held at 30% RH positively charged over 3 minutes
___________________________________________________________________18
Figure 1.14. Mass pickup of sucrose & ground glass at increasing humidity and
voltage
___________________________________________________________________18
Figure 1.15. Arrangement of swabs charged simultaneously from 2 inches height
___________________________________________________________________20
Figure 1.16. Substrates used in this study
___________________________________________________________________22
Figure 1.17. Ohio Travel Bag Zipper
___________________________________________________________________34
Figure 1.18. FTIR spectrum of authentic packing tape sample (Left) surrogate (Right)
___________________________________________________________________ 41
Figure 1.19. IMS signal response for NITRO for increasing concentrations of PETN
___________________________________________________________________43
Figure 1.20. IMS signal response for PETN for increasing concentrations of PETN
___________________________________________________________________43
Figure 1.21. IMS signal response for NITRO for increasing concentrations of AN
___________________________________________________________________43
xiv
Figure Page
Figure 2.1 general urethane linkage mechanism
___________________________________________________________________53
Figure 2.2. Synthesis of 2-(Hydroxymethyl)-2-nitropropane-1,3-diol (TMNM 1)
___________________________________________________________________55
Figure 2.3. Synthesis of 2,3-Bis(hydroxymethyl)-1,3-dinitrobutane-1,4-diol (TETRA 2)
___________________________________________________________________57
Figure 2.4. Synthesis of 2-(Azidomethyl)-2-nitropropane-1,3-diol (AZONITRO 3)
___________________________________________________________________58
Figure 2.5. Synthesis of 2,2-Bis(Azidomethyl)propane-1,3-diol (BAMP 4)
___________________________________________________________________58
Figure 2.6. Synthesis of 2,2-Dinitro-1,3-propanediol (DNPD, 5)
___________________________________________________________________59
Figure 2.7. Synthesis of (TEOA-TDI) foam
___________________________________________________________________60
Figure 2.8. Synthesis of (TMNM(1)/TEOA-TDI) foam assuming 1:1 mol Polyol
___________________________________________________________________61
Figure 2.9. Synthesis of (TETRA(2)/TEOA-TDI) foam assuming 1:1 mol Polyol
___________________________________________________________________62
Figure 2.10. Synthesis of (AZONITRO(3)/TEOA-TDI) Foam assuming 1:1 mol Polyol
___________________________________________________________________62
Figure 2.11. Synthesis of (BAMP(4)/TEOA-TDI) Foam assuming 1:1 mol Polyol
___________________________________________________________________63
Figure 2.12. Example UV-Vis calibration curve for I2 quantification
___________________________________________________________________64
xv
Figure 2.13. IR Spectra of TEOA (provided by NIST Chemistry WebBook), TMNM (1),
TETRA (2), AZONITRO (3), BAMP (4), and DNPD (5)
______________________________________________________________________65
Figure 2.14. LCMS Confirmation TETRA (2), AZONITRO (3), BAMP (4), & DNPD (5)
______________________________________________________________________66
Figure 2.15. DSC Traces TEOA, TMNM (1), TETRA (2), AZONITRO (3), BAMP (4),
& DNPD (5)
______________________________________________________________________67
Figure 2.16. IR Spectra of Polyurethane Foams TEOA-TDI, TMNM(1)/TEOA-TDI,
TETRA(2)/TEOA-TDI, AZONITRO(3)/TEOA-TDI, & BAMP(4)/TEOA-TDI
______________________________________________________________________68
Figure 2.17. Schematic of TEOA-TDI foam
______________________________________________________________________68
Figure 2.18. SDT of Polyurethane Foams TEOA-TDI, TMNM(1)/TEOA-TDI,
TETRA(2)/TEOA-TDI, AZONITRO(3)/TEOA-TDI, & BAMP(4)/TEOA-TDI
______________________________________________________________________70
Figure 2.19 Expansion of foams, from left to right: TEOA-TDI, TMNM(1)/TEOA-TDI,
TETRA(2)/TEOA-TDI, AZONITRO(3)/TEOA-TDI, BAMP(4)/TEOA-TDI
______________________________________________________________________71
Figure 2.20. SEM micrographs TEOA-TDI foam, 70% solids loading 90/10 Ca(IO3)2/Al
EDS foam top (left)(Spot 1 Ca & I; Spot 5, Al); bottom (right)(Spot 1 Ca & I; Spot 4, Al)
______________________________________________________________________72
Figure 2.21. Open burn of TEOA-TDI foam compared with bomb calorimetry values for
molecular iodine and heat production
______________________________________________________________________73
Figure 2.22. SDT of Ca(IO3)2/Al alone (top left) versus polyurethane foams w added
pyrotechnic (90/10 Ca(IO3)2 + 30% foam) TEOA-TDI foam, TEOA/AZONITRO(3)-
TDI foam, TEOA/BAMP(4)-TDI foam
______________________________________________________________________74
1
Manuscript 1
Electrostatically Enhanced Swabbing for Near-Field Sampling
By Rebecca Levine, Jimmie C. Oxley, James L. Smith, Devon Swanson, Alex
Yeudakimau, and Victoria Stubbs
Chemistry Department
University of Rhode Island
140 Flagg Road, Kingston, RI 02881
Submitted as confidential government report
2
ABSTRACT
Explosive detection often depends on collection of particles by swabbing
potentially contaminated surfaces. We have found that the pickup of particles by
commercials swabs can be improved by applying an electrostatic charge to the swab.
Two methods of generating electrostatically charged swabs were tested-- triboelectric
versus corona discharge. They were compared examining charge magnitude,
reproducibility, stability, and effects of humidity. The charge necessary for collection
of particles was evaluated using an electrostatic voltmeter and measuring particle
pickup. Enhancement of collection was judged by comparing pickup by
electrostatically enhanced Nomex® swabs with that achieved by contact swabbing.
The efficiency of contact versus non-contact electrostatic swabbing was tested against
two variables—analyte (TNT, RDX, PETN, and ammonium nitrate) and 13 substrates.
Mass spectrometry was used to quantify analyte pickup by mass balance of the analyte
on the swab and remaining on the substrate. When quantification by mass
spectrometry was impossible, electrostatic swabbing was evaluated and compared to
contact with an explosive trace detector (i.e. ion mobility spectrometer).
3
INTRODUCTION
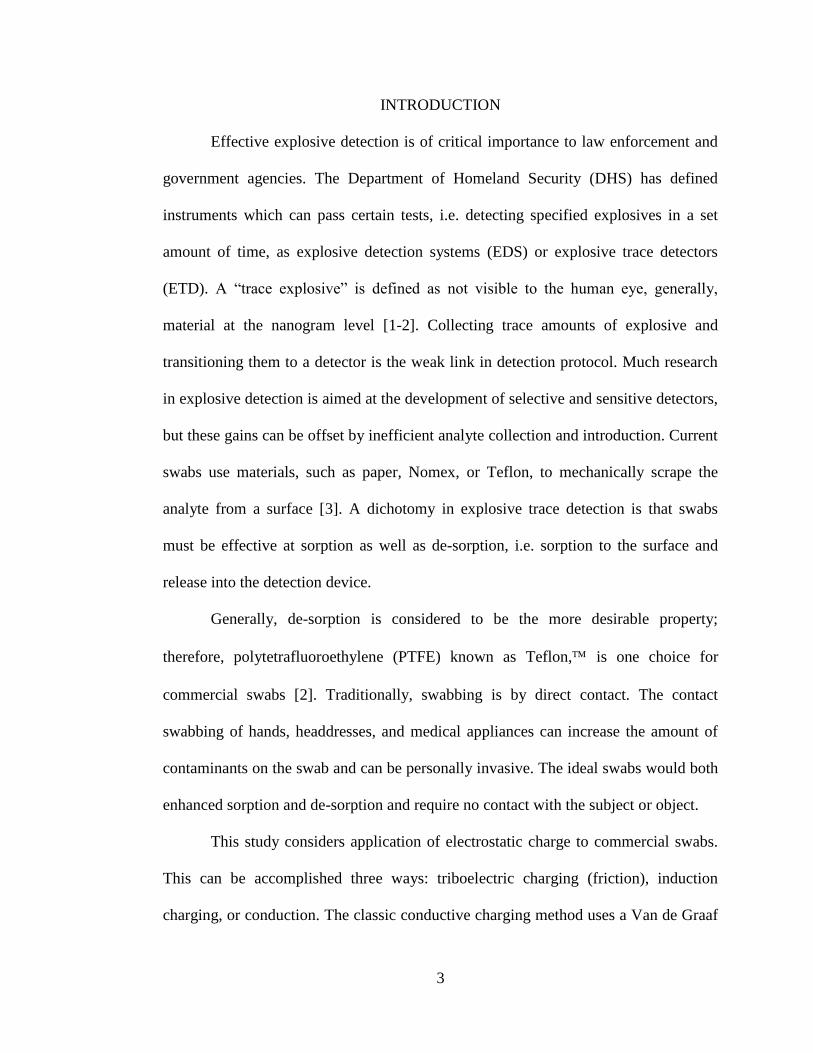
Effective explosive detection is of critical importance to law enforcement and
government agencies. The Department of Homeland Security (DHS) has defined
instruments which can pass certain tests, i.e. detecting specified explosives in a set
amount of time, as explosive detection systems (EDS) or explosive trace detectors
(ETD). A “trace explosive” is defined as not visible to the human eye, generally,
material at the nanogram level [1-2]. Collecting trace amounts of explosive and
transitioning them to a detector is the weak link in detection protocol. Much research
in explosive detection is aimed at the development of selective and sensitive detectors,
but these gains can be offset by inefficient analyte collection and introduction. Current
swabs use materials, such as paper, Nomex, or Teflon, to mechanically scrape the
analyte from a surface [3]. A dichotomy in explosive trace detection is that swabs
must be effective at sorption as well as de-sorption, i.e. sorption to the surface and
release into the detection device.
Generally, de-sorption is considered to be the more desirable property;
therefore, polytetrafluoroethylene (PTFE) known as Teflon, is one choice for
commercial swabs [2]. Traditionally, swabbing is by direct contact. The contact
swabbing of hands, headdresses, and medical appliances can increase the amount of
contaminants on the swab and can be personally invasive. The ideal swabs would both
enhanced sorption and de-sorption and require no contact with the subject or object.
This study considers application of electrostatic charge to commercial swabs.
This can be accomplished three ways: triboelectric charging (friction), induction
charging, or conduction. The classic conductive charging method uses a Van de Graaf
4
generator. The head of the Van de Graaf generator is negatively charged, and when a
neutral object comes into contact with it, the charge is transferred [4]. This method
was initially examined, but the charge was non-directional and short-lived on surfaces.
Thus, only triboelectric and corona charging were further investigated.
When two materials with different electron affinities come in close proximity,
the transfer of electrons creates separation of charge between the two surfaces [5-10].
The static charge created on the two surfaces can be positive or negative, depending
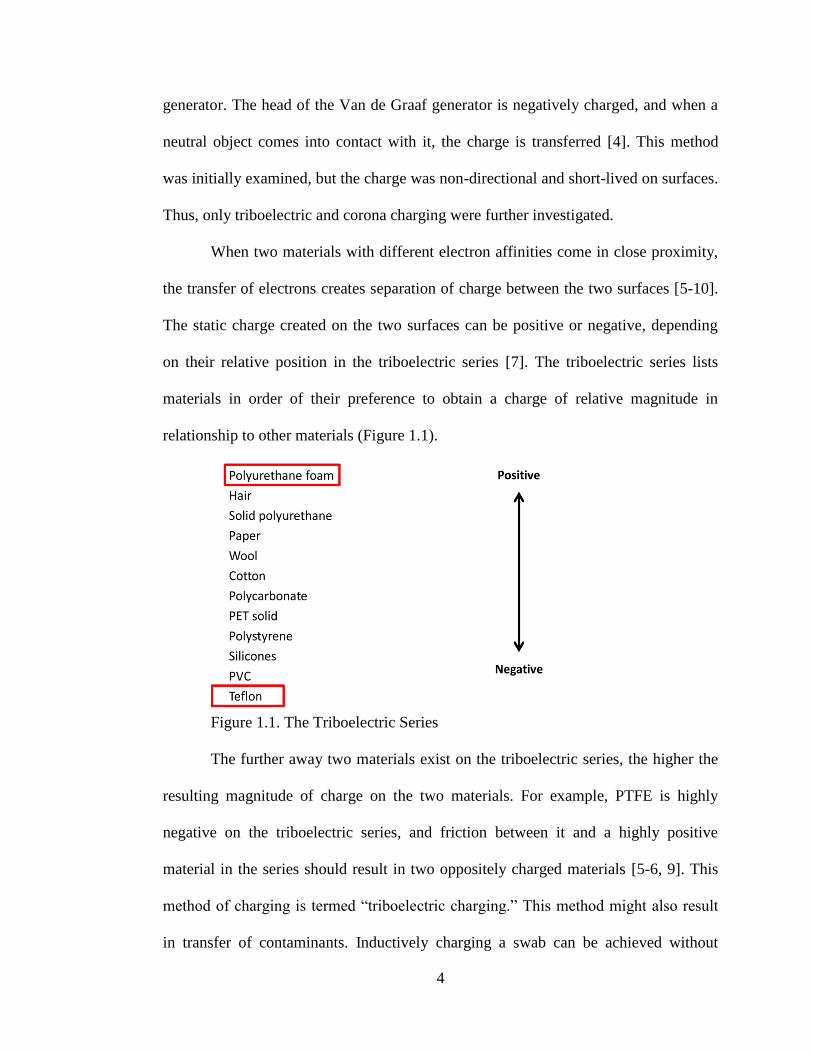
on their relative position in the triboelectric series [7]. The triboelectric series lists
materials in order of their preference to obtain a charge of relative magnitude in
relationship to other materials (Figure 1.1).
Figure 1.1. The Triboelectric Series
The further away two materials exist on the triboelectric series, the higher the
resulting magnitude of charge on the two materials. For example, PTFE is highly
negative on the triboelectric series, and friction between it and a highly positive
material in the series should result in two oppositely charged materials [5-6, 9]. This
method of charging is termed “triboelectric charging.” This method might also result
in transfer of contaminants. Inductively charging a swab can be achieved without
5
contact. A corona needle (pinner) attached to a high voltage supply with low current
ionizes the surrounding air molecules. When the pinner is in close proximity to a
grounding plate, electrons migrate toward the grounding plate, passing through
intervening surfaces, in this case, a swab. Thus, the swab is charged. The grounding
plate may play a role in increasing the uniformity of charge (a concept investigated in
this study). Inductive charging is used commercially, in one application to create a
permanently polarized material, termed an electret. Electrets, like the Swiffer®, are
formed by exposing a material to polarized electric fields at high temperature [11-14].
In theory, any material with a measurable relative permittivity should be
subject to electrostatic enhancement [15-16]. In this work, the potential for non-
contact electrostatic swabbing was investigated and benchmarked to performance of
standard contact swabs.
EXPERIMENTAL METHODS
Swabs & Substrates
Teflon (PTFE) and Nomex swabs were supplied by FLIR Detection. PTFE-
coated fiberglass and cotton swabs were supplied by DSA Detection and no
modifications were made. Substrates were cut from bulk material to approximately 1/2
inch by 2 inch. Bytac® substrate, (fluoroethylene propylene with vinyl backing) was
purchased from Saint-Gobain. Aluminum foil substrate (the dull side) was obtained
from Berkley Jensen. PTFE and cotton substrates were obtained from pieces of FLIR
and DSA Detection swabs, respectively. Vinyl, high density polyethylene (HDPE),
and polycarbonate substrates were purchased from McMaster-Carr. (The latter two
required a scroll saw to cut). Ballistic nylon was purchased online from Amazon. The
6
ABS (acrylonitrile butadiene styrene) substrate was printed into flat pieces on a
MakerBot 3-D printer. The white Nylon 1000 substrate was purchased from
Rockywoods (The white substrate was used because the solvent extracted the black
dye). Zipper substrates were plastic pull tabs (polyurethane) purchased from Ohio
Travel Bag. The cardboard substrate was created by pulling apart a cardboard
corrugated sheet so that just the first layer was used. Polypropylene wrapping material,
verified by FTIR using attenuated total reflectance (ATR) was also used.
Scanning Electron Microscopy (SEM)
Scanning electron micrographs were obtained at 20 kV in secondary ion mode on a
JEOL 5900 SEM of some of the substrates and swabs. Secondary ion mode was used
because it specifically focused on the surface morphology.
Analytes
Initially, commercial sugar and sodium chloride were used as surrogates for
organic explosives and inorganic energetics, respectively. These were sieved to
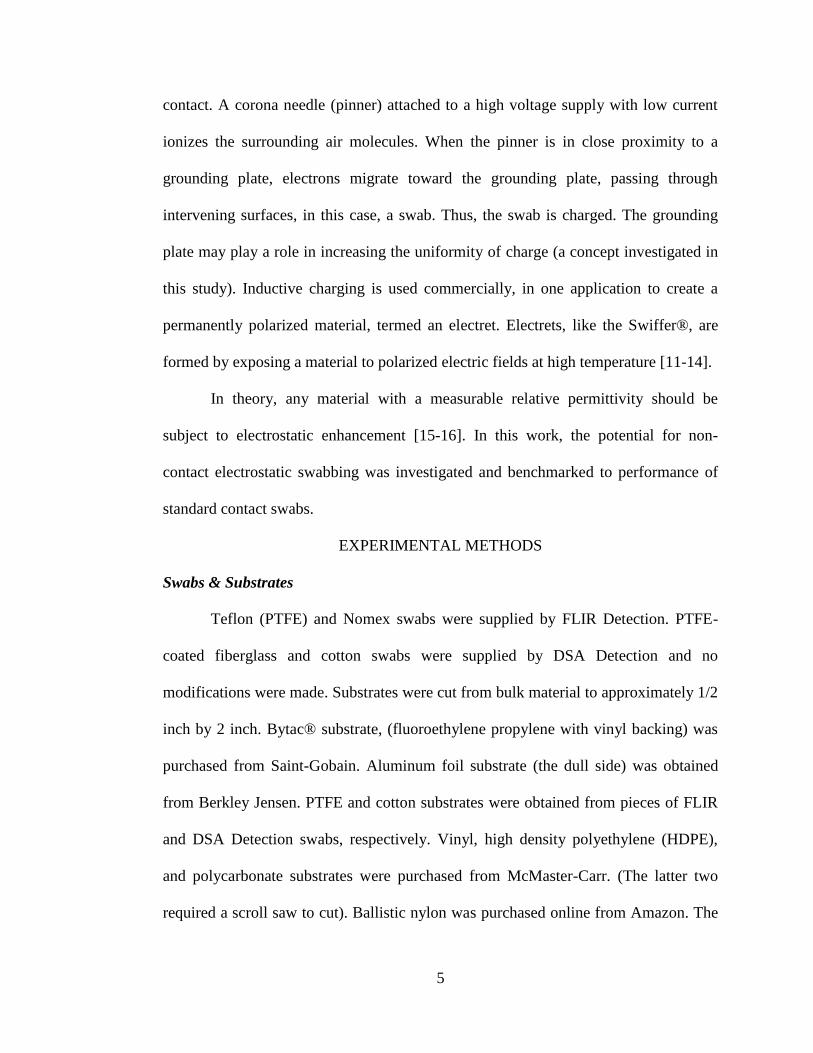
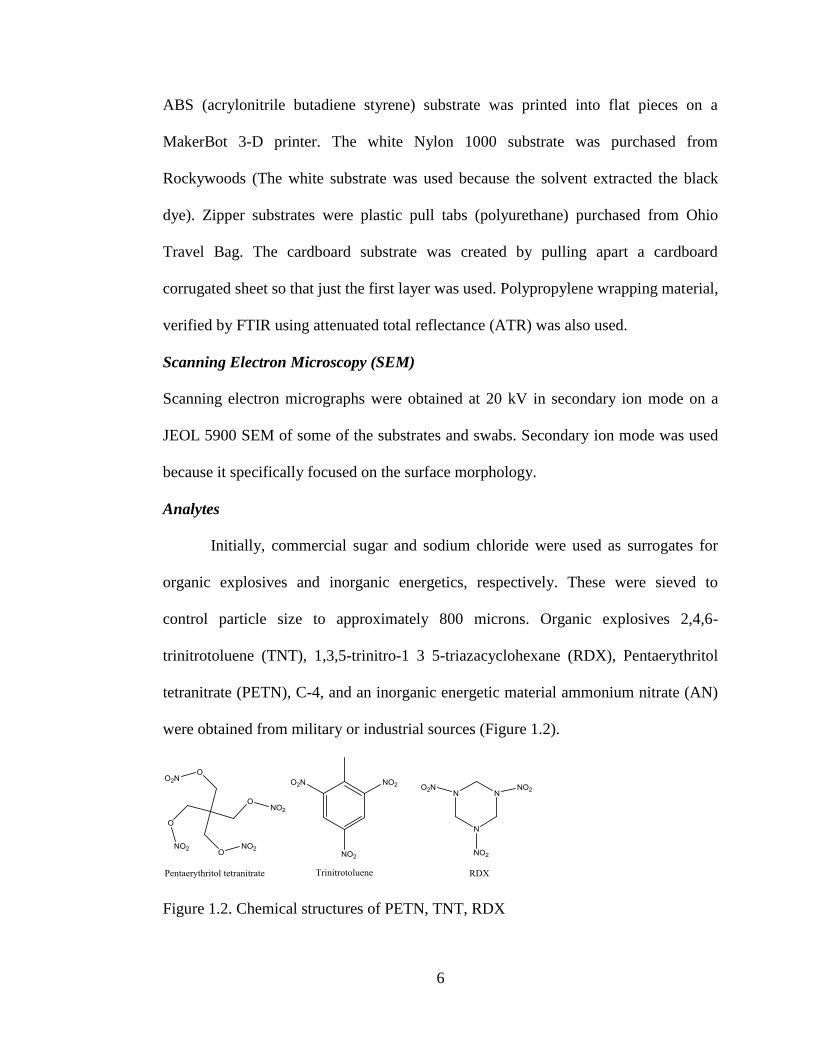
control particle size to approximately 800 microns. Organic explosives 2,4,6-
trinitrotoluene (TNT), 1,3,5-trinitro-1 3 5-triazacyclohexane (RDX), Pentaerythritol
tetranitrate (PETN), C-4, and an inorganic energetic material ammonium nitrate (AN)
were obtained from military or industrial sources (Figure 1.2).
Figure 1.2. Chemical structures of PETN, TNT, RDX
7
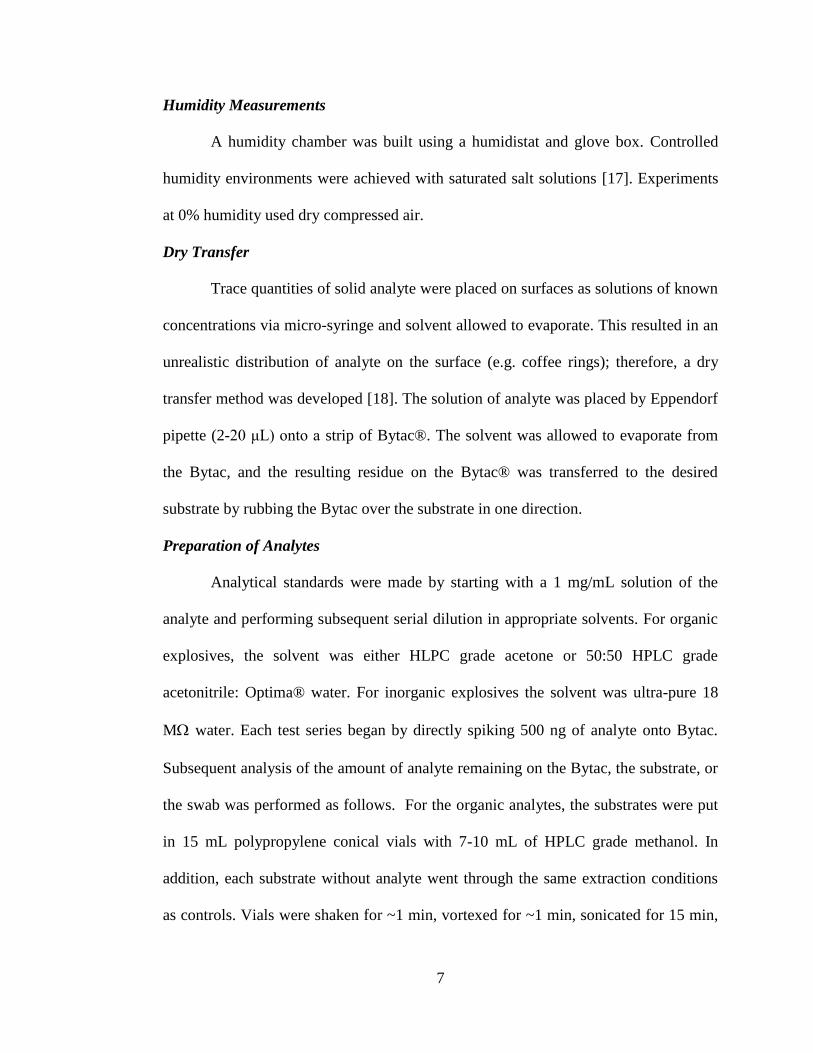
Humidity Measurements
A humidity chamber was built using a humidistat and glove box. Controlled
humidity environments were achieved with saturated salt solutions [17]. Experiments
at 0% humidity used dry compressed air.
Dry Transfer
Trace quantities of solid analyte were placed on surfaces as solutions of known
concentrations via micro-syringe and solvent allowed to evaporate. This resulted in an
unrealistic distribution of analyte on the surface (e.g. coffee rings); therefore, a dry
transfer method was developed [18]. The solution of analyte was placed by Eppendorf
pipette (2-20 μL) onto a strip of Bytac®. The solvent was allowed to evaporate from
the Bytac, and the resulting residue on the Bytac® was transferred to the desired
substrate by rubbing the Bytac over the substrate in one direction.
Preparation of Analytes
Analytical standards were made by starting with a 1 mg/mL solution of the
analyte and performing subsequent serial dilution in appropriate solvents. For organic
explosives, the solvent was either HLPC grade acetone or 50:50 HPLC grade
acetonitrile: Optima® water. For inorganic explosives the solvent was ultra-pure 18
M water. Each test series began by directly spiking 500 ng of analyte onto Bytac.
Subsequent analysis of the amount of analyte remaining on the Bytac, the substrate, or
the swab was performed as follows. For the organic analytes, the substrates were put
in 15 mL polypropylene conical vials with 7-10 mL of HPLC grade methanol. In
addition, each substrate without analyte went through the same extraction conditions
as controls. Vials were shaken for ~1 min, vortexed for ~1 min, sonicated for 15 min,
8
vortexed ~ 1 min, and transferred to clean glass conical vials. Vials were evaporated to
dryness using an Organomation Nitrogen evaporation system with compressed air and
a water bath at 40C. Solutions were reconstituted with the appropriate amount of
50:50 acetonitrile: water to achieve a final concentration of 500 ng/mL. The solution
(400 µL) was transferred into a LC vial, syringe filtered through a PTFE 0.22 µm
filter, and 20 µL of a 5000 µg/mL solution of 2,4-dichlorophenoxyacetic acid was
added to each vial as an internal standard.
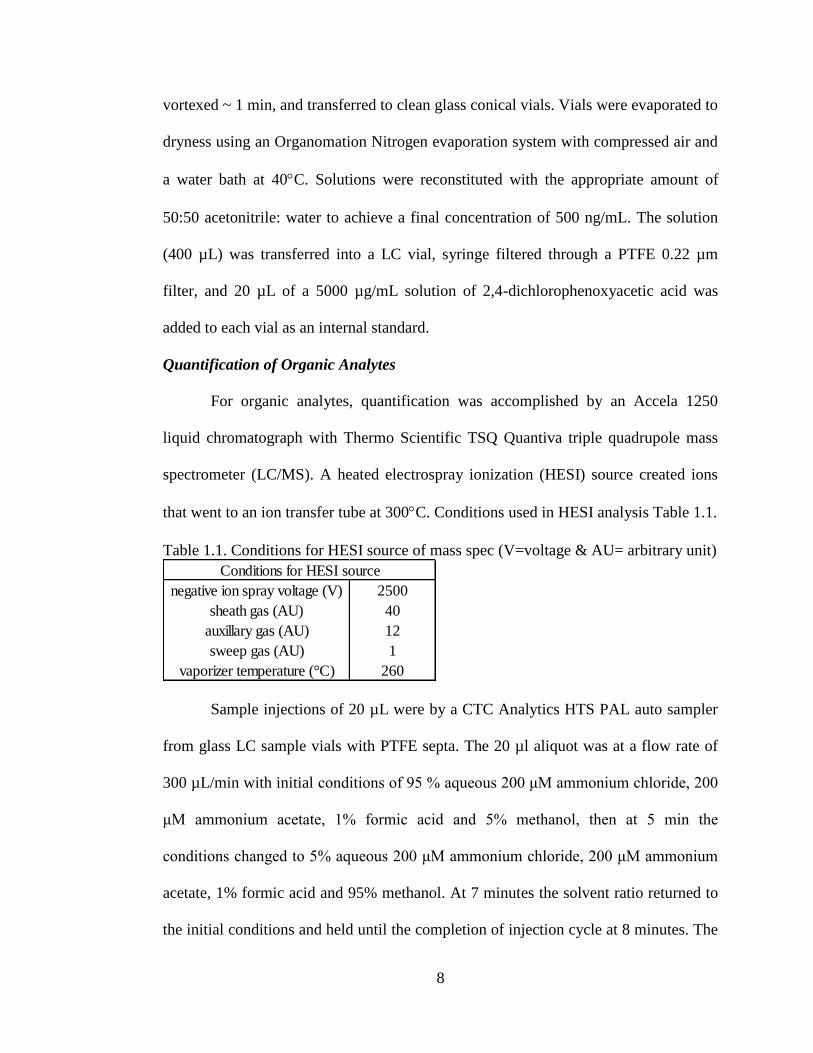
Quantification of Organic Analytes
For organic analytes, quantification was accomplished by an Accela 1250
liquid chromatograph with Thermo Scientific TSQ Quantiva triple quadrupole mass
spectrometer (LC/MS). A heated electrospray ionization (HESI) source created ions
that went to an ion transfer tube at 300C. Conditions used in HESI analysis Table 1.1.
Table 1.1. Conditions for HESI source of mass spec (V=voltage & AU= arbitrary unit)
Sample injections of 20 µL were by a CTC Analytics HTS PAL auto sampler
from glass LC sample vials with PTFE septa. The 20 µl aliquot was at a flow rate of
300 µL/min with initial conditions of 95 % aqueous 200 μM ammonium chloride, 200
μM ammonium acetate, 1% formic acid and 5% methanol, then at 5 min the
conditions changed to 5% aqueous 200 μM ammonium chloride, 200 μM ammonium
acetate, 1% formic acid and 95% methanol. At 7 minutes the solvent ratio returned to
the initial conditions and held until the completion of injection cycle at 8 minutes. The
negative ion spray voltage (V) 2500
sheath gas (AU) 40
auxillary gas (AU) 12
sweep gas (AU) 1
vaporizer temperature (°C) 260
Conditions for HESI source
9
LC column was a Thermo Scientific Acclaim Polar Advantage II C18 (PA2, 2.1x50
mm, 3 μm, 120 Å). Multiple reaction monitoring (MRM) transitions are shown for
each compound in Table 1.2.
Table 1.2. MRM transitions for organic explosive analytes
Compound Precursor (m/z) Product (m/z) Collision Energy (V) Retention Time (min)
351.03 46.15 16.93
351.03 62.11 10.25
226.03 46.24 26.58
226.03 165.93 15.31
226.03 196.09 12.83
257.12 35.24 32.50
257.12 46.01 28.35
257.12 82.17 10.25
219.00 89.04 34.88
219.00 125.00 27.04
219.00 160.94 13.03
2,4-
Dichlorophenoxy
acetic acid
6.4
5.6PETN
TNT 5.0
RDX 4.8
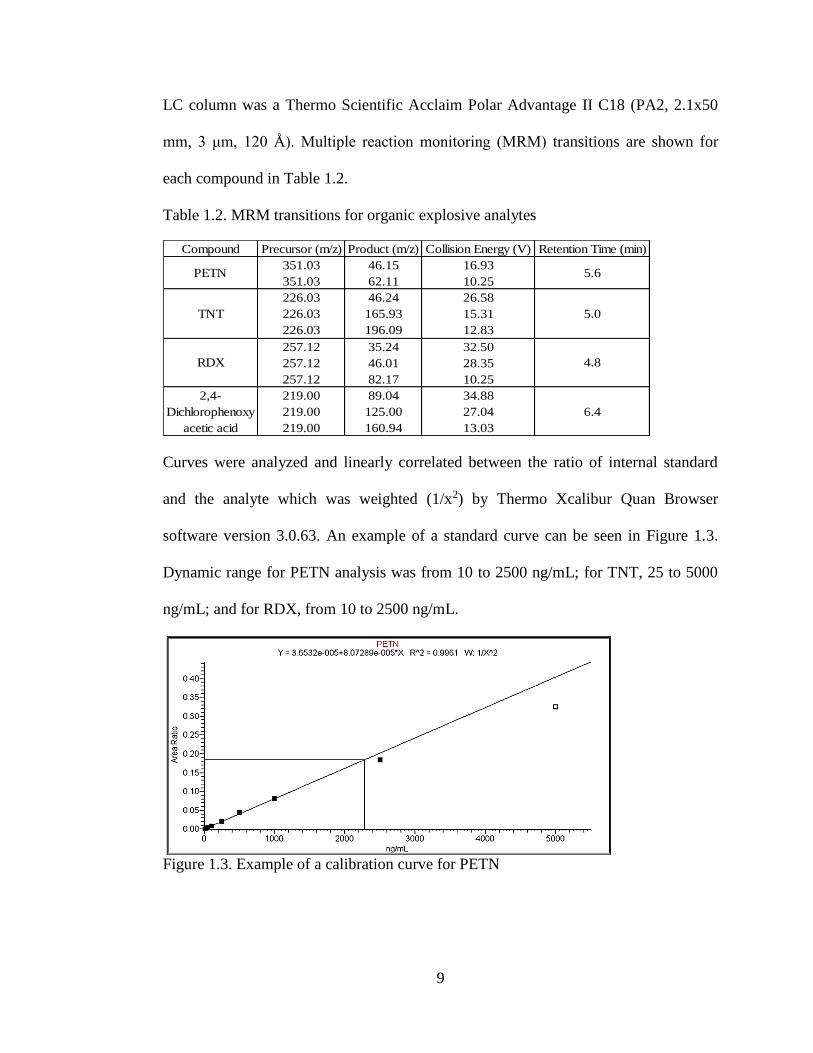
Curves were analyzed and linearly correlated between the ratio of internal standard
and the analyte which was weighted (1/x2) by Thermo Xcalibur Quan Browser
software version 3.0.63. An example of a standard curve can be seen in Figure 1.3.
Dynamic range for PETN analysis was from 10 to 2500 ng/mL; for TNT, 25 to 5000
ng/mL; and for RDX, from 10 to 2500 ng/mL.
Figure 1.3. Example of a calibration curve for PETN
10
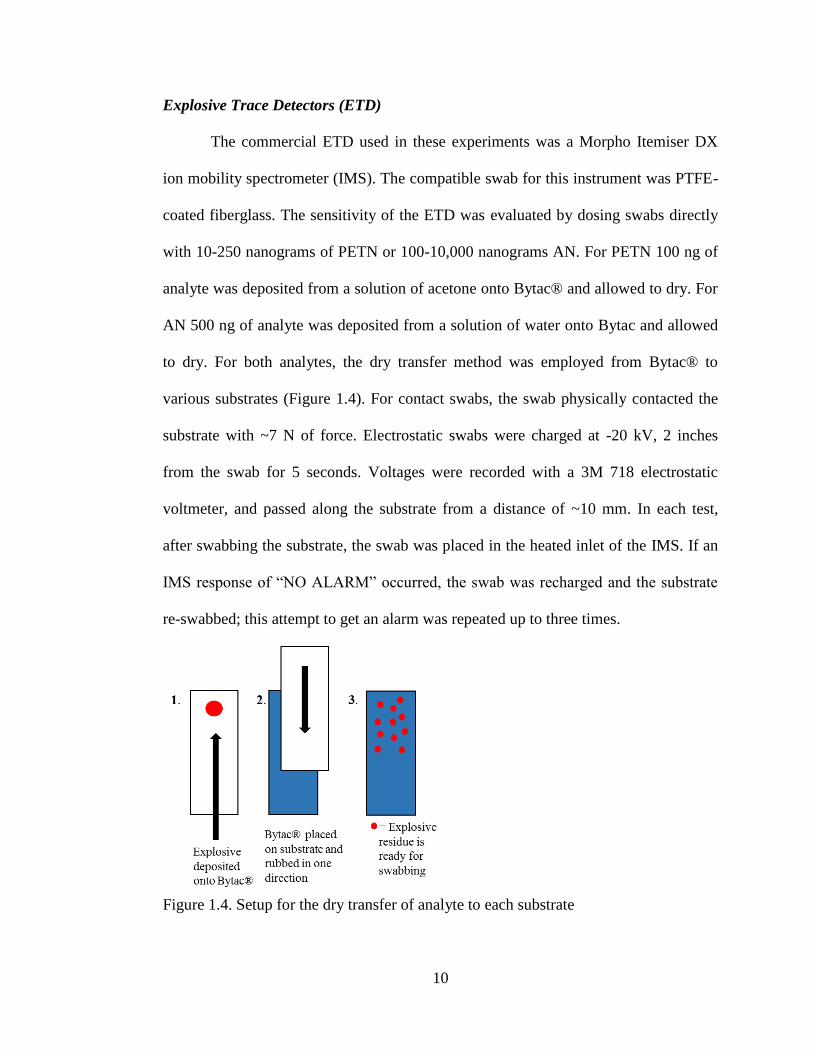
Explosive Trace Detectors (ETD)
The commercial ETD used in these experiments was a Morpho Itemiser DX
ion mobility spectrometer (IMS). The compatible swab for this instrument was PTFE-
coated fiberglass. The sensitivity of the ETD was evaluated by dosing swabs directly
with 10-250 nanograms of PETN or 100-10,000 nanograms AN. For PETN 100 ng of
analyte was deposited from a solution of acetone onto Bytac® and allowed to dry. For
AN 500 ng of analyte was deposited from a solution of water onto Bytac and allowed
to dry. For both analytes, the dry transfer method was employed from Bytac® to
various substrates (Figure 1.4). For contact swabs, the swab physically contacted the
substrate with ~7 N of force. Electrostatic swabs were charged at -20 kV, 2 inches
from the swab for 5 seconds. Voltages were recorded with a 3M 718 electrostatic
voltmeter, and passed along the substrate from a distance of ~10 mm. In each test,
after swabbing the substrate, the swab was placed in the heated inlet of the IMS. If an
IMS response of “NO ALARM” occurred, the swab was recharged and the substrate
re-swabbed; this attempt to get an alarm was repeated up to three times.
Figure 1.4. Setup for the dry transfer of analyte to each substrate
11
RESULTS AND DISCUSSION
Bulk Measurements
As a proof of concept, electrostatic pick up of visible amounts of surrogate
analytes, sucrose and sodium chloride, was performed (Figure 1.5, Table 1.3). An
electrostatic charge was applied to PTFE swabs by rubbing the swab on a
polyurethane foam roller. This triboelectric charging method resulted in swabs with
charges ranging from -1.32 kV to -3.61 kV. For the sucrose and sodium chloride data,
the relative humidity (RH) was 41% and 24%, respectively. On an index card, 100
milligrams of analyte was placed, and the charged swab was held over it at a fixed
distance—0, 10, 20, 30, 50, and 100 millimeters. For comparison, an uncharged swab,
was tested in a similar fashion. Efficiency of pickup was judged by the amount of
analyte remaining on the index card. Each test was done in triplicate. The nature of the
analyte, organic versus ionic, did not appear to affect the extent of pickup. However,
as expected, the farther away the swab was from the analyte, the less efficient the
pickup. There was a significant drop off from 20 mm to 30 mm. Results suggest the
maximum effective distance for any analyte transfer to a triboelectrically charged
swab is likely to be ~50 mm. Without a charge no significant amount of mass was
picked up at a distance greater than 0 millimeters. (Table 1.4).
12
Figure 1.5. Decrease of sucrose (A) and sodium chloride (B) pickup as a function of
distance
To determine the minimum charge necessary for pickup of analyte, 30 mg of
either PETN or AN were placed on an index card, and a PTFE swab was
triboelectrically charged, to voltages ranging 0.1 kV-1 kV. From a height of 10 mm,
analyte pickup was attempted. Both the index card and swab were weighed on an
analytical balance. Both analytes were picked up, even at these low voltages, although,
the highest pickup was (5 mg) which amounts to ~15% recovery (Figure 1.6).
Figure 1.6. Pickup of PETN and AN at low voltages in milligrams
A B
13
Table 1.3. Bulk Measurements of mass pickup of sucrose & NaCl on charged swabs
Distance
(mm)
Mass
sucrose
adsorbed
(mg)
Charge
(-kV)
Average
sucrose
absorbed
(mg)
Std
Dev
(mg)
Distance
(mm)
Mass
NaCl
adsorbed
(mg)
Charge
(-kV)
Average
NaCl
absorbed
(mg)
Std
Dev
(mg)
0 39.8 2.85 0 41.1 2.31
0 38.5 3.14 0 42.5 2.64
0 35.0 2.47 0 44.5 3.18
10 27.3 2.85 10 51.4 3.61
10 21.6 2.41 10 32.3 1.81
10 28.6 3.34 10 29.0 2.67
20 14.9 2.17 20 17.6 2.25
20 17.4 2.85 20 22.5 2.52
20 16.8 1.32 20 16.1 2.01
30 3.5 2.75 30 9.4 3.47
30 3.6 2.35 30 4.6 2.64
30 5 2.91 30 6.8 2.83
50 3 2.34 50 2.5 3.00
50 5 2.72 50 2 3.59
50 2 1.89 50 0 2.73
100 0 3.12 100 0 2.25
100 0 2.46 100 1 3.28
100 0 2.38 100 0 3.50
37.6 9.9
42.7 1.4
0.4 0.2
18.7 2.7
6.9 2.0
1.5 1.1
2.0
3.0
1.1
0.7
1
0
37.8
25.8
16.4
4
3
0
Table 1.4. Bulk measurements pickup of sucrose and NaCl on uncharged swabs
Distance
(mm)
Mass
sucrose
adsorbed
(mg)
Charge
(kV)
Distance
(mm)
Mass
NaCl
adsorbed
(mg)
Charge
(kV)
0 1.5 0.02 0 1.9 0.03
0 1.1 0.08 0 2.8 0.02
0 0.5 0 0 3.1 0.05
10 0 0.03 10 0 0.04
10 0 0.08 10 0.2 0.07
10 0.4 0.05 10 0.3 0.01
14
SEM Micrographs
Figure 1.7. SEM micrographs of select substrates (top rows) and swabs (bottom row)
Method for charging swabs
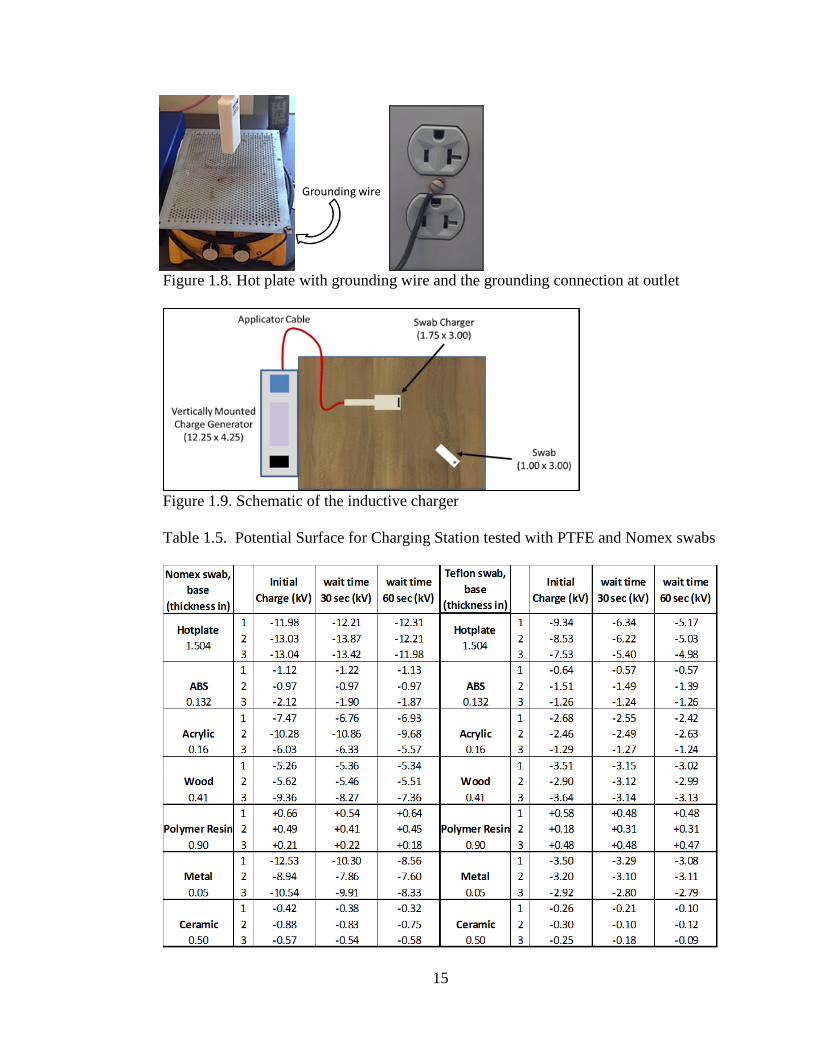
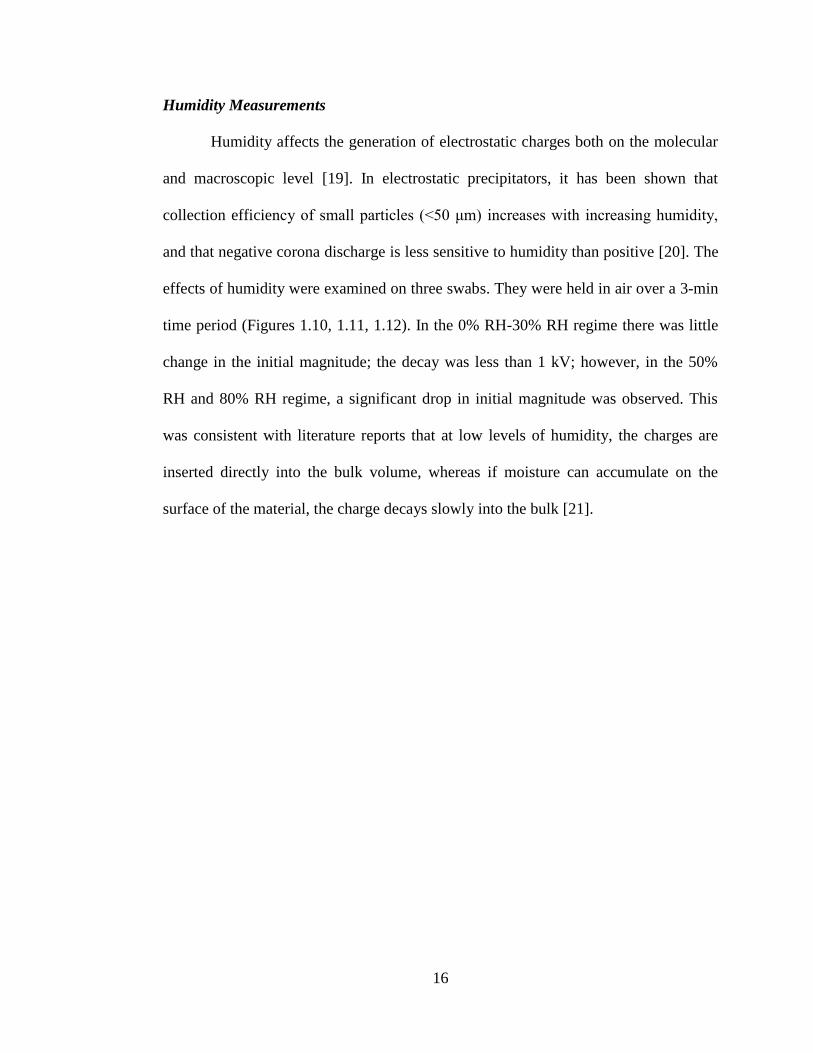
To charge swabs inductively, a pinner was fixed over an unheated hot plate
base which had been covered with a perforated metal (zinc coated steel) grounding
plate (Figure 1.8). The grounding plate had a screw in one corner and a wire which
was fixed to the screw of a traditional electrical outlet (A schematic is shown in Figure
1.9). The contact was tested with a multi-meter to verify proper grounding. Since the
use of inductive charging relies on the attraction of a charge through the swab to a
base, various bases were examined (Table 1.5). Tests were performed charging at -20
kV and 2 inches from the swab for 5 seconds at 40% RH. Voltages were measured
using a 3M 718 electrostatic voltmeter, and a static dissipater was used to eliminate
excess charge before each experiment. Results, shown in Table 1.5, indicated no
change in the base surface would be necessary.
15
Figure 1.8. Hot plate with grounding wire and the grounding connection at outlet
Figure 1.9. Schematic of the inductive charger
Table 1.5. Potential Surface for Charging Station tested with PTFE and Nomex swabs
16
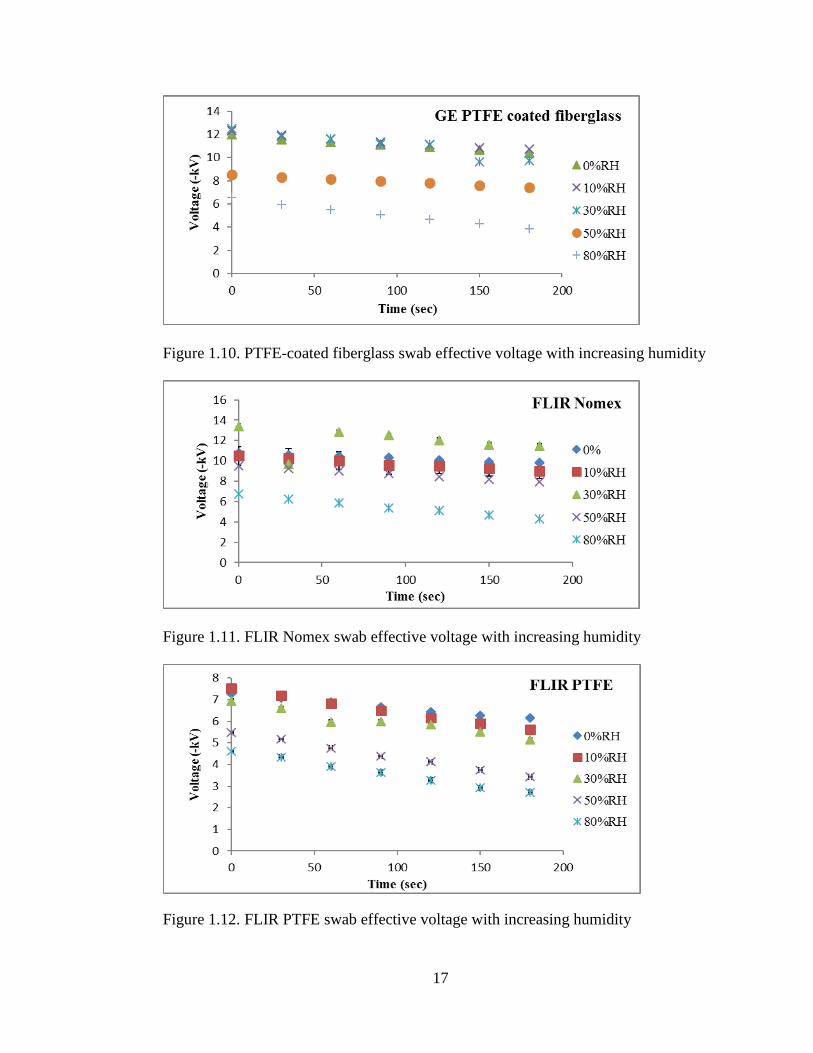
Humidity Measurements
Humidity affects the generation of electrostatic charges both on the molecular
and macroscopic level [19]. In electrostatic precipitators, it has been shown that
collection efficiency of small particles (<50 μm) increases with increasing humidity,
and that negative corona discharge is less sensitive to humidity than positive [20]. The
effects of humidity were examined on three swabs. They were held in air over a 3-min
time period (Figures 1.10, 1.11, 1.12). In the 0% RH-30% RH regime there was little
change in the initial magnitude; the decay was less than 1 kV; however, in the 50%
RH and 80% RH regime, a significant drop in initial magnitude was observed. This
was consistent with literature reports that at low levels of humidity, the charges are
inserted directly into the bulk volume, whereas if moisture can accumulate on the
surface of the material, the charge decays slowly into the bulk [21].
17
Figure 1.10. PTFE-coated fiberglass swab effective voltage with increasing humidity
Figure 1.11. FLIR Nomex swab effective voltage with increasing humidity
Figure 1.12. FLIR PTFE swab effective voltage with increasing humidity
18
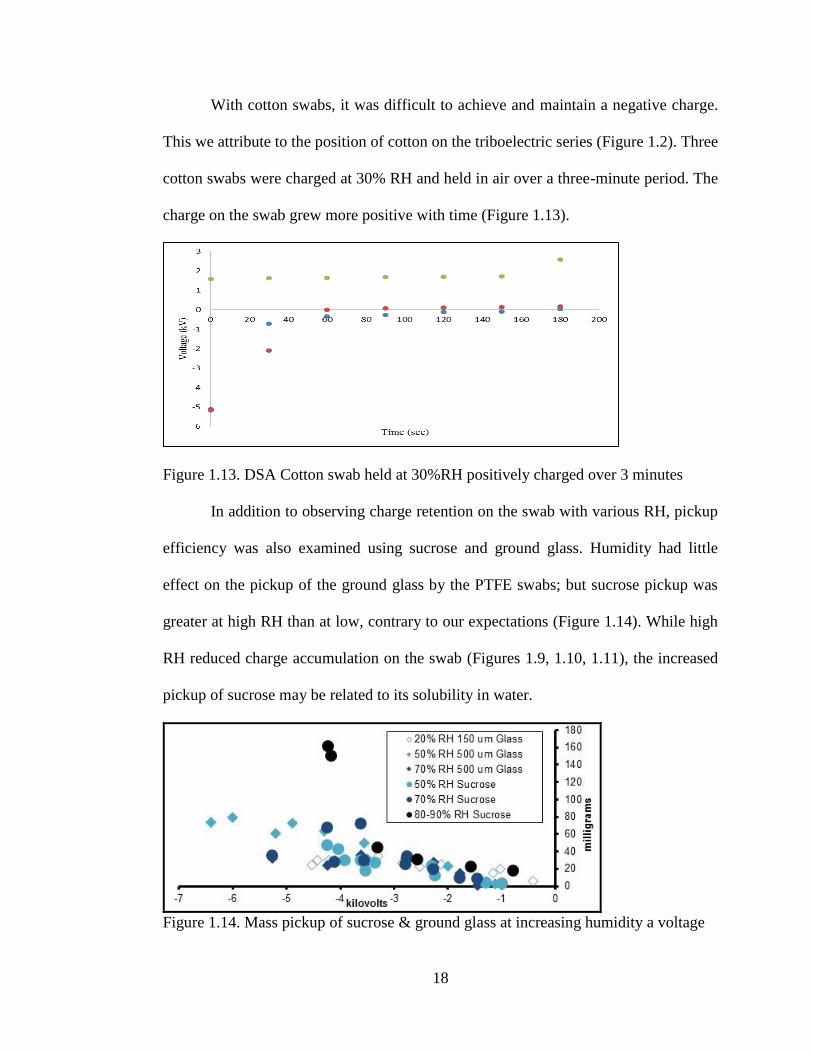
With cotton swabs, it was difficult to achieve and maintain a negative charge.
This we attribute to the position of cotton on the triboelectric series (Figure 1.2). Three
cotton swabs were charged at 30% RH and held in air over a three-minute period. The
charge on the swab grew more positive with time (Figure 1.13).
Figure 1.13. DSA Cotton swab held at 30%RH positively charged over 3 minutes
In addition to observing charge retention on the swab with various RH, pickup
efficiency was also examined using sucrose and ground glass. Humidity had little
effect on the pickup of the ground glass by the PTFE swabs; but sucrose pickup was
greater at high RH than at low, contrary to our expectations (Figure 1.14). While high
RH reduced charge accumulation on the swab (Figures 1.9, 1.10, 1.11), the increased
pickup of sucrose may be related to its solubility in water.
Figure 1.14. Mass pickup of sucrose & ground glass at increasing humidity a voltage
19
Swabbing and Swab Preparation
For contact swabs, they were physically rubbed against the substrate with the
experimenter attempting to apply ~7 N of force [22-23]. Electrostatically enhanced
swabs were charged by the inductive charging method and then passed along the
substrate from a distance of ~10 mm.
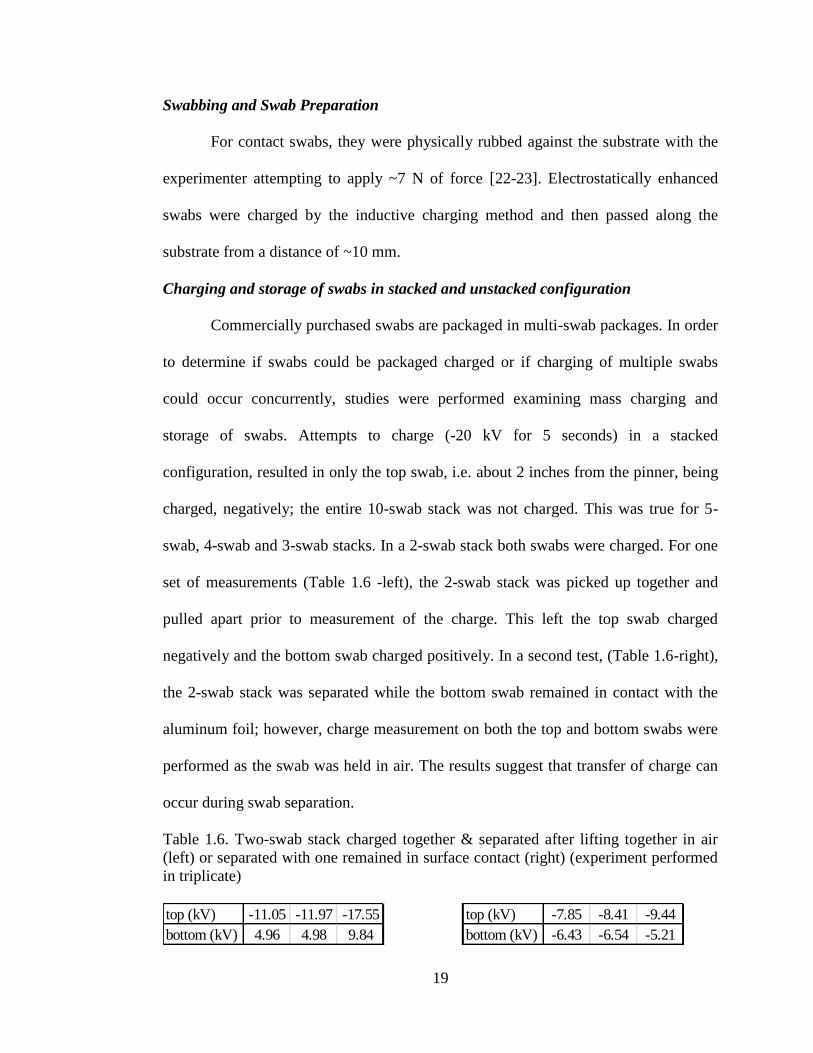
Charging and storage of swabs in stacked and unstacked configuration
Commercially purchased swabs are packaged in multi-swab packages. In order
to determine if swabs could be packaged charged or if charging of multiple swabs
could occur concurrently, studies were performed examining mass charging and
storage of swabs. Attempts to charge (-20 kV for 5 seconds) in a stacked
configuration, resulted in only the top swab, i.e. about 2 inches from the pinner, being
charged, negatively; the entire 10-swab stack was not charged. This was true for 5-
swab, 4-swab and 3-swab stacks. In a 2-swab stack both swabs were charged. For one
set of measurements (Table 1.6 -left), the 2-swab stack was picked up together and
pulled apart prior to measurement of the charge. This left the top swab charged
negatively and the bottom swab charged positively. In a second test, (Table 1.6-right),
the 2-swab stack was separated while the bottom swab remained in contact with the
aluminum foil; however, charge measurement on both the top and bottom swabs were
performed as the swab was held in air. The results suggest that transfer of charge can
occur during swab separation.
Table 1.6. Two-swab stack charged together & separated after lifting together in air
(left) or separated with one remained in surface contact (right) (experiment performed
in triplicate)
top (kV) -11.05 -11.97 -17.55 top (kV) -7.85 -8.41 -9.44
bottom (kV) 4.96 4.98 9.84 bottom (kV) -6.43 -6.54 -5.21
20
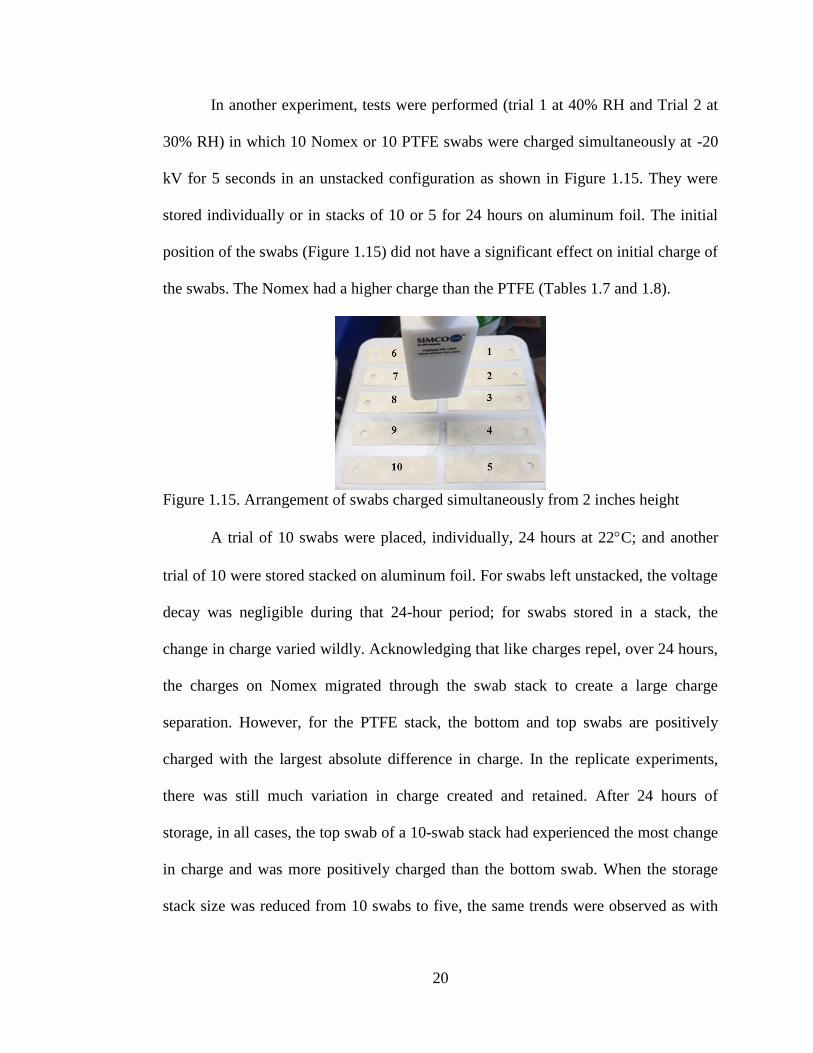
In another experiment, tests were performed (trial 1 at 40% RH and Trial 2 at
30% RH) in which 10 Nomex or 10 PTFE swabs were charged simultaneously at -20
kV for 5 seconds in an unstacked configuration as shown in Figure 1.15. They were
stored individually or in stacks of 10 or 5 for 24 hours on aluminum foil. The initial
position of the swabs (Figure 1.15) did not have a significant effect on initial charge of
the swabs. The Nomex had a higher charge than the PTFE (Tables 1.7 and 1.8).
Figure 1.15. Arrangement of swabs charged simultaneously from 2 inches height
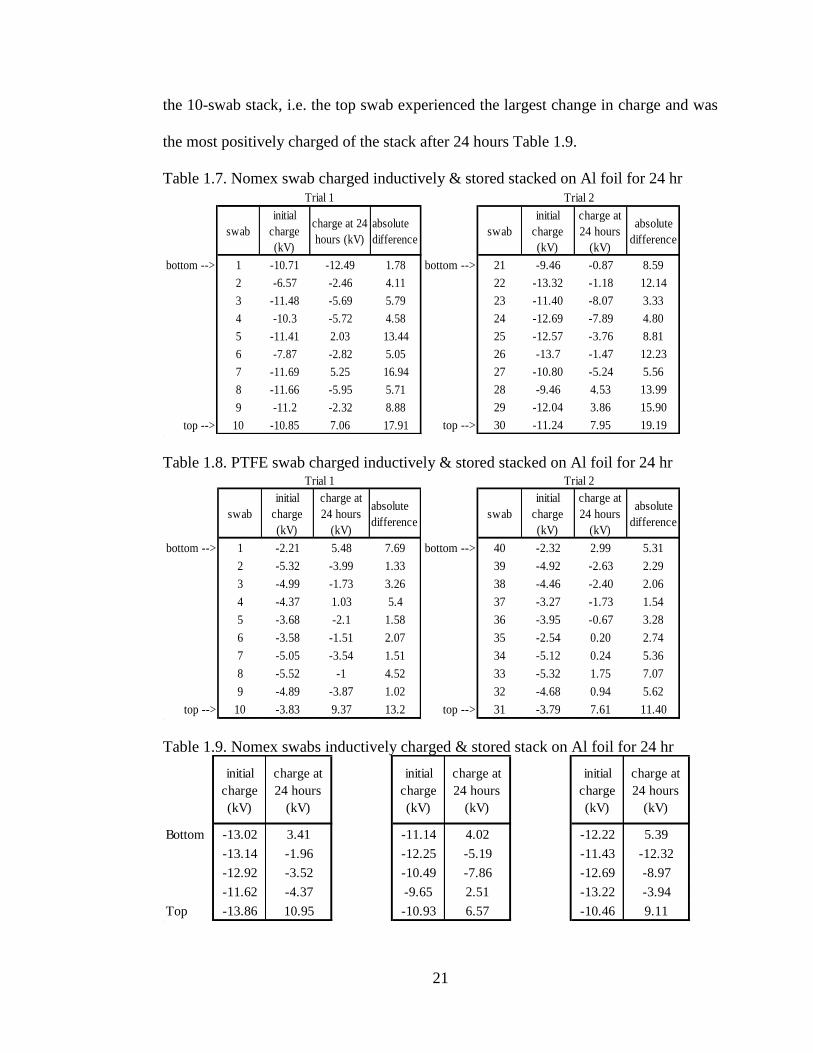
A trial of 10 swabs were placed, individually, 24 hours at 22C; and another
trial of 10 were stored stacked on aluminum foil. For swabs left unstacked, the voltage
decay was negligible during that 24-hour period; for swabs stored in a stack, the
change in charge varied wildly. Acknowledging that like charges repel, over 24 hours,
the charges on Nomex migrated through the swab stack to create a large charge
separation. However, for the PTFE stack, the bottom and top swabs are positively
charged with the largest absolute difference in charge. In the replicate experiments,
there was still much variation in charge created and retained. After 24 hours of
storage, in all cases, the top swab of a 10-swab stack had experienced the most change
in charge and was more positively charged than the bottom swab. When the storage
stack size was reduced from 10 swabs to five, the same trends were observed as with
21
the 10-swab stack, i.e. the top swab experienced the largest change in charge and was
the most positively charged of the stack after 24 hours Table 1.9.
Table 1.7. Nomex swab charged inductively & stored stacked on Al foil for 24 hr
swab
initial
charge
(kV)
charge at 24
hours (kV)
absolute
difference
bottom --> 1 -10.71 -12.49 1.78
2 -6.57 -2.46 4.11
3 -11.48 -5.69 5.79
4 -10.3 -5.72 4.58
5 -11.41 2.03 13.44
6 -7.87 -2.82 5.05
7 -11.69 5.25 16.94
8 -11.66 -5.95 5.71
9 -11.2 -2.32 8.88
top --> 10 -10.85 7.06 17.91
Trial 1
Table 1.8. PTFE swab charged inductively & stored stacked on Al foil for 24 hr
swab
initial
charge
(kV)
charge at
24 hours
(kV)
absolute
difference
bottom --> 1 -2.21 5.48 7.69
2 -5.32 -3.99 1.33
3 -4.99 -1.73 3.26
4 -4.37 1.03 5.4
5 -3.68 -2.1 1.58
6 -3.58 -1.51 2.07
7 -5.05 -3.54 1.51
8 -5.52 -1 4.52
9 -4.89 -3.87 1.02
top --> 10 -3.83 9.37 13.2
Trial 1
swab
initial
charge
(kV)
charge at
24 hours
(kV)
absolute
difference
bottom --> 40 -2.32 2.99 5.31
39 -4.92 -2.63 2.29
38 -4.46 -2.40 2.06
37 -3.27 -1.73 1.54
36 -3.95 -0.67 3.28
35 -2.54 0.20 2.74
34 -5.12 0.24 5.36
33 -5.32 1.75 7.07
32 -4.68 0.94 5.62
top --> 31 -3.79 7.61 11.40
Trial 2
Table 1.9. Nomex swabs inductively charged & stored stack on Al foil for 24 hr
initial
charge
(kV)
charge at
24 hours
(kV)
initial
charge
(kV)
charge at
24 hours
(kV)
initial
charge
(kV)
charge at
24 hours
(kV)
Bottom -13.02 3.41 -11.14 4.02 -12.22 5.39
-13.14 -1.96 -12.25 -5.19 -11.43 -12.32
-12.92 -3.52 -10.49 -7.86 -12.69 -8.97
-11.62 -4.37 -9.65 2.51 -13.22 -3.94
Top -13.86 10.95 -10.93 6.57 -10.46 9.11
Trial 2: Stored unstacked on aluminum foil
swab
initial
charge
(kV)
charge at
24 hours
(kV)
absolute
difference
bottom --> 21 -9.46 -0.87 8.59
22 -13.32 -1.18 12.14
23 -11.40 -8.07 3.33
24 -12.69 -7.89 4.80
25 -12.57 -3.76 8.81
26 -13.7 -1.47 12.23
27 -10.80 -5.24 5.56
28 -9.46 4.53 13.99
29 -12.04 3.86 15.90
top --> 30 -11.24 7.95 19.19
Trial 2
22
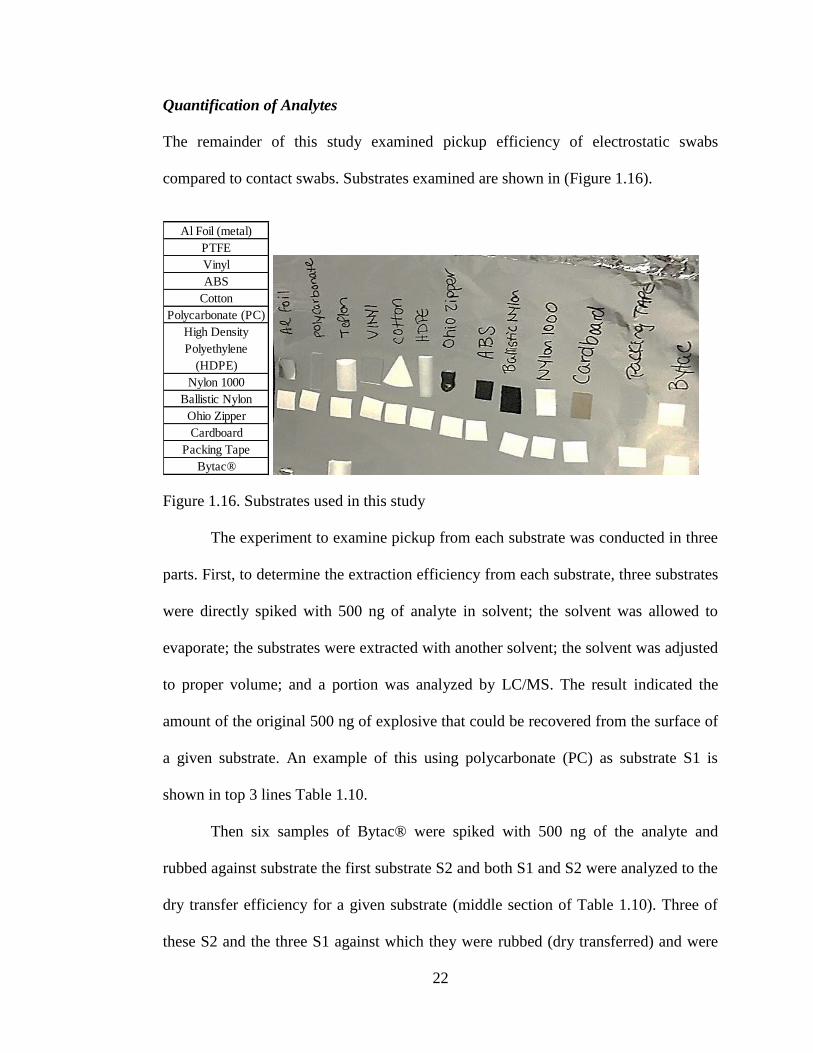
Quantification of Analytes
The remainder of this study examined pickup efficiency of electrostatic swabs
compared to contact swabs. Substrates examined are shown in (Figure 1.16).
Al Foil (metal)
PTFE
Vinyl
ABS
Cotton
Polycarbonate (PC)
High Density
Polyethylene
(HDPE)
Nylon 1000
Ballistic Nylon
Ohio Zipper
Cardboard
Packing Tape
Bytac®
Figure 1.16. Substrates used in this study
The experiment to examine pickup from each substrate was conducted in three
parts. First, to determine the extraction efficiency from each substrate, three substrates
were directly spiked with 500 ng of analyte in solvent; the solvent was allowed to
evaporate; the substrates were extracted with another solvent; the solvent was adjusted
to proper volume; and a portion was analyzed by LC/MS. The result indicated the
amount of the original 500 ng of explosive that could be recovered from the surface of
a given substrate. An example of this using polycarbonate (PC) as substrate S1 is
shown in top 3 lines Table 1.10.
Then six samples of Bytac® were spiked with 500 ng of the analyte and
rubbed against substrate the first substrate S2 and both S1 and S2 were analyzed to the
dry transfer efficiency for a given substrate (middle section of Table 1.10). Three of
these S2 and the three S1 against which they were rubbed (dry transferred) and were
23
extracted with solvent; the solvent was adjusted to proper volume, and was analyzed
by LC/MS. The result indicated the amount of explosive that could possibly be
transferred from S2 to the swab. That amount plus that remaining on S1 ideally would
add to 500 ng (1, middle section). Then, six more Bytac® (S1) were directly spiked
with 500 ng of analyte, dry transferred to S2, then three of the S2 were swabbed by
contact, i.e. directly rubbing the Nomex swab against S2 (~7 N force) and three of the
S2 were swabbed using the electrostatically enhanced Nomex swabs.
Then, these six swabs, S2, and S1 were extracted with solvent; the solvent was
adjusted to proper volume; and a portion was analyzed by LC/MS. For any given set,
the amount of explosive left on S1 and S2 and found on the swab should have added to
500 ng. The amount of explosive found on the three electrostatically enhanced swabs
versus the three contact swabs is shown in Table 1.10 (bottom section) along with
percent recovery. A metric of success is labeled Percent Recovery where the
nanograms of analyte on the swab (contact or electrostatic) are divided by the total
amount of nanograms recovered from 500 ng and displayed as a percentage. For
example, in the last line of Table 1.10, 351 ng were found on the swab out of a total
recovery of 475 ng. This translates to a 74% recovery.

24
Polycarbonate
The results shown in Table 1.10 for both contact and electrostatic swabs are below 100
ng, except for one outlier (3rd electrostatic swab). These results suggest analyte on
polycarbonate is difficult to sorb onto a swab, whether contact or electrostatic. This
could be related to the smoothness of the polycarbonate surface.
Table 1.10. Nomex contact & electrostatic swabbing for PETN from polycarbonate
Electrostatic swabs charged to -8.99 kV, -10.23 kV, & -13.01 kV at RH 25%.
PETN was deposited from a solution of acetone
Substrate (S1)
for direct
deposit
Substrate (S2)
onto which dry
transfer
ng PETN
out of
500ng
Polycarbonate -- 424
Polycarbonate -- 413
Polycarbonate -- 328
Substrate (S1)
for direct
deposit
Substrate (S2)
onto which dry
transfer
remaining
on S1
remaining
on S2
Total ng
PETN
recovered
from 500 ng
Bytac Polycarbonate 228 267 495
Bytac Polycarbonate 312 136 448
Bytac Polycarbonate 13 372 385
Substrate (S1)
for direct
deposit
Substrate (S2)
onto which dry
transfer
remaining
on S1
remaining
on S2
ng PETN on
Nomex by
CONTACT
swabbing
ng PETN on Nomex
by
ELECTROSTATIC
swabbing
Total ng
PETN
recovered
from 500 ng
Percent
Recovery
%
Bytac Polycarbonate 326 160 95 581 16
Bytac Polycarbonate 114 281 44 439 10
Bytac Polycarbonate 99 212 41 352 12
Bytac Polycarbonate 228 155 92 475 19
Bytac Polycarbonate 74 269 86 429 20
Bytac Polycarbonate 13 111 351 475 74
25
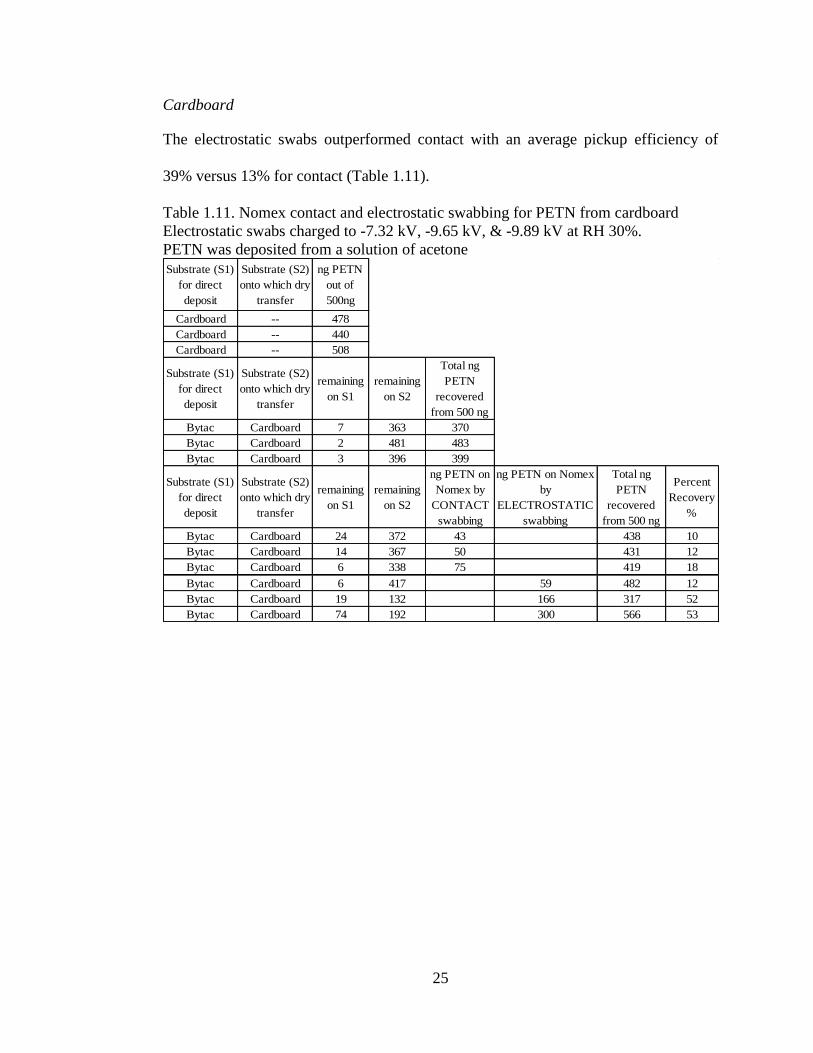
Cardboard
The electrostatic swabs outperformed contact with an average pickup efficiency of
39% versus 13% for contact (Table 1.11).
Table 1.11. Nomex contact and electrostatic swabbing for PETN from cardboard
Electrostatic swabs charged to -7.32 kV, -9.65 kV, & -9.89 kV at RH 30%.
PETN was deposited from a solution of acetone
Substrate (S1)
for direct
deposit
Substrate (S2)
onto which dry
transfer
ng PETN
out of
500ng
Cardboard -- 478
Cardboard -- 440
Cardboard -- 508
Substrate (S1)
for direct
deposit
Substrate (S2)
onto which dry
transfer
remaining
on S1
remaining
on S2
Total ng
PETN
recovered
from 500 ng
Bytac Cardboard 7 363 370
Bytac Cardboard 2 481 483
Bytac Cardboard 3 396 399
Substrate (S1)
for direct
deposit
Substrate (S2)
onto which dry
transfer
remaining
on S1
remaining
on S2
ng PETN on
Nomex by
CONTACT
swabbing
ng PETN on Nomex
by
ELECTROSTATIC
swabbing
Total ng
PETN
recovered
from 500 ng
Percent
Recovery
%
Bytac Cardboard 24 372 43 438 10
Bytac Cardboard 14 367 50 431 12
Bytac Cardboard 6 338 75 419 18
Bytac Cardboard 6 417 59 482 12
Bytac Cardboard 19 132 166 317 52
Bytac Cardboard 74 192 300 566 53

26
Bytac®
The average total recovery was low but the electrostatically enhanced swab recovered
more PETN than the contact swabs (Table 1.12).
Table 1.12. Nomex contact and electrostatic swabbing for PETN from Bytac®
Electrostatic swabs charged to -8.17 kV, -9.37 kV& -10.28 kV at RH 5%.
PETN was deposited from a solution of acetone Substrate (S1)
for direct
deposit
Substrate (S2)
onto which dry
transfer
ng PETN
out of
500ng
Bytac -- 486
Bytac -- 526
Bytac -- 483
Substrate (S1)
for direct
deposit
Substrate (S2)
onto which dry
transfer
remaining
on S1
remaining
on S2
Total ng
PETN
recovered
from 500 ng
Bytac Bytac 408 26 434
Bytac Bytac 311 244 555
Bytac Bytac 279 261 540
Substrate (S1)
for direct
deposit
Substrate (S2)
onto which dry
transfer
remaining
on S1
remaining
on S2
ng PETN on
Nomex by
CONTACT
swabbing
ng PETN on Nomex
by
ELECTROSTATIC
swabbing
Total ng
PETN
recovered
from 500 ng
Percent
Recovery
%
Bytac Bytac 439 22 7 468 2
Bytac Bytac 291 44 15 350 4
Bytac Bytac 360 52 10 421 2
Bytac Bytac 383 62 20 465 4
Bytac Bytac 123 212 108 444 24
Bytac Bytac 168 50 123 340 36
27
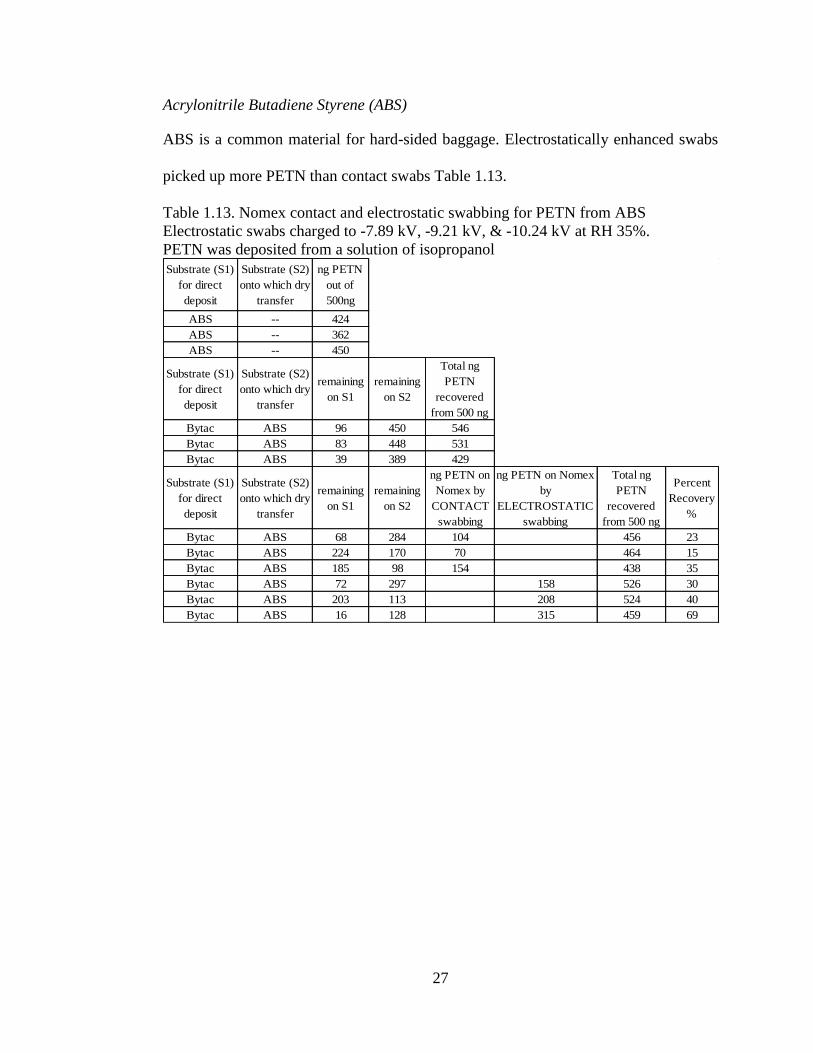
Acrylonitrile Butadiene Styrene (ABS)
ABS is a common material for hard-sided baggage. Electrostatically enhanced swabs
picked up more PETN than contact swabs Table 1.13.
Table 1.13. Nomex contact and electrostatic swabbing for PETN from ABS
Electrostatic swabs charged to -7.89 kV, -9.21 kV, & -10.24 kV at RH 35%.
PETN was deposited from a solution of isopropanol
Substrate (S1)
for direct
deposit
Substrate (S2)
onto which dry
transfer
ng PETN
out of
500ng
ABS -- 424
ABS -- 362
ABS -- 450
Substrate (S1)
for direct
deposit
Substrate (S2)
onto which dry
transfer
remaining
on S1
remaining
on S2
Total ng
PETN
recovered
from 500 ng
Bytac ABS 96 450 546
Bytac ABS 83 448 531
Bytac ABS 39 389 429
Substrate (S1)
for direct
deposit
Substrate (S2)
onto which dry
transfer
remaining
on S1
remaining
on S2
ng PETN on
Nomex by
CONTACT
swabbing
ng PETN on Nomex
by
ELECTROSTATIC
swabbing
Total ng
PETN
recovered
from 500 ng
Percent
Recovery
%
Bytac ABS 68 284 104 456 23
Bytac ABS 224 170 70 464 15
Bytac ABS 185 98 154 438 35
Bytac ABS 72 297 158 526 30
Bytac ABS 203 113 208 524 40
Bytac ABS 16 128 315 459 69
28
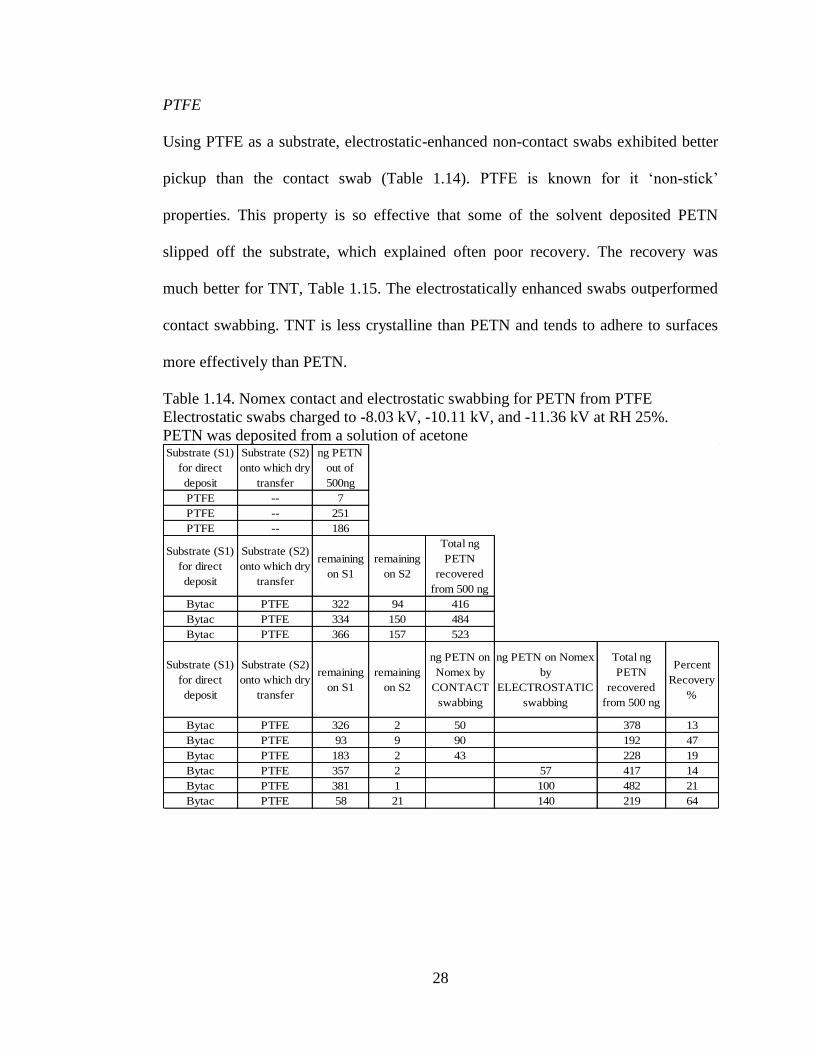
PTFE
Using PTFE as a substrate, electrostatic-enhanced non-contact swabs exhibited better
pickup than the contact swab (Table 1.14). PTFE is known for it ‘non-stick’
properties. This property is so effective that some of the solvent deposited PETN
slipped off the substrate, which explained often poor recovery. The recovery was
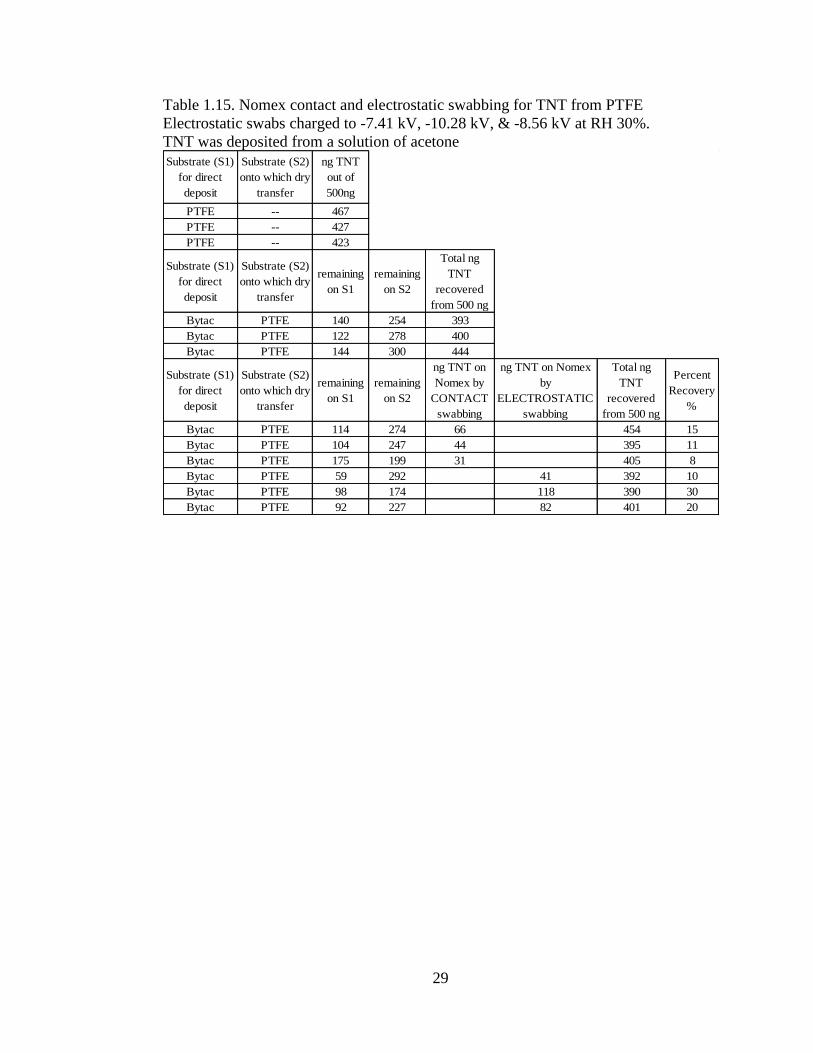
much better for TNT, Table 1.15. The electrostatically enhanced swabs outperformed
contact swabbing. TNT is less crystalline than PETN and tends to adhere to surfaces
more effectively than PETN.
Table 1.14. Nomex contact and electrostatic swabbing for PETN from PTFE
Electrostatic swabs charged to -8.03 kV, -10.11 kV, and -11.36 kV at RH 25%.
PETN was deposited from a solution of acetone Substrate (S1)
for direct
deposit
Substrate (S2)
onto which dry
transfer
ng PETN
out of
500ng
PTFE -- 7
PTFE -- 251
PTFE -- 186
Substrate (S1)
for direct
deposit
Substrate (S2)
onto which dry
transfer
remaining
on S1
remaining
on S2
Total ng
PETN
recovered
from 500 ng
Bytac PTFE 322 94 416
Bytac PTFE 334 150 484
Bytac PTFE 366 157 523
Substrate (S1)
for direct
deposit
Substrate (S2)
onto which dry
transfer
remaining
on S1
remaining
on S2
ng PETN on
Nomex by
CONTACT
swabbing
ng PETN on Nomex
by
ELECTROSTATIC
swabbing
Total ng
PETN
recovered
from 500 ng
Percent
Recovery
%
Bytac PTFE 326 2 50 378 13
Bytac PTFE 93 9 90 192 47
Bytac PTFE 183 2 43 228 19
Bytac PTFE 357 2 57 417 14
Bytac PTFE 381 1 100 482 21
Bytac PTFE 58 21 140 219 64
29
Table 1.15. Nomex contact and electrostatic swabbing for TNT from PTFE
Electrostatic swabs charged to -7.41 kV, -10.28 kV, & -8.56 kV at RH 30%.
TNT was deposited from a solution of acetone
Substrate (S1)
for direct
deposit
Substrate (S2)
onto which dry
transfer
ng TNT
out of
500ng
PTFE -- 467
PTFE -- 427
PTFE -- 423
Substrate (S1)
for direct
deposit
Substrate (S2)
onto which dry
transfer
remaining
on S1
remaining
on S2
Total ng
TNT
recovered
from 500 ng
Bytac PTFE 140 254 393
Bytac PTFE 122 278 400
Bytac PTFE 144 300 444
Substrate (S1)
for direct
deposit
Substrate (S2)
onto which dry
transfer
remaining
on S1
remaining
on S2
ng TNT on
Nomex by
CONTACT
swabbing
ng TNT on Nomex
by
ELECTROSTATIC
swabbing
Total ng
TNT
recovered
from 500 ng
Percent
Recovery
%
Bytac PTFE 114 274 66 454 15
Bytac PTFE 104 247 44 395 11
Bytac PTFE 175 199 31 405 8
Bytac PTFE 59 292 41 392 10
Bytac PTFE 98 174 118 390 30
Bytac PTFE 92 227 82 401 20
30
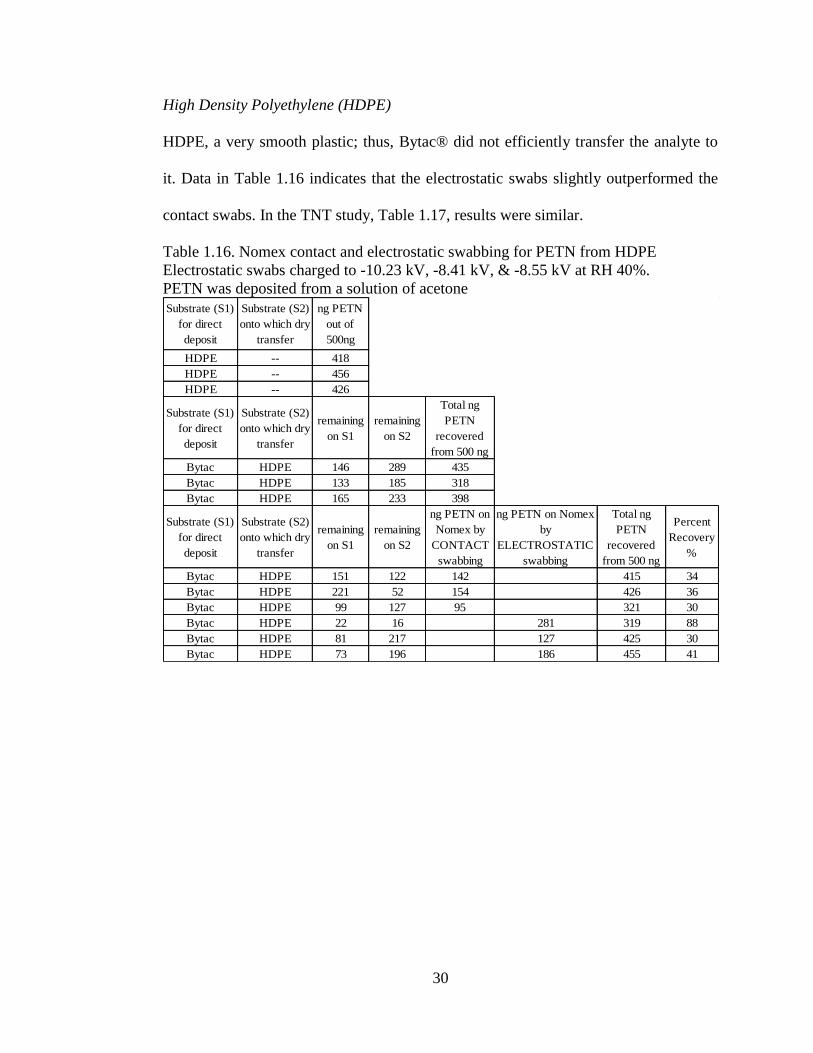
High Density Polyethylene (HDPE)
HDPE, a very smooth plastic; thus, Bytac® did not efficiently transfer the analyte to
it. Data in Table 1.16 indicates that the electrostatic swabs slightly outperformed the
contact swabs. In the TNT study, Table 1.17, results were similar.
Table 1.16. Nomex contact and electrostatic swabbing for PETN from HDPE
Electrostatic swabs charged to -10.23 kV, -8.41 kV, & -8.55 kV at RH 40%.
PETN was deposited from a solution of acetone
Substrate (S1)
for direct
deposit
Substrate (S2)
onto which dry
transfer
ng PETN
out of
500ng
HDPE -- 418
HDPE -- 456
HDPE -- 426
Substrate (S1)
for direct
deposit
Substrate (S2)
onto which dry
transfer
remaining
on S1
remaining
on S2
Total ng
PETN
recovered
from 500 ng
Bytac HDPE 146 289 435
Bytac HDPE 133 185 318
Bytac HDPE 165 233 398
Substrate (S1)
for direct
deposit
Substrate (S2)
onto which dry
transfer
remaining
on S1
remaining
on S2
ng PETN on
Nomex by
CONTACT
swabbing
ng PETN on Nomex
by
ELECTROSTATIC
swabbing
Total ng
PETN
recovered
from 500 ng
Percent
Recovery
%
Bytac HDPE 151 122 142 415 34
Bytac HDPE 221 52 154 426 36
Bytac HDPE 99 127 95 321 30
Bytac HDPE 22 16 281 319 88
Bytac HDPE 81 217 127 425 30
Bytac HDPE 73 196 186 455 41

31
Table 1.17. Nomex contact and electrostatic swabbing for TNT from HDPE
Electrostatic swabs charged to -9.23 kV, -8.74 kV, and -10.16 kV at RH 40%.
TNT was deposited from a solution of acetone
Substrate (S1)
for direct
deposit
Substrate (S2)
onto which dry
transfer
ng TNT
out of
500ng
HDPE -- 441
HDPE -- 499
HDPE -- 491
Substrate (S1)
for direct
deposit
Substrate (S2)
onto which dry
transfer
remaining
on S1
remaining
on S2
Total ng
TNT
recovered
from 500 ng
Bytac HDPE 57 475 532
Bytac HDPE 90 363 453
Bytac HDPE 0 443 443
Substrate (S1)
for direct
deposit
Substrate (S2)
onto which dry
transfer
remaining
on S1
remaining
on S2
ng TNT on
Nomex by
CONTACT
swabbing
ng TNT on Nomex
by
ELECTROSTATIC
swabbing
Total ng
TNT
recovered
from 500 ng
Percent
Recovery
%
Bytac HDPE 0 42 354 397 89
Bytac HDPE 78 40 354 472 75
Bytac HDPE 95 180 205 480 43
Bytac HDPE 93 119 294 507 58
Bytac HDPE 92 30 394 516 76
Bytac HDPE 0 65 355 420 84
32
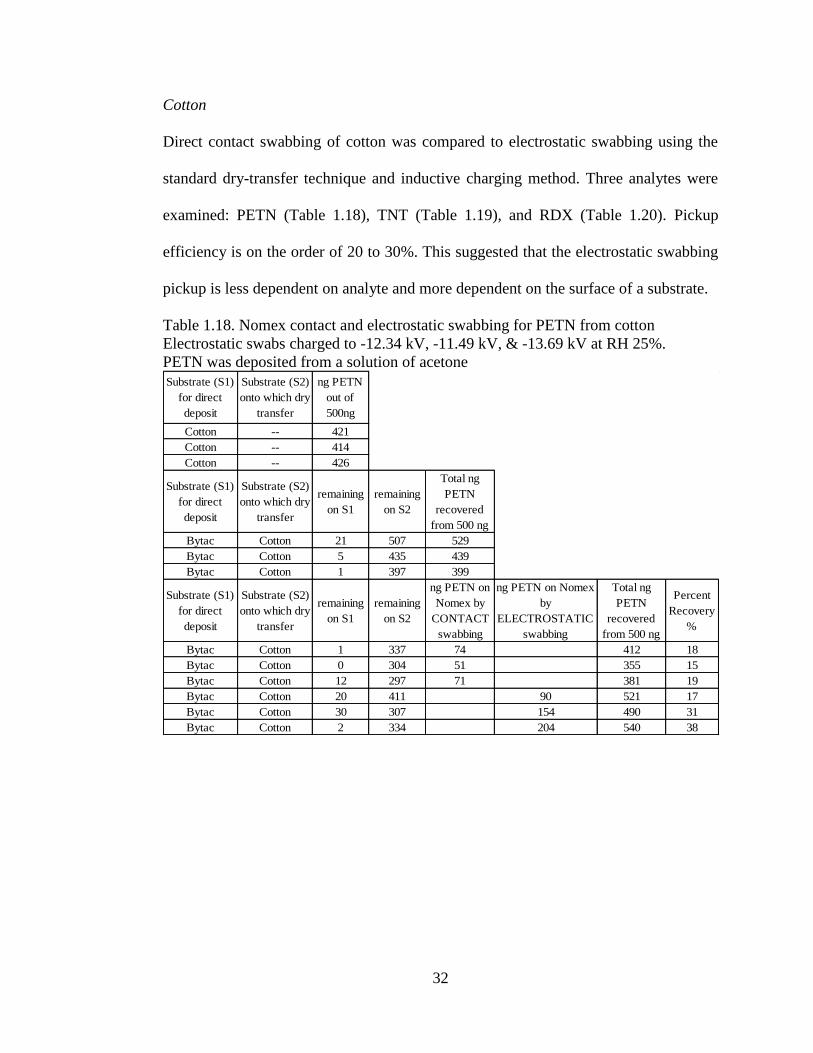
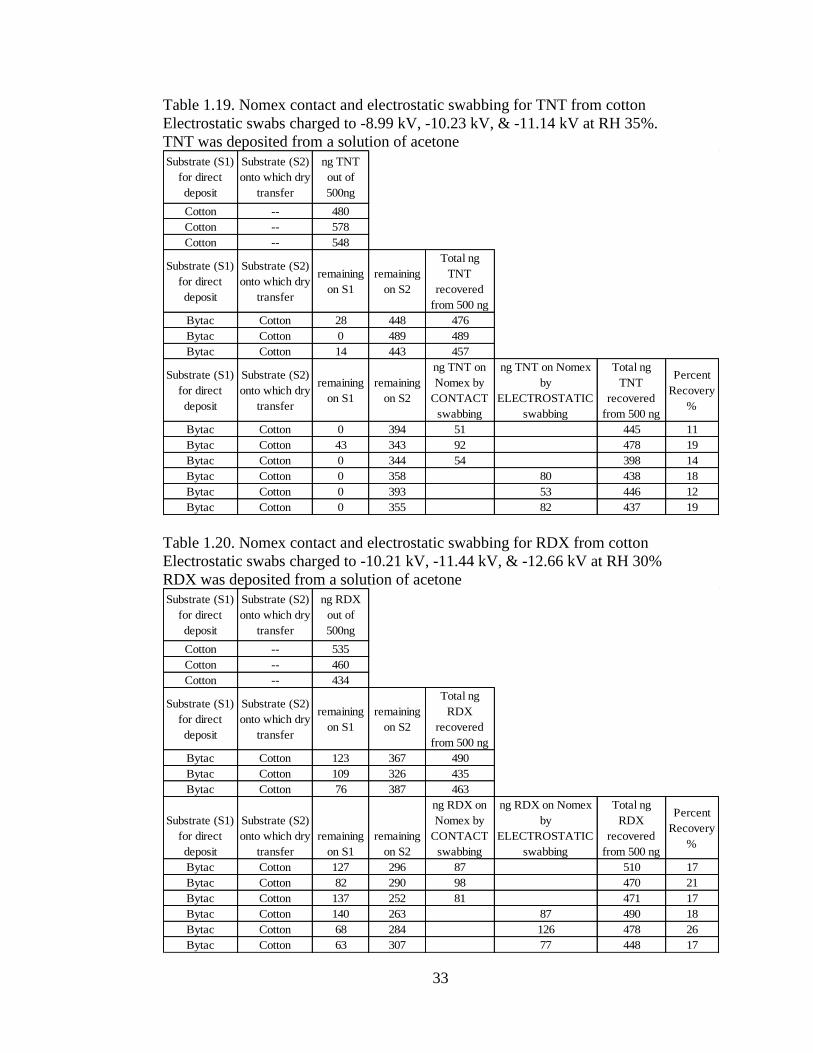
Cotton
Direct contact swabbing of cotton was compared to electrostatic swabbing using the
standard dry-transfer technique and inductive charging method. Three analytes were
examined: PETN (Table 1.18), TNT (Table 1.19), and RDX (Table 1.20). Pickup
efficiency is on the order of 20 to 30%. This suggested that the electrostatic swabbing
pickup is less dependent on analyte and more dependent on the surface of a substrate.
Table 1.18. Nomex contact and electrostatic swabbing for PETN from cotton
Electrostatic swabs charged to -12.34 kV, -11.49 kV, & -13.69 kV at RH 25%.
PETN was deposited from a solution of acetone
Substrate (S1)
for direct
deposit
Substrate (S2)
onto which dry
transfer
ng PETN
out of
500ng
Cotton -- 421
Cotton -- 414
Cotton -- 426
Substrate (S1)
for direct
deposit
Substrate (S2)
onto which dry
transfer
remaining
on S1
remaining
on S2
Total ng
PETN
recovered
from 500 ng
Bytac Cotton 21 507 529
Bytac Cotton 5 435 439
Bytac Cotton 1 397 399
Substrate (S1)
for direct
deposit
Substrate (S2)
onto which dry
transfer
remaining
on S1
remaining
on S2
ng PETN on
Nomex by
CONTACT
swabbing
ng PETN on Nomex
by
ELECTROSTATIC
swabbing
Total ng
PETN
recovered
from 500 ng
Percent
Recovery
%
Bytac Cotton 1 337 74 412 18
Bytac Cotton 0 304 51 355 15
Bytac Cotton 12 297 71 381 19
Bytac Cotton 20 411 90 521 17
Bytac Cotton 30 307 154 490 31
Bytac Cotton 2 334 204 540 38
33
Table 1.19. Nomex contact and electrostatic swabbing for TNT from cotton
Electrostatic swabs charged to -8.99 kV, -10.23 kV, & -11.14 kV at RH 35%.
TNT was deposited from a solution of acetone
Substrate (S1)
for direct
deposit
Substrate (S2)
onto which dry
transfer
ng TNT
out of
500ng
Cotton -- 480
Cotton -- 578
Cotton -- 548
Substrate (S1)
for direct
deposit
Substrate (S2)
onto which dry
transfer
remaining
on S1
remaining
on S2
Total ng
TNT
recovered
from 500 ng
Bytac Cotton 28 448 476
Bytac Cotton 0 489 489
Bytac Cotton 14 443 457
Substrate (S1)
for direct
deposit
Substrate (S2)
onto which dry
transfer
remaining
on S1
remaining
on S2
ng TNT on
Nomex by
CONTACT
swabbing
ng TNT on Nomex
by
ELECTROSTATIC
swabbing
Total ng
TNT
recovered
from 500 ng
Percent
Recovery
%
Bytac Cotton 0 394 51 445 11
Bytac Cotton 43 343 92 478 19
Bytac Cotton 0 344 54 398 14
Bytac Cotton 0 358 80 438 18
Bytac Cotton 0 393 53 446 12
Bytac Cotton 0 355 82 437 19
Table 1.20. Nomex contact and electrostatic swabbing for RDX from cotton
Electrostatic swabs charged to -10.21 kV, -11.44 kV, & -12.66 kV at RH 30%
RDX was deposited from a solution of acetone
Substrate (S1)
for direct
deposit
Substrate (S2)
onto which dry
transfer
ng RDX
out of
500ng
Cotton -- 535
Cotton -- 460
Cotton -- 434
Substrate (S1)
for direct
deposit
Substrate (S2)
onto which dry
transfer
remaining
on S1
remaining
on S2
Total ng
RDX
recovered
from 500 ng
Bytac Cotton 123 367 490
Bytac Cotton 109 326 435
Bytac Cotton 76 387 463
Substrate (S1)
for direct
deposit
Substrate (S2)
onto which dry
transfer
remaining
on S1
remaining
on S2
ng RDX on
Nomex by
CONTACT
swabbing
ng RDX on Nomex
by
ELECTROSTATIC
swabbing
Total ng
RDX
recovered
from 500 ng
Percent
Recovery
%
Bytac Cotton 127 296 87 510 17
Bytac Cotton 82 290 98 470 21
Bytac Cotton 137 252 81 471 17
Bytac Cotton 140 263 87 490 18
Bytac Cotton 68 284 126 478 26
Bytac Cotton 63 307 77 448 17
34
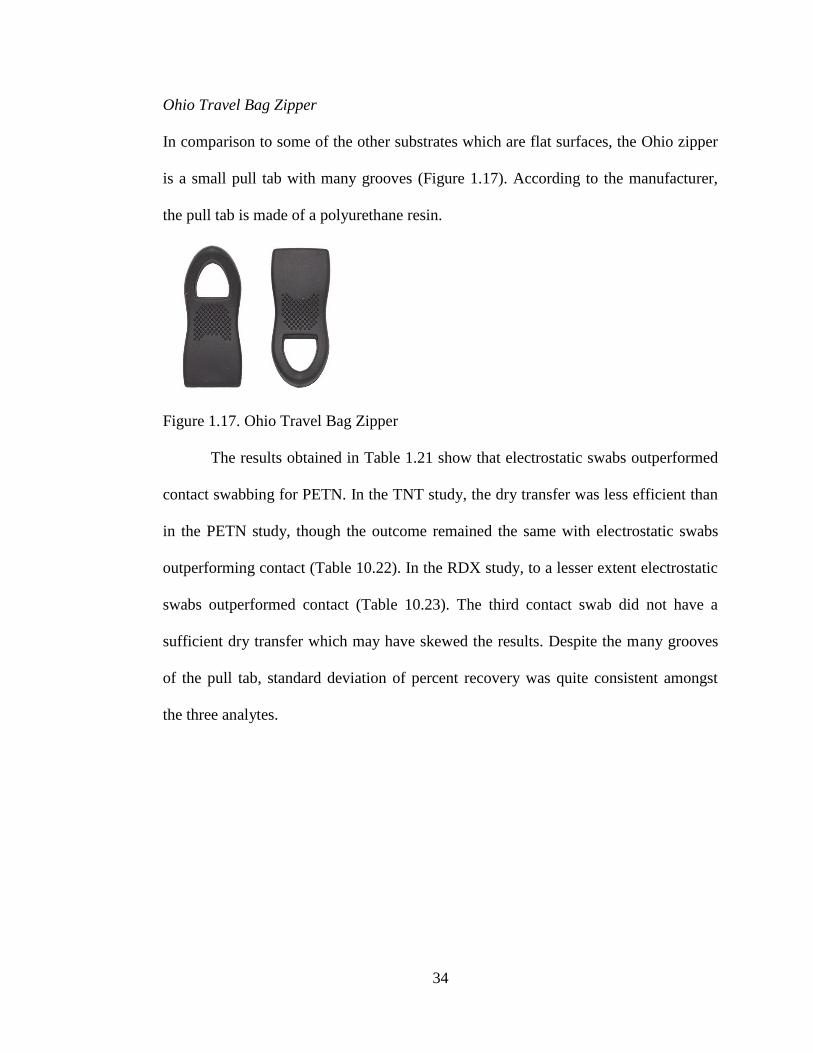
Ohio Travel Bag Zipper
In comparison to some of the other substrates which are flat surfaces, the Ohio zipper
is a small pull tab with many grooves (Figure 1.17). According to the manufacturer,
the pull tab is made of a polyurethane resin.
Figure 1.17. Ohio Travel Bag Zipper
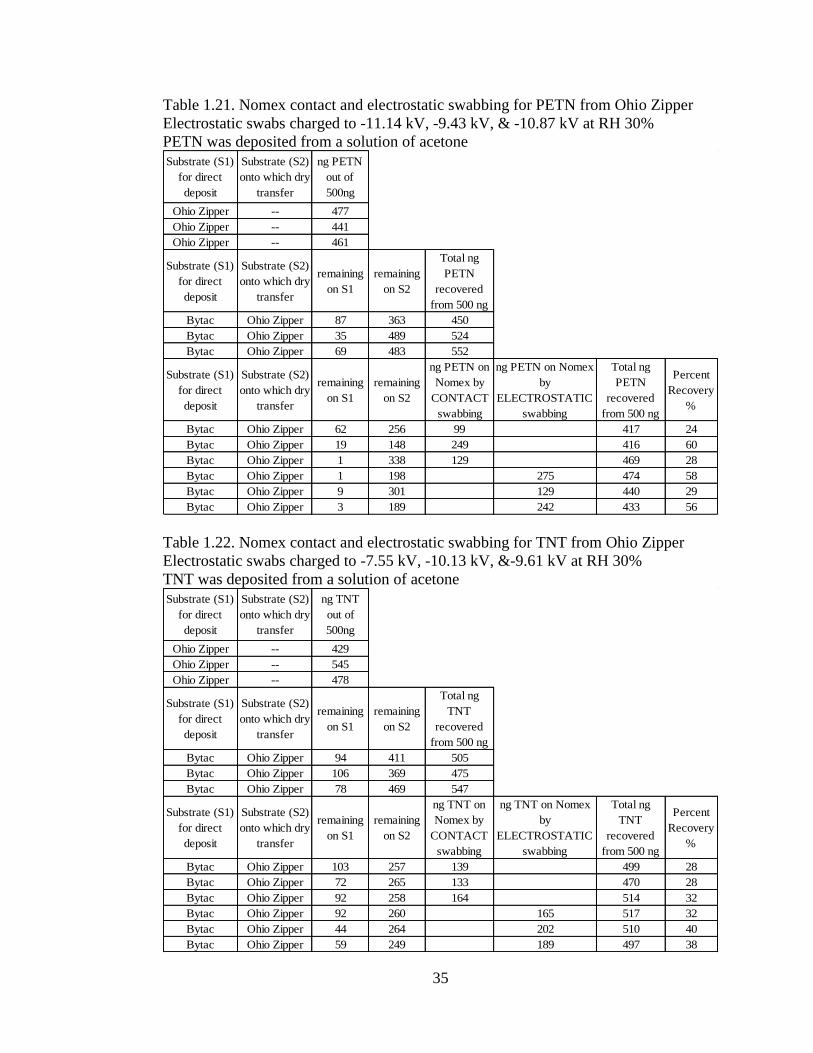
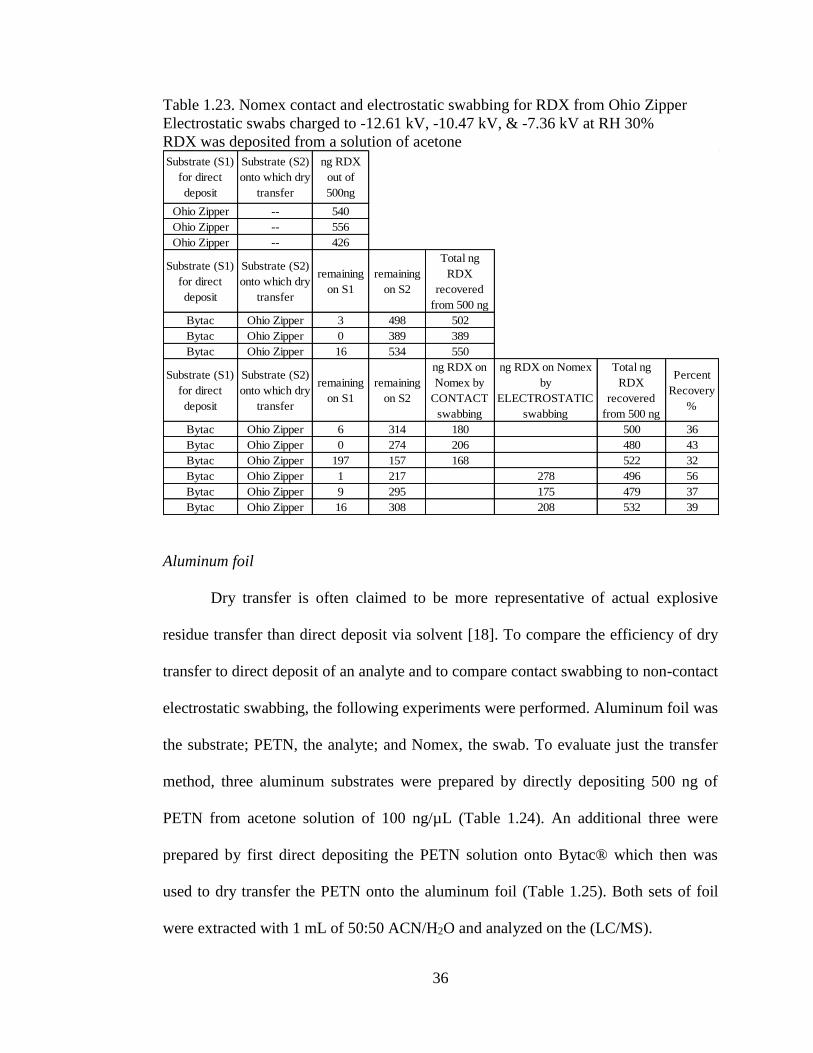
The results obtained in Table 1.21 show that electrostatic swabs outperformed
contact swabbing for PETN. In the TNT study, the dry transfer was less efficient than
in the PETN study, though the outcome remained the same with electrostatic swabs
outperforming contact (Table 10.22). In the RDX study, to a lesser extent electrostatic
swabs outperformed contact (Table 10.23). The third contact swab did not have a
sufficient dry transfer which may have skewed the results. Despite the many grooves
of the pull tab, standard deviation of percent recovery was quite consistent amongst
the three analytes.
35
Table 1.21. Nomex contact and electrostatic swabbing for PETN from Ohio Zipper
Electrostatic swabs charged to -11.14 kV, -9.43 kV, & -10.87 kV at RH 30%
PETN was deposited from a solution of acetone
Substrate (S1)
for direct
deposit
Substrate (S2)
onto which dry
transfer
ng PETN
out of
500ng
Ohio Zipper -- 477
Ohio Zipper -- 441
Ohio Zipper -- 461
Substrate (S1)
for direct
deposit
Substrate (S2)
onto which dry
transfer
remaining
on S1
remaining
on S2
Total ng
PETN
recovered
from 500 ng
Bytac Ohio Zipper 87 363 450
Bytac Ohio Zipper 35 489 524
Bytac Ohio Zipper 69 483 552
Substrate (S1)
for direct
deposit
Substrate (S2)
onto which dry
transfer
remaining
on S1
remaining
on S2
ng PETN on
Nomex by
CONTACT
swabbing
ng PETN on Nomex
by
ELECTROSTATIC
swabbing
Total ng
PETN
recovered
from 500 ng
Percent
Recovery
%
Bytac Ohio Zipper 62 256 99 417 24
Bytac Ohio Zipper 19 148 249 416 60
Bytac Ohio Zipper 1 338 129 469 28
Bytac Ohio Zipper 1 198 275 474 58
Bytac Ohio Zipper 9 301 129 440 29
Bytac Ohio Zipper 3 189 242 433 56
Table 1.22. Nomex contact and electrostatic swabbing for TNT from Ohio Zipper
Electrostatic swabs charged to -7.55 kV, -10.13 kV, &-9.61 kV at RH 30%
TNT was deposited from a solution of acetone
Substrate (S1)
for direct
deposit
Substrate (S2)
onto which dry
transfer
ng TNT
out of
500ng
Ohio Zipper -- 429
Ohio Zipper -- 545
Ohio Zipper -- 478
Substrate (S1)
for direct
deposit
Substrate (S2)
onto which dry
transfer
remaining
on S1
remaining
on S2
Total ng
TNT
recovered
from 500 ng
Bytac Ohio Zipper 94 411 505
Bytac Ohio Zipper 106 369 475
Bytac Ohio Zipper 78 469 547
Substrate (S1)
for direct
deposit
Substrate (S2)
onto which dry
transfer
remaining
on S1
remaining
on S2
ng TNT on
Nomex by
CONTACT
swabbing
ng TNT on Nomex
by
ELECTROSTATIC
swabbing
Total ng
TNT
recovered
from 500 ng
Percent
Recovery
%
Bytac Ohio Zipper 103 257 139 499 28
Bytac Ohio Zipper 72 265 133 470 28
Bytac Ohio Zipper 92 258 164 514 32
Bytac Ohio Zipper 92 260 165 517 32
Bytac Ohio Zipper 44 264 202 510 40
Bytac Ohio Zipper 59 249 189 497 38
36
Table 1.23. Nomex contact and electrostatic swabbing for RDX from Ohio Zipper
Electrostatic swabs charged to -12.61 kV, -10.47 kV, & -7.36 kV at RH 30%
RDX was deposited from a solution of acetone
Substrate (S1)
for direct
deposit
Substrate (S2)
onto which dry
transfer
ng RDX
out of
500ng
Ohio Zipper -- 540
Ohio Zipper -- 556
Ohio Zipper -- 426
Substrate (S1)
for direct
deposit
Substrate (S2)
onto which dry
transfer
remaining
on S1
remaining
on S2
Total ng
RDX
recovered
from 500 ng
Bytac Ohio Zipper 3 498 502
Bytac Ohio Zipper 0 389 389
Bytac Ohio Zipper 16 534 550
Substrate (S1)
for direct
deposit
Substrate (S2)
onto which dry
transfer
remaining
on S1
remaining
on S2
ng RDX on
Nomex by
CONTACT
swabbing
ng RDX on Nomex
by
ELECTROSTATIC
swabbing
Total ng
RDX
recovered
from 500 ng
Percent
Recovery
%
Bytac Ohio Zipper 6 314 180 500 36
Bytac Ohio Zipper 0 274 206 480 43
Bytac Ohio Zipper 197 157 168 522 32
Bytac Ohio Zipper 1 217 278 496 56
Bytac Ohio Zipper 9 295 175 479 37
Bytac Ohio Zipper 16 308 208 532 39
Aluminum foil
Dry transfer is often claimed to be more representative of actual explosive
residue transfer than direct deposit via solvent [18]. To compare the efficiency of dry
transfer to direct deposit of an analyte and to compare contact swabbing to non-contact
electrostatic swabbing, the following experiments were performed. Aluminum foil was
the substrate; PETN, the analyte; and Nomex, the swab. To evaluate just the transfer
method, three aluminum substrates were prepared by directly depositing 500 ng of
PETN from acetone solution of 100 ng/µL (Table 1.24). An additional three were
prepared by first direct depositing the PETN solution onto Bytac® which then was
used to dry transfer the PETN onto the aluminum foil (Table 1.25). Both sets of foil
were extracted with 1 mL of 50:50 ACN/H2O and analyzed on the (LC/MS).
37
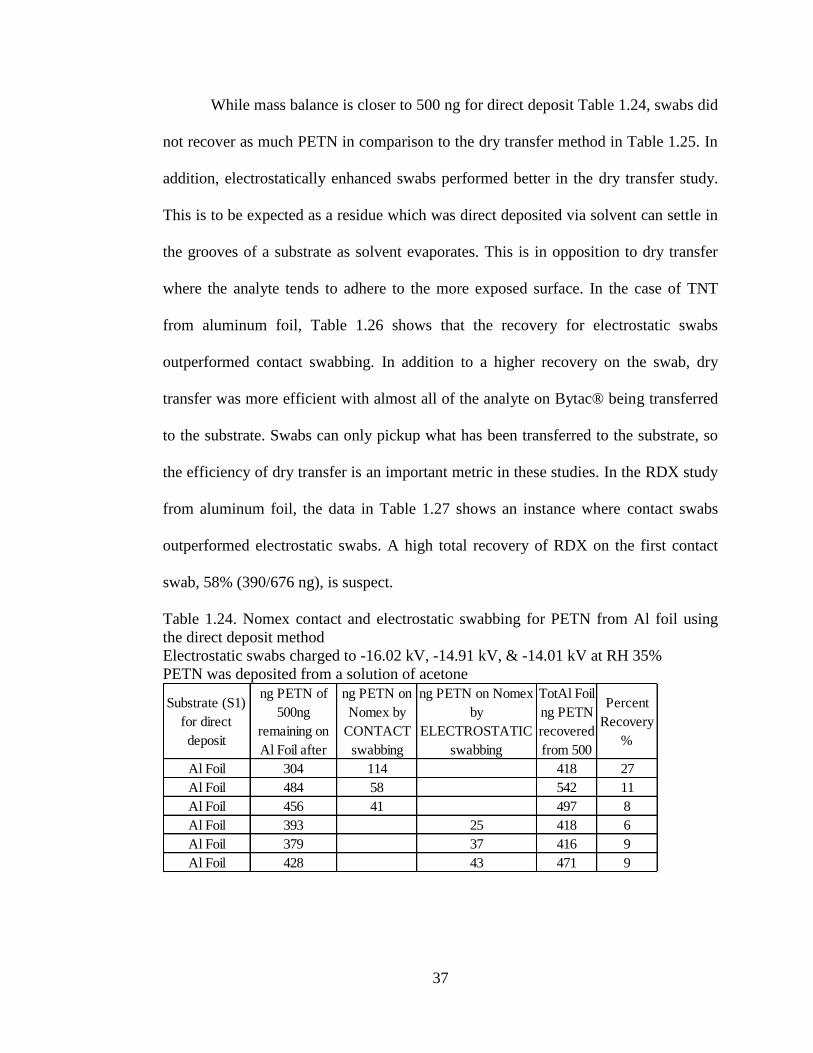
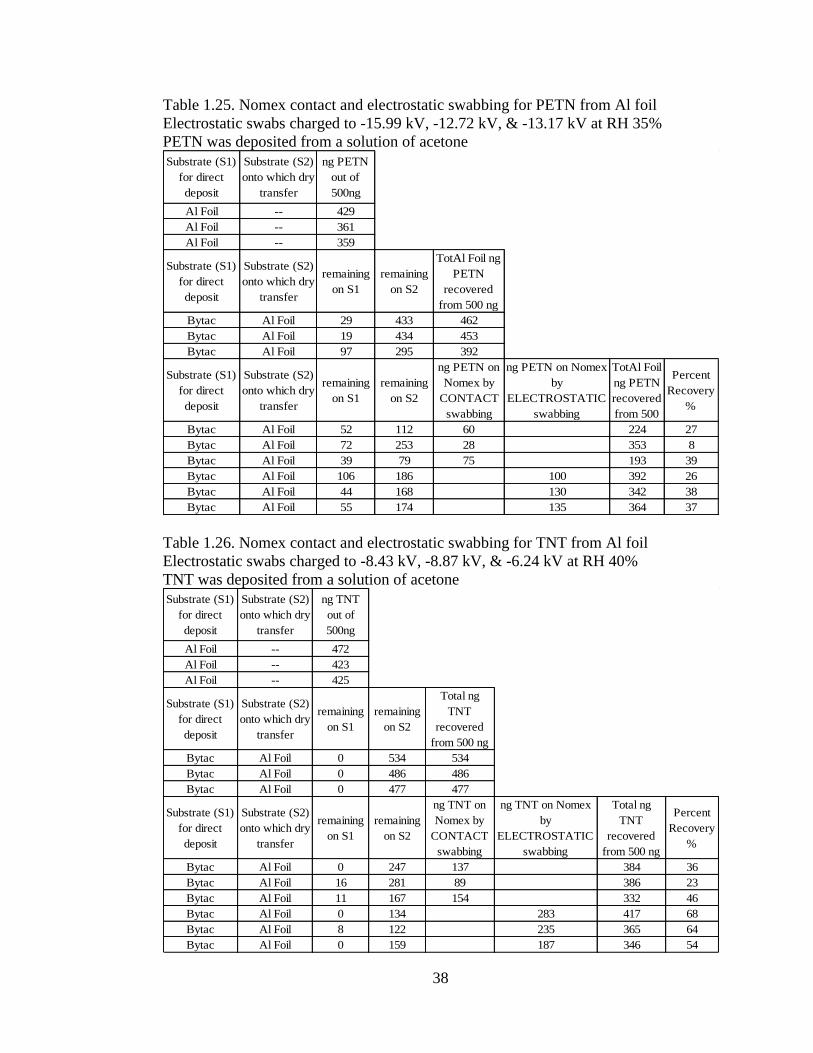
While mass balance is closer to 500 ng for direct deposit Table 1.24, swabs did
not recover as much PETN in comparison to the dry transfer method in Table 1.25. In
addition, electrostatically enhanced swabs performed better in the dry transfer study.
This is to be expected as a residue which was direct deposited via solvent can settle in
the grooves of a substrate as solvent evaporates. This is in opposition to dry transfer
where the analyte tends to adhere to the more exposed surface. In the case of TNT
from aluminum foil, Table 1.26 shows that the recovery for electrostatic swabs
outperformed contact swabbing. In addition to a higher recovery on the swab, dry
transfer was more efficient with almost all of the analyte on Bytac® being transferred
to the substrate. Swabs can only pickup what has been transferred to the substrate, so
the efficiency of dry transfer is an important metric in these studies. In the RDX study
from aluminum foil, the data in Table 1.27 shows an instance where contact swabs
outperformed electrostatic swabs. A high total recovery of RDX on the first contact
swab, 58% (390/676 ng), is suspect.
Table 1.24. Nomex contact and electrostatic swabbing for PETN from Al foil using
the direct deposit method
Electrostatic swabs charged to -16.02 kV, -14.91 kV, & -14.01 kV at RH 35%
PETN was deposited from a solution of acetone
Substrate (S1)
for direct
deposit
ng PETN of
500ng
remaining on
Al Foil after
ng PETN on
Nomex by
CONTACT
swabbing
ng PETN on Nomex
by
ELECTROSTATIC
swabbing
TotAl Foil
ng PETN
recovered
from 500
Percent
Recovery
%
Al Foil 304 114 418 27
Al Foil 484 58 542 11
Al Foil 456 41 497 8
Al Foil 393 25 418 6
Al Foil 379 37 416 9
Al Foil 428 43 471 9
38
Table 1.25. Nomex contact and electrostatic swabbing for PETN from Al foil
Electrostatic swabs charged to -15.99 kV, -12.72 kV, & -13.17 kV at RH 35%
PETN was deposited from a solution of acetone
Substrate (S1)
for direct
deposit
Substrate (S2)
onto which dry
transfer
ng PETN
out of
500ng
Al Foil -- 429
Al Foil -- 361
Al Foil -- 359
Substrate (S1)
for direct
deposit
Substrate (S2)
onto which dry
transfer
remaining
on S1
remaining
on S2
TotAl Foil ng
PETN
recovered
from 500 ng
Bytac Al Foil 29 433 462
Bytac Al Foil 19 434 453
Bytac Al Foil 97 295 392
Substrate (S1)
for direct
deposit
Substrate (S2)
onto which dry
transfer
remaining
on S1
remaining
on S2
ng PETN on
Nomex by
CONTACT
swabbing
ng PETN on Nomex
by
ELECTROSTATIC
swabbing
TotAl Foil
ng PETN
recovered
from 500
Percent
Recovery
%
Bytac Al Foil 52 112 60 224 27
Bytac Al Foil 72 253 28 353 8
Bytac Al Foil 39 79 75 193 39
Bytac Al Foil 106 186 100 392 26
Bytac Al Foil 44 168 130 342 38
Bytac Al Foil 55 174 135 364 37
Table 1.26. Nomex contact and electrostatic swabbing for TNT from Al foil
Electrostatic swabs charged to -8.43 kV, -8.87 kV, & -6.24 kV at RH 40%
TNT was deposited from a solution of acetone
Substrate (S1)
for direct
deposit
Substrate (S2)
onto which dry
transfer
ng TNT
out of
500ng
Al Foil -- 472
Al Foil -- 423
Al Foil -- 425
Substrate (S1)
for direct
deposit
Substrate (S2)
onto which dry
transfer
remaining
on S1
remaining
on S2
Total ng
TNT
recovered
from 500 ng
Bytac Al Foil 0 534 534
Bytac Al Foil 0 486 486
Bytac Al Foil 0 477 477
Substrate (S1)
for direct
deposit
Substrate (S2)
onto which dry
transfer
remaining
on S1
remaining
on S2
ng TNT on
Nomex by
CONTACT
swabbing
ng TNT on Nomex
by
ELECTROSTATIC
swabbing
Total ng
TNT
recovered
from 500 ng
Percent
Recovery
%
Bytac Al Foil 0 247 137 384 36
Bytac Al Foil 16 281 89 386 23
Bytac Al Foil 11 167 154 332 46
Bytac Al Foil 0 134 283 417 68
Bytac Al Foil 8 122 235 365 64
Bytac Al Foil 0 159 187 346 54
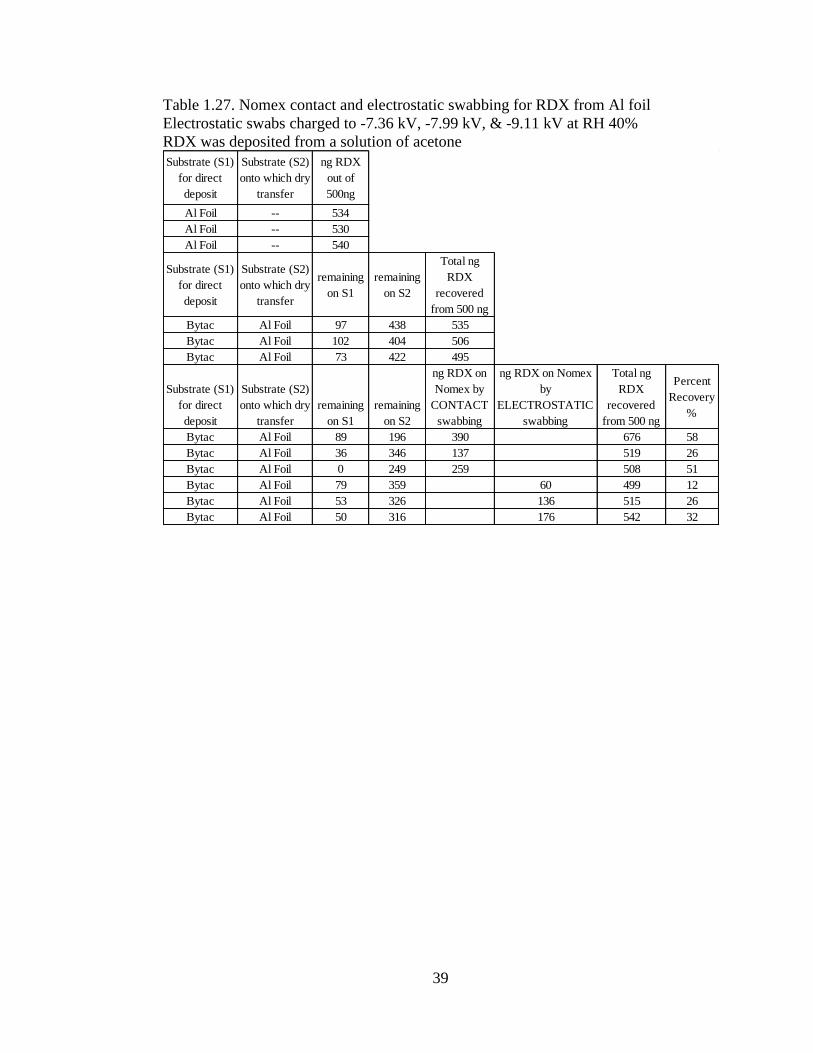
39
Table 1.27. Nomex contact and electrostatic swabbing for RDX from Al foil
Electrostatic swabs charged to -7.36 kV, -7.99 kV, & -9.11 kV at RH 40%
RDX was deposited from a solution of acetone
Substrate (S1)
for direct
deposit
Substrate (S2)
onto which dry
transfer
ng RDX
out of
500ng
Al Foil -- 534
Al Foil -- 530
Al Foil -- 540
Substrate (S1)
for direct
deposit
Substrate (S2)
onto which dry
transfer
remaining
on S1
remaining
on S2
Total ng
RDX
recovered
from 500 ng
Bytac Al Foil 97 438 535
Bytac Al Foil 102 404 506
Bytac Al Foil 73 422 495
Substrate (S1)
for direct
deposit
Substrate (S2)
onto which dry
transfer
remaining
on S1
remaining
on S2
ng RDX on
Nomex by
CONTACT
swabbing
ng RDX on Nomex
by
ELECTROSTATIC
swabbing
Total ng
RDX
recovered
from 500 ng
Percent
Recovery
%
Bytac Al Foil 89 196 390 676 58
Bytac Al Foil 36 346 137 519 26
Bytac Al Foil 0 249 259 508 51
Bytac Al Foil 79 359 60 499 12
Bytac Al Foil 53 326 136 515 26
Bytac Al Foil 50 316 176 542 32
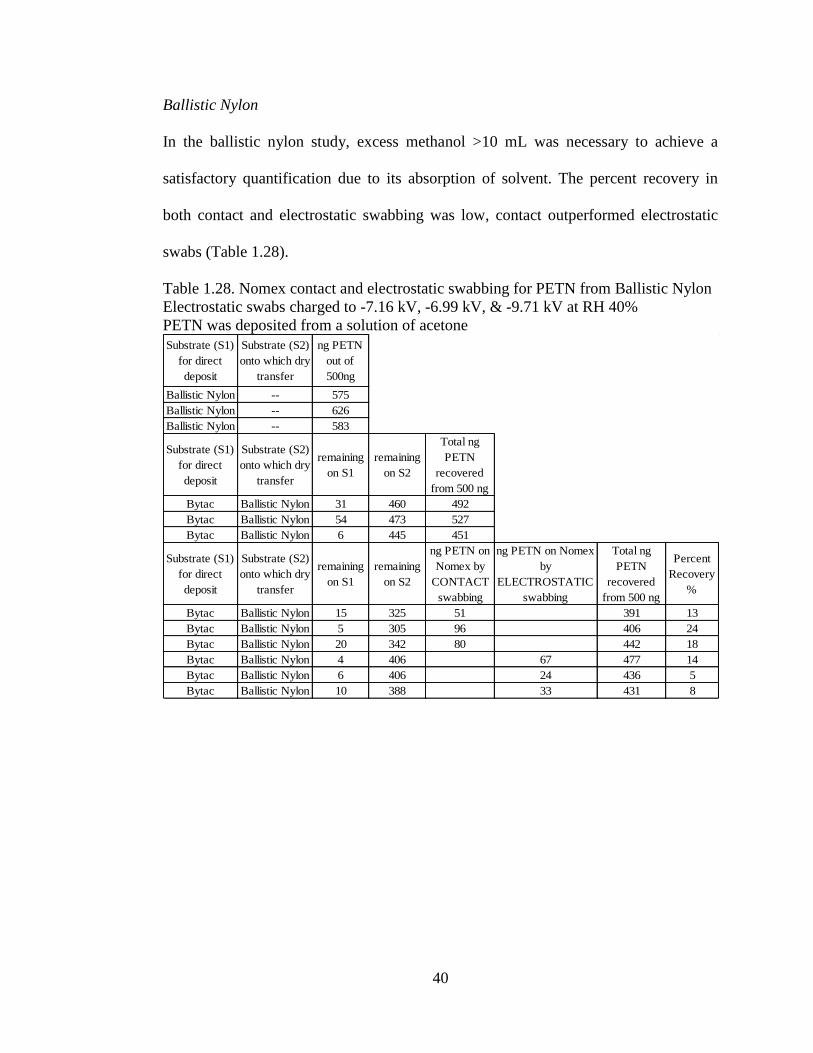
40
Ballistic Nylon
In the ballistic nylon study, excess methanol >10 mL was necessary to achieve a
satisfactory quantification due to its absorption of solvent. The percent recovery in
both contact and electrostatic swabbing was low, contact outperformed electrostatic
swabs (Table 1.28).
Table 1.28. Nomex contact and electrostatic swabbing for PETN from Ballistic Nylon
Electrostatic swabs charged to -7.16 kV, -6.99 kV, & -9.71 kV at RH 40%
PETN was deposited from a solution of acetone
Substrate (S1)
for direct
deposit
Substrate (S2)
onto which dry
transfer
ng PETN
out of
500ng
Ballistic Nylon -- 575
Ballistic Nylon -- 626
Ballistic Nylon -- 583
Substrate (S1)
for direct
deposit
Substrate (S2)
onto which dry
transfer
remaining
on S1
remaining
on S2
Total ng
PETN
recovered
from 500 ng
Bytac Ballistic Nylon 31 460 492
Bytac Ballistic Nylon 54 473 527
Bytac Ballistic Nylon 6 445 451
Substrate (S1)
for direct
deposit
Substrate (S2)
onto which dry
transfer
remaining
on S1
remaining
on S2
ng PETN on
Nomex by
CONTACT
swabbing
ng PETN on Nomex
by
ELECTROSTATIC
swabbing
Total ng
PETN
recovered
from 500 ng
Percent
Recovery
%
Bytac Ballistic Nylon 15 325 51 391 13
Bytac Ballistic Nylon 5 305 96 406 24
Bytac Ballistic Nylon 20 342 80 442 18
Bytac Ballistic Nylon 4 406 67 477 14
Bytac Ballistic Nylon 6 406 24 436 5
Bytac Ballistic Nylon 10 388 33 431 8
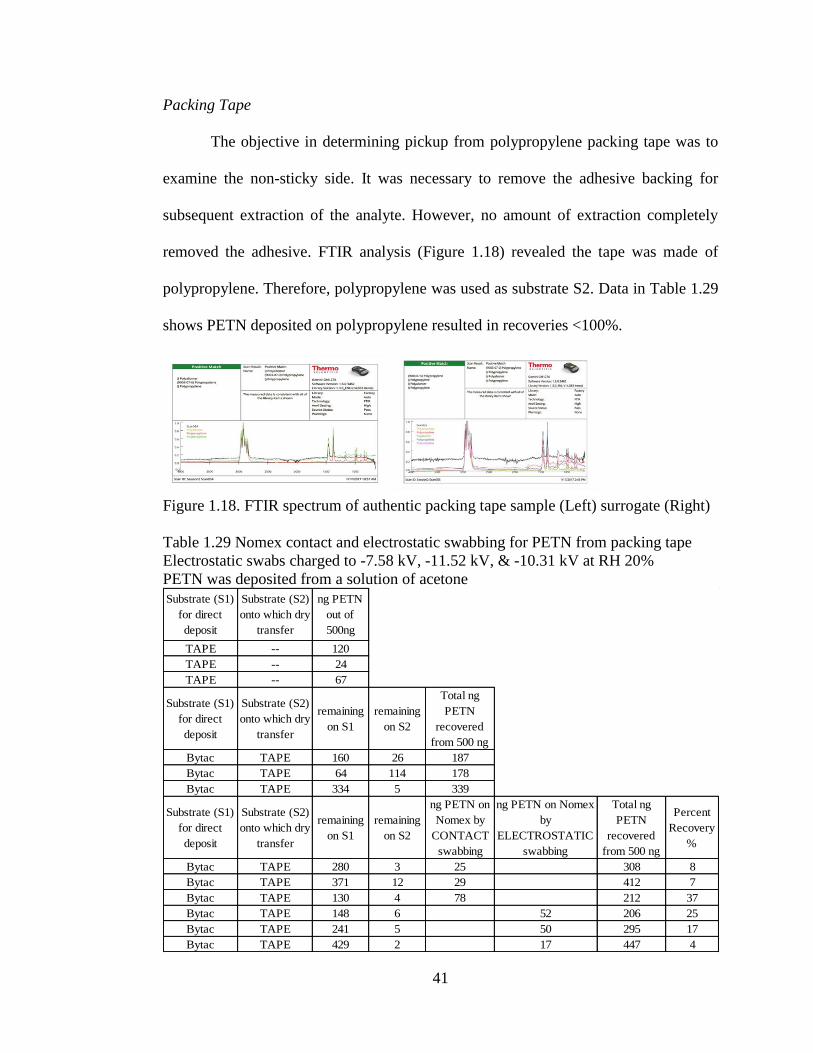
41
Packing Tape
The objective in determining pickup from polypropylene packing tape was to
examine the non-sticky side. It was necessary to remove the adhesive backing for
subsequent extraction of the analyte. However, no amount of extraction completely
removed the adhesive. FTIR analysis (Figure 1.18) revealed the tape was made of
polypropylene. Therefore, polypropylene was used as substrate S2. Data in Table 1.29
shows PETN deposited on polypropylene resulted in recoveries <100%.
Figure 1.18. FTIR spectrum of authentic packing tape sample (Left) surrogate (Right)
Table 1.29 Nomex contact and electrostatic swabbing for PETN from packing tape
Electrostatic swabs charged to -7.58 kV, -11.52 kV, & -10.31 kV at RH 20%
PETN was deposited from a solution of acetone
Substrate (S1)
for direct
deposit
Substrate (S2)
onto which dry
transfer
ng PETN
out of
500ng
TAPE -- 120
TAPE -- 24
TAPE -- 67
Substrate (S1)
for direct
deposit
Substrate (S2)
onto which dry
transfer
remaining
on S1
remaining
on S2
Total ng
PETN
recovered
from 500 ng
Bytac TAPE 160 26 187
Bytac TAPE 64 114 178
Bytac TAPE 334 5 339
Substrate (S1)
for direct
deposit
Substrate (S2)
onto which dry
transfer
remaining
on S1
remaining
on S2
ng PETN on
Nomex by
CONTACT
swabbing
ng PETN on Nomex
by
ELECTROSTATIC
swabbing
Total ng
PETN
recovered
from 500 ng
Percent
Recovery
%
Bytac TAPE 280 3 25 308 8
Bytac TAPE 371 12 29 412 7
Bytac TAPE 130 4 78 212 37
Bytac TAPE 148 6 52 206 25
Bytac TAPE 241 5 50 295 17
Bytac TAPE 429 2 17 447 4
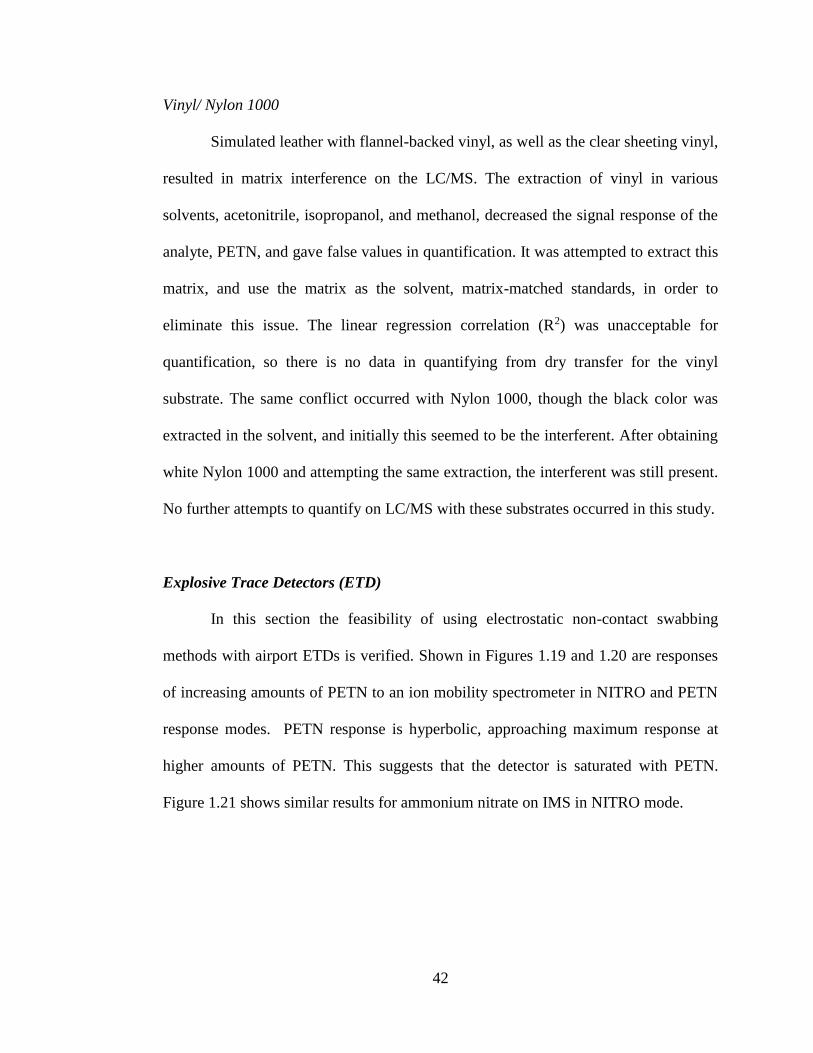
42
Vinyl/ Nylon 1000
Simulated leather with flannel-backed vinyl, as well as the clear sheeting vinyl,
resulted in matrix interference on the LC/MS. The extraction of vinyl in various
solvents, acetonitrile, isopropanol, and methanol, decreased the signal response of the
analyte, PETN, and gave false values in quantification. It was attempted to extract this
matrix, and use the matrix as the solvent, matrix-matched standards, in order to
eliminate this issue. The linear regression correlation (R2) was unacceptable for
quantification, so there is no data in quantifying from dry transfer for the vinyl
substrate. The same conflict occurred with Nylon 1000, though the black color was
extracted in the solvent, and initially this seemed to be the interferent. After obtaining
white Nylon 1000 and attempting the same extraction, the interferent was still present.
No further attempts to quantify on LC/MS with these substrates occurred in this study.
Explosive Trace Detectors (ETD)
In this section the feasibility of using electrostatic non-contact swabbing
methods with airport ETDs is verified. Shown in Figures 1.19 and 1.20 are responses
of increasing amounts of PETN to an ion mobility spectrometer in NITRO and PETN
response modes. PETN response is hyperbolic, approaching maximum response at
higher amounts of PETN. This suggests that the detector is saturated with PETN.
Figure 1.21 shows similar results for ammonium nitrate on IMS in NITRO mode.
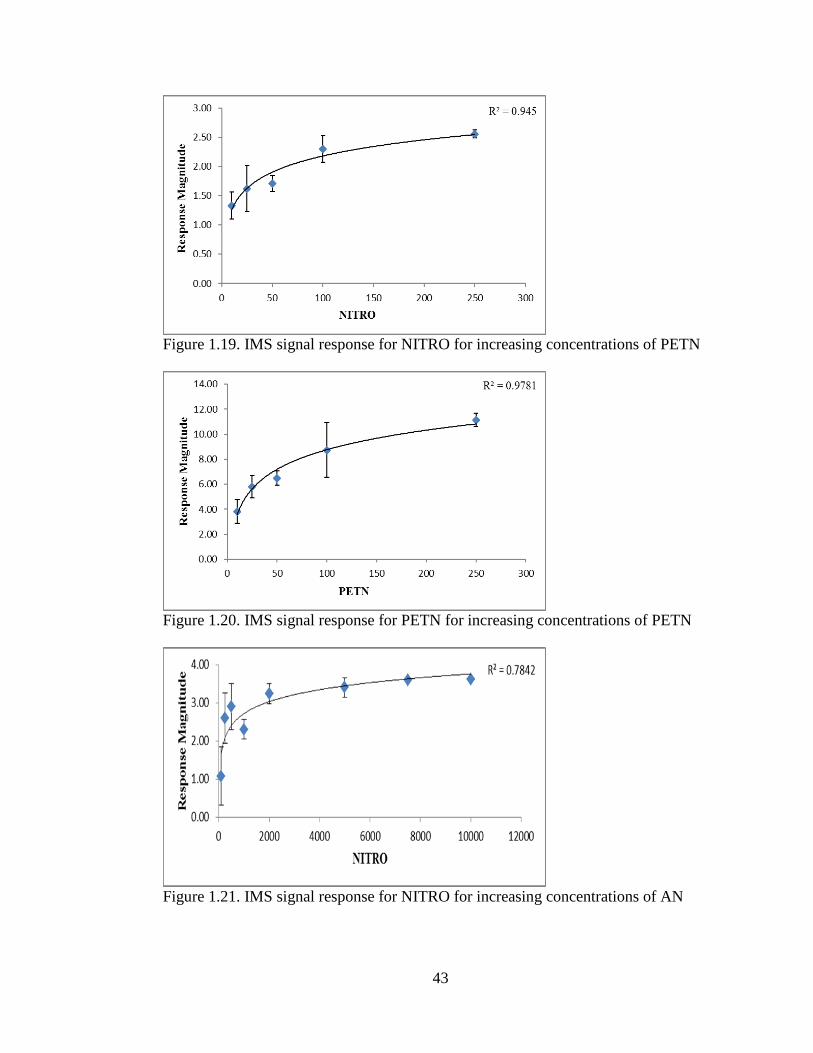
43
Figure 1.19. IMS signal response for NITRO for increasing concentrations of PETN
Figure 1.20. IMS signal response for PETN for increasing concentrations of PETN
Figure 1.21. IMS signal response for NITRO for increasing concentrations of AN
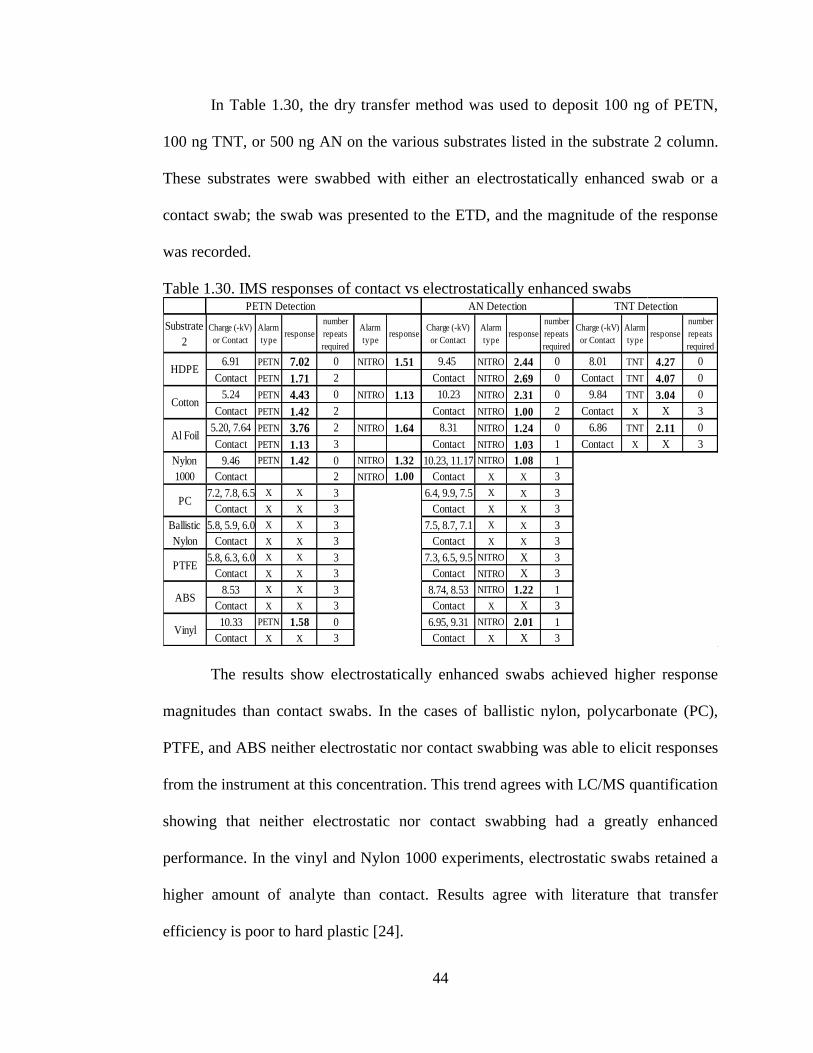
44
In Table 1.30, the dry transfer method was used to deposit 100 ng of PETN,
100 ng TNT, or 500 ng AN on the various substrates listed in the substrate 2 column.
These substrates were swabbed with either an electrostatically enhanced swab or a
contact swab; the swab was presented to the ETD, and the magnitude of the response
was recorded.
Table 1.30. IMS responses of contact vs electrostatically enhanced swabs PETN Detection AN Detection TNT Detection
Substrate
2
Charge (-kV)
or Contact
Alarm
typeresponse
number
repeats
required
Alarm
typeresponse
Charge (-kV)
or Contact
Alarm
typeresponse
number
repeats
required
Charge (-kV)
or Contact
Alarm
typeresponse
number
repeats
required
6.91 PETN 7.02 0 NITRO 1.51 9.45 NITRO 2.44 0 8.01 TNT 4.27 0
Contact PETN 1.71 2 Contact NITRO 2.69 0 Contact TNT 4.07 0
5.24 PETN 4.43 0 NITRO 1.13 10.23 NITRO 2.31 0 9.84 TNT 3.04 0
Contact PETN 1.42 2 Contact NITRO 1.00 2 Contact X X 3
5.20, 7.64 PETN 3.76 2 NITRO 1.64 8.31 NITRO 1.24 0 6.86 TNT 2.11 0
Contact PETN 1.13 3 Contact NITRO 1.03 1 Contact X X 3
9.46 PETN 1.42 0 NITRO 1.32 10.23, 11.17 NITRO 1.08 1
Contact 2 NITRO 1.00 Contact X X 3
7.2, 7.8, 6.5 X X 3 6.4, 9.9, 7.5 X X 3
Contact X X 3 Contact X X 3
5.8, 5.9, 6.0 X X 3 7.5, 8.7, 7.1 X X 3
Contact X X 3 Contact X X 3
5.8, 6.3, 6.0 X X 3 7.3, 6.5, 9.5 NITRO X 3
Contact X X 3 Contact NITRO X 3
8.53 X X 3 8.74, 8.53 NITRO 1.22 1
Contact X X 3 Contact X X 3
10.33 PETN 1.58 0 6.95, 9.31 NITRO 2.01 1
Contact X X 3 Contact X X 3
Al Foil
Cotton
Vinyl
Nylon
1000
HDPE
Ballistic
Nylon
PTFE
ABS
PC
The results show electrostatically enhanced swabs achieved higher response
magnitudes than contact swabs. In the cases of ballistic nylon, polycarbonate (PC),
PTFE, and ABS neither electrostatic nor contact swabbing was able to elicit responses
from the instrument at this concentration. This trend agrees with LC/MS quantification
showing that neither electrostatic nor contact swabbing had a greatly enhanced
performance. In the vinyl and Nylon 1000 experiments, electrostatic swabs retained a
higher amount of analyte than contact. Results agree with literature that transfer
efficiency is poor to hard plastic [24].
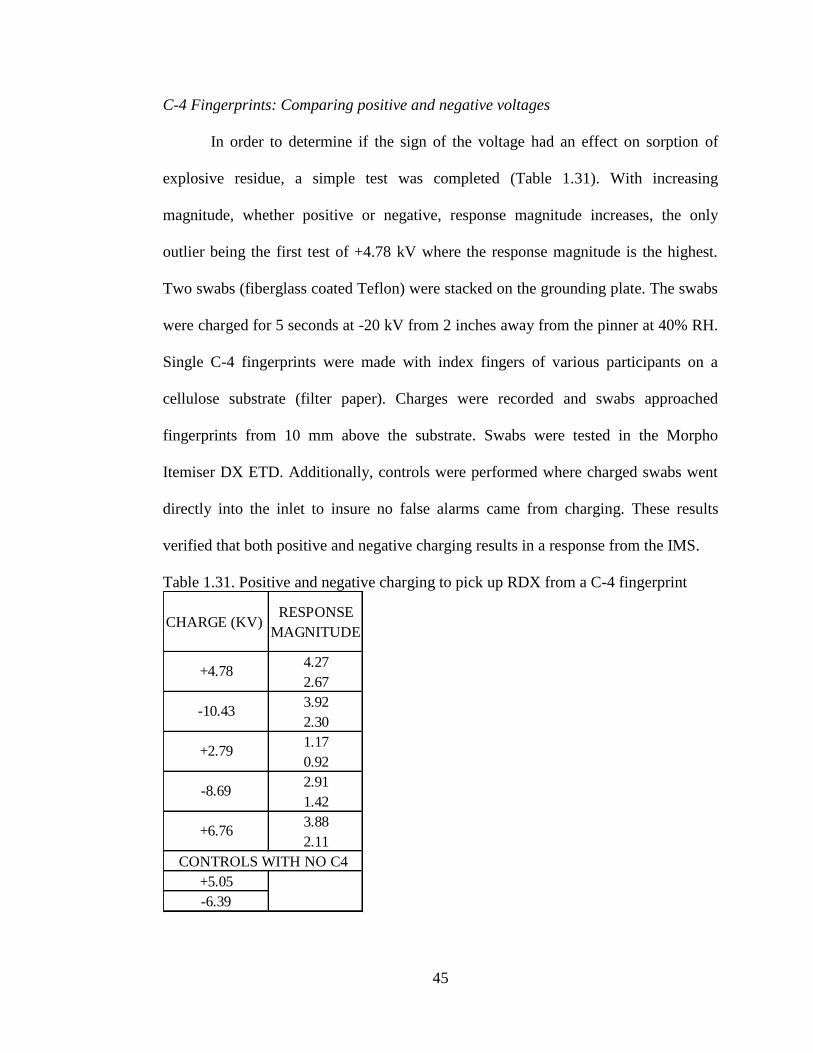
45
C-4 Fingerprints: Comparing positive and negative voltages
In order to determine if the sign of the voltage had an effect on sorption of
explosive residue, a simple test was completed (Table 1.31). With increasing
magnitude, whether positive or negative, response magnitude increases, the only
outlier being the first test of +4.78 kV where the response magnitude is the highest.
Two swabs (fiberglass coated Teflon) were stacked on the grounding plate. The swabs
were charged for 5 seconds at -20 kV from 2 inches away from the pinner at 40% RH.
Single C-4 fingerprints were made with index fingers of various participants on a
cellulose substrate (filter paper). Charges were recorded and swabs approached
fingerprints from 10 mm above the substrate. Swabs were tested in the Morpho
Itemiser DX ETD. Additionally, controls were performed where charged swabs went
directly into the inlet to insure no false alarms came from charging. These results
verified that both positive and negative charging results in a response from the IMS.
Table 1.31. Positive and negative charging to pick up RDX from a C-4 fingerprint
CHARGE (KV)RESPONSE
MAGNITUDE
4.27
2.67
3.92
2.30
1.17
0.92
2.91
1.42
3.88
2.11
+5.05
-6.39
+4.78
-10.43
+2.79
-8.69
+6.76
CONTROLS WITH NO C4
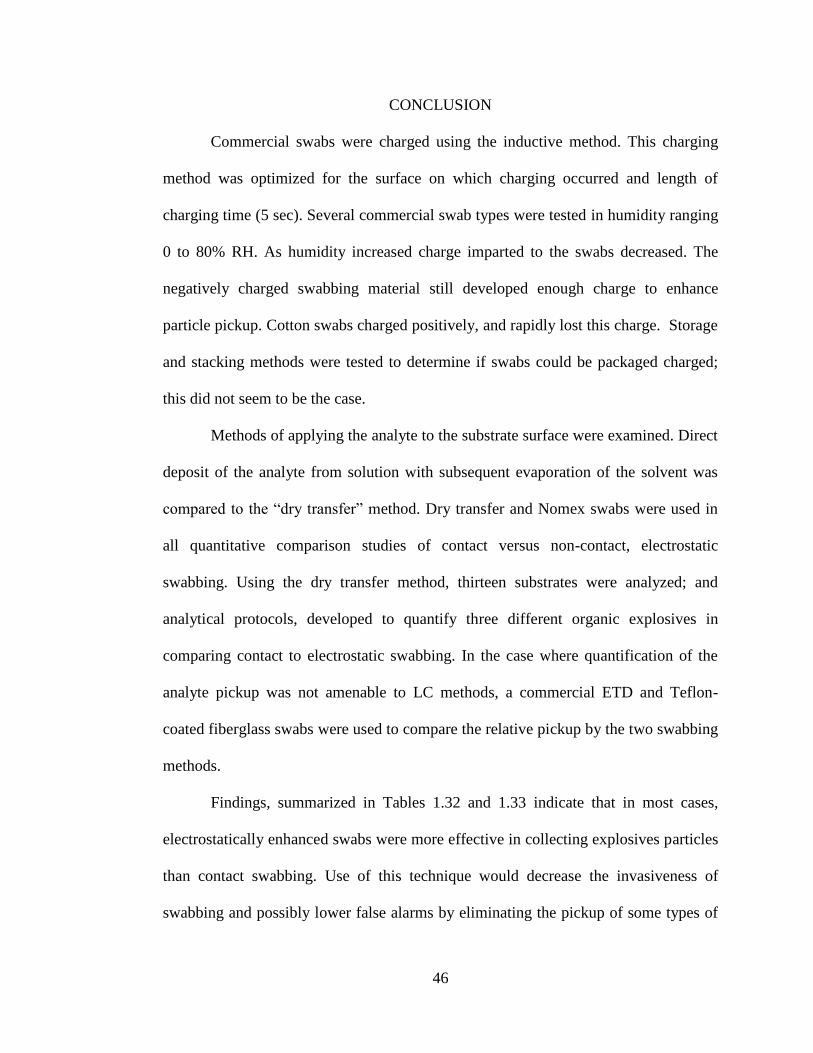
46
CONCLUSION
Commercial swabs were charged using the inductive method. This charging
method was optimized for the surface on which charging occurred and length of
charging time (5 sec). Several commercial swab types were tested in humidity ranging
0 to 80% RH. As humidity increased charge imparted to the swabs decreased. The
negatively charged swabbing material still developed enough charge to enhance
particle pickup. Cotton swabs charged positively, and rapidly lost this charge. Storage
and stacking methods were tested to determine if swabs could be packaged charged;
this did not seem to be the case.
Methods of applying the analyte to the substrate surface were examined. Direct
deposit of the analyte from solution with subsequent evaporation of the solvent was
compared to the “dry transfer” method. Dry transfer and Nomex swabs were used in
all quantitative comparison studies of contact versus non-contact, electrostatic
swabbing. Using the dry transfer method, thirteen substrates were analyzed; and
analytical protocols, developed to quantify three different organic explosives in
comparing contact to electrostatic swabbing. In the case where quantification of the
analyte pickup was not amenable to LC methods, a commercial ETD and Teflon-
coated fiberglass swabs were used to compare the relative pickup by the two swabbing
methods.
Findings, summarized in Tables 1.32 and 1.33 indicate that in most cases,
electrostatically enhanced swabs were more effective in collecting explosives particles
than contact swabbing. Use of this technique would decrease the invasiveness of
swabbing and possibly lower false alarms by eliminating the pickup of some types of
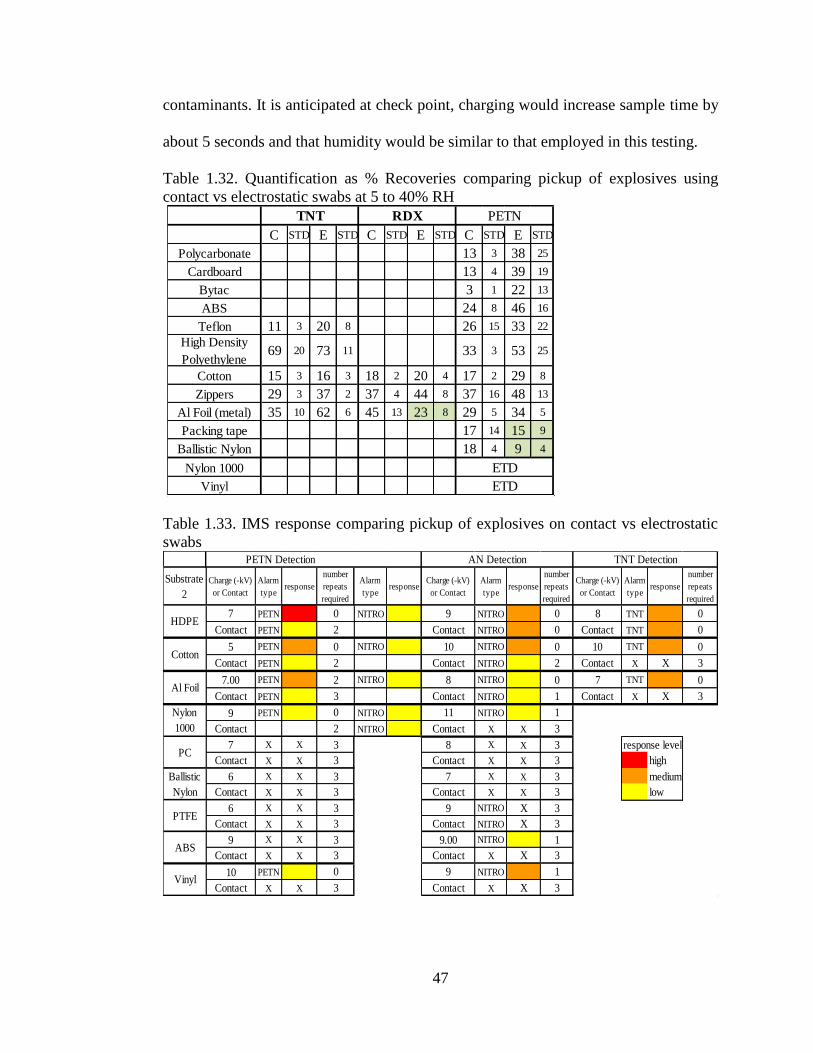
47
contaminants. It is anticipated at check point, charging would increase sample time by
about 5 seconds and that humidity would be similar to that employed in this testing.
Table 1.32. Quantification as % Recoveries comparing pickup of explosives using
contact vs electrostatic swabs at 5 to 40% RH
C STD E STD C STD E STD C STD E STD
Polycarbonate 13 3 38 25
Cardboard 13 4 39 19
Bytac 3 1 22 13
ABS 24 8 46 16
Teflon 11 3 20 8 26 15 33 22
High Density
Polyethylene69 20 73 11 33 3 53 25
Cotton 15 3 16 3 18 2 20 4 17 2 29 8
Zippers 29 3 37 2 37 4 44 8 37 16 48 13
Al Foil (metal) 35 10 62 6 45 13 23 8 29 5 34 5
Packing tape 17 14 15 9
Ballistic Nylon 18 4 9 4
Nylon 1000 ETD
Vinyl ETD
TNT RDX PETN
Table 1.33. IMS response comparing pickup of explosives on contact vs electrostatic
swabs PETN Detection AN Detection TNT Detection
Substrate
2
Charge (-kV)
or Contact
Alarm
typeresponse
number
repeats
required
Alarm
typeresponse
Charge (-kV)
or Contact
Alarm
typeresponse
number
repeats
required
Charge (-kV)
or Contact
Alarm
typeresponse
number
repeats
required
7 PETN 7.0 0 NITRO 1.51 9 NITRO 2.4 0 8 TNT 4.3 0
Contact PETN 1.7 2 Contact NITRO 2.7 0 Contact TNT 4.1 0
5 PETN 4.4 0 NITRO 1.13 10 NITRO 2.3 0 10 TNT 3.0 0
Contact PETN 1.4 2 Contact NITRO 1.0 2 Contact X X 3
7.00 PETN 3.8 2 NITRO 1.64 8 NITRO 1.2 0 7 TNT 2.1 0
Contact PETN 1.1 3 Contact NITRO 1.0 1 Contact X X 3
9 PETN 1.4 0 NITRO 1.32 11 NITRO 1.1 1
Contact 2 NITRO 1.00 Contact X X 3
7 X X 3 8 X X 3 response level
Contact X X 3 Contact X X 3 high
6 X X 3 7 X X 3 medium
Contact X X 3 Contact X X 3 low
6 X X 3 9 NITRO X 3
Contact X X 3 Contact NITRO X 3
9 X X 3 9.00 NITRO 1.2 1
Contact X X 3 Contact X X 3
10 PETN 1.6 0 9 NITRO 2.0 1
Contact X X 3 Contact X X 3
PTFE
ABS
Vinyl
HDPE
Cotton
Al Foil
Nylon
1000
PC
Ballistic
Nylon
48
REFERENCES
1. Moore, D. S., Recent Advances in Trace Explosives Detection. Sense Imaging
2007, 8, 9-38.
2. Verkouteren, J. R.; Coleman, J. L.; Fletcher, R. A.; Smith, W. J.; Klouda, G. A.;
Gillen, G., A method to determine collection efficiency of particles by swipe
sampling. Measurement Science and Technology 2008, 19 (11), 115101.
3. Verkouteren, J.; Grandner, J.; MacIsaac, K.; Ritchie, N.; In Forensics@NIST
2012, Gaithersburg, MD, November 29, 2012 Gaithersburg, MD, November 29,
2012. http://www.nist.gov/oles/upload/4-Verkouteren_Jennifer-Surface-Wipe-
Sampling.pdf
4. Images Scientific Instruments: Van de Graaf Generator.
http://www.imagesco.com/articles/high-voltage/van_de_graaf.html
5. Baytekin, H. T. The Mosaic of Surface Charge in Contact Electrification. Science
2011 333, 308-312.
6. Williams, M. W. Triboelectric charging of insulators- Mass transfer versus
electrons/ions. Journal of Electrostatics 2012 70, 233-234.
7. Diaz, A.F. A semi-quantitative tribo-electric series for polymeric materials: the
influence of chemical structure and properties. Journal of Electrostatics 2004 62,
277-290.
8. Pidoll, U. Predicting the electrostatic charging behavior of insulating materials
without charging tests. Journal of Electrostatics 2013 71, 513-516.
49
9. Park, C. H.; Chun B.C. Triboelectric series and charging properties of plastics
using the designed vertical-reciprocation charger. Journal of Electrostatics 2008
66, 578-583.
10. Sow, M.; Lacks, D. J. Effects of material strain on triboelectric charging:
Influence of material properties. Journal of Electrostatics 2013 71, 396-399.
11. Moreno, R. A.; Gross, B. Measurement of potential buildup and decay, surface
charge density, and charging currents of corona-charged polymer foil electrets.
Journal of Applied Physics 1976 47, 3397-3402.
12. Sessler, G. M.; Alquie, C.; Lewiner, J. Charge distrubution in Tefon FEP
negatively corona charged to high potentials. Journal of Applied Physics 1992 71,
2280-2284.
13. Gutmann, F. The Electret. Reviews of Modern Physics 1948 20, 457-472.
14. Sessler, G. M. Electrets: recent developments. Journal of Electrostatics 2001 51-
52, 137-145.
15. Smyth, C.P. Dielectric behavior and structure; dielectric constant and loss, dipole
moment and molecular structure, McGraw-Hill, 1955.
16. Jonassen, N. Electrostatics, International Thomson publishing, 1998.
17. Greenspan, Lewis. Humidity Fixed Points Binary Saturated Aqueous Solutions. J.
Res. Natl. Bur. Stand. Sec. A 1976 81A, 89-96.
18. Chamberlin, R; Dry Transfer Method for the Preparation of Explosives Test
Samples, US 6470730 B1, October 29, 2002.
50
19. Nemeth, E; Simon, F. Polymer tribo-electric charging: dependence on
thermodynamic surface properties and relative humidity. Journal of Electrostatics
2003 58, 3-16.
20. Nouri, H; Zouzou, N.; Dascalescu, L.; Zebboudj, Y. Investigation of relative
humidity effect of particles velocity and collection efficiency of laboratory scale
electrostatic precipitator. Process Safety and Environmental Protection 2016 104,
225-232.
21. Yawootti, A.; Intra, P.; Tippayawong, N.; Rattanadecho, P. An experimental study
of relative humidity and air flow effects on positive and negative corona
discharges in a corona-needle charger. Journal of Electrostatics 2015 77, 116-122.
22. Staymates, M.E.; Grandner, J.; Verkouteren, J. R.; Pressure-Sensitive Sampling
Wands for Homeland Security Applications. IEE Sensors Journal 2013 13, 4844-
4850.
23. Verkouteren, J. R.; Ritchie, W. M.; Gillen, G.; Use of force-sensing array films to
improve surface wipe sampling. J. Environ. Sci. Process. Impacts 2013, 15, 373-
380.
24. Tam, M.; Pilon, P.; Zaknoun, H.; Quantified explosives transfer on surfaces for the
evaluation of trace detection equipment. J. Forensic Sci. 2013, 58, 5, 1336-1340.
51
Manuscript 2
Potential Biocides: Polymer Packaging of Iodine containing Pyrotechnics
By Rebecca Levine, Jimmie C. Oxley, James Smith, Matthew Porter, Joe E. Brady IV
Chemistry Department
University of Rhode Island
140 Flagg Road, Kingston, RI 02881
Prepared for submission to Journal of Energetic Materials
52
ABSTRACT
Iodine-producing pyrotechnics have been investigated as biocides against
biological warfare agents [1-4]. For controlled application and dispersion of these
formulations in the field, polyurethane matrixes were examined as binders. To that end,
five energetic polyols containing energetic moieties nitro (–NO2) and/or azide (–N3) were
synthesized and characterized. These were used as partial replacements for
triethanolamine (TEOA) in its reaction with toluene diiosocyanate (TDI) to produce
polyurethane. The most promising of these polyurethane foams were mixed with a
pyrotechnic formulation (90/10 Ca(IO3)2/Al powder) to test for heat and iodine output.
Despite high solids loading (>70%) the foam cured without significant decrease in
expansion compared to the simple polyurethane (about 9 fold). Without polyurethane, a
90/10 formulation of Ca(IO3)2/Al resisted ignition, but in the presence of the foam binder
it was highly flammable. Addition of the energetic monomer did not greatly improve the
excellent heat output of the standard polyurethane foam, but it improved iodine output.
53
INTRODUCTION
The threat of biological weapons, specifically spores of Bacillus anthracis species,
are of concern to those charged with homeland security. Although the exact kill
mechanism is unknown, current research efforts suggest that heat and iodine gases can
act as a biocide causing DNA damage and increasing the kill-rate in spores [3-4].
Previous work examined the heat and iodine outputs of various fuels and oxides of iodine
mixtures [5]. For controlled application and dispersion of the biocidal formulations in the
field, these fuel/oxidizer mixtures require a binder. For a quick and thorough application
of the biocidal formulation, a sprayable binder was considered best. The properties
desired in a sprayable binder would include rapid curing (less than 10 seconds) with
significant expansion and acceptable mechanical properties so that high solids loading
could be achieved. It was determined that polyurethane foams met these needs. Because
polyurethane formations are based on combining a diisocyanate with a polyol to produce
a urethane linkage, (Figure 2.1) a number of modifications can be applied by changing
one of the monomers [6]. Functionalizing polymers with nitro or azide groups is the usual
approach to creating energetic binders [7-9]. Polyurethane foams were exclusively
investigated in this study.
Figure 2.1. general urethane linkage schematic
54
EXPERIMENTAL METHODS
Materials
All chemical reagents and analytical grade solvents were purchased from, Acros
Organics, Alpha Aesar, Fisher Scientific, TCI, or STREM and used without further
purification. Particle size of the calcium iodate was 70 to 150 μm; and the aluminum,
from Obron, was 23 μm. To lower the surface tension during polymer preparation,
promote uniform cell structure, and increase expansion, surfactant (TritonTM GR-7M)
provided by DOW Chemical was used at 1 wt % solution in pentane.
Fourier Transform-Infared Spectrometer (FTIR)
Infrared spectra were measured with a Thermo Scientific Nicolet 6700
spectrometer equipped with a Smart iTR diamond ATR. FTIR spectra were recorded at
ambient temperature. Background and spectra were collected in ranges of 4000-650 cm-1.
Thermal Measurements
Melting points, decomposition temperatures, and enthalpies were determined
using a TA Q100 for differential scanning calorimetry (DSC), calibrated against an
indium standard, heating at 20 C min-1 under nitrogen flow of 50 mL/min. Hermetic
aluminum pans were used for monomers, and glass sealed capillaries, for polymers.
Polymer decomposition was monitored with a TA Q600 Simultaneous DSC/TGA (SDT)
instrument; samples were held in open alumina pans, with heating rate 20 C min-1 and
nitrogen flow of 300 mL min-1.
Liquid Chromatography/ Mass Spectrometer (LCMS)
To determine mass spectra, each compound was dissolved in methanol to make a
1mg/mL solution and then serially diluted to 10 μg/mL. This methanol solution was
55
infused into Thermo Scientific LTQ Orbitrap XL™ mass spectrometer (MS) at a rate of 5
µL/min using electrospray ionization source in negative mode. The ionization source and
ion optics parameters were as follows: sheath gas 8, auxiliary gas 1, spray voltage 4.0 kV,
capillary temperature 275 °C, capillary voltage -1 V, tube lens -33.8 V, multipole 00
offset 2.5 V, lens 0 4.5 V, multipole 0 offset 4.75 V, lens 1 20.0 V, gate lens 64.0 V,
multiple 1 offset 8.0 V, multipole RF amplitude 400.0 V, front lens 4.75 V. The mass
spectra were collected using a full scan in ranges of 70 to 800 AMU (atomic mass units).
Monomers
2-(Hydroxymethyl)-2-nitropropane-1,3-diol (TMNM, 1) [10]
TMNM (1) was prepared by mixing nitromethane (17.9 g, 0.293 mol) in a
potassium hydroxide (0.49 g, 8.7 mol) methanol (45 mL)/dichloromethane (2 mL)
solution in a 250 mL round-bottom flask. The flask was cooled to 5C and portions of
28g, 0.933mol paraformaldehyde (37% w/v in water) solution was stirred in over 30
minutes. The mixture was heated to 40C, refluxed 2 hours, cooled to room temperature,
and placed in a freezer overnight. The precipitate was collected by vacuum filtration,
washed with hexanes, and dried in vacuum oven overnight at 50 °C to yield Compound 1
26.81g, 60%, m.p. 150-4C (Figure 2.2).
Figure 2.2. Synthesis of 2-(Hydroxymethyl)-2-nitropropane-1,3-diol (TMNM, 1)
56
2,3-Bis(hydroxymethyl)-1,3-dinitrobutane-1,4-diol (TETRA, 2) [10]
Compound 1 was condensed with acetone to form the ketal, (2,2-dimethyl-5-
nitro-1,3-dioxan-5-yl)methanol (2a), as follows. In a 250 mL round bottom flask
Compound 1 (30.21 g, 0.2 mol) and acetone (36.31 g, 0.620 mol) were combined, stirred,
and warmed until Compound 1 was fully dissolved. The mixture was cooled to 20C in
an ice bath, and BF3 (48% in ether, 34.38 g, 0.243 mol) was added to the flask all at once.
The mixture was briefly heated to 60C (~6 minutes) and then poured into a 2L beaker
containing saturated sodium bicarbonate solution (500 mL) and shaved ice (100 mL). The
tan colored precipitate was collected by vacuum filtration, washed with water, and air
dried to yield 35.07 g (80%) of Compound 2a, melting point 130-132C.
The dimerized ketal,2,2,2’,2’-tetramethyl-5,5’-dinitro-5,5’-bi(1,3-dioxane) (2b),
was prepared from Compound 2a (57.08 g, 0.3 mol) by placing it in 750 mL water in a 2
L round-bottom flask and heating it at 50C for 2.5 hours with sodium hydroxide solution
(50% w/w, 49 g, 0.6 mol). The mixture was cooled to 20C; sodium persulfate (146 g,
0.613 mol) was added over the course of an hour; and stirring was continued at room
temperature for 24 hours at which time sodium hydroxide solution (50% w/w) was added
until the pH reached 11-12. The precipitate was filtered, washed with cold hexanes, and
air dried to yield 2,2,2’,2’-tetramethyl-5,5’-dinitro-5,5’-bi(1,3-dioxane), (35.05 g, 72%
yield), Compound 2b, a tan solid with melting point of 129-130C.
The 2,3-bis(hydroxymethyl)-1,3-dinitrobutane-1,4-diol, Compound 2, was
prepared in a 250 mL round-bottom flask by dissolving Compound 2b (17.2 g, 0.053
mol) in 190 mL of methanol and 15 mL of 12M HCl. The mixture was refluxed at 65C
for 40 minutes before the methanol and HCl were removed by rotary evaporation. The
57
crude yield was 11.1 g (87%). The crude product compound 2 had a melting point of
100C. It was recrystallized from 25 mL of hot ethyl acetate; the precipitate was rinsed
with hexanes, and dried to yield 2,3-bis(hydroxymethyl)-1,3-dinitrobutane-1,4-diol,
compound 2 8.37 g with a melting point of 108C (Figure 2.3).
Figure 2.3. Synthesis of 2,3-Bis(hydroxymethyl)-1,3-dinitrobutane-1,4-diol (TETRA, 2)
2-(Azidomethyl)-2-nitropropane-1,3-diol (AZONITRO, 3) [11]
In a 250 mL round-bottom flask the ketal, (Compound 2a) (8.61 g, 45 mmol) was
dissolved in pyridine (18 mL) and cooled to -15oC. To the stirred solution, tosyl chloride
(9.173 g, 48 mol), dissolved in 13.5 mL dioxane, was added dropwise and allowed to stir
overnight at room temperature. The mixture was poured over sodium bicarbonate (2.025
g) in 90 g of ice water. The white precipitate was isolated by vacuum filtration yielding
2,2-dimethyl-5-nitro-1,3-dioxan-5-yl 4-methylbenzenesulfonate (Compound 3a) 11.31 g
(72% yield).
In a 250 mL round-bottom flask Compound 3a (9.22 g, 26.7 mmol) was dissolved
in 75 mL of dimethylformamide; sodium azide (8.80 g, 135 mol) was added, and the
mixture refluxed at 60C for 24 hours. The slurry was poured over 135 g of ice and
extracted with four aliquots of ethyl acetate (150 mL). The extracts were combined,
washed with 4 portions of deionized water (150 mL), and dried over sodium sulfate. The
sodium sulfate was removed by vacuum filtration; and the ethyl acetate, by rotary
evaporation. Xylenes (50 mL) were added to create an azeotrope for the excess DMF;
58
they were removed together by rotary evaporation. Crystals of 5-(azidomethyl)-2,2-
dimethyl-5-nitro-1,3-dioxane (Compound 3b) were removed from the round bottom to
yield 5.1 g (88%).
In a 250 mL round-bottom flask, Compound 3b (4.9 g, 22.7 mmol) was combined
with methanol (80mL) and 12M HCl (8mL) and refluxed at 60C for 24 h. At room
temperature, HCl and methanol were removed by rotary evaporation to produce dark
amber oil, 2-(azidomethyl)-2-nitropropane-1,3-diol, Compound 3 with quantitative yield
(4.2 g) (Figure 2.4).
Figure 2.4. Synthesis of 2-(Azidomethyl)-2-nitropropane-1,3-diol (AZONITRO, 3)
2,2-Bis(Azidomethyl)propane-1,3-diol (BAMP, 4) [12-14]
In a 250 mL round bottom flask, 2,2-bis(bromomethyl)propane-1,3-diol
(Compound 4a) (2.8 g, 10.7 mmol) and sodium azide (1.74 g, 28.8 mmol) were dissolved
in 20 mL DMSO. The solution was heated at 100 C for 48 h. Then proportional amounts
of water and brine were added (15 mL). The solution was extracted with three 20 mL
portions of ethyl acetate. The ethyl acetate solution was dried with sodium sulfate,
filtered, and remaining liquid removed by rotary evaporation yielding 1.90 g (95%) of
light yellow oil Compound 4 (Figure 2.5).
Figure 2.5. Synthesis of 2,2-Bis(Azidomethyl)propane-1,3-diol (BAMP, 4)
59
2,2-Dinitro-1,3-propanediol (DNPD, 5) [13-16]
In a 500 mL round-bottom flask, 4.50 g of sodium hydroxide was dissolved in
200 mL of water. The ketal, Compound 1a, (10.15 g, 53 mmol) was added and stirred
until dissolved. A solution of potassium ferricyanide (1.87 g) and sodium nitrite (14.7 g)
in 30 mL of distilled water was added to the flask. The flask was put into an ice bath, and
solid sodium persulfate (13.36 g) was added in portions while keeping the temperature
below 30C. The turbid solution was stirred for an additional 2 hours before the
precipitate was collected by vacuum filtration, washed with cold distilled water, and air
dried to yield 8.07 g of 2,2-dimethyl-5,5-dinitro-1,3-dioxane (86%) (Compound 5a), a
light cream colored product with a melting point of 53-54C.
To prepare Compound 5, in a 250 mL round-bottom flask, Compound 5a (8.07 g
39 mmol) was dissolved in 100 mL methanol and 14 mL of 12M HCl and heated at 60C
in an oil bath overnight. At room temperature, the HCl and methanol were removed by
rotary evaporation; and the solid, dried to yield Compound 5, 5.20 g (80%) with a
melting point of 135C (Figure 2.6).
Figure 2.6. Synthesis of 2,2-Dinitro-1,3-propanediol (DNPD, 5)
60
Polyurethane Foams
General Procedure of (TEOA-TDI) polyurethane foam synthesis
Part A consisted of toluene diiosocyanate (TDI) (1 mL, 7.0 mmol) in 500 µL
pentane to which 1 wt% DOW surfactant TRITONTM GR-7M. The two miscible liquids
were stirred in a centrifuge tube. Part B consisted of triethanolamine (TEOA, 500 µL,
3.0 mmol, 80% wt in water) and the catalyst, triethylamine (TEA, 250 µL, 1.8 mmol).
Increasing concentration of the catalyst increased the rate of foam formation; a near
instantaneous reaction was desired [17-18]. If applicable the specially synthesized
monomer, and a small amount of acetone was used to adjust viscosity. For the standard
TEOA-TDI synthesis, Part B was added to Part A, for synthesis involving the special
monomers, Part A was added to Part B’. The reaction took 5 seconds, increasing in
temperature as it cured to form the standard polyurethane (TEOA-TDI); it exhibited
significant expansion (9X) and hardening to withstand stimulation with a glass stir rod.
The exothermic cure of polyurethane foams can reach temperatures at high as 140-170 °C
which result in ‘scorching’ of the polymer. Scorching weakens the urethane linkages so
that they no longer withstand the mechanical stress associated with high solids loading
[6]. The TEOA-TDI foam was white in color with no visible scorching (Figure 2.7). This
synthetic method was altered using special energetic monomers, starting at 50:50 mole
ratios, and varying until foam had a desirable structure and expansion factor.
Figure 2.7. Synthesis of (TEOA-TDI) foam
61
Foam of Compound 1 (TMNM(1)/TEOA-TDI)
A solution was formed (2.6 mL) from TMNM 1 (0.75 g, 5 mmol), and TEOA
(1.12 g ,7.5 mmol), and 1 mL of acetone. An aliquot of this solution (500 µL) containing
1.0 mmol TMNM, and 1.5 mmol TEOA was added to TEA (250 µL, 1.8 mmol) and
mixed in a 50 mL centrifuge tube; this was Part B’. Part A (the isocyanate solution) was
added to Part B’; they were initially immiscible, but after swirling the mixture for about
4 seconds resulted in an increase in temperature and miscibility. At 10 seconds the
reaction began to bubble, and the resulting foam expanded to 10X the original volume.
This foam was yellow with no visible scorching and more crystalline in structure than the
TEOA-TDI foam. It withstood stimulation with a glass stir rod (Figure 2.8).
Figure 2.8. Synthesis of (TMNM(1)/TEOA-TDI) foam assuming 1:1 mol Polyol
Foam of Compound 2 (TETRA(2)/TEOA-TDI)
A dark red stock solution (2.5 mL) was formed by adding TETRA 2 (1 g, 4.2
mmol) and TEOA (1 g, 6.7 mmol) to 500 µL acetone. Part B’ was prepared in a 50 mL
centrifuge tube by adding TEA (100µL, 1.0 mmol) to an aliquot (650 µL) of the red
solution (1.0 mmol TETRA and 1.7 mmol TEOA). Part A (the TDI solution) was added
to Part B’; an instantaneous reaction began; and the foam expanded 10X the original
volume. The resulting foam was not stiff enough to withstand stimulation with a glass stir
rod (Figure 2.9). It was easily powdered with mortar and pestle. It was dark red in color,
and, despite several procedure changes, exhibited some visible scorching in the middle.
Starting at 50:50 mole ratio of TETRA to TEOA, the amount of TETRA 2 was reduced
62
until the TETRA to TEOA ratio was 0.4. Even at this low ratio, scorching was observed
in the center of the polymer mass. Lowering catalyst to 50 µL didn’t eliminate scorching.
Figure 2.9. Synthesis of (TETRA(2)/TEOA-TDI) foam assuming 1:1 mol Polyol
Foam of Compound 3 (AZONITRO(3)/TEOA-TDI)
One gram each of AZONITRO 3 (5.7 mmol) and TEOA (6.7 mmol) were mixed
in acetone (500 µL) to form 2.5 mL of a viscous, orange solution. In a 50 mL centrifuge
tube an aliquot (1 mL) of the orange solution [AZONITRO (2.2 mmol) and TEOA (2.7
mmol)] was mixed with TEA catalyst (100 µL, 1.0 mmol) to create Part B’. Part A was
added to Part B’; in 10 seconds the reaction was complete, and the foam had expanded 9
times the original volume. This orange foam showed no scorching and could withstand
stimulation with a glass stir rod (Figure 2.10).
Figure 2.10. Synthesis of (AZONITRO(3)/TEOA-TDI) Foam assuming 1:1 mol Polyol
Foam of Compound 4 (BAMP(4)/TEOA-TDI)
A transparent yellow solution (1.5 mL) was formed by adding BAMP 4 (1 g, 5.4
mmol) and TEOA (0.5 g, 3.4 mmol) to 500 µL of acetone. A 1 mL aliquot of this
solution, containing BAMP (2.7 mmol) and TEOA (1.7 mmol) was mixed with TEA (150
µL, 1.1 mmol) in a 50 mL centrifuge tube to make up Part B’. Part A was added to Part
63
B’, and the foam formed and expanded 7 fold in about 6 seconds. This white foam
showed no visible scorching and withstood stimulation with a glass stir rod (Figure 2.11).
Figure 2.11. Synthesis of (BAMP(4)/TEOA-TDI) Foam assuming 1:1 mol Polyol
Foam of Compound 5 (DNPD(5)/TEOA-TDI)
Countless attempts to make a foam using as little DNPD (0.10 g, 0.6 mmol) to
TEOA (0.15g, 1.0 mmol) and reducing catalyst to 50 µL resulted in a full scorching of
the foam with concomitant orange fumes.
Foams with Pyrotechnic
To examine how significant amounts of solids loading affected polymer formation
or expansion, the following experiment was performed. Part A was placed in a
centrifuge tube and stirred. Part B, which consisted of TEOA and TEA, was added to
Part A. Immediately after the reaction began, discernable by yellow coloration, and
before bubbling commenced, the pyrotechnic was added, an amount equivalent to 73%
solids loading. The pyrotechnic formulation was a 90/10 Ca(IO3)2/Al mixture, 73% solids
loading is equivalent to 4.84 g pyrotechnic per 1.80g foam. The reaction mixture was
stirred once before it began to expand; the reaction was complete in 20 seconds or less.
The product was porous, grey in color, and exhibited similar expansion (8X) to the foam
without solids.
64
Scanning Electron Microscope (SEM)/ Energy Dispersive Spectroscopy (EDS)
Pyrotechnic-loaded polyurethane foam samples were dried in a vacuum oven and
transported in falcon tubes. Small slivers were cut with razor blade from the top and
bottom of the expanded pyrotechnic-loaded foam. Samples were placed on the sample
holder examined under low vacuum (25 Pa) in backscatter mode at a voltage of 20 kV.
Powdered Foams with Pyrotechnic
For calorimetry, foams were ground in a coffee grinder and sieved to particle
sizes of 150-300 µm. They were mixed in a Resodyn Acoustic Mixer with pyrotechnic.
Bomb Calorimetry/UV-VIS
Bomb Calorimetry was performed using a Parr 6200 Isoperibol Bomb
Calorimeter. The calorimeter was calibrated (10 trials) with benzoic acid and 2.07 MPa
oxygen (ΔUc = 26.4 kJ/g). The samples were loaded and ignited in O2 (2.07 MPa).
When molecular iodine (I2) was produced in the bomb calorimetric experiments,
it was quantified using an ultraviolet-visible (UV-Vis) spectrometer (Agilent 8453), 190
to 1100 nm, resolution 1 nm, 0.5 s integration time. Iodine was extracted from the bomb
with 100 mL of an aqueous 0.5 M potassium iodide (KI) solution. The solution had
excess I- which solubilized I2 and transformed it to I3- (λ=353 nm) [19]. An example of a
calibration curve for iodine quantification is shown in Figure 2.12.
Figure 2.12. Example UV-Vis calibration curve for I2 quantification
65
RESULTS AND DISCUSSION
Monomers
Characterization
FTIR
In Figure 2.13, the FTIR of each monomer used is shown. At around 3200 cm-1
the OH stretch is visible and broad for all cases. In spectra 1,2,3 and 5, the stretch for
NO2 are seen at 1560-1510 cm-1. In spectra 3 and 4, the N3 stretch is sharp at 2100 cm-1.
Figure 2.13. IR Spectra of TEOA (provided by NIST Chemistry WebBook), TMNM (1),
TETRA (2), AZONITRO (3), BAMP (4), and DNPD (5)
66
LCMS
In order to confirm the synthesis of the monomers, LCMS was performed. Figure
2.14 shows the results from the mass spectrometer. TETRA (2) formed a fragment
[TETRA - OH] with an exact mass of 209.0415 AMU, and a chloride adduct [TETRA +
Cl-] with an exact mass of 275.0281 AMU. In the case of the AZONITRO compound (3),
there was only one peak to verify identification, a chloride adduct [AZONITRO + Cl-]
with an exact mass of 211.0237 AMU. BAMP (4) formed two adducts, a chloride adduct
[BAMP + Cl-] with an exact mass of 211.0560 AMU, and a formate adduct [BAMO +
CHOO-] with an exact mass of 231.0848 AMU. DNPD (5) formed a similar fragment to
TETRA [DNPD - OH] with an exact mass of 135.0048 AMU, and a chloride adduct
[DNPD + Cl-] with an exact mass of 200.9917 AMU.
Figure 2.14. LCMS Confirmation TETRA (2), AZONITRO (3), BAMP (4), & DNPD (5)
67
DSC
In Figure 2.15, DSC traces of the monomers used are shown at 20 °C min-1.
TEOA, the non-energetic monomer has an endothermic decomposition at 198 °C. All the
energetic synthesized monomers (1-5) have exotherms in the 200-260 °C region. The
three crystalline energetic monomers show endotherms at their melting points (1, 2 and
5). The two liquid energetic monomers, (3 and 4), have only a single exotherm.
Figure 2.15. DSC Traces TEOA, TMNM (1), TETRA (2), AZONITRO (3), BAMP (4),
& DNPD (5)
68
Polyurethane foams
Characterization
FTIR
Figure 2.16. IR Spectra of Polyurethane Foams TEOA-TDI, TMNM(1)/TEOA-TDI,
TETRA(2)/TEOA-TDI, AZONITRO(3)/TEOA-TDI, & BAMP(4)/TEOA-TDI
Figure 2.17. Schematic of TEOA-TDI foam
69
The FTIR characteristics are shown in Figure 2.16. In Figure 2.17, for the
standard foam (TEOA-TDI) the following stretches are observed: ATR ṽ= 3290 cm-1 is
the N-H valence vibration, 1700 cm-1 is the valence vibration of the C=O group (amide
I), 1525 cm-1 is the amide II vibration (N-H bending), and 1220 cm-1 is the asymmetric C-
O bending vibration. Foams TMNM(1)/TEOA-TDI and TETRA(2)/TEOA-TDI, only
have (NO2) functionality, which literature suggests, overlaps with the C-O asymmetric
vibration at around 1520 cm-1 (can be seen anywhere between 1500-1600 cm-1) [14]. In
Figure 2.16, AZONITRO(3)/TEOA-TDI and BAMP(4)/TEOA-TDI the quintessential
(N3) vibration can be seen at around 2100 cm-1.
Thermal Properties
SDT
Thermal traces of the five polyurethane foams run on TGA and DSC
simultaneously show clear, two-step weight loss, the first centered around 250 °C and the
second around 420 °C Figure 2.18. In the standard polyurethane, the first weight loss is
endothermic, whereas in the polymers modified with the energetic monomers
[TMNM(1)/TEOA-TDI, AZONITRO(3)/TEOA-TDI, and BAMP(4)/TEOA-TDI] this
weight loss is exothermic. Above 350 °C, all the polyurethanes exhibit endothermic
weight loss, until by 450 °C no polymer remains. These traces are interpreted as initial
partial decomposition of the monomer, followed by complete pyrolysis of the organic
species.
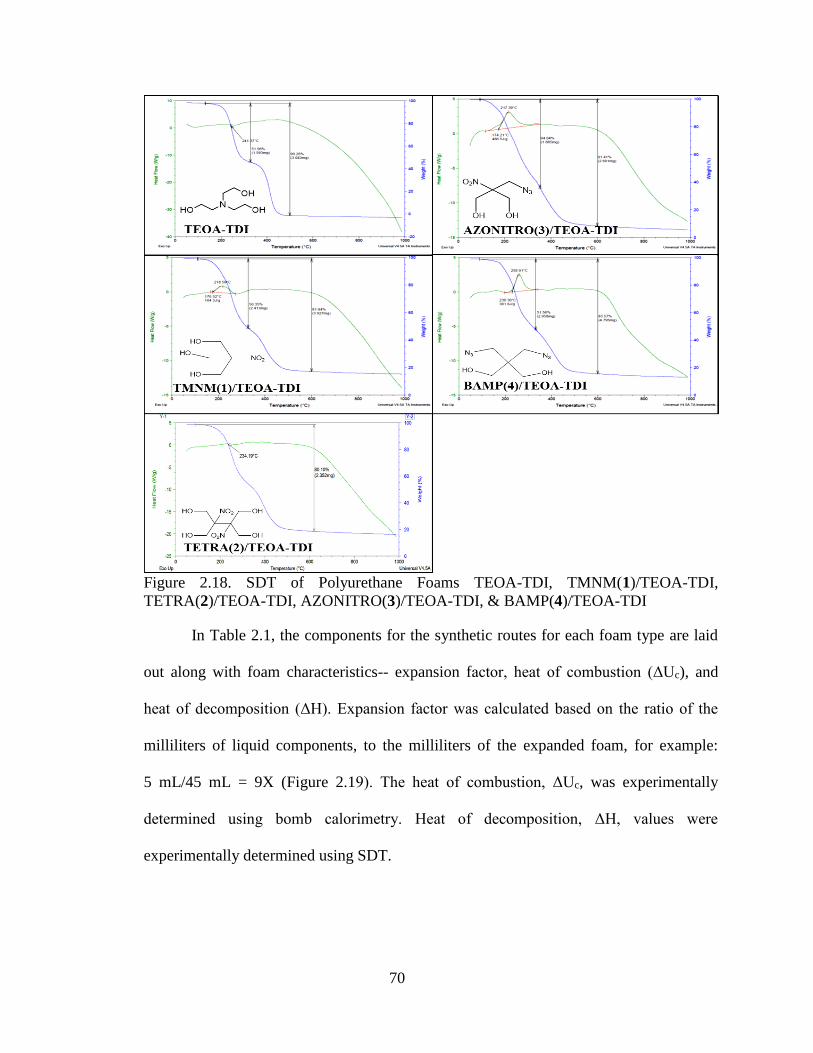
70
Figure 2.18. SDT of Polyurethane Foams TEOA-TDI, TMNM(1)/TEOA-TDI,
TETRA(2)/TEOA-TDI, AZONITRO(3)/TEOA-TDI, & BAMP(4)/TEOA-TDI
In Table 2.1, the components for the synthetic routes for each foam type are laid
out along with foam characteristics-- expansion factor, heat of combustion (ΔUc), and
heat of decomposition (ΔH). Expansion factor was calculated based on the ratio of the
milliliters of liquid components, to the milliliters of the expanded foam, for example:
5 mL/45 mL = 9X (Figure 2.19). The heat of combustion, ΔUc, was experimentally
determined using bomb calorimetry. Heat of decomposition, ΔH, values were
experimentally determined using SDT.
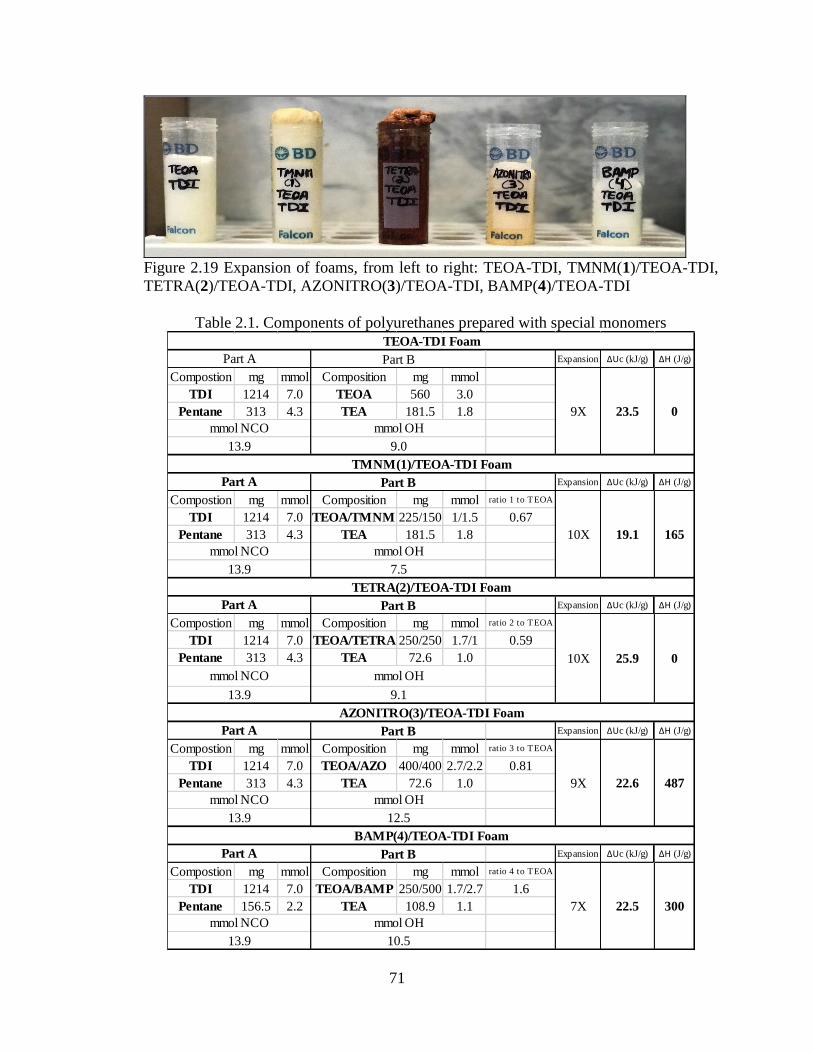
71
Figure 2.19 Expansion of foams, from left to right: TEOA-TDI, TMNM(1)/TEOA-TDI,
TETRA(2)/TEOA-TDI, AZONITRO(3)/TEOA-TDI, BAMP(4)/TEOA-TDI
Table 2.1. Components of polyurethanes prepared with special monomers
Expansion ΔUc (kJ/g) ΔH (J/g)
Compostion mg mmol Composition mg mmol
TDI 1214 7.0 TEOA 560 3.0
Pentane 313 4.3 TEA 181.5 1.8
Expansion ΔUc (kJ/g) ΔH (J/g)
Compostion mg mmol Composition mg mmol ratio 1 to TEOA
TDI 1214 7.0 TEOA/TMNM 225/150 1/1.5 0.67
Pentane 313 4.3 TEA 181.5 1.8
TETRA(2)/TEOA-TDI Foam
Expansion ΔUc (kJ/g) ΔH (J/g)
Compostion mg mmol Composition mg mmol ratio 2 to TEOA
TDI 1214 7.0 TEOA/TETRA 250/250 1.7/1 0.59
Pentane 313 4.3 TEA 72.6 1.0
Expansion ΔUc (kJ/g) ΔH (J/g)
Compostion mg mmol Composition mg mmol ratio 3 to TEOA
TDI 1214 7.0 TEOA/AZO 400/400 2.7/2.2 0.81
Pentane 313 4.3 TEA 72.6 1.0
Expansion ΔUc (kJ/g) ΔH (J/g)
Compostion mg mmol Composition mg mmol ratio 4 to TEOA
TDI 1214 7.0 TEOA/BAMP 250/500 1.7/2.7 1.6
Pentane 156.5 2.2 TEA 108.9 1.1
487
300
TMNM(1)/TEOA-TDI Foam
AZONITRO(3)/TEOA-TDI Foam
BAMP(4)/TEOA-TDI Foam
Part A Part B
7X 22.5
mmol NCO mmol OH
13.9 10.5
13.9 9.1
Part A Part B
9X 22.6
mmol NCO mmol OH
13.9 12.5
mmol OH
13.9 9.0
9X
TEOA-TDI Foam
mmol OH
Part A Part B
10X 19.1
mmol NCO mmol OH
13.9 7.5
0
165
0
23.5
Part A Part B
10X 25.9
mmol NCO
Part A Part B
mmol NCO
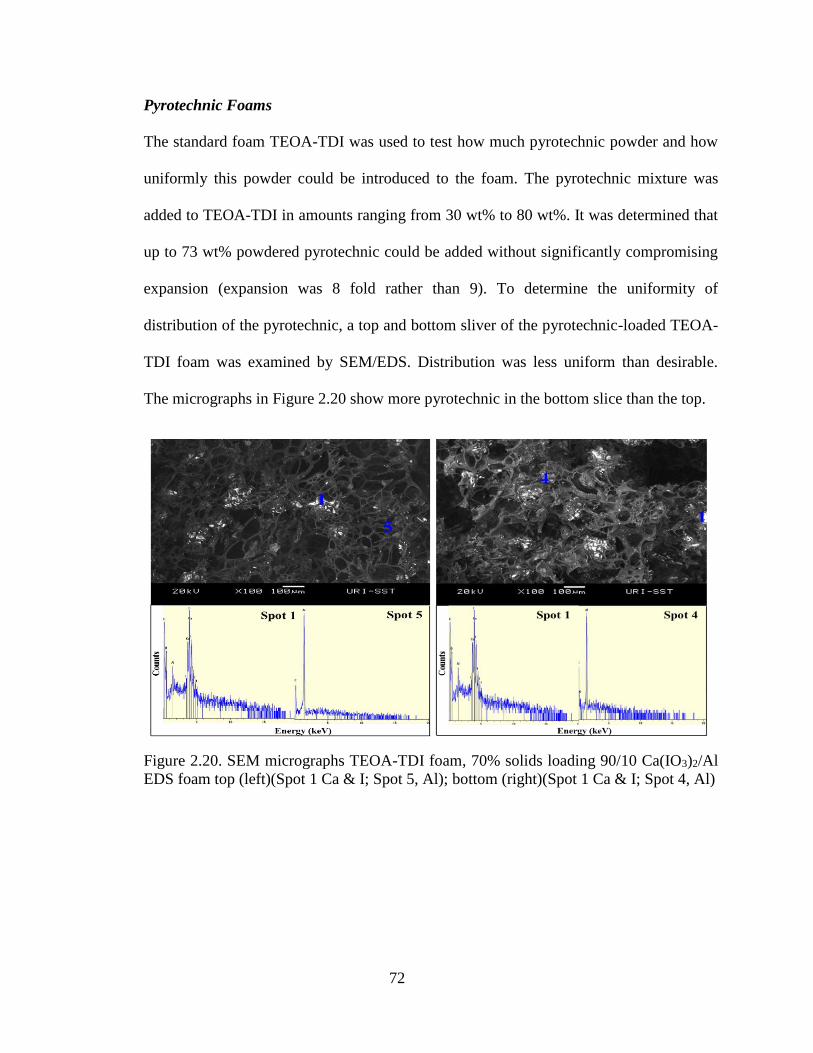
72
Pyrotechnic Foams
The standard foam TEOA-TDI was used to test how much pyrotechnic powder and how
uniformly this powder could be introduced to the foam. The pyrotechnic mixture was
added to TEOA-TDI in amounts ranging from 30 wt% to 80 wt%. It was determined that
up to 73 wt% powdered pyrotechnic could be added without significantly compromising
expansion (expansion was 8 fold rather than 9). To determine the uniformity of
distribution of the pyrotechnic, a top and bottom sliver of the pyrotechnic-loaded TEOA-
TDI foam was examined by SEM/EDS. Distribution was less uniform than desirable.
The micrographs in Figure 2.20 show more pyrotechnic in the bottom slice than the top.
Figure 2.20. SEM micrographs TEOA-TDI foam, 70% solids loading 90/10 Ca(IO3)2/Al
EDS foam top (left)(Spot 1 Ca & I; Spot 5, Al); bottom (right)(Spot 1 Ca & I; Spot 4, Al)

73
Without the presence of foam, the Ca(IO3)2/Al ratio which would readily burn was 75/25.
With added organic, a 90/10 ratio gave optimum performance (Fig. 2.21)
Figure 2.21. Open burn of TEOA-TDI foam compared with bomb calorimetry values for
molecular iodine and heat production
With the exception of TETRA(2)/TEOA-TDI, all the polymers shown in Table
2.1 were mixed with 70 wt% pyrotechnic mixture of 90/10 Ca(IO3)2/Al and the heats of
combustion and iodine production determined by bomb calorimetry. TETRA(2)/TEOA-
TDI was not chosen for further study because its charring suggested that mixing with a
pyrotechnic might result in hazardous, unexpected ignition. To overcome the lack of
uniform distribution of the pyrotechnic in the foams, for calorimetry only, the foams were
powderized, and 70 wt% of the pyrotechnic (90/10 Ca(IO3)2/Al) was mixed in (Table
2.2). SDT of the pyrotechnic-loaded energetic and standard foams (Figure 2.22) show the
pyrotechnic mixture releases heat earlier and over a longer range than without an organic
matrix.
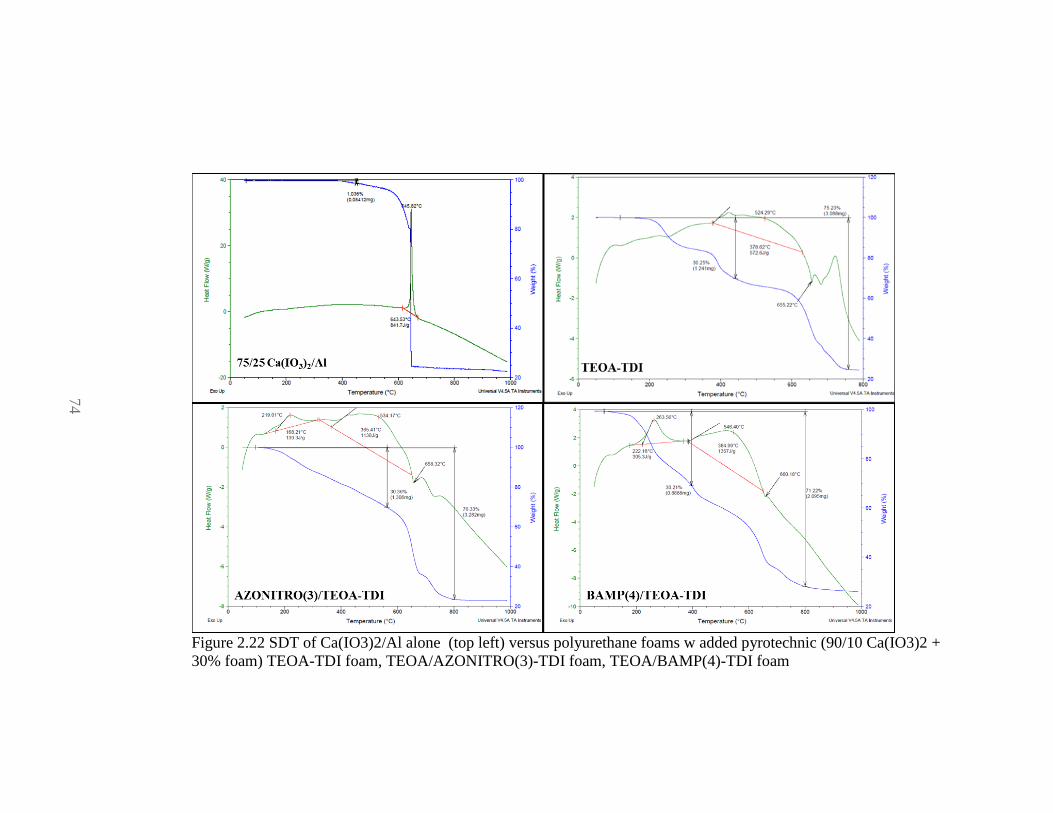
Figure 2.22 SDT of Ca(IO3)2/Al alone (top left) versus polyurethane foams w added pyrotechnic (90/10 Ca(IO3)2 +
30% foam) TEOA-TDI foam, TEOA/AZONITRO(3)-TDI foam, TEOA/BAMP(4)-TDI foam
74
75
Table 2.2. Bomb calorimetric results for pyrotechnic-loaded foams under oxygen
Pyrotechnic-loaded FoamHeat
Output
(kJ/g)
std dev
% Iodine (I2
formed to
pyro mass)
std
dev
90/10 Ca(IO3)2 /Al +30% TEOA-TDI Foam 9.04 0.38 34.0 1.84
90:10 Ca(IO3)2/Al/+30% TMNM(1)/TEOA-TDI Foam 8.72 0.15 32.4 1.81
90:10 Ca(IO3)2/Al/+30% AZONITRO(3)/TEOA-TDI Foam 7.52 0.66 36.7 0.80
90:10 Ca(IO3)2/Al/+30% BAMP(4)/TEOA-TDI Foam 8.99 0.21 36.8 1.21
Within standard deviation the pyrotechnic-loaded energetic foams do not
outperform the standard foam. This was not the case for the polymers when no
pyrotechnic was present (Table 2.1). Apparently, the boost in energy and oxygen
production provided by the pyrotechnic (70 wt% loading) overwhelms any addition
boost available from the energetic monomer which makes up less than 10 wt% of the
overall formulation.
76
CONCLUSIONS
This study sought to improve the energy output of polyurethane/pyrotechnic
formulations by replacing part of the polyol TEOA with polyols containing nitro
and/or azide groups. Monomers containing one or two of these functional groups were
synthesized, but it was found that the presence of two nitro groups in the polyol, as in
Compounds 2 and 5, resulted in a material so energetic that when combined with TDI,
the polyurethane could not be produced without “scorching.” It should be noted that
polyurethane resins have been made from compounds 4 and 5, but in that report
polymerization was allowed to progress slowly (overnight) [14]. In contrast, the diazo
group, one nitro group, and one azo/one nitro were successfully inserted into a
polyurethane. We believe TMNM 1 and AZONITRO 3 polyurethanes are reported
here for the first time.
It was found that a pyrotechnic powder could be mixed with the polyurethane
foams at levels up 73% solids with little negative impact on the foam expansion; it
was only reduced from 9 to 8 fold. Furthermore, the pyrotechnic added could contain
less aluminum since fuel was supplied by the polyurethane. Whereas at least 25%
aluminum was required to produce ignition in a Ca(IO3)2 powder, in the presence any
of the polyurethane foams the oxidizer/aluminum ratio could be raised to 90/10 and
still be readily ignited. Reduction of aluminum resulted in increased output of
molecular iodine.
77
REFERENCES
1. H. Fairhead, B. Setlow, P. Setlow, Prevention of DNA Damage to Spores and In
Vitro by Small, Acid-Soluble Proteins from Bacillus Species. J. Bacteriology, 1993,
175 (5), 1367-1374.
2. B.R. Clark, M.L. Pantoya, The aluminum and iodine pentoxide reaction for the
destruction of spore forming bacteria, Phys. Chem. Chem. Phys. 2010, 12 (39), 12653-
12657.
3. R. Tennen, B. Setlow, K.L. Davis, C.A. Loshon, P. Setlow, Mechanisms of killing
spores of Bacillus subtilis by iodine, glutaraldehyde, and nitrous acid. J. Appl.
Microbiol., 2000, 89, 330-338.
4. S.P. Gorman, E.M. Scott, E.P. Hutchinson, Effects of aqueous and alcoholic
providone-iodine on spores of Bacillus subtilis. J. Appl. Bacteriol., 1985, 59 (1), 99-
105.
5. Oxley, J.C..; Smith, J.L.; Porter, M.M.; Yekel, M.J.; Canaria, J.A. “Potential
Biocides” Iodine-Producing Pyrotechnics” Propellants Explos. Pyrotech., submitted.
6. Bailey, F.E. Jr. Flexible Polyurethane Foams. In Handbook of Polymeric Foams
and Foam Technology; Klempner, D; Frisch, K.C.; Hanser, Munich, 1991; p 53/68.
7. McGuire, R.R.; Cochoy, R. E.; Shackelford, S. A.; Process for preparation of
energetic plasticizers. US 4424398, January 3, 1984.
8. Provatas, A.; Energetic Polymers and Plasticisers for explosive formulations- A
review of recent advances. DSTO: Melbourne, 2000.
78
9. Ghee Ang, H. and Pisharath, S. Energetic Polymers: binders and plasticizers for
enhancing performance; Wiley: Wienhiem, 2012, 1-18.
10. Oxley, J. C.; Smith, J. L., Brady IV, J. E.; Brown, A. C.; Characterization and
Analysis of Tetranitrate Esters. Propellants Explos. Pyrotech. 2012, 37, 24-39.
11. Schulze, M.C.; Chavez, D. E.; Synthesis and characterization of energetic
plasticizer AMDNNM. J. Energ. Mater., 2016. 34 (2), 129-137.
12. Diaz, D.D.; Punna, Sreenivas; Holzer, P; Mcpherson, A. K.; Sharpless, B.; Fokin,
V.V.; Finn, M.G.; Click chemistry in materials synthesis. 1. Adhesive polymers from
copper-catalyzed azide-alkyne cycloaddition. J. Polym. Sci. A Polym. Chem. 2004, 42
(17), 4392-4403.
13. Hafner, S.; Hardegen, V. A.; Hofmayer, M. S.; Klapötke, T. M.; Potential
energetic plasticizers on the basis of 2,2-Dinitropropane-1,3-diol and 2,2-
Bis(azidomethyl)propane-1,3-diol. Propellants, Explos., Pyrotech. 2016, 41, 806-813.
14. Bellan, A, B.; Hafner, S.; Hartgenen, V. A.; Klapötke, T.M.; Polyurethanes based
on 2,2-Dinitropropane-1,3-diol and 2,2-Bis(azidomethyl)propane-1,3-diol as potential
energetic binders. J. Appl. Polym. Sci., 2016, 133, 43991-44000.
15. Klapötke, T. M.; Krumm, B.; Rest, S. F.; Suceska, M.; Polynitro containing
energetic materials based on carbonyldiisocyanate and 2,2-Dinitropropane-1,3-diol. Z.
Anorg. Allg. Chem. 2014, 640 (1), 84-92.
16. Hiskey, M. A.; Naud, D. L.; Improved synthetic routes to polynitroheterocycles. J.
Energ. Mater. 1999, 17(4), 379-391.
79
17. Backus, J.K. Rigid Polurethane Foams. In Handbook of Polymeric Foams and
Foam Technology; Klempner, D; Frisch, K.C.; Hanser, Munich, 1991; p 79.
18. Niyogi, S.; Sarkar, S.; Adhikari, B.; Catalytic activity of DBTDL in polyurethane
formation. Indian J. Chem. Technol. 2002, 9, 330-333.
19. Burgess, A.E.; Davidson, J.C.; “Kinetics of the Rapid Reaction between Iodine
and Ascorbic Acid in Aqueous Solution using UV-Visible Absorbance and Titration
by and Iodine Clock” J. Chem. Educ. 2014, 91 (2), 300-304.