interactions of silver and polystyrene nanoparticles with ... · interactions of nanoparticles with...
TRANSCRIPT
POUR L'OBTENTION DU GRADE DE DOCTEUR ÈS SCIENCES
acceptée sur proposition du jury:
Prof. J. S. Arey, président du juryProf. K. Schirmer, Dr R. Behra, directrices de thèse
Prof. B. Rothen-Rutishauser, rapporteuseDr K. Van Hoecke, rapporteuse
Dr L. F. De Alencastro, rapporteur
Interactions of silver and polystyrene nanoparticles with algae
THÈSE NO 6818 (2015)
ÉCOLE POLYTECHNIQUE FÉDÉRALE DE LAUSANNE
PRÉSENTÉE LE 23 NOVEMBRE 2015
À LA FACULTÉ DE L'ENVIRONNEMENT NATUREL, ARCHITECTURAL ET CONSTRUITLABORATOIRE DE TOXICOLOGIE DE L'ENVIRONNEMENT
PROGRAMME DOCTORAL EN GÉNIE CIVIL ET ENVIRONNEMENT
Suisse2015
PAR
Xiaomei LI

Summary
Nanoparticles have a variety of unique physicochemical properties attributable to their small
dimensions, and are attractive to manufactures and researchers alike. The global production and
application of nanoparticles lead to a raised concern for their environmental impacts,
particularly on those aquatic organisms that are likely exposed to the particles. Algae are of high
ecological importance, functioning as oxygen producers and as energy and food base for almost
all aquatic life. In the present thesis, interactions of nanoparticles with different fresh water algal
strains were examined.
First, the toxicity and uptake of citrate-coated silver nanoparticles (AgNP, ~50 nm) and AgNO3
(added as Ag+ source) were examined in the green alga Euglena gracilis, which has no cell wall
but a pellicle surrounding the cell. To assess whether the effects were due to the particles or the
Ag+ ions present in the AgNP suspensions, exposures were performed in the presence of a silver
ligand to complex the Ag+ ions. Secondly, to examine the role of algal cell wall in determining
the particle interactions with algae, four strains were selected, including Euglena gracilis,
Haematococcus pluvialis, and Chlamydomonas reinhardtii wild type and a cell wall free mutant.
Their interactions with fluorescent polystyrene nanoparticles (PSNP) of two sizes, 50 nm
(PSNP50) and 500 nm (PSNP500), were investigated. Third, interactions of three differently coated
AgNP with alkaline phosphatase (AP), an extracellular enzyme responsible for phosphorus
acquisition, were assessed. The selected coatings were citrate (CIT), polyvinylpyrrolidone (PVP)
and gelatin (GEL), allowing for evaluation of how particle surface chemistry influences the
particle interactions with the enzyme.
Exposure to AgNP and AgNO3 for 1-2 hours led to a decrease in photosynthetic yield, in a
concentration-dependent manner, and changes in cell morphology in E. gracilis. Based on total
silver added, AgNP were less toxic than AgNO3. Concentrations causing a 50% reduction in
photosynthetic yield (EC50) after 1 hour exposure were 1.9 µM and 85 n M for AgNP and
AgNO3, respectively, and extending to 2 hours exposure did not lead to a higher toxicity.
Damaging effects of AgNP on photosynthesis and morphology were completely prevented by
cysteine, suggesting that the toxicity of AgNP was mediated by Ag+ ions. Uptake studies
I
Summary
showed that the maximal cell-associated silver measured after 1 hour exposure was higher in
AgNP compared to AgNO3, amounting to 5.1 × 10⁻⁴ mol Lcell-1 and 1.4 × 10⁻⁴ mol Lcell-1 for AgNP
and AgNO3, respectively. The higher silver level determined in AgNP exposures was shown to
correspond to particles adsorbed to the pellicle.
By examining four algal strains, it was found that no strain internalized PSNP, emphasizing the
role of algal cell walls as barrier for nanoparticle uptake. Interactions of PSNP with algae were
found to be unique for each strain, and dependent on particle size. PSNP50 were associated with
E. gracilis cells displaying a non-homogeneous distribution pattern on the pellicle, and resulted
in significant morphological changes of the cells and loss of the flagella. In H. pluvialis, PSNP50
were distributed homogeneously around the cells. The wild type and cell wall free mutant of C.
reinhardtii cells exposed to PSNP50 were found to clump together packed within the extracellular
polymeric substances (EPS). The particles were associated with the EPS. Other than the PSNP50,
the larger PSNP500 were observed to interact only with the two C. reinhardtii strains. Taken
together, these results indicate that the algal cell walls hinder the crossing of nanoparticles at
least in case of those displaying sizes of ~50 nm and larger. The absence of particle
internalization in the cell wall free mutant of C. reinhardtii suggests that no efficient transport
routes for the assessed nanoparticles are available in the plasma membrane of this algae. The
different patterns of interaction strongly depended on both the particle size and the
characteristics of the algal cells, in particular their surface architecture and potential to secrete
biomolecules. The localization of these biomolecules determined the distribution of the
nanoparticles, either on the algal surfaces or in the exposure medium.
Assessing the sorption of AP to AgNPCIT, AgNPPVP, and AgNPGEL showed that the
physiochemical properties of both the particle coatings and the enzyme were determinant for
the binding. The presence of AP did not affect the stability of the three AgNP in the
experimental medium, though the enzyme did adsorb to the AgNPCIT and AgNPPVP, leading to a
10% and 70% coverage of the particle surface area, respectively. No adsorption of AP was found
in the case of AgNPGEL. The three types of AgNP decreased the AP activity in a concentration-
dependent manner, however, the inhibitory effects only occurred when the AgNP were added
after addition of the substrate to the enzyme, not vice versa. AgNO3 did not affect the AP
II
Summary
activity. Thus, the results of this study indicate particle-specific effects due to interactions with
the enzyme-substrate intermediate. In addition, the conformation of the AP was important in
determining its interaction with the nanoparticles.
To conclude, this thesis provides fundamental information on environmental risk assessment of
nanoparticles. The results confirm that toxicity of AgNP to E. gracilis was due to Ag+ ions.
Interactions of nanoparticles with algae depend on particle size, algae characteristics and cell
response to the particles. No uptake occurred in the examined algal strains. Moreover,
adsorption of the extracellular enzyme to AgNP was determined by the physicochemical
properties of the particle coatings and the enzyme, as well as the conformation of the enzyme.
Keywords
Silver nanoparticles, algae, cell wall, toxicity, uptake, adsorption, extracellular enzyme,
nanoparticle enzyme interactions
III

IV
Résumé
Les nanoparticules (NP) ont des propriétés physico-chimiques uniques conférées par leurs
petites dimensions. Elles sont aussi attractives pour les chercheurs que pour les industriels. Au
niveau mondial, la production et l'application des nanoparticules conduisent à une
préoccupation importante pour leurs impacts sur l'environnement, en particulier sur les
organismes aquatiques qui se retrouvent probablement exposés à ces particules. Les algues ont
une importance hautement écologique en tant que productrices d'oxygène et d'énergie mais
aussi en tant que base de la chaine alimentaire pour presque toute la vie aquatique. Dans cette
thèse, les interactions des nanoparticules avec différentes souches algales d’eaux douces ont été
examinées.
Dans un premier temps, la toxicité et l'assimilation de nanoparticules d’AgNO3 (ajouté comme
source de Ag+) ou de nanoparticules d'argent enrobé de citrate (AgNP, ~50 nm) ont été
examinées dans l'algue verte Euglena gracilis, qui n'a pas de paroi cellulaire mais une pellicule
entourant la cellule. Pour déterminer si les effets étaient dus à des particules ou des ions Ag+
présents dans les suspensions de AgNP, les expositions ont été réalisées en présence d'un ligand
d'argent en complément des ions Ag+. Dans un deuxième temps, le rôle de la paroi cellulaire
chez l’algue dans la détermination des interactions des particules avec les algues a été examiné.
Quatre souches ont été sélectionnées, incluant Euglena gracilis, Haematococcus pluvialis, et
Chlamydomonas reinhardtii (une souche de type sauvage et un mutant libre de la paroi cellulaire
pour cette dernière souche). Les interactions de ces quatre souches avec les nanoparticules de
polystyrène fluorescentes (PSNP) de deux tailles, 50 nm (PSNP50) et 500 nm (PSNP500), ont été
étudiées. Enfin, les interactions de trois AgNP différemment enrobé avec de la phosphatase
alcaline (AP), une enzyme extracellulaire responsable de l'acquisition de phosphore, ont été
évaluées. Les revêtements choisis étaient le citrate (CIT), la polyvinylpyrrolidone (PVP) et la
gélatine (GEL), permettant l'évaluation de la façon dont la chimie de surface des particules
influence leurs interactions avec l'enzyme.
L'exposition à des NPAg et à AgNO3 pendant 1-2 heures conduit à diminuer le rendement
photosynthétique, d'une manière concentration-dépendante, et induit des changements dans la
V
Résumé
morphologie des cellules de E. gracilis. Si on se base sur l'argent total ajouté, les AgNP sont
moins toxiques qu’AgNO3. La concentration qui entraine une réduction de 50% du rendement
photosynthétique (EC50) après 1 heure d'exposition est de 1,9 µM pour AgNP et de 85 nM pour
AgNO3. L'extension à 2 heures d'exposition ne conduit pas à une toxicité plus élevée. Les effets
néfastes de AgNP sur la morphologie et la photosynthèse ont été empêchés complètement par la
cysteine, ce qui suggère que la toxicité de AgNP est médiée par des ions Ag+. Des études sur
l’assimilation ont montré que le maximum des cellules associées à l’argent, mesurée après une
heure d’exposition, était plus élevée pour AgNP que pour AgNO3, soit 5.1 × 10⁻⁴ mol Lcell-1 et 1.4 ×
10-4 mol Lcell-1 pour AgNP et pour AgNO3, respectivement. Il a été montré que le niveau élevé
d'argent déterminé dans les expositions de AgNP correspond à des particules adsorbées sur la
pellicule.
En examinant les 4 souches algales, il a été trouvé qu’aucune souche n’internalisait les PSNP,
soulignant le rôle des parois cellulaires des algues comme barrière contre l’absorption des
nanoparticules. Les interactions entre PSNP et les algues sont uniques pour chaque souche, et
dépendent de la taille des particules. Les PSNP50 qui sont associé avec les cellules de E. gracilis
présentant un modèle de distribution non homogène sur la pellicule, résultent de changements
morphologiques importants des cellules et de la perte des flagelles. Chez H. pluvialis, les PSNP50
sont distribués de manière homogène autour des cellules. Le type sauvage et le type mutant
libre de la paroi cellulaire chez les cellules de C. reinhardtii exposées à des PSNP50 s’agglutinent
ensemble, empaqueté au sein de substances polymères extracellulaires (EPS). Les particules ont
été associées avec les EPS. En dehors des PSNP50, les interactions des PSNP500, plus grosses, ont
été observées uniquement avec les deux souches de C. reinhardtii. Pris ensemble, ces résultats
indiquent que les parois cellulaires des algues empêchent le passage de nanoparticules, au
moins dans le cas où les tailles sont de ~50 nm et plus. L'absence d'internalisation des particules
du mutant libre de paroi cellulaire de C. reinhardtii suggère qu’il n’y a pas de voie de transport
efficace pour ces nanoparticules dans la membrane plasmique de cette algue. Les différents
modes d’interactions dépendent fortement à la fois de la taille de la particule et des
caractéristiques de la cellule algale, en particulier de l’architecture de la surface et de leur
VI
Résumé
potentiel à sécréter des biomolécules. La localisation de ces biomolécules détermine la
distribution des nanoparticules, soit sur la surface des algues soit dans le milieu d’exposition.
L’évaluation de la sorption de AP sur AgNPCIT, AgNPPVP, et sur AgNPGEL a montré que les
propriétés physico-chimiques des revêtements des particules et de l'enzyme ont été
déterminantes pour la liaison. La présence de AP n'a pas affecté la stabilité des trois AgNP dans
le milieu expérimental, bien que l'enzyme se soit adsorbé au AgNPCIT et AgNPPVP, conduisant à
une couverture des particules de la zone de surface de 10% et 70%, respectivement. Aucune
adsorption de AP n’a été trouvée dans le cas de AgNPGEL. Les trois types de AgNP diminue
l'activité de AP de manière concentration-dépendante. Cependant, les effets inhibiteurs
apparaissent seulement lorsque les AgNP sont ajoutés après l'addition du substrat de l'enzyme,
et non l'inverse. AgNO3 n'affecte pas l'activité de AP. Ainsi, les résultats de cette étude indiquent
des effets particules-spécifiques dues aux interactions avec l'enzyme-substrat intermédiaire. En
outre, la conformation de AP est importante dans la détermination de ses interactions avec les
nanoparticules.
En conclusion, cette thèse fournit des informations fondamentales sur l'évaluation des risques
environnementaux des nanoparticules. Les résultats confirment que la toxicité de AgNP sur E.
gracilis était due à ions Ag+. Les interactions des nanoparticules avec les algues dépendent à la
fois la taille des particules, des caractéristiques des algues et de la réponse cellulaire aux
particules. Aucune absorption n’a eu lieu dans les souches d'algues étudiées. En outre,
l'adsorption d’enzyme extracellulaire sur les AgNP a été déterminée par les propriétés physico-
chimiques des revêtements de particules et de l’enzyme, ainsi que la conformation de l'enzyme.
Mots clefs : Nanoparticules d’argent, algues, paroi cellulaire, toxicité, absorption, adsorption,
enzyme extracellulaire, interactions enzyme-nanoparticules
VII

VIII
Contents
Chapter 1 General introduction .......................................................................................................... 1
1.1 Engineered nanoparticles .......................................................................................................... 1
1.1.1 Production and application ................................................................................................... 1
1.1.2 Physicochemical properties................................................................................................... 2
1.1.3 Nanoparticle characterization............................................................................................... 3
1.2 Silver nanoparticles (AgNP) in the aquatic environment ..................................................... 4
1.2.1 Release of AgNP into the aquatic environment ................................................................. 4
1.2.2 Fate of AgNP in the aquatic environment .......................................................................... 5
1.2.3 Impacts of AgNP on aquatic organisms .............................................................................. 6
1.3 Interaction of AgNP with algae ................................................................................................ 6
1.3.1 Cellular uptake of nanoparticles in algae............................................................................ 7
1.3.2 Toxicity of AgNP to algae ..................................................................................................... 9
1.4 Interactions of nanoparticles with proteins ............................................................................ 9
1.4.1 Formation of protein corona ............................................................................................... 10
1.4.2 Impacts of protein-nanoparticle interactions on nanoparticles ..................................... 11
1.4.3 Impacts of protein-nanoparticle interactions on proteins .............................................. 11
1.5 Scope of the thesis .................................................................................................................... 12
Chapter 2 Silver nanoparticle toxicity and association with the alga Euglena gracilis .............. 15
2.1 Introduction ............................................................................................................................... 16
2.2 Materials and methods ............................................................................................................ 18
2.2.1 Materials ................................................................................................................................ 18
2.2.2 Nanoparticle characterization............................................................................................. 18
VX
Résumé
2.2.3 Algae culture and exposure medium ................................................................................ 18
2.2.4 Photosynthesis ...................................................................................................................... 19
2.2.5 Cell morphology ................................................................................................................... 19
2.2.6 Uptake experiments ............................................................................................................. 20
2.2.7 Metal analysis ........................................................................................................................ 20
2.2.8 ToF-SIMS analysis ................................................................................................................ 20
2.2.9 Data analysis ......................................................................................................................... 21
2.3 Results ....................................................................................................................................... 21
2.3.1 Nanoparticle characterization ........................................................................................ 21
2.3.2 Effects on algal photosynthesis ...................................................................................... 22
2.3.3 Effects on cell morphology .............................................................................................. 23
2.3.4 Uptake experiments .......................................................................................................... 23
2.3.5 ToF-SIMS analysis .............................................................................................................. 23
2.4 Discussion .................................................................................................................................. 24
2.5 Figures and tables ..................................................................................................................... 29
2.6 Supporting information ........................................................................................................... 34
Chapter 3 Interactions of polystyrene nanoparticles with four fresh water algal strains ........ 41
3.1 Introduction ............................................................................................................................... 42
3.2 Materials and methods ............................................................................................................ 44
3.2.1 PSNP and characterization in exposure media ................................................................ 44
3.2.2 Algae culture ......................................................................................................................... 45
3.2.3 Exposure experiments.......................................................................................................... 45
3.2.4 CLSM ...................................................................................................................................... 46
3.2.5 Image analysis ....................................................................................................................... 46
X
Résumé
3.3 Results ........................................................................................................................................ 47
3.3.1 Characterization of PSNP in culture media ...................................................................... 47
3.3.2 Interaction of PSNP with Euglena gracilis .......................................................................... 47
3.3.3 Interaction of PSNP with Haematococcus pluvialis ............................................................ 48
3.3. Interaction of PSNP with Chlamydomonas reinhardtii .......................................................... 49
3.4 Discussion .................................................................................................................................. 49
3.4.1 Euglena gracilis ....................................................................................................................... 50
3.4.2 Haematococcus pluvialis ......................................................................................................... 51
3.4.3 Chlamydomonas reinhardtii .................................................................................................... 52
3.5 Figures and tables ..................................................................................................................... 54
3.6 Supporting information ........................................................................................................... 61
Chapter 4 Interactions of differently coated silver nanoparticles with alkaline phosphatase . 67
4.1 Introduction ............................................................................................................................... 68
4.2 Materials and methods ............................................................................................................ 70
4.2.1 Materials ................................................................................................................................ 70
4.2.2 AgNP characterization ......................................................................................................... 71
4.2.3 Adsorption assay .................................................................................................................. 71
4.2.4 Protein analysis ..................................................................................................................... 72
4.2.5 Metal analysis ........................................................................................................................ 72
4.2.6 Effects of AgNP on AP activity .......................................................................................... 73
4.3 Results ........................................................................................................................................ 73
4.3.1 Characterization of AgNP ................................................................................................... 73
4.3.2 Adsorption assay .................................................................................................................. 74
4.3.3 Effects on enzyme activity ................................................................................................... 75
XI
Résumé
4.4 Discussion .................................................................................................................................. 75
4.5 Figures and tables ..................................................................................................................... 79
4.6 Supporting information ........................................................................................................... 84
Chapter 5 Outlook .............................................................................................................................. 87
5.1 Uptake of nanoparticles in algae ............................................................................................ 87
5.2 Interactions of nanoparticles with algal cell walls ............................................................... 88
5.3 Nanoparticle interactions with extracellular molecules ..................................................... 89
References .................................................................................................................................................. 91
Acknowledgements ................................................................................................................................ 101
Curriculum vitae .................................................................................................................................... 102
XII
Chapter 1 General introduction Incredibly small by definition (less than 100 nm), nanoparticles have been increasingly used in
various consumer products, which makes the release of nanoparticles into the environment very
likely. Such environmental exposure to nanoparticles leads to rising concerns on their potential
impacts on organisms, such as those living in surface water (Kahru and Dubourguier, 2010).
This thesis focuses on interactions of nanoparticles with fresh water algae. In the introductory
chapter, I provide an overview of the nanoparticle characteristics, environmental fate and state
of knowledge of nanoparticle interactions with aquatic organisms as a background leading to
the research questions addressed in this thesis.
1.1 Engineered nanoparticles
1.1.1 Production and application
The recent innovations and promising applications of nanotechnology have led to a strongly
increased production and application of engineered nanoparticles (ENP) during the last
decades. Inorganic ENP based on metals/metal oxides include silver nanoparticles (AgNP), gold
nanoparticles (AuNP), titanium dioxide nanoparticles (TiO2NP), and zinc oxide nanoparticles
(ZnONP) (Peralta-Videa et al., 2011; Srivastava et al., 2015). The annual production of these
nanoparticles has been estimated at global and regional levels. For instance, the European yearly
production of TiO2NP was reported to range between 55-3,000 tons (Piccinno et al., 2012). For
AgNP, a global production of 5.5-500 tons per year was reported (Aschberger et al., 2011;
Piccinno et al., 2012; Windler et al., 2013), while in Europe, a AgNP production of around 30
tons per year was calculated (Sun et al., 2014a). Specifically in Switzerland, the annual
production volume was estimated to be 0.026-4.03 tons for AgNP (Gottschalk et al., 2010).
Nanoparticles are currently used in broad fields covering household and industrial applications.
According to the estimation of ENP distribution within grouped product categories, TiO2 NP,
ZnO NP and AgNP are largely used in paints, cosmetics, filters, cleaning agents, and other
applications (Gottschalk et al., 2009; Gottschalk et al., 2010; Keller et al., 2013; Piccinno et al.,
2012). TiO2 NP exhibit strong optical and catalytic properties, which facilitate their application in 1
Chapter 1 General introduction
environmental- and energy- related fields, such as photocatalysis and photovoltaics (Boucle and
Ackermann, 2012; Fujishima et al., 2008). Owing to their well-known antimicrobial activities,
AgNP have been widely used in household products, such as plastics, textiles and food
containers, as well as in medical applications (Chen and Schluesener, 2008; Rai et al., 2009;
Sharma et al., 2009). As chemically inert and biocompatible nanoparticles, AuNP have been
extensively exploited in biological and medical fields (Boisselier and Astruc, 2009; Shah et al.,
2014).
1.1.2 Physicochemical properties
Their physicochemical properties make nanoparticles distinct from bulk materials and provide
them with attractive features for various applications (described above). At the same time, these
physicochemical properties are important when considering their interactions with the
surrounding environment. Such properties include elemental composition, size, charge, surface
coatings, aggregation/agglomeration state, and solubility.
The nanometer dimensions of the particles provide more pronounced interfacial properties and
surface reactivity than compared to larger particles (Auffan et al., 2009). For instance, the
adsorption of molecules to the nanoparticle surface was found to be largely enhanced in the case
of smaller-sized particles due to their increased surface area (Bottero et al., 2011; Jegadeesan et
al., 2010).
When dispersed in aqueous solutions, nanoparticles become charged due to protonation or
deprotonation processes on their surfaces. The resulting charges receive and accumulate the
counter ions from the solution, resulting in an electric double layer surrounding the particles.
Surface charge is the most important factor in determining particle stability, with more
positively or negatively charged particles being more stable than the more neutral particles.
Interactions between adjacent nanoparticles, such as electrostatic interactions and Van der Waals
forces, may lead to the aggregation or agglomeration of particles in the suspension. Based on
DLVO theory (named after Derjaguin, Landau, Verwey and Overbeek), the balance between the
two forces, electrostatic repulsion and van der Waals attraction, determines whether
aggregation or agglomeration occurs between particles. Aggregation refers to particles joining
2
Chapter 1 General introduction
together to form a larger assemblage, while agglomeration refers to weakly interacting particles.
To stabilize the nanoparticle dispersion, the surface of nanoparticles can be intentionally coated
with chemically defined molecules, such as citrate and carbonate, and various polymers like
polyvinylpyrrolidone (PVP), polyethylene glycol (PEG) and gelatin (Gupta and Gupta, 2005).
Such coatings provide the nanoparticle with additional charge or steric forces, and thus
increased stability. Generally, the steric coatings, like PVP and PEG, are more efficient in
stabilizing the particles compared to the electrostatic coatings (Tejamaya et al., 2012).
Metallic nanoparticles, such as AgNP, ZnONP and copper nanoparticles, tend to dissolve in the
suspension, resulting in the release of metal ions. The dissolution of nanoparticles is a dynamic
process and has been found to be dependent on particle size, coating, and the chemical
composition of the exposure media (Misra et al., 2012; Navarro et al., 2015).
1.1.3 Nanoparticle characterization
Various techniques for nanoparticle characterization can be exploited in ecotoxicological studies.
While microscopy techniques, such as scanning electron microscopy (SEM) and transmission
electron microscopy (TEM) (Dudkiewicz et al., 2011; Luo et al., 2013; Tiede et al., 2009), can
directly .visualize the particles, it is highly time consuming to assess a large number of
nanoparticles. Fluorescent microscopy can be specifically exploited in the case of fluorescently
labelled nanoparticles, like polystyrene nanoparticles (PSNP), which have well-established
surface functionalization and a wide range of choices for the fluorescence spectra.
Other techniques, such as dynamic light scattering (DLS) and nanoparticle tracking analysis
(NTA), provide measurements of the hydrodynamic diameter of nanoparticles based on
fluctuation of scattering light as a result of the Brownian movement of particles in suspensions
(Montes-Burgos et al., 2010). DLS measures the scattered light of the entire suspension, whereas
NTA is based on single particle analysis. Measurements with DLS can be limited for highly
dispersed particle suspensions, where the average size of particles might be biased to the
presence of a few large particles. NTA is more efficient than DLS in the analysis of polydisperse
samples, and moreover, NTA can provide particle concentration information which can be
beneficial when evaluating polydisperse sample.
3
Chapter 1 General introduction
UV-vis spectroscopy is a commonly used and convenient technique, allowing the estimation of
particle aggregation/agglomeration state, primarily based on the surface plasma resonance of
the nanoparticles (Amendola and Meneghetti, 2009; Piccapietra et al., 2012b). However, the
ability to characterize nanoparticles by this method is limited to a few types of nanoparticles
having plasma resonance properties (e.g. AgNP and AuNP), and can be dependent on factors
such as sample concentration and media composition. Additionally, surface analytical
techniques, like time-of-flight secondary ion mass spectrometry (TOF-SIMS), have been used to
investigate nanoparticle coatings (Neunzehn et al., 2013).
1.2 Silver nanoparticles (AgNP) in the aquatic environment
My thesis is mainly based on the examination of the effects of AgNP in the aquatic environment.
This nanoparticle was selected due to its wide application in daily life and exceptional
antibacterial properties. The release of AgNP into the environment is certain (Benn and
Westerhoff, 2008; Kaegi et al., 2010). Once entered the aquatic system, AgNP are chemically
modified, which results in the generation of various silver-related species. The interaction of
AgNP with aquatic organisms requires careful consideration with regard to the silver species
present in the exposure medium.
1.2.1 Release of AgNP into the aquatic environment
Nanoparticles can be released into environmental compartments during their whole life cycle,
through both intended and unintended routes. Different release scenarios, including outdoor
weathering, washing, and incineration, have been reviewed for nanoparticles (Froggett et al.,
2014). For AgNP, about 30% of the total silver content in a paint used for outdoor facades was
found to be released to the water column through runoff during one year (Kaegi et al., 2010).
Other studies showed the release of AgNP from different commercially available textiles during
washing and rinsing (Benn and Westerhoff, 2008; Lorenz et al., 2012).
Quantitative data on environmental concentrations of AgNP in the aquatic system are currently
not available due to the limitation of analytical methods on measuring nanoparticles at trace
concentrations. Several modeling studies provide information on predicted environmental
concentrations of AgNP based on the whole life cycle assessment of AgNP from production to
4
Chapter 1 General introduction
disposal (Blaser et al., 2008; Gottschalk and Nowack, 2011; Gottschalk et al., 2009; Gottschalk et
al., 2010; Mueller and Nowack, 2008; Sun et al., 2014a). According to the modelling, AgNP
concentrations in the surface water in Switzerland were reported to be in the ranges of 0.56-2.63
ng L-1 (Gottschalk et al., 2009), and 0.51 to 0.94 ng L-1 as calculated in a more recent study (Sun et
al., 2014a).
1.2.2 Fate of AgNP in the aquatic environment
Silver is a highly chemically active species (Adams and Kramer, 1999b; Dobias and Bernier-
Latmani, 2013; Levard et al., 2012), which challenges the analysis and prediction of the fate of
AgNP in aquatic environments. Previous studies on AgNP behavior in synthetic media and
natural water showed that the intrinsic nanoparticle physiochemical properties, for instance
size, shape, and coatings, and also diverse environmental factors in aqueous systems, such as
pH, ionic strength, divalent ions, inorganic and organic ligands, can influence the particle
stability, fate, and environmental transformations. Humic acids were found to enhance the
stability of AgNP due to additional electrostatic repulsion induced by adsorption of the organic
molecules (Huynh and Chen, 2011). On the other hand, studies investigating the behavior of
AgNP in different aqueous solutions showed that AgNP tend to agglomerate at acidic pH and
high ionic strength (El Badawy et al., 2010; Piccapietra et al., 2012b). AgNP can dissolve under
oxidative conditions, resulting in the formation of silver ions (Ag+) (Dobias and Bernier-Latmani,
2013; Lee et al., 2012). Size-dependent dissolution of AgNP was found in both neutral and acidic
conditions, with smaller nanoparticles being more soluble (Peretyazhko et al., 2014). The
released Ag+ tend to react with other organic and inorganic molecules, and form different silver
species that may precipitate in the natural environment. Due to the strong affinity of silver for
sulfur (Adams and Kramer, 1999a), formation of Ag2S is expected upon interaction with
inorganic HS- or organic thiols. At environmentally realistic concentrations of HS-, Cl-, and CO32-,
the dominant silver species in fresh water are suggested to be Ag2S, AgCl, and elemental silver
(Ag0) (Levard et al., 2012).
5
Chapter 1 General introduction
1.2.3 Impacts of AgNP on aquatic organisms
Quantitative ecotoxicological data are required to evaluate the sensitivity of different organisms
and estimate the corresponding effective concentrations. The toxicity data concerning the half-
maximal effective concentration (EC50) of AgNP as well as other metallic nanoparticles to
various aquatic organisms have been summarized in several reviews (Bondarenko et al., 2013;
Fabrega et al., 2011a; Kahru and Dubourguier, 2010). The assessed organisms include bacteria,
yeast, protozoa, algae, nematode, crustaceans, and fish, which cover different levels of the
aquatic food chain (Bondarenko et al., 2013). The reported EC50 values are in the range of µg L-1
to mg L-1 of total silver in the exposure media.
Toxicity studies on AgNP have suggested that the observed effects on organisms are due to the
released silver ions in the AgNP suspensions, which are considered as the most toxic form of
silver in aquatic environments (Ratte, 1999), and the nanoparticle interactions with cells
(Morones et al., 2005; Pal et al., 2007; Xiu et al., 2012; Zhao and Wang, 2012). To determine
whether the Ag+ or the AgNP per se is the main cause of the toxicity, experiments are conducted
using silver ligands, like cysteine, to complex and reduce the bioavailability of the Ag+. The
complete prevention of toxicity in the presence of the silver ligands indicates the determinant
role of Ag+, as shown in several studies with bacteria and algae (Miao et al., 2009; Navarro et al.,
2008b; Xiu et al., 2011). On the other hand, a few studies have suggested the contribution of
AgNP per se to the overall toxicity in bacteria, algae, and a fish cell line (Fabrega et al., 2009;
Miao et al., 2010; Yue et al., 2015). Direct interaction of AgNP with bacterial cell surfaces might
affect the cell membrane and induce intracellular accumulation of reactive oxygen species (ROS)
(Amro et al., 2000; Choi and Hu, 2008). Also in algae, increased generation of ROS has been
detected upon exposure to silver (He et al., 2012; Szivak et al., 2009).
1.3 Interaction of AgNP with algae
Unicellular algae are important in nanoecotoxicity studies because they are primary producers
and represent the base of aquatic food webs. To evaluate the particle effects and their transfer
along the food chain in the aquatic environment, it is necessary to determine the uptake and
6
Chapter 1 General introduction
accumulation of AgNP in algae, as well as in other aquatic organisms. However, whether the
particle internalization is a prerequisite for specific effects is not yet known.
1.3.1 Cellular uptake of nanoparticles in algae
Algae cells are typically surrounded by a rigid cell wall in addition to the plasma membrane.
The cell wall maintains the integrity of the algae and constitutes a primary site for interaction
with the surrounding environment. Algal cell walls are remarkably diverse among different
species in their biochemical composition and structural features. Some algae have cell walls that
are similar to the typical terrestrial plant cell walls (Sorensen et al., 2010; Sorensen et al., 2011),
which are comprised of networks of cellulose microfibrils and cross-linking glycans. Other
algae, for instance, the alga Chlamydomonas reinhardtii, do not have cellulose but mainly
glycoproteins in their cell walls which are composed of multiple crystalline layers of about 100
nm in thickness (Monk et al., 1983). The Euglenids species, e.g. Euglena gracilis, are distinguished
from other algal species by the lack of a typical cell wall but the possession of a pellicle that is
mainly composed of protein, lipid and carbohydrate (Nakano et al., 1987). The pellicle has
unique surface characteristics: each individual pellicle stripe is helically arranged, and cavities
are present between two stripes (Leander and Farmer, 2001; Leander et al., 2001). The algal cell
wall composition and structure can undergo dynamic changes during the different stages of cell
development. For instance, in the vegetative flagellate Haemotococcus pluvialis, the cell wall is
mainly composed of carbohydrates and proteins, which are linked to a 35 nm thick layer, while
during aplanospore formation, the cell wall contains additionally cellulose and thickens to 2.2
µm (Hagen et al., 2002; Wang et al., 2004). Additionally, the alga Ochromonas danica represents a
special algal species that does not possess a cell wall, having a specialized cell membrane as the
outer surface instead (Cole and Wynne, 1974).
For nanoparticles to enter algal cells, they must first pass through the cell wall and subsequently
through the plasma membrane via endocytotic processes or passive diffusion. The algal cell wall
is semi-permeable, however, little is known about the pore size. Large particles that are above
the size of the pores might be excluded from passing through the cell wall (Navarro et al.,
2008a). The diversity in algal cell wall composition and structure may influence the passage of
the particles into, and through the cell wall. Few studies have demonstrated endocytosis in
7
Chapter 1 General introduction
algae. Euglenid species are claimed to acquire particulate nutrients by phagocytosis in the
absence of light (Leander et al., 2007). Specifically for the algae O. danica, microsized blue-green
algae were visualized to be internalized using electron microscopy (Cole and Wynne, 1974).
Permeability of the cells can change during their life cycles. As shown in the alga H. pluvialis,
some particular molecules were found to be taken up by cells exclusively during cell division
(Praveenkumar et al., 2015). During growth, the cell wall may have an increased porosity, due to
the insertion of newly synthesized wall materials (Denobel and Barnett, 1991; Yamamoto et al.,
2003). Moreover, the adsorption of nanoparticles to the cell surface, or dissolved metal ions,
might cause damage to the cell walls or membranes (Machado and Soares, 2015). It is not known
yet whether the changes in cell permeability will facilitate nanoparticle internalization.
Internalization of nanoparticles in algae was suggested in only a few studies (Miao et al., 2010;
Taylor et al., 2015; Wang et al., 2013), all of which used metal-based nanoparticles that tend to
release metal ions. For instance, AgNP were visualized inside the cell wall deficient alga O.
danica using TEM imaging (Miao et al., 2010). More often, nanoparticle uptake was not
evidenced in algae (Leclerc and Wilkinson, 2014; Piccapietra et al., 2012a; Röhder, 2014; Van
Hoecke et al., 2009), which emphasizes the role of the algal surface as a barrier against
nanoparticle entry to the cells. As shown in a systematic study with the alga C. reinhardtii wild
type and a cell wall-free mutant, neither AgNP nor cerium dioxide nanoparticles were
evidenced to be internalized by the algal cells, as measured by inductively coupled plasma mass
spectrometry (ICP-MS) (Piccapietra et al., 2012a; Röhder, 2014). This suggests that both the cell
wall and the cell membrane may hinder the particle entry. Using hyperspectral imaging,
particulate forms of silver were found to be intracellular in AgNP-exposed C. reinhardtii cells, yet
the presence of particles was attributed to the reduction or precipitation of Ag+ ions that were
released from AgNP, rather than a direct uptake of AgNP in the exposure medium (Barwal et
al., 2011; Leclerc and Wilkinson, 2014). Some studies reported that nanoparticles were clustered
onto the algal cell wall (Hartmann et al., 2013; Van Hoecke et al., 2008; Van Hoecke et al., 2009),
however, it is not clear whether the particles have direct contact with the cells.
8
Chapter 1 General introduction
1.3.2 Toxicity of AgNP to algae
Algae have been examined for their sensitivity to AgNP and other types of nanoparticles
(Bondarenko et al., 2013; Fabrega et al., 2011a; Kahru and Dubourguier, 2010). Toxicity studies
have reported inhibitory effects of AgNP to algal growth (Burchardt et al., 2012; Fabrega et al.,
2011a; Ribeiro et al., 2014; Sorensen and Baun, 2015), and to photosynthesis (Dewez and
Oukarroum, 2012; Navarro et al., 2008b; Navarro et al., 2015). The effective concentrations
reported in these studies range from µg L-1 to mg L-1 (Bondarenko et al., 2013).
While it is accepted that the silver ions released from AgNP are highly toxic and contribute to
the observed AgNP effects in algae, it remains unclear to what extent the AgNP per se contribute
to the overall toxicity. For instance, the toxicity of AgNP to the freshwater alga C. reinhardtii
(Navarro et al., 2008b), and to a marine diatom, Thalassiosira weissflogii (Miao et al., 2009), was
found to be completely prevented in the presence of thiol ligands, thereby indicating that
inhibitory effects of AgNP were caused solely by the silver ions. In another study, the addition
of thiol ligands reduced, but not fully prevented, the inhibitory effects of AgNP on the growth of
the freshwater algae, O. danica, suggesting that, besides the silver ions, also the AgNP
contributed to the toxicity (Miao et al., 2010).
Algae are known to secrete extracellular biomolecules, especially enzymes used for nutrient
acquisition (Sinsabaugh et al., 1991). Such enzymes include a variety of hydrolytic and oxidative
enzymes, such as alkaline phosphatase, β-glucosidase, leucine aminopeptidase, and
phenoloxidase, which cleave recalcitrant organic matter, and produce molecules that are readily
transported across the cell membranes. Studies on the interactions of nanoparticles with these
extracellular enzymes have reported a decreased enzyme activity upon exposure to the particles
(Gil-Allue et al., 2015; Schug et al., 2014). In case of AgNP, the effects on extracellular enzymatic
activity were attributed to both the silver ions and the particles (Gil-Allue et al., 2015).
1.4 Interactions of nanoparticles with proteins
The high surface-to-volume ratio of nanoparticles greatly favors the adsorption of proteins
present in surrounding fluid. Proteins possess different functional groups, such as carboxylate,
phosphate, hydroxyl, amine, and sulfhydryl, which offer a range of active sites to interact and
9
Chapter 1 General introduction
bind with nanoparticles. The adsorbed proteins, termed ‘protein corona’, form single or multiple
layers surrounding the nanoparticle surface. The corona determines the fate and interaction of
nanoparticles in biological systems (Lynch et al., 2007; Lynch and Dawson, 2008; Monopoli et al.,
2012). Most of the data regarding identification and quantification of the protein corona are
available from human proteins (Ge et al., 2015; Gunawan et al., 2014; Shemetov et al., 2012).
Very limited studies have examined the interaction of nanoparticles with yeast and bacterial
proteins (Eigenheer et al., 2014; Khan et al., 2011c; Wigginton et al., 2010). No information about
interactions of nanoparticles with proteins in algae exists thus far.
1.4.1 Formation of protein corona
Interactions of nanoparticles with proteins have been studied with different biological systems,
including single selected proteins (Sun et al., 2014b; Wen et al., 2013), extracellular proteins
(Albanese et al., 2014; Khan et al., 2011c), human plasma (Lundqvist et al., 2008; Walczyk et al.,
2010; Walkey et al., 2014), cell extracts (Eigenheer et al., 2014; Giri et al., 2014; Wigginton et al.,
2010), and intact cells (Bertoli et al., 2014; Hofmann et al., 2014).
The formation of protein corona is dynamic in nature. Adsorption of proteins to nanoparticles is
driven by colloidal forces and other biophysicochemical interactions present at the interface,
including Van der Waals forces, electrostatic interactions, and hydrophobic/hydrophilic
interactions (Gunawan et al., 2014; Nel et al., 2009). The type of proteins dominating the corona
depends on its binding affinity to the particle surfaces and its relative abundance in the
surrounding fluid. The corona will be first dominated by abundant proteins, but later by less-
abundant proteins with a higher affinity (Mahmoudi et al., 2011). When the equilibrium is
reached, the adsorption/desorption of proteins continues at the interface. Depending on the
binding affinity, the corona can be classified as a ‘hard’ corona, composed of high-affinity low-
exchange-rate proteins, and a ‘soft’ corona, composed of low-affinity high-exchange-rate
proteins (Fleischer and Payne, 2014).
The binding of proteins to nanoparticle surfaces is influenced by the physiochemical
characteristics of particles. It has been shown for AuNP that the adsorbed protein pattern varied
significantly as a function of size, charge and surface coatings of the particles (Benetti et al., 2013;
10
Chapter 1 General introduction
Deng et al., 2013; Walkey et al., 2012). Also for AgNP, proteins were found to bind differently to
bare surfaces of the particles or to chemically modified surfaces (Eigenheer et al., 2014; Podila et
al., 2012). Knowing the influence of particle physicochemical properties on corona formation
may allow the controlled synthesis of nanoparticles with a tunable reactivity with the biological
systems, and therefore lower the toxicity of nanoparticles.
1.4.2 Impacts of protein-nanoparticle interactions on nanoparticles
Adsorption of proteins to the nanoparticle surface may affect the particle stability. The surface
charge of nanoparticles might be either neutralized, if adsorbed proteins possess the opposite
electrical property, or enhanced, if the protein is carrying the same charge. Changes of surface
charge will further affect the stability of nanoparticles. Nanoparticle agglomeration might be
driven by molecular forces, like presence of hydrogen bonding between the particles and
proteins (Yoo et al., 2008). On the other hand, interacting proteins might stabilize the particles,
as a result of enhanced electrostatic interactions or steric stabilization. For instance, tungsten
carbide nanoparticles quickly agglomerated in the protein-free medium, but remained dispersed
when the serum protein was supplemented, sterically stabilizing the particles (Kuhnel et al.,
2009). Moreover, the concentration of proteins was found to affect the stability of nanoparticles,
with more agglomerates formed in the presence of a higher concentration of proteins (Meissner
et al., 2010).
1.4.3 Impacts of protein-nanoparticle interactions on proteins
The native conformation of proteins determines their biological functions. During the formation
of a protein corona, the proteins undergo a partial loss of structure, which may expose
undesired epitopes and render the proteins dysfunctional. Rearrangements of myoglobin
structure upon binding to different nanoparticle surfaces have been reported (Bellezza et al.,
2009; Bellezza et al., 2007). Using both experiments and simulations, destabilization of α-helix
but increased β-sheet were shown in AgNP-adsorbed ubiquitins (Ding et al., 2013). In another
study, fibrillation of 2-microglobulin (human plasma protein) was found to occur on various
types of nanoparticle surfaces, including copolymer nanoparticle, CeO2NP, and carbon
nanotubes (Linse et al., 2007). The fibrillation process led to formation of insoluble protein
11
Chapter 1 General introduction
aggregates, which are typically found in many human diseases e.g. Alzheimer’s disease. In
addition, chemical modifications of proteins, such as carboxylation, might occur upon
interactions with nanoparticles (Tedesco et al., 2008).
Different kinds of enzymes, including lysozyme, horseradish peroxidase, catalase, and trypsin,
were characterized for their interaction with silicon nanoparticles (SiO2 NP) and showed that the
strong association with the nanoparticles caused conformational changes and significant loss in
their enzymatic activities (Czeslik and Winter, 2001; Kondo et al., 1993; Norde and Anusiem,
1992). The sorption to nanoparticles was found to induce alterations of enzyme structure and
function in a size-dependent manner (Shang et al., 2007; Vertegel et al., 2004). In contrast, the
adsorption of luciferase to AgNP did not induce conformational changes in this enzyme, though
reduced enzymatic activity was measured upon interaction with the AgNP, which was
attributed to the silver ions released from the particles (Kakinen et al., 2013).
1.5 Scope of the thesis
The main scope of this Ph.D. thesis was to investigate the interactions of nanoparticles with
fresh water algae, with major focus on AgNP. For certain research questions, fluorescent
labelled PSNP (polystyrene nanoparticles) were used, due to their chemically inert properties
and feasible assessment using microscopy. In this thesis, I addressed the following research
questions:
(i) What are the effects of AgNP to algae and can AgNP be internalized?
(ii) How do algae differing in their cell walls interact with PSNP?
(iii) How do extracellular enzymes interact with AgNP and are these interactions
influenced by the particle coatings?
The effects and uptake of citrate-coated AgNP were examined using E. gracilis as a model
organism, considering the barrier role of the algal cell wall and the lack of typical cell wall in this
algal species. The effects of AgNP were evaluated upon comparison with the effects caused by
Ag+ ions. Thus, experiments were performed with AgNO3 added as silver source, and in
presence of silver ligand to discriminate between the particle specific effects and the effects
caused by the Ag+ ions. To further investigate the uptake of nanoparticles in algae differing in
12
Chapter 1 General introduction
their cell wall composition and structure, four fresh water algal strains were selected, including
E. gracilis, H. pluvialis, and C. reinhardtii wild type and cell wall free mutant. Furthermore,
interactions of nanoparticles with alkaline phosphatase, selected enzyme as a representative
extracellular enzyme secreted by aquatic organisms, were assessed. To evaluate the influence of
particle coating on protein-nanoparticle interactions, AgNP with different coatings were tested.
In Chapter 2, a study on the effects and uptake of citrate-coated AgNP and AgNO3 in E. gracilis
is presented. The algae were exposed to various concentrations of AgNP and AgNO3 in the short
term. Effects on photosynthesis and morphology were assessed, and cellular silver content was
quantified by ICP-MS. Toxicity experiments were also performed with cysteine, which
complexed the silver ions and consequently allowed for discrimination between the effects
caused by AgNP per se and by Ag+. To gather information on whether the AgNP were associated
with cells, the algal cell surfaces following exposure to AgNP and AgNO3 were chemically
analyzed using TOF-SIMS. Results indicated effects on algal photosynthesis and cell
morphology upon exposure to AgNP, yet the effects were attributed to Ag+ ions only. AgNP
were found to be associated with the cells, but particles were localized on the surface rather than
intracellularly. This study has been submitted to Environmental Science: Nano.
In Chapter 3, a study on the interactions of PSNP, of 50 nm and 500 nm in size, with four fresh
water algal strains differing in their surface characteristics, is presented. In this work, cell
response to PSNP exposure, uptake, and association of PSNP were assessed using confocal laser
scanning microscopy. Results were examined in relation to the characteristics of the algae and of
the particles. Considered characteristics included the physicochemical properties of
nanoparticles, algal cell wall composition, structure and thickness, and the response of algae to
particle exposures. Results indicated that no particle internalization occurred in all examined
algal strains, confirming the role of algal cell walls and plasma membranes as a barrier for
nanoparticle uptake in algae, though the pattern of interaction was unique for each algae. The
interactions were found to depend on the particle size, algal surface characteristics, and cell
response to particle exposures, in particular, the excretion of extracellular molecules.
In Chapter 4, a study on the interactions of AgNP with alkaline phosphatase is presented. The
tested AgNP were differently coated: : citrate, polyvinylpyrrolidone and gelatin. The influence
13
Chapter 1 General introduction
of enzymes on particle stability was examined by DLS. Adsorption of alkaline phosphatase to
AgNP was assessed by isolating the enzyme-AgNP complex using sucrose cushion
centrifugation and then the enzyme was released from the particle. Quantification of the
adsorbed enzyme was assessed using electrophoresis. Effects on enzymatic activity were
assessed either following addition of the substrate to AP-AgNP mixture, or, alternatively,
following addition of AgNP to AP-substrate mixture. Results showed that the presence of the
enzyme did not alter the stability of the particles. The binding of alkaline phosphatase to AgNP
depended on the physicochemical properties of the coatings, and the confirmation of the
enzyme. AgNP decreased the enzyme activity in a concentration-dependent manner, but only
when AgNP were added to AP-substrate mixture.
14
Chapter 2 Silver nanoparticle toxicity and association with the alga Euglena gracilis
15
Chapter 2 Silver nanoparticle toxicity and association with the alga Euglena gracilis
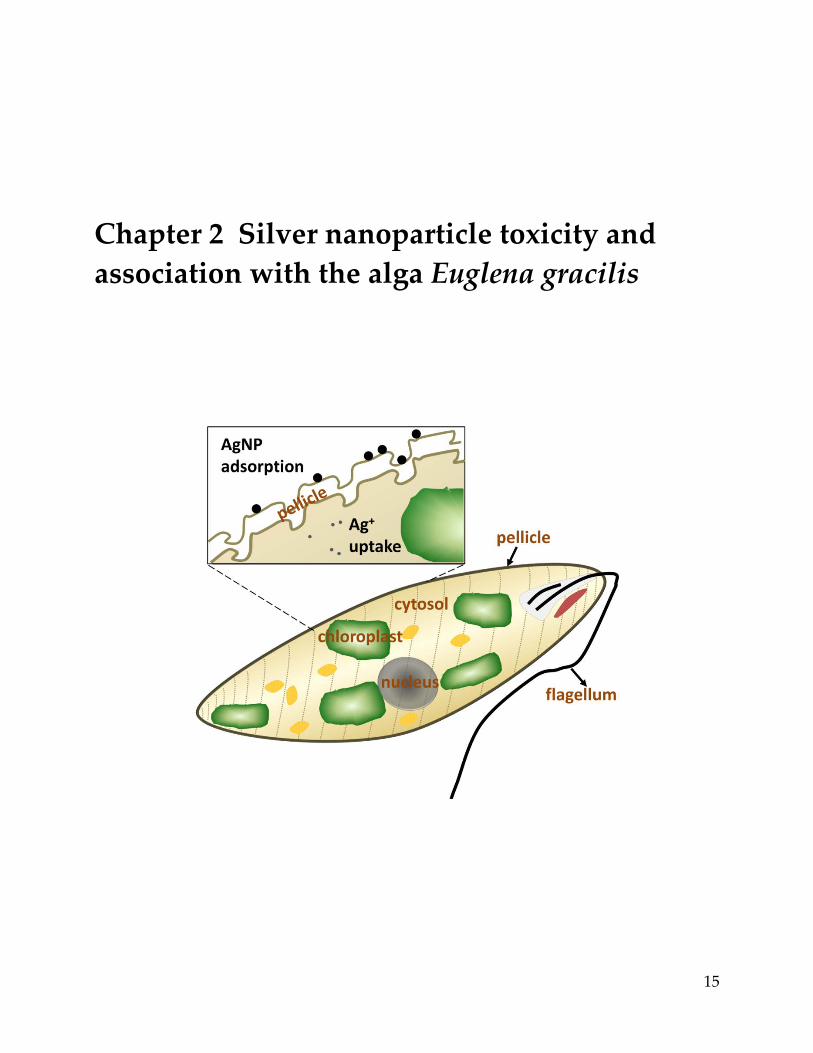
Impact of silver nanoparticles (AgNP) on aquatic algae has largely been studied with model
species that possess a rigid cell wall. Here we explored the interactions of AgNP with Euglena
gracilis, a green alga having no cell wall but a pellicle. The toxicity and silver uptake upon 1-2 h
exposures to various concentrations of AgNO3 and AgNP, having a mean size of 47 nm
measured in the exposure medium, were examined. The photosynthetic yield decreased in a
concentration-dependent manner and AgNP were less toxic than AgNO3 based on total silver
added. Cell morphology was significantly altered by AgNP and AgNO3. Damaging effects of
AgNP on photosynthesis and morphology were completely prevented by cysteine, suggesting
that the toxicity of AgNP was mediated by dissolved Ag. Uptake experiments showed that the
maximal cell-associated silver was higher in AgNP compared to AgNO3 exposures, amounting
to 5.1 × 10⁻⁴ mol Lcell-1 and 1.4 × 10⁻⁴ mol Lcell-1 for AgNP and AgNO3, respectively. The higher level
of silver measured in AgNP exposures was corresponded to sorption of AgNP to the pellicle.
2.1 Introduction
The growing production, use and disposal of silver nanoparticles (AgNP) will eventually lead to
their presence in aquatic environments (Benn and Westerhoff, 2008; Kaegi et al., 2010), with
difficult to predict ecological consequences (Behra et al., 2013; Fabrega et al., 2011a; Navarro et
al., 2008a). In studies with AgNP and algae, inhibition of algal photosynthesis and growth have
been reported (Miao et al., 2010; Miao et al., 2009; Navarro et al., 2008b; Navarro et al., 2015;
Ribeiro et al., 2014). While it is accepted that the dissolved Ag released from AgNP are highly
toxic and contribute to observed AgNP effects, it remains unclear to what extent the AgNP by
themselves contribute to the overall toxicity. For instance, AgNP were shown to inhibit
photosynthesis in the freshwater algae, Chlamydomonas reinhardtii (Navarro et al., 2008b), but
toxicity was completely prevented in the presence of cysteine, a strong silver ligand, thereby
indicating that inhibitory effects of AgNP were caused solely by the dissolved Ag. Likewise,
toxicity of AgNP on growth, photosynthesis, and chlorophyll production in the marine diatom,
Thalassiosira weissflogii, was prevented following addition of the thiols glutathione and cysteine
in the exposure medium (Miao et al., 2009). In another study, inhibitory effects of AgNP on
growth of the freshwater algae, Ochromonas danica, were reduced but not fully prevented in the
16
Chapter 2 Silver nanoparticle toxicity and association with the alga Euglena gracilis
presence of high concentrations of glutathione, suggesting that, besides the dissolved Ag, also
the AgNP directly contributed to toxicity (Miao et al., 2010).
Whether nanoparticle internalization in algae cells is a pre-requisite for toxicity is not yet
understood (Behra et al., 2013). The algae cell is typically surrounded by a cell wall that could
represent a barrier against nanoparticle uptake. The algal cell wall is composed of multiple
layers that are chemically heterogeneous among different algal species. The major cell wall
constituents in algae include cellulose, glycoproteins and polysaccharides, which are linked with
other structural or functional components to form a rigid complex network (Domozych et al.,
2012; Heredia et al., 1993; Knox, 1995). The diatom algae possess a special type of cell wall which
is composed of hydrated silicon dioxide. In general, the algal cell wall is semi-permeable, and
the pore size has been estimated to be a few nanometers (5-20 nm) (Fleischer et al., 1999).
Comparing the size of nanoparticles to the pore size of the algal cell wall, it has been
hypothesized that only nanoparticles with sizes that are smaller than the size of the pores may
cross the cell wall and be internalized in cells via endocytosis (Moore, 2006; Navarro et al.,
2008a). Internalization of AgNP was reported for in the alga O. danica (Miao et al., 2010). This
algal species lacks a cell wall, and has been previously proved to be capable of endocytosis (Cole
and Wynne, 1974). On the other hand, a systematic study with the alga C. reinhardtii did not
evidence particle internalization either in the wild type or in the cell wall free mutant,
suggesting that both the cell wall and the cell membrane constitute a barrier for particle
internalization (Piccapietra et al., 2012a).
In order to address the questions if 1) nanoparticle uptake occurs in algae and 2) to what extent
the nanoparticles contribute to toxicity, we here examine the interactions of citrate-coated AgNP
with the freshwater alga Euglena gracilis. This algae species was selected because it does not
possess a cell wall but a glycoprotein composed pellicle, with longitudinal articulated stripes
aligned on the surface (Leander and Farmer, 2001; Nakano et al., 1987). Together with the
assessment of toxicity upon short-term exposure, silver uptake and accumulation in E. gracilis
was studied.
17
Chapter 2 Silver nanoparticle toxicity and association with the alga Euglena gracilis
2.2 Materials and methods
2.2.1 Materials
Citrate-coated AgNP were provided as an aqueous solution with a concentration of 1 g/L (9.27
mM, pH 6.5) from NanoSys (Wolfhalden, Switzerland). The AgNP stock solution was kept in
the dark to prevent redox reactions, and experimental solutions were freshly prepared in the
exposure medium. A stock solution of 50 mM AgNO3 (Sigma) was prepared in deionized water
(Barnstead Nanopure, Switzerland) and stored in the dark.
All materials for algal growth were autoclaved to prevent biological contamination. To avoid
metal contaminations in silver uptake experiments, polycarbonate and Teflon materials were
washed in acid (0.03 M HNO3), and cellulose filters (0.45 µm, Sartorius) were boiled in acid for 1
h and then dried.
2.2.2 Nanoparticle characterization
The hydrodiameter and ζ-potential of 10-100 µM AgNP in 10 mM 3-morpholine
propanesulfonic acid (MOPS) at pH 7.5 were measured between 15 min to 4 h by dynamic light
scattering (DLS) using a Zetasizer (Nano ZS, Malvern Instruments). UV–vis absorbance of
AgNP was recorded after 1 h exposure in MOPS using a spectrophotometer (UVIKON 930).
Dissolution of AgNP was determined after 2 h exposure in MOPS. The fraction of dissolved Ag
was separated from nanoparticles via ultrafiltration through a 3 kDa filter unit (Millipore
centrifugal concentrators), and via ultracentrifugation (145,000 × g, 3 h, CENTRIKON T-2000).
The filtrate obtained from ultrafiltration and the supernatant (0.5 mL aliquot from the upper
volume) obtained from ultracentrifugation were acidified for analysis of Ag.
2.2.3 Algae culture and exposure medium
The alga E. gracilis strain Z (Culture Collection of Algae, Göttingen, Germany) was cultured in
the synthetic medium Talaquil buffered with 10 mM MOPS at pH 7.5 (Scheidegger et al., 2011),
and supplemented with vitamin B1 and B12 (Shehata and Kempner, 1978). Algae were
maintained at 20°C on a shaker (90 rpm, Infors, Switzerland) under light-dark cycles of 12 h
18
Chapter 2 Silver nanoparticle toxicity and association with the alga Euglena gracilis
each. Cell number and volume were measured using an electronic particle counter (Beckman Z2
Coulter, USA).
To avoid silver complexation, MOPS (10 mM, pH 7.5) was selected as the exposure medium. In
this medium, algae maintain their maximal photosynthetic activity up to 4 h (Supplementary
Information (SI) Figure S 2.1), while all exposures were performed within 2 h in MOPS. Before
exposure to AgNO3 and AgNP, exponentially growing algae were first centrifuged (2000 × g, 10
min) and then resuspended in MOPS. For the toxicity experiment, the final cell density was 1.5 ×
104 cell mL-1, while a higher cell density of 1 × 10⁵ cell mL-1 was used in the uptake experiments
to ensure sufficient amounts of silver for quantification. Additionally, effects of AgNO3 and
AgNP on photosynthesis were also measured at a cell density of 1 × 10⁵ cell mL-1.
2.2.4 Photosynthesis
Toxicity to photosynthesis was assessed under increasing concentrations of AgNO3 (0-400 nM)
and AgNP (0-40 µM). After 1 and 2 h, the photosynthetic yield was measured by fluorometry
using a PHYTO-PAM (Heinz Walz GmbH, Germany). Maximum fluorescence (Fm') was
measured under a short saturating pulse of light, and compared to the fluorescence in the
steady-state (F). Photosynthetic yield was determined according to the equation: photosynthetic
yield = (Fm'-F)/Fm'. Values were represented as percentage of controls, and were plotted as a
function of measured total Ag, dissolved Ag, and also to cell-associated Ag.
To determine the contribution of dissolved Ag to AgNP toxicity, cysteine was used as silver
ligand. AgNP (5 µM) and AgNO3 (100 nM) were first pre-equilibrated with cysteine (1 µM) for
15 min. Then algae were exposed to the AgNP-cysteine or AgNO3-cysteine mixture for 1 h and
photosynthetic yield was measured.
2.2.5 Cell morphology
The morphology of algal cells after 1 h exposure to AgNO3 (100 nM) and AgNP (5 µM) in the
presence and absence of cysteine (1 µM) was examined after fixation in 4% paraformaldehyde
(10 min), using a confocal laser scanning microscope (CLSM, Leica SP5 DMI 6000). Both the
chlorophyll fluorescence and the transmitted light image were obtained at different depths
19
Chapter 2 Silver nanoparticle toxicity and association with the alga Euglena gracilis
along the z-axis. The output image was generated by average intensity projection of the z-axis
image stack (Image J, version 1.44).
2.2.6 Uptake experiments
Algae were exposed to 0-10 µM AgNP and to 0-500 nM AgNO3 at a cell density of 1 × 10⁵ cell
mL-1. After 1 h exposure, algae were washed to remove loosely bound AgNP or adsorbed silver
ions following a protocol established in preliminary experiments (SI Figure S 2.2). Algae
exposed to AgNP were first centrifuged (2000 × g, 10 min) and resuspended in MOPS. After 2
wash cycles, algae were resuspended in cysteine-MOPS, and gently stirred for 5 min. Algae
exposed to AgNO3 were centrifuged and resuspended in cysteine-MOPS, followed by 5 min
stirring. After the wash, algae were filtered (SM 16510, Sartorius) and digested for metal
analysis. The silver which was measured after the wash steps was operationally defined as cell-
associated silver ({Ag}cell). The measured {Ag}cell was either related to cell number and expressed
as mol cell-1, or related to the measured cell volume and expressed as mol Lcell-1. Experiments
were performed in technical triplicates and repeated at least twice.
2.2.7 Metal analysis
For metal determination, filters with algae were transferred into Teflon flasks and digested
in 3 mL of 65% HNO3 and 0.5 mL of 30% H2O2 in a microwave oven (195°C, mls 1200
mega; Microwave Laboratory System, Switzerland). Each sample was then filled to 25
mL with deionized water in a volumetric flask. Total silver mass (1:10 dilution) was
measured by inductively coupled plasma mass spectrometry (ICP-MS, Thermo Finnigan,
Germany) using the isotope 107Ag. To control the reliability of the quantification, water
references (M105A, IFA-Tull, Austria) with a known silver content were measured.
2.2.8 ToF-SIMS analysis
E. gracilis cells were exposed to 250 nM AgNO3, 1 and 5 µM AgNP at a cell density of 1 ×
105 cell mL-1. After 1 h, algae were washed as described above. Then, algae were fixed in
2.5% glutaraldehyde on ice for 10 min, and washed twice with deionized water. After
20
Chapter 2 Silver nanoparticle toxicity and association with the alga Euglena gracilis
centrifugation (2000 × g, 10 min), the algae pellet was soaked in 0.6% ammonium acetate
for 10 sec, deposited on a silicon substrate and dried using nitrogen gas flow.
The ToF-SIMS analysis (ToF-SIMS.5 instrument, ION-TOF GmbH) was performed in both
spectral and imaging mode. Using the spectral mode, 107Ag+ and 109Ag+ were detected with
high mass resolution at masses 106.91 and 108.90, respectively. 25keV Bi1+ primary ions were
used to ensure a high sensitivity to silver, together with electron flooding to compensate for
charge accumulation at the sample surface. Based on an in-depth sputtering with 2keV O2 over
23.4 sec (20 scans), 5.2 sec sputtering was selected as optimal sputtering time for silver detection
(SI Figure S 2.4). Secondary ions of positive polarity were analysed from surface areas of 150 ×
150 µm2, before and after sputtering of 5.2 sec (4 scans). To ensure a reasonable signal over noise
ratio, each measurement accounted for a total of 200 scans, which represents a surface ion dose
of 5.5 × 10¹³ ions/cm2. Additionally, each analysed cell was characterized in imaging mode with
high lateral resolution (~200 nm) to gain insights into its spatial conformation. To ensure the
reliability and reproducibility of measurements, a minimum of five cells of each sample
were randomly selected and analysed.
2.2.9 Data analysis
Concentrations leading to 50% inhibition (EC50s) of photosynthetic yield were
determined by the nonlinear regression sigmoidal dose-response curve fitting using the
Hill slope equation (GraphPad Prism version 4.00, USA), and were presented as mean of
three independent experiments, with 95% confidence interval. Differences in the
concentration-response curves were compared based on the Hill slope and the EC50
values using F-test. Photosynthetic values and cell volume in the cysteine experiment
were analysed by ANOVA followed by Dunnett’s post-test.
2.3 Results
2.3.1 Nanoparticle characterization
The AgNP in the original stock solution (9.27 mM) displayed an average size of 20 ± 0.2
nm and an average ζ- potential of -34 ± 2 mV. When diluted in 10 mM MOPS at pH 7.5,
21
Chapter 2 Silver nanoparticle toxicity and association with the alga Euglena gracilis
AgNP remained stable up to 4 h with an average size between 38 and 73 nm (Figure 2.1
A), and a ζ-potential between -23 and -28 mV for AgNP concentrations between 10 and
100 µM (Figure 2.1 B). The AgNP suspension displayed a maximal UV-vis absorbance at
410-420 nm (Figure 2.1 C). The dissolved silver in AgNP suspensions (10-100 µM) was
0.5-3.5% as determined by ultracentrifugation, and 1.3-2.6% by ultrafiltration, with a
combined mean value of 1.7% (Table 2.1).
2.3.2 Effects on algal photosynthesis
Inhibition of photosynthetic yield increased with increasing concentrations of AgNO3 and
AgNP. After 1 hour exposure, AgNO3 displayed a higher toxicity than AgNP based on
total silver added (Figure 2.2 A). At the highest applied concentration of AgNO3 (400 nM)
and AgNP (40 µM), the photosynthetic yield decreased to 6% and 18%, respectively,
compared to that of control cells. The EC50 values were 85 nM for AgNO3 and 1858 nM for
AgNP (Table 2.2). Extending the exposure time to 2 h yielded similar concentration-
response curves compared to 1 h for both AgNO3 and AgNP, with EC50 values of 89 nM
and 1487 nM, respectively.
By plotting the photosynthetic yield as a function of the mean value of dissolved silver
(1.7% of total Ag), AgNP appeared to be more toxic than AgNO3 (Figure 2.2 B). The
calculated EC50 values were 32 nM after 1 h, and 16 nM after 2 h (Table 2.2). Based on the
whole range of measured dissolved silver (0.5-3.5%), the resulting EC50 values of AgNP
were all significantly lower compared to those of AgNO3 (SI Table S 2.1).
The role of dissolved Ag in AgNP toxicity was examined using the silver ligand cysteine.
The photosynthetic yield was reduced to 30% of control cells after 1 h exposure to 100 nM
AgNO3, and to 8% after exposure to 5 µM AgNP (Figure 2.2 C). In the presence of 5 µM
cysteine, no decrease of photosynthetic yield was detectable, suggesting that the AgNP toxicity
was mediated by dissolved Ag.
22
Chapter 2 Silver nanoparticle toxicity and association with the alga Euglena gracilis
2.3.3 Effects on cell morphology
CLSM examination of algae exposed to 100 nM AgNO3 and 5 µM AgNP revealed morphological
changes. Control cells displayed a spindle-like morphology with an average cell volume of 1532
± 81 fL (Figure 2.3 A). Cells exposed to AgNO3 were less elongated compared to control cells and
the cell volume increased up to 2654 ± 132 fL (Figure 2.3 B). In case of AgNP, cells were
completely round, and the cell volume increased to 2774 ± 172 fL (Figure 2.3 C). In presence of
cysteine, the cell morphology and cell volume of algae exposed to AgNO3 and AgNP were
similar to those of control cells (Figure 2.3 E, F), while cysteine had no effect on morphology or
cell volume (Figure 2.3 D).
2.3.4 Uptake experiments
Cell-associated silver ({Ag}cell) in E. gracilis after 1 h exposure increased with increasing
concentrations of AgNO3. The increase of {Ag}cell per algal cell was linear (R2 = 0.99) over
the AgNO3 concentration range between 25 and 500 nM (Figure 2.4 A). Detailed values of
{Ag}cell are listed in Table S 2.2 (SI). At the highest AgNO3 concentration, the {Ag}cell was
6.2 × 10⁻¹⁶ mole cell-1. When {Ag}cell was related to the measured cell volume, ranging from
1317 to 4260 fL in the case of AgNO3 and from 1797 to 3262 fL in the case of AgNP, silver
uptake was non-linear. A maximal {Ag}cell value of 1.4 × 10⁻⁴ mol Lcell-1 was measured at
500 nM AgNO3. In case of AgNP, {Ag}cell increased with increasing AgNP concentrations
up to 2.5 µM AgNP and remained constant upon further increase of the AgNP
concentration up to 10 µM (Figure 2.4 B). Above 2.5 µM AgNP, maximal values of 1.5 ×
10-15 mol cell-1 and 5.1 × 10⁻⁴ mol Lcell-1 were measured. A comparison of {Ag}cell in the
AgNO3 and AgNP treatments was carried out as a function of dissolved silver (Figure 2.4
C). In the concentration range of 25-200 nM dissolved Ag, {Ag}cell was 5-15 times higher in
AgNP exposed cells.
2.3.5 ToF-SIMS analysis
After 1 h exposure to AgNO3 and AgNP, the surface of E. gracilis was analyzed using ToF-SIMS.
The chemical map of three positive ions, Si+, CxHy+ and Ag+, was resolved in the spectral mode
(Figure 2.5). The signal of the Si+ ion refers to the substrate where the algae were deposited on. 23
Chapter 2 Silver nanoparticle toxicity and association with the alga Euglena gracilis
The fragment ion type CxHy+ is typically representative of organic matter, and was thereby used
to locate the algae cells. The Ag+ ions in the chemical map were resolved from both mass type,
107 and 109, to enhance the overall signals. The silver spectrum of mass 107 is shown in Figure
2.5 (right column), this mass being the most representative silver mass detected. Silver mass 109
behaved similarly yet with lower intensity (data not shown). The overall algae structure was
additionally characterized in the imaging mode with the sum of total ion counts (Figure 2.5, left
column), showing that cells remained intact after sample preparation.
The ToF-SIMS analysis revealed the presence and the distribution of silver at the surface of E.
gracilis cells. A comparison of chemical analysis before and after O2 sputtering is shown in
Figure S 2.5 (SI). Before sputtering, silver was detected over the whole sample surface, including
both the cell area and the surrounding substrate. Quantitative analysis of silver intensity
showed that, before sputtering, the overall silver intensity, Isubtrate + Icell, increased from control
(193), to AgNO3 (382), 1 µM AgNP (491), and to 5 µM AgNP (1045) treatments (Table 2.3). After
the short sputtering, most of the silver from the substrate was removed, while silver from the
cell area remained unaffected (SI Figure S 2.5). This was further confirmed by the quantitative
analysis showing that the sputtering significantly decreased the total silver intensity Isubtrate + Icell
in all samples, whereas silver intensity from the cell area (Icell) was not affected by the sputtering
procedure (Table 2.3). Comparison of Icell after sputtering can be visualized directly from the
silver spectrum (Figure 2.5, right column). In the control (Figure 2.5 A) and the AgNO3 exposed
cells (Figure 2.5 B), silver intensity was found to be very low. For 1 µM (note two cells were
analyzed, Figure 2.5 C) and 5 µM AgNP (Figure 2.5 D), increased silver intensity was detected
with a distinct silver peak representing the silver counts from the cell area. Silver was found
being distributed homogeneously on the cell surface. Icell of 5 µM AgNP exposed cells was more
than 2 times higher compared to that of 1 µM AgNP (Table 2.3). The intensity ratio, Icell' / Isubstrate',
was calculated with respect to the corresponding cell or substrate area (Table 2.3). The ratio
increased from AgNO3 (3.6) to 1 µM AgNP (5.5), and to 5 µM AgNP (18.0).
2.4 Discussion
Since nanoparticles may display different agglomeration behaviour in aqueous solutions (Behra
and Krug, 2008), and size of nanoparticles is expected to influence biological effects, we first
24
Chapter 2 Silver nanoparticle toxicity and association with the alga Euglena gracilis
characterized the AgNP suspensions in the exposure medium used in the experiments.
Assessing the size of the AgNP showed that nanoparticles remained stabilized over 4 h of
exposure with a mean size of 47 nm. The UV-vis spectra, which showed maximal absorbance at
around 410-420 nm, confirmed that the AgNP did not agglomerate during that time. Also the
fraction of dissolved silver after 2 h exposure in the medium varied only slightly for the
different AgNP concentrations, between 0.5 and 3.5% as determined by ultracentrifugation and
between 1.3 and 2.6% as determined by membrane filtration. Similar values of dissolved silver
were previously determined with the AgNP dispersed in MOPS as well as other media
containing inorganic salts and organic substances (Gil-Allue et al., 2015; Piccapietra et al., 2012b;
Yue et al., 2015), indicating that there was little particle dissolution.
Both AgNP and AgNO3 proved to decrease the photosynthetic yield. The inhibition of
photosynthesis was concentration dependent, with EC50 values of 85 nM for AgNO3 and 1858
nM for AgNP after 1 h of exposure. The EC50 values of AgNP determined in our study were
within the range of the EC50s (43-4800 nM) reported for the other algal species (Bondarenko et
al., 2013; Fabrega et al., 2011b). Based on total silver concentrations in the exposure medium,
AgNO3 was more toxic than AgNP, with a 22 times lower EC50 value compared to that of AgNP.
With reference to previous studies showing that the toxicity of AgNP to algae was dependent on
dissolved Ag in the exposure medium (Miao et al., 2009; Navarro et al., 2008b; Navarro et al.,
2015; Ribeiro et al., 2014), we hypothesized that also in E. gracilis the dissolved Ag was a major
contributor of AgNP toxicity. Experiments were carried out in the presence of cysteine, in order
to complex the dissolved Ag and decrease Ag bioavailability. Accordingly, the effects on
photosynthesis were completely prevented, thus supporting our hypothesis that the toxicity of
AgNP was due to dissolved Ag. Recalculation of the photosynthetic yield based on the
measured values of dissolved Ag shifted the AgNP concentration-response curve to lower
effective concentrations than for AgNO3, although the extent of this difference depended on the
chosen percentage of dissolution (SI Table S 2.1). The lower EC50s of AgNP might be explained
by increased AgNP dissolution upon interaction with algal exudates, such as H2O2 (He et al.,
2012; Suarez et al., 2013).
25
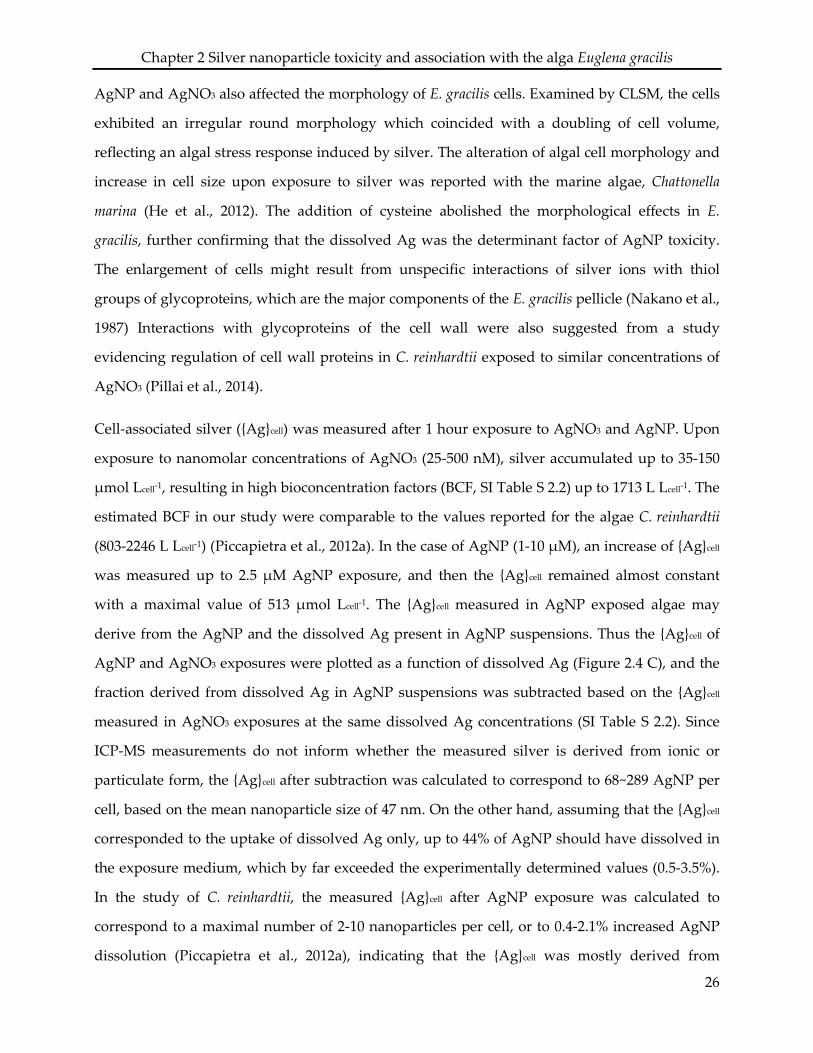
Chapter 2 Silver nanoparticle toxicity and association with the alga Euglena gracilis
AgNP and AgNO3 also affected the morphology of E. gracilis cells. Examined by CLSM, the cells
exhibited an irregular round morphology which coincided with a doubling of cell volume,
reflecting an algal stress response induced by silver. The alteration of algal cell morphology and
increase in cell size upon exposure to silver was reported with the marine algae, Chattonella
marina (He et al., 2012). The addition of cysteine abolished the morphological effects in E.
gracilis, further confirming that the dissolved Ag was the determinant factor of AgNP toxicity.
The enlargement of cells might result from unspecific interactions of silver ions with thiol
groups of glycoproteins, which are the major components of the E. gracilis pellicle (Nakano et al.,
1987) Interactions with glycoproteins of the cell wall were also suggested from a study
evidencing regulation of cell wall proteins in C. reinhardtii exposed to similar concentrations of
AgNO3 (Pillai et al., 2014).
Cell-associated silver ({Ag}cell) was measured after 1 hour exposure to AgNO3 and AgNP. Upon
exposure to nanomolar concentrations of AgNO3 (25-500 nM), silver accumulated up to 35-150
µmol Lcell-1, resulting in high bioconcentration factors (BCF, SI Table S 2.2) up to 1713 L Lcell-1. The
estimated BCF in our study were comparable to the values reported for the algae C. reinhardtii
(803-2246 L Lcell-1) (Piccapietra et al., 2012a). In the case of AgNP (1-10 µM), an increase of {Ag}cell
was measured up to 2.5 µM AgNP exposure, and then the {Ag}cell remained almost constant
with a maximal value of 513 µmol Lcell-1. The {Ag}cell measured in AgNP exposed algae may
derive from the AgNP and the dissolved Ag present in AgNP suspensions. Thus the {Ag}cell of
AgNP and AgNO3 exposures were plotted as a function of dissolved Ag (Figure 2.4 C), and the
fraction derived from dissolved Ag in AgNP suspensions was subtracted based on the {Ag}cell
measured in AgNO3 exposures at the same dissolved Ag concentrations (SI Table S 2.2). Since
ICP-MS measurements do not inform whether the measured silver is derived from ionic or
particulate form, the {Ag}cell after subtraction was calculated to correspond to 68~289 AgNP per
cell, based on the mean nanoparticle size of 47 nm. On the other hand, assuming that the {Ag}cell
corresponded to the uptake of dissolved Ag only, up to 44% of AgNP should have dissolved in
the exposure medium, which by far exceeded the experimentally determined values (0.5-3.5%).
In the study of C. reinhardtii, the measured {Ag}cell after AgNP exposure was calculated to
correspond to a maximal number of 2-10 nanoparticles per cell, or to 0.4-2.1% increased AgNP
dissolution (Piccapietra et al., 2012a), indicating that the {Ag}cell was mostly derived from
26
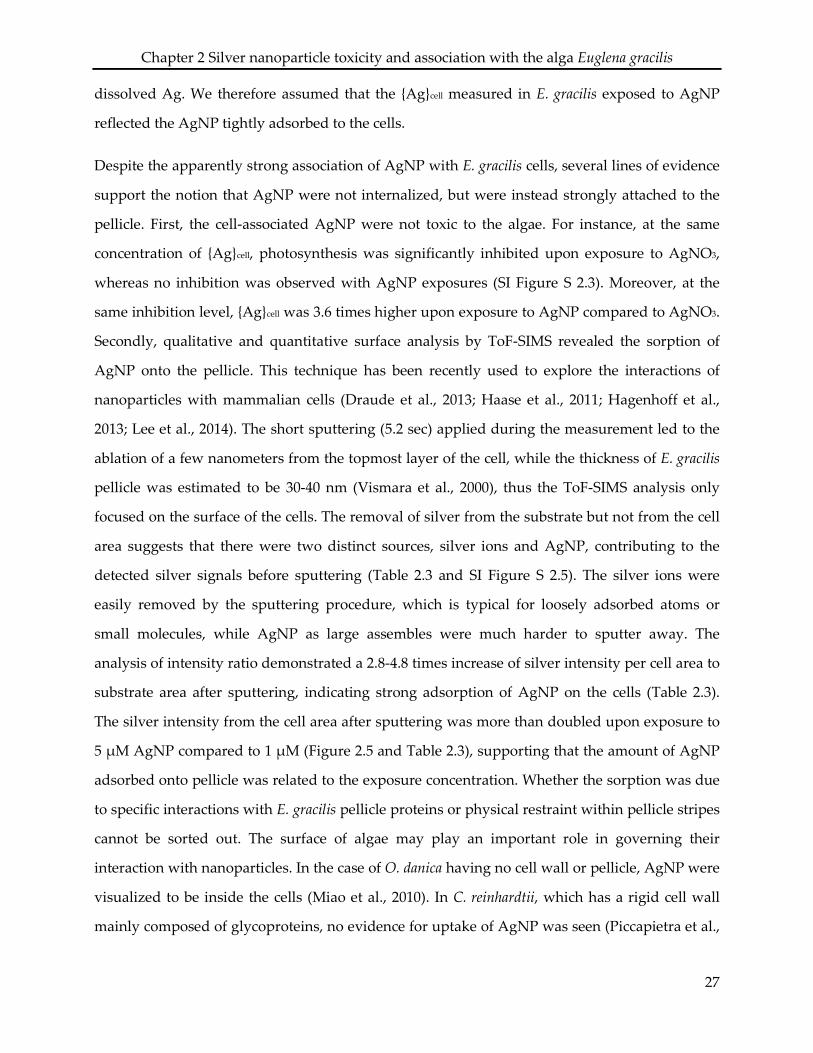
Chapter 2 Silver nanoparticle toxicity and association with the alga Euglena gracilis
dissolved Ag. We therefore assumed that the {Ag}cell measured in E. gracilis exposed to AgNP
reflected the AgNP tightly adsorbed to the cells.
Despite the apparently strong association of AgNP with E. gracilis cells, several lines of evidence
support the notion that AgNP were not internalized, but were instead strongly attached to the
pellicle. First, the cell-associated AgNP were not toxic to the algae. For instance, at the same
concentration of {Ag}cell, photosynthesis was significantly inhibited upon exposure to AgNO3,
whereas no inhibition was observed with AgNP exposures (SI Figure S 2.3). Moreover, at the
same inhibition level, {Ag}cell was 3.6 times higher upon exposure to AgNP compared to AgNO3.
Secondly, qualitative and quantitative surface analysis by ToF-SIMS revealed the sorption of
AgNP onto the pellicle. This technique has been recently used to explore the interactions of
nanoparticles with mammalian cells (Draude et al., 2013; Haase et al., 2011; Hagenhoff et al.,
2013; Lee et al., 2014). The short sputtering (5.2 sec) applied during the measurement led to the
ablation of a few nanometers from the topmost layer of the cell, while the thickness of E. gracilis
pellicle was estimated to be 30-40 nm (Vismara et al., 2000), thus the ToF-SIMS analysis only
focused on the surface of the cells. The removal of silver from the substrate but not from the cell
area suggests that there were two distinct sources, silver ions and AgNP, contributing to the
detected silver signals before sputtering (Table 2.3 and SI Figure S 2.5). The silver ions were
easily removed by the sputtering procedure, which is typical for loosely adsorbed atoms or
small molecules, while AgNP as large assembles were much harder to sputter away. The
analysis of intensity ratio demonstrated a 2.8-4.8 times increase of silver intensity per cell area to
substrate area after sputtering, indicating strong adsorption of AgNP on the cells (Table 2.3).
The silver intensity from the cell area after sputtering was more than doubled upon exposure to
5 µM AgNP compared to 1 µM (Figure 2.5 and Table 2.3), supporting that the amount of AgNP
adsorbed onto pellicle was related to the exposure concentration. Whether the sorption was due
to specific interactions with E. gracilis pellicle proteins or physical restraint within pellicle stripes
cannot be sorted out. The surface of algae may play an important role in governing their
interaction with nanoparticles. In the case of O. danica having no cell wall or pellicle, AgNP were
visualized to be inside the cells (Miao et al., 2010). In C. reinhardtii, which has a rigid cell wall
mainly composed of glycoproteins, no evidence for uptake of AgNP was seen (Piccapietra et al.,
27
Chapter 2 Silver nanoparticle toxicity and association with the alga Euglena gracilis
2012a). Our results therefore highlight the importance of taking the large diversity in cell wall
composition and surface architecture among different algal species into account.
Contributions:
I prepared the analytical samples for ICP-MS and the measurement was performed by David
Kistler in our department. ToF-SIMS analysis was conducted in collaboration with Laetitia
Bernard (EMPA, Dübendorf). I worked on the sample preparation and participated in the
measurement and data analysis.
28
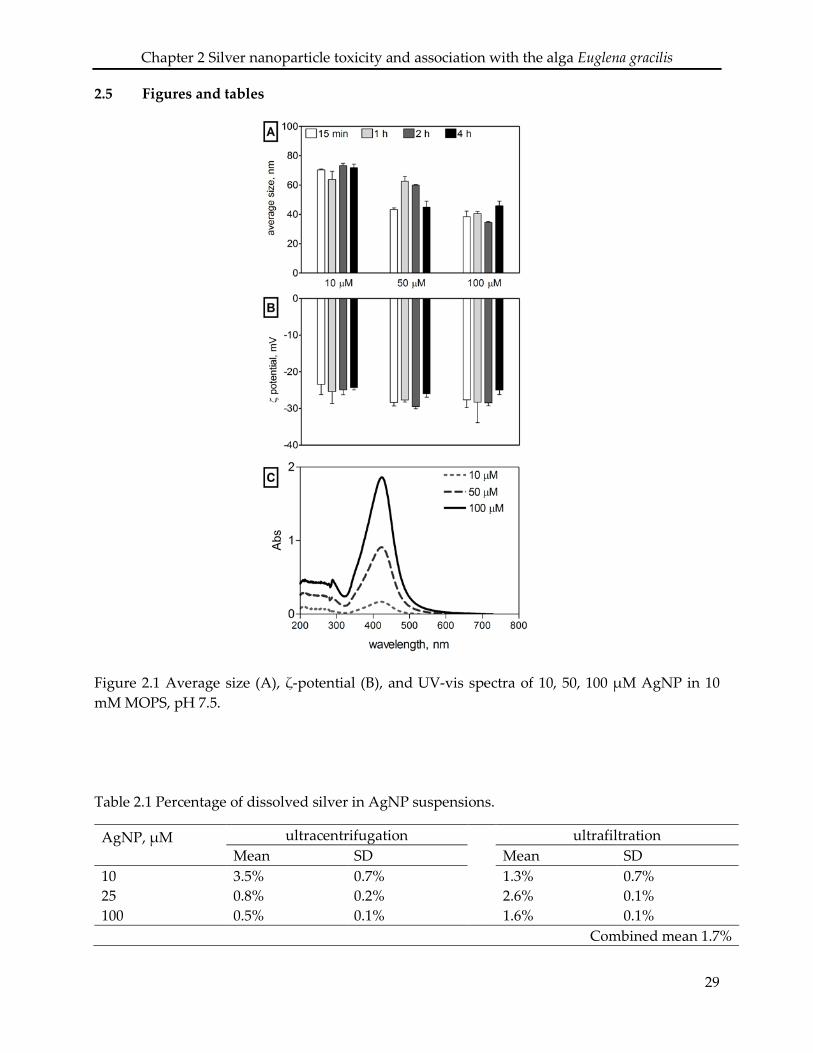
Chapter 2 Silver nanoparticle toxicity and association with the alga Euglena gracilis
2.5 Figures and tables
Figure 2.1 Average size (A), ζ-potential (B), and UV-vis spectra of 10, 50, 100 µM AgNP in 10 mM MOPS, pH 7.5.
Table 2.1 Percentage of dissolved silver in AgNP suspensions.
AgNP, µM ultracentrifugation
ultrafiltration Mean SD
Mean SD
10 3.5% 0.7%
1.3% 0.7% 25 0.8% 0.2%
2.6% 0.1%
100 0.5% 0.1%
1.6% 0.1% Combined mean 1.7%
29
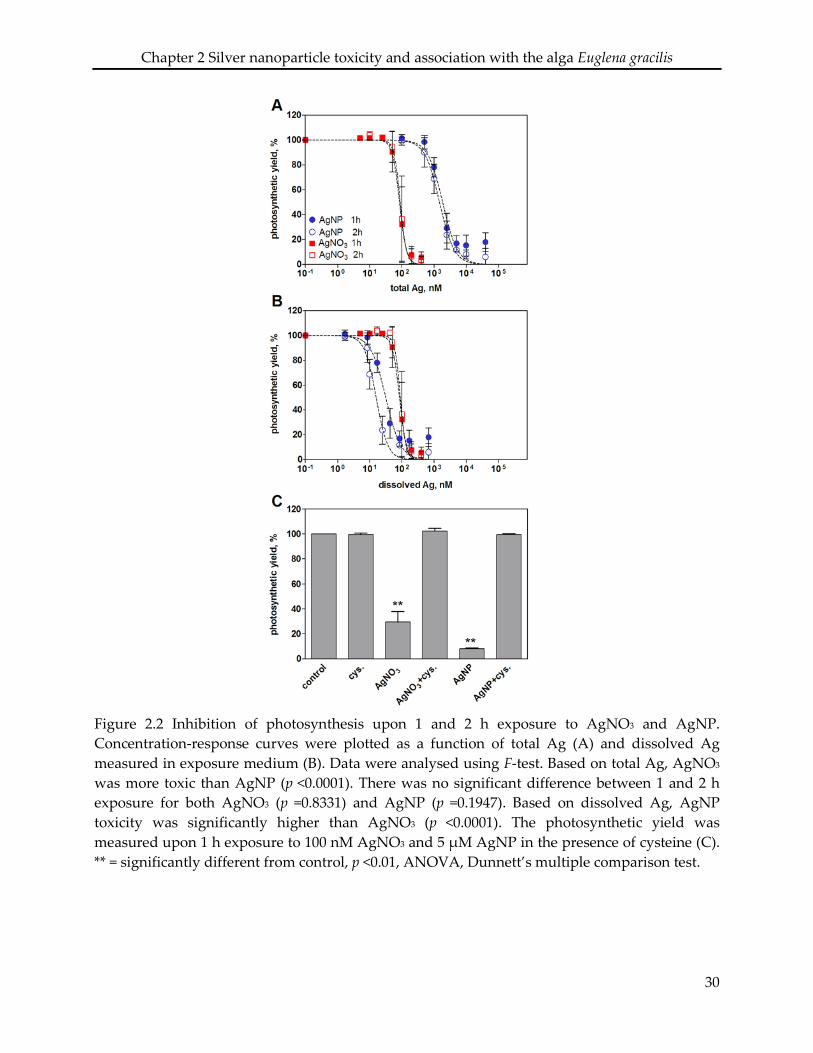
Chapter 2 Silver nanoparticle toxicity and association with the alga Euglena gracilis
Figure 2.2 Inhibition of photosynthesis upon 1 and 2 h exposure to AgNO3 and AgNP. Concentration-response curves were plotted as a function of total Ag (A) and dissolved Ag measured in exposure medium (B). Data were analysed using F-test. Based on total Ag, AgNO3 was more toxic than AgNP (p <0.0001). There was no significant difference between 1 and 2 h exposure for both AgNO3 (p =0.8331) and AgNP (p =0.1947). Based on dissolved Ag, AgNP toxicity was significantly higher than AgNO3 (p <0.0001). The photosynthetic yield was measured upon 1 h exposure to 100 nM AgNO3 and 5 µM AgNP in the presence of cysteine (C). ** = significantly different from control, p <0.01, ANOVA, Dunnett’s multiple comparison test.
30
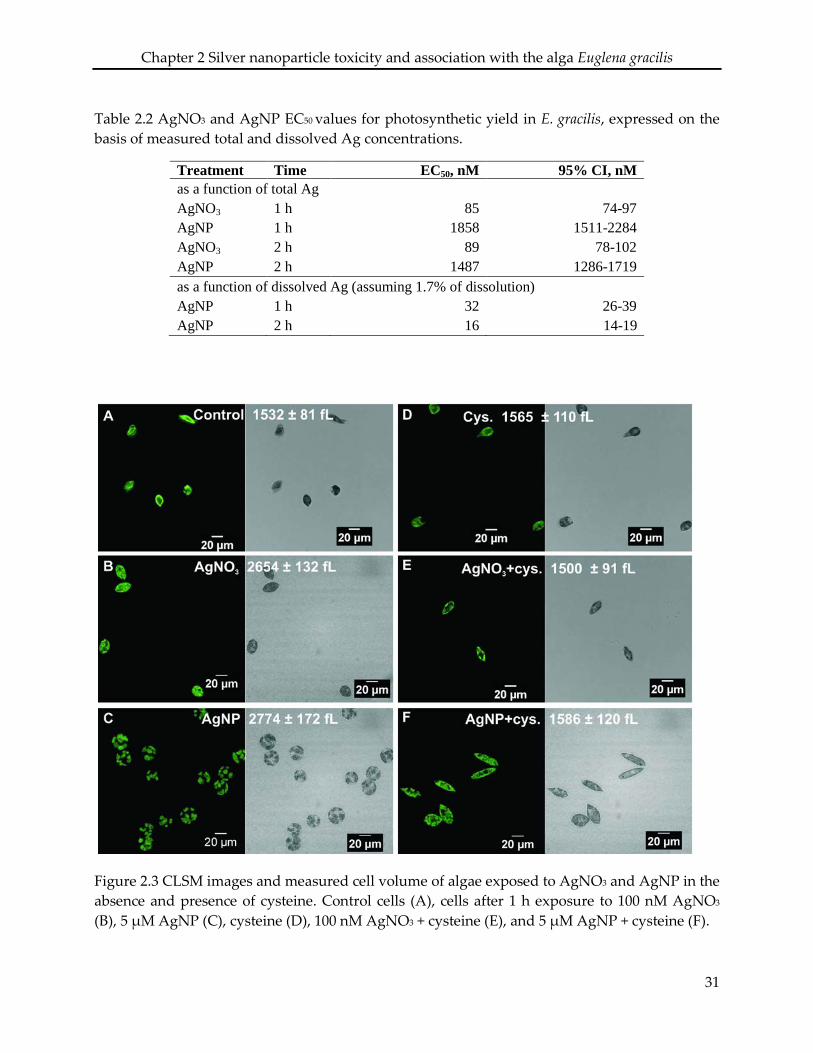
Chapter 2 Silver nanoparticle toxicity and association with the alga Euglena gracilis
Table 2.2 AgNO3 and AgNP EC50 values for photosynthetic yield in E. gracilis, expressed on the basis of measured total and dissolved Ag concentrations.
Treatment Time EC50, nM 95% CI, nM as a function of total Ag AgNO3 1 h 85 74-97 AgNP 1 h 1858 1511-2284 AgNO3 2 h 89 78-102 AgNP 2 h 1487 1286-1719 as a function of dissolved Ag (assuming 1.7% of dissolution) AgNP 1 h 32 26-39 AgNP 2 h 16 14-19
Figure 2.3 CLSM images and measured cell volume of algae exposed to AgNO3 and AgNP in the absence and presence of cysteine. Control cells (A), cells after 1 h exposure to 100 nM AgNO3 (B), 5 µM AgNP (C), cysteine (D), 100 nM AgNO3 + cysteine (E), and 5 µM AgNP + cysteine (F).
31

Chapter 2 Silver nanoparticle toxicity and association with the alga Euglena gracilis
Figure 2.4 Cell-associated silver ({Ag}cell) measured in E. gracilis after 1 h exposure to various concentrations of AgNO3 (A) and AgNP (B) expressed as mol Lcell-1 (left y-axis) and mol cell-1 (right y-axis), and comparison of {Ag}cell between AgNO3 and AgNP exposures based on dissolved silver (C).
32
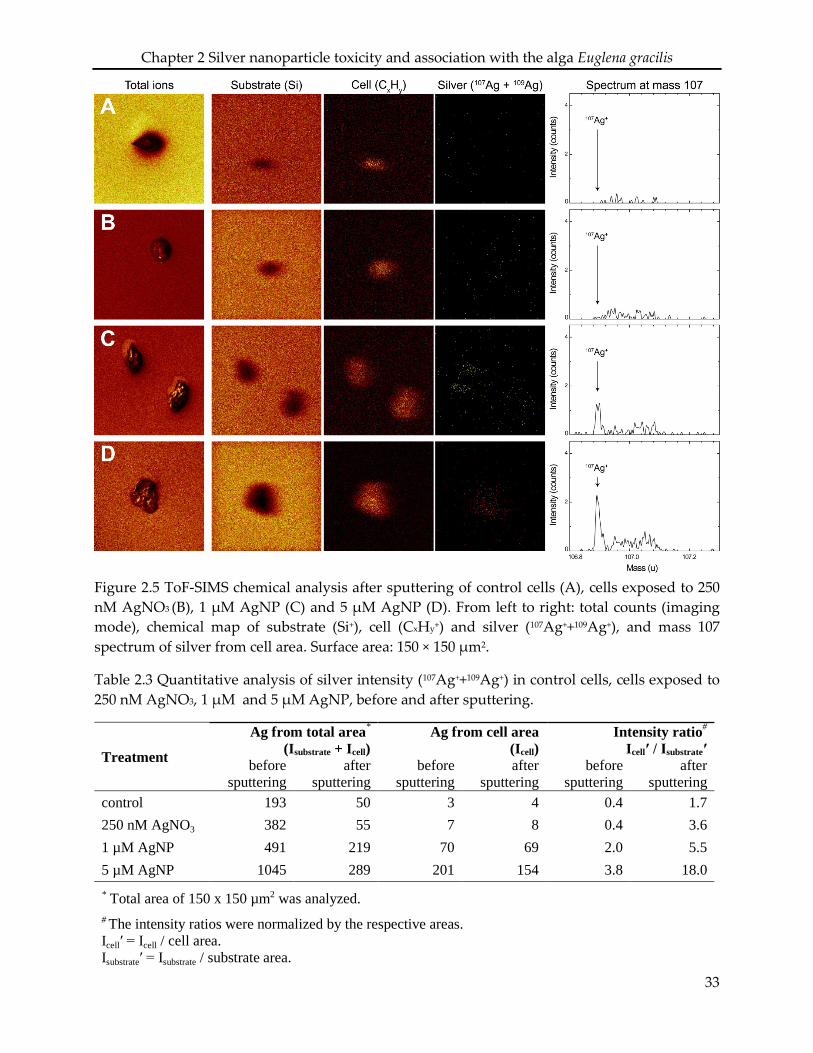
Chapter 2 Silver nanoparticle toxicity and association with the alga Euglena gracilis
Figure 2.5 ToF-SIMS chemical analysis after sputtering of control cells (A), cells exposed to 250 nM AgNO3 (B), 1 µM AgNP (C) and 5 µM AgNP (D). From left to right: total counts (imaging mode), chemical map of substrate (Si+), cell (CxHy+) and silver (107Ag++109Ag+), and mass 107 spectrum of silver from cell area. Surface area: 150 × 150 µm2.
Table 2.3 Quantitative analysis of silver intensity (107Ag++109Ag+) in control cells, cells exposed to 250 nM AgNO3, 1 µM and 5 µM AgNP, before and after sputtering.
Treatment
Ag from total area* (Isubstrate + Icell)
Ag from cell area (Icell)
Intensity ratio# Icellʹ / Isubstrateʹ
before sputtering
after sputtering
before sputtering
after sputtering
before sputtering
after sputtering
control 193 50 3 4 0.4 1.7 250 nM AgNO3 382 55 7 8 0.4 3.6 1 µM AgNP 491 219 70 69 2.0 5.5 5 µM AgNP 1045 289 201 154 3.8 18.0 * Total area of 150 x 150 µm2 was analyzed. # The intensity ratios were normalized by the respective areas. Icellʹ = Icell / cell area. Isubstrateʹ = Isubstrate / substrate area.
33
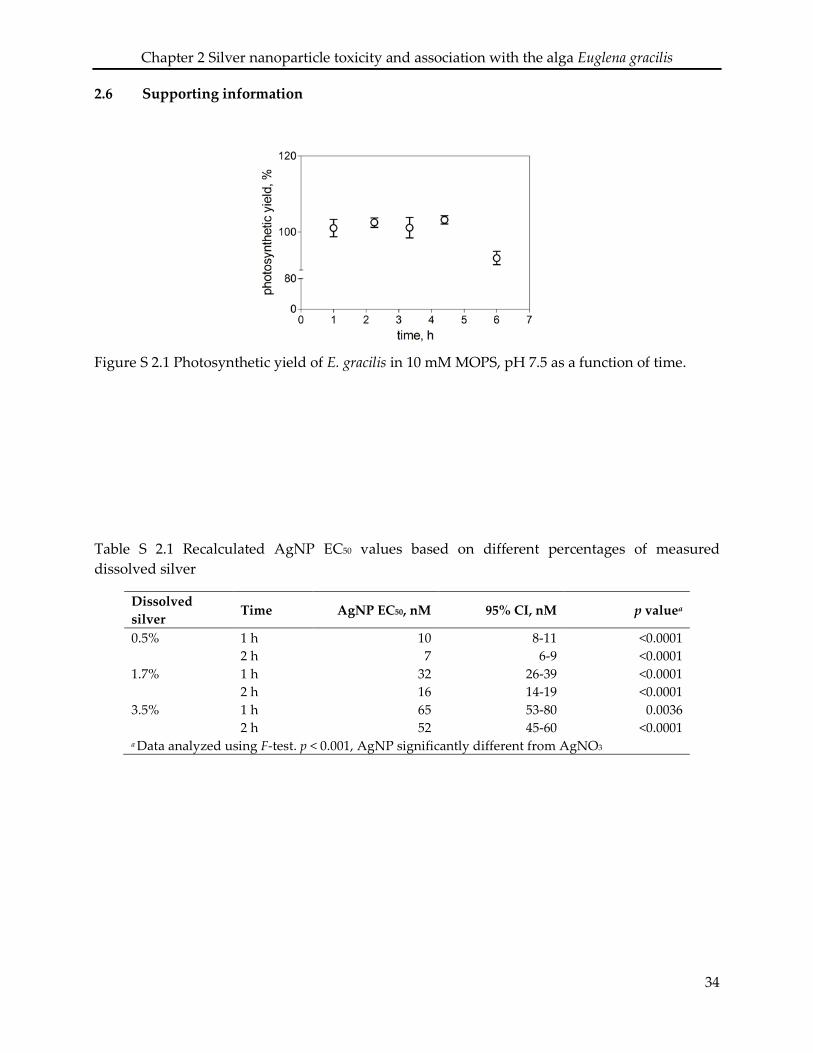
Chapter 2 Silver nanoparticle toxicity and association with the alga Euglena gracilis
2.6 Supporting information
Figure S 2.1 Photosynthetic yield of E. gracilis in 10 mM MOPS, pH 7.5 as a function of time.
Table S 2.1 Recalculated AgNP EC50 values based on different percentages of measured dissolved silver
Dissolved silver
Time AgNP EC50, nM 95% CI, nM p valuea
0.5% 1 h 10 8-11 <0.0001 2 h 7 6-9 <0.0001 1.7% 1 h 32 26-39 <0.0001 2 h 16 14-19 <0.0001 3.5% 1 h 65 53-80 0.0036 2 h 52 45-60 <0.0001 a Data analyzed using F-test. p < 0.001, AgNP significantly different from AgNO3
34
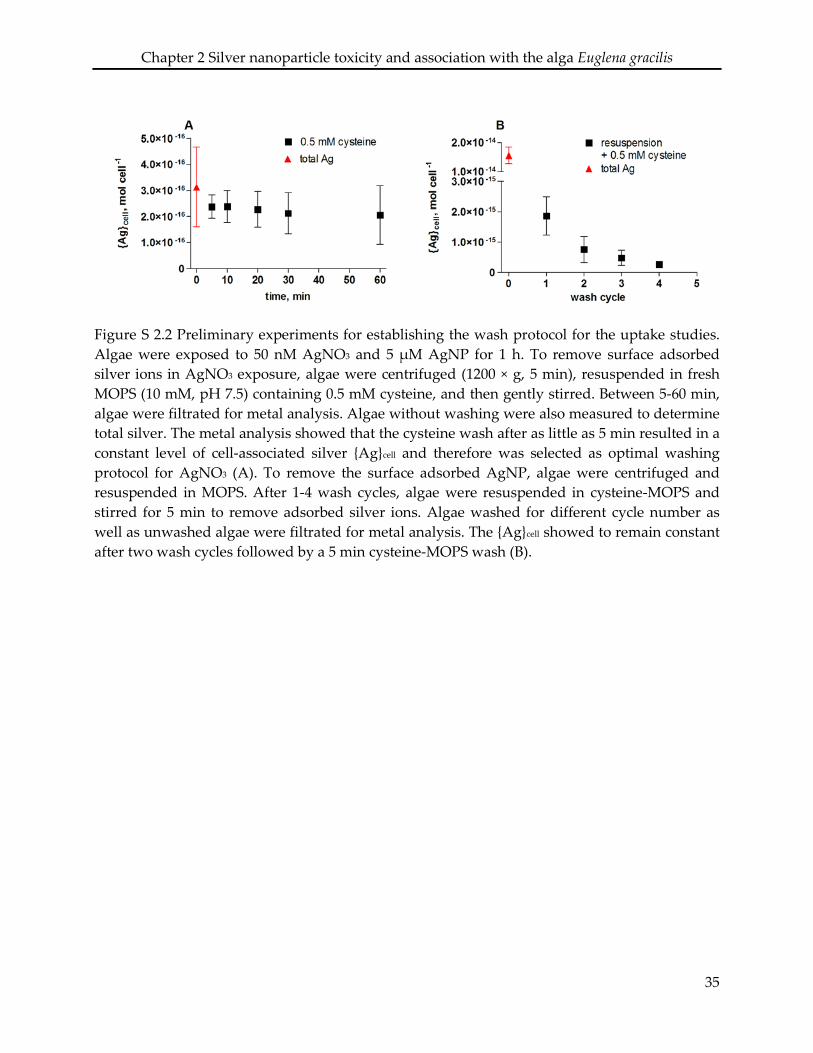
Chapter 2 Silver nanoparticle toxicity and association with the alga Euglena gracilis
Figure S 2.2 Preliminary experiments for establishing the wash protocol for the uptake studies. Algae were exposed to 50 nM AgNO3 and 5 µM AgNP for 1 h. To remove surface adsorbed silver ions in AgNO3 exposure, algae were centrifuged (1200 × g, 5 min), resuspended in fresh MOPS (10 mM, pH 7.5) containing 0.5 mM cysteine, and then gently stirred. Between 5-60 min, algae were filtrated for metal analysis. Algae without washing were also measured to determine total silver. The metal analysis showed that the cysteine wash after as little as 5 min resulted in a constant level of cell-associated silver {Ag}cell and therefore was selected as optimal washing protocol for AgNO3 (A). To remove the surface adsorbed AgNP, algae were centrifuged and resuspended in MOPS. After 1-4 wash cycles, algae were resuspended in cysteine-MOPS and stirred for 5 min to remove adsorbed silver ions. Algae washed for different cycle number as well as unwashed algae were filtrated for metal analysis. The {Ag}cell showed to remain constant after two wash cycles followed by a 5 min cysteine-MOPS wash (B).
35
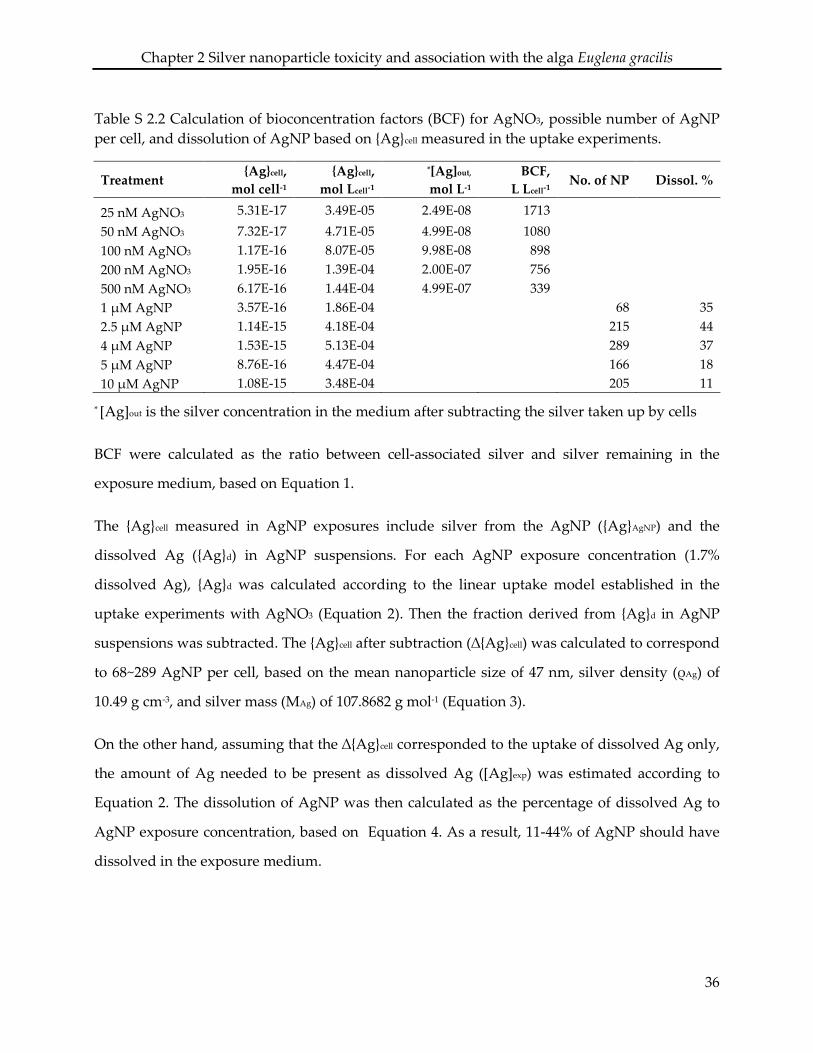
Chapter 2 Silver nanoparticle toxicity and association with the alga Euglena gracilis
Table S 2.2 Calculation of bioconcentration factors (BCF) for AgNO3, possible number of AgNP per cell, and dissolution of AgNP based on {Ag}cell measured in the uptake experiments.
Treatment {Ag}cell,
mol cell-1 {Ag}cell,
mol Lcell-1 *[Ag]out,
mol L-1 BCF,
L Lcell-1 No. of NP Dissol. %
25 nM AgNO3 5.31E-17 3.49E-05 2.49E-08 1713 50 nM AgNO3 7.32E-17 4.71E-05 4.99E-08 1080 100 nM AgNO3 1.17E-16 8.07E-05 9.98E-08 898 200 nM AgNO3 1.95E-16 1.39E-04 2.00E-07 756 500 nM AgNO3 6.17E-16 1.44E-04 4.99E-07 339 1 µM AgNP 3.57E-16 1.86E-04 68 35 2.5 µM AgNP 1.14E-15 4.18E-04 215 44 4 µM AgNP 1.53E-15 5.13E-04 289 37 5 µM AgNP 8.76E-16 4.47E-04 166 18 10 µM AgNP 1.08E-15 3.48E-04 205 11
* [Ag]out is the silver concentration in the medium after subtracting the silver taken up by cells
BCF were calculated as the ratio between cell-associated silver and silver remaining in the
exposure medium, based on Equation 1.
The {Ag}cell measured in AgNP exposures include silver from the AgNP ({Ag}AgNP) and the
dissolved Ag ({Ag}d) in AgNP suspensions. For each AgNP exposure concentration (1.7%
dissolved Ag), {Ag}d was calculated according to the linear uptake model established in the
uptake experiments with AgNO3 (Equation 2). Then the fraction derived from {Ag}d in AgNP
suspensions was subtracted. The {Ag}cell after subtraction (∆{Ag}cell) was calculated to correspond
to 68~289 AgNP per cell, based on the mean nanoparticle size of 47 nm, silver density (ρAg) of
10.49 g cm-3, and silver mass (MAg) of 107.8682 g mol-1 (Equation 3).
On the other hand, assuming that the ∆{Ag}cell corresponded to the uptake of dissolved Ag only,
the amount of Ag needed to be present as dissolved Ag ([Ag]exp) was estimated according to
Equation 2. The dissolution of AgNP was then calculated as the percentage of dissolved Ag to
AgNP exposure concentration, based on Equation 4. As a result, 11-44% of AgNP should have
dissolved in the exposure medium.
36
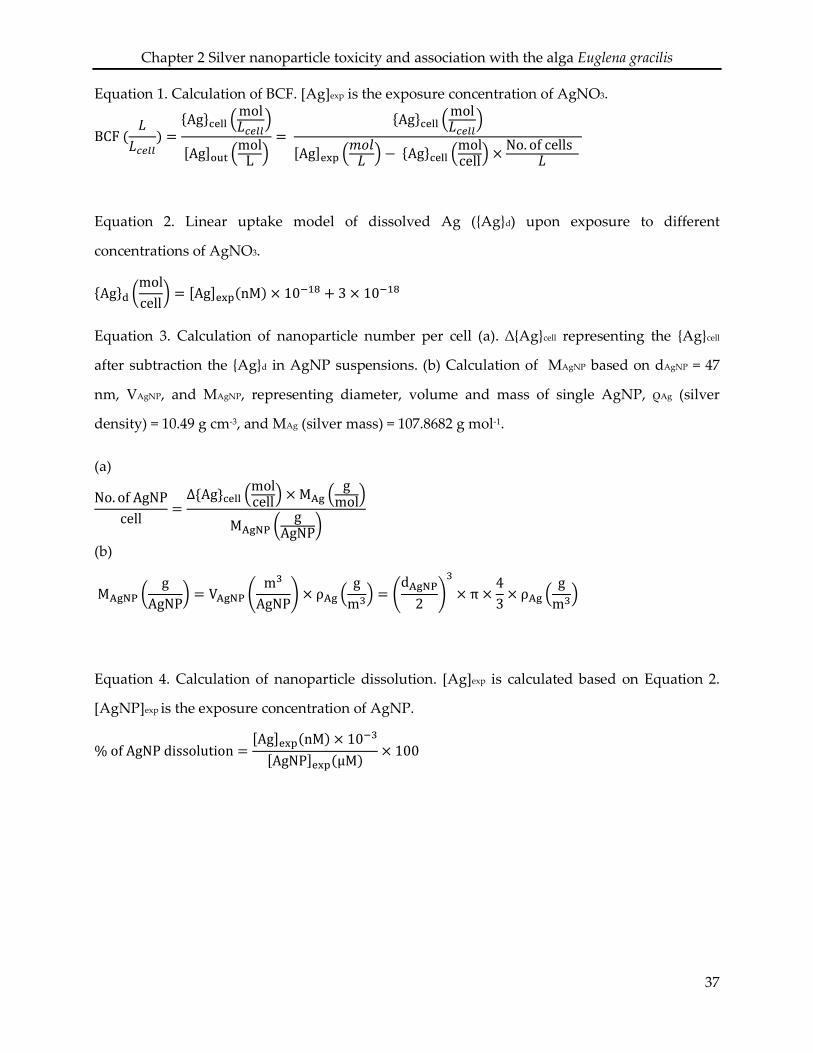
Chapter 2 Silver nanoparticle toxicity and association with the alga Euglena gracilis
Equation 1. Calculation of BCF. [Ag]exp is the exposure concentration of AgNO3.
BCF (𝐿𝐿
𝐿𝐿𝑐𝑐𝑐𝑐𝑐𝑐𝑐𝑐) =
{Ag}cell �mol𝐿𝐿𝑐𝑐𝑐𝑐𝑐𝑐𝑐𝑐
�
[Ag]out �mol
L �=
{Ag}cell �mol𝐿𝐿𝑐𝑐𝑐𝑐𝑐𝑐𝑐𝑐
�
[Ag]exp �𝑚𝑚𝑚𝑚𝑚𝑚𝐿𝐿 � − {Ag}cell �
molcell� × No. of cells
𝐿𝐿
Equation 2. Linear uptake model of dissolved Ag ({Ag}d) upon exposure to different
concentrations of AgNO3.
{Ag}d �molcell
� = [Ag]exp(nM) × 10−18 + 3 × 10⁻¹⁸
Equation 3. Calculation of nanoparticle number per cell (a). ∆{Ag}cell representing the {Ag}cell
after subtraction the {Ag}d in AgNP suspensions. (b) Calculation of MAgNP based on dAgNP = 47
nm, VAgNP, and MAgNP, representing diameter, volume and mass of single AgNP, ρAg (silver
density) = 10.49 g cm-3, and MAg (silver mass) = 107.8682 g mol-1.
(a)
No. of AgNPcell
=∆{Ag}cell �
molcell� × MAg �
gmol�
MAgNP �g
AgNP�
(b)
MAgNP �g
AgNP� = VAgNP �
m3
AgNP�× ρAg �
gm3� = �
dAgNP2 �
3
× π ×43
× ρAg �g
m3�
Equation 4. Calculation of nanoparticle dissolution. [Ag]exp is calculated based on Equation 2.
[AgNP]exp is the exposure concentration of AgNP.
% of AgNP dissolution =[Ag]exp(nM) × 10−3
[AgNP]exp(µM) × 100
37
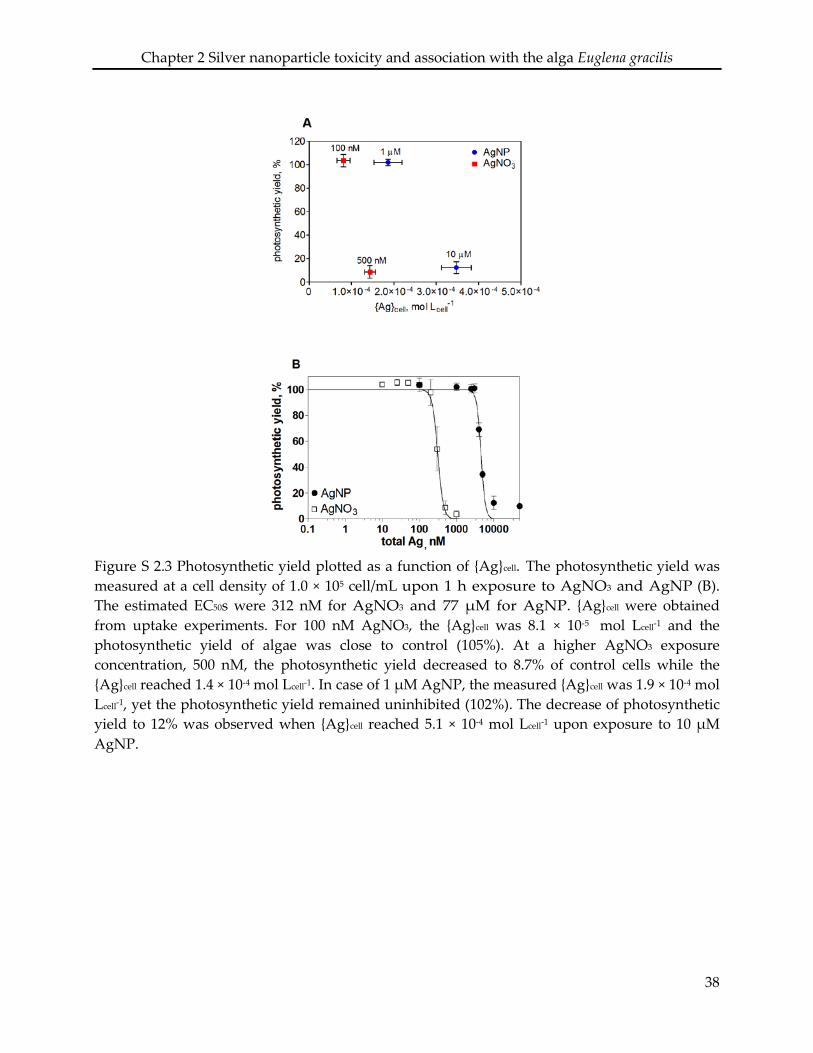
Chapter 2 Silver nanoparticle toxicity and association with the alga Euglena gracilis
Figure S 2.3 Photosynthetic yield plotted as a function of {Ag}cell. The photosynthetic yield was measured at a cell density of 1.0 × 10⁵ cell/mL upon 1 h exposure to AgNO3 and AgNP (B). The estimated EC50s were 312 nM for AgNO3 and 77 µM for AgNP. {Ag}cell were obtained from uptake experiments. For 100 nM AgNO3, the {Ag}cell was 8.1 × 10⁻⁵ mol Lcell-1 and the photosynthetic yield of algae was close to control (105%). At a higher AgNO3 exposure concentration, 500 nM, the photosynthetic yield decreased to 8.7% of control cells while the {Ag}cell reached 1.4 × 10⁻⁴ mol Lcell-1. In case of 1 µM AgNP, the measured {Ag}cell was 1.9 × 10⁻⁴ mol Lcell-1, yet the photosynthetic yield remained uninhibited (102%). The decrease of photosynthetic yield to 12% was observed when {Ag}cell reached 5.1 × 10⁻⁴ mol Lcell-1 upon exposure to 10 µM AgNP.
38
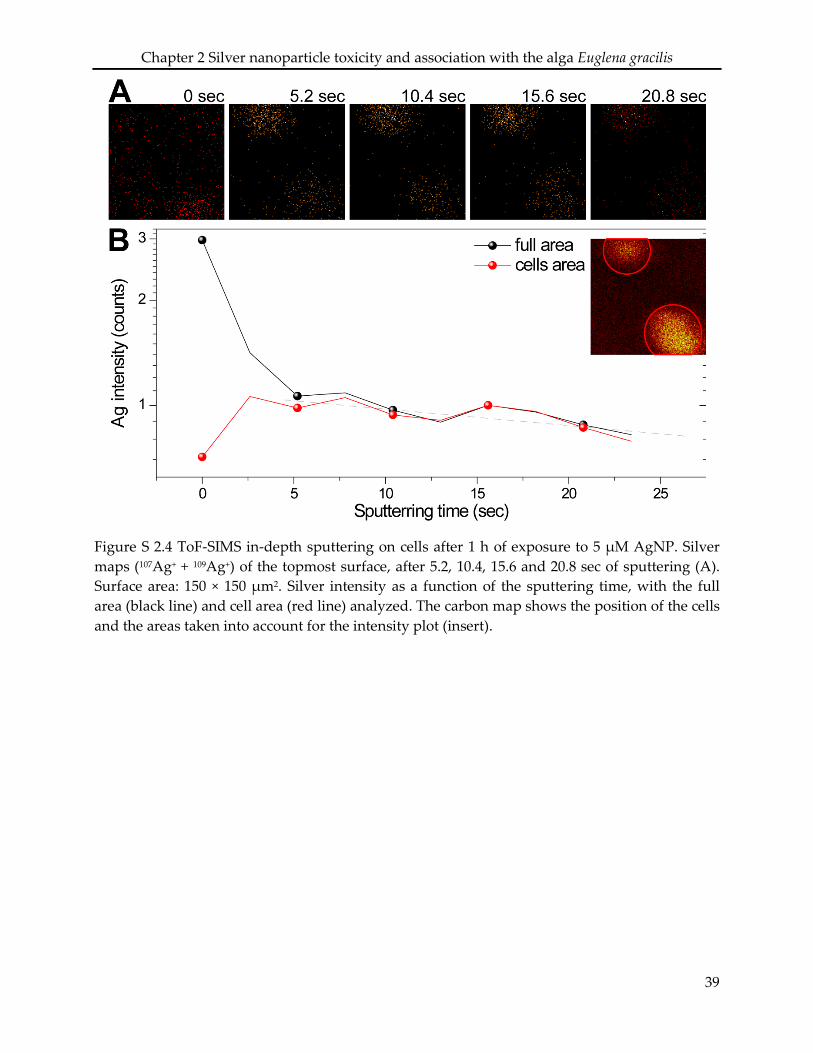
Chapter 2 Silver nanoparticle toxicity and association with the alga Euglena gracilis
Figure S 2.4 ToF-SIMS in-depth sputtering on cells after 1 h of exposure to 5 µM AgNP. Silver maps (107Ag+ + 109Ag+) of the topmost surface, after 5.2, 10.4, 15.6 and 20.8 sec of sputtering (A). Surface area: 150 × 150 µm2. Silver intensity as a function of the sputtering time, with the full area (black line) and cell area (red line) analyzed. The carbon map shows the position of the cells and the areas taken into account for the intensity plot (insert).
39
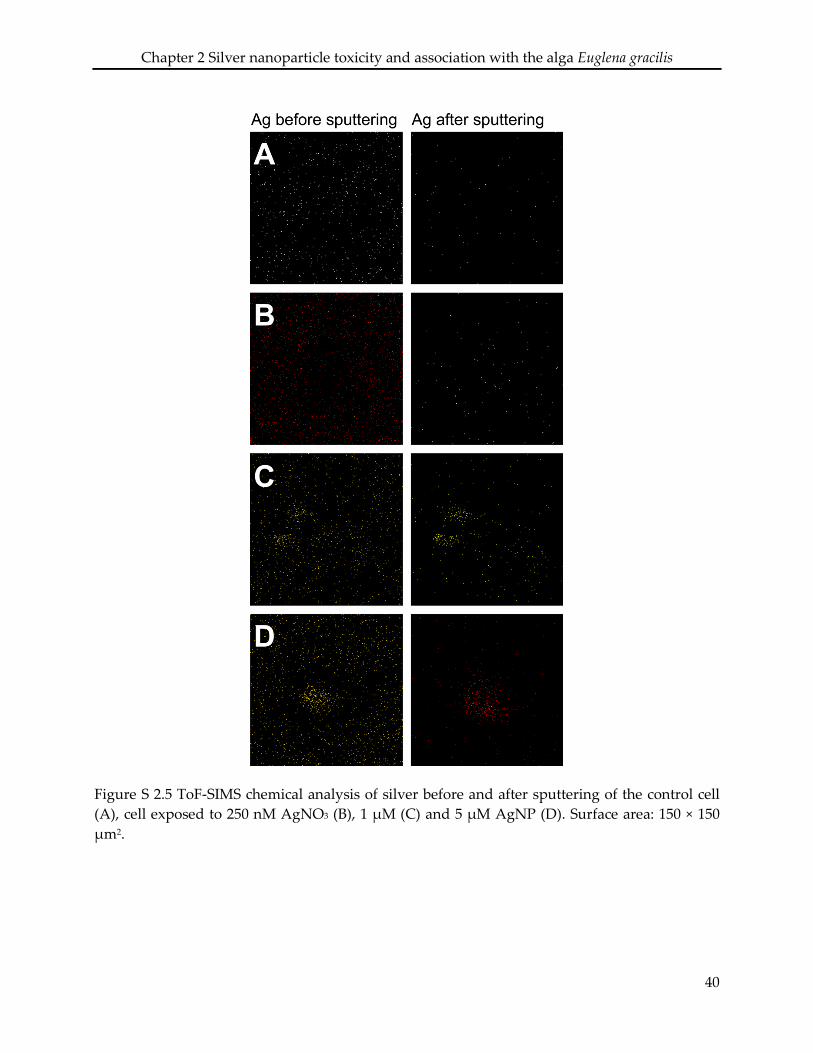
Chapter 2 Silver nanoparticle toxicity and association with the alga Euglena gracilis
Figure S 2.5 ToF-SIMS chemical analysis of silver before and after sputtering of the control cell (A), cell exposed to 250 nM AgNO3 (B), 1 µM (C) and 5 µM AgNP (D). Surface area: 150 × 150 µm2.
40
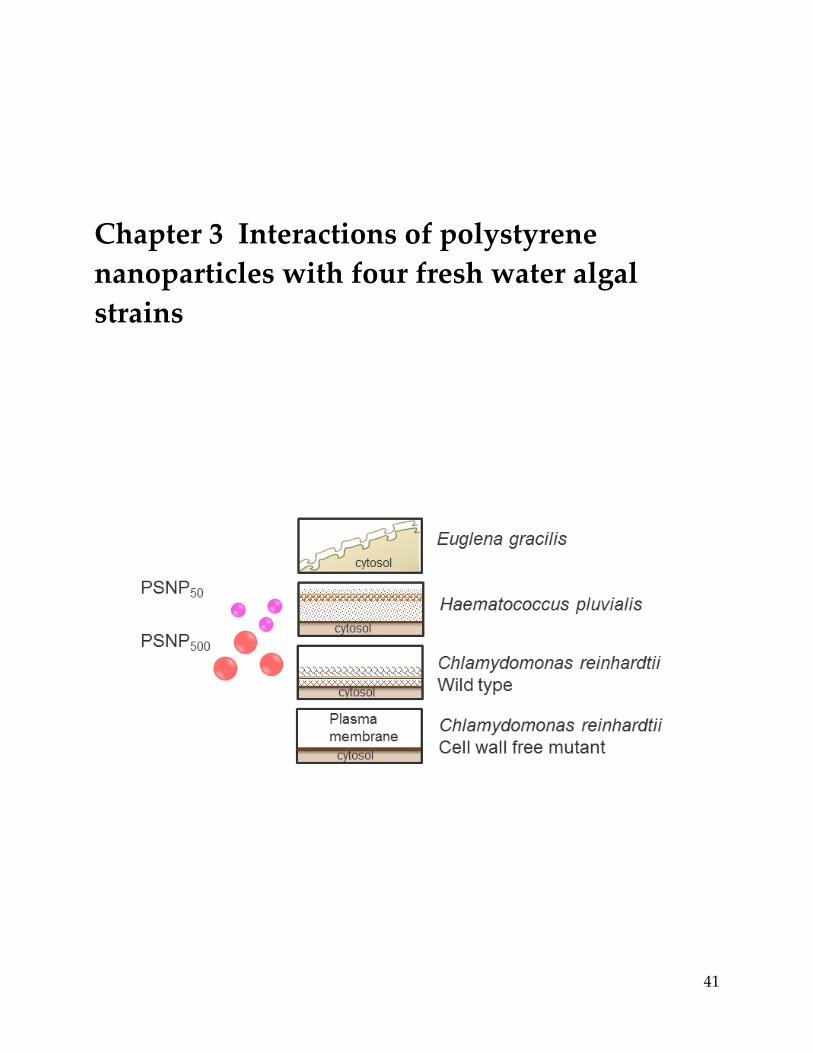
Chapter 3 Interactions of polystyrene nanoparticles with four fresh water algal strains
41
Chapter 3 Interactions of polystyrene nanoparticles with four fresh water algal strains
While effects of nanoparticles have been demonstrated with various algae species, no studies
have proved that the effects are related to cellular internalization of the particles. Algal cells are
surrounded by a cell wall which represents a primary site to interact with the nanoparticles. To
examine whether algal cell walls influence the particle interactions with algae, four strains
specifically Euglena gracilis, Haematococcus pluvialis, and Chlamydomonas reinhardtii wild type and
a cell wall free mutant, were selected. Their interactions with fluorescent polystyrene
nanoparticles (PSNP) of two sizes, 50 nm (PSNP50) and 500 nm (PSNP500) were investigated
using confocal laser scanning microscopy. No strain internalized PSNP. Interactions of PSNP
with algae were found to be unique for each strain, and depend on both the particle size and the
characteristics of the algal cells, in particular their surface architecture and potential to secrete
biomolecules.
3.1 Introduction
Owing to their extremely small dimensions and unique physicochemical properties,
nanoparticles have been increasingly produced and used in widespread applications in the last
decade. The massive usage of nanoparticles makes them likely to be present in the aquatic
environment (Gottschalk et al., 2009; Lorenz et al., 2012; Mitrano et al., 2014; Sun et al., 2014a),
and eventually become a concern to the aquatic organisms that are potentially exposed to such
pollutants. Algae, as primary producers at the base of aquatic food chains, have been examined
for their sensitivity to various types of nanoparticles (Bondarenko et al., 2013; Fabrega et al.,
2011a; Kahru and Dubourguier, 2010). While most of the toxicity studies have reported the
inhibitory effects of nanoparticles on algal growth (Aruoja et al., 2009; Cardinale et al., 2012;
Fabrega et al., 2011a; Franklin et al., 2007; Lee and An, 2013; Van Hoecke et al., 2008; Van Hoecke
et al., 2009), others have examined the sensitivity of photosynthesis to nanoparticles (Dewez and
Oukarroum, 2012; Navarro et al., 2008b; Navarro et al., 2015; Röhder, 2014). The effective
concentrations reported in these studies range from µg/L to mg/L (Bondarenko et al., 2013),
though it is not generally known whether measured effects result from particle internalization
into algae cells. In case of metal-based nanoparticles with high solubility, toxicity has rather
been related to the uptake of metal ions released from particles than to direct particle effects
(Aruoja et al., 2009; Franklin et al., 2007; He et al., 2012; Navarro et al., 2008b; Navarro et al.,
42
Chapter 3 Interactions of polystyrene nanoparticles with four fresh water algal strains
2015). For less soluble nanoparticles, toxicity has been attributed to indirect effects like shading
of algae by aggregated particles (Bhattacharya et al., 2010; Handy et al., 2012; Hartmann et al.,
2013; Hartmann et al., 2010). However, no studies available so far have proved the occurrence of
particle specific effects on algae as a result of cellular internalization of particles.
For nanoparticles to enter algal cells, they must first cross the cell wall in order to reach the cell
membrane, where they might be internalized via endocytotic pathways or by passive diffusion
(Behra et al., 2013; Navarro et al., 2008a). Algal cell walls are fairly rigid structures that serve to
maintain cell shape and to protect the cell membrane from mechanical stress. The biochemical
composition of algal cell walls differs across algal species (Popper et al., 2014; Sorensen et al.,
2010; Sorensen et al., 2011). Its main components include cellulose, glycoproteins, and
polysaccharides (Domozych et al., 2012), each possessing a variety of functional groups such as
carboxylic, phosphate and sulfhydryl groups. The structural organization and thickness of algal
cell walls are also diverse and species specific (Domozych et al., 2012). The algal cell wall is
freely permeable to low molecular weight molecules, but little information is available on its
pore size. One can assume that the crossing of nanoparticles through the algal cell wall is limited
to those particles having sizes that are smaller than the size exclusion of the pore.
Information on nanoparticle uptake in algae is so far limited to a few studies. Silver
nanoparticles (AgNP) were visualized by transmission electron microscopy (TEM) inside a cell
wall deficient alga Ochromonas danica (Miao et al., 2010). On the other hand, studies with the
green alga Chlamydomonas reinhardtii did not evidence any uptake of AgNP nor of cerium
dioxide nanoparticles (CeO2NP) by Inductively Coupled Plasma Mass Spectrometry
measurements (Piccapietra et al., 2012a; Röhder, 2014). Similarly, no uptake of AgNP was
evidenced in the fresh water algae Euglena gracilis, though particles were found to be sorbed to
the surface of the algal cells based on Time-of-Flight Secondary Ion Mass Spectrometry
measurements (Chapter 2).
In this study, we investigated the interactions of nanoparticles with fresh water algae differing
in their cell surface characteristics (Supporting information (SI) Figure S 3.1). The selected
unicellular strains were Euglena gracilis, Haemotococcus pluvialis, and the wild type and a cell wall
free mutant of Chlamydomonas reinhardtii. E. gracilis cells do not possess a typical cell wall but a
43
Chapter 3 Interactions of polystyrene nanoparticles with four fresh water algal strains
thin glycoprotein-based pellicle of ~40 nm in thickness (Leforttran et al., 1980; Nakano et al.,
1987), which allows the cells to flexibly alter their morphology during movement. The pellicle is
unique in its architecture, displaying regular stripes connected via longitudinal cavities (Vismara
et al., 2000) (SI Figure S 3.1 A). In the case of H. pluvialis, following dynamic regulation through
the whole cell-cycle, the composition, thickness and structure of the cell wall is variable, with
remarkable increase of the thickness from 35 nm up to 2.2 µm (Hagen et al., 2002; Wang et al.,
2004). Characteristically, cell walls of H. pluvialis are covered by a multilayered gelatinous
extracellular matrix containing carbohydrates and proteins, which is also localized between the
cell wall and the plasma membrane (Hagen et al., 2002) (SI Figure S 3.1 B). The cell wall of C.
reinhardtii is about 100 nm thick and is mainly composed of glycoproteins, which are linked to
multiple crystalline layers (Monk et al., 1983) (SI Figure S 3.1 C). To assess whether the plasma
membrane is a barrier for nanoparticle uptake, a cell wall free mutant of C. reinhardtii, with the
membrane as the outer surface (SI Figure S 3.1 D), was also included in this study. The
interactions of nanoparticles with the algal strains were investigated upon exposure of the algae
to fluorescently labeled polystyrene nanoparticles (PSNP) of 50 and 500 nm size, and examined
using confocal laser scanning microscopy (CLSM).
3.2 Materials and methods
3.2.1 PSNP and characterization in exposure media
Fluorescent PSNP50 (mean primary size 50 nm, size range 40-60 nm) and PSNP500 (mean primary
size 500 nm, size range 400-600 nm) were purchased from Corpuscular Inc. (Microspheres-
Nanospheres, USA). The particles were provided in deionized water at a concentration of 10
mg/mL. The fluorophores of the PSNP50 and PSNP500 have excitation/emission wavelengths at
465/ 480 nm and 565/580 nm, respectively. Both PSNP were negatively charged, given by the
fluorophore residues. The nanoparticle stock solutions were kept in dark at 4 °C.
PSNP were characterized in the different algal media used in the exposure experiments. The
PSNP50 and PSNP500 stock solutions were diluted in Talaquil, organic medium, and 10 mM 3-
morpholine propanesulfonic acid (MOPS) at pH 7.5, used as simple buffer control, to a final
concentration of 0.01 mg/mL. Average size and Zeta potential of particles were measured 2
44
Chapter 3 Interactions of polystyrene nanoparticles with four fresh water algal strains
hours after dilution by dynamic light scattering (DLS) using a Zeta Sizer (Nano ZS, Malvern
Instruments). For the settings, the material was set to polystyrene latex with refraction index
1.59 and absorption 0.01; the dispersant was set to water; and the automatic settings were used
for other parameters, including measurement duration, attenuation and optimum measurement
position. For Zeta potential, automatic attenuation and voltage, a minimum of 10 runs and a
maximum of 30 runs, and a Smolvchowski model were set. Three measurement replicates were
performed for each sample. A mean size with standard deviation, and a polydispersity index
(PDI) were calculated per sample based on cumulant analysis algorithm.
3.2.2 Algae culture
The stock culture of the alga E. gracilis strain Z (SAG 1224-5/25), and H. pluvialis (SAG 34-1n)
were obtained from the Institute of Plant Physiology at the University of Göettingen (Germany).
The wild type of the freshwater algae C. reinhardtii, strain CC-125, and the cell wall free mutant,
strain CC-400, were obtained from the Chlamydomonas Genetics Centre (Durham, USA).
All algae strains were grown in glass Erlenmeyer flask under controlled conditions. E. gracilis
and H. pluvialis were maintained at 20 °C (90 rpm, 40 µE m-2 s-1) using a High Technology Infors
shaker (Infors, Bottmingen, Switzerland) under 12-hour light-dark cycles. Both C. reinhardtii
strains were cultured at 25 °C in the shaker under continuous light (90 rpm, 120 µE m-2 s-1).
Algae were cultured in different types of synthetic media established to fulfill their nutrient
requirements. E. gracilis were grown in an inorganic Talaquil medium buffered with 10 mM
MOPS at pH 7.5 (composition listed in SI Table S3.1), and supplemented with Vitamin B1 (3.32 ×
10-7 M) and B12 (3.69 × 10⁻¹² M). H. pluvialis were grown in either Talaquil or an organic medium
containing tryptone (0.2%), yeast extract (2%) and CaCl2 (5 × 10⁻⁴ M) buffered with 10 mM MOPS
at pH 7.5. Both strains of C. reinhardtii were grown in Talaquil. All culture media were
autoclaved before use.
3.2.3 Exposure experiments
For all experiments, exponentially growing algae were centrifuged and resuspended in fresh
culture media. Due to different sensitivities to mechanical stress among the strains, different
45
Chapter 3 Interactions of polystyrene nanoparticles with four fresh water algal strains
centrifugation protocols were applied for pelleting the algae cells (10 min, 2000 rpm for E.
gracilis; 5 min, 1000 rpm for H. pluvialis; 10 min, 3000 rpm for C. reinhardtii wild type; 10 min,
1500 rpm for C. reinhardtii mutant). E. gracilis and H. pluvialis, at a cell density of 1 × 10⁵ cell/mL,
and both strains of C. reinhardtii, at a cell density of 1 × 10⁶ cell/mL, were exposed to 1 mg/mL
PSNP50 or PSNP500 in their culture media. Exposure was performed under shaking and dark
conditions to prevent fluorescence bleaching of the PSNP. After 2 hours, algae were chemically
fixed with 2% glutaraldehyde for 10 min. Fixed algae were transferred to a glass slide, covered
with coverslip and directly examined using confocal laser scanning microscopy (CLSM).
3.2.4 CLSM
Examination of nanoparticle interaction with the algae was performed by CLSM using a Leica
SP5 DMI 6000 microscope (Germany). Images were recorded using the software LAS AF v2.7.9
and a 63× oil immersion lens with a numerical aperture of 1.4. For all samples, sequential mode
was applied to distinguish between the fluorescent signals given by the PSNP and the algal
chlorophyll. The PSNP50 fluorescence was excited using a 476 nm laser light and detected at 500-
550 nm in the photomultiplier tube (PMT). The chlorophyll was excited with a 488 nm laser and
detected at the PMT in the range of 650-750 nm. For PSNP500, the laser light of 514 nm was
exploited and the fluorescence was detected at 570-633 nm PMT. Transmission images of the
cells were recorded under bright field illumination. All images were acquired at 200 Hz
scanning speed, averaged from two frame recording and output in 1024 × 1024 pixel format. The
autofluorescence of the algal cells was checked by imaging non-nanoparticle-exposed cells
under the same settings described above. For several samples, a xyz scan was performed to
record multiple optical planes of the cells. The z-depth (10-15 µm) was adjusted to allow for a
complete z-stack imaging of the entire cell from top to down views. The step size (typically
around 0.2 µm) was kept as default settings that was optimized by the software.
3.2.5 Image analysis
All image analysis was performed with the software Image J version 1.44. The fluorescent
images are presented as an overlay of the PSNP and the chlorophyll fluorescence. Based on z-
46
Chapter 3 Interactions of polystyrene nanoparticles with four fresh water algal strains
stack images, three-dimensional (3D) analysis was performed and displayed as xz projections or
3D volume viewer. The xyz coordinates of the 3D visualization were indicated on the images.
3.3 Results
3.3.1 Characterization of PSNP in culture media
Two hours after dilution in 10 mM MOPS at pH 7.5, PSNP50 at 0.01 mg/mL displayed an average
diameter of 73.8 nm as measured by DLS (Table 3.1). The measured diameter of the particles
was comparable to the diameter indicated by the supplier (40-60 nm). When diluted at the same
concentration in the two media used for exposure experiments, Talaquil and organic medium,
PSNP50 showed a similar average diameter of 84.7 and 72.6 nm, respectively. The size
distribution of all particle suspensions was between 20 and 120 nm (SI Figure S 3.2 A, B).
Meausurements of Zeta potential displayed sligtly less negative charges in Talaquil and organic
medium compared to MOPS.
Two hours after dilution in MOPS, PSNP500 at 0.01 mg/mL showed an average diameter of 467.4
nm (Table 3.1), which is comparable to the size stated by the supplier (400-600 nm). When
dispersed in the exposure medium Talaquil, a similar average size of 443.9 nm was measured.
Analysis of the PSNP500 at the same concentration in the organic medium showed an increase in
particle size to 524.4 nm. The size distributation was in the range between 200 to 1000 nm (SI
Figure S 3.2 C, D). The Zeta potential became less negative when the particles were dispersed in
Talaquil and the organic medium compared to MOPS.
3.3.2 Interaction of PSNP with Euglena gracilis
E. gracilis cells in the absence of nanoparticles exhibit an elongated shape, with flagella located
on the anterior end of the cells (SI Figure S 3.3). As revealed by CLSM, exposure to PSNP50 led to
morphological changes of the cells that displayed a less elongated and rounder shape compared
to control cells (Figure 3.1 A, B). In most of the cells, flagella were disassociated from the cell
bodies.
As shown in the CLSM micrographs, fluorescence of PSNP50 was observed to be in close
association with the cells (Figure 3.1 A, B). In order to get detailed information about the
47
Chapter 3 Interactions of polystyrene nanoparticles with four fresh water algal strains
localization and distribution of the particles, sequential z-stack imaging was applied to an
individual E. gracilis cell. The 3D analysis of the z-stack images displayed as xz projections
(Figure 3.1 C1-C5) or volume viewing (Figure 3.1 E), showed PSNP50 to adsorb and aggregate on
the pellicle, in a non-homogeneous manner. No particles were detected to be localized in an
intracellular compartment during the entire sequential z-stack imaging and 3D analysis.
Upon exposure to the PSNP500, the morphology of E. gracilis cells was elongated and comparable
to control cells (Figure 3.1 F, G). Particles appeared to be dispersed in the exposure medium and
were not detectable in association with the pellicle.
3.3.3 Interaction of PSNP with Haematococcus pluvialis
The morphology of H. pluvialis cells was comparable in both the inorganic (Talaquil) and organic
media, displaying a typical spherical or ellipsoidal shape with two equal-length flagella
emerging from the anterior end of the cells (SI Figure S 3.4). Exposure to PSNP50 or PSNP500 did
not induce morphological changes in H. pluvialis in either media (Figure 3.2 and Figure 3.3).
The CLSM micrographs revealed that PSNP50 were associated with the H. pluvialis cells cultured
in Talaquil (Figure 3.2 A,B). The localization and distribution of the particles were further
investigated by 3D analysis based on sequential z-stack imaging. As shown in the xz projections
and volume viewing, PSNP50 were homogenously distributed over the entire cell surface (Figure
3.2 C1-C5, E). Large aggregates were observed to occur at the root region of flagella. For all the
analyzed images, no particle internalization was evident. In case of PSNP500 exposures, no direct
contact was observed between the nanoparticles and the cells (Figure 3.2 F, G).
The interactions of PSNP with H. pluvialis cultured in organic medium were similar to those
observed for H. pluvialis cultured in Talaquil (Figure 3.3). PSNP50 were clearly associated with
the cells (Figure 3.3 A, B). Again, homogeneous distribution of PSNP50 on algal cell surface was
shown in the xyz projection and 3D volume viewing (Figure 3.3 C1-C5, E). Also, large aggregates
of PSNP50 were found to attach to the root region of the algal flagella. No intracellular particles
were detected throughout the sequential z-stack imaging. PSNP500 were dispersed in the
medium and not associated with the cells (Figure 3.3 F, G).
48
Chapter 3 Interactions of polystyrene nanoparticles with four fresh water algal strains
3.3. Interaction of PSNP with Chlamydomonas reinhardtii
The C. reinhardtii wild type cells are spherical shaped and possess two flagella (SI Figure S 3.5 A,
B). The morphology of cells from the wild type strain was not altered after 2 hour exposure to
PSNP50 or PSNP500 (Figure 3.4). As shown in the transmission CLSM images (Figure 3.4 B), the
algae exposed to PSNP50 excreted extracellular polymeric substances (EPS) to the periphery of
the cells and to the medium. Cells clumped together and were packed with the EPS (Figure 3.4
B). PSNP50 appeared to be associated with the EPS (Figure 3.4 A, B). In the presence of PSNP500,
cells secreted less EPS and did not clump together (Figure 3.4 C, D). In this case, PSNP500 were
associated only with the algal flagella.
Similar to the wild type, the wall free mutant strain of C. reinhardtii cell also has a spherical
shape, but do not possess flagella (SI Figure S 3.5 C, D). The morphology of the mutant was not
altered in the presence of PSNP50 nor PSNP500 (Figure 3.5). As shown in the transmission images,
exposure to PSNP50 led to excretion of EPS and clumping of the cells (Figure 3.5 B). The secreted
EPS was not released to the medium but remained associated with the cell membrane (Figure
3.5 B). PSNP50 were associated with the EPS (Figure 3.5 A, B). Cells exposed to PSNP500 also
secreted EPS though the cells did not clump to larger aggregates (Figure 3.5 C, D). The particles
were found to be primarily associated with the EPS.
3.4 Discussion
In this study, we aimed to examine how PSNP interact with fresh water algae and, in particular,
whether particles are taken up by the algae. Therefore, we exploited the distinct characteristics
of four algal strains belonging to three species to aid a systematic investigation of the role of
algal surface characteristics on resulting interactions with the nanoparticles. Using fluorescent-
labeled PSNP and detection by confocal microscopy, we demonstrate that no nanoparticle
internalization occurred in the examined algal strains. However, patterns of interaction
appeared to be unique for each strain, as summarized in Table 3.2.
49
Chapter 3 Interactions of polystyrene nanoparticles with four fresh water algal strains
3.4.1 Euglena gracilis
In E. gracilis cultures, particle interactions were clearly size-dependent. While the PSNP50
strongly adsorbed and aggregated on the pellicle (Figure 3.1A-E), PSNP500 were observed to be
dispersed in the medium and not particularly associated with the cells (Figure 3.1 F, G). Since
both PSNP50 and PSNP500 were stable in the exposure medium (Table 3.1), the observed
aggregation of PSNP50 on the pellicle appears to result from the interaction with the surface of E.
gracilis. Considering the unique surface features of the pellicle, which has longitudinal cavities
with a width of ~ 250 nm (Cruenberger, 2007; Vismara et al., 2000), the absence of sorption of the
PSNP500 suggests that the sorption of the PSNP50 might be driven by their physical entrapment
into the cavities. However, since the PSNP50 were not homogeneously positioned along the
whole cavity, additional factors might determine their sorption. Euglenoid species are known to
excrete mucilaginous material along these cavities, which is deposited locally and randomly by
sub-pellicle compartments (Leander and Farmer, 2000). Thus, sorption of the PSNP50 might be
further influenced by chemical interaction with mucopolysaccharides which are randomly
distributed along the cavities. Sorption of particles onto the pellicle of E. gracilis was also
detected in a previous study with AgNP of comparable size (Chapter 2), indicating size-
dependent physical entrapment as one determinant factor for particle adsorption.
Despite the close association of PSNP50 with the pellicle of E. gracilis, the 3D analysis upon z-
stack imaging shows no particle internalization in this algae (Figure 3.1C-E). These results
suggest that the glycoprotein-based pellicle prevents the crossing of nanoparticles, at least in
case of those displaying sizes of ~50 nm and larger, though, depending on the pore size the
passage of smaller particles cannot be excluded.
Exposure of E. gracilis to PSNP50 particles led to cellular damages manifested as morphological
changes and the loss of the flagella. On the other hand, no damage was detectable in cells
exposed to the larger PSPN500. These results strongly suggest that the observed cellular damage
in PSNP50 exposed algae results from the sorption of the nanoparticles. Previous studies showed
inhibition of photosynthesis and alteration of cell morphology in E. gracilis exposed to AgNP
(Chapter 2). However, and despite the sorption of AgNP on the pellicle, damaging effects were
attributed to the action of dissolved Ag+ ions released by the particles. Other studies have shown
50
Chapter 3 Interactions of polystyrene nanoparticles with four fresh water algal strains
that sorption of PSNP on the algal surface of Chlorella sp. inhibits photosynthesis, probably as a
result of shading effects (Bhattacharya et al., 2010).
3.4.2 Haematococcus pluvialis
The CLSM analysis of H. pluvialis cells was not indicative of any cell damages in PSNP exposed
cells, suggesting a lower sensitivity of this species to PSNP compared to the other examined
algal strains.
Nanoparticle interactions with H. pluvialis were comparable in cultures grown in organic and
inorganic media, which were selected considering the influence of environmental factors like
nutrients availability on the chemical composition of the cell wall, as demonstrated in a
proteomic study with this alga (Wang et al., 2004). As shown in Figures 3.2 and 3.3, PSNP50 were
found to be homogeneously distributed over the whole surface of the algal cell, while the larger
PSPN500 were not sorbed to the cells, but remained dispersed in both media. This difference
suggests that also in the case of H. pluvialis, particle interactions depend on size. Indeed,
ultrastructural analysis of the cell wall of this alga shows that the cell wall surface is irregular
displaying a patchwork like construction (Hagen et al., 2002). These patchworks seem to fit the
smaller but not the larger PSNP500. CLSM analysis of cells does not allow to image whether the
homogeneous distribution of the PSNP50 results from direct contact of the particles to the cell
wall. Nevertheless, considering that cells of H. pluvialis are embedded in a gelatinous matrix
surrounding the cell wall (Hagen et al., 2002), we suggest that sorption depends also on
chemical interactions of the particles with chemical components of the matrix, which mainly
consists of proteins and a small fraction of carbohydrates.
As indicated by the 3D analysis using xz projections and volume viewing (Figure 3.2 C1-C5, E
and Figure 3.3 C1-C5, E), no PSNP50 were evidenced to be intracellular. These results suggest
that, given by the pore size exclusion of the H. pluvialis cell wall, 50 nm and larger sized
nanoparticles are not able to enter the cells. Moreover, considering that during the cell division
the cell wall thickens from ~35 nm up to 2.2 µm and changes chemical composition (Hagen et al.,
2002), even the entry of smaller particles might be hampered also by the thickness of the cell
wall.
51
Chapter 3 Interactions of polystyrene nanoparticles with four fresh water algal strains
3.4.3 Chlamydomonas reinhardtii
The wild type of C. reinhardtii displayed different stress responses to PSNP50 and PSNP500
exposure. As clearly visible in the transmission images, algae exposed to PSNP50 secreted EPS,
leading cells to strongly clump together packed within the surrounding EPS (Figure 3.4 B).
Differently, algae exposed to PSNP500 released less EPS and did not clump together (Figure 3.4
D). Both EPS secretion and flocculation are general responses of C. reinhardtii to environmental
stress that were detected also upon exposure to other nanoparticles (Ma et al., 2015; Röhder et al.,
2014). Distribution of PSNP50 matched the distribution of EPS (Figure 3.4 A, B), indicating an
association of the PSNP50 with the EPS and an absence of direct contact of the particles with the
cells. The EPS of C. reinhardtii has been previously characterized to contain mainly proteins and
polysaccharides (Zhu et al., 2012), which might chemically interact with the fluorophore
residues of PSNP50 and affect the particle stability. However, the CLSM used in this study does
not allow to assess the aggregation state of the particles within the EPS. Other studies have
shown that EPS derived from bacteria and periphyton sorbed to AgNP and increased their
stability (Khan et al., 2011a; Khan et al., 2011b; Kroll et al., 2014).
The PSNP500 appeared to be specifically localized in the flagella region of the wild type of C.
reinhardtii, showing unique interactions of larger particles with algae cells (Figure 3.4 C).
Association of particles with flagella was observed also in H. pluvialis, but only with the smaller
PSNP50 (Figure 3.2 C-E and Figure 3.3 C-E). However, the flagella-associated PSNP50 formed
large aggregates in H. pluvialis while in C. reinhardtii the PSNP500 occurred as individual particles.
The association of particles with the flagella of these algae is indicative of specific interactions
between the PSNP and flagellar components, which chemically differ from the cell wall
components (Pazour and Bloodgood, 2008). The flagella of Chlamydomonas are covered by a
membrane that emerges from the plasma membrane, but has different protein and lipid
composition (Luck et al., 1977; Mitchell, 2000; Pazour et al., 2005).
Different interactions occurred between PSNP and the cell wall free mutant of C. reinhardtii
compared to the wild type. As visible in the transmission images, the mutant exposed to both
the PSNP50 and the PSNP500 secreted EPS, which, in case of the PSNP50 appeared to be
homogeneously associated with the algal surfaces, while in case of the PSNP500 the EPS was
52
Chapter 3 Interactions of polystyrene nanoparticles with four fresh water algal strains
secreted into the medium (Figure 3.5 B, D). The PSNP50 appeared to be localized around the cells,
suggesting their binding to the EPS rather than their direct contact to the plasma membrane
(Figure 3.5 A, B). Similarly, the PSNP500 seemed to bind to the EPS released by the cells in the
medium (Figure 3.5 C, D).
The CLSM analysis of both the wild type and cell wall free mutant of C. reinhardtii showed no
internalization of the PSNP. These results suggest that the cell wall of C reinhardtii, as in case of
the other two examined algae, is not permeable for nanoparticles of ~50 nm in size. Moreover,
the absence of particle internalization in the cell wall free mutant indicates that, besides the cell
wall, also the plasma membrane is a barrier for nanoparticle uptake. Similarly, previous studies
did not evidence any particle uptake in both strains of C. reinhardtii exposed to AgNP and
CeO2NP (Piccapietra et al., 2012a; Röhder, 2014). Thus, it seems that the plasma membrane of C.
reinhardtii lacks pathways for the internalization of these particles, which, depending on their
physicochemical properties, are taken up by endocytosis or passive diffusion in animal cells
(Kuhn et al., 2014; Moore, 2006; Yacobi et al., 2010).
The results of this study have shown that no PSNP internalization occurred across all examined
algal strains, and different factors affected the interaction of PSNP with the algal cells. The
patterns of interaction strongly depend on both the particle size and the characteristics of the
algal cells, in particular their surface architecture and secretion of biomolecules (i.e. mucilage,
gelatinous matrix, and EPS). The localization of these biomolecules determined the distribution
of the nanoparticles either on the algal surfaces or in the exposure medium.
53
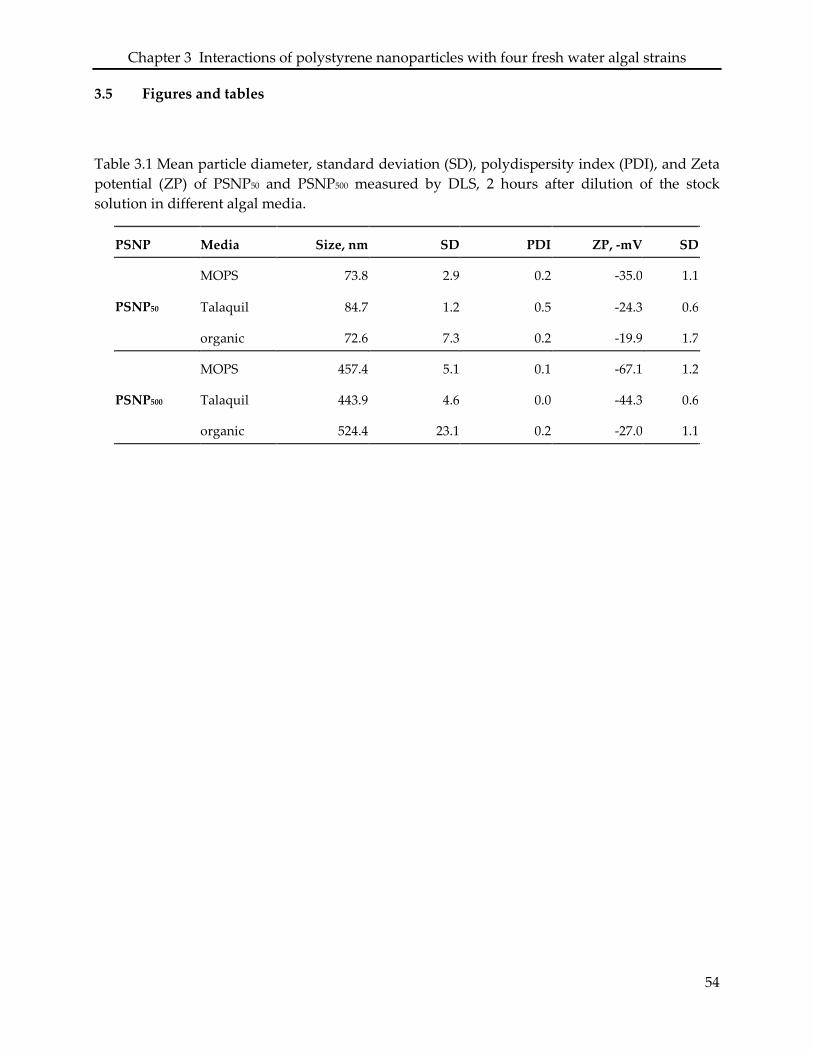
Chapter 3 Interactions of polystyrene nanoparticles with four fresh water algal strains
3.5 Figures and tables
Table 3.1 Mean particle diameter, standard deviation (SD), polydispersity index (PDI), and Zeta potential (ZP) of PSNP50 and PSNP500 measured by DLS, 2 hours after dilution of the stock solution in different algal media.
PSNP Media Size, nm SD PDI ZP, -mV SD
PSNP50
MOPS 73.8 2.9 0.2 -35.0 1.1
Talaquil 84.7 1.2 0.5 -24.3 0.6
organic 72.6 7.3 0.2 -19.9 1.7
PSNP500
MOPS 457.4 5.1 0.1 -67.1 1.2
Talaquil 443.9 4.6 0.0 -44.3 0.6
organic 524.4 23.1 0.2 -27.0 1.1
54
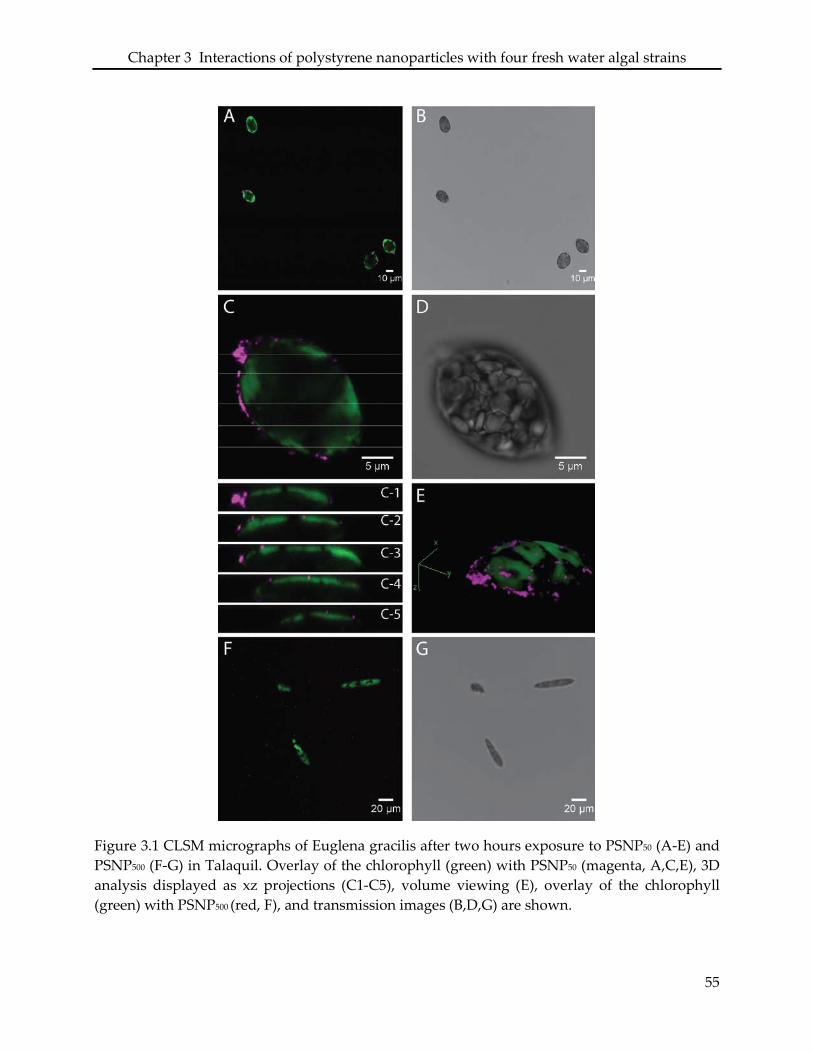
Chapter 3 Interactions of polystyrene nanoparticles with four fresh water algal strains
Figure 3.1 CLSM micrographs of Euglena gracilis after two hours exposure to PSNP50 (A-E) and PSNP500 (F-G) in Talaquil. Overlay of the chlorophyll (green) with PSNP50 (magenta, A,C,E), 3D analysis displayed as xz projections (C1-C5), volume viewing (E), overlay of the chlorophyll (green) with PSNP500 (red, F), and transmission images (B,D,G) are shown.
55
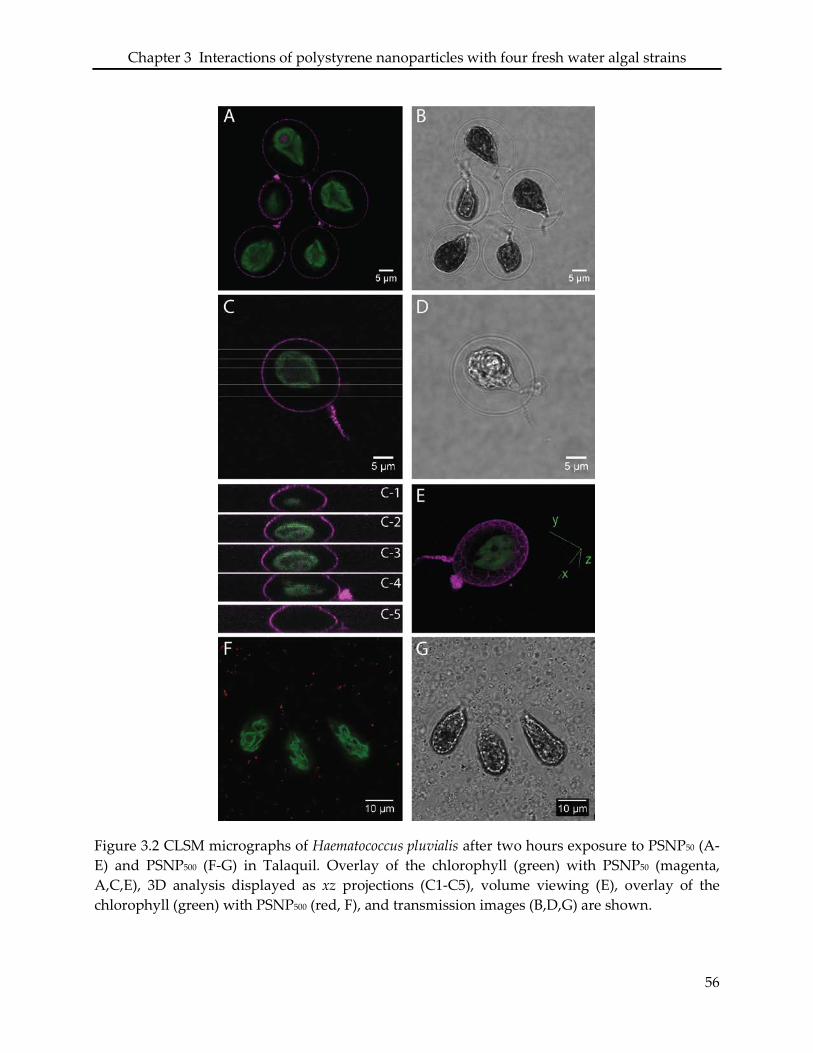
Chapter 3 Interactions of polystyrene nanoparticles with four fresh water algal strains
Figure 3.2 CLSM micrographs of Haematococcus pluvialis after two hours exposure to PSNP50 (A-E) and PSNP500 (F-G) in Talaquil. Overlay of the chlorophyll (green) with PSNP50 (magenta, A,C,E), 3D analysis displayed as xz projections (C1-C5), volume viewing (E), overlay of the chlorophyll (green) with PSNP500 (red, F), and transmission images (B,D,G) are shown.
56
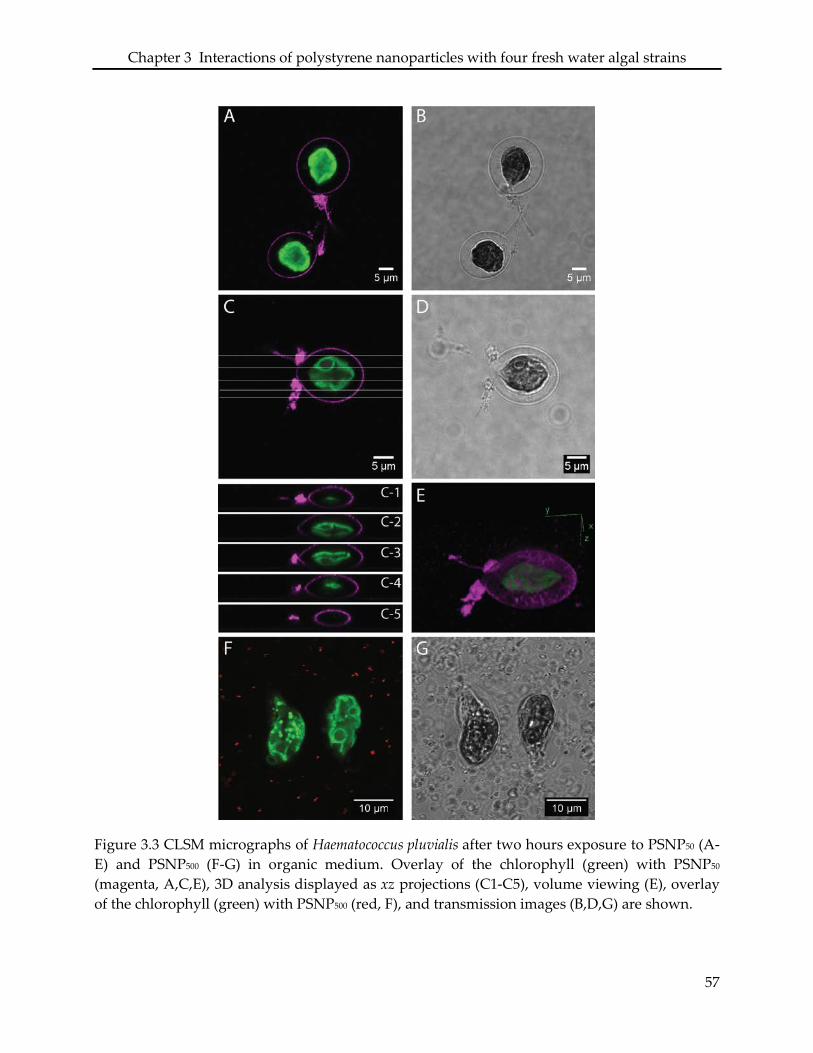
Chapter 3 Interactions of polystyrene nanoparticles with four fresh water algal strains
Figure 3.3 CLSM micrographs of Haematococcus pluvialis after two hours exposure to PSNP50 (A-E) and PSNP500 (F-G) in organic medium. Overlay of the chlorophyll (green) with PSNP50 (magenta, A,C,E), 3D analysis displayed as xz projections (C1-C5), volume viewing (E), overlay of the chlorophyll (green) with PSNP500 (red, F), and transmission images (B,D,G) are shown.
57
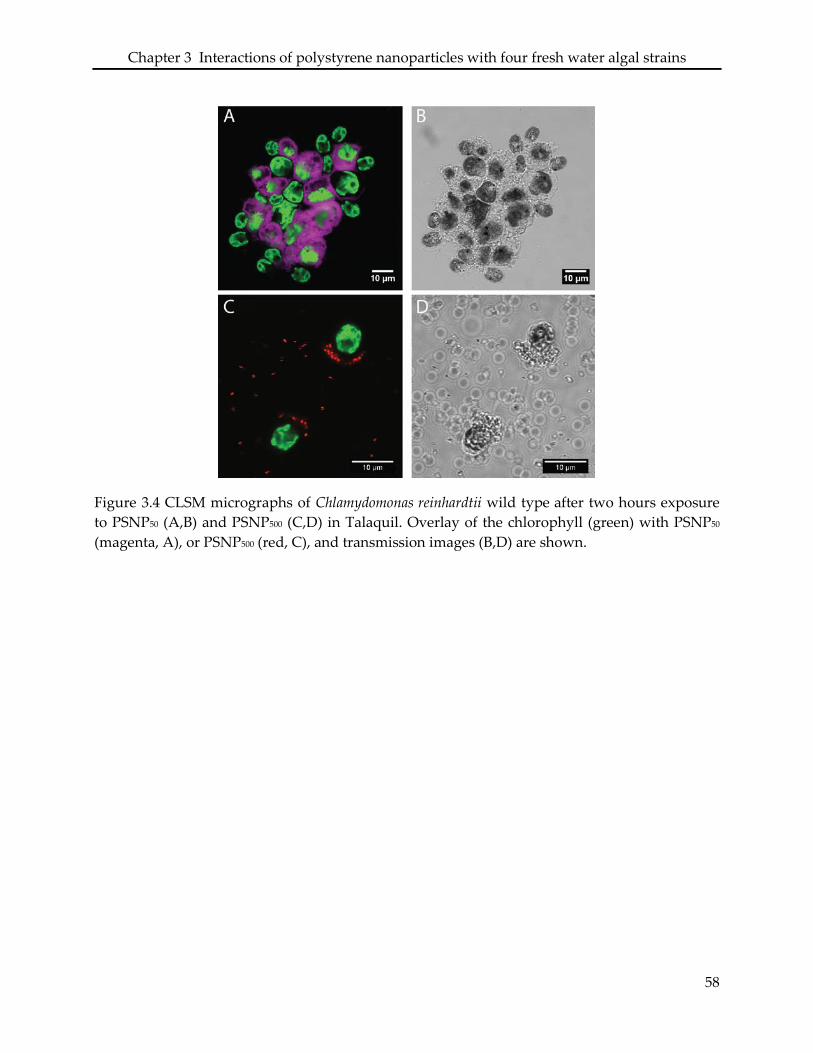
Chapter 3 Interactions of polystyrene nanoparticles with four fresh water algal strains
Figure 3.4 CLSM micrographs of Chlamydomonas reinhardtii wild type after two hours exposure to PSNP50 (A,B) and PSNP500 (C,D) in Talaquil. Overlay of the chlorophyll (green) with PSNP50 (magenta, A), or PSNP500 (red, C), and transmission images (B,D) are shown.
58
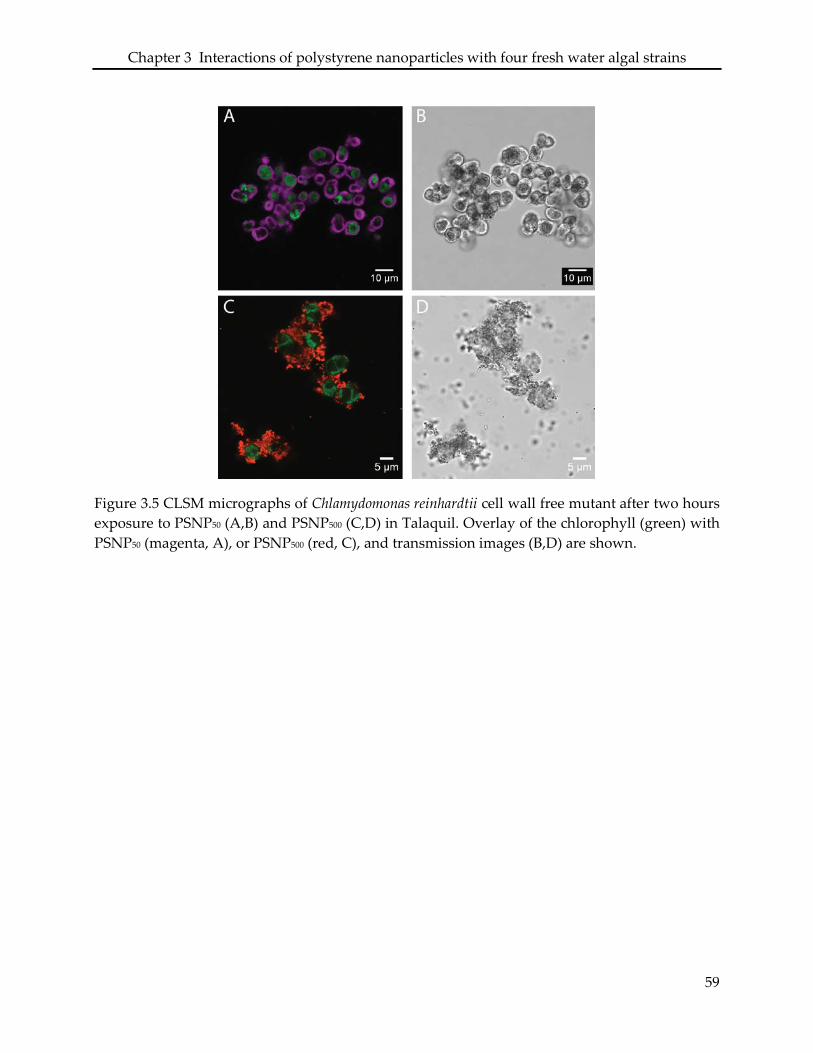
Chapter 3 Interactions of polystyrene nanoparticles with four fresh water algal strains
Figure 3.5 CLSM micrographs of Chlamydomonas reinhardtii cell wall free mutant after two hours exposure to PSNP50 (A,B) and PSNP500 (C,D) in Talaquil. Overlay of the chlorophyll (green) with PSNP50 (magenta, A), or PSNP500 (red, C), and transmission images (B,D) are shown.
59
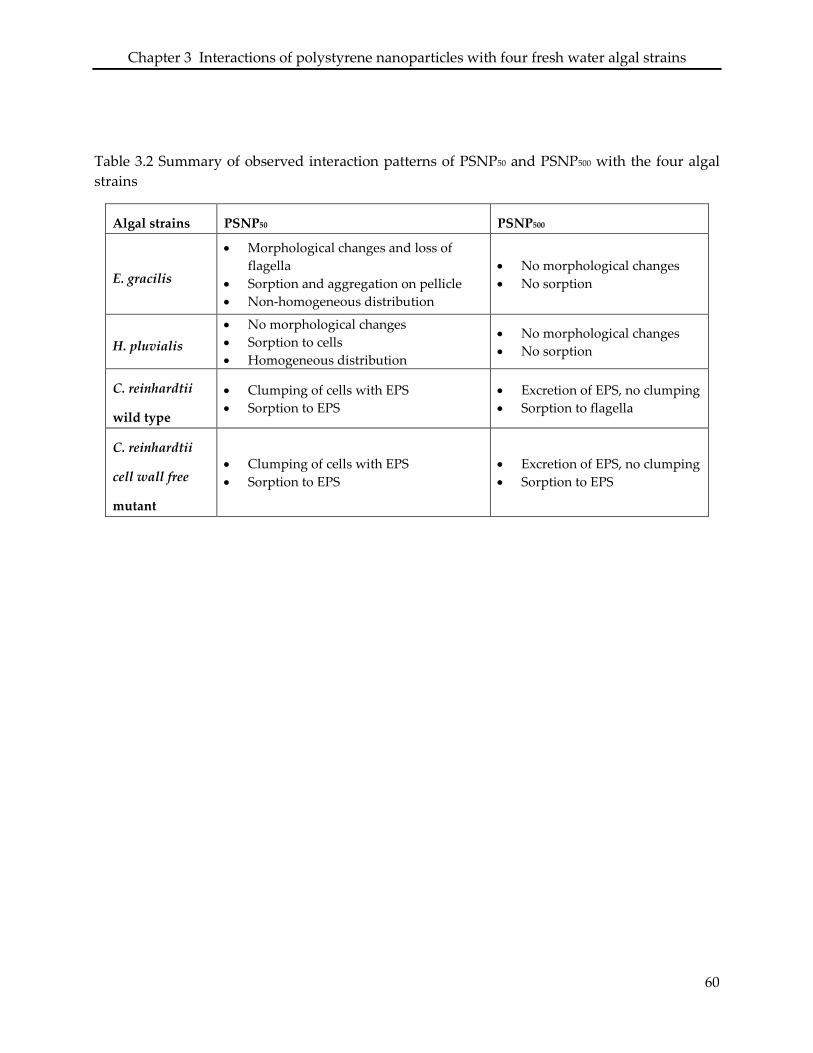
Chapter 3 Interactions of polystyrene nanoparticles with four fresh water algal strains
Table 3.2 Summary of observed interaction patterns of PSNP50 and PSNP500 with the four algal strains
Algal strains PSNP50 PSNP500
E. gracilis
• Morphological changes and loss of flagella
• Sorption and aggregation on pellicle • Non-homogeneous distribution
• No morphological changes • No sorption
H. pluvialis • No morphological changes • Sorption to cells • Homogeneous distribution
• No morphological changes • No sorption
C. reinhardtii
wild type
• Clumping of cells with EPS • Sorption to EPS
• Excretion of EPS, no clumping • Sorption to flagella
C. reinhardtii
cell wall free
mutant
• Clumping of cells with EPS • Sorption to EPS
• Excretion of EPS, no clumping • Sorption to EPS
60
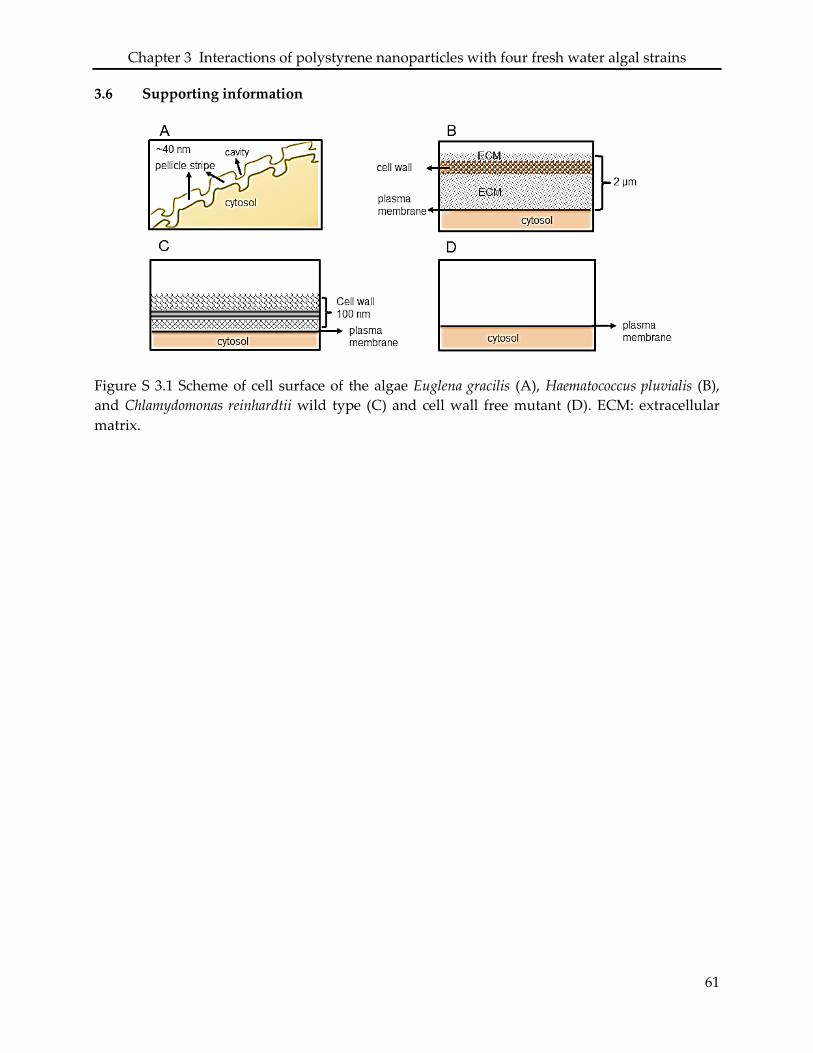
Chapter 3 Interactions of polystyrene nanoparticles with four fresh water algal strains
3.6 Supporting information
Figure S 3.1 Scheme of cell surface of the algae Euglena gracilis (A), Haematococcus pluvialis (B), and Chlamydomonas reinhardtii wild type (C) and cell wall free mutant (D). ECM: extracellular matrix.
61
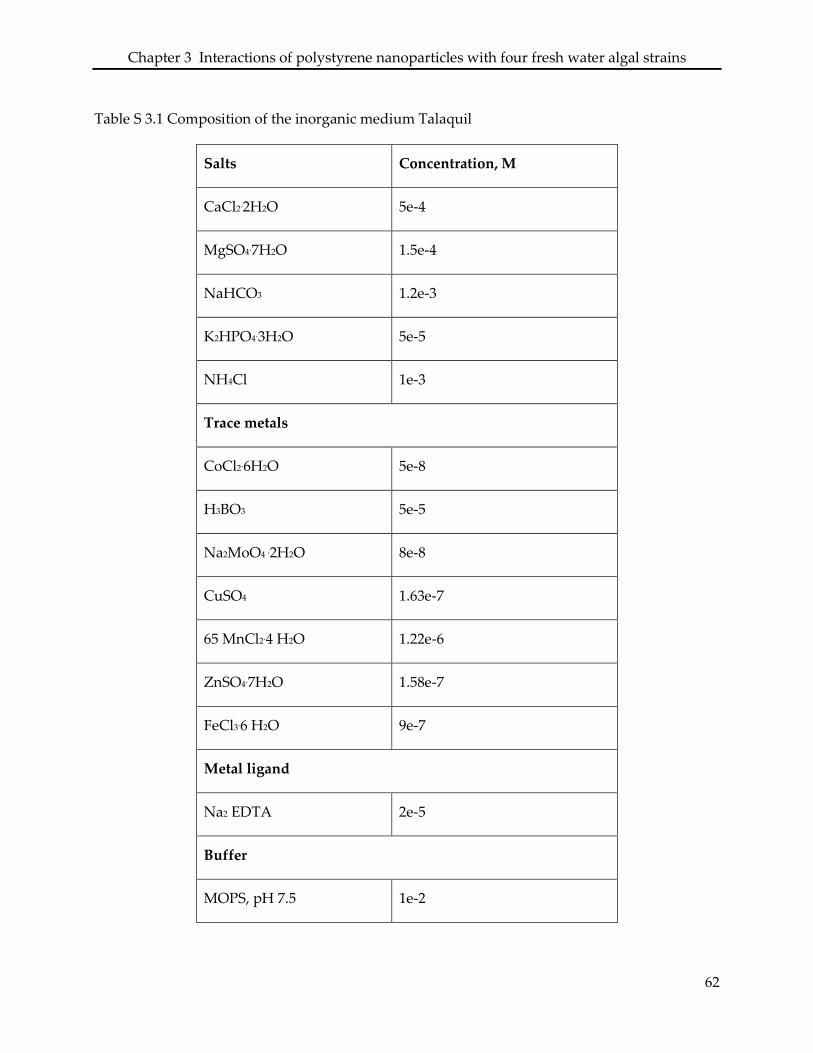
Chapter 3 Interactions of polystyrene nanoparticles with four fresh water algal strains
Table S 3.1 Composition of the inorganic medium Talaquil
Salts Concentration, M
CaCl2.2H2O 5e-4
MgSO4.7H2O 1.5e-4
NaHCO3 1.2e-3
K2HPO4.3H2O 5e-5
NH4Cl 1e-3
Trace metals
CoCl2.6H2O 5e-8
H3BO3 5e-5
Na2MoO4 .2H2O 8e-8
CuSO4 1.63e-7
65 MnCl2.4 H2O 1.22e-6
ZnSO4.7H2O 1.58e-7
FeCl3.6 H2O 9e-7
Metal ligand
Na2 EDTA 2e-5
Buffer
MOPS, pH 7.5 1e-2
62
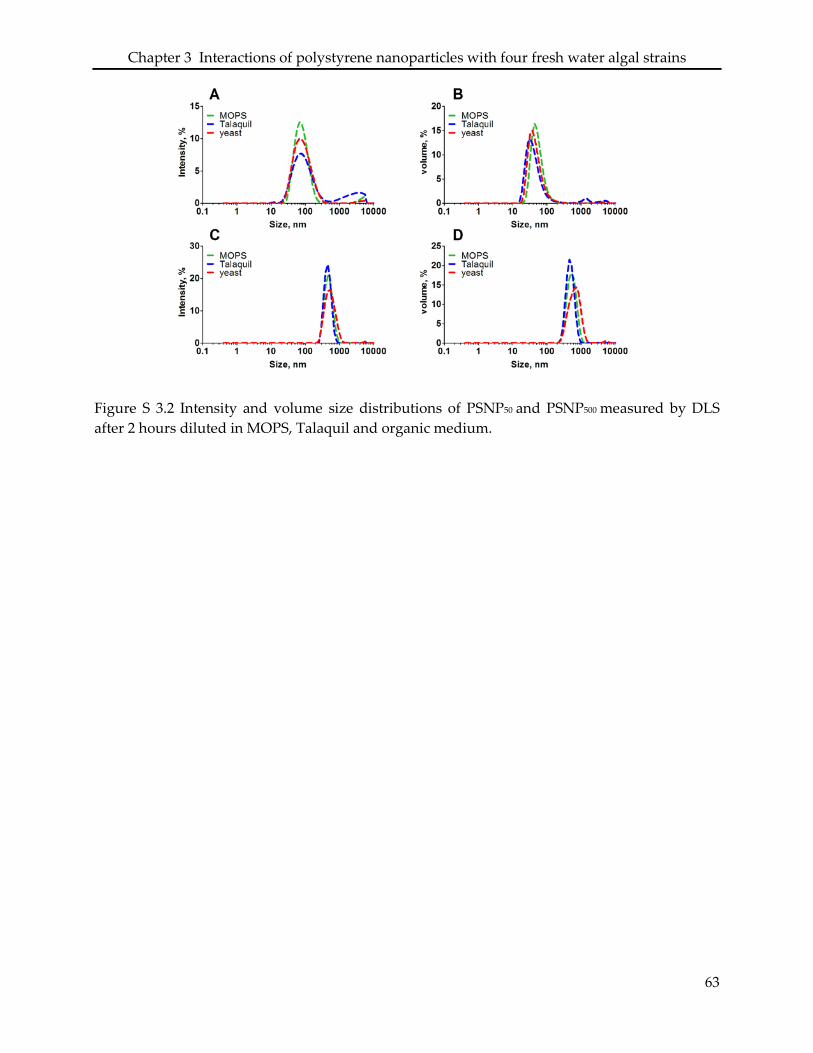
Chapter 3 Interactions of polystyrene nanoparticles with four fresh water algal strains
Figure S 3.2 Intensity and volume size distributions of PSNP50 and PSNP500 measured by DLS after 2 hours diluted in MOPS, Talaquil and organic medium.
63
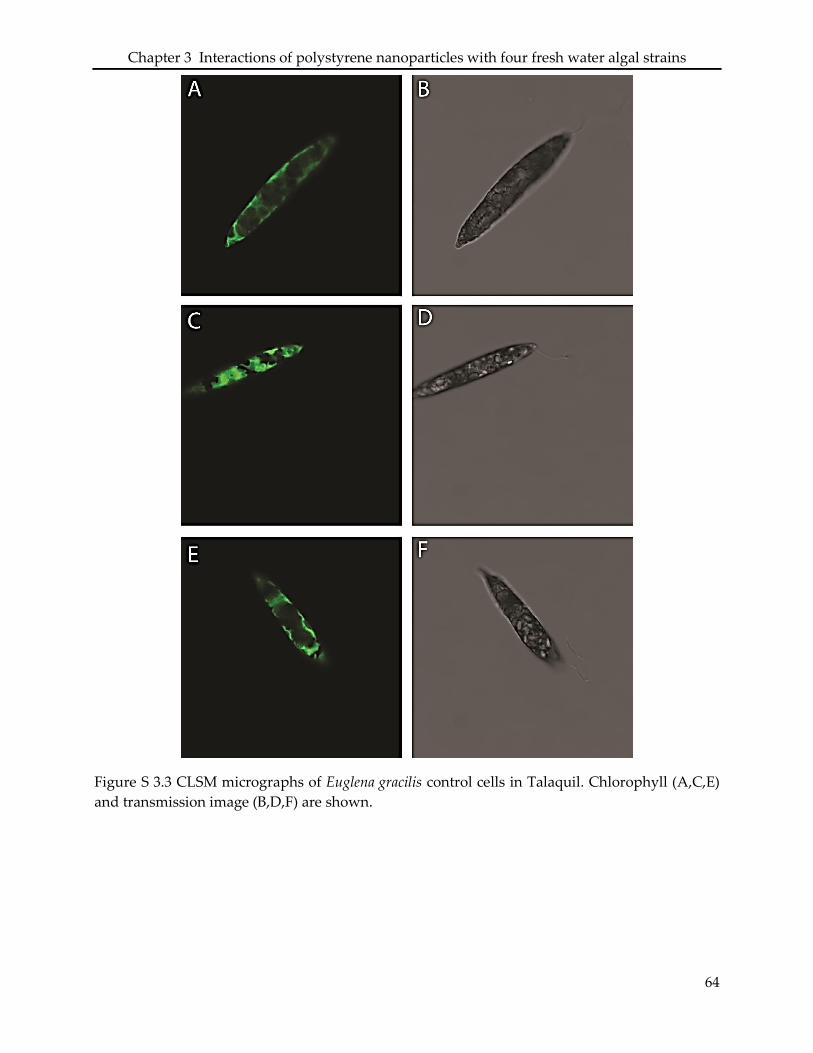
Chapter 3 Interactions of polystyrene nanoparticles with four fresh water algal strains
Figure S 3.3 CLSM micrographs of Euglena gracilis control cells in Talaquil. Chlorophyll (A,C,E) and transmission image (B,D,F) are shown.
64
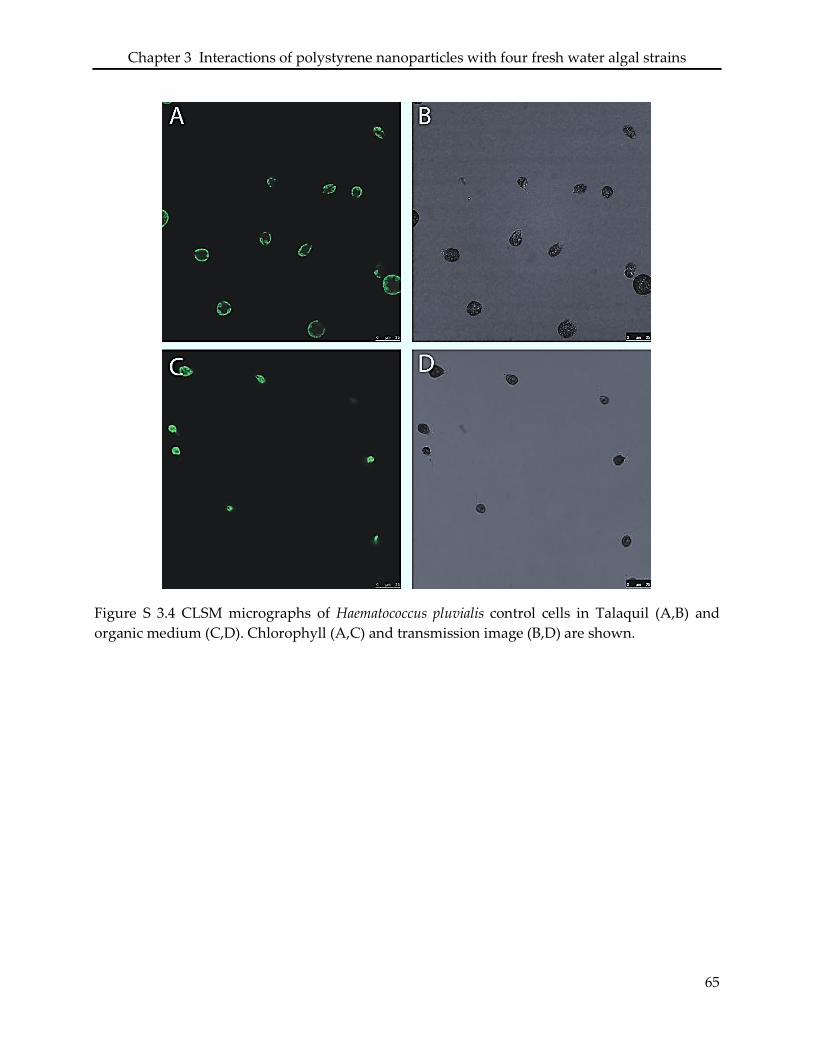
Chapter 3 Interactions of polystyrene nanoparticles with four fresh water algal strains
Figure S 3.4 CLSM micrographs of Haematococcus pluvialis control cells in Talaquil (A,B) and organic medium (C,D). Chlorophyll (A,C) and transmission image (B,D) are shown.
65
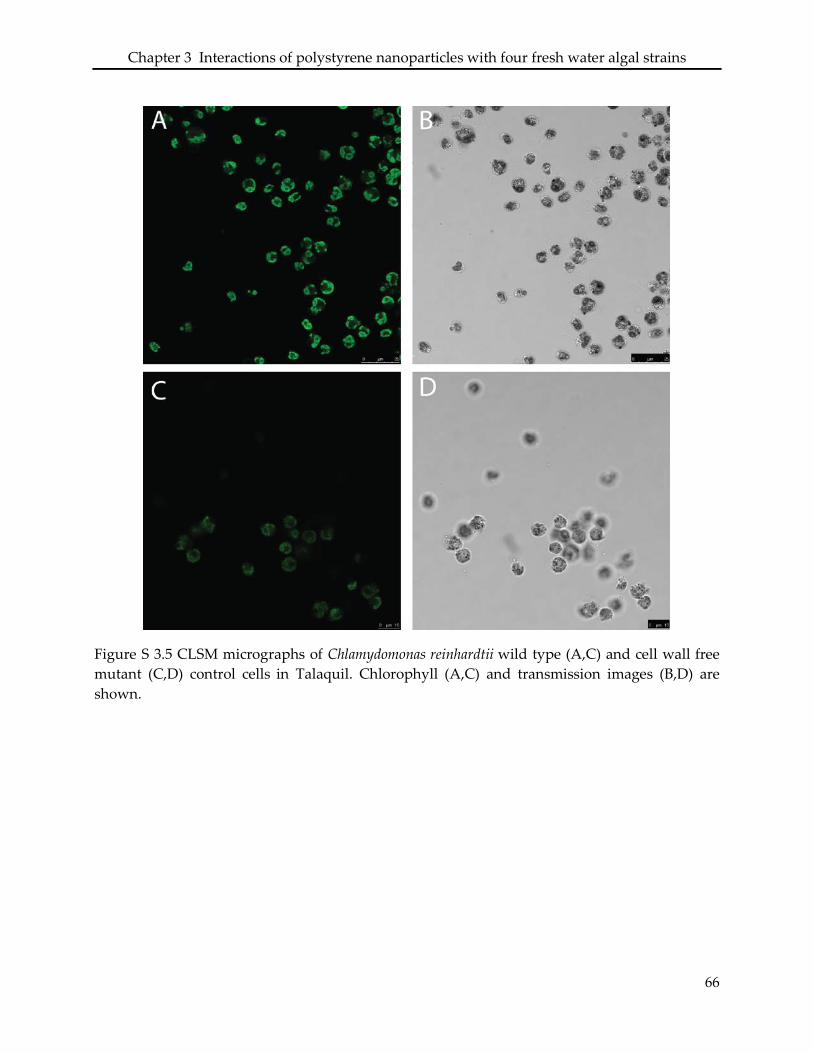
Chapter 3 Interactions of polystyrene nanoparticles with four fresh water algal strains
Figure S 3.5 CLSM micrographs of Chlamydomonas reinhardtii wild type (A,C) and cell wall free mutant (C,D) control cells in Talaquil. Chlorophyll (A,C) and transmission images (B,D) are shown.
66
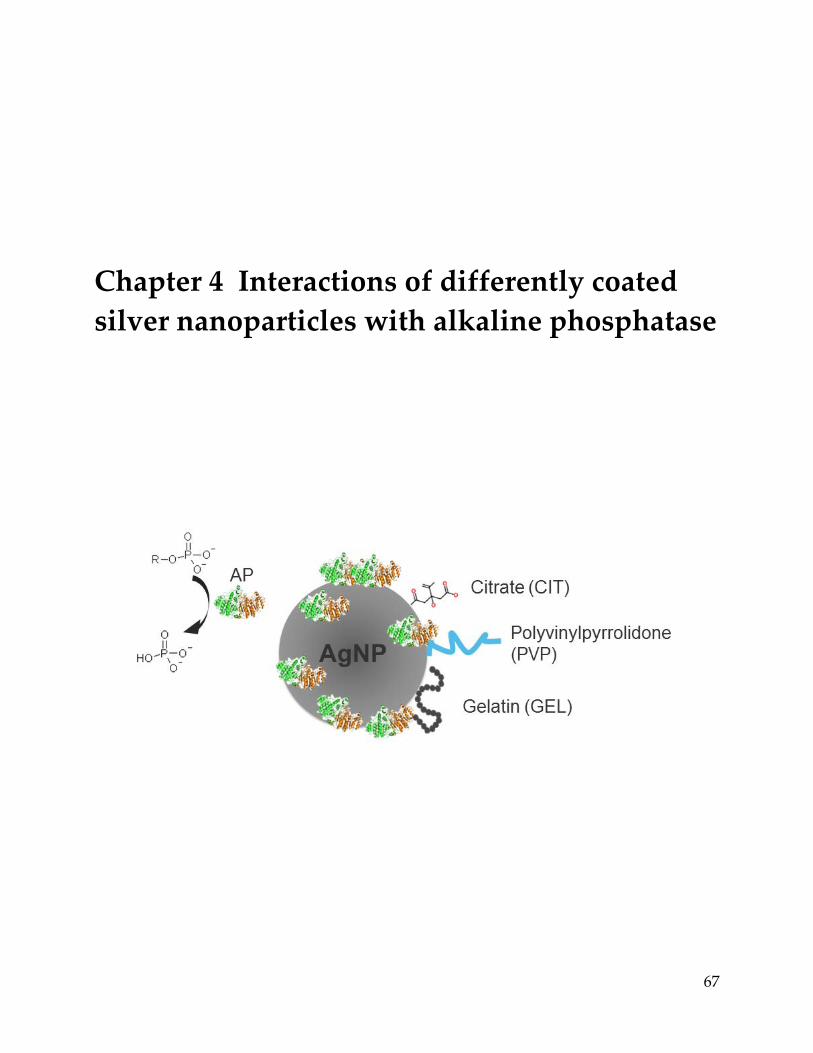
Chapter 4 Interactions of differently coated silver nanoparticles with alkaline phosphatase
67
Chapter 4 Interactions of differently coated silver nanoparticles with alkaline phosphatase
Extracellular enzymes play an important role in nutrient acquisition for aquatic organisms. Due
to their extracellular localization, they are likely to have direct contact and interactions with
nanoparticles in aquatic environments. In this study, interactions of three differently coated
silver nanoparticles (AgNP) and alkaline phosphatase (AP), a representative example of
extracellular enzymes, were investigated. After incubating the enzyme with AgNP for 2 hours,
the AP-AgNP complex was isolated using a sucrose cushion centrifugation and the adsorbed AP
was quantified. To assess the effects of AgNP on AP activity, enzyme assays were started either
by addition of the substrate to AP-AgNP mixture, or, alternatively, by the addition of AgNP to
the AP-substrate mixture. The sorption was found to differ across the examined AgNP, and
various factors influencing the sorption are discussed. The enzymatic activity was affected by
the three types of AgNP, though the inhibitory effects of AgNP depended on the sequence of
addition of the AgNP and substrate to the enzyme. Overall, the present study showed that the
adsorption of AP to AgNP was determined by the physicochemical properties the particle
coating and the conformation of the enzyme.
4.1 Introduction
The small dimension and high surface area of nanoparticles provide them with various
attractive properties of interest to researchers and manufactures alike. In the last decades, the
production and application of nanoparticles have been rapidly expanded. For this reason, they
are likely to be present and accumulate in the environment, and thus challenge the biosafety and
sustainable development of nanotechnology (Kahru and Dubourguier, 2010; Moore, 2006;
Navarro et al., 2008a).
Upon introduction into environments, nanoparticles readily interact with biomolecules, like
proteins. As a result of this interaction, the proteins adsorb to the particles, forming a corona
surrounding the particle surfaces. The adsorption of proteins to nanoparticles is driven by
various biophysicochemical interactions occurring at the interface, including Van der Waals
forces, electrostatic interactions, and hydrophobic/hydrophilic interactions (Gunawan et al., 2014;
Nel et al., 2009). The composition of the protein corona is dynamically modified depending on
the protein binding affinity to the particle surfaces and its relative abundance in the fluid
(Mahmoudi et al., 2011). The ‘hard’ corona consists of high-affinity low-exchange-rate proteins
68
Chapter 4 Interactions of differently coated silver nanoparticles with alkaline phosphatase
(Fleischer and Payne, 2014), and determines the nanoparticle fate and interactions in biological
systems (Lynch et al., 2007; Lynch and Dawson, 2008; Monopoli et al., 2012).
Interactions of nanoparticles with proteins have mainly been studied using human proteins (Ge
et al., 2015; Gunawan et al., 2014; Lundqvist et al., 2008; Shemetov et al., 2012; Walczyk et al.,
2010; Walkey et al., 2014), and limited information exists on environmental relevant systems
thus far (Eigenheer et al., 2014; Gil-Allue et al., 2015; Khan et al., 2011c; Schug et al., 2014;
Wigginton et al., 2010). The protein-nanoparticle interactions can be influenced by the
physiochemical characteristics of the particles. It has been shown for gold nanoparticles that the
adsorbed protein pattern varied significantly as a function of size, charge and surface coatings of
the particles (Benetti et al., 2013; Deng et al., 2013; Walkey et al., 2012). Also for silver
nanoparticles (AgNP), proteins were found to bind differently to the bare surfaces of the
particles and to chemically modified surfaces (Eigenheer et al., 2014; Podila et al., 2012). The
binding of proteins to the nanoparticles might affect the stability and environmental reactivity of
the particles, as well as structure and function of proteins. Upon binding by proteins,
nanoparticles tend to agglomerate, resulting from hydrogen bonds present between the particles
and proteins (Yoo et al., 2008), or to be stabilized due to enhanced electrostatic interactions or
steric stabilization (Kuhnel et al., 2009). During the formation of a protein corona, the proteins
may undergo conformational changes (Bellezza et al., 2007; Ding et al., 2013; Linse et al., 2007),
making the proteins dysfunctional. Significant loss of enzymatic activity was reported as a result
of enzyme association with the nanoparticles (Czeslik and Winter, 2001; Kondo et al., 1993;
Norde and Anusiem, 1992).
Many aquatic organisms, like bacterial and algae, are known to excrete extracellular enzymes
which are essential for nutrient acquisition (Sinsabaugh et al., 1991). Such enzymes are widely
present in aquatic environments and might potentially interact with nanoparticles. Previous
studies with heterotrophic and autotrophic biofilms have reported the effects of nanoparticles
on extracellular enzyme activity (Gil-Allue et al., 2015; Schug et al., 2014). For heterotrophic
biofilms, a decreased activity was found to result from reactive oxygen species formed by
titanium oxide nanoparticles (Schug et al., 2014). In periphyton, inhibition of extracellular
69
Chapter 4 Interactions of differently coated silver nanoparticles with alkaline phosphatase
enzyme activity by AgNP was attributed to dissolved Ag+ ions which were released from the
particles, and to direct AgNP effects (Gil-Allue et al., 2015).
Alkaline phosphatase (AP) is an extracellular enzyme responsible for phosphorus acquisition.
This enzyme is highly abundant in aquatic environments, and is produced by a wide range of
organisms including bacteria, fungi, algae and zooplankton (Jansson et al., 1988; Rier et al., 2007;
Rose and Axler, 1998). The AP activity in periphyton has been shown not to be adversely
affected by AgNP (Gil-Allue et al., 2015). However, since this study was conducted in the
presence of the organisms, which continuously synthesized enzymes and secreted to the
medium, it could not be determined whether the absence of inhibitory effects was due to a low
sensitivity of this enzyme to AgNP. Further studies on isolated enzyme are required to assess
whether nanoparticles directly interact with the enzyme.
In this study, we investigated the interaction of three differently coated AgNP with AP. The
selected coatings were a small molecular weight ligand, citrate (CIT), a long chained polymer
polyvinylpyrrolidone (PVP), and a protein-based gelatin (GEL). These coatings have differing
physicochemical properties, such as charge, functional groups, and confirmation, and would
allow the evaluation of the influence of surface chemistry on their interactions with the enzyme.
In this study, the sorption of AP to the differently coated AgNP was quantified and effects on
enzymatic activity were assessed. To evaluate the contribution of Ag+ to the effects caused by
AgNP, enzymatic activity was also measured following addition of AgNO3.
4.2 Materials and methods
4.2.1 Materials
AgNPCIT, AgNPPVP, and AgNPGEL were provided by NanoSys GmbH (Wolfhalden, Switzerland)
as aqueous suspensions of 1 g L-1 determined on total silver (nominal concentrations). Stock
AgNP suspensions were kept in the dark. For exposure studies, AgNP and AgNO3 solutions
were freshly prepared in the experimental medium, 10 mM 3-morpholinepropanesulfonic acid
(MOPS) at pH 7.5. Alkaline phosphatase (AP) isolated from Escherichia coli was provided by
Sigma-Aldrich as lyophilized powder (30-60 units mg protein-1), and used without further
purification. Unless otherwise indicated, all chemicals were purchased from Sigma-Aldrich.
70
Chapter 4 Interactions of differently coated silver nanoparticles with alkaline phosphatase
4.2.2 AgNP characterization
To assess the effects of AP on particle stability, the three types of AgNP were dispersed in MOPS
at a concentration of 5 mg L-1 with and without the addition of the enzyme (7.15 mg L-1). After a
2 hour exposure, AgNP suspensions were characterized for size and Zeta potential by dynamic
light scattering (DLS) using a Zeta Sizer (Nano ZS, Malvern Instruments). The average value of
three technical replicates, each measured with three analytical replicates, is presented. Statistical
significance was determined by F- and t-test.
4.2.3 Adsorption assay
For adsorption experiments, AP was added to a final concentration of 14.5 and 145 mg L-1 in 1
mL MOPS (10 mM, pH 7.5), and incubated with 100 mg L-1 of the three differently coated AgNP
for 2 h at 25 °C. All exposures were carried out in 1.5 mL Eppendorf Protein LoBind Tubes to
ensure high recovery of proteins. Each exposure was performed with three replicates.
After exposure, nanoparticles associated with AP were separated from non-associated AP via
centrifugation through a sucrose cushion (Supporting Information (SI) Figure S 4.1), which
allows nanoparticles above a certain size to pellet down. For these experiments, 200 µL of
sucrose (0.7 M in 10 mM MOPS) were added to the bottom of the tube, and then 1 mL of the
enzyme-AgNP mixture solution was loaded onto the sucrose cushion. After centrifugation
(20,000 × g, 1 h, 4 °C), the supernatant (~1.2 mL), containing free enzyme, small AgNP, and
sucrose was carefully removed. The pellet was washed in fresh MOPS, and again centrifuged to
remove the loosely bound enzyme. The resulting pellet was resuspended in 20 µL
Urea/Thiourea buffer (30 mM Tris/HCl, 7 M Urea, 2 M Thiourea, pH 8.5) and boiled at 95 °C for
10 min to release the associated enzyme from the AgNP. Then, the released enzyme was
separated from the remaining AgNP by centrifugation (20,000 × g, 15 min, 4 °C). The
supernatant containing AP was transferred to a new Protein LoBind tube for protein analysis,
and the AgNP in the pellet was digested for metal analysis.
71
Chapter 4 Interactions of differently coated silver nanoparticles with alkaline phosphatase
4.2.4 Protein analysis
An Agilent 2100 Bioanalyzer equipped with a laser-induced fluorescence detector was used to
assess the size and quantity of AP associated with AgNP (High Sensitivity Protein 250 Kit). All
sample preparations were performed in 0.5 mL Protein LoBind tubes. The prepared samples,
including AP released from AgNP, AP reference of a known concentration, and protein
molecular weight ladder, were fluorescently labeled in the Urea/Thiourea/ Tris/HCl buffer at pH
8.5, and excess dye was quenched after reaction with Ethanolamine.
For the on-chip analysis, the labeled samples were diluted 200 times in deionized water to
decrease the background fluorescence. Immediately after dilution, 4 µL of the diluted labeled
sample were mixed with 2 µL of a sodium dodecyl sulfate (SDS)-based denaturing buffer
containing a 5 kDa lower molecular weight marker, and heated for 5 min at 95 °C. After cooling,
6 µL of sample, together with 12 µL of a size sieving polymer matrix, and 12 µL of a destaining
solution were loaded into each well on the protein chip. Proteins were separated by
electrophoresis based on size, and detected by laser-induced fluorescence in the Agilent 2100
Bioanalyzer. One sample per run was analyzed. The molecular weight ladder was analyzed first,
followed by experimental samples. The instrument constructs, based on recognized size and
intensity, a calibration curve that is used for size determination and quantification of protein
concentrations. The 5 kDa marker was used for alignment of all the data in order to compensate
for drift effects that may occur during the course of the run of the entire chip. Moreover, the AP
concentration in experimental samples was quantified based on intensity comparison with the
AP reference.
4.2.5 Metal analysis
To determine the amount of silver pelleted after sucrose centrifugation, the pellet was digested
with HNO3 in a microwave oven (195°C, MSL 1200 mega; Microwave Laboratory System,
Switzerland). Silver concentration was measured by inductively coupled plasma mass
spectrometry (ICP-MS, Thermo Finnigan, Germany) using the isotope 107Ag. The reliability of
measurements was controlled by measuring a water reference solution with a known silver
concentration (M105A, IFA-Tull, Austria).
72
Chapter 4 Interactions of differently coated silver nanoparticles with alkaline phosphatase
4.2.6 Effects of AgNP on AP activity
Enzyme activity was assayed with 1.43 mg L-1 AP in 200 µL MOPS (10 mM) at pH 7.5, using
fluorescently linked 4-methylumbelliferyl phosphate disodium salt (5 mM) as substrate. The
conversion of substrate was measured over 2 min in a multi-well plate reader (Tecan, Infinite
M200; Switzerland) at excitation and emission wavelengths of 366 and 442 nm, respectively. The
slope of the linear reaction was calculated to determine the enzyme activity.
To assess the effects of AgNP on AP activity, enzyme assays were started either by addition of
the substrate to AP-AgNP mixture, or, alternatively, by the addition of AgNP to the AP-
substrate mixture. The assessed AgNP concentrations were 0.25, 0.5, 1, 2, and 2.5 mg L-1. The
incubation time was 2 hours for AP-AgNP mixture, and 2 minutes for the AP-substrate mixture.
Effects of AgNO3 were assessed at concentrations of 0.025, 0.05, and 0.1 mg L-1, covering the
range of dissolved silver concentrations that were previously measured in the three AgNP
suspensions (Navarro et al., 2015). Final enzyme activity was presented as a mean of three
replicates, which were normalized to an untreated control, allowing for a better comparison
between independent experiments.
4.3 Results
4.3.1 Characterization of AgNP
After being diluted in the experimental medium (10 mM MOPS, pH 7.5) for 2 hours, the three
types of AgNP (5 mg L-1) displayed similar average diameters, ranging from 52 nm (AgNPCIT) to
76 nm (AgNPGEL) (Figure 4.1 A). In the presence of AP (7.15 mg L-1), the average diameters were
similar to the values measured in MOPS, ranging from 40 nm (AgNPCIT) to 79 nm (AgNPGEL).
The DLS analysis showed that the three types of AgNP were all negatively charged in MOPS,
with Zeta potentials ranging from -5.2 mV (AgNPPVP) to -29.6 mV (AgNPGEL) (Figure 4.1 B).
Following the addition of the AP, the Zeta potential values of AgNPCIT and AgNPGEL were
comparable to the values measured in MOPS. AgNPPVP became more negatively charged in the
presence of the enzyme (Figure 4.1 B).
73
Chapter 4 Interactions of differently coated silver nanoparticles with alkaline phosphatase
4.3.2 Adsorption assay
Quantification of AgNP pellet
An adsorption assay was performed with the three types of AgNP at the same mass
concentration (100 mg L-1). Based on their average size determined by DLS, the total surface area
of each AgNP suspension available for enzyme binding was calculated to be 11 cm2 for AgNPCIT,
9.1 cm2 for AgNPPVP, and 7.5 cm2 for AgNPGEL (Table 4.1). As measured by ICP-MS, the amount
of silver in the AgNP pellet, obtained after sucrose cushion centrifugation, ranged from 11.0 to
66.6 µg. Similar amounts of silver were found for the same type of AgNP incubated with AP at
two exposure concentrations (14.5 and 145 mg L-1). Less AgNPPVP (11.0-11.2 µg) were pelleted
compared to AgNPCIT (64.3-66.6 µg) and AgNPGEL (48.8-49.7 µg).
Quantification of AP
The electrophoresis gel obtained using 2100 Bioanalyzer shows the molecular weight (kDa) and
abundance of the AgNP associated AP (Figure 4.2). The molecular weight protein ladder
displayed clearly resolved bands in the gel (Figure 4.2 A-C, lane Ladder) and electropherogram
peaks (Figure 4.2 D) for each marker protein, having relative molecular weights of 240, 150, 95,
63, 46, and 15 kDa, and a lower molecular weight marker of 5 kDa. The size of proteins in the
analyzed samples was derived from alignment of each lane to the resolved protein bands in the
molecular weight ladder. The AP reference displayed a clear protein band between 46-63 kDa
(Figure 4.2 A-C, Lane AP Ref.). In the electropherogram, the AP reference displayed a distinct
peak in the same molecular weight range (Figure 4.2 E). The AP released from AgNPCIT and
AgNPPVP showed protein bands positioned similarly to the AP reference (Figure 4.2 A,B). Also,
the electropherograms of the analyzed samples from AgNPCIT and AgNPPVP showed distinct
peaks between 46-63 kDa. The electropherograms of AP released from AgNPCIT was shown as
an example (Figure 4.2 F,G). Similar electropherograms were obtained for AgNPPVP (data not
shown). No clear protein bands or electropherogram peaks were detected in the samples
derived from AgNPGEL exposure (Figure 4.2 C).
Absolute quantification of the AP was achieved upon comparison of the intensity of the protein
band between the samples and the AP reference. More AP were found to be associated with
74
Chapter 4 Interactions of differently coated silver nanoparticles with alkaline phosphatase
AgNPCIT (956 µg) than AgNPPVP (615 µg) at the lower exposure concentration of AP (14.5 mg L-1),
while at the higher AP concentration (145 mg L-1) the amounts of adsorbed AP were comparable
(Table 4.2). When the sorption data were related to the determined silver in AgNP pellets, and
corresponding AgNP surface area calculated based on average size previously measured by
DLS (Figure 4.1), the binding of AP was found to be higher on AgNPPVP compared to AgNPCIT
for both AP exposure concentrations. No AP was quantifiable with AgNPGEL.
4.3.3 Effects on enzyme activity
When the substrate was added to the AP-AgNP mixture, no decrease in enzymatic activity was
measured for the three types of AgNP at concentrations ranging from 0.25 to 2.5 mg L-1 (Figure
4.3). When AgNP were added to the AP-substrate mixture, a concentration-dependent decrease
of enzymatic activity was measured for the three types of AgNP, with the inhibitory effects
starting at 0.25 mg L-1 of AgNP in all cases (Figure 4.4). No effects of AgNO3 on AP activity were
measured up to 0.1 mg L-1 of silver following the two different sequences of addition of AgNO3
and substrate to the enzyme (Figure 4.5).
4.4 Discussion
In this study, we were interested in examining the interactions of three differently coated AgNP
with alkaline phosphatase (AP) as a representative extracellular enzyme in aquatic
environments. The AP is a dimeric enzyme and catalyzes the hydrolysis of phosphate esters.
The selected coatings (i.e. CIT, PVP and GEL) have different physicochemical properties, which
were expected to influence the particle interactions with AP. Experiments were carried out in
vitro in a simple buffer, MOPS (10 mM, pH p.5), in which particles maintain their stability
(Chapter 2; Navarro et al., 2008b; Navarro et al., 2015; Piccapietra et al., 2012b). Characterization
of nanoparticles in the presence of AP showed the three differently coated AgNP to remain
stable. However, DLS measurements do not allow to detect changes in particle size due to AP
adsorption, since the formation of an AP monolayer around the particles would correspond to
an increase of the average diameter of only ~10 nm (SI Table S 4.1).
The sucrose cushion centrifugation applied to isolate the enzyme-AgNP complex in the sorption
experiments showed to be very reproducible for all the types of AgNP. However, depending on
75
Chapter 4 Interactions of differently coated silver nanoparticles with alkaline phosphatase
the coating, different amounts of silver were determined in the pellet. While more than 50% of
total AgNP pelleted for AgNPCIT and AgNPGEL, only 10% was determined in the case of AgNPPVP
(Table 4.1). The pelleting through the sucrose cushion is density- and size-dependent, thus for
similar sizes and density the quantity of pelleted particles is expected to be comparable. The
three types of AgNP used in our study were comparable in their hydrodynamic size. However,
the PVP coating, as a long chained polymer, contributes to the hydrodynamic size of the
particles. Hence, the real size of the AgNPPVP core must be smaller than the other types of AgNP,
leading to a lower amount of pelleted particles.
Protein analysis of the pelleted AgNP using Bioanalyzer provides both sizing and quantitative
information of the AP, representing an adequate method for analyzing small amounts of
nanoparticle associated proteins. Binding of AP to AgNP was found to differ between the three
differently coated AgNP (Figure 4.6). The highest binding of AP was detected on the AgNPPVP
with an estimated ~70% of the total surface area covered, followed by AgNPCIT with ~10%
coverage, and AgNPGEL with no AP adsorption (Table 4.2). Different experimental conditions
might influence the sorption of AP, such as amounts of the enzyme, particle surface area, and
characteristics of the coatings. In our study, the lowest exposure concentration of AP was
already two times in excess to that needed to cover the AgNP with a monolayer (SI Table S 4.1).
Additionally, the surface area of the three types of AgNP was comparable (Table 4.1). Thus, the
characteristics of the surface coatings of AgNP were responsible for AP binding.
Depending on the physicochemical characteristics of both the particle coatings and the enzyme,
different factors favoring or resisting adsorption of AP to the three types of AgNP might account
for the measured differential binding. Electrostatic interactions, which have been regarded as
one of the major driving forces in protein-nanoparticle interactions (Nel et al., 2009), might play
a determinant role in our study. Considering that AP has an isoelectric point at 4~5 (Garen and
Levinthal, 1960), and thus displays a negative net charge under the experimental conditions (pH
7.5), a particle surface with negative charge is expected to repel the enzyme. Indeed, the binding
of AP was found to be proportional to the Zeta potential of the AgNP (Table 4.1, Table 4.2), with
higher binding to the less negatively charged AgNPPVP. For AgNPCIT, the adsorption of AP might
76
Chapter 4 Interactions of differently coated silver nanoparticles with alkaline phosphatase
also involve specific interactions of the positively charged residues of the enzyme with the
carboxyl groups of the CIT.
In case of AgNPPVP, additional factors might explain the high binding of AP. PVP is a nonionic
polymer chain that has to be of sufficient length in order to stabilize the particles by steric
repulsion. One important characteristic given by the long chained polymer is that it displays a
brush-like conformation on the particle surface, which might allow the AP to readily partition
and be embedded into the polymer brush structure (Luzinov et al., 2008). Moreover, considering
the amphiphilic nature of PVP polymers, the relatively high adsorption of AP to AgNPPVP
suggests that the binding might also be driven by hydrophilic interactions between PVP and the
functional groups displaying low hydrophobicity and located at the surface of the enzyme.
Difference in protein sorption to PVP- and CIT-coated AgNP were also found by others, though
the higher binding to PVP-coated nanoparticles was related to increased changes in protein
conformation upon interaction with the PVP polymer (Podila et al., 2012; Shannahan et al., 2013).
The lack of AP adsorption to the AgNPGEL might be a consequence of protein-protein repulsion.
GEL is a mixture of single- and multi-stranded polypeptides and proteins derived from collagen
and known to have little interactions with biomolecules, which makes GEL biocompatible
(Elzoghby, 2013). The low potential of GEL to interact with proteins is known and exploited for
the isolation of specific proteins displaying high affinity to GEL (Speziale et al., 2008). Thus, we
conclude that the characteristics of AP dot not allow for specific interactions and binding with
GEL proteins.
In order to capture the effects of AgNP on the activity of AP, we first examined the influence of
AgNO3, as many of the AgNP effects on heterotrophic and autotrophic aquatic organisms have
been attributed to dissolved Ag+ ions (Gil-Allue et al., 2015; Navarro et al., 2008b; Navarro et al.,
2015; Xiu et al., 2012). In our study, AP activity was not decreased even at the highest Ag+
concentration (Figure 4.5), which corresponded to the level of dissolved silver measured in the
AgNP suspensions (Navarro et al., 2015), suggesting a low sensitivity of the AP to Ag+ ions.
Effects of AgNP on enzyme activity were found to depend on the exposure concentration of
AgNP and the sequence of addition of AgNP and substrate to the enzyme, with inhibition
occurring only when AgNP were added to the enzyme-substrate complex (Figure 4.3 and Figure
77
Chapter 4 Interactions of differently coated silver nanoparticles with alkaline phosphatase
4.4). The mechanism of catalytic reaction of AP might explain the different effects of the AgNP.
The reaction involves formation of an enzyme-substrate intermediate in which the AP displays a
different conformation compared to the free enzyme (Coleman, 1992; Halford et al., 1969; Holtz
and Kantrowitz, 1999). We thus propose that the AgNP, irrespective of the coatings, interact
with the enzyme-substrate intermediate leading to a decreased activity. These results indicate
that the conformation of AP can influence its interaction with nanoparticles, which is in
agreement with previous studies showing the significant role of protein conformation in
determining adsorption to nanoparticles (Podila et al., 2012; Shannahan et al., 2013). In addition,
the lack of effects of AgNO3 together with the detected inhibitory effect of the AgNP indicate
particle-specific effects, as noted for some other extracellular enzymes (Gil-Allue et al., 2015;
Schug et al., 2014).
78
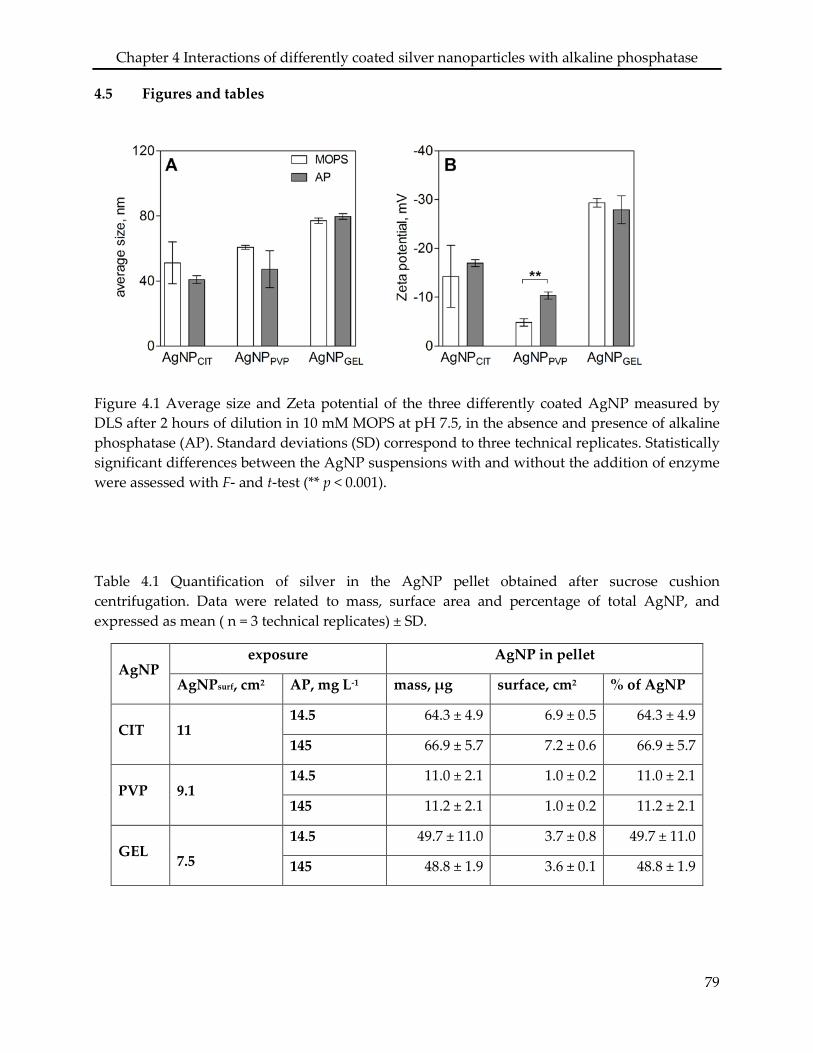
Chapter 4 Interactions of differently coated silver nanoparticles with alkaline phosphatase
4.5 Figures and tables
Figure 4.1 Average size and Zeta potential of the three differently coated AgNP measured by DLS after 2 hours of dilution in 10 mM MOPS at pH 7.5, in the absence and presence of alkaline phosphatase (AP). Standard deviations (SD) correspond to three technical replicates. Statistically significant differences between the AgNP suspensions with and without the addition of enzyme were assessed with F- and t-test (** p < 0.001).
Table 4.1 Quantification of silver in the AgNP pellet obtained after sucrose cushion centrifugation. Data were related to mass, surface area and percentage of total AgNP, and expressed as mean ( n = 3 technical replicates) ± SD.
AgNP exposure AgNP in pellet
AgNPsurf, cm2 AP, mg L-1 mass, µg surface, cm2 % of AgNP
CIT 11 14.5 64.3 ± 4.9 6.9 ± 0.5 64.3 ± 4.9
145 66.9 ± 5.7 7.2 ± 0.6 66.9 ± 5.7
PVP 9.1 14.5 11.0 ± 2.1 1.0 ± 0.2 11.0 ± 2.1
145 11.2 ± 2.1 1.0 ± 0.2 11.2 ± 2.1
GEL 7.5
14.5 49.7 ± 11.0 3.7 ± 0.8 49.7 ± 11.0
145 48.8 ± 1.9 3.6 ± 0.1 48.8 ± 1.9
79
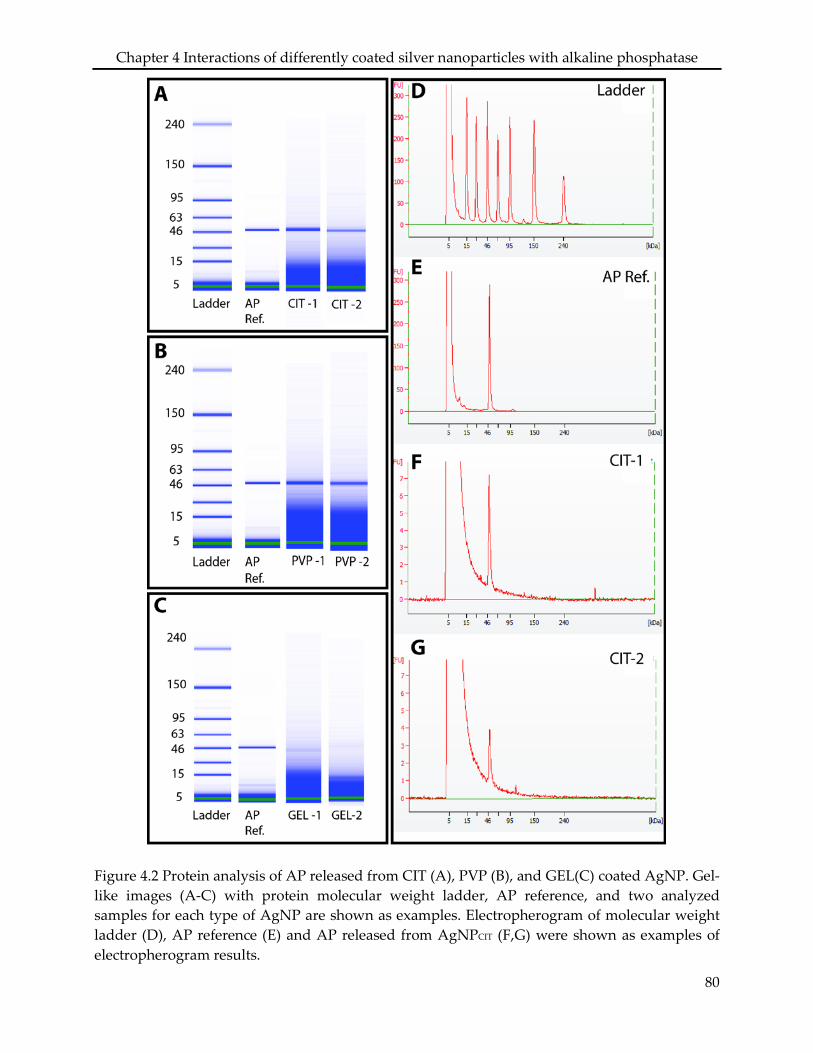
Chapter 4 Interactions of differently coated silver nanoparticles with alkaline phosphatase
Figure 4.2 Protein analysis of AP released from CIT (A), PVP (B), and GEL(C) coated AgNP. Gel-like images (A-C) with protein molecular weight ladder, AP reference, and two analyzed samples for each type of AgNP are shown as examples. Electropherogram of molecular weight ladder (D), AP reference (E) and AP released from AgNPCIT (F,G) were shown as examples of electropherogram results.
80
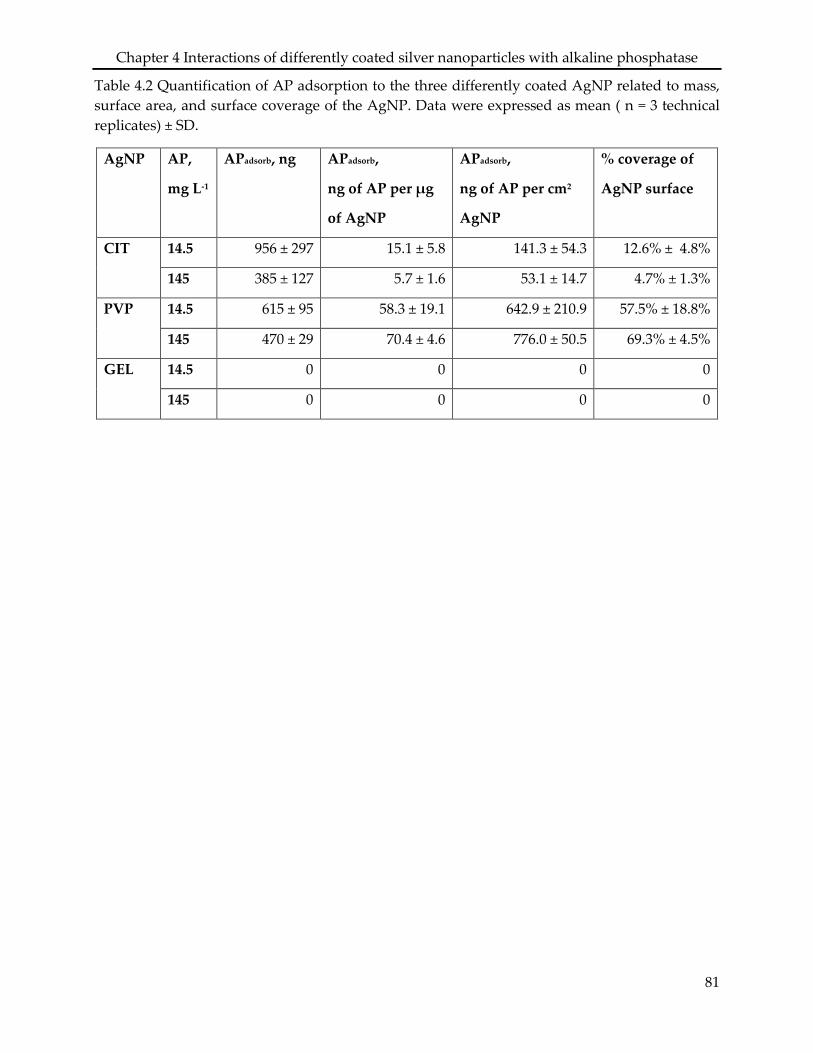
Chapter 4 Interactions of differently coated silver nanoparticles with alkaline phosphatase
Table 4.2 Quantification of AP adsorption to the three differently coated AgNP related to mass, surface area, and surface coverage of the AgNP. Data were expressed as mean ( n = 3 technical replicates) ± SD.
AgNP AP,
mg L-1
APadsorb, ng APadsorb,
ng of AP per µg
of AgNP
APadsorb,
ng of AP per cm2
AgNP
% coverage of
AgNP surface
CIT 14.5 956 ± 297 15.1 ± 5.8 141.3 ± 54.3 12.6% ± 4.8%
145 385 ± 127 5.7 ± 1.6 53.1 ± 14.7 4.7% ± 1.3%
PVP 14.5 615 ± 95 58.3 ± 19.1 642.9 ± 210.9 57.5% ± 18.8%
145 470 ± 29 70.4 ± 4.6 776.0 ± 50.5 69.3% ± 4.5%
GEL 14.5 0 0 0 0
145 0 0 0 0
81
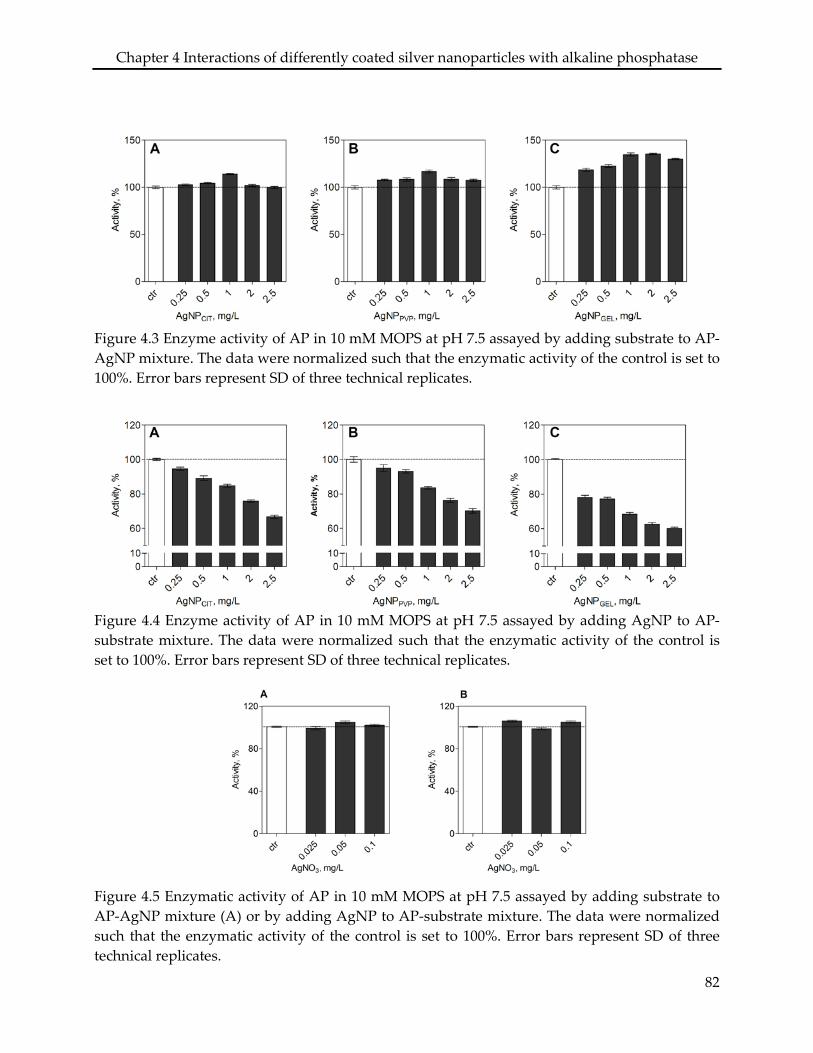
Chapter 4 Interactions of differently coated silver nanoparticles with alkaline phosphatase
Figure 4.3 Enzyme activity of AP in 10 mM MOPS at pH 7.5 assayed by adding substrate to AP-AgNP mixture. The data were normalized such that the enzymatic activity of the control is set to 100%. Error bars represent SD of three technical replicates.
Figure 4.4 Enzyme activity of AP in 10 mM MOPS at pH 7.5 assayed by adding AgNP to AP-substrate mixture. The data were normalized such that the enzymatic activity of the control is set to 100%. Error bars represent SD of three technical replicates.
Figure 4.5 Enzymatic activity of AP in 10 mM MOPS at pH 7.5 assayed by adding substrate to AP-AgNP mixture (A) or by adding AgNP to AP-substrate mixture. The data were normalized such that the enzymatic activity of the control is set to 100%. Error bars represent SD of three technical replicates.
82
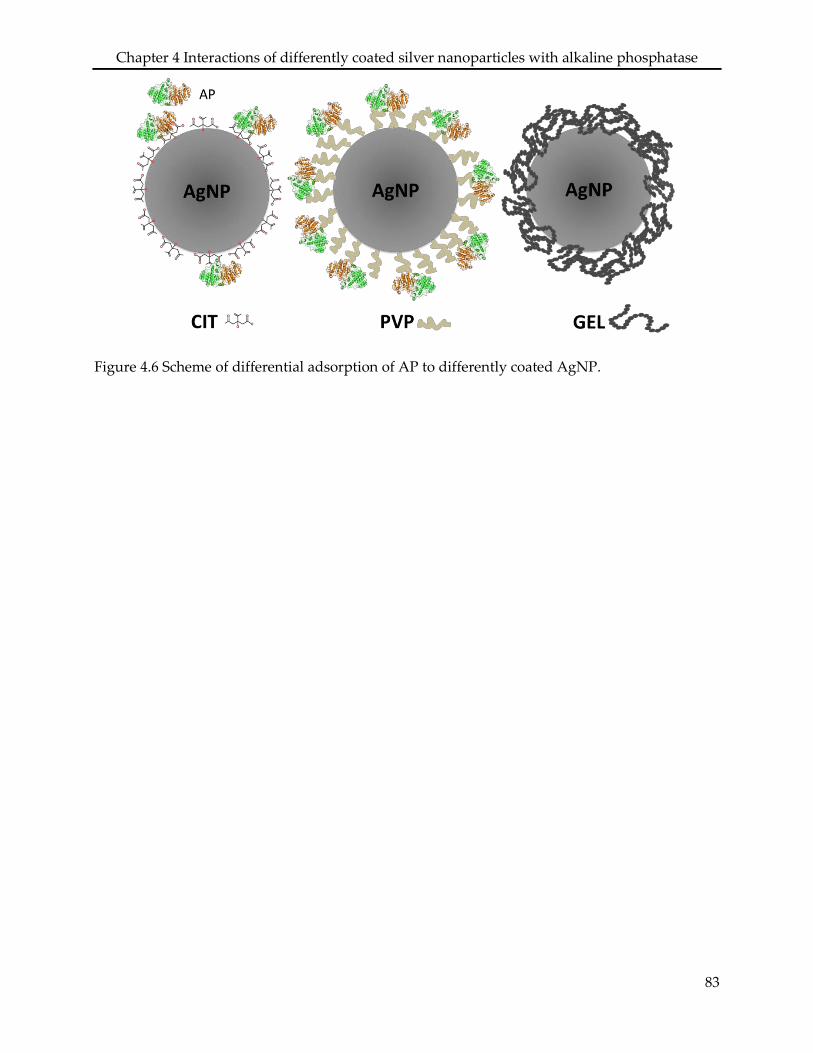
Chapter 4 Interactions of differently coated silver nanoparticles with alkaline phosphatase
Figure 4.6 Scheme of differential adsorption of AP to differently coated AgNP.
83
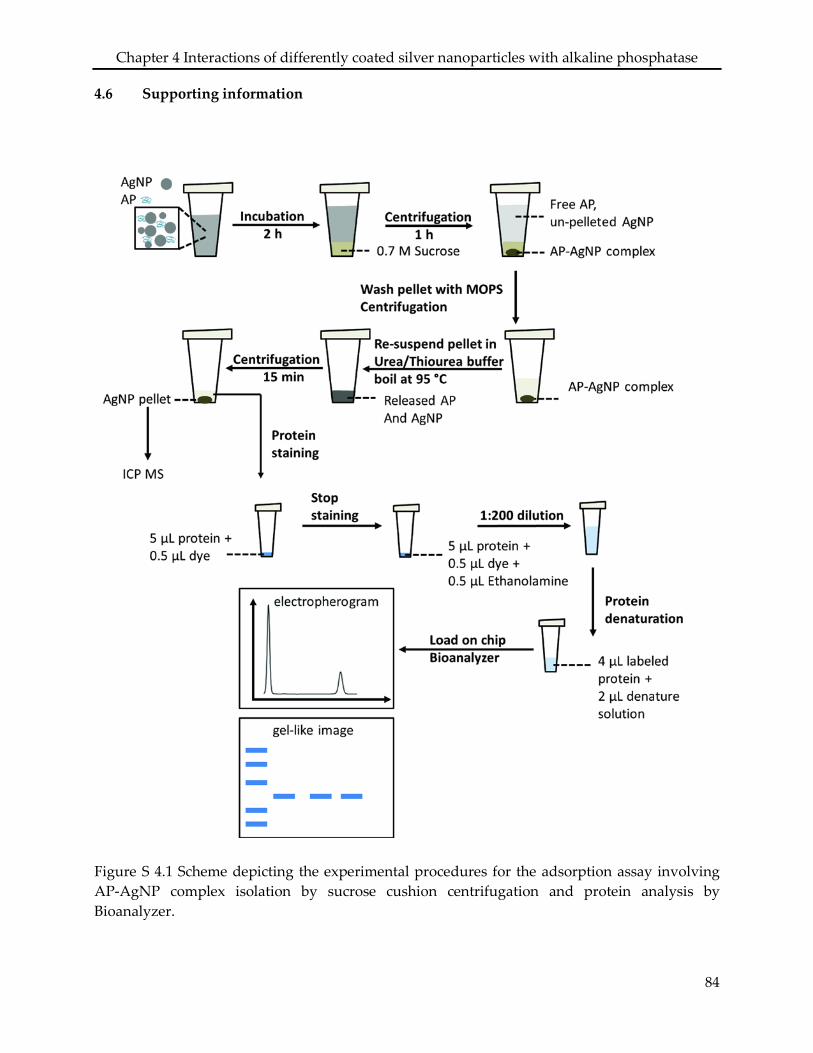
Chapter 4 Interactions of differently coated silver nanoparticles with alkaline phosphatase
4.6 Supporting information
Figure S 4.1 Scheme depicting the experimental procedures for the adsorption assay involving AP-AgNP complex isolation by sucrose cushion centrifugation and protein analysis by Bioanalyzer.
84
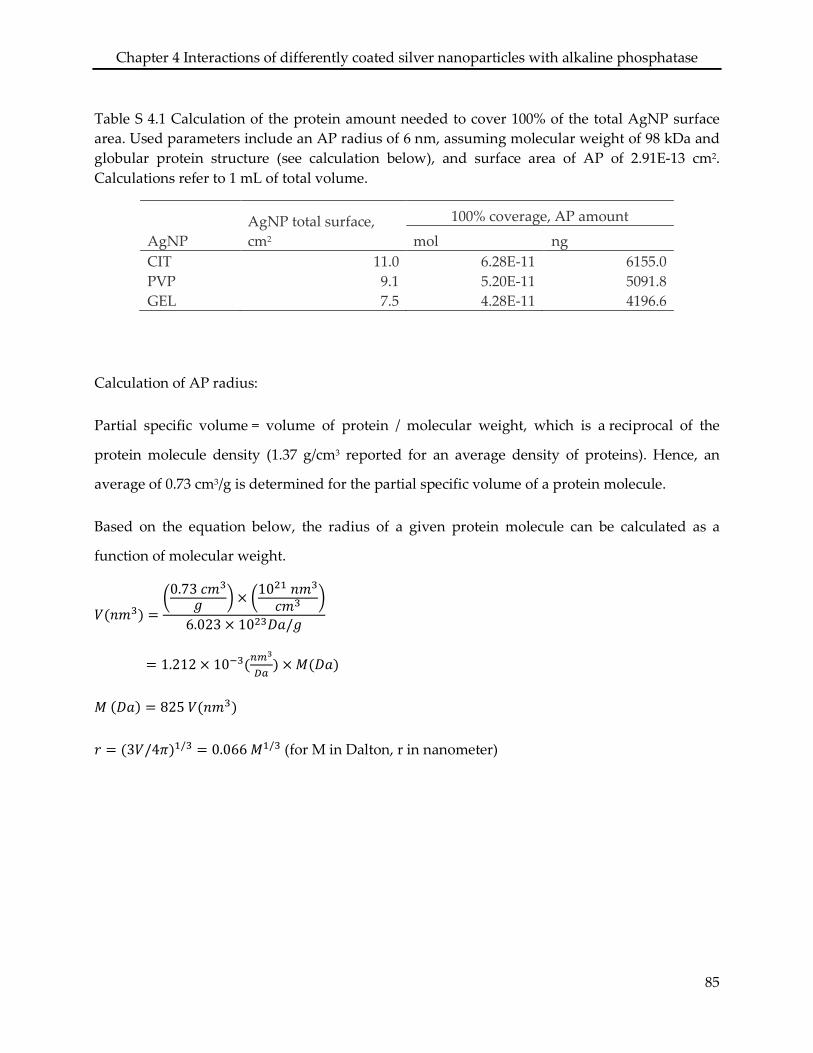
Chapter 4 Interactions of differently coated silver nanoparticles with alkaline phosphatase
Table S 4.1 Calculation of the protein amount needed to cover 100% of the total AgNP surface area. Used parameters include an AP radius of 6 nm, assuming molecular weight of 98 kDa and globular protein structure (see calculation below), and surface area of AP of 2.91E-13 cm2. Calculations refer to 1 mL of total volume.
AgNP AgNP total surface, cm2
100% coverage, AP amount
mol ng CIT 11.0 6.28E-11 6155.0 PVP 9.1 5.20E-11 5091.8 GEL 7.5 4.28E-11 4196.6
Calculation of AP radius:
Partial specific volume = volume of protein / molecular weight, which is a reciprocal of the
protein molecule density (1.37 g/cm3 reported for an average density of proteins). Hence, an
average of 0.73 cm3/g is determined for the partial specific volume of a protein molecule.
Based on the equation below, the radius of a given protein molecule can be calculated as a
function of molecular weight.
𝑉𝑉(𝑛𝑛𝑚𝑚3) =�0.73 𝑐𝑐𝑚𝑚3
𝑔𝑔 �× �1021 𝑛𝑛𝑚𝑚3
𝑐𝑐𝑚𝑚3 �
6.023 × 10²³𝐷𝐷𝐷𝐷/𝑔𝑔
= 1.212 × 10⁻³(𝑛𝑛𝑛𝑛3
𝐷𝐷𝐷𝐷) ×𝑀𝑀(𝐷𝐷𝐷𝐷)
𝑀𝑀 (𝐷𝐷𝐷𝐷) = 825 𝑉𝑉(𝑛𝑛𝑚𝑚3)
𝑟𝑟 = (3𝑉𝑉/4𝜋𝜋)1/3 = 0.066 𝑀𝑀1/3 (for M in Dalton, r in nanometer)
85

86
Chapter 5 Outlook This thesis gathered information on interactions of nanoparticles with algae. It was shown that
in the freshwater algae Euglena gracilis, silver nanoparticles (AgNP) affected photosynthesis and
cell morphology due to released Ag+ ions. AgNP were not evidenced to be internalized by this
algae, though association of particles with the algal cells was found. The absence of particle
uptake in algae was confirmed using polystyrene nanoparticles (PSNP) and four different algal
strains, E. gracilis, Haemotococcus pluvialis, Chlamydomonas reinhardtii wild type and cell wall free
mutant. Further, the extracellular enzyme alkaline phosphatase did adsorb to AgNP though the
sorption was largely dependent on the particle coatings. The enzymatic activity was decreased
by the AgNP upon interactions with the enzyme-substrate intermediate. In the following
chapter, several questions arising from this thesis work are discussed.
5.1 Uptake of nanoparticles in algae
The uptake experiments with citrate-coated AgNP (chapter 2) and the confocal laser scanning
microscopy (CLSM) examinations of PSNP (chapter 3) did not evidence particle uptake in algae,
though interactions of PSNP were found to differ across the selected algal strains. Both studies
used nanoparticles of average diameters of 50 nm or larger, however, uptake of smaller sized
nanoparticles could not be excluded.
To address this question, uptake experiments can be carried out by exposing algae to fluorescent
PSNP of less than 10 nm and assessed using CLSM. This techniques allows to visualize whether
the particles are localized on or inside the cells upon z-stack imaging and 3D analysis, yet due to
the resolution of light microscopy, the visualization of small PSNP would be possible only when
a cluster of nanoparticles were internalized simultaneously. Particular attention should be given
to the spectral properties of experimental PSNP and autofluorescence of algae pigments to
enable particle detection by CLSM. The ideal PSNP would have fluorescent spectrum with least
overlapping with the spectrum of the autofluorescence from algae pigments. Alternatively,
algae can be exposed to metal-based nanoparticles of less than 10 nm in diameter, and followed
by metal analysis with inductively coupled plasma mass spectrometry (ICP MS). In case of
87
Chapter 5 Outlook
particles displaying solubility, ICP MS measurements on nanoparticle exposed samples do not
allow to determine whether the analyzed metal is derived from the particles or the metal ions
which were present in the particle suspension. Parallel uptake experiments with metal ion could
be carried out, and the difference at the same level of metal ion concentration in the particle
suspensions could indicate the metal derived from the particles (Behra et al., 2013). To avoid the
contribution of metal ions to ICP MS measurements in uptake experiments, metal-based
nanoparticles with low solubility as for instance gold nanoparticles seem more appropriate.
The surface distribution of nanoparticles on algae can be investigated using time-of-flight
secondary ion mass spectrometry (TOF-SIMS), which as shown in Chapter 2 provides
information on both chemical analysis and lateral distribution of the metals. Transmission
electron microscopy (TEM) can be used to examine whether particles internalized in cells. Yet,
the imaging by TEM requires tedious work to gain statistically meaningful data, thus is not
feasible to systematically assess uptake of a large number of nanoparticles in different algae
species.
Since the size of pores that span through cell walls is expected to influence whether a particle
can be internalized, it is also of relevance to determine typical pore sizes of cell walls of the algae
of interest. Fluorescent dextran conjugates in several molecular weight ranges are commercially
available and could be used for algae exposures and their cellular localization assessed by CLSM.
5.2 Interactions of nanoparticles with algal cell walls
In chapter 3, it was shown that PSNP were associated with extracellular molecules secreted by
algae, such as mucilage, gelatinous matrix, and extracellular polymeric substances (EPS). These
molecules determined the distribution of PSNP through their localization on cell surface or in
the exposure medium. Thus, it remains unclear whether PSNP were directly in contact with the
cell wall or associated through interaction with extracellular molecules on the outer surface.
Upon selection of appropriate molecular probes that would enable imaging cell walls, the
plasma membrane, and extracellular molecules by CLSM, and their use to stain algae exposed to
fluorescent PSNP, would allow to clarify this question. The possibility of using the CLSM in
88
Chapter 5 Outlook
sequential multi-channel mode would allow to record multi-markers in separate channels
without cross talking.
Various fluorescent probes have been exploited for staining cell wall, plasma membrane, and
extracellular molecules. It has been reported that a whole range of fluorescently labeled lectins
can efficiently stain glycoconjugates, and have been used to characterize a wide range of cell
walls and EPS in biofilms (Johnsen et al., 2000; Michael and Smith, 1995). Glycoconjugates are
commonly present in many algal cell walls, the plasma membrane, and extracellular molecules,
and thus can be used as targets for lectin probes in algae. Depending on the type of glycoprotein
and its abundance in the examined algae, a screening of all the commercially available lectin
probes should carried out as an initial step, in order to evaluate the specificity of staining and
select lectins suitable for the specific glycoconjugates present in a particular sample (Peltola et al.,
2008; Zippel and Neu, 2011). For plasma membrane staining, there are other probes available to
generally stain all types of membrane, without testing lectin specificity (Cogger et al., 2010; Jiang
et al., 2010). Moreover, the fluorescence conjugated to the probes should be chosen to avoid
cross talk of signals given by the staining, PSNP and autofluorescent algal pigments.
5.3 Nanoparticle interactions with extracellular molecules
In chapter 4, it was shown that the adsorption of alkaline phosphatase, as a representative of
extracellular enzymes, to AgNP depended on the physicochemical properties of particle
coatings and the enzyme. Despite various forces present at the interface of the particles and
enzyme, which might potentially facilitate the sorption of the enzyme to AgNP, low sorption
was determined in all cases in our study. In aquatic environments, extracellular enzymes play
an important role in nutrient acquisition for many organisms, therefore it is of interest to further
study interactions of nanoparticles with other types of enzymes. In addition to extracellular
enzymes, other molecules secreted and released by aquatic organisms could also be studied, due
to their extracellular localization and likely contact with nanoparticles.
Interactions of nanoparticles with other extracellular enzymes in heterotrophic and autotrophic
biofilms have been suggested in previous studies (Gil-Allue et al., 2015; Schug et al., 2014). It is
thus of particular interest to examine the sorption of these enzymes to AgNP, as well as the
89
Chapter 5 Outlook
influence of particle coatings on adsorption. For instance, leucine aminopeptidase is a
commonly analyzed extracellular enzyme in biofilms involved in the degradation of peptide.
Inhibition of leucine aminopeptidase activity by AgNP has been shown to be caused by particle-
specific effects (Gil-Allue et al., 2015), indicating a direct particle interaction with the enzyme. To
assess the interactions of nanoparticles with other extracellular enzymes, commercially available
isolated enzymes could be used, and sorption experiments would be carried out using the same
techniques as applied in the sorption study in this thesis (chapter 4). Since the sorption assay
requires the enzyme to be pure enough for the analysis and quantification, the purity of the
enzyme should be evaluated before incubating with nanoparticles using the Bioanalyzer.
Impure enzymes should be further purified.
Interactions of nanoparticles with other extracellular molecules, like EPS produced from a single
algae species (chapter 3) or a biofilm have also been reported (Kroll et al., 2014). EPS contain
mainly polysaccharides, proteins, lipids and low molecular weight acids, and maintain the
mechanical stability of biofilm and protect organisms against pollution toxicity (Cogan and
Keener, 2004; Stewart et al., 2013). Determining which EPS components do adsorb to
nanoparticles is of great importance to evaluate particle fate, transport and toxicity in aquatic
environments. For exploring nanoparticle interactions with EPS, the EPS should be first
separated from the biomass using centrifugation, and then incubated with the nanoparticles.
The EPS-nanoparticle complex can be isolated using sucrose cushion centrifugation (chapter 4),
and then the EPS can be released and analyzed. Since the EPS contain a high level of
polysaccharide, and the Bioanalyzer cannot be used to efficiently separate the proteins with high
saccharide background, a label-free quantitative analysis approach, i.e. electrospray liquid
chromatography mass spectrometry (LC MS/MS) could be applied to identify the molecules
with high binding to the particles.
90
References Adams, N. W. H., Kramer, J. R., 1999a. Potentiometric determination of silver thiolate formation
constants using a Ag2S electrode. Aquatic Geochemistry. 5, 1-11. Adams, N. W. H., Kramer, J. R., 1999b. Silver speciation in wastewater effluent, surface waters,
and pore waters. Environmental Toxicology and Chemistry. 18, 2667-2673. Albanese, A., et al., 2014. Secreted Biomolecules Alter the Biological Identity and Cellular
Interactions of Nanoparticles. Acs Nano. 8, 5515-5526. Amendola, V., Meneghetti, M., 2009. Size Evaluation of Gold Nanoparticles by UV-vis
Spectroscopy. Journal of Physical Chemistry C. 113, 4277-4285. Amro, N. A., et al., 2000. High-resolution atomic force microscopy studies of the Escherichia coli
outer membrane: Structural basis for permeability. Langmuir. 16, 2789-2796. Aruoja, V., et al., 2009. Toxicity of nanoparticles of CuO, ZnO and TiO2 to microalgae
Pseudokirchneriella subcapitata. Science of the Total Environment. 407, 1461-1468. Aschberger, K., et al., 2011. Analysis of currently available data for characterising the risk of
engineered nanomaterials to the environment and human health - Lessons learned from four case studies. Environment International. 37, 1143-1156.
Auffan, M., et al., 2009. Towards a definition of inorganic nanoparticles from an environmental, health and safety perspective. Nature Nanotechnology. 4, 634-641.
Barwal, I., et al., 2011. Cellular oxido-reductive proteins of Chlamydomonas reinhardtii control the biosynthesis of silver nanoparticles. Journal of Nanobiotechnology. 9.
Behra, R., Krug, H., 2008. Nanoecotoxicology - Nanoparticles at large. Nature Nanotechnology. 3, 253-254.
Behra, R., et al., 2013. Bioavailability of silver nanoparticles and ions: from a chemical and biochemical perspective. Journal of the Royal Society Interface. 10.
Bellezza, F., et al., 2009. Structure and Catalytic Behavior of Myoglobin Adsorbed onto Nanosized Hydrotalcites. Langmuir. 25, 10918-10924.
Bellezza, F., et al., 2007. Structure, stability, and activity of myoglobin adsorbed onto phosphate-grafted zirconia nanoparticles. Langmuir. 23, 13007-13012.
Benetti, F., et al., 2013. Gold nanoparticles: role of size and surface chemistry on blood protein adsorption. Journal of Nanoparticle Research. 15.
Benn, T. M., Westerhoff, P., 2008. Nanoparticle silver released into water from commercially available sock fabrics. Environmental Science & Technology. 42, 4133-4139.
Bertoli, F., et al., 2014. Magnetic Nanoparticles to Recover Cellular Organelles and Study the Time Resolved Nanoparticle-Cell Interactome throughout Uptake. Small. 10, 3307-3315.
Bhattacharya, P., et al., 2010. Physical Adsorption of Charged Plastic Nanoparticles Affects Algal Photosynthesis. Journal of Physical Chemistry C. 114, 16556-16561.
Blaser, S. A., et al., 2008. Estimation of cumulative aquatic exposure and risk due to silver: Contribution of nano-functionalized plastics and textiles. Science of the Total Environment. 390, 396-409.
Boisselier, E., Astruc, D., 2009. Gold nanoparticles in nanomedicine: preparations, imaging, diagnostics, therapies and toxicity. Chemical Society Reviews. 38, 1759-1782.
91
References
Bondarenko, O., et al., 2013. Toxicity of Ag, CuO and ZnO nanoparticles to selected environmentally relevant test organisms and mammalian cells in vitro: a critical review. Archives of Toxicology. 87, 1181-1200.
Bottero, J. Y., et al., 2011. Manufactured metal and metal-oxide nanoparticles: Properties and perturbing mechanisms of their biological activity in ecosystems. Comptes Rendus Geoscience. 343, 168-176.
Boucle, J., Ackermann, J., 2012. Solid-state dye-sensitized and bulk heterojunction solar cells using TiO2 and ZnO nanostructures: recent progress and new concepts at the borderline. Polymer International. 61, 355-373.
Burchardt, A. D., et al., 2012. Effects of Silver Nanoparticles in Diatom Thalassiosira pseudonana and Cyanobacterium Synechococcus sp. Environmental Science & Technology. 46, 11336-11344.
Cardinale, B. J., et al., 2012. Effects of TiO2 nanoparticles on the growth and metabolism of three species of freshwater algae. Journal of Nanoparticle Research. 14.
Chen, X., Schluesener, H. J., 2008. Nanosilver: A nanoproduct in medical application. Toxicology Letters. 176, 1-12.
Choi, O., Hu, Z. Q., 2008. Size dependent and reactive oxygen species related nanosilver toxicity to nitrifying bacteria. Environmental Science & Technology. 42, 4583-4588.
Cogan, N. G., Keener, J. P., 2004. The role of the biofilm matrix in structural development. Mathematical Medicine and Biology-a Journal of the Ima. 21, 147-166.
Cogger, V. C., et al., 2010. Three-dimensional structured illumination microscopy of liver sinusoidal endothelial cell fenestrations. J Struct Biol. 171, 382-8.
Cole, G. T., Wynne, M. J., 1974. Endocytosis of Microcystis-Aeruginosa by Ochromonas-Danica. Journal of Phycology. 10, 397-410.
Coleman, J. E., 1992. Structure and mechanism of alkaline phosphatase. Annu Rev Biophys Biomol Struct. 21, 441-83.
Cruenberger, C., Atomic Force Microscopy of the alga Euglena gracilis. Wien, 2007. Czeslik, C., Winter, R., 2001. Effect of temperature on the conformation of lysozyme adsorbed to
silica particles. Physical Chemistry Chemical Physics. 3, 235-239. Deng, Z. J., et al., 2013. Plasma protein binding of positively and negatively charged polymer-
coated gold nanoparticles elicits different biological responses. Nanotoxicology. 7, 314-322.
Denobel, J. G., Barnett, J. A., 1991. Passage of Molecules through Yeast-Cell Walls - a Brief Essay-Review. Yeast. 7, 313-323.
Dewez, D., Oukarroum, A., 2012. Silver nanoparticles toxicity effect on photosystem II photochemistry of the green alga Chlamydomonas reinhardtii treated in light and dark conditions. Toxicological and Environmental Chemistry. 94, 1536-1546.
Ding, F., et al., 2013. Direct observation of a single nanoparticle-ubiquitin corona formation. Nanoscale. 5, 9162-9169.
Dobias, J., Bernier-Latmani, R., 2013. Silver Release from Silver Nanoparticles in Natural Waters. Environmental Science & Technology. 47, 4140-4146.
Domozych, D. S., et al., 2012. The cell walls of green algae: a journey through evolution and diversity. Frontiers in Plant Science. 3.
Draude, F., et al., 2013. ToF-SIMS and Laser-SNMS analysis of macrophages after exposure to silver nanoparticles. Surface and Interface Analysis. 45, 286-289.
92
References
Dudkiewicz, A., et al., 2011. Characterization of nanomaterials in food by electron microscopy. Trac-Trends in Analytical Chemistry. 30, 28-43.
Eigenheer, R., et al., 2014. Silver nanoparticle protein corona composition compared across engineered particle properties and environmentally relevant reaction conditions. Environmental Science-Nano. 1, 238-247.
El Badawy, A. M., et al., 2010. Impact of Environmental Conditions (pH, Ionic Strength, and Electrolyte Type) on the Surface Charge and Aggregation of Silver Nanoparticles Suspensions. Environmental Science & Technology. 44, 1260-1266.
Elzoghby, A. O., 2013. Gelatin-based nanoparticles as drug and gene delivery systems: Reviewing three decades of research. Journal of Controlled Release. 172, 1075-1091.
Fabrega, J., et al., 2009. Silver Nanoparticle Impact on Bacterial Growth: Effect of pH, Concentration, and Organic Matter. Environmental Science & Technology. 43, 7285-7290.
Fabrega, J., et al., 2011a. Silver nanoparticles: Behaviour and effects in the aquatic environment. Environment International. 37, 517-531.
Fabrega, J., et al., 2011b. Impact of silver nanoparticles on natural marine biofilm bacteria. Chemosphere. 85, 961-966.
Fleischer, A., et al., 1999. The pore size of non-graminaceous plant cell walls is rapidly decreased by borate ester cross-linking of the pectic polysaccharide rhamnogalacturonan II. Plant Physiology. 121, 829-838.
Fleischer, C. C., Payne, C. K., 2014. Nanoparticle-Cell Interactions: Molecular Structure of the Protein Corona and Cellular Outcomes. Accounts of Chemical Research. 47, 2651-2659.
Franklin, N. M., et al., 2007. Comparative toxicity of nanoparticulate ZnO, bulk ZnO, and ZnCl2 to a freshwater microalga (Pseudokirchneriella subcapitata): The importance of particle solubility. Environmental Science & Technology. 41, 8484-8490.
Froggett, S. J., et al., 2014. A review and perspective of existing research on the release of nanomaterials from solid nanocomposites. Particle and Fibre Toxicology. 11.
Fujishima, A., et al., 2008. TiO2 photocatalysis and related surface phenomena. Surface Science Reports. 63, 515-582.
Garen, A., Levinthal, C., 1960. A Fine-Structure Genetic and Chemical Study of the Enzyme Alkaline Phosphatase of E-Coli .1. Purification and Characterization of Alkaline Phosphatase. Biochimica Et Biophysica Acta. 38, 470-483.
Ge, C. C., et al., 2015. Towards understanding of nanoparticle-protein corona. Archives of Toxicology. 89, 519-539.
Gil-Allue, C., et al., 2015. Silver Nanoparticle Effects on Stream Periphyton During Short-Term Exposures. Environmental Science & Technology. 49, 1165-1172.
Giri, K., et al., 2014. Understanding Protein-Nanoparticle Interaction: A New Gateway to Disease Therapeutics. Bioconjugate Chemistry. 25, 1078-1090.
Gottschalk, F., Nowack, B., 2011. The release of engineered nanomaterials to the environment. Journal of Environmental Monitoring. 13, 1145-1155.
Gottschalk, F., et al., 2009. Modeled Environmental Concentrations of Engineered Nanomaterials (TiO2, ZnO, Ag, CNT, Fullerenes) for Different Regions. Environmental Science & Technology. 43, 9216-9222.
Gottschalk, F., et al., 2010. Possibilities and Limitations of Modeling Environmental Exposure to Engineered Nanomaterials by Probabilistic Material Flow Analysis. Environmental Toxicology and Chemistry. 29, 1036-1048.
93
References
Gunawan, C., et al., 2014. Nanoparticle-protein corona complexes govern the biological fates and functions of nanoparticles. Journal of Materials Chemistry B. 2, 2060-2083.
Gupta, A. K., Gupta, M., 2005. Synthesis and surface engineering of iron oxide nanoparticles for biomedical applications. Biomaterials. 26, 3995-4021.
Haase, A., et al., 2011. Application of Laser Postionization Secondary Neutral Mass Spectrometry/Time-of-Flight Secondary Ion Mass Spectrometry in Nanotoxicology: Visualization of Nanosilver in Human Macrophages and Cellular Responses. Acs Nano. 5, 3059-3068.
Hagen, C., et al., 2002. Ultrastructural and chemical changes in the cell wall of Haematococcus pluvialis (Volvocales, Chlorophyta) during aplanospore formation. European Journal of Phycology. 37, 217-226.
Hagenhoff, B., et al., 2013. Detection of micro- and nano-particles in animal cells by ToF-SIMS 3D analysis. Surface and Interface Analysis. 45, 315-319.
Halford, S. E., et al., 1969. A substate-induced conformation change in the reaction of alkaline phosphatase from Escherichia coli. Biochem J. 114, 243-51.
Handy, R. D., et al., 2012. Practical considerations for conducting ecotoxicity test methods with manufactured nanomaterials: what have we learnt so far? Ecotoxicology. 21, 933-972.
Hartmann, N. B., et al., 2013. The challenges of testing metal and metal oxide nanoparticles in algal bioassays: titanium dioxide and gold nanoparticles as case studies. Nanotoxicology. 7, 1082-1094.
Hartmann, N. B., et al., 2010. Algal testing of titanium dioxide nanoparticles-Testing considerations, inhibitory effects and modification of cadmium bioavailability. Toxicology. 269, 190-197.
He, D., et al., 2012. Silver Nanoparticle-Algae Interactions: Oxidative Dissolution, Reactive Oxygen Species Generation and Synergistic Toxic Effects. Environmental Science & Technology. 46, 8731-8738.
Heredia, A., et al., 1993. Plant-Cell Wall Structure. Revista Espanola De Ciencia Y Tecnologia De Alimentos. 33, 113-131.
Hofmann, D., et al., 2014. Mass Spectrometry and Imaging Analysis of Nanoparticle-Containing Vesicles Provide a Mechanistic Insight into Cellular Trafficking. Acs Nano. 8, 10077-10088.
Holtz, K. M., Kantrowitz, E. R., 1999. The mechanism of the alkaline phosphatase reaction: insights from NMR, crystallography and site-specific mutagenesis. FEBS Lett. 462, 7-11.
Huynh, K. A., Chen, K. L., 2011. Aggregation Kinetics of Citrate and Polyvinylpyrrolidone Coated Silver Nanoparticles in Monovalent and Divalent Electrolyte Solutions. Environmental Science & Technology. 45, 5564-5571.
Jansson, M., et al., 1988. Phosphatases - Origin, Characteristics and Function in Lakes. Hydrobiologia. 170, 157-175.
Jegadeesan, G., et al., 2010. Arsenic sorption on TiO2 nanoparticles: Size and crystallinity effects. Water Research. 44, 965-973.
Jiang, X., et al., 2010. Quantitative analysis of the protein corona on FePt nanoparticles formed by transferrin binding. J R Soc Interface. 7 Suppl 1, S5-S13.
Johnsen, A. R., et al., 2000. Evaluation of fluorescently labeled lectins for noninvasive localization of extracellular polymeric substances in Sphingomonas biofilms. Applied and Environmental Microbiology. 66, 3487-3491.
94
References
Kaegi, R., et al., 2010. Release of silver nanoparticles from outdoor facades. Environmental Pollution. 158, 2900-2905.
Kahru, A., Dubourguier, H. C., 2010. From ecotoxicology to nanoecotoxicology. Toxicology. 269, 105-119.
Kakinen, A., et al., 2013. Interaction of firefly luciferase and silver nanoparticles and its impact on enzyme activity. Nanotechnology. 24.
Keller, A. A., et al., 2013. Global life cycle releases of engineered nanomaterials. Journal of Nanoparticle Research. 15.
Khan, S. S., et al., 2011a. Impact of exopolysaccharides on the stability of silver nanoparticles in water. Water Research. 45, 5184-5190.
Khan, S. S., et al., 2011b. Interaction of colloidal silver nanoparticles (SNPs) with exopolysaccharides (EPS) and its adsorption isotherms and kinetics. Colloids and Surfaces a-Physicochemical and Engineering Aspects. 381, 99-105.
Khan, S. S., et al., 2011c. Interaction of silver nanoparticles (SNPs) with bacterial extracellular proteins (ECPs) and its adsorption isotherms and kinetics. Journal of Hazardous Materials. 192, 299-306.
Knox, J. P., 1995. The Extracellular-Matrix in Higher-Plants .4. Developmentally-Regulated Proteoglycans and Glycoproteins of the Plant-Cell Surface. Faseb Journal. 9, 1004-1012.
Kondo, A., et al., 1993. Kinetic and Circular-Dichroism Studies of Enzymes Adsorbed on Ultrafine Silica Particles. Applied Microbiology and Biotechnology. 39, 726-731.
Kroll, A., et al., 2014. Extracellular Polymeric Substances (EPS) of Freshwater Biofilms Stabilize and Modify CeO2 and Ag Nanoparticles. Plos One. 9.
Kuhn, D. A., et al., 2014. Different endocytotic uptake mechanisms for nanoparticles in epithelial cells and macrophages. Beilstein Journal of Nanotechnology. 5, 1625-1636.
Kuhnel, D., et al., 2009. Agglomeration of tungsten carbide nanoparticles in exposure medium does not prevent uptake and toxicity toward a rainbow trout gill cell line. Aquatic Toxicology. 93, 91-99.
Leander, B. S., et al., 2007. Macroevolution of complex cytoskeletal systems in euglenids. Bioessays. 29, 987-1000.
Leander, B. S., Farmer, M. A., 2000. Comparative morphology of the euglenid pellicle. I. Patterns of strips and pores. Journal of Eukaryotic Microbiology. 47, 469-479.
Leander, B. S., Farmer, M. A., 2001. Comparative morphology of the euglenid pellicle. II. Diversity of strip substructure. Journal of Eukaryotic Microbiology. 48, 202-217.
Leander, B. S., et al., 2001. Trends in the evolution of the euglenid pellicle. Evolution. 55, 2215-2235.
Leclerc, S., Wilkinson, K. J., 2014. Bioaccumulation of Nanosilver by Chlamydomonas reinhardtii-Nanoparticle or the Free Ion? Environmental Science & Technology. 48, 358-364.
Lee, P. L., et al., 2014. Development and validation of TOF-SIMS and CLSM imaging method for cytotoxicity study of ZnO nanoparticles in HaCaT cells. Journal of Hazardous Materials. 277, 3-12.
Lee, W. M., An, Y. J., 2013. Effects of zinc oxide and titanium dioxide nanoparticles on green algae under visible, UVA, and UVB irradiations: no evidence of enhanced algal toxicity under UV pre-irradiation. Chemosphere. 91, 536-44.
95
References
Lee, Y. J., et al., 2012. Ion-release kinetics and ecotoxicity effects of silver nanoparticles. Environmental Toxicology and Chemistry. 31, 155-159.
Leforttran, M., et al., 1980. Euglena Plasma-Membrane during Normal and Vitamin-B12 Starvation Growth. Journal of Cell Science. 41, 245-261.
Levard, C., et al., 2012. Environmental Transformations of Silver Nanoparticles: Impact on Stability and Toxicity. Environmental Science & Technology. 46, 6900-6914.
Linse, S., et al., 2007. Nucleation of protein fibrillation by nanoparticles. Proceedings of the National Academy of Sciences of the United States of America. 104, 8691-8696.
Lorenz, C., et al., 2012. Characterization of silver release from commercially available functional (nano)textiles. Chemosphere. 89, 817-824.
Luck, D., et al., 1977. Flagellar Mutants of Chlamydomonas - Studies of Radial Spoke-Defective Strains by Dikaryon and Revertant Analysis. Proceedings of the National Academy of Sciences of the United States of America. 74, 3456-3460.
Lundqvist, M., et al., 2008. Nanoparticle size and surface properties determine the protein corona with possible implications for biological impacts. Proceedings of the National Academy of Sciences of the United States of America. 105, 14265-14270.
Luo, P., et al., 2013. Visualization and characterization of engineered nanoparticles in complex environmental and food matrices using atmospheric scanning electron microscopy. Journal of Microscopy. 250, 32-41.
Luzinov, I., et al., 2008. Responsive brush layers: from tailored gradients to reversibly assembled nanoparticles. Soft Matter. 4, 714-725.
Lynch, I., et al., 2007. The nanoparticle - protein complex as a biological entity; a complex fluids and surface science challenge for the 21st century. Advances in Colloid and Interface Science. 134-35, 167-174.
Lynch, I., Dawson, K. A., 2008. Protein-nanoparticle interactions. Nano Today. 3, 40-47. Ma, S., et al., 2015. Heteroagglomeration of Oxide Nanoparticles with Algal Cells: Effects of
Particle Type, Ionic Strength and pH. Environmental Science & Technology. 49, 932-939. Machado, M. D., Soares, E. V., 2015. Use of a fluorescence-based approach to assess short-term
responses of the alga Pseudokirchneriella subcapitata to metal stress. Journal of Applied Phycology. 27, 805-813.
Mahmoudi, M., et al., 2011. Protein-Nanoparticle Interactions: Opportunities and Challenges. Chemical Reviews. 111, 5610-5637.
Meissner, T., et al., 2010. Physical-chemical characterization of tungsten carbide nanoparticles as a basis for toxicological investigations. Nanotoxicology. 4, 196-206.
Miao, A. J., et al., 2010. Intracellular Uptake: A Possible Mechanism for Silver Engineered Nanoparticle Toxicity to a Freshwater Alga Ochromonas danica. Plos One. 5.
Miao, A. J., et al., 2009. The algal toxicity of silver engineered nanoparticles and detoxification by exopolymeric substances. Environmental Pollution. 157, 3034-3041.
Michael, T., Smith, C. M., 1995. Lectins Probe Molecular Films in Biofouling - Characterization of Early Films on Nonliving and Living Surfaces. Marine Ecology Progress Series. 119, 229-236.
Misra, S. K., et al., 2012. The complexity of nanoparticle dissolution and its importance in nanotoxicological studies. Science of the Total Environment. 438, 225-232.
Mitchell, D. R., 2000. Chlamydomonas flagella. Journal of Phycology. 36, 261-273.
96
References
Mitrano, D. M., et al., 2014. Presence of Nanoparticles in Wash Water from Conventional Silver and Nano-silver Textiles. Acs Nano. 8, 7208-7219.
Monk, B. C., et al., 1983. Topography of Chlamydomonas - Fine-Structure and Polypeptide Components of the Gametic Flagellar Membrane-Surface and the Cell-Wall. Planta. 158, 517-533.
Monopoli, M. P., et al., 2012. Biomolecular coronas provide the biological identity of nanosized materials. Nature Nanotechnology. 7, 779-786.
Montes-Burgos, I., et al., 2010. Characterisation of nanoparticle size and state prior to nanotoxicological studies. Journal of Nanoparticle Research. 12, 47-53.
Moore, M. N., 2006. Do nanoparticles present ecotoxicological risks for the health of the aquatic environment? Environment International. 32, 967-976.
Morones, J. R., et al., 2005. The bactericidal effect of silver nanoparticles. Nanotechnology. 16, 2346-2353.
Mueller, N. C., Nowack, B., 2008. Exposure modeling of engineered nanoparticles in the environment. Environmental Science & Technology. 42, 4447-4453.
Nakano, Y., et al., 1987. Isolation, Purification, and Characterization of the Pellicle of Euglena-Gracilis-Z. Journal of Biochemistry. 102, 1053-1063.
Navarro, E., et al., 2008a. Environmental behavior and ecotoxicity of engineered nanoparticles to algae, plants, and fungi. Ecotoxicology. 17, 372-386.
Navarro, E., et al., 2008b. Toxicity of Silver Nanoparticles to Chlamydomonas reinhardtii. Environmental Science & Technology. 42, 8959-8964.
Navarro, E., et al., 2015. Effects of Differently Coated Silver Nanoparticles on the Photosynthesis of Chlamydomonas reinhardtii. Environ Sci Technol. 49, 8041-7.
Nel, A. E., et al., 2009. Understanding biophysicochemical interactions at the nano-bio interface. Nature Materials. 8, 543-557.
Neunzehn, J., et al., 2013. Detection of protein coatings on nanoparticles surfaces by ToF-SIMS and advanced electron microscopy. Surface and Interface Analysis. 45, 1340-1346.
Norde, W., Anusiem, A. C. I., 1992. Adsorption, Desorption and Readsorption of Proteins on Solid-Surfaces. Colloids and Surfaces. 66, 73-80.
Pal, S., et al., 2007. Does the antibacterial activity of silver nanoparticles depend on the shape of the nanoparticle? A study of the gram-negative bacterium Escherichia coli. Applied and Environmental Microbiology. 73, 1712-1720.
Pazour, G. J., et al., 2005. Proteomic analysis of a eukaryotic cilium. Journal of Cell Biology. 170, 103-113.
Pazour, G. J., Bloodgood, R. A., 2008. Targeting Proteins to the Ciliary Membrane. Ciliary Function in Mammalian Development. 85, 115-149.
Peltola, M., et al., 2008. Architecture of Deinococcus geothermalis biofilms on glass and steel: a lectin study. Environ Microbiol. 10, 1752-9.
Peralta-Videa, J. R., et al., 2011. Nanomaterials and the environment: A review for the biennium 2008-2010. Journal of Hazardous Materials. 186, 1-15.
Peretyazhko, T. S., et al., 2014. Size-Controlled Dissolution of Silver Nanoparticles at Neutral and Acidic pH Conditions: Kinetics and Size Changes. Environmental Science & Technology. 48, 11954-11961.
97
References
Piccapietra, F., et al., 2012a. Intracellular Silver Accumulation in Chlamydomonas reinhardtii upon Exposure to Carbonate Coated Silver Nanoparticles and Silver Nitrate. Environmental Science & Technology. 46, 7390-7397.
Piccapietra, F., et al., 2012b. Colloidal Stability of Carbonate-Coated Silver Nanoparticles in Synthetic and Natural Freshwater. Environmental Science & Technology. 46, 818-825.
Piccinno, F., et al., 2012. Industrial production quantities and uses of ten engineered nanomaterials in Europe and the world. Journal of Nanoparticle Research. 14.
Pillai, S., et al., 2014. Linking toxicity and adaptive responses across the transcriptome, proteome, and phenotype of Chlamydomonas reinhardtii exposed to silver. Proceedings of the National Academy of Sciences of the United States of America. 111, 3490-3495.
Podila, R., et al., 2012. Effects of surface functional groups on the formation of nanoparticle-protein corona. Applied Physics Letters. 101.
Popper, Z. A., et al., 2014. Plant and algal cell walls: diversity and functionality PREFACE. Annals of Botany. 114, 1043-1048.
Praveenkumar, R., et al., 2015. Breaking dormancy: an energy-efficient means of recovering astaxanthin from microalgae. Green Chemistry. 17, 1226-1234.
Rai, M., et al., 2009. Silver nanoparticles as a new generation of antimicrobials. Biotechnology Advances. 27, 76-83.
Ratte, H. T., 1999. Bioaccumulation and toxicity of silver compounds: A review. Environmental Toxicology and Chemistry. 18, 89-108.
Ribeiro, F., et al., 2014. Silver nanoparticles and silver nitrate induce high toxicity to Pseudokirchneriella subcapitata, Daphnia magna and Danio rerio. Science of the Total Environment. 466, 232-241.
Rier, S. T., et al., 2007. Algal regulation of extracellular enzyme activity in stream microbial communities associated with inert substrata and detritus. Journal of the North American Benthological Society. 26, 439-449.
Röhder, L. A., Interactions of cerium dioxide nanoparticles with the green alga Chlamydomonas reinhardtii: influence of physico-chemical characteristics and cerium(III) ETH Zurich, Zurich, 2014.
Röhder, L. A., et al., 2014. Influence of agglomeration of cerium oxide nanoparticles and speciation of cerium(III) on short term effects to the green algae Chlamydomonas reinhardtii. Aquatic Toxicology. 152, 121-130.
Rose, C., Axler, R. P., 1998. Uses of alkaline phosphatase activity in evaluating phytoplankton community phosphorus deficiency. Hydrobiologia. 361, 145-156.
Scheidegger, C., et al., 2011. Characterization of Lead Induced Metal-Phytochelatin Complexes in Chlamydomonas Reinhardtii. Environmental Toxicology and Chemistry. 30, 2546-2552.
Schug, H., et al., 2014. Effect of TiO2 Nanoparticles and UV Radiation on Extracellular Enzyme Activity of Intact Heterotrophic Biofilms. Environmental Science & Technology. 48, 11620-11628.
Shah, M., et al., 2014. Biological Applications of Gold Nanoparticles. Journal of Nanoscience and Nanotechnology. 14, 344-362.
Shang, L., et al., 2007. pH-dependent protein conformational changes in albumin : gold nanoparticle bioconjugates: A spectroscopic study. Langmuir. 23, 2714-2721.
98
References
Shannahan, J. H., et al., 2013. Silver nanoparticle protein corona composition in cell culture media. PLoS One. 8, e74001.
Sharma, V. K., et al., 2009. Silver nanoparticles: Green synthesis and their antimicrobial activities. Advances in Colloid and Interface Science. 145, 83-96.
Shehata, T. E., Kempner, E. S., 1978. Sequential-Changes in Cell-Volume Distribution during Vitamin-B12 Starvation of Euglena-Gracilis. Journal of Bacteriology. 133, 396-398.
Shemetov, A. A., et al., 2012. Molecular Interaction of Proteins and Peptides with Nanoparticles. Acs Nano. 6, 4585-4602.
Sinsabaugh, R. L., et al., 1991. Exoenzyme Accumulation in Epilithic Biofilms. Hydrobiologia. 222, 29-37.
Sorensen, I., et al., 2010. How Have Plant Cell Walls Evolved? Plant Physiology. 153, 366-372. Sorensen, I., et al., 2011. The charophycean green algae provide insights into the early origins of
plant cell walls. Plant Journal. 68, 201-211. Sorensen, S. N., Baun, A., 2015. Controlling silver nanoparticle exposure in algal toxicity testing
A matter of timing. Nanotoxicology. 9, 201-209. Speziale, P., et al., 2008. Purification of human plasma fibronectin using immobilized gelatin and
Arg affinity chromatography. Nature Protocols. 3, 525-533. Srivastava, V., et al., 2015. Critical Review on the Toxicity of Some Widely Used Engineered
Nanoparticles. Industrial & Engineering Chemistry Research. 54, 6209-6233. Stewart, T. J., et al., 2013. Characterization of extracellular polymeric substances (EPS) from
periphyton using liquid chromatography-organic carbon detection-organic nitrogen detection (LC-OCD-OND). Environmental Science and Pollution Research. 20, 3214-3223.
Suarez, G., et al., 2013. Biosensor based on chemically-designed anchorable cytochrome c for the detection of H2O2 released by aquatic cells. Biosensors & Bioelectronics. 42, 385-390.
Sun, T. Y., et al., 2014a. Comprehensive probabilistic modelling of environmental emissions of engineered nanomaterials. Environmental Pollution. 185, 69-76.
Sun, X. T., et al., 2014b. The Selective Interaction between Silica Nanoparticles and Enzymes from Molecular Dynamics Simulations. Plos One. 9.
Szivak, I., et al., 2009. Metal-Induced Reactive Oxygen Species Production in Chlamydomonas Reinhardtii (Chlorophyceae). Journal of Phycology. 45, 427-435.
Taylor, N. S., et al., 2015. Molecular toxicity of cerium oxide nanoparticles to the freshwater alga Chlamydomonas reinhardtii is associated with supra-environmental exposure concentrations. Nanotoxicology. 1-10.
Tedesco, S., et al., 2008. Gold nanoparticles and oxidative stress in Mytilus edulis. Mar Environ Res. 66, 131-3.
Tejamaya, M., et al., 2012. Stability of Citrate, PVP, and PEG Coated Silver Nanoparticles in Ecotoxicology Media. Environmental Science & Technology. 46, 7011-7017.
Tiede, K., et al., 2009. Imaging of engineered nanopartlicles and their aggregates under fully liquid conditions in environmental matrices. Water Research. 43, 3335-3343.
Van Hoecke, K., et al., 2008. Ecotoxicity of silica nanoparticles to the green alga Pseudokirchneriella subcapitata: Importance of surface area. Environmental Toxicology and Chemistry. 27, 1948-1957.
Van Hoecke, K., et al., 2009. Fate and Effects of CeO2 Nanoparticles in Aquatic Ecotoxicity Tests. Environmental Science & Technology. 43, 4537-4546.
99
References
Vertegel, A. A., et al., 2004. Silica nanoparticle size influences the structure and enzymatic activity of adsorbed lysozyme. Langmuir. 20, 6800-7.
Vismara, R., et al., 2000. Ultrastructure of the pellicle of Euglena gracilis. Tissue & Cell. 32, 451-456.
Walczyk, D., et al., 2010. What the Cell "Sees" in Bionanoscience. Journal of the American Chemical Society. 132, 5761-5768.
Walkey, C. D., et al., 2012. Nanoparticle Size and Surface Chemistry Determine Serum Protein Adsorption and Macrophage Uptake. Journal of the American Chemical Society. 134, 2139-2147.
Walkey, C. D., et al., 2014. Protein Corona Fingerprinting Predicts the Cellular Interaction of Gold and Silver Nanoparticles. Acs Nano. 8, 2439-2455.
Wang, S. B., et al., 2004. Cell wall proteomics of the green alga Haematococcus pluvialis (Chlorophyceae). Proteomics. 4, 692-708.
Wang, Y., et al., 2013. Bioaccumulation of CdTe Quantum Dots in a Freshwater Alga Ochromonas danica: A Kinetics Study. Environmental Science & Technology. 47, 10601-10610.
Wen, Y. M., et al., 2013. Binding of cytoskeletal proteins with silver nanoparticles. Rsc Advances. 3, 22002-22007.
Wigginton, N. S., et al., 2010. Binding of Silver Nanoparticles to Bacterial Proteins Depends on Surface Modifications and Inhibits Enzymatic Activity. Environmental Science & Technology. 44, 2163-2168.
Windler, L., et al., 2013. Comparative evaluation of antimicrobials for textile applications. Environment International. 53, 62-73.
Xiu, Z. M., et al., 2011. Differential Effect of Common Ligands and Molecular Oxygen on Antimicrobial Activity of Silver Nanoparticles versus Silver Ions. Environmental Science & Technology. 45, 9003-9008.
Xiu, Z. M., et al., 2012. Negligible Particle-Specific Antibacterial Activity of Silver Nanoparticles. Nano Letters. 12, 4271-4275.
Yacobi, N. R., et al., 2010. Mechanisms of Alveolar Epithelial Translocation of a Defined Population of Nanoparticles. American Journal of Respiratory Cell and Molecular Biology. 42, 604-614.
Yamamoto, M., et al., 2003. Relationship between presence of a mother cell wall and speciation in the unicellular microalga Nannochloris (Chlorophyta). Journal of Phycology. 39, 172-184.
Yoo, E. J., et al., 2008. Size-dependent flocculation behavior of colloidal Au nanoparticles modified with various biomolecules. Ultramicroscopy. 108, 1273-1277.
Yue, Y., et al., 2015. Toxicity of silver nanoparticles to a fish gill cell line: Role of medium composition. Nanotoxicology. 9, 54-63.
Zhao, C. M., Wang, W. X., 2012. Importance of surface coatings and soluble silver in silver nanoparticles toxicity to Daphnia magna. Nanotoxicology. 6, 361-370.
Zhu, C., et al., 2012. Bioflocculant produced by Chlamydomonas reinhardtii. Journal of Applied Phycology. 24, 1245-1251.
Zippel, B., Neu, T. R., 2011. Characterization of glycoconjugates of extracellular polymeric substances in tufa-associated biofilms by using fluorescence lectin-binding analysis. Appl Environ Microbiol. 77, 505-1
100
Acknowledgements I would like to gratefully acknowledge my doctoral supervisor Renata Behra and Kristin
Schirmer, for their unmeasurable guidance, support, encouragement, and inspiration
throughout the study and research, and also for their patience and enthusiasm in educating me
on both the knowledge and the writing skills.
My sincere thanks also goes to Laura Sigg, Marc Suter, Smitha Pillai, and Ahmed Tlili, for their
countless supports and discussions in the project meetings. Thanks for Carmen Gill and Yang
Yue, who were accompany with me during the whole Ph.D. period, as a first batch of EPFL
students in our Environmental Toxicology Department (UTOX), sharing many experience in
taking courses and attending conferences, and going through all the toughness in the study
together.
My special thanks give to Bettina Wanger for her great technical supports for all the algae work
and more importantly for her creating such a nice and comfortable lab atmosphere. I thank
David Kistler, for all the ICP MS measurements and always trying to teach me some Swiss-
Germen. I also thank Laetitia Bernard for all the work she took care about TOF-SIMS analysis
and explanation about the techniques.
Thanks to all my colleagues at UTOX for being a nice scientific and social community. Specially,
I would like to thank all my officemates in F20: Muris Korkaric, Alexandra Kroll, Niksa Odzak,
Yang Yue, Linn Sgier, and Flavio Piccapietra, for making our office lovely with daily laughs, and
for their continuous effects in maintaining the giant ‘forest’ cultured in all the flower pots.
Specially, thank you Muris, for being sitting so close to me for four years and sharing all the
happiness and stress together. Also thank you Flavio, for joining our office and being ready to
talk at any moment.
This dissertation would not have been possible without funding from the Swiss National Science
Foundation, through the National Research Programme 64 Opportunities and Risks of
Nanomaterials.
Last but not the least, I would like to thank my family for their unconditional supports and
encouragement. In particular, I thank my husband Yigang for allowing me fully dedicated to all
the deadlines and thesis writing, and my little son Luli Yan, for his born and endless happiness
he brings along.
101
Curriculum vitae Xiaomei Li Date of birth: 28 October 1986 Nationality: Chinese Address: Department of Environmental Toxicology, Eawag
überlandstrasse 133, 8600 Dübendorf, Switzerland Diploma 2010 M.Sc. in Molecular Biotechnology, School of Biotechnology, KTH-Royal Institute
of Technology (Sweden) 2008 B.Sc. in Biotechnology, College of Life Science, Linyi University (China)
Work and research experience 2011 PhD project, Eawag (Switzerland) Interactions of silver and polystyrene nanoparticles with algae 2010-2011 Research assistant, Bio-Nanotechnology Laboratory, Nano-Science,
University of Copenhagen (Denmark) Mammalian cell adhesion on vertical arrays of nanowires
2010 M.Sc. thesis project, Bio-Nanotechnology Laboratory, Nano-Science, University of Copenhagen (Denmark)
Interfacing mammalian cells vertical arrays of nanowires 2008 B.Sc. thesis project, Linyi University (China) Anatomy of Pulsatila Nakai Koreana
Scholarship Master project scholarship, 2010, University of Copenhagen, Denmark Excellent undergraduate reward, 2008, Shandong Province, China First prize scholarship, 2004-2005, 2006-2007, Biotechnology, Linyi University, China
Publication Bonde S, Berthing T, Madsen M. H, Andersen T. K, Buch-Manson N, Guo L, Li X. M, Badique F, Anselme K, Nygard J, Martinez K. L. (2013). "Tuning InAs Nanowire Density for HEK293 Cell Viability, Adhesion, and Morphology: Perspectives for Nanowire-Based Biosensors." Acs Applied Materials & Interfaces 5(21): 10510-10519
Li X, Schirmer K, Bernard L, Sigg L, Pillai S, Behra R. (2015). "Silver nanoparticle toxicity and association with the alga Euglena gracilis." Environmental Science: Nano. DOI: 10.1039/C5EN00093A
Li X, Schirmer K, Behra R. Interactions of fluorescent polystyrene nanoparticles with four fresh water algal strains. In preparation
Li X, Schirmer K, Behra R. Interactions of differently coated silver nanoparticles with alkaline phosphatase. In preparation
102