interactive analytics for very large scale genomic data · 1 1 interactive analytics for very large...
TRANSCRIPT

1
Interactive Analytics for Very Large Scale Genomic Data 1
2
Cuiping Pan1,2,6*, Nicole Deflaux3*, Gregory McInnes2*, Michael Snyder1,2, Jonathan Bingham3, 3
Somalee Datta2, Philip Tsao4,5,6 4
5
*These authors contributed equally to this manuscript. 6
7
1. Department of Genetics, Stanford University, CA 8
2. Stanford Center for Genomics and Personalized Medicine, Stanford University, CA 9
3. Google Inc, 1600 Amphitheatre Pkwy, Mountain View, CA 10
4. Division of Cardiovascular Medicine, Stanford University, CA 11
5. VA Palo Alto Health Care System, CA 12
6. Palo Alto Veterans Institute for Research, VA Palo Alto, Palo Alto, CA 13
14
15
Key words 16
whole genome sequencing, next-generation sequencing, population genomics, genomic 17
analytics, cloud computation, SQL, distributed database, Global Alliance for Genomics and 18
Health API 19
20
21
Abstract 22
Large scale genomic sequencing is now widely used to decipher questions in diverse realms 23
such as biological function, human diseases, evolution, ecosystems, and agriculture. With the 24
quantity and diversity these data harbor, a robust and scalable data handling and analysis 25
solution is desired. Here we present interactive analytics using public cloud infrastructure and 26
distributed computing database Dremel and developed according to the standards of Global 27
Alliance for Genomics and Health, to perform information compression, comprehensive quality 28
controls, and biological information retrieval in large volumes of genomic data. We demonstrate 29
that such computing paradigms can provide orders of magnitude faster turnaround for common 30
analyses, transforming long-running batch jobs submitted via a Linux shell into questions that 31
can be asked from a web browser in seconds. 32
.CC-BY-ND 4.0 International licensenot certified by peer review) is the author/funder. It is made available under aThe copyright holder for this preprint (which wasthis version posted December 24, 2015. . https://doi.org/10.1101/035295doi: bioRxiv preprint

2
Main Text 1
Genomic sequencing projects have gone from sequencing a few genomes to hundreds or 2
thousands of genomes in the past decade 1-11. The massive amount of data generated from 3
these studies has presented challenges ranging from affordable long-term storage, controlled 4
data sharing, flexible data retrieval, fast and scalable data processing, and interactive 5
downstream mining of biological information. Recently, jointly analyzing genomic data from 6
multiple studies 12 and with other types of data 13 has proven to be invaluable in improving study 7
power and thus yielded important new discoveries. These data integration efforts have 8
highlighted the need for a scalable analysis platform that can combine various information 9
sources. Standard public tools, run on local files on fixed-size computer clusters, do not readily 10
scale for large studies. Public cloud platforms can provide part of the solution, with sufficient 11
computing capacity for large batch analysis jobs, and have demonstrated early potential to grow 12
into mature solutions for handling large-scale biology and health data 14-17. Another part of the 13
solution may be new interactive analytics frameworks based on distributed computing 14
approaches, such as Dremel 18, 19, a query engine based on a columnar database and available 15
in both open source and commercial implementations. Here we present cloud platform-based 16
data processing and Dremel-based interactive analytic solutions for very large scale genomic 17
data. We have built such solutions according to the standards of Global Alliance for Genomics 18
and Health, aiming to help achieve the goal of creating a common framework for securely 19
sharing and analyzing genomic and clinical data. 20
21
The dataset of this study contains 460 whole human genomes sequenced with 101 base-pair 22
paired-end reads on the Illumina HiSeq 2000 with an average genome coverage of 50x, totaling 23
48 terabytes of pre-aligned reads presented in BAM format. We processed these data using our 24
automated BWA and GATK Unified Genotyper pipeline 20 as implemented on an in-house 25
computer cluster at Stanford University (Figure 1 step i [Figure 1.i]). Each genome was 26
processed individually, and we turned on the option in GATK to detect both reference and 27
variant bases, yielding in total 9 terabytes of genotypic information presented in compressed 28
VCF format (Methods). To enable cloud-based analysis, we uploaded these VCF files to a 29
storage bucket (Figure 1.ii). As the calls were presented for each position individually and large 30
amount of them were reference calls, we transformed the calls for every genome from VCF to 31
gVCF format in which variant calls were retained in single entries and consecutive reference 32
calls were collapsed into single intervals (Methods, Figure 1.iii). This transformation reduced 33
.CC-BY-ND 4.0 International licensenot certified by peer review) is the author/funder. It is made available under aThe copyright holder for this preprint (which wasthis version posted December 24, 2015. . https://doi.org/10.1101/035295doi: bioRxiv preprint
3
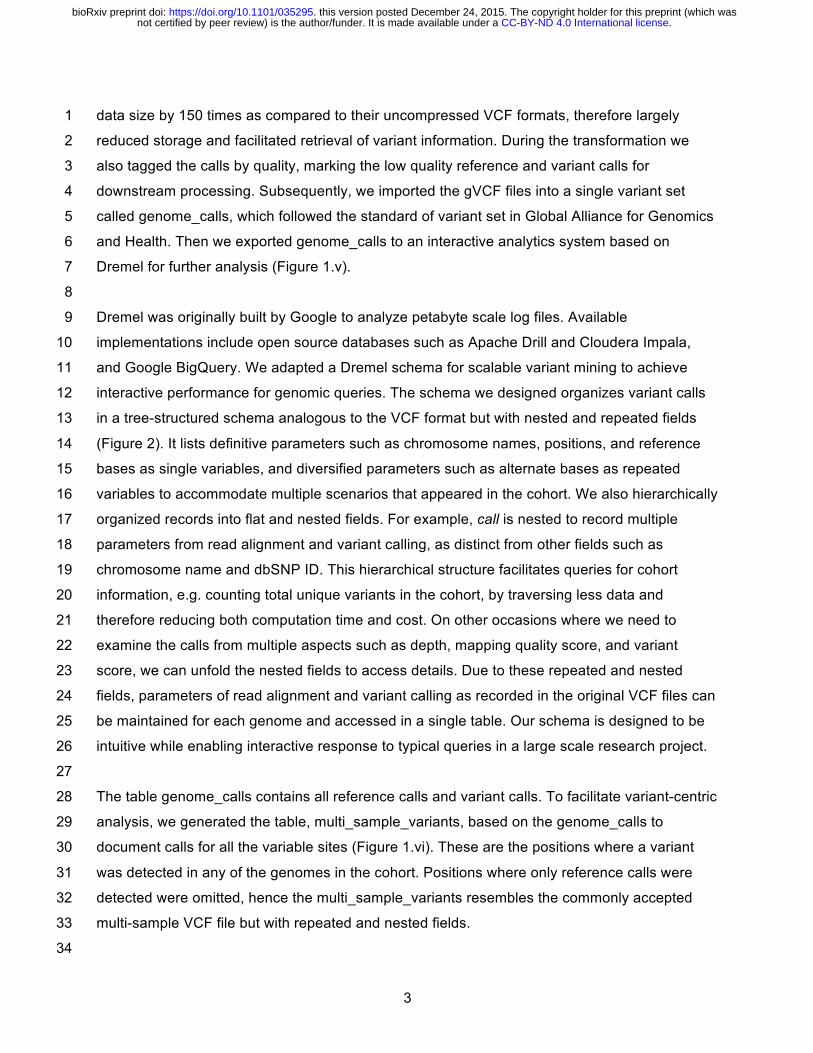
data size by 150 times as compared to their uncompressed VCF formats, therefore largely 1
reduced storage and facilitated retrieval of variant information. During the transformation we 2
also tagged the calls by quality, marking the low quality reference and variant calls for 3
downstream processing. Subsequently, we imported the gVCF files into a single variant set 4
called genome_calls, which followed the standard of variant set in Global Alliance for Genomics 5
and Health. Then we exported genome_calls to an interactive analytics system based on 6
Dremel for further analysis (Figure 1.v). 7
8
Dremel was originally built by Google to analyze petabyte scale log files. Available 9
implementations include open source databases such as Apache Drill and Cloudera Impala, 10
and Google BigQuery. We adapted a Dremel schema for scalable variant mining to achieve 11
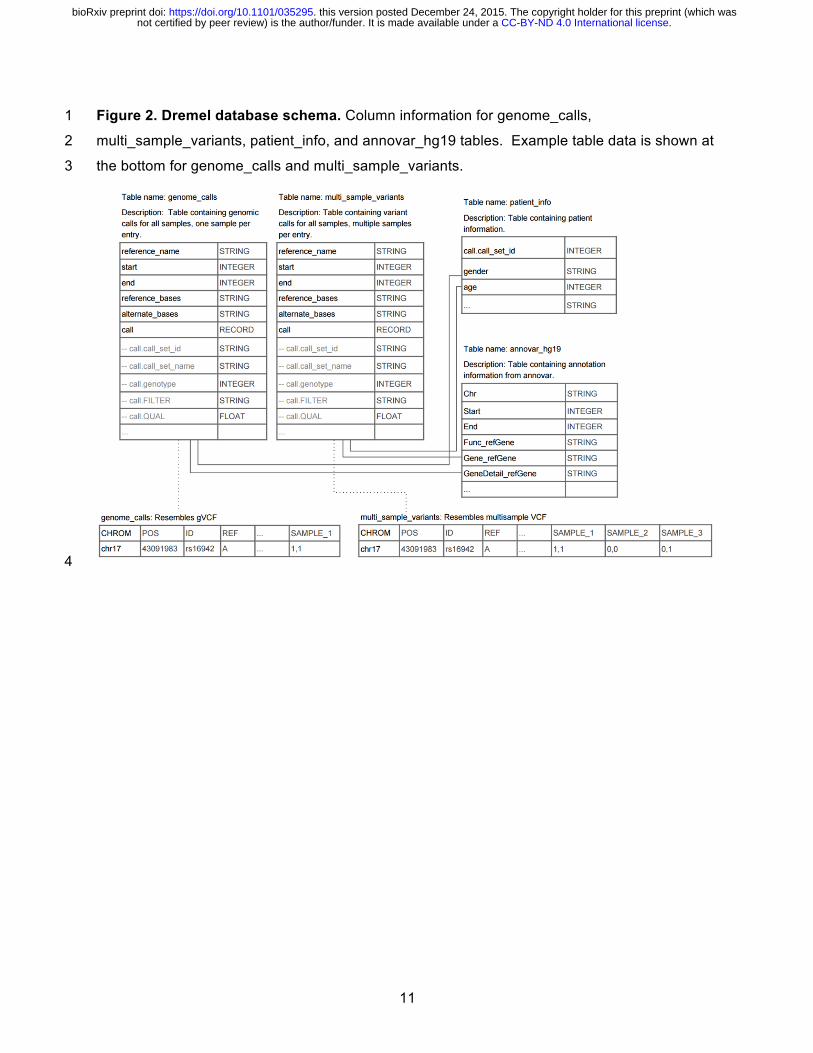
interactive performance for genomic queries. The schema we designed organizes variant calls 12
in a tree-structured schema analogous to the VCF format but with nested and repeated fields 13
(Figure 2). It lists definitive parameters such as chromosome names, positions, and reference 14
bases as single variables, and diversified parameters such as alternate bases as repeated 15
variables to accommodate multiple scenarios that appeared in the cohort. We also hierarchically 16
organized records into flat and nested fields. For example, call is nested to record multiple 17
parameters from read alignment and variant calling, as distinct from other fields such as 18
chromosome name and dbSNP ID. This hierarchical structure facilitates queries for cohort 19
information, e.g. counting total unique variants in the cohort, by traversing less data and 20
therefore reducing both computation time and cost. On other occasions where we need to 21
examine the calls from multiple aspects such as depth, mapping quality score, and variant 22
score, we can unfold the nested fields to access details. Due to these repeated and nested 23
fields, parameters of read alignment and variant calling as recorded in the original VCF files can 24
be maintained for each genome and accessed in a single table. Our schema is designed to be 25
intuitive while enabling interactive response to typical queries in a large scale research project. 26
27
The table genome_calls contains all reference calls and variant calls. To facilitate variant-centric 28
analysis, we generated the table, multi_sample_variants, based on the genome_calls to 29
document calls for all the variable sites (Figure 1.vi). These are the positions where a variant 30
was detected in any of the genomes in the cohort. Positions where only reference calls were 31
detected were omitted, hence the multi_sample_variants resembles the commonly accepted 32
multi-sample VCF file but with repeated and nested fields. 33
34
.CC-BY-ND 4.0 International licensenot certified by peer review) is the author/funder. It is made available under aThe copyright holder for this preprint (which wasthis version posted December 24, 2015. . https://doi.org/10.1101/035295doi: bioRxiv preprint

4
To derive a list of high quality samples and variants for downstream data mining, we 1
implemented comprehensive quality control (QC) metrics over the SNVs and INDELs using 2
mostly SQL queries. Altogether there are three levels of quality controls: data processing QC, 3
sample health QC, and variant health QC (Figure 3; Supplemental Table 1; Figure 1.iii, vii-x). 4
The data processing QC was implemented during the data transformation step, as mentioned 5
above. In this step, QC of variant calls largely relied on variant quality score recalibration 6
(VQSR) in GATK, which studied the distribution of a variety of parameters for the dbSNP 7
variants identified in our cohort, and expanded the true set to the previously unknown variants 8 20. For reference calls, we hard coded the filtering criteria (Methods). In the tables genome_calls 9
and multi_sample_variants, high quality calls retain their original genotypes (REF: 0/0, VAR: 10
0/1, 1/1 or 1/2), whereas low quality calls were changed to -1/-1 genotypes (Supplemental 11
Table 2). At the levels of sample health and variant health QC, we considered principles for 12
individual and population genomics. Sample health QC identifies problematic genomes by 13
assessing potential batch effect, unexpected relatedness (e.g. IBS and inbreeding coefficients), 14
concordance to the SNP array data, concordance with phenotypic data (e.g. sex and ethnicity), 15
and distribution of the variants within the cohort (e.g. missingness, singleton, and 16
heterozygosity). Problematic genomes identified from this step were removed entirely from the 17
dataset. The remaining genomes were collected for variant health QC, which aimed to detect 18
problematic variants that 1) mapped to genes that were previously known to have higher failure 19
rate of alignment and variant calling (blacklisted genes 22), 2) were mistakenly called as 20
heterozygous in sex chromosomes in male genomes (heterozygous haplotype), 3) were 21
undetected in a significant portion of the cohort (missingness), or 4) failed population genetics 22
tests (HWE and Ti/Tv). Variants failing QC were tagged in the final table. Code for each step is 23
published online (GitHub 1, 2), and the QC process was automated using a custom pipeline that 24
executes queries through a web-based Application Program Interface (API) (GitHub 3). 25
26
To test the accuracy of our QC steps as implemented in Dremel, we extracted all calls on the 27
BRCA1 gene and compared the QC results with those derived from VCFtools, Plink, and 28
PlinkSeq (Methods: Query validation). Our point-to-point comparison shows very close 29
concordance with those commonly used tools (GitHub 4). We found that most of the few 30
differences were explained by the academic tools disregarding multi-allelic sites. We attempted 31
to better handle multi-allelic sites where appropriate. We then applied these QC steps to our 32
whole genome sequencing cohort (Supplemental Figure 1), and results were summarized in 33
Supplemental Figure 2 and Supplemental Table 3. 34
.CC-BY-ND 4.0 International licensenot certified by peer review) is the author/funder. It is made available under aThe copyright holder for this preprint (which wasthis version posted December 24, 2015. . https://doi.org/10.1101/035295doi: bioRxiv preprint

5
1
After extensive QC on our 460 human genome cohort, we derived in total 446 genomes with 2
27,076,770 good quality SNVs and 640,341 INDELs. We developed SQL-like, interactive 3
queries to obtain statistical, biological, and medical information. For cohort statistics, we queried 4
these genotypes at various levels to understand how the genotypes distributed within this 5
population (Supplemental Figure 3). We assessed callable rates and a typical scenario in a 6
single genome is displayed in Supplemental Figure 4. We calculated genomic statistics such as 7
Ti/Tv, Het/Hom, novel SNVs and INDELs that were not reported in dbSNP, and private SNVs 8
and INDELs (Supplemental Figure 5). After computing variant allele frequencies within the 9
cohort (Supplemental Figure 6) we observed that close to half of the SNVs were found in only 1-10
3 genomes, likely due to the fact that these genomes were deeply sequenced. We queried for 11
regions where variation occurred more frequently, the so-called “mutational hotspots”. As an 12
example, we summed the number of SNVs for every 1 kb for P53 gene in each genome 13
(Supplemental Figure 7). We also implemented more comprehensive analytics such as genome 14
wide association studies to facilitate discovery of trait-associated SNVs (GitHub 5). To study the 15
potential impacts the variants could have on biological functions, we annotated the variants 16
using Annovar and uploaded the results to Dremel (Methods, Figure 1.xiii-ix). By querying the 17
annotated features, we identified variants in different genic regions and when normalized by 18
chromosome lengths, we observed that chromosome 19 tended to have denser variation related 19
to coding events locating on exonic, splicing, UTR5 and UTR3 regions (Supplemental Figure 8). 20
There have been increasing efforts to understand medical implications from genomic 21
sequencing data 23-26. We imported into Dremel the pharmGKB database 27 and queried for all 22
variants in our study that could affect Warfarin dosage effect (Fig 1.xv). Results show that a 23
third of our study subjects should be given a lower dose of Warfarin (Supplemental Figure 9). 24
25
Dremel, like other database systems, allows a researcher to join their data with other public and 26
private sources. In our experimentation, we uploaded the calls of the 1000 Genomes Phase 1 27
project and compared allele frequency distributions in our cohort and in the European 28
populations of the 1000 Genomes Project (Supplemental Figure 10). We observed that in the 29
lower allele frequency categories, our whole genome sequencing study contributed significantly 30
more variants. This can be expected as our deep sequencing was able to identify more rare 31
variants. 32
33
.CC-BY-ND 4.0 International licensenot certified by peer review) is the author/funder. It is made available under aThe copyright holder for this preprint (which wasthis version posted December 24, 2015. . https://doi.org/10.1101/035295doi: bioRxiv preprint
6
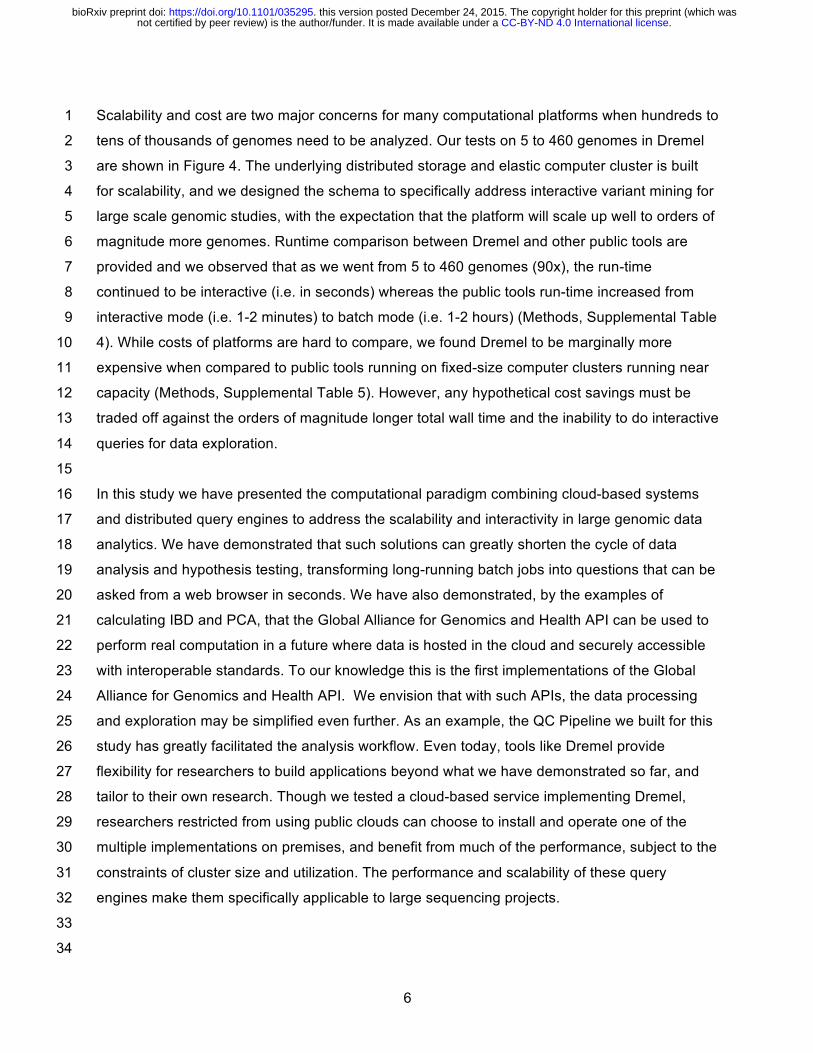
Scalability and cost are two major concerns for many computational platforms when hundreds to 1
tens of thousands of genomes need to be analyzed. Our tests on 5 to 460 genomes in Dremel 2
are shown in Figure 4. The underlying distributed storage and elastic computer cluster is built 3
for scalability, and we designed the schema to specifically address interactive variant mining for 4
large scale genomic studies, with the expectation that the platform will scale up well to orders of 5
magnitude more genomes. Runtime comparison between Dremel and other public tools are 6
provided and we observed that as we went from 5 to 460 genomes (90x), the run-time 7
continued to be interactive (i.e. in seconds) whereas the public tools run-time increased from 8
interactive mode (i.e. 1-2 minutes) to batch mode (i.e. 1-2 hours) (Methods, Supplemental Table 9
4). While costs of platforms are hard to compare, we found Dremel to be marginally more 10
expensive when compared to public tools running on fixed-size computer clusters running near 11
capacity (Methods, Supplemental Table 5). However, any hypothetical cost savings must be 12
traded off against the orders of magnitude longer total wall time and the inability to do interactive 13
queries for data exploration. 14
15
In this study we have presented the computational paradigm combining cloud-based systems 16
and distributed query engines to address the scalability and interactivity in large genomic data 17
analytics. We have demonstrated that such solutions can greatly shorten the cycle of data 18
analysis and hypothesis testing, transforming long-running batch jobs into questions that can be 19
asked from a web browser in seconds. We have also demonstrated, by the examples of 20
calculating IBD and PCA, that the Global Alliance for Genomics and Health API can be used to 21
perform real computation in a future where data is hosted in the cloud and securely accessible 22
with interoperable standards. To our knowledge this is the first implementations of the Global 23
Alliance for Genomics and Health API. We envision that with such APIs, the data processing 24
and exploration may be simplified even further. As an example, the QC Pipeline we built for this 25
study has greatly facilitated the analysis workflow. Even today, tools like Dremel provide 26
flexibility for researchers to build applications beyond what we have demonstrated so far, and 27
tailor to their own research. Though we tested a cloud-based service implementing Dremel, 28
researchers restricted from using public clouds can choose to install and operate one of the 29
multiple implementations on premises, and benefit from much of the performance, subject to the 30
constraints of cluster size and utilization. The performance and scalability of these query 31
engines make them specifically applicable to large sequencing projects. 32
33
34
.CC-BY-ND 4.0 International licensenot certified by peer review) is the author/funder. It is made available under aThe copyright holder for this preprint (which wasthis version posted December 24, 2015. . https://doi.org/10.1101/035295doi: bioRxiv preprint

7
Acknowledgement 1
This work was supported by research grants from the National Institutes of Health 2
(1P50HL083800 and 1R01HL101388) and from the Veterans Affairs Office of Research and 3
Development. We acknowledge the Genetics Bioinformatics Service Center (GBSC), a Stanford 4
School of Medicine Service Center that provides computational infrastructure for genomics 5
research. GBSC provided the dbGaP compliant on-premise cluster and cloud gateway for this 6
research. We acknowledge Bina Technologies Inc (now Roche) for providing technical support 7
for calling genomic variants on Bina servers. We thank Alicia Deng and Hassan Chaib from 8
Stanford University for preparing the DNA for sequencing, Denis Salins and Isaac Liao from 9
Stanford University for bioinformatics support, Elmer Garduno, Danyao Wang, and Samuel 10
Gross from Google for bioinformatics support on Google Cloud, Shannon Rego from Stanford 11
University for discussing results, and David Glazer from Google for insightful advice along the 12
project. 13
14
15
References: 16
1. The 1000 Genomes Project Consortium. Nature 491, 56–65 (2012) 17 2. The International Cancer Genome Consortium. Nature 464, 993-998 (2010) 18 3. The Cancer Genome Atlas Research Network., Weinstein,J.N., Collisson, E.A. et al. Nature 19
Genetics 45, 1113–1120 (2013) 20 4. Ball, M.P., Bobe, J.R., Chou, M.F., et al. Genome Medicine 6:10 (2014) 21 5. Taylor, P.N., Porcu,E., Chew, S, et. al. Nature Communications. 6;6:5681 (2015) 22 6. CONVERGE consortium. Nature 523, 588–591 (2015) 23 7. Boomsma, D.I., Wijmenga, C., Slagboom, E.P. et al. European Journal of Human Genetics 22, 24
221–227. (2014) 25 8. Middha, S., Lindor, N.M., McDonnell, S.K., et. al. Frontiers in Genetics 6: 244. (2015) 26 9. Hussin, J.G., Hodgkinson A, Idaghdour. Y., et. al. Nature Genetics 47, 400–404 (2015) 27 10. Rees, E., Kirov, G., Walters, J.T. et al. Translational Psychiatry. 21;5:e607. (2015) 28 11. Bäckhed, F.,Roswall, J., Peng, Y. et al. Cell Host and Microbe. 13;17(5):690-703. (2015) 29 12. DIAbetes Genetics Replication And Meta-analysis (DIAGRAM) Consortium. et. al. Nature 30
Genetics 46, 234–244 (2014) 31 13. Akbani, R., Ng, P.K.S., Werner, H.M.J,. Nature Communications | 5:3887 (2014) 32 14. Shringarpure, S.S., Carroll, A., De La Vega, F.M., et. al. PLoS One. 10(6):e0129277 (2015) 33 15. Huang Z, Yu J, Yu F. IEEE; 2013. p. 49–52. (2013) 34 16. Karczewski, K.J., Fernald, G.H., Martin, A.R., et. al. PloS one. 9(1):e84860. (2013) 35
.CC-BY-ND 4.0 International licensenot certified by peer review) is the author/funder. It is made available under aThe copyright holder for this preprint (which wasthis version posted December 24, 2015. . https://doi.org/10.1101/035295doi: bioRxiv preprint

8
17. Reid, J.G., Carroll, A., Veeraraghavan, N., et al. BMC Bioinformatics 15(1):30. (2014) 1 18. Melnik, S., Gubarev, A., Long, J.J., et al. Proc. of the 36th Int'l Conf on Very Large Data Bases, 2
330-339 (2010) 3 19. BigQuery whitepaper: https://cloud.google.com/files/BigQueryTechnicalWP.pdf 4 20. Lam, H.Y.K., Pan,C., Clark, M.J. et al. Nature Biotechnology 30(3):226-9 (2012) 5 21. DePristo, M., Banks, E., Poplin, R. et al. Nature Genetics 43:491-498 (2011) 6 22. Duitama, J., Quintero, J.C., Cruz, D.F. et al. Nucleic Acids Research 42(6):e44 (2014) 7 23. Green, R.C., Berg, J.S., Grody, W.W. et al. Genetics in Medicine 15(7):565-74 (2013) 8 24. Dewey, F.E., Grove, M.E., Pan, C. et al. The Journal of the American Medical Association. 9
12;311(10):1035-45 (2014) 10 25. Thompson, B.A., Spurdle, A.B., Plazzer, J.P. et al. Nature Genetics 46(2):107-15 (2014) 11 26. McLaughlin, H.M., Ceyhan-Birsoy, O., Christensen, K.D. et al. BMC Medical Genetics 12
14;15:134(2014) 13 27. Whirl-Carrillo, M., McDonagh, E.M., Hebert, J.M. et al. Clinical Pharmacology & Therapeutics 14
92(4):414-7 (2012) 15
16 GitHub links: 17
1. https://github.com/StanfordBioinformatics/mvp_aaa_codelabs/blob/master/Sample-Level-QC.md 18 2. https://github.com/StanfordBioinformatics/mvp_aaa_codelabs/blob/master/Variant-Level-QC.md 19 3. https://github.com/StanfordBioinformatics/mvp_aaa_codelabs/blob/master/Comparison.md 20 4. https://github.com/StanfordBioinformatics/bigquery-genomics-qc 21 5. https://github.com/googlegenomics/codelabs/blob/master/R/1000Genomes-BRCA1-22
analysis/sql/gwas-brca1-pattern.sql 23
.CC-BY-ND 4.0 International licensenot certified by peer review) is the author/funder. It is made available under aThe copyright holder for this preprint (which wasthis version posted December 24, 2015. . https://doi.org/10.1101/035295doi: bioRxiv preprint

9
Figure 1: Bioinformatics workflow describing how we utilized on-premise computer cluster for 1
preparing genomic input files (in green) and public cloud infrastructure for carrying out file 2
format transformation and quality controls (in blue). The derived data were imported into Dremel 3
for interactive analysis. i.) BAM files provided by Illumina Sequencing Services were 4
reanalyzed using the HugeSeq pipeline to perform primary genome analysis. Hugeseq 5
comprises BWA and GATK UnifiedGenotyper among other tools. ii.) VCFs output from step i. 6
were uploaded to a cloud storage bucket. iii.) The VCFs were then processed with a Hadoop 7
Streaming job in order to group reference calls into reference-matching blocks and flaq low 8
quality loci. iv.) gVCFs with reference matching blocks were imported into a Global Alliance for 9
Genomics and Health (ga4gh) variant set. v.) A Dremel table resembling a gVCF was generated 10
by exporting the contents of the variant set using the ga4gh API. vi.) A Dremel table resembling 11
a multisample VCF was generated using a Cloud Dataflow pipeline that read data from the 12
variant set and output a Dremel table. vii.) Sample and variant level quality control queries were 13
run through the Dremel API using a python pipeline. viii.) Ethnicity was inferred for the genomes 14
in this study by running a Apache Spark pipeline on 100,000 randomly selected sites from 15
dbSNP for the 460 genomes in this study combined with the 1092 genomes from 1,000 16
Genomes phase 110. The pipeline reads data from the variant set through the ga4gh API and 17
outputs the PCA results to a storage bucket. ix.) The same Apache Spark pipeline from the 18
previous step was run on all sites of the 460 genomes from this study to test for sequencing 19
batch effects. x.) Identity by State (IBS) was run for all genomes comparing each genome to all 20
other genomes to identify unexpected relatedness. xi.) Final genome_calls and 21
multi_sample_variants tables were generated after combining the results from each of the QC 22
steps (vii-x). Low quality loci are flagged in the final tables with a genotype of -1/-1 and low 23
quality samples are removed from the dataset entirely. xii.) A multisample VCF was generated 24
from the multi_sample_variants table by exporting the table and running a python script for 25
formatting. xiii.) Annovar was run on a local HPC to perform variant annotation on all high 26
quality loci. xiv.) A Dremel annotations table was created from the Annovar results. xv.) Other 27
genomic databases such as PharmGKB were imported as Dremel tables to perform additional 28
annotation. 29
.CC-BY-ND 4.0 International licensenot certified by peer review) is the author/funder. It is made available under aThe copyright holder for this preprint (which wasthis version posted December 24, 2015. . https://doi.org/10.1101/035295doi: bioRxiv preprint

10
1
.CC-BY-ND 4.0 International licensenot certified by peer review) is the author/funder. It is made available under aThe copyright holder for this preprint (which wasthis version posted December 24, 2015. . https://doi.org/10.1101/035295doi: bioRxiv preprint
11
Figure 2. Dremel database schema. Column information for genome_calls, 1
multi_sample_variants, patient_info, and annovar_hg19 tables. Example table data is shown at 2
the bottom for genome_calls and multi_sample_variants. 3
4
.CC-BY-ND 4.0 International licensenot certified by peer review) is the author/funder. It is made available under aThe copyright holder for this preprint (which wasthis version posted December 24, 2015. . https://doi.org/10.1101/035295doi: bioRxiv preprint

12
Figure 3. A three-level quality control for large scale genomic sequencing data. 1
2
.CC-BY-ND 4.0 International licensenot certified by peer review) is the author/funder. It is made available under aThe copyright holder for this preprint (which wasthis version posted December 24, 2015. . https://doi.org/10.1101/035295doi: bioRxiv preprint

13
Figure 4. Performance of Dremel in analyzing 5 versus 460 human genomes in this study. Top: 1
Average run times for each query. Bottom: Estimated cost, based on $5/TB of data traversed. 2
3
.CC-BY-ND 4.0 International licensenot certified by peer review) is the author/funder. It is made available under aThe copyright holder for this preprint (which wasthis version posted December 24, 2015. . https://doi.org/10.1101/035295doi: bioRxiv preprint