interactive exploratory visualization of 2d vector fields
TRANSCRIPT

Eurographics/ IEEE-VGTC Symposium on Visualization 2008A. Vilanova, A. Telea, G. Scheuermann, and T. Möller(Guest Editors)
Volume 27 (2008), Number 3
Interactive Exploratory Visualization of 2D Vector Fields
Tobias Isenberg1,2 Maarten H. Everts1 Jens Grubert2 Sheelagh Carpendale2
1University of Groningen, The Netherlands 2University of Calgary, Canada
AbstractIn this paper we present several techniques to interactively explore representations of 2D vector fields. Througha set of simple hand postures used on large, touch-sensitive displays, our approach allows individuals to custom-design glyphs (arrows, lines, etc.) that best reveal patterns of the underlying dataset. Interactive exploration ofvector fields is facilitated through freedom of glyph placement, glyph density control, and animation. The customglyphs can be applied individually to probe specific areas of the data but can also be applied in groups to explorelarger regions of a vector field. Re-positionable sources from which glyphs—animated according to the local vectorfield—continue to emerge are used to examine the vector field dynamically. The combination of these techniquesresults in an engaging visualization with which the user can rapidly explore and analyze varying types of 2Dvector fields, using a virtually infinite number of custom-designed glyphs.
Categories and Subject Descriptors (according to ACM CCS): I.3.6 [Computer Graphics]: Methodology andTechniques—Interaction techniques; I.3.m [Computer Graphics]: Miscellaneous—Visualization
1. Introduction
Vector field data arises in many scientific and technicalapplications. Thus, vector and flow field visualization hasbeen an important research domain for visualization. Manysuccessful techniques have been developed to help peopleunderstand the properties of such datasets. However, tradi-tional vector field visualization typically relies on producingstatic images. For example, line integral convolution (LIC,[CL93]) or the extraction of topologic properties [LHZP07]both produce one image per vector field (or possibly an ani-mation or 3D shape) that can then be examined by the viewer.Using these techniques, exploration of a dataset is limited tosetting parameters for the automatic image generation andthen browsing through the final results. By providing tech-niques to interactively explore vector data in chosen regionsusing a set of custom-designed glyphs, we offer additionalexploration possibilities that go beyond simple parameterchanges of automated glyph placement algorithms.
Interactive exploratory visualization of vector fields al-lows people who need to analyze such information to probevector data locally, to place multiple glyphs to show larger-scale properties, and to place glyph sources to explore thedirectional properties of the data. Our interface allows peo-ple to use hand postures to sketch custom glyphs that are
best able to reveal data properties and supports interactivedistribution of these glyphs. This combination of custom-designed glyphs with direct-touch interaction through a min-imalistic interface enables users to both explore the data in-depth as well as to annotate traditional vector field renditions.We emphasize with our approach the necessity of physicallyand intuitively interacting with visualizations, rather thanjust tweaking parameters and observing their effects in stillimages. While our system works best on touch-sensitive walldisplays, it can also be used with desktop and mouse setups.
The paper is organized as follows. In Section 2 we re-view previous work related to our approach in the area ofvector visualization. Next, Section 3 introduces our conceptof interactive exploratory vector field visualization beforewe show possible application scenarios in Section 4. Sec-tion 5 reports on a preliminary evaluation of the presentedtechniques while Section 6 discusses technical aspects of therealization and points out some limitations. We conclude thepaper in Section 7 and suggest directions for future work.
2. Related Work
Previous work in vector field or flow visualization can beclassified in one of four categories [LHD∗04]: direct visual-
© 2008 The Author(s)Journal compilation © 2008 The Eurographics Association and Blackwell Publishing Ltd.Published by Blackwell Publishing, 9600 Garsington Road, Oxford OX4 2DQ, UK and350 Main Street, Malden, MA 02148, USA.

Tobias Isenberg, Maarten H. Everts, Jens Grubert, and Sheelagh Carpendale / Interactive Exploratory Visualization of 2D Vector Fields
ization, dense texture-based visualization, geometric visual-ization, and feature-based visualization. We discuss relatedapproaches according to each of these categories.
Direct visualization techniques use a direct mapping fromdata to visualization to produce an overall picture of the flow.A common approach is to position glyphs at grid points toconvey properties such as direction or velocity. A simple ex-ample is an arrow plot, but more complex glyphs have beenused to convey, e. g., uncertainty [WPL96]. Alternatively,simulated painted brush strokes can be used as glyphs to ob-tain non-photorealistic visualizations of multi-dimensionaldata elements [HTER04, THE07]. Kirby et al. [KML99], in-spired by layering in painting, use layers of glyphs and back-grounds to visualize different aspects of a vector dataset.
Texture-based techniques provide a dense view of the vec-tor field by computing a texture that conveys both localand global properties. Similar to the direct techniques, thesetexture-based techniques also provide an overall picture ofthe flow. Line Integral Convolution (LIC) [CL93] is an earlybut commonly used texture-based technique. While manyvariations of the LIC technique exist, both in 2D and 3D,the basic idea is that a noise texture is smeared out in thedirection of the vector field. More recent texture-based ap-proaches are image-based flow visualization [vW02] and thelevel-set based dye advection approach presented in [Wei04].Two-dimensional texture-based visualizations that have thesame spatial domain as the original data can be used in oursystem as background visualizations.
The last two groups are geometric and feature-based meth-ods. Geometric techniques integrate particle paths to formgeometric objects such as streamlines, streaklines, or path-lines. These can show the long-term behavior of a field andare related to our approach as the glyphs we are using some-times serve a similar purpose. Feature-based methods ex-tract features from the vector field and visualize them, re-sulting in potentially less cluttered visualizations. Examplesof such features include convergence, divergence, flow rota-tion, shear, and flow vorticity. A detailed account on feature-based flow visualization can be found in [PVH∗02] or, morerecently, for topology-based techniques in [LHZP07].
As studies have shown that visualizations that are custom-designed (e. g., by artists) with adequate tools can yield bet-ter results than standard methods [KKVL05], and that differ-ent visualization techniques for vector fields are suited forcertain tasks to varying degrees [LKJ∗05], we believe thatinteractive exploration of vector data is a promising path toinvestigate. Most existing literature on this subject focuseson the visualization of 3D vector fields and on generatingthose visualizations at interactive frame-rates, only few ap-proaches explore the interaction with the data. In [dLvW93]a method is presented that allows users to interactively probeand annotate 3D flow fields using complex glyphs that showfield properties such as velocity, shear, and rotation. In ad-dition, the approaches presented in [RAEM94, vTRvdM97,
KE01] allow people to customize glyphs to use for data vi-sualization by associating data values with glyph parameters.However, these customizations are restricted to simple geo-metric 3D glyph shapes. An interactive approach using dyeadvection is presented in [WBE05]. This work along withearlier work [MS92, Wei04] relate to our system in that theydiscuss the placement of sources and interactively computewhich part of the flow is affected by them.
3. Interacting with Vector Fields
Vector field visualizations tend to focus on creating globalrepresentations of the data. If the data sets are either large orcomplex, the resulting visualizations can have overwhelm-ing visual complexity. As a result it can be hard to pick outpertinent details and difficult to use these visualizations tocommunicate convincingly. We begin to address this visualcomplexity by providing personalization tools that enable:
• the creation and personalization of the actual glyphs tobe used: Glyphs can be designed to be more understand-able to the targeted group of people, and custom glyphsmay better reveal particular patterns in the data.
• the placement, and/or animation of glyphs in specifi-cally chosen locations: This enables us to control the vi-sual complexity by annotating visualizations in specificlocation only, extending these local annotations at will toincrease the visual complexity at a rate chosen to main-tain comprehensibility, and thus allowing our interactiontechniques to be used to create even large visualizations.
• emphasis and annotation: The capability for local vectorvisualization combined with the use of both personalizedglyphs and color provides for a great variety of possibili-ties for creating emphasis and adding annotation.
In keeping with our goals to provide simple, interactiveexploration tools for vector data, we look to develop a sim-ple interface by avoiding, when possible, a complex param-eterization of the program control by, instead, utilizing nat-ural hand postures. In this section we describe how thesegoals are realized. Building from the smallest component,the glyph, we start by describing how hand postures can beused to create a huge variety of personalized glyphs. Next,we outline the underlying framework that provides the ani-mation and simplifies the localization of visual effects. ThenSection 3.3 explains how, with the same postures, one cancreate and adjust the vector visualizations.
3.1. Hand-Designed Glyphs
Glyphs are frequently used to illustrate properties of vectorfields as they can show local data parameters by adaptingtheir orientation, size, and other properties. Also glyphs, bytheir shape, can communicate properties of the data. For in-stance, arrows are often used to indicate the directionality ofa field. Thus, glyphs are a natural choice as elements to workwith to enable users to interactively explore vector data.
© 2008 The Author(s)Journal compilation © 2008 The Eurographics Association and Blackwell Publishing Ltd.

Tobias Isenberg, Maarten H. Everts, Jens Grubert, and Sheelagh Carpendale / Interactive Exploratory Visualization of 2D Vector Fields
Figure 1: Examples for hand-sketched directional glyphs.
Figure 2: The four hand postures that can be recognized.
Traditionally, the design of glyphs used in vector fieldvisualizations was finalized before run-time or even beforecompile-time. This can lead to sub-optimal visualizations asglyphs often depend on the type of data that is being used.Therefore, we allow individuals to personally sketch and de-sign the glyphs that are used in visualizing the data (arrows,lines, etc.; see Figure 1). This provides the freedom to createglyphs that, for the intended usage, best reveal patterns in thecurrent vector data. In addition, sketching custom glyphs canallow individuals to more rapidly test out and realize ideaswith respect to given visualization tasks.
For the creation of personalized glyphs we support a num-ber of tasks: people can indicate when they are creatingglyphs and not interacting with the vector data, draw a vari-ety of lines to design glyphs, and erase these lines or parts ofthem. The touch screen we are using, the SMART Technolo-gies DViT, recognizes the center point of a touch interaction,the approximate size of the object that touches the screen,and detects when a pen has been picked up from a tray. Weuse this last function to signal a switch from vector data inter-action to glyph drawing mode. This follows the notion thatpicking up a pen indicates the intention to sketch or draw.
Next, to actually draw the glyph, people can use thepicked-up pen as well as hand postures to control the strokewidth: using the pen provides the thinnest lines while usingone finger, two fingers, and a fist creates increasingly thickerlines. The flat hand is used for erasing. These four simplehand postures are shown in Figure 2. For more details onthe identification of possible hand postures see [GCI08]. Ina nutshell, the postures can be distinguished by thresholdingthe touched surface area that the DViT provides. Factors thatrestrict the number of possible postures are the quality of thetouch area data and that the hand postures need to be easyto form for human hands. Theoretically we would be able totrack the lifting of more than one pen, increasing the possibil-ities for controlling aspects of the application. However, we
Figure 3: The area for sketching glyphs is displayed after apen has been picked up from the tray. The stroke’s width iscontrolled through postures as well as drawing speed, whileerasing is possible using a flat hand.
decided against this as more options would be increasinglydifficult to recall for users of the interface.
The described interactions allow people to sketch a widevariety of glyphs for use in vector field exploration and illus-tration (see example of sketching in Figure 3). As the vec-tor field’s direction is used to orient the glyphs, this conse-quently means that each glyph has an inherent directionality.We address this by employing the notion that the directionof a sketched glyph is straight up. In addition, the samplingpoint of the glyph is in the middle of the sketch area.
3.2. Interactive Glyph-Based Vector Fields
Using and interacting with a potentially high number ofglyphs on a large display also poses a number of challenges.Interaction should offer a way to affect certain glyph proper-ties. A system needs to be able to accommodate and rendera high number of glyphs without losing interactive speed.For this purpose we make use of interface buffers (i-buffers,[IMC06]). These i-buffers store properties (e. g., size, orien-tation, or color) in a spatial manner so that primitives canaccess them locally to update their appearance accordingly.By interactively changing the buffer contents it is now possi-ble to interact with the displayed primitives.
In order to visualize vector field data, we represent thevector directions in one of these i-buffers and the length ofthe vectors (i. e., the local strength of the field) in anotherone. These properties can now be used to control the appear-ance of glyphs whose location is projected to i-buffer posi-tions. The vector field’s direction is mapped to the orienta-tion of the glyph while the field’s strength is represented bythe glyph size. As glyphs move across the buffers, they con-stantly check for new values with respect to their positionand update their rendering accordingly. Alternatively, toolscan modify the values of the i-buffers, to update the repre-sentation of glyphs reading from them. We make use of thislatter technique, for instance, to control glyph transparency.
© 2008 The Author(s)Journal compilation © 2008 The Eurographics Association and Blackwell Publishing Ltd.

Tobias Isenberg, Maarten H. Everts, Jens Grubert, and Sheelagh Carpendale / Interactive Exploratory Visualization of 2D Vector Fields
Figure 4: Probing the dataset with a single glyph and theone-finger posture. The glyph is off-set to ensure its visibility.
3.3. Interactive Vector Field Exploration
Once custom glyphs have been designed, we use these to sup-port the interactive exploration of vector field data. For thispurpose we offer a second set of hand posture mappings forthe phase when the pen is placed in its tray (one finger, twofingers, fist, and flat hand). These mappings need to supportexploration tasks but also have to follow naturally from thepostures to provide an intuitive interface. We selected fourexploration actions for our visualizations: probing the vectorfield locally with a single glyph, placing a number of glyphssimultaneously at a larger scale, de-emphasizing and remov-ing glyphs, as well as placing and re-locating sources thatcontinuously emit glyphs which then start moving across thedata, following the vector field’s direction.
Probing the vector data is enabled with the one-finger pos-ture. When just one finger is placed on the display, the sys-tem automatically creates a new instance of the most recentlysketched glyph. While the finger is still touching the display,moving the finger also moves the glyph, whose renditionadapts to vector field’s data values below its current position(Figure 4). As fingers are relatively blunt tools (compared to,e. g., a mouse pointer’s tip), the glyph is off-set from the ac-tual finger position to the top left (top right for left-handedpeople) to guarantee visibility [PWS88]. As soon as the fin-ger is released from the screen, the glyph remains at its lastlocation, visualizing the local conditions at this point.
While the above interaction allows users to explore thedataset locally, the fist posture is employed to explore thevector field at a larger scale. By placing the fist on and mov-ing it across the screen, the system continuously emits newinstances of the most recently sketched glyph at random lo-cations [Dov95] within a radius around the interaction point(Figure 5). Using this technique, regions or the entire datasetcan be covered with glyphs within a short time to explorethe behavior of the field on a larger scale. We found rela-tively small and simple glyphs to be particularly useful forthis type of interaction as they do not cause too much visual
Figure 5: Exploring larger areas of the dataset using a fist.
Figure 6: Glyph de-emphasis & erasing using the flat hand.
clutter. The resulting images resemble those created by tech-niques which place short streamlines on vector data as wellas traditional glyph-based visualizations.
The flat-hand posture provides de-emphasis or can com-pletely erase glyphs (Figure 6), similar to its mapping in thesketching phase. De-emphasis of glyphs is realized by firstincreasing their transparency when the hand is first placed onthe display and only deleting glyphs once their transparencyhas reached a given threshold. This de-emphasis can be usedto provide an indication of the field’s general direction andsize properties. The probing interaction can be used on topof such a visualization to examine specific locations.
While static glyphs can be useful to explore a flow dataset,the display of animated glyphs following the streamlines canfurther aid the detection of patterns in the data. We offer ex-ploration with animated glyphs through the use of the two-finger posture to create glyph sources that can be placed onand moved over the dataset. Each source continuously emitsinstances of the most recently sketched glyph. The instancesare again generated at random positions within the radius ofthe glyph sources to allow users to explore local variations of
© 2008 The Author(s)Journal compilation © 2008 The Eurographics Association and Blackwell Publishing Ltd.
Tobias Isenberg, Maarten H. Everts, Jens Grubert, and Sheelagh Carpendale / Interactive Exploratory Visualization of 2D Vector Fields
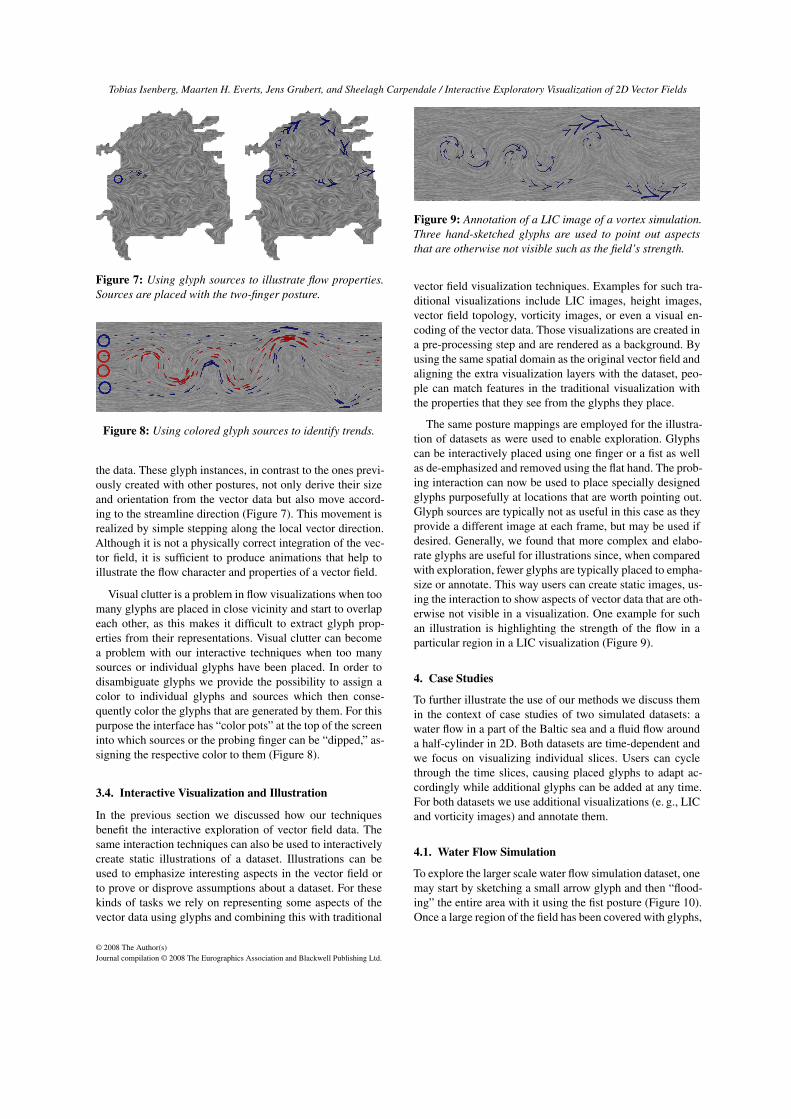
Figure 7: Using glyph sources to illustrate flow properties.Sources are placed with the two-finger posture.
Figure 8: Using colored glyph sources to identify trends.
the data. These glyph instances, in contrast to the ones previ-ously created with other postures, not only derive their sizeand orientation from the vector data but also move accord-ing to the streamline direction (Figure 7). This movement isrealized by simple stepping along the local vector direction.Although it is not a physically correct integration of the vec-tor field, it is sufficient to produce animations that help toillustrate the flow character and properties of a vector field.
Visual clutter is a problem in flow visualizations when toomany glyphs are placed in close vicinity and start to overlapeach other, as this makes it difficult to extract glyph prop-erties from their representations. Visual clutter can becomea problem with our interactive techniques when too manysources or individual glyphs have been placed. In order todisambiguate glyphs we provide the possibility to assign acolor to individual glyphs and sources which then conse-quently color the glyphs that are generated by them. For thispurpose the interface has “color pots” at the top of the screeninto which sources or the probing finger can be “dipped,” as-signing the respective color to them (Figure 8).
3.4. Interactive Visualization and Illustration
In the previous section we discussed how our techniquesbenefit the interactive exploration of vector field data. Thesame interaction techniques can also be used to interactivelycreate static illustrations of a dataset. Illustrations can beused to emphasize interesting aspects in the vector field orto prove or disprove assumptions about a dataset. For thesekinds of tasks we rely on representing some aspects of thevector data using glyphs and combining this with traditional
Figure 9: Annotation of a LIC image of a vortex simulation.Three hand-sketched glyphs are used to point out aspectsthat are otherwise not visible such as the field’s strength.
vector field visualization techniques. Examples for such tra-ditional visualizations include LIC images, height images,vector field topology, vorticity images, or even a visual en-coding of the vector data. Those visualizations are created ina pre-processing step and are rendered as a background. Byusing the same spatial domain as the original vector field andaligning the extra visualization layers with the dataset, peo-ple can match features in the traditional visualization withthe properties that they see from the glyphs they place.
The same posture mappings are employed for the illustra-tion of datasets as were used to enable exploration. Glyphscan be interactively placed using one finger or a fist as wellas de-emphasized and removed using the flat hand. The prob-ing interaction can now be used to place specially designedglyphs purposefully at locations that are worth pointing out.Glyph sources are typically not as useful in this case as theyprovide a different image at each frame, but may be used ifdesired. Generally, we found that more complex and elabo-rate glyphs are useful for illustrations since, when comparedwith exploration, fewer glyphs are typically placed to empha-size or annotate. This way users can create static images, us-ing the interaction to show aspects of vector data that are oth-erwise not visible in a visualization. One example for suchan illustration is highlighting the strength of the flow in aparticular region in a LIC visualization (Figure 9).
4. Case Studies
To further illustrate the use of our methods we discuss themin the context of case studies of two simulated datasets: awater flow in a part of the Baltic sea and a fluid flow arounda half-cylinder in 2D. Both datasets are time-dependent andwe focus on visualizing individual slices. Users can cyclethrough the time slices, causing placed glyphs to adapt ac-cordingly while additional glyphs can be added at any time.For both datasets we use additional visualizations (e. g., LICand vorticity images) and annotate them.
4.1. Water Flow Simulation
To explore the larger scale water flow simulation dataset, onemay start by sketching a small arrow glyph and then “flood-ing” the entire area with it using the fist posture (Figure 10).Once a large region of the field has been covered with glyphs,
© 2008 The Author(s)Journal compilation © 2008 The Eurographics Association and Blackwell Publishing Ltd.

Tobias Isenberg, Maarten H. Everts, Jens Grubert, and Sheelagh Carpendale / Interactive Exploratory Visualization of 2D Vector Fields
Figure 10: Exploring trends using the fist posture.
Figure 11: Illustrating the identified trends using the one-finger posture and a larger glyph.
the major streams in the flow and their strengths are revealed.After streams have been identified, one can delete all placedglyphs, draw a larger arrow as the next glyph, and use itto probe the field more precisely. By continuously leavingglyphs at interesting spots one can end up with an illustra-tion of the major flows on top of the LIC background image(Figure 11). Finally, to confirm the flow characteristics withanimated glyphs, one may draw a simple straight line glyphand place sources onto the dataset. By placing the sources atthe inflow of the water body one can reveal how the glyphsproceed along the major streams (Figure 12, left). This flowpattern may change significantly when a different time stepof the simulation is chosen which can reveal temporal rela-tionships between the time slices (Figure 12, right).
4.2. Turbulence Simulation
For exploring the small-scale water flow simulation around ahalf-cylinder, one can start by drawing an arrow without thecenter bar and probing the dataset with it, using the LIC im-age in the background as a guide and leaving instances of theglyph as annotations (Figure 13, top). Next, using the sameglyph, the fist posture is used to discover larger trends, in
Figure 12: Using sources to show the flow at different times.
Figure 13: Probing the dataset with few glyphs vs. revealingthe flow’s strength and direction using many glyphs.
particular the strength of the flow (Figure 13, bottom). Now,to illustrate the different rotation directions of the vorticesin the dataset, one can choose to draw an arrow that is bentclockwise, to show the vortices that rotate that way, and to re-peat the same action with a mirrored arrow for vortices thatrotate counter-clockwise (Figure 14, top). To further illus-trate the differences, the second set of arrows can be coloredin red to distinguish them from the first set which is blue.Finally, to confirm the findings of the previous step, the LICimage in the background is replaced by a visualization of thevorticity of the flow (Figure 14, bottom).
5. Preliminary Evaluation
In this section we report on some initial findings fromdomain scientists experimenting with our interaction tech-niques. We allowed them to work with both their own dataas well as datasets from other sources (such as the wind datain Figure 15). Generally we received very positive feedback.In particular, people liked the possibility to explore aspectsof new datasets to get an initial understanding: “This toolis very good when you do not yet understand your data.”
© 2008 The Author(s)Journal compilation © 2008 The Eurographics Association and Blackwell Publishing Ltd.

Tobias Isenberg, Maarten H. Everts, Jens Grubert, and Sheelagh Carpendale / Interactive Exploratory Visualization of 2D Vector Fields
Figure 14: Illustrating the rotation direction using bent ar-rows and using a vorticity visualization for confirmation.
Figure 15: Visualization of storm Emma hitting Europe.
People said that it “is much easier and faster” to use thantraditional tools (e. g., Gnuplot), in particular when specificglyphs are needed for highlighting or interpreting local fea-tures. Also, the option to place sources was liked very much.The interaction techniques were even seen as an interactivecommunication medium, for instance to discuss vector fieldproperties of or to share insights about the dataset with col-leagues. We also observed new ways to use the interactiontechniques that we did not expect. For instance, one persondrew a filled circle as glyph to only show the magnitude ofa dataset, blending out its directional aspect. In addition, wereceived interesting suggestions for extensions such as an op-tion to delete all generated glyphs at once, the use of entirelywhite backgrounds to only see the generated visualization,and the use of animation to provide a better overview.
6. Technical Realization Aspects and Limitations
The interactive vector field exploration system is imple-mented using OpenGL and relies on representing the vec-tor data in i-buffers [IMC06]. Each glyph is representedby an OpenGL quad that is texture-mapped with the pre-viously sketched glyph. During the glyph sketching phase,the strokes that form the glyphs are represented analyticallyin order to accommodate the easy erasing of parts of them.
Once the glyph is completed, the strokes are rendered in anoff-screen buffer and copied into an OpenGL texture.
Each glyph instance, at each animation step, looks up thei-buffer values for its position, i. e., its center. If this positiondoes not happen to fall exactly on one of the buffer values,the value is linearly interpolated. Transparency is maintainedby each glyph individually and is also modified through ani-buffer. For this purpose, the tool that is invoked by theflat hand posture writes transparency offsets into this sepa-rate i-buffer, while glyphs use this value to update their spe-cific transparency values. Glyphs are deleted once this valuedrops below a given threshold. Glyphs are also deleted whentheir size drops below a small threshold. This causes glyphsthat move out of the dataset to be deleted automatically asthe values in the background part of the size i-buffer are ini-tialized to zero. This ensures that no glyphs are maintainedor rendered longer than necessary, keeping the interactionresponsive and the animation running smoothly.
Our entire interactive system is realized on the CPU withi-buffers and data being maintained in main memory. Whilethis provides much flexibility for the implementation of theanimation, it also has its limits with respect to how muchdata can be accommodated. For example, not the entiredatasets shown in Section 4 (which contain a stack of timesteps) can be converted to screen-sized i-buffer data directly,as this would require more memory than is available on typ-ical PCs. Instead, whenever we switch between time steps,the current i-buffer set as well as the texture for the currentbackground visualization are created from the data. However,the smaller glyphs are all maintained as textures on the graph-ics card and we did not notice any problems even when usinga large number of different glyphs simultaneously.
While the presented approach works nicely for manydatasets, it may not be as powerful with very noisy vectordata that does not have strong “streams.” We experimented,for example, with vector fields extracted from diffusion ten-sor imaging (DTI) datasets which arise, for instance, in biol-ogy. In such cases where there are no clear trends it is alsodifficult to place meaningful glyphs with our technique toillustrate aspects of the dataset.
7. Conclusion and Future Work
In summary, we have presented a system for interactiveexploratory visualization of vector fields on large, touch-sensitive wall displays. By allowing users to sketch their ownglyphs we can let them create ones that work best for thespecific data. These custom glyphs can then be used to inter-actively explore vector fields as well annotate traditional vi-sualizations of a dataset. The interface is controlled throughhand postures which allow us to largely abstain from usingkeyboard or menus. Certainly, different mappings as well asinteractions are possible to control such a tool. Also, someparameters such as specific stroke widths, animation speeds,
© 2008 The Author(s)Journal compilation © 2008 The Eurographics Association and Blackwell Publishing Ltd.

Tobias Isenberg, Maarten H. Everts, Jens Grubert, and Sheelagh Carpendale / Interactive Exploratory Visualization of 2D Vector Fields
or thresholds to detect hand postures are hidden and/or em-pirically determined. We think, however, that limiting thenumber of exposed parameters in a minimalistic approachprovides an intuitive and easy-to-understand interface forflexible, human-guided visualization. Our technique comple-ments existing visualizations by facilitating intuitive explo-rations of data and later the illustration of specific aspects.
For future work we are considering a number of paths.For example, we would like to investigate how to show athird dimension of a vector field using either glyph shapeor color. We also want to include a more precise integrationmethod for moving glyphs. Special datasets may also requirea way to deal with sinks inside the vector field. In this casewe would need to track the position of glyphs to eventuallydelete them. In addition, other types of interaction could beinvestigated such as the zooming and/or panning of largedatasets or the interactive placement of chains of glyphs. Fi-nally, we are pursuing the use of different types of vectordatasets from various sources as well as a formal study ofthe interaction techniques with domain scientists.
Acknowledgments
We thank Kurt Frischmuth (Univ. of Rostock, Germany) forthe simulated dataset of the Greifswalder Bodden, MichelWestenberg (Univ. of Groningen, Netherlands) for the turbu-lence dataset, and GRIB.US for the weather data. We alsothank Petra Isenberg for her help with creating the video,Henk Bekker and Samuli Ollila for discussions on the tech-nique, and the anonymous reviewers for their valuable com-ments. We also thank our funding providers Alberta Igenuity,NWO, NSERC, CFI, iCORE, and SMART Technologies.
References
[CL93] CABRAL B., LEEDOM L. C.: Imaging Vector Fields us-ing Line Integral Convolution. In Proc. SIGGRAPH (New York,1993), ACM Press, pp. 263–270.
[dLvW93] DE LEEUW W., VAN WIJK J.: A Probe for Local FlowField Visualization. In Proc. IEEE VIS (Los Alamitos, 1993),IEEE Computer Society, pp. 39–45.
[Dov95] DOVEY D.: Vector Plots for Irregular Grids. InProc. IEEE VIS (Los Alamitos, 1995), IEEE Computer Society,pp. 248–253.
[GCI08] GRUBERT J., CARPENDALE S., ISENBERG T.: Interac-tive Stroke-Based NPR using Hand Postures on Large Displays.In Eurographics 2008 – Short Papers (Aire-la-Ville, Switzerland,2008), Eurographics Assoc., pp. 279–282.
[HTER04] HEALEY C. G., TATEOSIAN L., ENNS J. T., REMPLE
M.: Perceptually-Based Brush Strokes for Nonphotorealistic Vi-sualization. ACM Transactions on Graphics 23, 1 (Jan. 2004),64–96.
[IMC06] ISENBERG T., MIEDE A., CARPENDALE S.: A BufferFramework for Supporting Responsive Interaction in InformationVisualization Interfaces. In Proc. C5 (Los Alamitos, 2006), IEEEComputer Society, pp. 262–269.
[KE01] KRAUS M., ERTL T.: Interactive Data Exploration withCustomized Glyphs. In Proc. WSCG (2001), pp. 20–23.
[KKVL05] KEEFE D. F., KARELITZ D. B., VOTE E. L., LAID-LAW D. H.: Artistic Collaboration in Designing VR Visualiza-tions. Computer Graphics and Applications 25, 2 (Mar./Apr.2005), 18–23.
[KML99] KIRBY R. M., MARMANIS H., LAIDLAW D. H.: Vi-sualizing Multivalued Data from 2D Incompressible Flows UsingConcepts from Painting. In Proc. IEEE VIS (Los Alamitos, 1999),IEEE Computer Society, pp. 333–340.
[LHD∗04] LARAMEE R. S., HAUSER H., DOLEISCH H.,VROLIJK B., POST F. H., WEISKOPF D.: The State of the Art inFlow Visualization: Dense and Texture-Based Techniques. Com-puter Graphics Forum 23, 2 (June 2004), 203–221.
[LHZP07] LARAMEE R., HAUSER H., ZHAO L., POST F.:Topology-Based Flow Visualization, The State of the Art. InTopology-based Methods in Visualization, Hauser H., Hagen H.,Theisel H., (Eds.). Springer-Verlag, Berlin, 2007, pp. 1–19.
[LKJ∗05] LAIDLAW D. H., KIRBY R. M., JACKSON C. D.,DAVIDSON J. S., MILLER T. S., DA SILVA M., WARREN
W. H., TARR M. J.: Comparing 2D Vector Field VisualizationMethods: A User Study. IEEE Transactions on Visualization andComputer Graphics 11, 1 (Jan./Feb. 2005), 59–70.
[MS92] MA K.-L., SMITH P. J.: Virtual Smoke: An Interactive3D Flow Visualization Technique. In Proc. VIS (Los Alamitos,1992), IEEE Computer Society, pp. 46–53.
[PVH∗02] POST F. H., VROLIJK B., HAUSER H., LARAMEE
R. S., DOLEISCH H.: Feature Extraction and Visualization ofFlow Fields. In Eurographics 2002 State of the Art Reports. Eu-rographics Assoc., Aire-la-Ville, Switzerland, 2002, pp. 69–100.
[PWS88] POTTER R. L., WELDON L. J., SHNEIDERMAN B.: Im-proving the Accuracy of Touch Screens: An Experimental Evalu-ation of Three Strategies. In Proc. CHI (New York, 1988), ACMPress, pp. 27–32.
[RAEM94] RIBARSKY W., AYERS E., EBLE J., MUKHERJEA
S.: Glyphmaker: Creating Customized Visualizations of Com-plex Data. Computer 27, 7 (July 1994), 57–64.
[THE07] TATEOSIAN L. G., HEALEY C. G., ENNS J. T.: Engag-ing Viewers Through Nonphotorealistic Visualizations. In Proc.NPAR (New York, 2007), ACM Press, pp. 93–102.
[vTRvdM97] VAN TEYLINGEN R., RIBARSKY W., VAN DER
MAST C.: Virtual Data Visualizer. IEEE Transactions on Visual-ization and Computer Graphics 3, 1 (Jan.–Mar. 1997), 65–74.
[vW02] VAN WIJK J.: Image Based Flow Visualization. ACMTransactions on Graphics 21, 3 (July 2002), 745–754.
[WBE05] WEISKOPF D., BOTCHEN R. P., ERTL T.: InteractiveVisualization of Divergence in Unsteady Flow by Level-Set DyeAdvection. In Proc. SimVis (Erlangen, 2005), SCS European Pub-lishing House, pp. 221–232.
[Wei04] WEISKOPF D.: Dye Advection without the Blur: ALevel-Set Approach for Texture-Based Visualization of UnsteadyFlow. Computer Graphics Forum 23, 3 (Sept. 2004), 479–488.
[WPL96] WITTENBRINK C. M., PANG A. T., LODHA S. K.:Glyphs for Visualizing Uncertainty in Vector Fields. IEEETransactions on Visualization and Computer Graphics 2, 3 (Sept.1996), 266–279.
© 2008 The Author(s)Journal compilation © 2008 The Eurographics Association and Blackwell Publishing Ltd.