interactive hierarchical dimension ordering, spacing …davis.wpi.edu/~xmdv/docs/tr0313_osf.pdf ·...
TRANSCRIPT

Interactive Hierarchical Dimension Ordering, Spacing and Filtering forExploration of High Dimensional Datasets
Jing Yang, Wei Peng, Matthew O. Ward and Elke A. RundensteinerComputer Science DepartmentWorcester Polytechnic Institute
Worcester, MA 01609fyangjing,debbie,matt,[email protected] �
Abstract
Large numbers of dimensions not only cause clutter in multi-dimensional visualizations, but also make it difficult for users tonavigate the data space. Effective dimension management, suchas dimension ordering, spacing and filtering, is critical for visualexploration of such datasets. Dimension ordering and spacingexplicitly reveal dimension relationships in arrangement-sensitivemultidimensional visualization techniques, such as Parallel Coor-dinates, Star Glyphs, and Pixel-Oriented techniques. They facil-itate the visual discovery of patterns within the data. Dimensionfiltering hides some of the dimensions to reduce clutter while pre-serving the major information of the dataset.
In this paper, we propose an interactive hierarchical dimensionordering, spacing and filtering approach, called DOSFA. DOSFAis based on dimension hierarchies derived from similarities amongdimensions. It is a scalable multi-resolution approach making di-mensional management a tractable task. On the one hand, it auto-matically generates default settings for dimension ordering, spac-ing and filtering. On the other hand, it allows users to efficientlycontrol all aspects of this dimension management process via vi-sual interaction tools for dimension hierarchy manipulation. Acase study visualizing a dataset containing over 200 dimensionsreveals how our proposed approach greatly improves the effec-tiveness of high dimensional visualization techniques.
Keywords: dimension ordering, dimension spacing, dimen-sion filtering, multidimensional visualization, high dimensionaldatasets
1 Introduction
High dimensional datasets are becoming commonplace in appli-cations such as digital libraries, bioinformatics, simulations, pro-cess monitoring, and surveys. They bring an important issue toexisting multi-dimensional visualization techniques - dimensionmanagement. Without effective dimension management, such asdimension ordering, spacing and filtering, high dimensional visu-alizations can be cluttered and difficult for users to navigate thedata space. For example, a 200 dimensional data set means 40000plots for Scatterplot Matrices [7], 200 axes for Parallel Coordi-nates [13, 22], 200 subwindows for Recursive Pattern [15], and200 arms for Star Glyphs [19].
The order of dimensions is crucial for the effectiveness of alarge number of visualization techniques [2]. For example, inmany multidimensional visualization techniques, such as Parallel
�This work was supported under NSF grants IIS-9732897, IRIS-9729878, and IIS-0119276.
Coordinates [13, 22], Star Glyphs [19], Circle Segments [3] andRecursive Pattern [15], the dimensions have to be positioned insome one- or two- dimensional arrangement on the screen. Thischosen arrangement of dimensions can have a major impact onthe expressiveness of the visualization because the relationshipsamong adjacent dimensions are easier to detect than relationshipsamong dimensions positioned far from each other. Another ex-ample is attribute mapping. In visualizations such as ChernoffFaces [6], Worlds within Worlds [9], and Dimensional Stacking[17], more important dimensions need to be mapped to more pre-attentive visual attributes, such as more important features of theface in Chernoff Faces, axes appearing earlier in Worlds withinWorlds, and outer dimensions in Dimensional Stacking. Dimen-sion ordering targets these problems, and aims to improve theeffectiveness of the visualization by giving reasonable orders tothe dimensions so that users can easily detect relationships or paymore attention to more important dimensions.
In several multidimensional visualization techniques, such asParallel Coordinates [13, 22] and Star Glyphs [19], uniform spac-ing/angles are placed by default between two adjacent axes in thedisplay. We conjecture that non-uniform spacing could be used toconvey information about dimensions, such as similarity betweenadjacent dimensions or structure of the dimension space.
Dimension filtering removes some of the dimensions from thedisplay. It is essential for visualizing high dimensional datasets.For datasets contains several hundreds or more dimensions, noneof the existing multidimensional visualization techniques can mapall the dimensions at the same time without cluttering the display.Popular dimension reduction approaches, such as Principal Com-ponent Analysis [14], Multidimensional Scaling [18], and Koho-nen’s Self Organizing Maps [16, 10], condense the hundreds orthousands of dimensions into a few dimensions. However, thosegenerated dimensions have little intuitive meaning to users and al-low little user interaction. Dimension filtering is more intuitive tousers in that the remaining dimensions are all original dimensionsin the dataset so that they are all meaningful. Dimension filteringis also more flexible in that it allows users to interactively selector unselect dimensions to be filtered.
In this paper, we propose a general approach to dimension man-agement for high dimensional visualization. Our solution is aninteractive hierarchical dimension management approach calledDOSFA (Dimension Ordering, Spacing, and Filtering Approach).It supports both automatic as well as interactive means of dimen-sion ordering, spacing and filtering.
To reveal how DOSFA improves the effectiveness of high di-mensional visualization techniques, we present a case study in thispaper that visualizes the OHSUMED dataset, which contains theword-counts of a medical abstract collection [12]. It contains 215

dimensions and 298 data points.The remainder of this paper is organized as follows. In Sec-
tion 2, we review related work. In Section 3, we introduce thedimension hierarchy construction and navigation processes fun-damental to our DOSFA approach. In Sections 4, 5 and 6 wepresent our semi-automatic dimension ordering, spacing and fil-tering approaches. In Section 7, we present our conclusions andfuture work.
2 Background
Dimension order is an important issue in visualization. Bertingave some examples illustrating that permutations of dimensionsand data items reveal patterns and improve the comprehension ofvisualizations [4]. Ankerst et. al. [2] pointed out the importance ofdimension arrangement for order-sensitive multidimensional vi-sualization techniques. They defined the concept of similaritybetween dimensions and discussed several similarity measures.They proposed the idea of rearranging the dimensions such thatdimensions showing a similar behavior are positioned close to oneanother. They proved that this is an NP-complete problem equiv-alent to the traveling salesman problem, and used an automaticheuristic approach to generate a solution. Our dimension orderingapproach is different from their approach in that we impose a hi-erarchical structure over the dimensions to reduce the complexityof the ordering problem and allow efficient user interactions.
Dimension order is also important for many other fields. Forinstance, the database primitive similarity join has been used tospeed up applications such as similarity search, data analysis anddata mining. Its computational overhead is mostly dedicated tothe final distance computations between the feature dimensions.Bohm et. al.[5] proposed a generic technique to avoid and accel-erate the distance calculations between those dimensions by care-fully ordering them according to a probability model.
Manual dimension ordering and filtering are available in manymultidimensional visualization systems. For example, Polaris [20]allows users to manually select and order the dimensions to bemapped to the display. Microsoft Excel allows users to change theorder of the dimension by drag-and-drop operations. In XmdvTool[1], users manually filter dimensions and change the order of thedimensions from a reconfigurable list of dimensions. Althoughmanual dimension ordering and filtering as found in such tools aresufficient for low dimensional datasets, they become cumbersomefor high dimensional datasets.
Conveying information using spacing in the display has manyapplications. Many tree drawing algorithms [11, 8] use spacing toconvey structural information about the tree. Ward [21] used thedistance between adjacent glyphs to convey their relationship inan N dimensional space. In our approach, we propose to use thespacing between dimensions to indicate similarity between adja-cent dimensions or structure of the dimension space.
The idea of using dimension hierarchies to facilitate dimensionordering, spacing and filtering is inspired by our previous work onVisual Hierarchy Dimension Reduction (VHDR) [24]. In VHDR,dimensions in a high dimensional dataset are grouped into a di-mension hierarchy according to their similarities. Users select in-teresting dimension clusters and display them instead of the orig-inal dimensions in order to reduce the dimensionality of the dis-play.
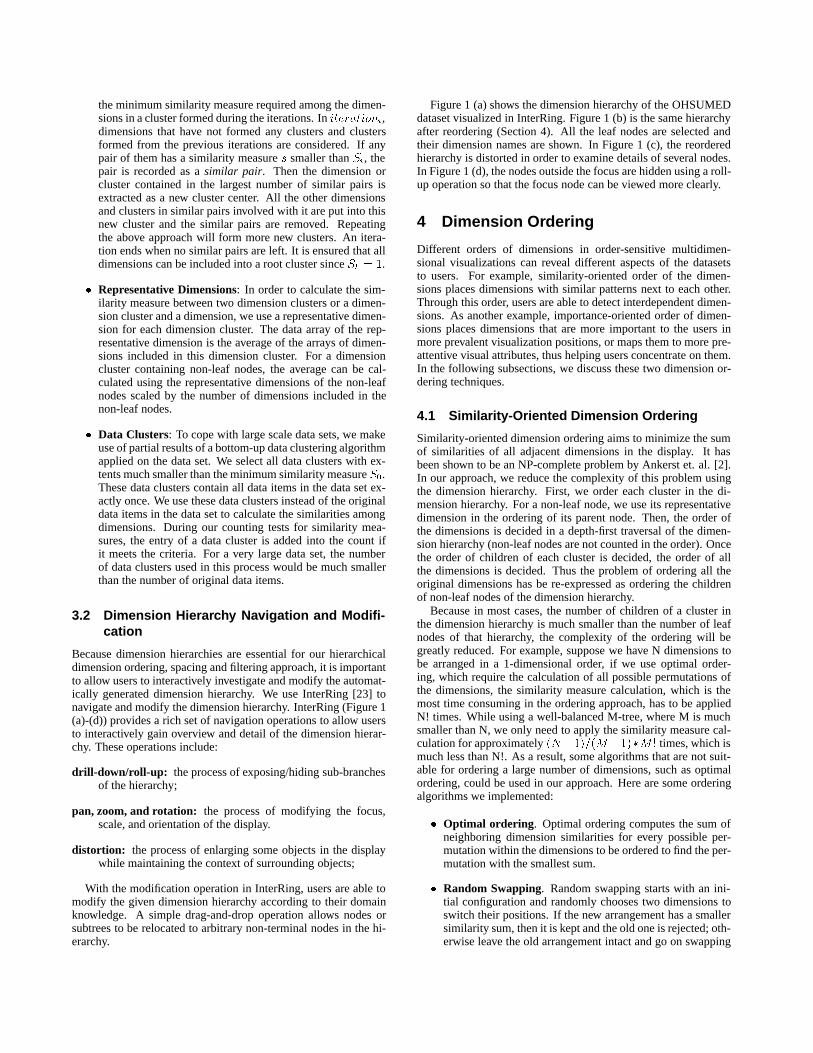
InterRing [23] (Figure 1 (a)-(d)) is an interactive radial spacefilling tree visualization tool we designed for visualizing a dimen-sion hierarchy. InterRing is generated using the rules that deepernodes of the hierarchy are drawn further from the center; child
nodes are drawn within the arc subtended by their parents, andthe sweep angle of a non-leaf node is equal to the aggregation ofthat of all its children. InterRing provides a rich set of interactivetools for panning/zooming, rolling-up/drilling-down, multi-focusdistortion, modification, reordering, and selection.
3 Dimension Hierarchy
Our hierarchical dimension ordering, spacing and filtering ap-proach is based on dimension hierarchies derived from similaritiesamong dimensions. The problem of determining the similarity ofdimensions was characterized by Ankerst et. al. [2] as follows:The database containing N data items with d-dimensions can bedescribed as d arrays Ai(0 <= i < d), each containing N realnumbers ai;k (0 <= k < N ). A similarity measure S mapstwo such arrays to a real number. It also might be called a dis-similarity measure because large numbers mean high dissimilaritywhereas zero means identity. Similarity can be defined in variousways. Often it is highly domain-dependent. Detailed informationof similarity measures between two dimensions can be found in[2]. In this paper, we assume that 0 <= S <= 1.
Currently, we use an efficient counting test to decide if the sim-ilarity measure between two dimensions is lower than a certainsimilarity measure threshold. Given a similarity measure thresh-old S, the idea of our approach is that if most data items in thedataset have lower or equal dissimilarities than S when evaluatingtwo dimensions, then the similarity measure of these two dimen-sions passes the counting test and is lower than S. Those dataitems that have higher dissimilarities than S are defined as out-liers. Given an acceptable outlier percentage O, the number ofoutliers must be lower than O � N to pass the counting test. Thisapproach is flexible in that users can change the outlier percentagein order to constrain or relax the similarity measure.
Using a dimension clustering approach (described in Section3.1), we group similar dimensions into clusters and similar clus-ters into larger clusters, resulting in a dimension hierarchy. Byorganizing the original dimensions of a high dimensional datasetsinto a dimension hierarchy, we are able to switch the problem ofordering, spacing, and filtering of all the original dimensions tothe problem of ordering, spacing, and filtering of the child nodesof each cluster in the dimension hierarchy. This then scales downthe problems and reducing their complexity.
3.1 Dimension Hierarchy Construction
We construct dimension hierarchies using a dimension clusteringapproach. Generally speaking, as long as the similarity measurebetween two dimensions is defined, any one of several existingdata clustering algorithms can be used to generate the dimen-sion hierarchy; the similarity measure between two dimensionsin dimension clustering corresponds to distance between two dataitems and dimensions in dimension clustering correspond to dataitems in data clustering. We briefly describe a bottom-up ag-glomerative dimension clustering algorithm we implemented asfollows. For more detail information, refer to [24].
� Iterative Clustering: We use a bottom-up clustering ap-proach with a user defined number of iterations I . The itera-tions are performed in the order of iteration0, iteration1,..., iterationI . The iterations correspond to a series of in-creasing similarity measure thresholds Si (0 <= i < I ,Si < Sj if i < j, S0 = 0, SI = 1). These thresholds are
the minimum similarity measure required among the dimen-sions in a cluster formed during the iterations. In iterationi,dimensions that have not formed any clusters and clustersformed from the previous iterations are considered. If anypair of them has a similarity measure s smaller than Si, thepair is recorded as a similar pair. Then the dimension orcluster contained in the largest number of similar pairs isextracted as a new cluster center. All the other dimensionsand clusters in similar pairs involved with it are put into thisnew cluster and the similar pairs are removed. Repeatingthe above approach will form more new clusters. An itera-tion ends when no similar pairs are left. It is ensured that alldimensions can be included into a root cluster since SI = 1.
� Representative Dimensions: In order to calculate the sim-ilarity measure between two dimension clusters or a dimen-sion cluster and a dimension, we use a representative dimen-sion for each dimension cluster. The data array of the rep-resentative dimension is the average of the arrays of dimen-sions included in this dimension cluster. For a dimensioncluster containing non-leaf nodes, the average can be cal-culated using the representative dimensions of the non-leafnodes scaled by the number of dimensions included in thenon-leaf nodes.
� Data Clusters: To cope with large scale data sets, we makeuse of partial results of a bottom-up data clustering algorithmapplied on the data set. We select all data clusters with ex-tents much smaller than the minimum similarity measure S0.These data clusters contain all data items in the data set ex-actly once. We use these data clusters instead of the originaldata items in the data set to calculate the similarities amongdimensions. During our counting tests for similarity mea-sures, the entry of a data cluster is added into the count ifit meets the criteria. For a very large data set, the numberof data clusters used in this process would be much smallerthan the number of original data items.
3.2 Dimension Hierarchy Navigation and Modifi-cation
Because dimension hierarchies are essential for our hierarchicaldimension ordering, spacing and filtering approach, it is importantto allow users to interactively investigate and modify the automat-ically generated dimension hierarchy. We use InterRing [23] tonavigate and modify the dimension hierarchy. InterRing (Figure 1(a)-(d)) provides a rich set of navigation operations to allow usersto interactively gain overview and detail of the dimension hierar-chy. These operations include:
drill-down/roll-up: the process of exposing/hiding sub-branchesof the hierarchy;
pan, zoom, and rotation: the process of modifying the focus,scale, and orientation of the display.
distortion: the process of enlarging some objects in the displaywhile maintaining the context of surrounding objects;
With the modification operation in InterRing, users are able tomodify the given dimension hierarchy according to their domainknowledge. A simple drag-and-drop operation allows nodes orsubtrees to be relocated to arbitrary non-terminal nodes in the hi-erarchy.
Figure 1 (a) shows the dimension hierarchy of the OHSUMEDdataset visualized in InterRing. Figure 1 (b) is the same hierarchyafter reordering (Section 4). All the leaf nodes are selected andtheir dimension names are shown. In Figure 1 (c), the reorderedhierarchy is distorted in order to examine details of several nodes.In Figure 1 (d), the nodes outside the focus are hidden using a roll-up operation so that the focus node can be viewed more clearly.
4 Dimension Ordering
Different orders of dimensions in order-sensitive multidimen-sional visualizations can reveal different aspects of the datasetsto users. For example, similarity-oriented order of the dimen-sions places dimensions with similar patterns next to each other.Through this order, users are able to detect interdependent dimen-sions. As another example, importance-oriented order of dimen-sions places dimensions that are more important to the users inmore prevalent visualization positions, or maps them to more pre-attentive visual attributes, thus helping users concentrate on them.In the following subsections, we discuss these two dimension or-dering techniques.
4.1 Similarity-Oriented Dimension Ordering
Similarity-oriented dimension ordering aims to minimize the sumof similarities of all adjacent dimensions in the display. It hasbeen shown to be an NP-complete problem by Ankerst et. al. [2].In our approach, we reduce the complexity of this problem usingthe dimension hierarchy. First, we order each cluster in the di-mension hierarchy. For a non-leaf node, we use its representativedimension in the ordering of its parent node. Then, the order ofthe dimensions is decided in a depth-first traversal of the dimen-sion hierarchy (non-leaf nodes are not counted in the order). Oncethe order of children of each cluster is decided, the order of allthe dimensions is decided. Thus the problem of ordering all theoriginal dimensions has be re-expressed as ordering the childrenof non-leaf nodes of the dimension hierarchy.
Because in most cases, the number of children of a cluster inthe dimension hierarchy is much smaller than the number of leafnodes of that hierarchy, the complexity of the ordering will begreatly reduced. For example, suppose we have N dimensions tobe arranged in a 1-dimensional order, if we use optimal order-ing, which require the calculation of all possible permutations ofthe dimensions, the similarity measure calculation, which is themost time consuming in the ordering approach, has to be appliedN! times. While using a well-balanced M-tree, where M is muchsmaller than N, we only need to apply the similarity measure cal-culation for approximately (N�1)=(M�1)�M ! times, which ismuch less than N!. As a result, some algorithms that are not suit-able for ordering a large number of dimensions, such as optimalordering, could be used in our approach. Here are some orderingalgorithms we implemented:
� Optimal ordering. Optimal ordering computes the sum ofneighboring dimension similarities for every possible per-mutation within the dimensions to be ordered to find the per-mutation with the smallest sum.
� Random Swapping. Random swapping starts with an ini-tial configuration and randomly chooses two dimensions toswitch their positions. If the new arrangement has a smallersimilarity sum, then it is kept and the old one is rejected; oth-erwise leave the old arrangement intact and go on swapping
another pair of dimensions. Keep doing this for a certainnumber of times. This is not an optimal approach for re-ordering dimensions, but it is more applicable for large num-ber of dimensions.
An approximate dimension ordering approach is to directly usethe depth-first traversal result of a dimension hierarchy withoutreordering it. The reason is that in dimension hierarchies, similar-ities among siblings within a cluster are controlled within certainranges. In other words, the similarities among the children of adimension cluster are similar. Thus with a good dimension hierar-chy, we should get a reasonable order of the original dimensionseven without reordering the hierarchy.
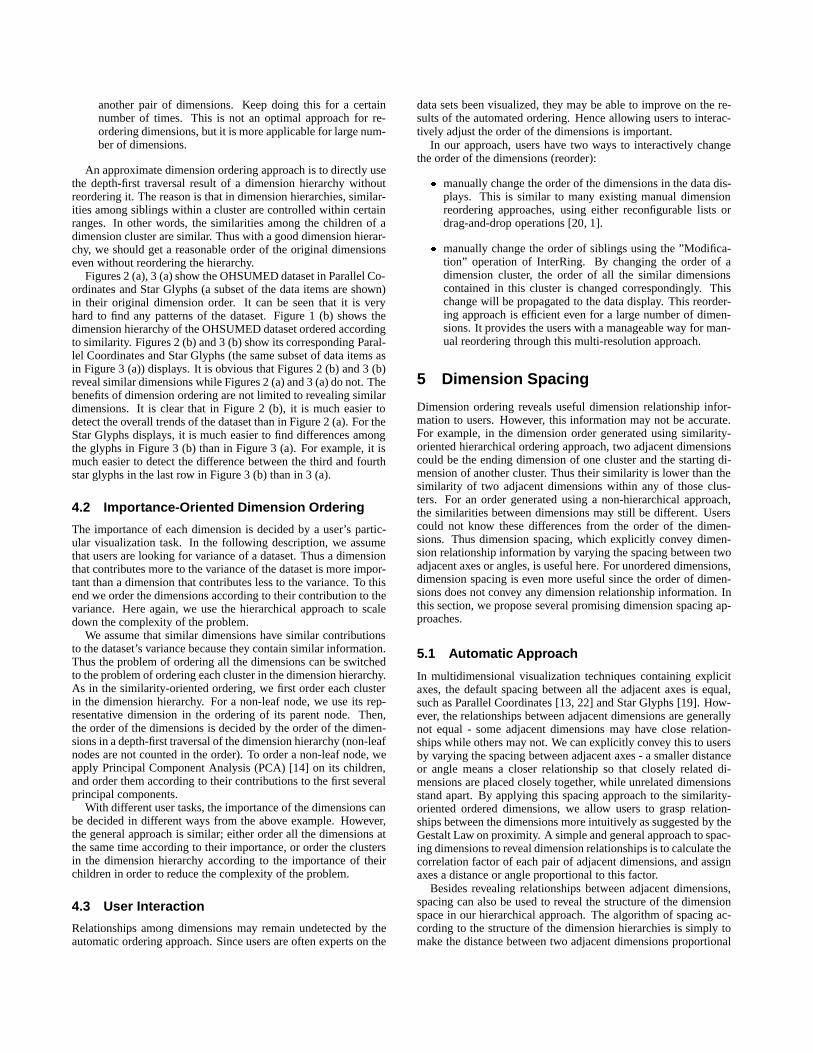
Figures 2 (a), 3 (a) show the OHSUMED dataset in Parallel Co-ordinates and Star Glyphs (a subset of the data items are shown)in their original dimension order. It can be seen that it is veryhard to find any patterns of the dataset. Figure 1 (b) shows thedimension hierarchy of the OHSUMED dataset ordered accordingto similarity. Figures 2 (b) and 3 (b) show its corresponding Paral-lel Coordinates and Star Glyphs (the same subset of data items asin Figure 3 (a)) displays. It is obvious that Figures 2 (b) and 3 (b)reveal similar dimensions while Figures 2 (a) and 3 (a) do not. Thebenefits of dimension ordering are not limited to revealing similardimensions. It is clear that in Figure 2 (b), it is much easier todetect the overall trends of the dataset than in Figure 2 (a). For theStar Glyphs displays, it is much easier to find differences amongthe glyphs in Figure 3 (b) than in Figure 3 (a). For example, it ismuch easier to detect the difference between the third and fourthstar glyphs in the last row in Figure 3 (b) than in 3 (a).
4.2 Importance-Oriented Dimension Ordering
The importance of each dimension is decided by a user’s partic-ular visualization task. In the following description, we assumethat users are looking for variance of a dataset. Thus a dimensionthat contributes more to the variance of the dataset is more impor-tant than a dimension that contributes less to the variance. To thisend we order the dimensions according to their contribution to thevariance. Here again, we use the hierarchical approach to scaledown the complexity of the problem.
We assume that similar dimensions have similar contributionsto the dataset’s variance because they contain similar information.Thus the problem of ordering all the dimensions can be switchedto the problem of ordering each cluster in the dimension hierarchy.As in the similarity-oriented ordering, we first order each clusterin the dimension hierarchy. For a non-leaf node, we use its rep-resentative dimension in the ordering of its parent node. Then,the order of the dimensions is decided by the order of the dimen-sions in a depth-first traversal of the dimension hierarchy (non-leafnodes are not counted in the order). To order a non-leaf node, weapply Principal Component Analysis (PCA) [14] on its children,and order them according to their contributions to the first severalprincipal components.
With different user tasks, the importance of the dimensions canbe decided in different ways from the above example. However,the general approach is similar; either order all the dimensions atthe same time according to their importance, or order the clustersin the dimension hierarchy according to the importance of theirchildren in order to reduce the complexity of the problem.
4.3 User Interaction
Relationships among dimensions may remain undetected by theautomatic ordering approach. Since users are often experts on the
data sets been visualized, they may be able to improve on the re-sults of the automated ordering. Hence allowing users to interac-tively adjust the order of the dimensions is important.
In our approach, users have two ways to interactively changethe order of the dimensions (reorder):
� manually change the order of the dimensions in the data dis-plays. This is similar to many existing manual dimensionreordering approaches, using either reconfigurable lists ordrag-and-drop operations [20, 1].
� manually change the order of siblings using the ”Modifica-tion” operation of InterRing. By changing the order of adimension cluster, the order of all the similar dimensionscontained in this cluster is changed correspondingly. Thischange will be propagated to the data display. This reorder-ing approach is efficient even for a large number of dimen-sions. It provides the users with a manageable way for man-ual reordering through this multi-resolution approach.
5 Dimension Spacing
Dimension ordering reveals useful dimension relationship infor-mation to users. However, this information may not be accurate.For example, in the dimension order generated using similarity-oriented hierarchical ordering approach, two adjacent dimensionscould be the ending dimension of one cluster and the starting di-mension of another cluster. Thus their similarity is lower than thesimilarity of two adjacent dimensions within any of those clus-ters. For an order generated using a non-hierarchical approach,the similarities between dimensions may still be different. Userscould not know these differences from the order of the dimen-sions. Thus dimension spacing, which explicitly convey dimen-sion relationship information by varying the spacing between twoadjacent axes or angles, is useful here. For unordered dimensions,dimension spacing is even more useful since the order of dimen-sions does not convey any dimension relationship information. Inthis section, we propose several promising dimension spacing ap-proaches.
5.1 Automatic Approach
In multidimensional visualization techniques containing explicitaxes, the default spacing between all the adjacent axes is equal,such as Parallel Coordinates [13, 22] and Star Glyphs [19]. How-ever, the relationships between adjacent dimensions are generallynot equal - some adjacent dimensions may have close relation-ships while others may not. We can explicitly convey this to usersby varying the spacing between adjacent axes - a smaller distanceor angle means a closer relationship so that closely related di-mensions are placed closely together, while unrelated dimensionsstand apart. By applying this spacing approach to the similarity-oriented ordered dimensions, we allow users to grasp relation-ships between the dimensions more intuitively as suggested by theGestalt Law on proximity. A simple and general approach to spac-ing dimensions to reveal dimension relationships is to calculate thecorrelation factor of each pair of adjacent dimensions, and assignaxes a distance or angle proportional to this factor.
Besides revealing relationships between adjacent dimensions,spacing can also be used to reveal the structure of the dimensionspace in our hierarchical approach. The algorithm of spacing ac-cording to the structure of the dimension hierarchies is simply tomake the distance between two adjacent dimensions proportional

to the threshold used to form their first common ascendant. Thus adimension will have a smaller distance or angle to its adjacent di-mension if the adjacent dimension belongs to the same cluster thanif it belongs to a different cluster. Also, if two adjacent dimensionsbelong to the same cluster, their distance or angle is smaller if thethreshold used to form that cluster is smaller. Because the thresh-old used to form a cluster reflects similarity of its children in thedimension hierarchy, the spacing calculated using this algorithmalso reveals the similarity of the adjacent dimensions along withthe overall structure of the dimension space.
The Parallel Coordinates display of the OHSUMED dataset inFigure 2 (b) has been spaced according to the structure of the di-mension hierarchy. It is easy to detect some closely related dimen-sions, and some dimensions that are fairly different from adjacentdimensions from this figure. Figure 2 (c) is a zoomed display ofFigure 2 (b). It can be seen that in the OHSUMED dataset, whichcontains word-counts in a medical abstract collection, the word“glucose” appears in similar frequency to the word “insulin” inmost articles.
5.2 Interactive Control
For high dimensional datasets, the displays might still be cluttereddespite dimension spacing. Thus it is important to allow users tointeractively enlarge or decrease the distance of adjacent dimen-sions so that they can examine as well as hide detail of interestingor uninteresting dimensions and relationships. In our approach,we provide three ways to allow users to interactively change thedistances between dimensions.
� zooming in/out and panning. We allow users to zoom the xand/or y directions so that, for visualization techniques suchas Parallel Coordinates, horizontal zooming will only affectthe distances between axes.
� manual distortion. When the display is in distortion mode,users can left click between two axes to increase their spac-ing, or right click to decrease it.
� structure-based spacing distortion.
Zooming and panning keeps the original spacing of the dimen-sions, however, context is lost when users are examining details.Manual distortion preserves the context, however, the local spac-ing in the distorted area is lost. In addition, it can be tedious whenusers want to examine details of many dimensions at the sametime. When the dimensionality of the dataset is high, it is alsodifficult to specify a distortion because the spacing between mostdimensions is very small. Structure-based spacing distortion ad-dresses these shortcomings.
Structure-based spacing distortion is linked to structure-basedcircular distortion of InterRing [23], the dimension hierarchy visu-alization. Structure-based circular distortion allows users to pro-portionally enlarge/decrease all descendants in clusters throughsimple drag-and-drop operations. Figure 1 (c) shows a distorteddimension hierarchy in InterRing. A cluster and all its descen-dants are enlarged by one drag-and-drop operation. We propagatethis distortion to dimension spacing in data displays. Thus whena node in InterRing presenting a dimension is enlarged/decreased,the spacing around the dimension is also enlarged/decreased.
Particularly, we adjust the dimension spacing algorithm so thatthe spacing between two adjacent dimensions is decided by theproduct of two parameters: the spacing parameter and the distor-tion parameter. The spacing parameter is the distance or angledecided by the algorithm described in Section 5.1 that reflects the
relationship between these two dimensions. The distortion param-eter is specified by the distortion degree of the nodes representingthese two dimensions in InterRing. We choose the larger of thetwo so that for an enlarged leaf node in InterRing, the spacingaround its corresponding dimension is also enlarged proportion-ally.
Many advantages of structure-based distortion in InterRinghave propagated to structure-based spacing distortion, such as:
� Spacing of a cluster of dimensions can be distorted using asingle drag-and-drop operation.
� Details can be examined within their context.
� Local spacing inside the enlarged or decreased area has beenpreserved.
� Multiple foci can coexist. Users can enlarge or decrease sev-eral areas in the same display.
In Figure 1 (c), the dimension hierarchy is distorted usingstructure-based distortion. Figure 3 (c) shows part of the StarGlyphs display linked to Figure 1 (c) with structure-based spac-ing distortion. It is clear that structure-based spacing distortionhelps users to see details within context.
6 Dimension Filtering
6.1 Automatic Approach
When the dimensionality is fairly large, even if we apply order-ing and spacing of the dimensions to the display, it still may becrowded. Very similar dimensions may likely be cluttered to-gether. In this case, we would like to filter some dimensions toreduce the clutter problem while at the same time retaining mostof information in the dataset. This could be done manually, auto-matically, or semi-automatically. We propose a dimension filter-ing approach that automatically generates a default filtering result,while allowing users to interactively modify it. We claim that auto-matically generating a default result is important for high dimen-sional datasets, and user interactions are also necessary becauseimprovements can usually be made on automatic approaches.
Our dimension filtering approach is also based on the dimen-sion hierarchy. In this approach, we use a filtering criterion that isa combination of the dimension similarity and importance. We as-sume that if some dimensions are very similar to each other, thenonly one of them should be left in the display. We also assumethat if some dimensions are fairly unimportant for a user’s visual-ization task, then they should not be displayed. Thus a similaritythreshold and an importance threshold are used in the filtering.The algorithm to select dimensions for display is an iterative ap-proach starting from the root of the dimension hierarchy. Eachiteration contains the following steps:
1. Check if the node’s importance is smaller than the impor-tance threshold; if yes, ignore the node and return. That is,the dimensions contained in unimportant nodes are ignored.
2. If it is not ignored and it is a leaf node, select it and return.
3. Otherwise check the threshold used to form the node. If itis larger than the similarity threshold, apply the iterative ap-proach on its immediate descendants. Otherwise only applythe iterative approach on its most important immediate de-scendant.

Figures 2 (d), 3 (d) and 4 (b) give examples of dimension filter-ing. Comparing Figures 1 (b), 4 (b) with 2 (d), 3 (d) (remainingdimensions in Figures 2 (d) and 3 (d) keep the same order as inFigures 2 (b) and 3 (b)), we find that the filtering retains the majorinformation of the dataset fairly well, while in the filtered displays,the number of dimensions is much more manageable compared tothe unfiltered ones. In Figure 4 (b), the Scatterplot Matrix displayof the OHSUMED dataset, there are so many plots that individualplots cannot be discerned without significant zooming.. While inFigure 4 (d), the number of plots has been greatly reduced.
6.2 Interactive Filtering
It is possible that the automatic filtering process might filter outsome dimensions that a user is concerned about, or keep somedimensions that a user finds uninteresting. It is therefore importantto allow users to interactively adjust filtering results.
The automatic filtering (Section 6.1) is a recursive process star-ing from the root of a hierarchy. We can apply this process to theroot of any sub-branch in the dimension hierarchy instead of theroot of the dimension hierarchy. In this way, we can apply filteringto a subset of the dimensions instead of all the dimensions.
In InterRing, each selected leaf node corresponds to a dimen-sion displayed in the data visualization. We can add/delete adimension to/from the display by selecting/unselecting its corre-sponding leaf node. Thus users can filter dimensions using a man-ual selection operation in InterRing, that is, clicking an unselectednode to select it, or clicking a selected node to unselect it.
In InterRing, rolling-up/drilling-down operations allow users tohide/show sub-branches by clicking their root nodes. We also linkthem to the dimension filtering. Whenever some leaf nodes arehidden in InterRing, it means that users are not interested in them.Thus we also filter their corresponding dimensions from the datadisplay.
Users can also manually delete a dimension from the data dis-play by clicking to select it, then hitting the ‘delete’ button todelete it. Since InterRing provides an overview of the dimensionspace structure, while data display provides the context of the dataitems for manually filtering dimensions, the option of filtering di-mensions from InterRing or the data display gives users significantflexibility.
7 Conclusion and Future Work
In this paper, we have proposed an interactive approach to dimen-sion ordering, spacing and filtering for high dimensional datasetsbased on dimension hierarchies. Dimension ordering, spacing andfiltering can significantly increase the effectiveness of multidimen-sional visualizations, but the processes are complex for high di-mensional datasets. By grouping dimensions into a dimensionhierarchy according to their similarity, we improved the manage-ability of dimensions in high dimensional data sets and reducedthe complexity of the ordering, spacing and filtering tasks. In ad-dition, our findings are that user interactions for dimension or-dering, spacing and filtering are much easier to accomplish withdimension hierarchies.
In the future, we will formally evaluate our approach. We planto compare the quality of our hierarchical ordering approach withother heuristic approaches. We want to evaluate how dimensionordering, spacing and filtering benefits high dimensional visual-ization applications, such as document visualization, through userstudies. We intend to evaluate DOSFA’s applicability to differ-ent multidimensional visualization techniques. We also want to
study and improve the efficiency and effectiveness of our dimen-sional clustering algorithm, as it is the foundation of our DOSFAapproach.
References
[1] http://davis.wpi.edu/ xmdv/.[2] M. Ankerst, S. Berchtold, and D. A. Keim. Similarity clustering of dimen-
sions for an enhanced visualization of multidimensional data. Proc. of IEEESymposium on Information Visualization, InfoVis’98, p. 52-60, 1998.
[3] M. Ankerst, D. Keim, and H. Driegel. Circle segments: A technique forvisually exploring large multidimensional data sets. Proc. of Visualization’96, 1996.
[4] J. Bertin. Semiology of Graphics: Diagrams, Networks, Maps. University ofWisconsin Press, 1983.
[5] C. Boehm, F. Krebs, and H.-P. Kriegel. Optimal dimension order: A generictechnique for the similarity join. 4th Int. Conf. on Data Warehousing andKnowledge Discovery, pp. 135-149, 2002.
[6] H. Chernoff. The use of faces to represent points in k-dimensional spacegraphically. Journal of the American Statistical Association, Vol. 68, p. 361-68, 1973.
[7] W. Cleveland and M. McGill. Dynamic Graphics for Statistics. Wadsworth,Inc., 1988.
[8] P. Eades. Drawing the trees. Bulletin of the Institute of Combinatorics and itsApplications, p. 10-36, 1992.
[9] S. Feiner and C. Beshers. Worlds within worlds: Metaphors for exploringn-dimensional virtual worlds. Proc. UIST’90, p. 76-83, 1990.
[10] A. Flexer. On the use of self-organizing maps for clustering and visualization.PKDD’99, p. 80-88, 1999.
[11] G. Furnas. Generalized fisheye views. Proc. of Computer-Human Interaction’86, p. 16-23, 1986.
[12] W. Hersh, C. Buckley, T. Leone, and D. Hickman. OHSUMED: An interactiveretrieval evaluation and new large text collection for research. In Proceedingsof the Seventeenth Annual International ACM SIGIR Conference on Researchand Development in Information Retrieval, Performance Evaluation, pages192–201, 1994.
[13] A. Inselberg and B. Dimsdale. Parallel coordinates: A tool for visualizingmultidimensional geometry. Proc. of Visualization ’90, p. 361-78, 1990.
[14] J. Jolliffe. Principal Component Analysis. Springer Verlag, 1986.[15] D. Keim, H. Kriegel, and M. Ankerst. Recursive pattern: a technique for
visualizing very large amounts of data. Proc. of Visualization ’95, p. 279-86,1995.
[16] T. Kohonen. Self Organizing Maps. Springer Verlag, 1995.[17] J. LeBlanc, M. Ward, and N. Wittels. Exploring n-dimensional databases.
Proc. of Visualization ’90, p. 230-7, 1990.[18] A. Mead. Review of the development of multidimensional scaling methods.
The Statistician, Vol. 33, p. 27-35, 1992.[19] J. Siegel, E. Farrell, R. Goldwyn, and H. Friedman. The surgical implication
of physiologic patterns in myocardial infarction shock. Surgery Vol. 72, p.126-41, 1972.
[20] C. Stolte and P. Hanrahan. Polaris: A system for query, analysis, and visual-ization of multidimensional relational databases. InfoVis ’00, p. 5-14, 2000.
[21] M. O. Ward. A taxonomy of glyph placement strategies for multidimensionaldata visualization. Information Visualization, Vol 1, pp.194-210, 2002.
[22] E. Wegman. Hyperdimensional data analysis using parallel coordinates. Jour-nal of the American Statistical Association, Vol. 411(85), p. 664-675, 1990.
[23] J. Yang, M. O. Ward, and E. A. Rundensteiner. Interring: An interactive toolfor visually navigating and manipulating hierarchical structures. InfoVis ’02,p. 77-84, 2002.
[24] J. Yang, M. O. Ward, E. A. Rundensteiner, and S. Huang. Visual hierarchicaldimension reduction for exploration of high dimensional datasets. VisSym2003, accepted, 2003.
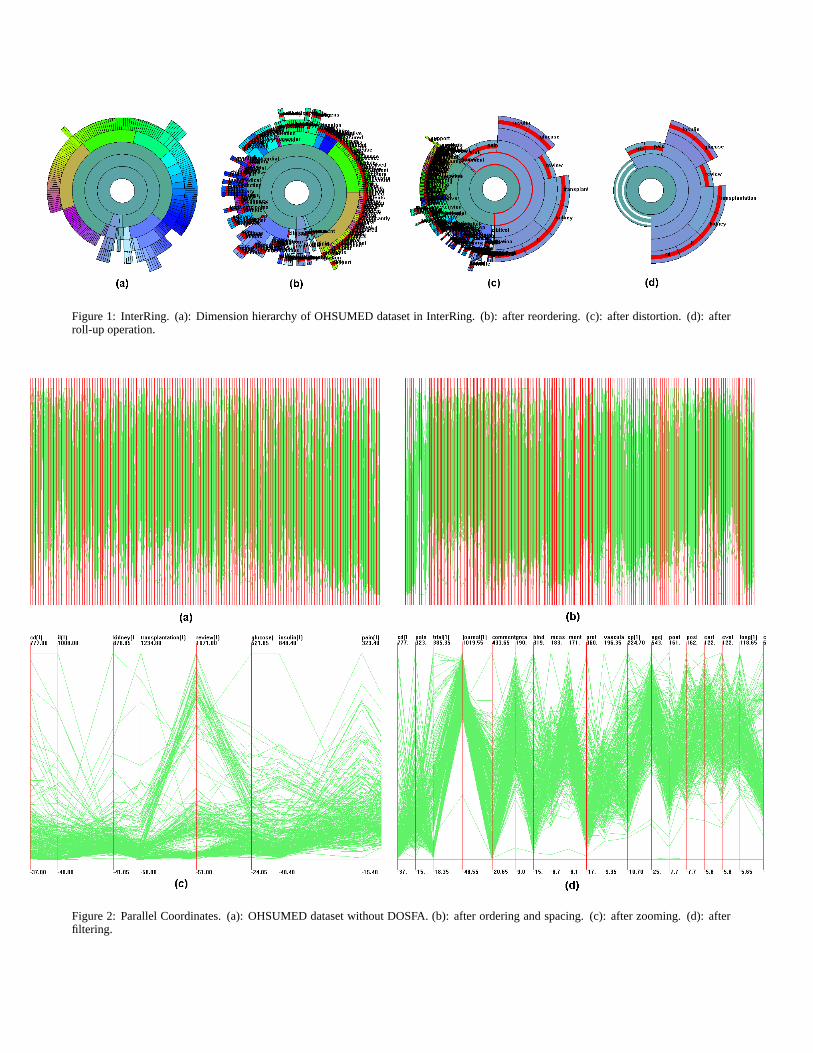
Figure 1: InterRing. (a): Dimension hierarchy of OHSUMED dataset in InterRing. (b): after reordering. (c): after distortion. (d): afterroll-up operation.
Figure 2: Parallel Coordinates. (a): OHSUMED dataset without DOSFA. (b): after ordering and spacing. (c): after zooming. (d): afterfiltering.

Figure 3: Star Glyphs. (a): OHSUMED dataset without DOSFA. (b): after ordering and spacing. (c): distorted star glyphs. (d): afterfiltering.
Figure 4: Scatterplot Matrices. (a): OHSUMED dataset without DOSFA. Individual plots cannot be discerned without significant zooming.(b): after filtering.