interactive record/replay for web application...
TRANSCRIPT
Interactive Record/Replay for Web Application DebuggingBrian Burg1, Richard Bailey1, Andrew J. Ko2, Michael D. Ernst1
Computer Science and Engineering1
University of Washington{burg, rjacob, mernst}@cs.washington.edu
The Information School2
University of [email protected]
ABSTRACTDuring debugging, a developer must repeatedly and manu-ally reproduce faulty behaviors in order to inspect differentfacets of the program’s execution. Existing tools for reproduc-ing such behaviors prevent the use of debugging aids such asbreakpoints and logging, and are not designed for interactive,random-access exploration of recorded behavior. This paperpresents Timelapse, a tool for quickly recording, reproduc-ing, and debugging interactive behaviors in web applications.Developers can use Timelapse to browse, visualize, and seekwithin recorded program executions while simultaneously us-ing familiar debugging tools such as breakpoints and logging.Testers and end-users can use Timelapse to demonstrate fail-ures in situ and share recorded behaviors with developers,improving bug report quality by obviating the need for de-tailed reproduction steps. Timelapse is built on Dolos, a novelrecord/replay infrastructure that ensures deterministic execu-tion by capturing and reusing program inputs both from theuser and from external sources such as the network. Dolosintroduces negligible overhead and does not interfere withbreakpoints and logging. In a small user evaluation, partici-pants used Timelapse to accelerate existing reproduction ac-tivities, but were not significantly faster or more successful incompleting the larger tasks at hand. Together, the Dolos in-frastructure and Timelapse developer tool support systematicbug reporting and debugging practices.
Author KeywordsDebugging, deterministic replay, web applications
ACM Classification KeywordsD.2.5 Software Engineering: Testing and debugging
General TermsHuman Factors; Design
INTRODUCTIONDebugging is often an iterative process in which developers re-peatedly adjust their view on a program’s execution by addingand removing breakpoints and inspecting program state atdifferent times and locations. This iteration requires a devel-oper to repeatedly reproduce the behavior they are inspecting,
Permission to make digital of hard copies of all or part of this work forpersonal or classroom use is granted without fee provided that copies arenot made or distributed for profit or commercial advantage and that copiesbear this notice and the full citation on the first page. To copy otherwise, torepublish, to post on servers or to redistribute to lists, requires prior specificpermission and/or a fee.UIST 2013, October 8–11, 2013, St Andrews, United Kingdom.Copyright 2013 ACM XXX...$0.00.
which can be time-consuming and error-prone [36]. In thecase of interactive programs, even reproducing a failure canbe difficult or impossible: failures can occur on mouse dragevents, be time-dependent, or simply occur too infrequentlyfor a developer to easily reach a program state suitable fordebugging.
Deterministic record/replay [5] is a technique that can be usedto record a behavior once and then deterministically replay itrepeatedly and automatically, without user interaction. Thoughit seems that the capability to record and replay executionsshould be useful for debugging, no prior work has describedactual use cases for these capabilities, or how to best exposethese capabilities via user interface affordances. At most,prior systems demonstrate feasibility by providing a simpleVCR-like interface [18, 33] that can record and replay linearly.Many record/replay systems have no UI, and are controlled viacommands to the debugger or special APIs [9, 11, 27]. Finally,prior work does not consider how record/replay capabilitiescan interoperate with and enhance existing debugging toolslike breakpoints and logging. Prior tool instantiations [18, 25,1] are inappropriate for debugging because they can interferewith program performance, determinism, and breakpoint use,and they are difficult to deploy.
This paper presents Timelapse, a developer tool for capturingand replaying web application behaviors during debugging,and Dolos, a novel record/replay infrastructure for web ap-plications. A developer can use Timelapse’s interactive vi-sualizations of program inputs to find and seek non-linearlythrough the recording, and then use the debugger or othertools to understand program behavior. To ensure determinis-tic execution, Dolos captures and reuses user input, networkresponses, and other nondeterministic inputs as the programexecutes. It does this in a purely additive way—without im-peding the use of other tools such as debuggers—via a noveladaptation of virtual machine record/replay techniques to theexecution environment of web browsers. Debugging tools areparticularly important for interactive web applications becausethe web’s highly dynamic, event-driven programming modelstymies traditional static program analysis techniques.
This paper makes the following contributions:
• Dolos: a fast, scalable, precise, and practical infrastructurefor deterministic record/replay of web applications.
• Timelapse: a developer tool for creating, visualizing, andnavigating program recordings during debugging tasks.
• The first user study to explore how and when developersuse record/replay tools during realistic debugging tasks.
Dolos and Timelapse are free software: our source code, studymaterials, and data are available on the project website1.
We first discuss the design of Timelapse, and use a scenario toillustrate how Timelapse supports recording, reproducing, anddebugging interactive behaviors. Next, we present the designand implementation of the underlying Dolos record/replayinfrastructure. We discuss the results of a small study to seehow developers use Timelapse in open-ended debugging tasks.Finally, we conclude with related work and present severalimplications for future interactive debugging tools.
REPRODUCING AND NAVIGATING PROGRAM STATESThe Timelapse developer tool is designed around two activities:capturing user-demonstrated program behaviors, and quicklyand repeatedly reaching program states within a recordingwhen localizing and understanding a fault. The novel featureswe describe in this section support these activities by mak-ing it simple to record program behavior and by providingvisualizations and affordances that quicken the process of find-ing and seeking to relevant program states without manuallyreproducing behavior.
To better understand the utility of replay capabilities duringdebugging, we first conducted a small pilot study with a pro-totype record/replay interface. Using contextual inquiry, wefound that developers primarily used the prototype to iso-late buggy output, and to quickly reach specific states whenworking backwards from buggy output towards its root cause.Towards these ends, we saw several common use cases: “playand watch”; isolating output using random-access seeking;stepping through execution in single-input increments, andreading low-level input details or logged output.
This section introduces the novel features of the Timelapsedeveloper tool by showing how a fictional developer namedClaire might use Timelapse’s features while debugging.
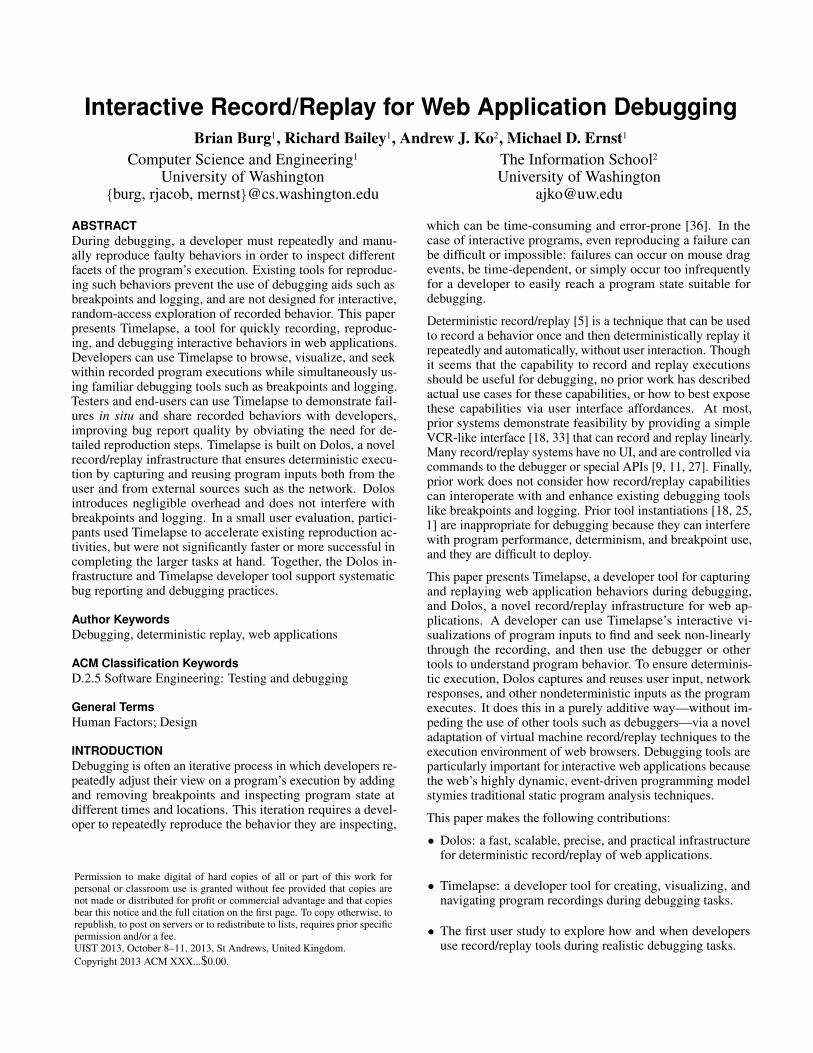
Debugging Scenario: (Buggy) Space InvadersClaire, a new hire at a game company, has been asked tofix a bug in a web application version of the Space Invadersvideo game2. In this game, the player moves a defendingship and shoots advancing aliens. The game’s implementationis representative of modern object-oriented interactive webprograms: it uses timer callbacks, event-driven programming,and helper libraries. The game contains a defect that allowsmultiple player bullets to be in flight at a time; there is onlysupposed to be one player bullet at a time (Figure 1).
Reproducing Program BehaviorClaire is unfamiliar with the Space Invaders implementation,so her first step towards understanding and fixing the multiple-bullet defect is to figure out how to reliably reproduce it. Thisis difficult because the failure only occurs in specific gamestates and is influenced by execution conditions outside ofher control, such as random numbers, the current time, orasynchronous network requests.1http://github.com/burg/timelapse/2http://matthaynes.net/playground/javascript/glow/spaceinvaders/
Figure 1. Screenshots of normal and buggy Space Invader game mechan-ics. Only one bullet should be in play at a time (shown on left). Due tomisuse of library code, each bullet fires two asynchronous bulletDiedevents instead of one event when it is destroyed. The double dispatchsometimes enables multiple player bullets being in play at once (shownon right). This happens when two bullets are created: one between twobulletDied events, and the other after both events.
With Timelapse, Claire begins capturing program behaviorswith a single click (Figure 2-6), plays the game until she repro-duces the failure, and then finishes the recording. Recordingscreated by Timelapse are compact, self-contained, and serial-izable, so Claire can attach her recording to a bug report orshare it via email.
To reproduce the defect with traditional tools, Claire wouldhave to multitask between synthesizing reproduction steps,playing the video game, and reflecting on whether the repro-duction steps are correct. Once Claire finds reliable reproduc-tion steps, she could then use breakpoints to further understand
1
2
5
5
9b
4
6 7 8
5
3 9a
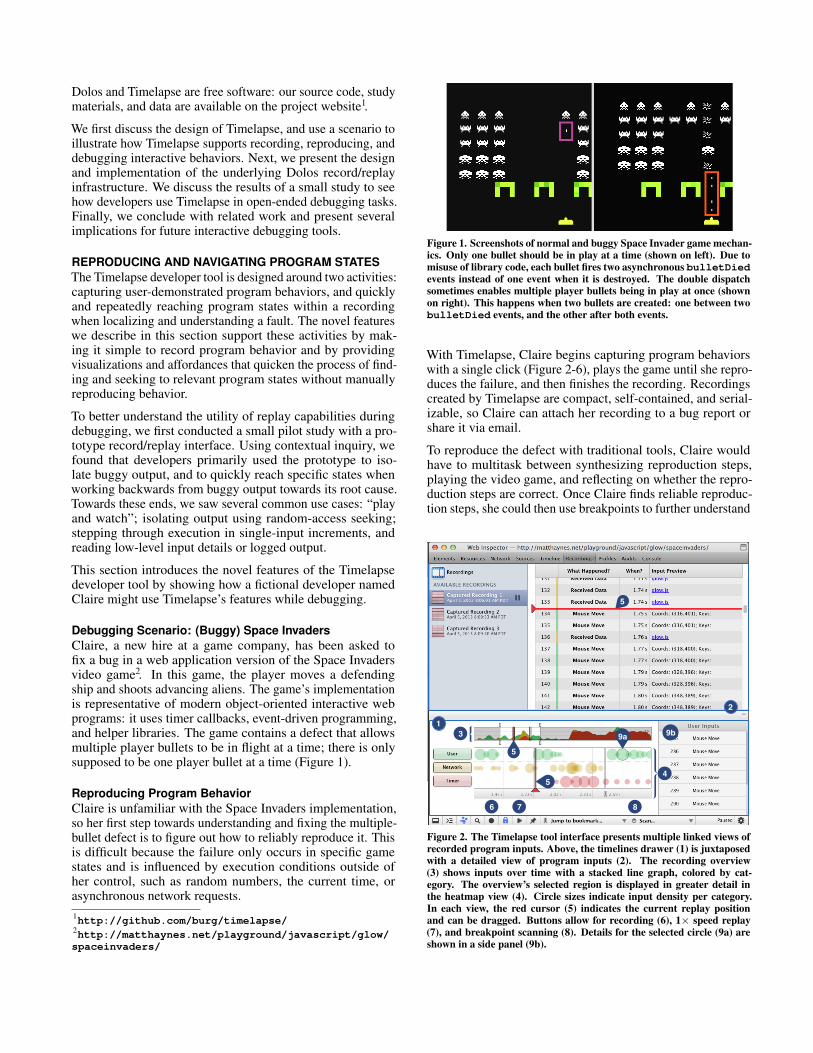
Figure 2. The Timelapse tool interface presents multiple linked views ofrecorded program inputs. Above, the timelines drawer (1) is juxtaposedwith a detailed view of program inputs (2). The recording overview(3) shows inputs over time with a stacked line graph, colored by cat-egory. The overview’s selected region is displayed in greater detail inthe heatmap view (4). Circle sizes indicate input density per category.In each view, the red cursor (5) indicates the current replay positionand can be dragged. Buttons allow for recording (6), 1× speed replay(7), and breakpoint scanning (8). Details for the selected circle (9a) areshown in a side panel (9b).
the defect. But, breakpoints might themselves affect timing,making the defect harder to trigger or requiring modified re-production steps.
Navigating to Specific Program StatesTo focus her attention on code relevant to the failure, Claireneeds to know which specific user input—and thus whichevent handler invocations—caused the second bullet to appear.
Claire uses Timelapse’s visualization and navigation tools(Figure 2) to locate and seek the recording to an instanceof the multiple bullets failure. First, Claire limits the zoominterval to when she actually fired bullets, and then filters outnon-keystroke inputs. She replays single keystrokes with akeyboard shortcut until a second bullet is added to the gameboard. Then, she seeks execution backward by one keystroke.At this point, she is confident that the code which created thesecond bullet ran in response to the current keystroke.
Without Timelapse, it would not be possible for Claire to iso-late the failure to a specific keystroke and then work backwardsfrom the keystroke. Instead, she would have to insert loggingstatements, repeatedly reproduce the failure to generate log-ging output, and scrutinize logged values for clues leadingtowards the root cause.
Navigation Aid: Debugger BookmarksHaving tracked down the second bullet to a specific user input,Claire now needs to investigate what code ran, and why.
With Timelapse, Claire sets several debugger bookmarks (Fig-ure 3-6) at positions in the recording that she wants to quicklyrevert back to, such as the keystroke that caused the secondbullet to appear or an important program point reached via thedebugger. Debugger bookmarks support the concept of tempo-ral focus points [28],which are useful when a developer wantsto relate information [13]—such as the program’s state at abreakpoint hit—that is only available at certain points of exe-cution. Timelapse restores a debugger bookmark by seekingto the preceding input, setting and continuing to the preced-ing breakpoint, and finally simulating the user’s sequence ofdebugger commands (step forward/into/out).
With traditional tools, Claire must explore an execution withdebugger commands such as “step into”, “step over”, and“step out”. This is frustrating because these commands areirreversible, and Claire would have to manually reproducethe failure multiple times to compare multiple instants or theeffects of different commands.
Navigation Aid: Breakpoint RadarOnce Claire finds the code that creates bullets, she needs tounderstand why some keystrokes fire bullets and others do not.
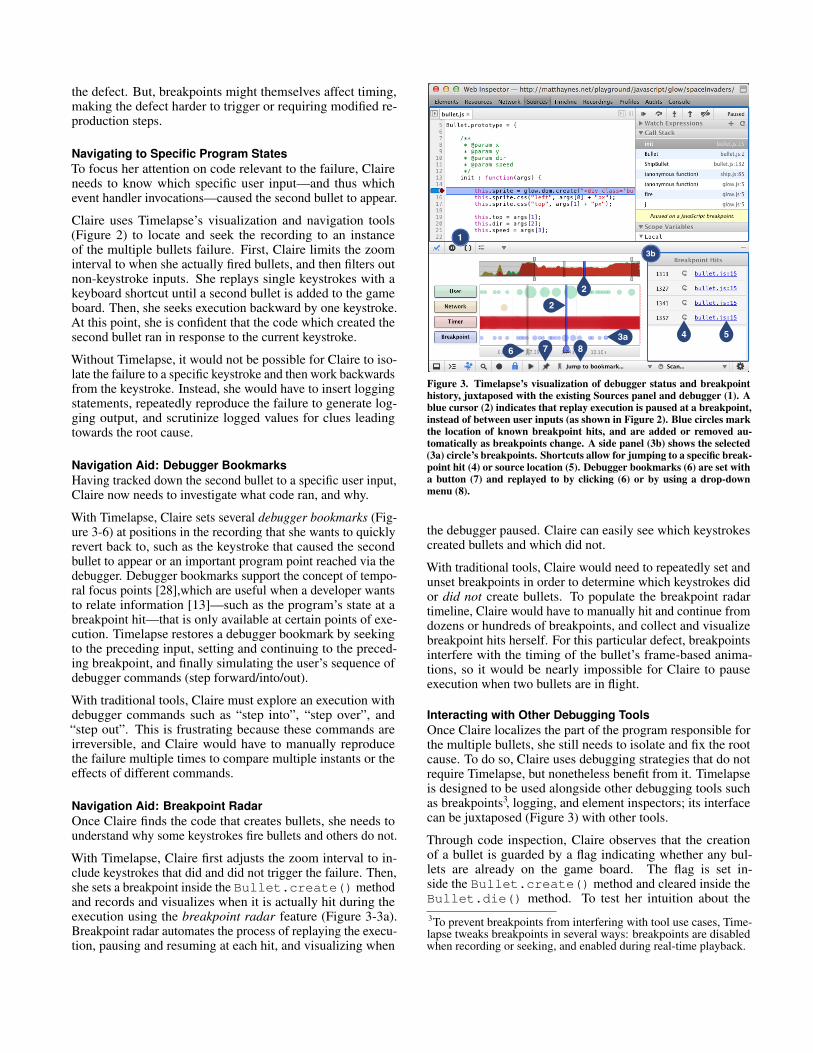
With Timelapse, Claire first adjusts the zoom interval to in-clude keystrokes that did and did not trigger the failure. Then,she sets a breakpoint inside the Bullet.create() methodand records and visualizes when it is actually hit during theexecution using the breakpoint radar feature (Figure 3-3a).Breakpoint radar automates the process of replaying the execu-tion, pausing and resuming at each hit, and visualizing when
3b
1
2
2
43a 57 86
Figure 3. Timelapse’s visualization of debugger status and breakpointhistory, juxtaposed with the existing Sources panel and debugger (1). Ablue cursor (2) indicates that replay execution is paused at a breakpoint,instead of between user inputs (as shown in Figure 2). Blue circles markthe location of known breakpoint hits, and are added or removed au-tomatically as breakpoints change. A side panel (3b) shows the selected(3a) circle’s breakpoints. Shortcuts allow for jumping to a specific break-point hit (4) or source location (5). Debugger bookmarks (6) are set witha button (7) and replayed to by clicking (6) or by using a drop-downmenu (8).
the debugger paused. Claire can easily see which keystrokescreated bullets and which did not.
With traditional tools, Claire would need to repeatedly set andunset breakpoints in order to determine which keystrokes didor did not create bullets. To populate the breakpoint radartimeline, Claire would have to manually hit and continue fromdozens or hundreds of breakpoints, and collect and visualizebreakpoint hits herself. For this particular defect, breakpointsinterfere with the timing of the bullet’s frame-based anima-tions, so it would be nearly impossible for Claire to pauseexecution when two bullets are in flight.
Interacting with Other Debugging ToolsOnce Claire localizes the part of the program responsible forthe multiple bullets, she still needs to isolate and fix the rootcause. To do so, Claire uses debugging strategies that do notrequire Timelapse, but nonetheless benefit from it. Timelapseis designed to be used alongside other debugging tools suchas breakpoints3, logging, and element inspectors; its interfacecan be juxtaposed (Figure 3) with other tools.
Through code inspection, Claire observes that the creationof a bullet is guarded by a flag indicating whether any bul-lets are already on the game board. The flag is set in-side the Bullet.create() method and cleared inside theBullet.die() method. To test her intuition about the3To prevent breakpoints from interfering with tool use cases, Time-lapse tweaks breakpoints in several ways: breakpoints are disabledwhen recording or seeking, and enabled during real-time playback.
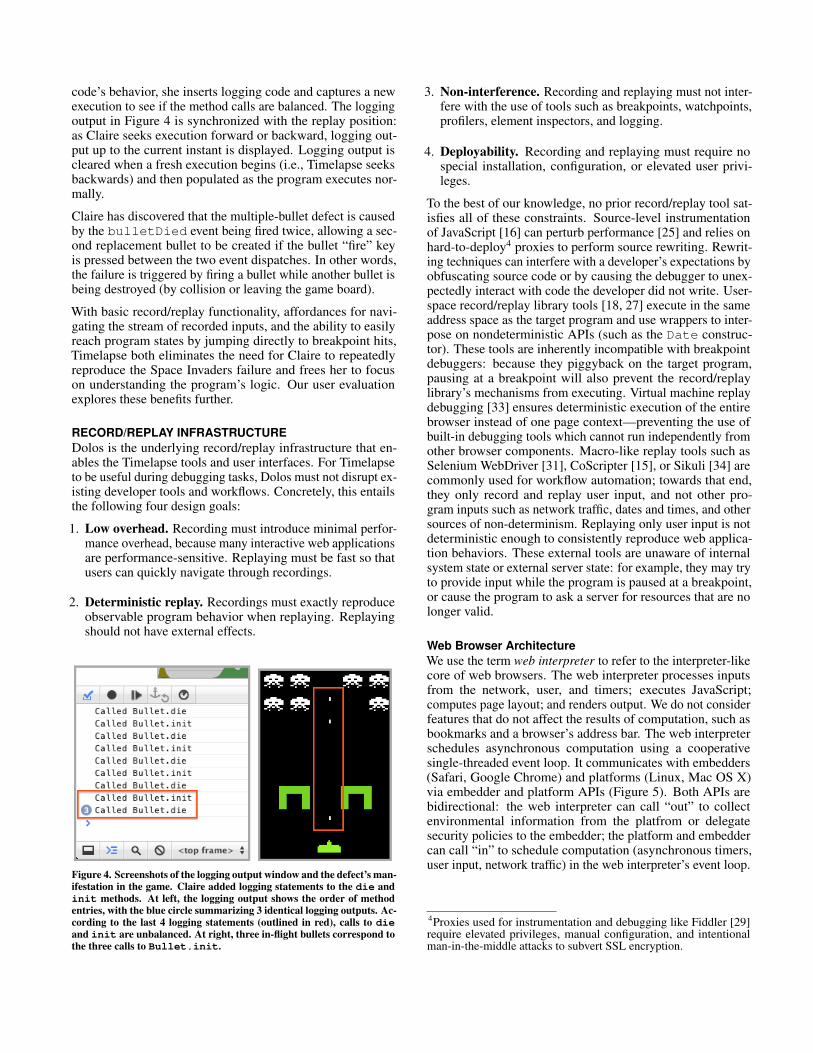
code’s behavior, she inserts logging code and captures a newexecution to see if the method calls are balanced. The loggingoutput in Figure 4 is synchronized with the replay position:as Claire seeks execution forward or backward, logging out-put up to the current instant is displayed. Logging output iscleared when a fresh execution begins (i.e., Timelapse seeksbackwards) and then populated as the program executes nor-mally.
Claire has discovered that the multiple-bullet defect is causedby the bulletDied event being fired twice, allowing a sec-ond replacement bullet to be created if the bullet “fire” keyis pressed between the two event dispatches. In other words,the failure is triggered by firing a bullet while another bullet isbeing destroyed (by collision or leaving the game board).
With basic record/replay functionality, affordances for navi-gating the stream of recorded inputs, and the ability to easilyreach program states by jumping directly to breakpoint hits,Timelapse both eliminates the need for Claire to repeatedlyreproduce the Space Invaders failure and frees her to focuson understanding the program’s logic. Our user evaluationexplores these benefits further.
RECORD/REPLAY INFRASTRUCTUREDolos is the underlying record/replay infrastructure that en-ables the Timelapse tools and user interfaces. For Timelapseto be useful during debugging tasks, Dolos must not disrupt ex-isting developer tools and workflows. Concretely, this entailsthe following four design goals:
1. Low overhead. Recording must introduce minimal perfor-mance overhead, because many interactive web applicationsare performance-sensitive. Replaying must be fast so thatusers can quickly navigate through recordings.
2. Deterministic replay. Recordings must exactly reproduceobservable program behavior when replaying. Replayingshould not have external effects.
Figure 4. Screenshots of the logging output window and the defect’s man-ifestation in the game. Claire added logging statements to the die andinit methods. At left, the logging output shows the order of methodentries, with the blue circle summarizing 3 identical logging outputs. Ac-cording to the last 4 logging statements (outlined in red), calls to dieand init are unbalanced. At right, three in-flight bullets correspond tothe three calls to Bullet.init.
3. Non-interference. Recording and replaying must not inter-fere with the use of tools such as breakpoints, watchpoints,profilers, element inspectors, and logging.
4. Deployability. Recording and replaying must require nospecial installation, configuration, or elevated user privi-leges.
To the best of our knowledge, no prior record/replay tool sat-isfies all of these constraints. Source-level instrumentationof JavaScript [16] can perturb performance [25] and relies onhard-to-deploy4 proxies to perform source rewriting. Rewrit-ing techniques can interfere with a developer’s expectations byobfuscating source code or by causing the debugger to unex-pectedly interact with code the developer did not write. User-space record/replay library tools [18, 27] execute in the sameaddress space as the target program and use wrappers to inter-pose on nondeterministic APIs (such as the Date construc-tor). These tools are inherently incompatible with breakpointdebuggers: because they piggyback on the target program,pausing at a breakpoint will also prevent the record/replaylibrary’s mechanisms from executing. Virtual machine replaydebugging [33] ensures deterministic execution of the entirebrowser instead of one page context—preventing the use ofbuilt-in debugging tools which cannot run independently fromother browser components. Macro-like replay tools such asSelenium WebDriver [31], CoScripter [15], or Sikuli [34] arecommonly used for workflow automation; towards that end,they only record and replay user input, and not other pro-gram inputs such as network traffic, dates and times, and othersources of non-determinism. Replaying only user input is notdeterministic enough to consistently reproduce web applica-tion behaviors. These external tools are unaware of internalsystem state or external server state: for example, they may tryto provide input while the program is paused at a breakpoint,or cause the program to ask a server for resources that are nolonger valid.
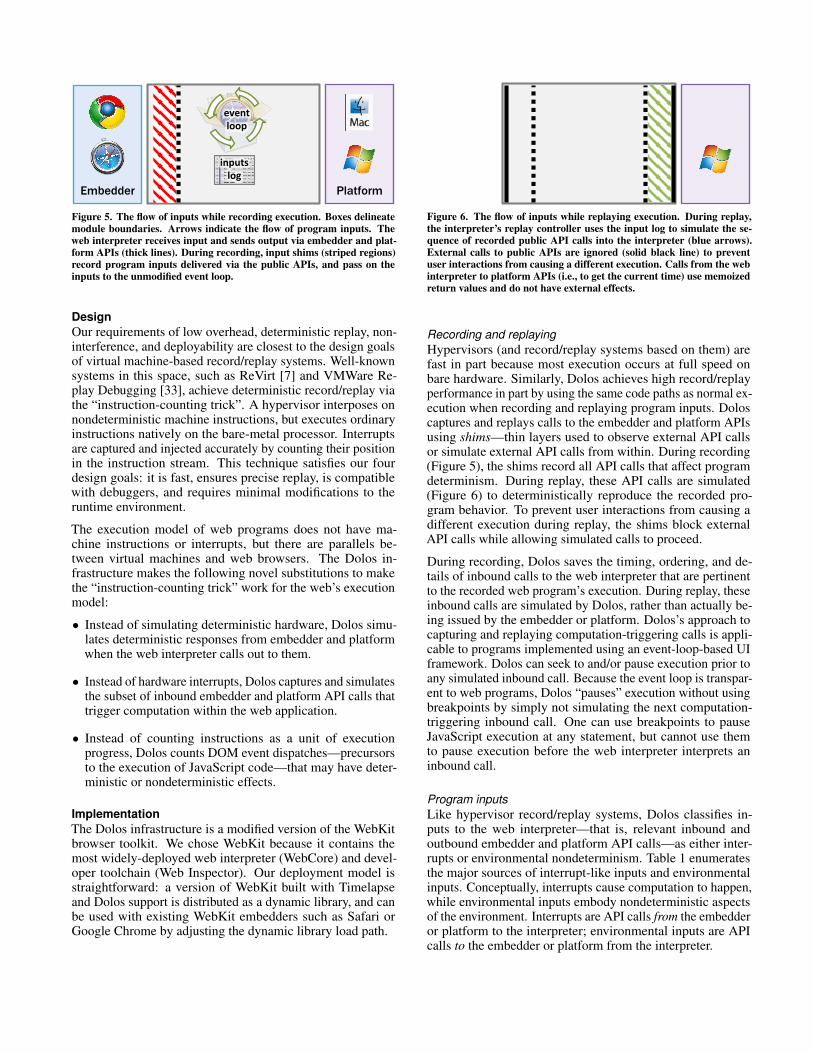
Web Browser ArchitectureWe use the term web interpreter to refer to the interpreter-likecore of web browsers. The web interpreter processes inputsfrom the network, user, and timers; executes JavaScript;computes page layout; and renders output. We do not considerfeatures that do not affect the results of computation, such asbookmarks and a browser’s address bar. The web interpreterschedules asynchronous computation using a cooperativesingle-threaded event loop. It communicates with embedders(Safari, Google Chrome) and platforms (Linux, Mac OS X)via embedder and platform APIs (Figure 5). Both APIs arebidirectional: the web interpreter can call “out” to collectenvironmental information from the platfrom or delegatesecurity policies to the embedder; the platform and embeddercan call “in” to schedule computation (asynchronous timers,user input, network traffic) in the web interpreter’s event loop.
4Proxies used for instrumentation and debugging like Fiddler [29]require elevated privileges, manual configuration, and intentionalman-in-the-middle attacks to subvert SSL encryption.
Embedder
inputs$log$
event$loop$
Platform Web Interpreter
event$loop$
Platform Embedder
inputs$log$
Web Interpreter
Figure 5. The flow of inputs while recording execution. Boxes delineatemodule boundaries. Arrows indicate the flow of program inputs. Theweb interpreter receives input and sends output via embedder and plat-form APIs (thick lines). During recording, input shims (striped regions)record program inputs delivered via the public APIs, and pass on theinputs to the unmodified event loop.
DesignOur requirements of low overhead, deterministic replay, non-interference, and deployability are closest to the design goalsof virtual machine-based record/replay systems. Well-knownsystems in this space, such as ReVirt [7] and VMWare Re-play Debugging [33], achieve deterministic record/replay viathe “instruction-counting trick”. A hypervisor interposes onnondeterministic machine instructions, but executes ordinaryinstructions natively on the bare-metal processor. Interruptsare captured and injected accurately by counting their positionin the instruction stream. This technique satisfies our fourdesign goals: it is fast, ensures precise replay, is compatiblewith debuggers, and requires minimal modifications to theruntime environment.
The execution model of web programs does not have ma-chine instructions or interrupts, but there are parallels be-tween virtual machines and web browsers. The Dolos in-frastructure makes the following novel substitutions to makethe “instruction-counting trick” work for the web’s executionmodel:
• Instead of simulating deterministic hardware, Dolos simu-lates deterministic responses from embedder and platformwhen the web interpreter calls out to them.
• Instead of hardware interrupts, Dolos captures and simulatesthe subset of inbound embedder and platform API calls thattrigger computation within the web application.
• Instead of counting instructions as a unit of executionprogress, Dolos counts DOM event dispatches—precursorsto the execution of JavaScript code—that may have deter-ministic or nondeterministic effects.
ImplementationThe Dolos infrastructure is a modified version of the WebKitbrowser toolkit. We chose WebKit because it contains themost widely-deployed web interpreter (WebCore) and devel-oper toolchain (Web Inspector). Our deployment model isstraightforward: a version of WebKit built with Timelapseand Dolos support is distributed as a dynamic library, and canbe used with existing WebKit embedders such as Safari orGoogle Chrome by adjusting the dynamic library load path.
event%loop%
Platform
inputs%log%
Web Interpreter
Embedder
inputs%log%
event%loop%
Platform Web Interpreter
Embedder
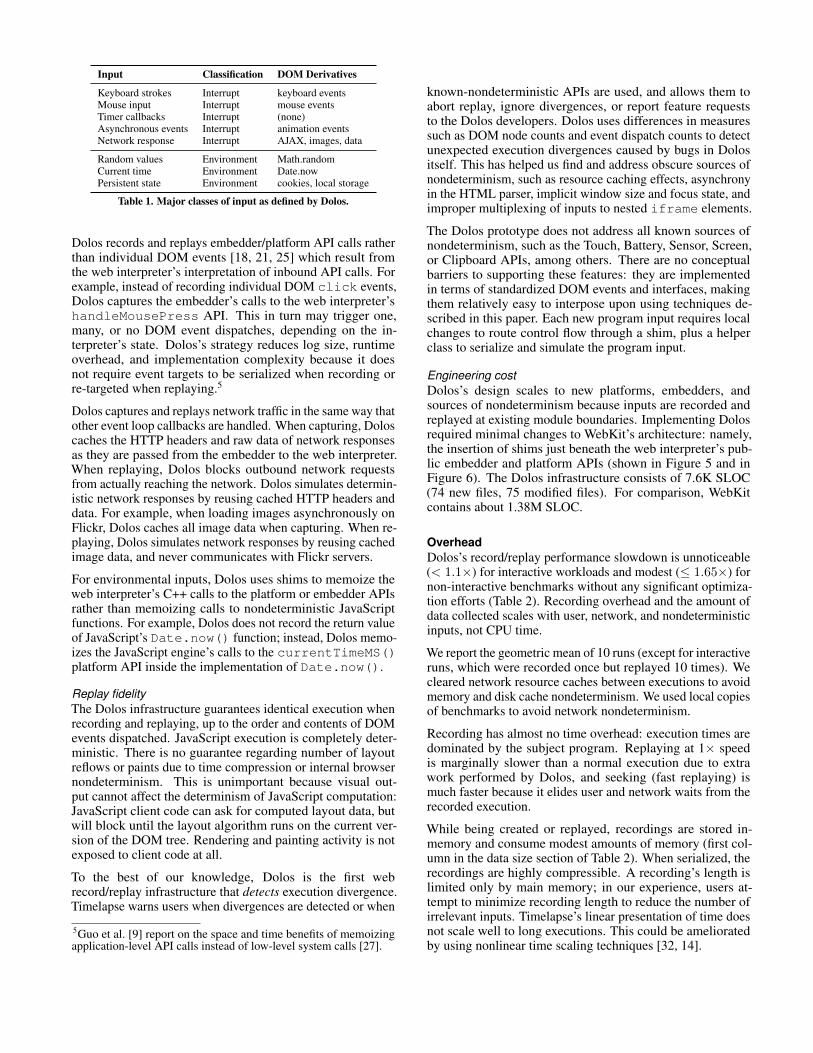
Figure 6. The flow of inputs while replaying execution. During replay,the interpreter’s replay controller uses the input log to simulate the se-quence of recorded public API calls into the interpreter (blue arrows).External calls to public APIs are ignored (solid black line) to preventuser interactions from causing a different execution. Calls from the webinterpreter to platform APIs (i.e., to get the current time) use memoizedreturn values and do not have external effects.
Recording and replayingHypervisors (and record/replay systems based on them) arefast in part because most execution occurs at full speed onbare hardware. Similarly, Dolos achieves high record/replayperformance in part by using the same code paths as normal ex-ecution when recording and replaying program inputs. Doloscaptures and replays calls to the embedder and platform APIsusing shims—thin layers used to observe external API callsor simulate external API calls from within. During recording(Figure 5), the shims record all API calls that affect programdeterminism. During replay, these API calls are simulated(Figure 6) to deterministically reproduce the recorded pro-gram behavior. To prevent user interactions from causing adifferent execution during replay, the shims block externalAPI calls while allowing simulated calls to proceed.
During recording, Dolos saves the timing, ordering, and de-tails of inbound calls to the web interpreter that are pertinentto the recorded web program’s execution. During replay, theseinbound calls are simulated by Dolos, rather than actually be-ing issued by the embedder or platform. Dolos’s approach tocapturing and replaying computation-triggering calls is appli-cable to programs implemented using an event-loop-based UIframework. Dolos can seek to and/or pause execution prior toany simulated inbound call. Because the event loop is transpar-ent to web programs, Dolos “pauses” execution without usingbreakpoints by simply not simulating the next computation-triggering inbound call. One can use breakpoints to pauseJavaScript execution at any statement, but cannot use themto pause execution before the web interpreter interprets aninbound call.
Program inputsLike hypervisor record/replay systems, Dolos classifies in-puts to the web interpreter—that is, relevant inbound andoutbound embedder and platform API calls—as either inter-rupts or environmental nondeterminism. Table 1 enumeratesthe major sources of interrupt-like inputs and environmentalinputs. Conceptually, interrupts cause computation to happen,while environmental inputs embody nondeterministic aspectsof the environment. Interrupts are API calls from the embedderor platform to the interpreter; environmental inputs are APIcalls to the embedder or platform from the interpreter.
Input Classification DOM Derivatives
Keyboard strokes Interrupt keyboard eventsMouse input Interrupt mouse eventsTimer callbacks Interrupt (none)Asynchronous events Interrupt animation eventsNetwork response Interrupt AJAX, images, data
Random values Environment Math.randomCurrent time Environment Date.nowPersistent state Environment cookies, local storage
Table 1. Major classes of input as defined by Dolos.
Dolos records and replays embedder/platform API calls ratherthan individual DOM events [18, 21, 25] which result fromthe web interpreter’s interpretation of inbound API calls. Forexample, instead of recording individual DOM click events,Dolos captures the embedder’s calls to the web interpreter’shandleMousePress API. This in turn may trigger one,many, or no DOM event dispatches, depending on the in-terpreter’s state. Dolos’s strategy reduces log size, runtimeoverhead, and implementation complexity because it doesnot require event targets to be serialized when recording orre-targeted when replaying.5
Dolos captures and replays network traffic in the same way thatother event loop callbacks are handled. When capturing, Doloscaches the HTTP headers and raw data of network responsesas they are passed from the embedder to the web interpreter.When replaying, Dolos blocks outbound network requestsfrom actually reaching the network. Dolos simulates determin-istic network responses by reusing cached HTTP headers anddata. For example, when loading images asynchronously onFlickr, Dolos caches all image data when capturing. When re-playing, Dolos simulates network responses by reusing cachedimage data, and never communicates with Flickr servers.
For environmental inputs, Dolos uses shims to memoize theweb interpreter’s C++ calls to the platform or embedder APIsrather than memoizing calls to nondeterministic JavaScriptfunctions. For example, Dolos does not record the return valueof JavaScript’s Date.now() function; instead, Dolos memo-izes the JavaScript engine’s calls to the currentTimeMS()platform API inside the implementation of Date.now().
Replay fidelityThe Dolos infrastructure guarantees identical execution whenrecording and replaying, up to the order and contents of DOMevents dispatched. JavaScript execution is completely deter-ministic. There is no guarantee regarding number of layoutreflows or paints due to time compression or internal browsernondeterminism. This is unimportant because visual out-put cannot affect the determinism of JavaScript computation:JavaScript client code can ask for computed layout data, butwill block until the layout algorithm runs on the current ver-sion of the DOM tree. Rendering and painting activity is notexposed to client code at all.
To the best of our knowledge, Dolos is the first webrecord/replay infrastructure that detects execution divergence.Timelapse warns users when divergences are detected or when
5Guo et al. [9] report on the space and time benefits of memoizingapplication-level API calls instead of low-level system calls [27].
known-nondeterministic APIs are used, and allows them toabort replay, ignore divergences, or report feature requeststo the Dolos developers. Dolos uses differences in measuressuch as DOM node counts and event dispatch counts to detectunexpected execution divergences caused by bugs in Dolositself. This has helped us find and address obscure sources ofnondeterminism, such as resource caching effects, asynchronyin the HTML parser, implicit window size and focus state, andimproper multiplexing of inputs to nested iframe elements.
The Dolos prototype does not address all known sources ofnondeterminism, such as the Touch, Battery, Sensor, Screen,or Clipboard APIs, among others. There are no conceptualbarriers to supporting these features: they are implementedin terms of standardized DOM events and interfaces, makingthem relatively easy to interpose upon using techniques de-scribed in this paper. Each new program input requires localchanges to route control flow through a shim, plus a helperclass to serialize and simulate the program input.
Engineering costDolos’s design scales to new platforms, embedders, andsources of nondeterminism because inputs are recorded andreplayed at existing module boundaries. Implementing Dolosrequired minimal changes to WebKit’s architecture: namely,the insertion of shims just beneath the web interpreter’s pub-lic embedder and platform APIs (shown in Figure 5 and inFigure 6). The Dolos infrastructure consists of 7.6K SLOC(74 new files, 75 modified files). For comparison, WebKitcontains about 1.38M SLOC.
OverheadDolos’s record/replay performance slowdown is unnoticeable(< 1.1×) for interactive workloads and modest (≤ 1.65×) fornon-interactive benchmarks without any significant optimiza-tion efforts (Table 2). Recording overhead and the amount ofdata collected scales with user, network, and nondeterministicinputs, not CPU time.
We report the geometric mean of 10 runs (except for interactiveruns, which were recorded once but replayed 10 times). Wecleared network resource caches between executions to avoidmemory and disk cache nondeterminism. We used local copiesof benchmarks to avoid network nondeterminism.
Recording has almost no time overhead: execution times aredominated by the subject program. Replaying at 1× speedis marginally slower than a normal execution due to extrawork performed by Dolos, and seeking (fast replaying) ismuch faster because it elides user and network waits from therecorded execution.
While being created or replayed, recordings are stored in-memory and consume modest amounts of memory (first col-umn in the data size section of Table 2). When serialized, therecordings are highly compressible. A recording’s length islimited only by main memory; in our experience, users at-tempt to minimize recording length to reduce the number ofirrelevant inputs. Timelapse’s linear presentation of time doesnot scale well to long executions. This could be amelioratedby using nonlinear time scaling techniques [32, 14].
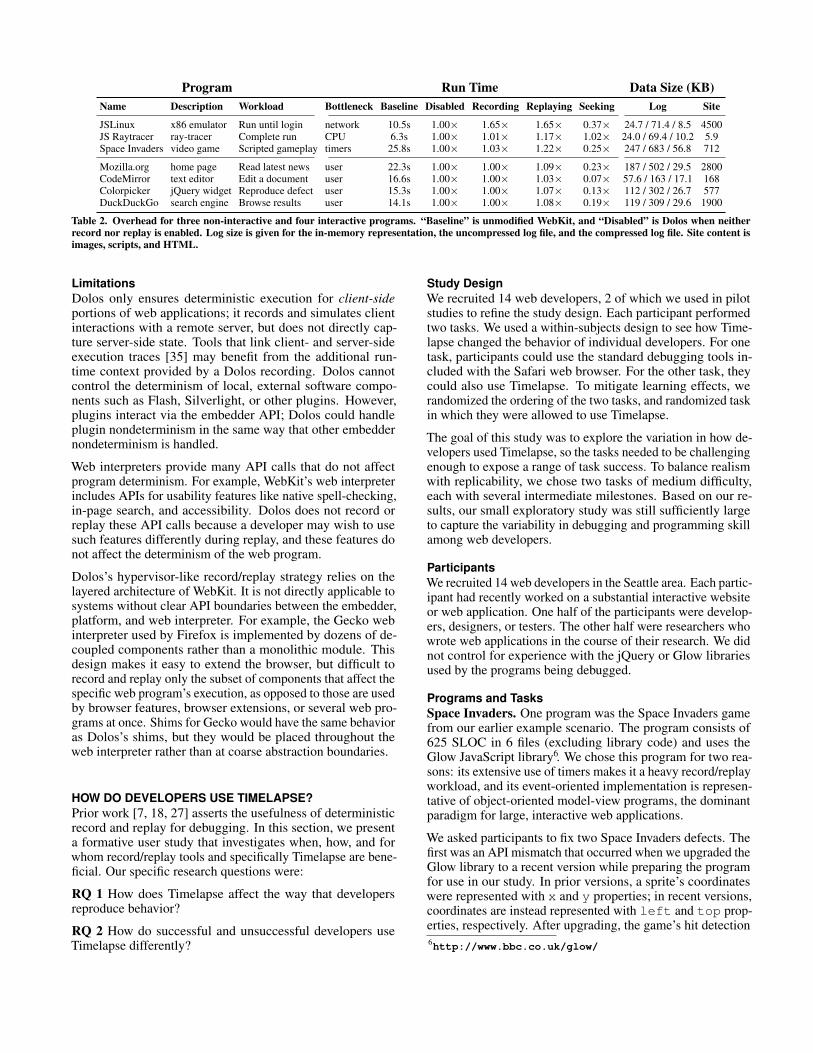
Program Run Time Data Size (KB)Name Description Workload Bottleneck Baseline Disabled Recording Replaying Seeking Log Site
JSLinux x86 emulator Run until login network 10.5s 1.00× 1.65× 1.65× 0.37× 24.7 / 71.4 / 8.5 4500JS Raytracer ray-tracer Complete run CPU 6.3s 1.00× 1.01× 1.17× 1.02× 24.0 / 69.4 / 10.2 5.9Space Invaders video game Scripted gameplay timers 25.8s 1.00× 1.03× 1.22× 0.25× 247 / 683 / 56.8 712
Mozilla.org home page Read latest news user 22.3s 1.00× 1.00× 1.09× 0.23× 187 / 502 / 29.5 2800CodeMirror text editor Edit a document user 16.6s 1.00× 1.00× 1.03× 0.07× 57.6 / 163 / 17.1 168Colorpicker jQuery widget Reproduce defect user 15.3s 1.00× 1.00× 1.07× 0.13× 112 / 302 / 26.7 577DuckDuckGo search engine Browse results user 14.1s 1.00× 1.00× 1.08× 0.19× 119 / 309 / 29.6 1900
Table 2. Overhead for three non-interactive and four interactive programs. “Baseline” is unmodified WebKit, and “Disabled” is Dolos when neitherrecord nor replay is enabled. Log size is given for the in-memory representation, the uncompressed log file, and the compressed log file. Site content isimages, scripts, and HTML.
LimitationsDolos only ensures deterministic execution for client-sideportions of web applications; it records and simulates clientinteractions with a remote server, but does not directly cap-ture server-side state. Tools that link client- and server-sideexecution traces [35] may benefit from the additional run-time context provided by a Dolos recording. Dolos cannotcontrol the determinism of local, external software compo-nents such as Flash, Silverlight, or other plugins. However,plugins interact via the embedder API; Dolos could handleplugin nondeterminism in the same way that other embeddernondeterminism is handled.
Web interpreters provide many API calls that do not affectprogram determinism. For example, WebKit’s web interpreterincludes APIs for usability features like native spell-checking,in-page search, and accessibility. Dolos does not record orreplay these API calls because a developer may wish to usesuch features differently during replay, and these features donot affect the determinism of the web program.
Dolos’s hypervisor-like record/replay strategy relies on thelayered architecture of WebKit. It is not directly applicable tosystems without clear API boundaries between the embedder,platform, and web interpreter. For example, the Gecko webinterpreter used by Firefox is implemented by dozens of de-coupled components rather than a monolithic module. Thisdesign makes it easy to extend the browser, but difficult torecord and replay only the subset of components that affect thespecific web program’s execution, as opposed to those are usedby browser features, browser extensions, or several web pro-grams at once. Shims for Gecko would have the same behavioras Dolos’s shims, but they would be placed throughout theweb interpreter rather than at coarse abstraction boundaries.
HOW DO DEVELOPERS USE TIMELAPSE?Prior work [7, 18, 27] asserts the usefulness of deterministicrecord and replay for debugging. In this section, we presenta formative user study that investigates when, how, and forwhom record/replay tools and specifically Timelapse are bene-ficial. Our specific research questions were:
RQ 1 How does Timelapse affect the way that developersreproduce behavior?
RQ 2 How do successful and unsuccessful developers useTimelapse differently?
Study DesignWe recruited 14 web developers, 2 of which we used in pilotstudies to refine the study design. Each participant performedtwo tasks. We used a within-subjects design to see how Time-lapse changed the behavior of individual developers. For onetask, participants could use the standard debugging tools in-cluded with the Safari web browser. For the other task, theycould also use Timelapse. To mitigate learning effects, werandomized the ordering of the two tasks, and randomized taskin which they were allowed to use Timelapse.
The goal of this study was to explore the variation in how de-velopers used Timelapse, so the tasks needed to be challengingenough to expose a range of task success. To balance realismwith replicability, we chose two tasks of medium difficulty,each with several intermediate milestones. Based on our re-sults, our small exploratory study was still sufficiently largeto capture the variability in debugging and programming skillamong web developers.
ParticipantsWe recruited 14 web developers in the Seattle area. Each partic-ipant had recently worked on a substantial interactive websiteor web application. One half of the participants were develop-ers, designers, or testers. The other half were researchers whowrote web applications in the course of their research. We didnot control for experience with the jQuery or Glow librariesused by the programs being debugged.
Programs and TasksSpace Invaders. One program was the Space Invaders gamefrom our earlier example scenario. The program consists of625 SLOC in 6 files (excluding library code) and uses theGlow JavaScript library6. We chose this program for two rea-sons: its extensive use of timers makes it a heavy record/replayworkload, and its event-oriented implementation is represen-tative of object-oriented model-view programs, the dominantparadigm for large, interactive web applications.
We asked participants to fix two Space Invaders defects. Thefirst was an API mismatch that occurred when we upgraded theGlow library to a recent version while preparing the programfor use in our study. In prior versions, a sprite’s coordinateswere represented with x and y properties; in recent versions,coordinates are instead represented with left and top prop-erties, respectively. After upgrading, the game’s hit detection6http://www.bbc.co.uk/glow/
code ceases to work because it references the obsolete propertynames. The second defect was described in the motivatingexample and was masked by the first defect.
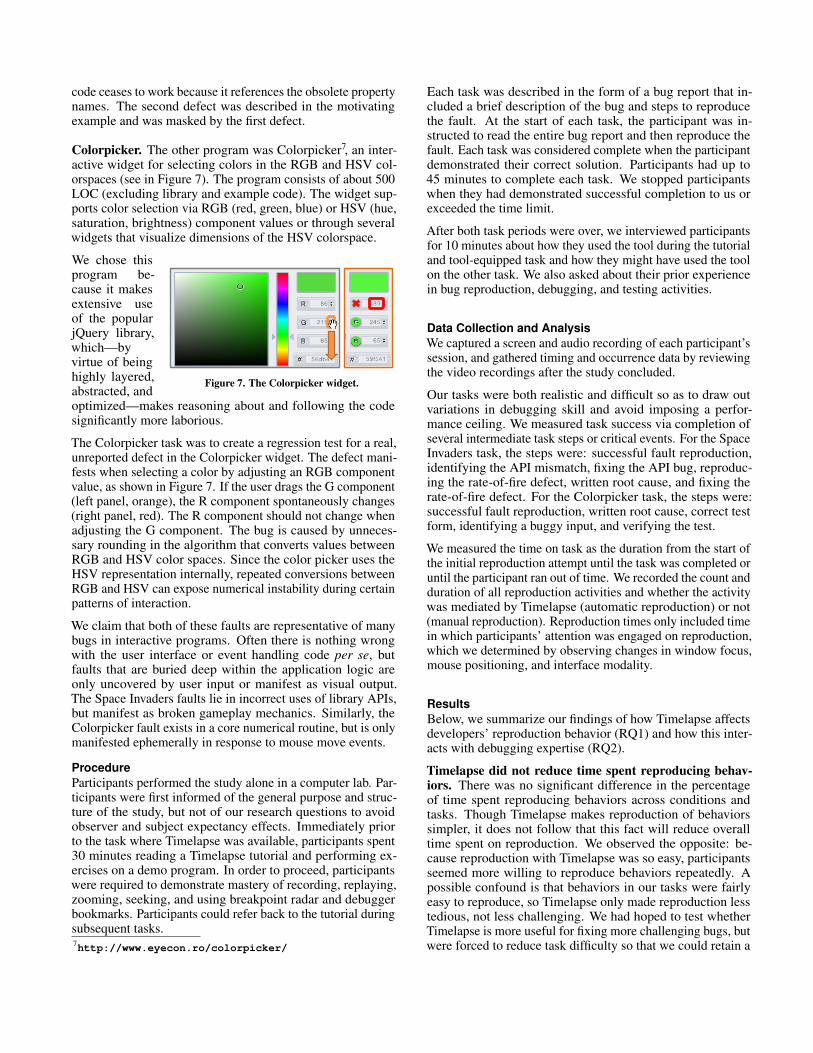
Colorpicker. The other program was Colorpicker7, an inter-active widget for selecting colors in the RGB and HSV col-orspaces (see in Figure 7). The program consists of about 500LOC (excluding library and example code). The widget sup-ports color selection via RGB (red, green, blue) or HSV (hue,saturation, brightness) component values or through severalwidgets that visualize dimensions of the HSV colorspace.
We chose this
Figure 7. The Colorpicker widget.
program be-cause it makesextensive useof the popularjQuery library,which—byvirtue of beinghighly layered,abstracted, andoptimized—makes reasoning about and following the codesignificantly more laborious.
The Colorpicker task was to create a regression test for a real,unreported defect in the Colorpicker widget. The defect mani-fests when selecting a color by adjusting an RGB componentvalue, as shown in Figure 7. If the user drags the G component(left panel, orange), the R component spontaneously changes(right panel, red). The R component should not change whenadjusting the G component. The bug is caused by unneces-sary rounding in the algorithm that converts values betweenRGB and HSV color spaces. Since the color picker uses theHSV representation internally, repeated conversions betweenRGB and HSV can expose numerical instability during certainpatterns of interaction.
We claim that both of these faults are representative of manybugs in interactive programs. Often there is nothing wrongwith the user interface or event handling code per se, butfaults that are buried deep within the application logic areonly uncovered by user input or manifest as visual output.The Space Invaders faults lie in incorrect uses of library APIs,but manifest as broken gameplay mechanics. Similarly, theColorpicker fault exists in a core numerical routine, but is onlymanifested ephemerally in response to mouse move events.
ProcedureParticipants performed the study alone in a computer lab. Par-ticipants were first informed of the general purpose and struc-ture of the study, but not of our research questions to avoidobserver and subject expectancy effects. Immediately priorto the task where Timelapse was available, participants spent30 minutes reading a Timelapse tutorial and performing ex-ercises on a demo program. In order to proceed, participantswere required to demonstrate mastery of recording, replaying,zooming, seeking, and using breakpoint radar and debuggerbookmarks. Participants could refer back to the tutorial duringsubsequent tasks.7http://www.eyecon.ro/colorpicker/
Each task was described in the form of a bug report that in-cluded a brief description of the bug and steps to reproducethe fault. At the start of each task, the participant was in-structed to read the entire bug report and then reproduce thefault. Each task was considered complete when the participantdemonstrated their correct solution. Participants had up to45 minutes to complete each task. We stopped participantswhen they had demonstrated successful completion to us orexceeded the time limit.
After both task periods were over, we interviewed participantsfor 10 minutes about how they used the tool during the tutorialand tool-equipped task and how they might have used the toolon the other task. We also asked about their prior experiencein bug reproduction, debugging, and testing activities.
Data Collection and AnalysisWe captured a screen and audio recording of each participant’ssession, and gathered timing and occurrence data by reviewingthe video recordings after the study concluded.
Our tasks were both realistic and difficult so as to draw outvariations in debugging skill and avoid imposing a perfor-mance ceiling. We measured task success via completion ofseveral intermediate task steps or critical events. For the SpaceInvaders task, the steps were: successful fault reproduction,identifying the API mismatch, fixing the API bug, reproduc-ing the rate-of-fire defect, written root cause, and fixing therate-of-fire defect. For the Colorpicker task, the steps were:successful fault reproduction, written root cause, correct testform, identifying a buggy input, and verifying the test.
We measured the time on task as the duration from the start ofthe initial reproduction attempt until the task was completed oruntil the participant ran out of time. We recorded the count andduration of all reproduction activities and whether the activitywas mediated by Timelapse (automatic reproduction) or not(manual reproduction). Reproduction times only included timein which participants’ attention was engaged on reproduction,which we determined by observing changes in window focus,mouse positioning, and interface modality.
ResultsBelow, we summarize our findings of how Timelapse affectsdevelopers’ reproduction behavior (RQ1) and how this inter-acts with debugging expertise (RQ2).
Timelapse did not reduce time spent reproducing behav-iors. There was no significant difference in the percentageof time spent reproducing behaviors across conditions andtasks. Though Timelapse makes reproduction of behaviorssimpler, it does not follow that this fact will reduce overalltime spent on reproduction. We observed the opposite: be-cause reproduction with Timelapse was so easy, participantsseemed more willing to reproduce behaviors repeatedly. Apossible confound is that behaviors in our tasks were fairlyeasy to reproduce, so Timelapse only made reproduction lesstedious, not less challenging. We had hoped to test whetherTimelapse is more useful for fixing more challenging bugs, butwere forced to reduce task difficulty so that we could retain a
within-subjects study design while minimizing participants’time commitment.
8–25% of time was spent reproducing behavior. Evenwhen provided detailed and correct reproduction steps, de-velopers in both conditions spent up to 25% (and typically10–15%) of their time reproducing behaviors. Participantsin all tasks and conditions reproduced behavior many times(median of 22 instances) over small periods. This suggests thatdevelopers frequently digress from investigative activities to re-produce program behavior. These measures are unlikely to beecologically valid because most participants did not completeall tasks, and time spent on reproduction activities outside ofthe scope of our study tasks (i.e., during bug reporting, triage,and testing) is not included.
Expert developers incorporated replay capabilities. High-performing participants—those who successfully completedthe most task steps—seemed to better integrate Timelapse’scapabilities into their debugging workflows. Corroboratingthe results of previous studies [26, 22], we observed that suc-cessful developers debugged methodically, formed and testeddebugging hypotheses using a bisection strategy, and revisedtheir assessment of the root cause as their understanding ofthe defect grew. They quickly learned how to use Timelapseto facilitate these activities. They used Timelapse to acceleratefamiliar tasks, rather than redesigning their workflow aroundrecord/replay capabilities. In the Colorpicker task, participant11 used Timelapse to compare program state before and aftereach call in the mousemove event handler, and then usedTimelapse to move back and forth in time when bisecting thespecific calls that caused the widget’s RGB values to updateincorrectly. Participants in the control condition appeared toachieve the same strategy more slowly by interleaving changesto breakpoints and manual reproduction.
Timelapse distracted less-skilled developers. Those whoonly achieved partial or limited success had trouble integrat-ing Timelapse into their workflow. We partially attribute thisto differences in participants’ prior debugging experiences andstrategies. The less successful participants used ad-hoc, op-portunistic debugging strategies; overlooked important sourcecode or runtime state; and were led astray by unverified as-sumptions. Consequently, even when these developers usedTimelapse, they did not use it to a productive end.
Summary In our study, developers used Timelapse to automat-ically reproduce program behavior during debugging tasks, butthis capability alone did not significantly affect task times, tasksuccess, or time spent reproducing behaviors. For developerswho employed systematic debugging strategies, Timelapsewas useful for quickly reproducing behaviors and navigatingto important program states. Timelapse distracted developerswho used ad-hoc or opportunistic strategies, or who were un-familiar with standard debugging tools. Timelapse was usedto accelerate the reproduction steps of existing strategies, butdid not seem to affect strategy selection during our short study.As with any new tool, it appears that some degree of trainingand experience is necessary to fully exploit the tool’s benefits.In our small study, the availability of Timelapse had no statis-tically significant effects on participants’ speed or success in
●
●
●
Colorpicker Space Invaders
1000
1500
2000
2500
Task
Tim
e (s
)
Colorpicker Space Invaders
0
25
50
75
100
Task
Com
plet
ion
(%)
Task Condition Control Timelapse
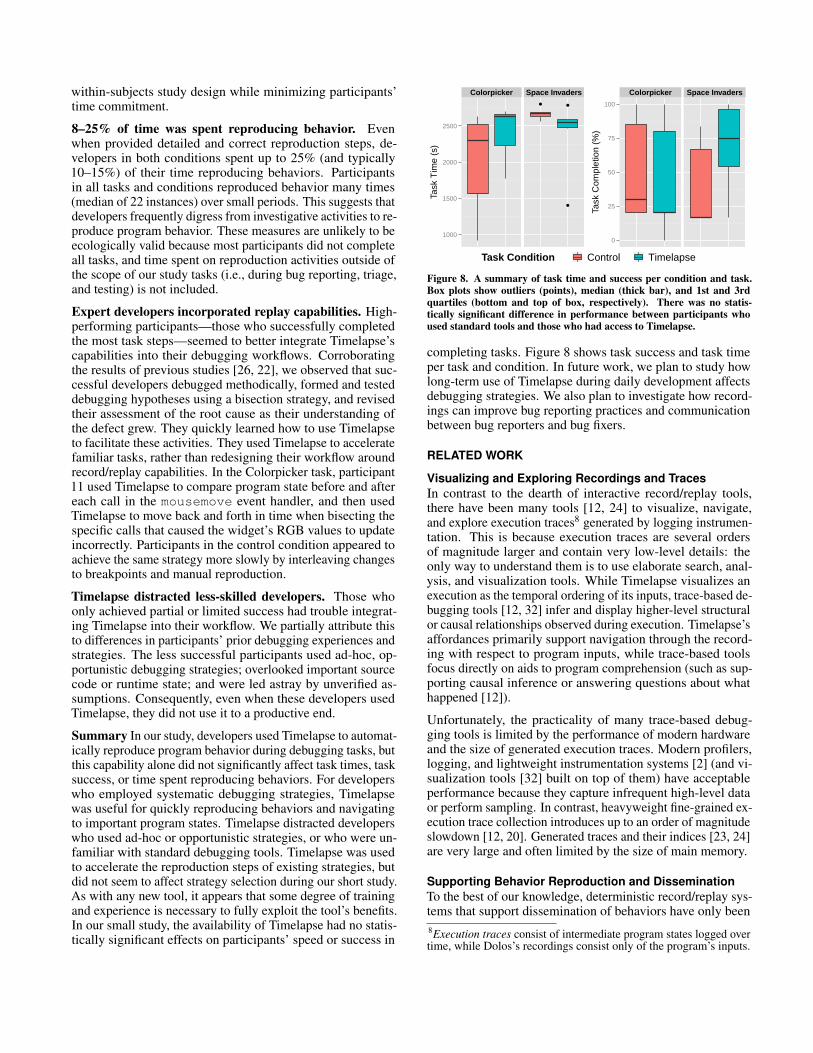
Figure 8. A summary of task time and success per condition and task.Box plots show outliers (points), median (thick bar), and 1st and 3rdquartiles (bottom and top of box, respectively). There was no statis-tically significant difference in performance between participants whoused standard tools and those who had access to Timelapse.
completing tasks. Figure 8 shows task success and task timeper task and condition. In future work, we plan to study howlong-term use of Timelapse during daily development affectsdebugging strategies. We also plan to investigate how record-ings can improve bug reporting practices and communicationbetween bug reporters and bug fixers.
RELATED WORK
Visualizing and Exploring Recordings and TracesIn contrast to the dearth of interactive record/replay tools,there have been many tools [12, 24] to visualize, navigate,and explore execution traces8 generated by logging instrumen-tation. This is because execution traces are several ordersof magnitude larger and contain very low-level details: theonly way to understand them is to use elaborate search, anal-ysis, and visualization tools. While Timelapse visualizes anexecution as the temporal ordering of its inputs, trace-based de-bugging tools [12, 32] infer and display higher-level structuralor causal relationships observed during execution. Timelapse’saffordances primarily support navigation through the record-ing with respect to program inputs, while trace-based toolsfocus directly on aids to program comprehension (such as sup-porting causal inference or answering questions about whathappened [12]).
Unfortunately, the practicality of many trace-based debug-ging tools is limited by the performance of modern hardwareand the size of generated execution traces. Modern profilers,logging, and lightweight instrumentation systems [2] (and vi-sualization tools [32] built on top of them) have acceptableperformance because they capture infrequent high-level dataor perform sampling. In contrast, heavyweight fine-grained ex-ecution trace collection introduces up to an order of magnitudeslowdown [12, 20]. Generated traces and their indices [23, 24]are very large and often limited by the size of main memory.
Supporting Behavior Reproduction and DisseminationTo the best of our knowledge, deterministic record/replay sys-tems that support dissemination of behaviors have only been8Execution traces consist of intermediate program states logged overtime, while Dolos’s recordings consist only of the program’s inputs.
widely deployed as part of video game engines [6]. Recordingsof gameplay are artifacts shared between users for entertain-ment and education. These recordings are also a critical toolfor debugging video game engines and their network proto-cols [30]. In the wider software development community, bugreporting systems [8] and practices [36] emphasize the sharingof evidence such as program output (e.g., screenshots, stacktraces, logs, memory dumps) and program input (e.g, testcases, configurations, and files). Developers investigate bugreports with user-written reproduction steps.
While we have focused on the utility of record/replay systemsfor debugging, such systems are also useful for creating andevaluating software. Prior work has used record/replay ofreal captured data to provide a consistent, interactive meansfor prototyping sensor processing [3, 19] and computer vi-sion [10] algorithms. More generally, macro-replay systemsfor reproducing user [31] and network [29] input are usedfor prototyping and testing web applications and other userinterfaces. Dolos recordings contain a superset of these in-puts; it is possible to synthesize a macro (i.e, automated testcase) for use with other tools. The JSBench tool [25] uses thisstrategy to synthesize standalone web benchmarks. Derivedinputs may improve the results of state-exploration tools suchas Crawljax [17] by providing real, captured input traces.
CONCLUSION AND FUTURE WORKTogether, Timelapse and Dolos constitute the first toolchaindesigned for interactively capturing and replaying web ap-plication behaviors during debugging. Timelapse focuses onbrowsing, visualizing, and navigating program states to sup-port behavior reproduction during debugging tasks. Our userstudy confirmed that behavior reproduction was a significantactivity in realistic debugging tasks, and Timelapse assistedsome developers in locating and automatically reproducingbehaviors of interest. The Dolos infrastructure uses a noveladaptation of instruction-counting record/replay techniques toreproduce web application behaviors. Our prototype demon-strates that deterministic record/replay can be implementedwithin browsers in an additive way—without impacting per-formance or determinism, impeding tool use, or requiringconfiguration—and is a platform for new debugging aids.
Prior work assumes that executions are in short supply duringdebugging, and that developers know a priori what sorts ofanalysis and data they want before reproducing behavior. Infuture work, we want to disrupt this status quo. On-demandreplay (in the foreground, background, or offline) couldchange the feasibility of useful program understandingtools [12] or dynamic analyses [4] that, heretofore, havebeen considered too expensive for practical (always-on)use. Using the Dolos infrastructure, we intend to transformprior works in dynamic analysis and trace visualization intoon-demand, interactive tools that a developer can quicklyemploy when necessary. We believe that when combinedwith on-demand replay, post mortem trace visualization andprogram understanding tools will become in vivo tools forunderstanding program behavior at runtime.
ACKNOWLEDGEMENTSThis material is based in part upon work supported by theNational Science Foundation under Grant Numbers CCF-0952733 and CCF-1153625. Any opinions, findings, andconclusions or recommendations expressed in this material arethose of the author(s) and do not necessarily reflect the viewsof the National Science Foundation.
REFERENCES1. Andrica, S., and Candea, G. WaRR: A tool for
high-fidelity web application record and replay. In DSN(2011).
2. Cantrill, B. M., Shapiro, M. W., and Leventhal, A. H.Dynamic instrumentation of production systems. InUSENIX ATC (2004).
3. Cardenas, T., Bastea-Forte, M., Ricciardi, A., Hartmann,B., and Klemmer, S. R. Testing physical computingprototypes through time-shifted and simulated inputtraces. In UIST (2008).
4. Chow, J., Garfinkel, T., and Chen, P. M. Decouplingdynamic program analysis from execution in virtualenvironments. In USENIX ATC (2008).
5. Cornelis, F., Georges, A., Christiaens, M., Ronsse, M.,Ghesquiere, T., and Bosschere, K. D. A taxonomy ofexecution replay systems. In SSGRR (2003).
6. Dickinson, P. Instant replay: Building a game engine withreproducible behavior. In Gamasutra (July 2001).
7. Dunlap, G. W., King, S. T., Cinar, S., Basrai, M. A., andChen, P. M. ReVirt: enabling intrusion analysis throughvirtual-machine logging and replay. SIGOPS Oper. Syst.Rev. 36, SI (Dec. 2002), 211–224.
8. Glerum, K., Kinshuman, K., Greenberg, S., Aul, G.,Orgovan, V., Nichols, G., Grant, D., Loihle, G., and Hunt,G. Debugging in the (very) large: Ten years ofimplementation and practice. In SOSP (2009).
9. Guo, Z., Wang, X., Tang, J., Liu, X., Xu, Z., Wu, M.,Kaashoek, M. F., and Zhang, Z. R2: An application-levelkernel for record and replay. In OSDI (2008).
10. Kato, J., McDirmid, S., and Cao, X. DejaVu: Integratedsupport for developing interactive camera-basedprograms. In UIST (2012).
11. King, S. T., Dunlap, G. W., and Chen, P. M. Debuggingoperating systems with time-traveling virtual machines.In USENIX ATC (2005).
12. Ko, A. J., and Myers, B. A. Extracting and answeringwhy and why not questions about Java program output.ACM Trans. Softw. Eng. Methodol. 20, 2 (Sept. 2010),4:1–4:36.
13. Ko, A. J., Myers, B. A., Coblenz, M. J., and Aung, H. H.An exploratory study of how developers seek, relate, andcollect relevant information during software maintenancetasks. IEEE Trans. Softw. Eng. 32, 12 (Dec. 2006),971–987.
14. Kuhn, A., and Greevy, O. Exploiting the analogy betweentraces and signal processing. In ICSM (2006).
15. Leshed, G., Haber, E. M., Matthews, T., and Lau, T.CoScripter: Automating and sharing how-to knowledgein the enterprise. In CHI (2008).
16. Mesbah, A., and van Deursen, A. Invariant-basedautomatic testing of AJAX user interfaces. In ICSE(2009).
17. Mesbah, A., van Deursen, A., and Lenselink, S. CrawlingAjax-based web applications through dynamic analysis ofuser interface state changes. ACM Transactions on theWeb (TWEB) 6, 1 (2012), 3:1–3:30.
18. Mickens, J., Elson, J., and Howell, J. Mugshot:deterministic capture and replay for JavaScriptapplications. In NSDI (2010).
19. Newman, M. W., Ackerman, M. S., Kim, J., Prakash, A.,Hong, Z., Mandel, J., and Dong, T. Bringing the field intothe lab: Supporting capturing and RePlay of contextualdata for design. In UIST (2010).
20. O’Callahan, R. Efficient collection and storage of indexedprogram traces, 2006.http://www.ocallahan.org/Amber.pdf.
21. Oney, S., and Myers, B. FireCrystal: Understandinginteractive behaviors in dynamic web pages. In VL/HCC(2009).
22. Parnin, C., and Orso, A. Are automated debuggingtechniques actually helping programmers? In ISSTA(2011).
23. Pothier, G., and Tanter, E. Summarized trace indexingand querying for scalable back-in-time debugging. InECOOP (2011).
24. Pothier, G., Tanter, E., and Piquer, J. Scalable omniscientdebugging. In OOPSLA (2007).
25. Richards, G., Gal, A., Eich, B., and Vitek, J. Automatedconstruction of JavaScript benchmarks. In OOPSLA(2011).
26. Robillard, M. P., Coelho, W., and Murphy, G. C. Howeffective developers investigate source code: anexploratory study. IEEE Trans. Softw. Eng. 30, 12 (Dec.2004), 889–903.
27. Saito, Y. Jockey: a user-space library for record-replaydebugging. In AADEBUG (2005).
28. Sillito, J., Murphy, G. C., and Volder, K. D. Asking andanswering questions during a programming change task.IEEE Trans. Soft. Eng. 34 (2008), 434–451.
29. Telerik. Fiddler web debugging proxy, 2013.http://www.fiddler2.com/fiddler2/.
30. Terrano, M., and Bettner, P. 1500 Archers on a 28.8:Network programming in Age of Empires and beyond. InGamasutra (March 2001).
31. The Selenium Project. Selenium WebDriverdocumentation, 2012.http://seleniumhq.org/docs/03_webdriver.html.
32. Trumper, J., Bohnet, J., and Dollner, J. Understandingcomplex multithreaded software systems by using tracevisualization. In SOFTVIS (2010).
33. VMWare, I. Replay debugging on Linux, October 2009.http://www.vmware.com/pdf/ws7_replay_linux_technote.pdf.
34. Yeh, T., Chang, T.-H., and Miller, R. C. Sikuli: UsingGUI screenshots for search and automation. In UIST(2009).
35. Zaidman, A., Matthijssen, N., Storey, M.-A., and vanDeursen, A. Connecting client and server-side executiontraces. Empirical Software Engineering (EMSE) 18, 2(2013), 181–218.
36. Zimmermann, T., Premraj, R., Bettenburg, N., Just, S.,Schrter, A., and Weiss, C. What makes a good bug report?IEEE Trans. Soft. Eng. 36, 5 (September 2010), 618–643.