interactive tennessee road improvement program (itrip)
TRANSCRIPT

Interactive Tennessee Road Improvement Program (iTRIP)
Introducing the new TDOT interactive Tennessee Road Improvement Program, or as we like to call it iTRIP. This program provides a comprehensive, authoritative, live roadway project database. The objective of iTRIP is to develop a dataset of focused information about TDOT’s roadway projects. This database will serve as a valuable tool that is reliable, current, and easy to navigate for TDOT’s variety of customers. iTRIP allows the user to locate detailed information on all Active and Let projects in TDOT’s pipeline. The accessible projects include a range of programs such as, bridge, safety, resurfacing, and Legislative. The goal of this application is to provide a public-facing source for the user to access and review current roadway projects across the State of Tennessee. Providing this constantly updated (daily) project data to the public is a new accomplishment for TDOT.
________________________________________________________________________________
This documentation will provide a brief overview of the key functionality within iTRIP.
Click on the following link to navigate to the iTRIPs website.
https://bit.ly/TDOTiTRIP
______________________________________________________________________________Interface

Filtering
Upper Right the user can filter on Representative Name and Senator Name.
To select click the drop down and pick a name. To unselect click the small X to the right of the filter item.
Upper Left you are able to filter on Program Type, County, Region, MPO, and RPO.
To select click the drop down and pick an item. To unselect click the small X to the right of the filter item.
• Program Type – Types of Programs and Projects at the TDOT. See Program Type Help tab.
• County – County Boundary. • Region – Tennessee Regional Boundaries • MPO – Metropolitan Planning Organization
Boundaries. • RPO – Rural Planning Organization Boundaries.
Left Center (Tabs) are individual tabs which offer help and additional product functionality. This will be further explained later.
• Map • Attribute Table • How to Use Dashboard • Program Type Help

Indicators/Widgets
Located bottom center these are interactive and allow the user to click and filter what is seen on the map. Clicking on an item in the bar or the pie charts will update the map. Clicking on it again will update it again.

Map Functionality and Useability
These items will be highlighted but not discussed in depth because they are self-explanatory in nature. Here their mention is to make the reader aware such functionality does exist.
• Clicking with your mouse on any project (shown as a line) will display a pop up with the project information.
o Blank entries are expected and not a result of filtering or exclusion. • Lower right corner of the map is a zoom in and zoom out function. • Upper Right you have a set of six tools individually described below
o Magnifying Glass – Search, allows the user to search by PIN or Route Number. o Home – Return to full extent. o Bullet List – Legend of what can be seen on the map. o Layers – Toggle on and off individual layers of the map. o Four Squares – The background or underlying map image can be changed to suit the
user’s needs. o Full Extent Circle – This is a small circle with four outward facing arrows that enlarges
the map.

Attribute Table Tab Purpose & Functionality
Purpose
To provide a more hands on way of querying and filtering the data and support the tabular exporting of this data.
*note* The Map tab and the Attribute Table tab are independent of each other. Meaning that a drop-down filter on the map will not interact with the Attribute Table Tab.
Both tabs link to the same underlying data but serve separate functions. They will not and cannot interact with each other.
There are two options or methods to perform queries with the Attribute Table Tab.

Option 1
At the bottom of the map you will see “Attribute Table”. Click this tab to open.
This tab presents the first possible option for displaying a table and exporting a table.
In the upper right there is an expand to full screen circle if you need more space.
In the left middle-center there is an “Options” button (seen right). Clicking it will show you the “Filter” option.
This will open a filter screen where you can create a single or multiple criteria filter. Below is a picture showing a completed query. It filters the data by Davidson County to show only Resurfacing Program Types. Clicking OK will apply this filter. This is a case sensitive query.
Clicking okay will return you to the tab table window.
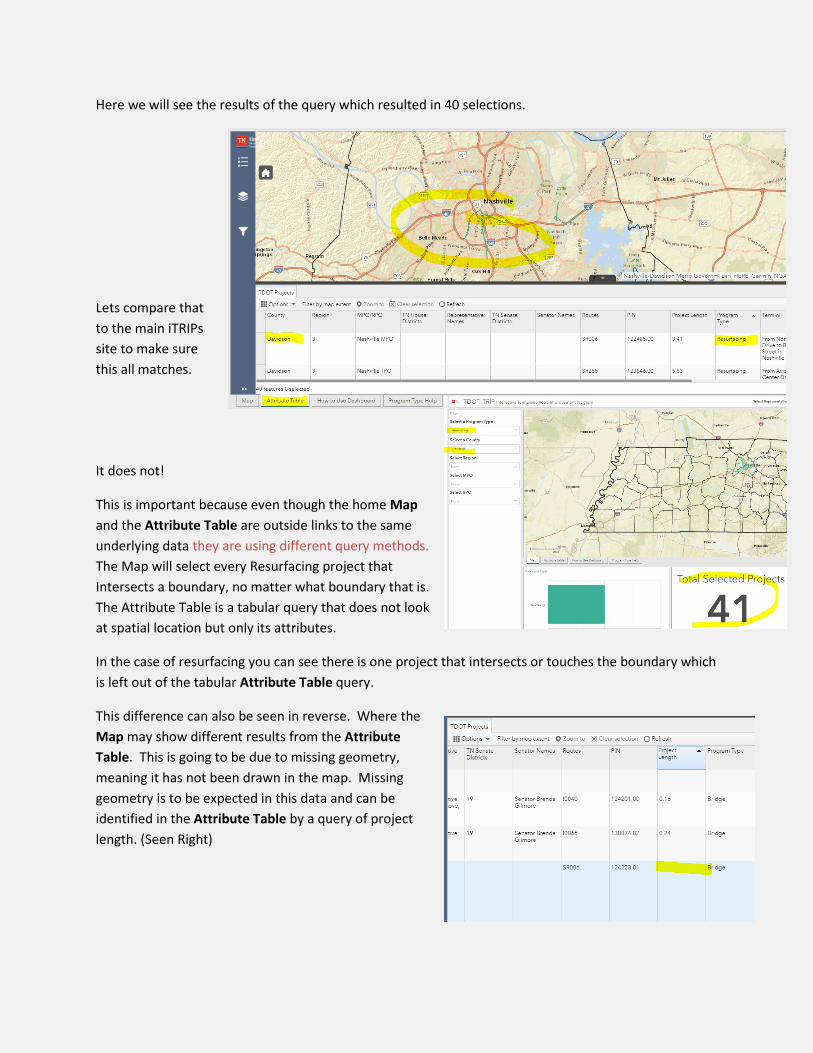
Here we will see the results of the query which resulted in 40 selections.
Lets compare that to the main iTRIPs site to make sure this all matches.
It does not!
This is important because even though the home Map and the Attribute Table are outside links to the same underlying data they are using different query methods. The Map will select every Resurfacing project that Intersects a boundary, no matter what boundary that is. The Attribute Table is a tabular query that does not look at spatial location but only its attributes.
In the case of resurfacing you can see there is one project that intersects or touches the boundary which is left out of the tabular Attribute Table query.
This difference can also be seen in reverse. Where the Map may show different results from the Attribute Table. This is going to be due to missing geometry, meaning it has not been drawn in the map. Missing geometry is to be expected in this data and can be identified in the Attribute Table by a query of project length. (Seen Right)
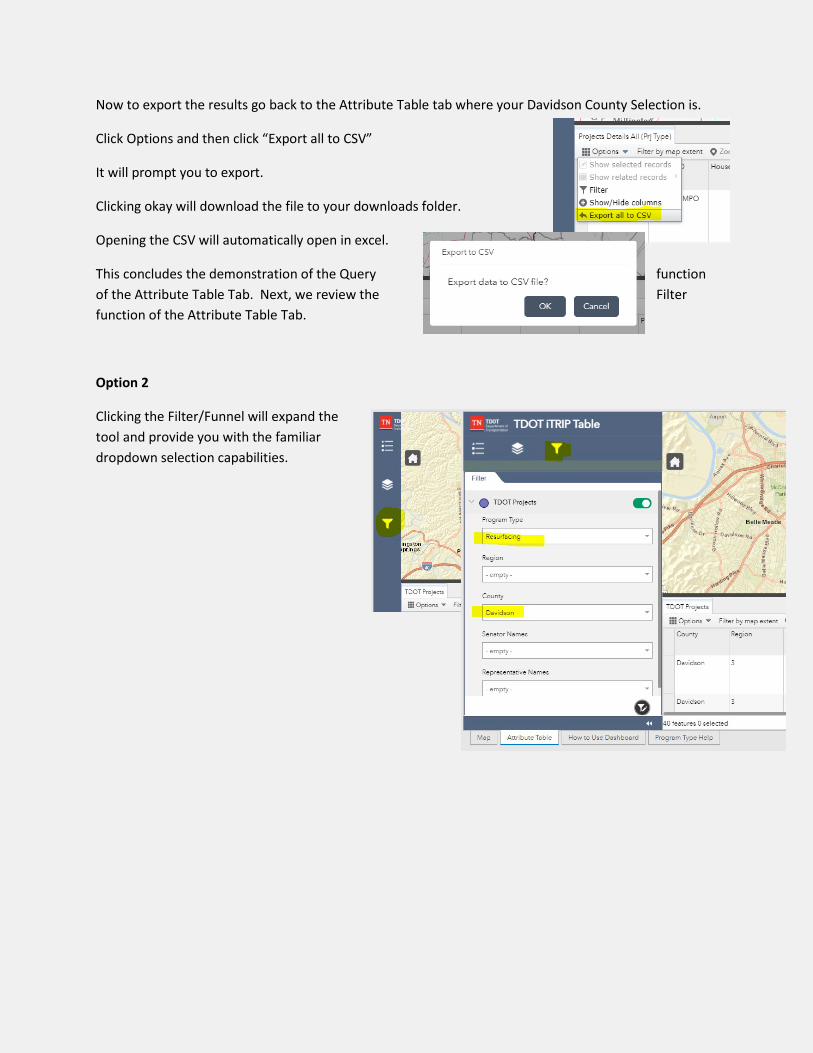
Now to export the results go back to the Attribute Table tab where your Davidson County Selection is.
Click Options and then click “Export all to CSV”
It will prompt you to export.
Clicking okay will download the file to your downloads folder.
Opening the CSV will automatically open in excel.
This concludes the demonstration of the Query function of the Attribute Table Tab. Next, we review the Filter function of the Attribute Table Tab.
Option 2
Clicking the Filter/Funnel will expand the tool and provide you with the familiar dropdown selection capabilities.

Now to export the results go back to the Attribute Table tab where your Davidson County Selection is.
Click Options and then click “Export all to CSV”
It will prompt you to export.
Clicking okay will download the file to your downloads folder.
Opening the CSV will automatically open in excel.

Exporting and Reporting
*note* The technology this system is built on does not provide a report functionality. Formatting of this file is the responsibility of the user and it cannot be automated, preformatted, or generated in other formats.
When you open in excel you will have an unformatted product. As shown in the below picture I used the excel default and clicked “Format as Table” and selected blue.
Doing so formats it nicely with filters as seen below. Comparing data counts you will see that there are again 18 matching records which match the above filters.
This concludes the demonstration of the exporting and reporting functionality of the Attribute Table Tab. Next, we will touch on the documentation Tabs.

Documentation
The documentation Tabs repeat much of the same information found here.
“How to Use Dashboard” is a quick reference guide on the basic functionality of iTRIP and the sites Disclaimer.
“Program Type Help” is a dictionary of the different Program Types providing the user with useful background on each type.
Please contact [email protected] for further questions or a personal walk through of this functionality.