interactome - national institutes of health
TRANSCRIPT
Interactome
Teresa M. Przytycka* and Dong-Yeon Cho
National Center of Biotechnology Information, NIH
8600 Rockville Pike, Bethesda MD, 20894 USA
Correspondig author e-mail: [email protected]
Cell’s interactome consists of all the molecular interactions occurring in the cell. Among diverse
types of molecular interactions, genome-wide protein-protein interactions are most broadly
studied. In this chapter we focus on genome-scale methods to infer and study protein-protein
interactions. Following a brief introduction to the subject (Section 1), we outline experimental
(Section2) and computational (Section3) techniques to uncover interactions between proteins. In
the context of computational methods, we also discuss methods for predicting interactions
between protein domains. In Section 4, we describe basic topological properties of protein
interaction networks such as node degree distribution, modularity, and network motifs. In section
5, we discuss the motivation and approaches for comparing biological networks. In Section 6,
we briefly introduce protein and domain interaction databases. Section 7 provides sample
applications that take advantage of interactome data while the last Section 8 points to possible
future directions of interactome related research.
Keyword Glossary
Co-evolution Correlated evolutionary changes in the genetic composition of biological objects such as genes. Typically it is assumed that the change in one object is triggered by the genetic change in the second. However in the context of this article, we don’t make the causality assumption. Co-expression Analogous spatial or temporal expression patterns of two or more genes. Typically, co-expression can be identified by calculating correlation coefficients and assessing these correlations though statistical tests. Graph/Network A representation of a binary relation between a set of objects. The objects are called vertices (or nodes). The relation between two vertices is represented by an edge (or link). Specially, a graph whose edges are directed is called directed graph. Directed graphs can be used to represent an asymmetric relation such as gene regulation. Gene Regulatory Network A directed network of genes where one gene (a transcription factor) regulates the expression of another gene (target gene).
Homologs and Orthologs Homologs are genes which originated from a common ancestor. Two homologous found in different species are called orthologs if their least common ancestor in the gene evolutionary tree corresponds to a speciation event. Orthologs typically perform closely related roles in the corresponding organisms. Protein-Protein Interaction Network A network whose nodes denote proteins and links represent binding of proteins to carry out their biological function. Transcription Factor A protein which binds to specific DNA sequences to regulate the transcription or expression of genes. By controlling RNA polymerase’s access to the genes, transcription factors can activate or repress the expression (transfer of genetic information from DNA to mRNA) of the corresponding gene. Yeast Two-Hybrid (Y2H) A yeast-based biological technique used to test protein interaction. One of tested proteins is fused to a DNA binding domain and the other fused to an activation domain. If the two proteins interact a reporter gene is expressed.
1. Introduction
Within a cell, diverse biomolecules work together in a coordinated fashion to provide specific
cellular functions. This coordinated action is achieved, in large part, by a variety of
intermolecular interactions including protein-protein interactions, protein-DNA interactions,
RNA interactions, and many others. Here we focus mainly on interactions between proteins,
including those corresponding to physical interactions (here protein-protein binding) as well as
more abstract “functional” interactions between them. However we briefly mention other
interaction types as well.
Biomolecular interactions are conveniently represented as networks (graphs) with nodes
(vertices) representing molecules, and links (edges) representing interactions between them.
Depending on the type of interaction, the corresponding edge might be directed or not. For
example, a binding of two proteins is typically represented by an undirected edge while an
interaction between a transcription factor and a gene whose expression is regulated by the given
transcription factor is usually represented by a directed edge. A representation of the interactome
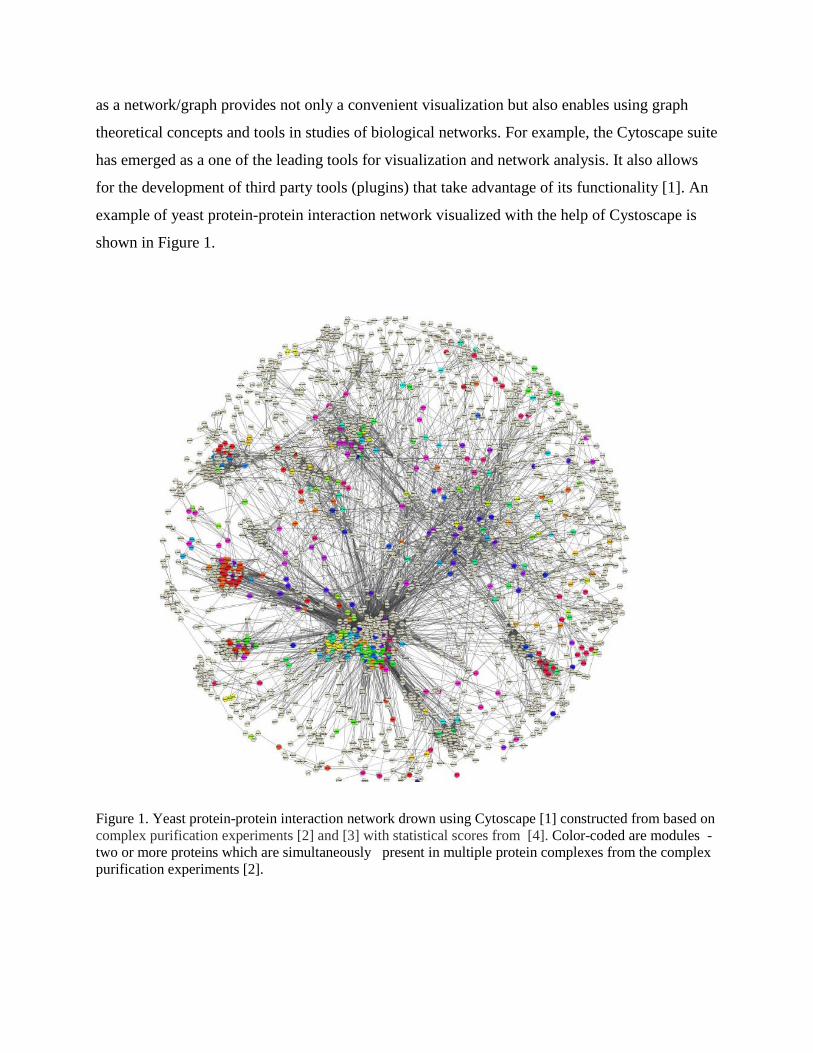
as a network/graph provides not only a convenient visualization but also enables using graph
theoretical concepts and tools in studies of biological networks. For example, the Cytoscape suite
has emerged as a one of the leading tools for visualization and network analysis. It also allows
for the development of third party tools (plugins) that take advantage of its functionality [1]. An
example of yeast protein-protein interaction network visualized with the help of Cystoscape is
shown in Figure 1.
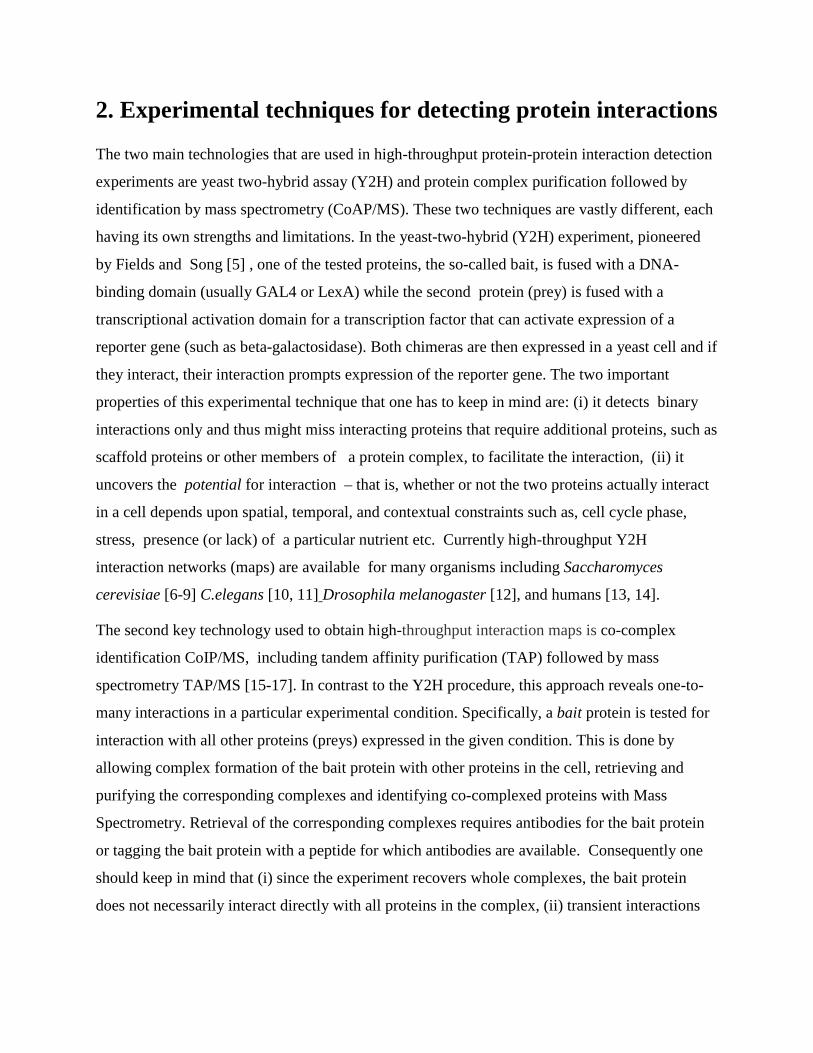
Figure 1. Yeast protein-protein interaction network drown using Cytoscape [1] constructed from based on complex purification experiments [2] and [3] with statistical scores from [4]. Color-coded are modules - two or more proteins which are simultaneously present in multiple protein complexes from the complex purification experiments [2].
2. Experimental techniques for detecting protein interactions
The two main technologies that are used in high-throughput protein-protein interaction detection
experiments are yeast two-hybrid assay (Y2H) and protein complex purification followed by
identification by mass spectrometry (CoAP/MS). These two techniques are vastly different, each
having its own strengths and limitations. In the yeast-two-hybrid (Y2H) experiment, pioneered
by Fields and Song [5] , one of the tested proteins, the so-called bait, is fused with a DNA-
binding domain (usually GAL4 or LexA) while the second protein (prey) is fused with a
transcriptional activation domain for a transcription factor that can activate expression of a
reporter gene (such as beta-galactosidase). Both chimeras are then expressed in a yeast cell and if
they interact, their interaction prompts expression of the reporter gene. The two important
properties of this experimental technique that one has to keep in mind are: (i) it detects binary
interactions only and thus might miss interacting proteins that require additional proteins, such as
scaffold proteins or other members of a protein complex, to facilitate the interaction, (ii) it
uncovers the potential for interaction – that is, whether or not the two proteins actually interact
in a cell depends upon spatial, temporal, and contextual constraints such as, cell cycle phase,
stress, presence (or lack) of a particular nutrient etc. Currently high-throughput Y2H
interaction networks (maps) are available for many organisms including Saccharomyces
cerevisiae [6-9] C.elegans [10, 11] Drosophila melanogaster [12], and humans [13, 14].
The second key technology used to obtain high-throughput interaction maps is co-complex
identification CoIP/MS, including tandem affinity purification (TAP) followed by mass
spectrometry TAP/MS [15-17]. In contrast to the Y2H procedure, this approach reveals one-to-
many interactions in a particular experimental condition. Specifically, a bait protein is tested for
interaction with all other proteins (preys) expressed in the given condition. This is done by
allowing complex formation of the bait protein with other proteins in the cell, retrieving and
purifying the corresponding complexes and identifying co-complexed proteins with Mass
Spectrometry. Retrieval of the corresponding complexes requires antibodies for the bait protein
or tagging the bait protein with a peptide for which antibodies are available. Consequently one
should keep in mind that (i) since the experiment recovers whole complexes, the bait protein
does not necessarily interact directly with all proteins in the complex, (ii) transient interactions
are often difficult to capture using this approach. Like with Y2H experiment, a number of high-
throughput co-complexed interaction have been obtained [2, 3, 18-20] .
The two experimental methods described above are, in many ways, complementary and have
unique strengths and limitations [21-23]. Therefore the results of both types of experiments are
commonly combined into one protein-protein interaction network. While such a combined
network provides a more complete interactome, it is important to keep in mind that if treated
individually, the two types of experiments used to obtain such a network define two rather
different networks in terms of their biological and topological properties (e.g. [9, 24]) .
3. Computational Prediction of Protein Interactions
Experimental procedures detecting protein-protein interactions are complemented by
computational approaches. Computational methods explore a variety of techniques which can
roughly be divided into three categories: evolutionary based approaches, statistical methods, and
machine learning techniques. Evolutionary based approaches for predicting protein interactions
typically explore the idea that interacting proteins are subject to common evolutionary
constraints. Such constraints can impact the spatial organization of interacting genes in the
genome, position in protein-protein interaction network, or the amino-acid sequence. While
some of these approaches are designed to predict physical interactions, many do not attempt to
distinguish physical and functional interactions, as both types of interactions might be subject to
similar evolutionary constrains.
3.1. Interaction prediction from the gene patterns across genomes.
3.1.1. Gene Fusion
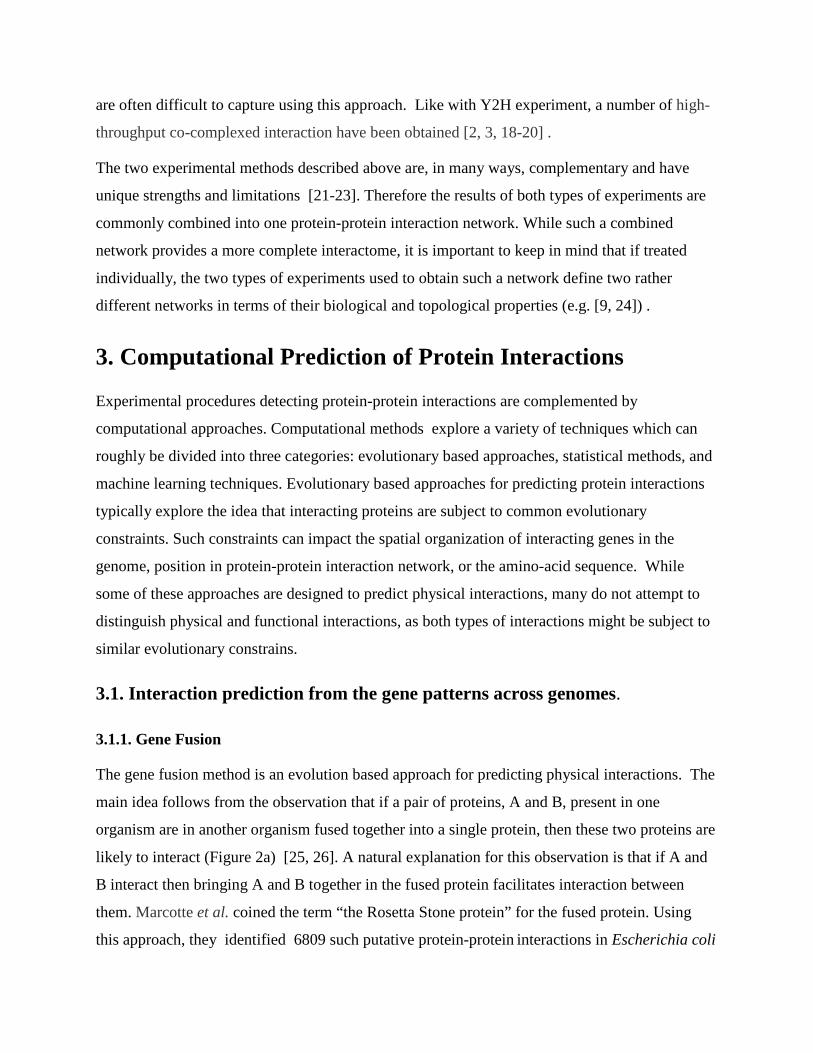
The gene fusion method is an evolution based approach for predicting physical interactions. The
main idea follows from the observation that if a pair of proteins, A and B, present in one
organism are in another organism fused together into a single protein, then these two proteins are
likely to interact (Figure 2a) [25, 26]. A natural explanation for this observation is that if A and
B interact then bringing A and B together in the fused protein facilitates interaction between
them. Marcotte et al. coined the term “the Rosetta Stone protein” for the fused protein. Using
this approach, they identified 6809 such putative protein-protein interactions in Escherichia coli
and 45,502 in yeast (Figure 2a). In a larger study, Enright and Ouziunis uncovered 7,224
component and 2,365 unique composite proteins across 24 species [27].
Figure 2. Prediction of protein interaction from gene pattern in the genomes: a) the “Rosetta stone” method that predicts interaction between proteins P1 and P2 based on the fact that they are fused together into one protein in genome 3; b) the gene order method predicts interaction between P1 and P3 based on conservation of their order; c) Phylogenic profile method predicts (functional) interaction based on similar pattern of presence and absence in genomes G1-G5.
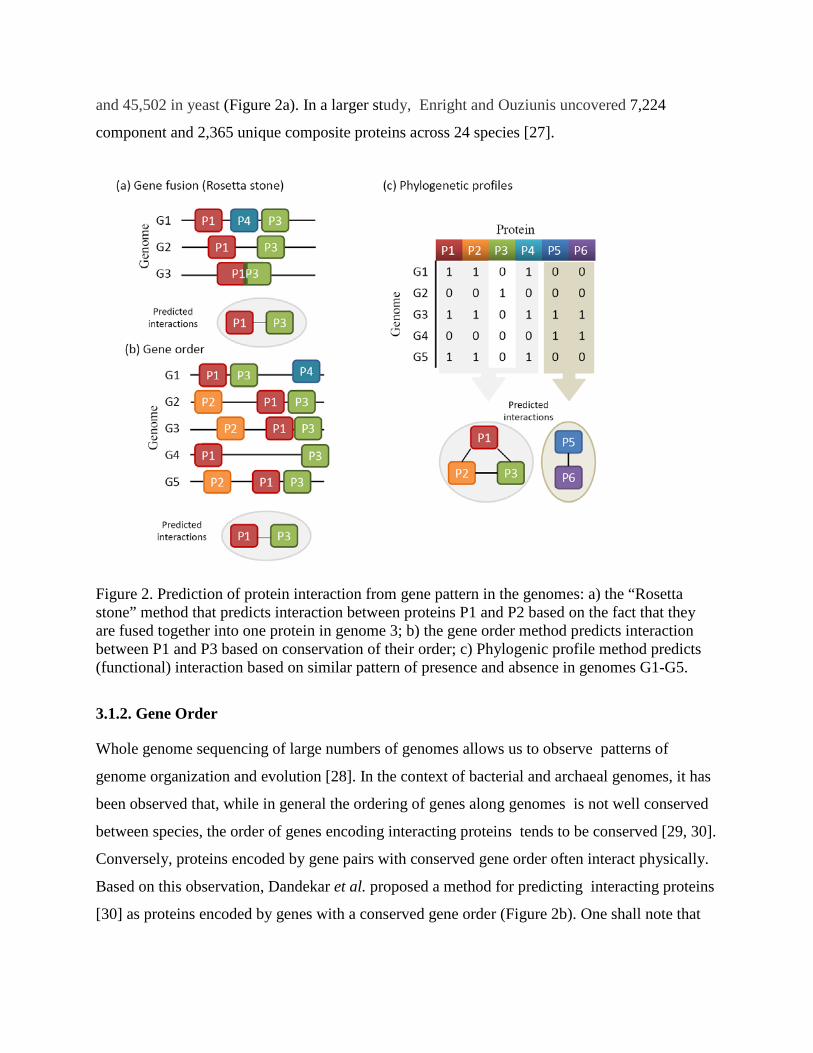
3.1.2. Gene Order
Whole genome sequencing of large numbers of genomes allows us to observe patterns of
genome organization and evolution [28]. In the context of bacterial and archaeal genomes, it has
been observed that, while in general the ordering of genes along genomes is not well conserved
between species, the order of genes encoding interacting proteins tends to be conserved [29, 30].
Conversely, proteins encoded by gene pairs with conserved gene order often interact physically.
Based on this observation, Dandekar et al. proposed a method for predicting interacting proteins
[30] as proteins encoded by genes with a conserved gene order (Figure 2b). One shall note that
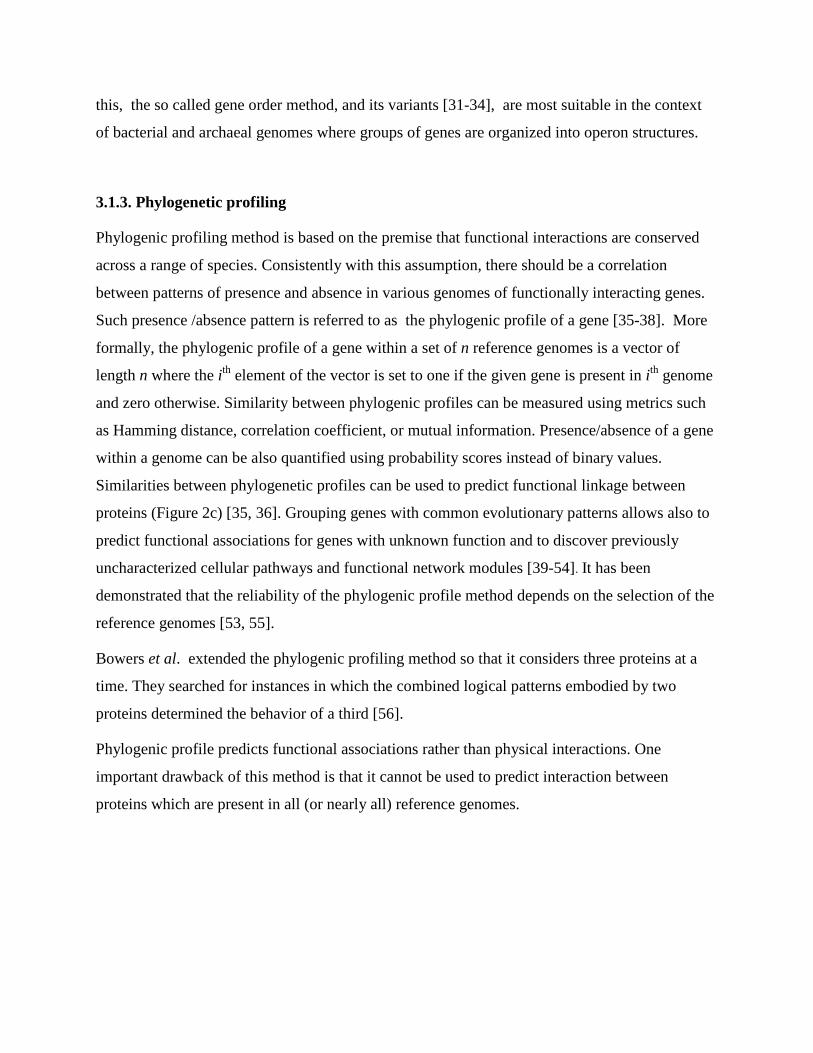
this, the so called gene order method, and its variants [31-34], are most suitable in the context
of bacterial and archaeal genomes where groups of genes are organized into operon structures.
3.1.3. Phylogenetic profiling
Phylogenic profiling method is based on the premise that functional interactions are conserved
across a range of species. Consistently with this assumption, there should be a correlation
between patterns of presence and absence in various genomes of functionally interacting genes.
Such presence /absence pattern is referred to as the phylogenic profile of a gene [35-38]. More
formally, the phylogenic profile of a gene within a set of n reference genomes is a vector of
length n where the ith element of the vector is set to one if the given gene is present in ith genome
and zero otherwise. Similarity between phylogenic profiles can be measured using metrics such
as Hamming distance, correlation coefficient, or mutual information. Presence/absence of a gene
within a genome can be also quantified using probability scores instead of binary values.
Similarities between phylogenetic profiles can be used to predict functional linkage between
proteins (Figure 2c) [35, 36]. Grouping genes with common evolutionary patterns allows also to
predict functional associations for genes with unknown function and to discover previously
uncharacterized cellular pathways and functional network modules [39-54]. It has been
demonstrated that the reliability of the phylogenic profile method depends on the selection of the
reference genomes [53, 55].
Bowers et al. extended the phylogenic profiling method so that it considers three proteins at a
time. They searched for instances in which the combined logical patterns embodied by two
proteins determined the behavior of a third [56].
Phylogenic profile predicts functional associations rather than physical interactions. One
important drawback of this method is that it cannot be used to predict interaction between
proteins which are present in all (or nearly all) reference genomes.
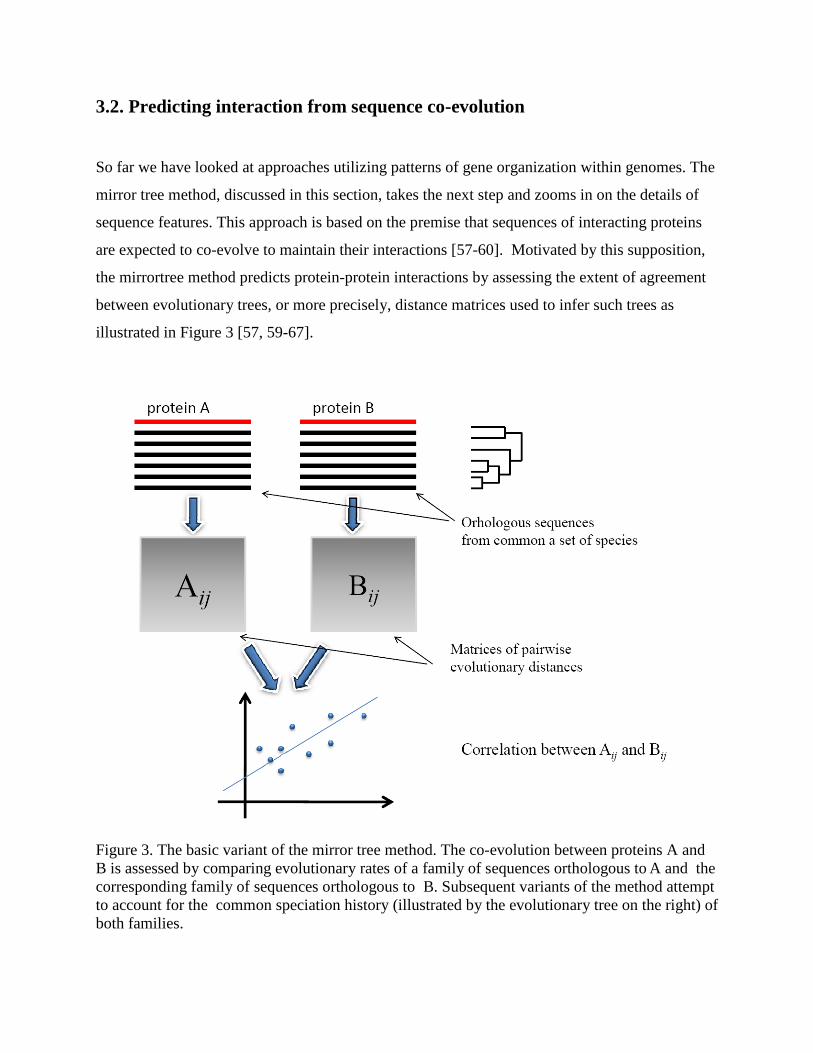
3.2. Predicting interaction from sequence co-evolution
So far we have looked at approaches utilizing patterns of gene organization within genomes. The
mirror tree method, discussed in this section, takes the next step and zooms in on the details of
sequence features. This approach is based on the premise that sequences of interacting proteins
are expected to co-evolve to maintain their interactions [57-60]. Motivated by this supposition,
the mirrortree method predicts protein-protein interactions by assessing the extent of agreement
between evolutionary trees, or more precisely, distance matrices used to infer such trees as
illustrated in Figure 3 [57, 59-67].
Figure 3. The basic variant of the mirror tree method. The co-evolution between proteins A and B is assessed by comparing evolutionary rates of a family of sequences orthologous to A and the corresponding family of sequences orthologous to B. Subsequent variants of the method attempt to account for the common speciation history (illustrated by the evolutionary tree on the right) of both families.
In its simplest form, the mirror tree method assesses the co-evolution of two proteins by the
correlation between the distance matrices constructed individually for the sets of sequences
orthologous to each of the two proteins. That is, given two proteins A and B, it considers n
sequences orthologous with A and the same number of sequences orthologous with B coming
from the same set of species. Subsequently, for each pair (i,j) of orthologs of A (respectively
B), it estimates the evolutionary distance A(i,j) (respectively B(i,j) ) between them. The degree
of co-evolution between the two families of orthologs is then assessed by computing the
correlation coefficient between the distance matrices (Figure 3).
As described above, the mirror tree measures the correlation between rates of evolutionary
changes (rates of divergence). There are two reasons for which such correlation might occur:
common speciation history and common evolutionary constraints imposed by physical and/or
functional interaction. Thus one of the challenges related to the mirror tree approach is to
separate apart these two sources of correlation. Recently several methods have been developed to
address this problem and have been shown to improve interaction prediction accuracy [64, 65,
68]. The approaches of Pazos et al. and Sato et al. subtract the estimated organism divergence
rates from the combined co-evolution signal while Kann et al. shows that the performance of the
mirrortree method can be further improved by restricting the co-evolution analysis to the more
conserved regions in the protein domain sequences and disregarding highly divergent regions.
Such regions are likely to be diverged by neutral evolution and are not expected to contain a
functional co-evolution signal.
It is natural to hypothesize that the driving mechanisms of sequence co-evolution come from
compensating mutations, where mutations in one binding partner is compensated by
complementary mutations in another partner to maintain amino acid interactions. However it has
been shown that compensating mutations are not the only, perhaps not even the dominating,
contributor to the correlation of evolutionary rates [69, 70]. Instead, the co-evolution signal is
more likely a composite of many other factors such co-expression of interacting proteins, similar
codon usage, interaction with other proteins in a complex, etc. This suggests that it should be
meaningful to consider co-evolution (or co-adaptation) of proteins in a broader network-level
context. This idea has been explored by Juan et al. who replaced the vector of evolutionary
distances by the vector of co-evolutionary correlations between all proteins within a genome
and, in this way, obtained a reliable interaction network of Escherichia coli [71].
There are several other variants of the mirror tree method. For example, Tiller and Charlebois
replaced simple matrix correlation by a more sophisticated search for the most similar common
subtree, that can also include paralogs [72]. A variant of the mirror tree approach has been used
to predict interaction specificity. Namely, given two families of proteins, which are known to
interact, the objective is to establish a mapping defining interaction partners between the
members of one family with the members of the other family [62, 73, 74]. Finally, Jothi et al.
used the mirror tree method to identify interacting domains within interacting proteins [61].
3.3. Domain interactions
A large fraction of prokaryotic and most of eukaryotic proteins are composed of more than one
domain [75]. Protein interaction typically involves binding between two or more specific
domains. Indeed, the domain composition of two proteins can be used for predicting interaction
between them [76-84]. Conversely, the knowledge of a protein interaction network can be used
to infer interacting domains [85-90].
The idea of using protein-protein interaction network to predict domain-domain interactions was
first explored by Sprinzak and Margalit who proposed a simple statistical approach, referred to
as the Association Method [82]. The idea behind this approach is to score each domain pair by
the log ratio of the frequency of occurrences in interacting proteins to the expected frequency of
independent occurrences of these two domains [82]. That is, if Pi is the observed frequency of
domain i in the interaction network and Pij is the observed frequency of domain pair (i, j) in
interacting protein pairs, then ji
ij
PPP
jiScorenAssociatio log),(_ = . Interacting domain pairs are then
predicted as the pairs with high association score. Following the work of Sprinzak and Margalit,
several related methods have been proposed (reviewed in [86]). For example, Deng et al.
developed a maximum likelihood approach to estimate the probability of domain-domain
interactions [81]. The main idea is to estimate, for each domain pair, the probability of
interaction between domains so that the likelihood of the interaction network is maximized. An
elegant feature of this approach is an explicit modeling of errors in the high-throughput data that
constitutes the protein interaction network.
These early domain interaction prediction methods were successful in uncovering domains that
interact in a constitutive way however were challenged in the situations where a domain pair ( i,
j) interacts in the context of some protein pairs but at the same time there are also many proteins
containing i and j respectively that do not interact. To be able to discover such context specific
interactions, Riley et al. introduced Domain Pair Exclusion Analysis (DPEA) [91]. This
approach is a clever utilization of the maximum likelihood approach. Namely the likelihood
score of a network can be viewed as a measure of how well the probabilities assigned to putative
domain interactions explain the network. Thus, if domain pair (i, j) mediates some protein-
protein interactions in a context specific way, then excluding such domain pair as a possible
interacting pair should decrease the likelihood score of the network. Consistently with this
premise, DPEA predicts interaction between domains by measuring the drop in the likelihood
score when a particular domain pair is not allowed to interact. This approach was able to detect
interacting domain pairs missed by the previous approaches. More recently, Wang et al. [92]
improved this idea further and suggested a scoring method that accounts more fully for the
context in which the interaction occurs. To achieve this, rather than globally disallowing all
interactions between two specific domains as proposed by Riley et al., they disallow only
interactions in the context of a specific pair of interacting proteins.
The idea of recovering interacting domains by examining how well the potential domain contacts
explain the protein interaction network was also the basis of the method proposed by Guimarães
and colleagues [85]. Building on the assumption that protein interactions evolved in a most
parsimonious way, they proposed the Parsimonious Explanation method which finds a smallest
weighted set of domain interactions that can “explain” the protein interaction network. In other
words, the method finds the smallest set of domains so that if one considers them interacting then
each interacting protein pair contains at least one interacting domain pair. This model is
formalized as an optimization problem and solved with a Linear Programming procedure. The
variables of the linear program represent the potential domain contacts derived from the protein
interaction network, and the constraints are defined protein-protein interactions (edges). The
construction is illustrated in Figure 4.
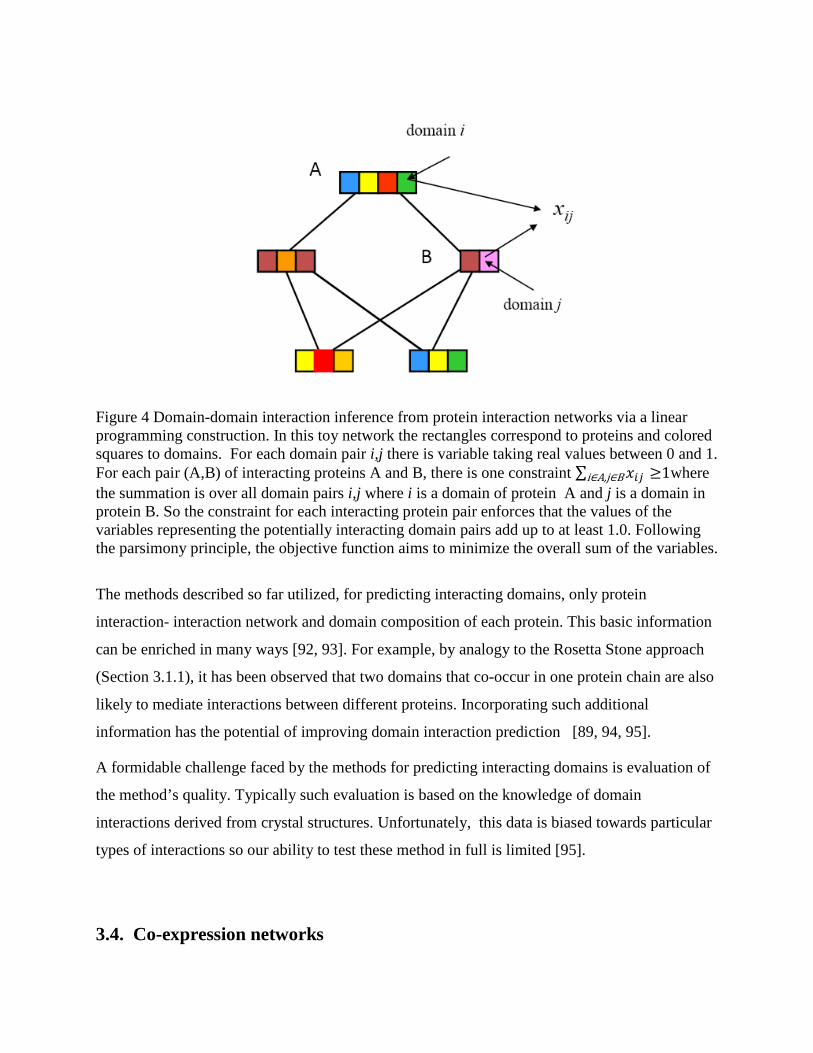
Figure 4 Domain-domain interaction inference from protein interaction networks via a linear programming construction. In this toy network the rectangles correspond to proteins and colored squares to domains. For each domain pair i,j there is variable taking real values between 0 and 1. For each pair (A,B) of interacting proteins A and B, there is one constraint ∑ 𝑥𝑖𝑗 i∈A,j∈B ≥1where the summation is over all domain pairs i,j where i is a domain of protein A and j is a domain in protein B. So the constraint for each interacting protein pair enforces that the values of the variables representing the potentially interacting domain pairs add up to at least 1.0. Following the parsimony principle, the objective function aims to minimize the overall sum of the variables.
The methods described so far utilized, for predicting interacting domains, only protein
interaction- interaction network and domain composition of each protein. This basic information
can be enriched in many ways [92, 93]. For example, by analogy to the Rosetta Stone approach
(Section 3.1.1), it has been observed that two domains that co-occur in one protein chain are also
likely to mediate interactions between different proteins. Incorporating such additional
information has the potential of improving domain interaction prediction [89, 94, 95].
A formidable challenge faced by the methods for predicting interacting domains is evaluation of
the method’s quality. Typically such evaluation is based on the knowledge of domain
interactions derived from crystal structures. Unfortunately, this data is biased towards particular
types of interactions so our ability to test these method in full is limited [95].
3.4. Co-expression networks
Starting from the assumption that proteins from the same protein complex are likely to be co-
expressed, expression data has been utilized to predict new and validate known protein-protein
interactions [96-102]. Co-expression networks are usually inferred by computing the Pearson
correlation coefficients or mutual information between every pair of gene expression profiles
across a variety of experimental conditions. It has been shown that genes with similar expression
patterns across a set of samples tend to be functionally related [103]. Therefore co-expression
data is frequently combined with other type of data to predict protein-protein interactions and
build functional networks. Such networks built using expression information have been
constructed for variety of organisms [96-98, 104-108].
Expression profiles are often used to infer regulatory networks. The underlying assumption
explored in gene regulatory network reconstruction programs such as ARACNE [109] is that
change in the expression of a transcription factor should be mirrored in a change in the
expression of genes regulated by a given transcription factor. Co-expression alone does not
provide information on the direction of regulatory relationship. However, expression data can be
also used to construct Bayesian networks which can represent conditional dependence of
expression levels (for a primer on Bayesian network analysis utilizing expression data see [110];
for a recent review see [111]). A related approach to orient the edges was proposed by Schadt et
al. [112, 113].
4. Exploring the topology of the interactome
Graph theory provides a unifying language to describe relations within complex systems and has
played an increasingly important role in understanding biological systems. It enables the use of
graph-theoretical tools and concepts to interrogate properties of interaction networks. Currently a
number of packages for visualizing, modeling and analyzing various types of networks are
available including the popular Cytoscape package [1, 114].
4.1 Global properties
Studies of protein interaction networks form several model organisms revealed that such
networks often have interesting topological properties. One of the most celebrated properties is a
particular distribution of node degrees (the number of immediate network neighbors for a given
node). Specifically, it has been argued that for these networks the degree distribution is
consistent with a power law [115-117]. In other words, it has been suggested that interaction
networks are scale free. Formally, in a scale free network, the fraction P(k) of nodes in the
network having degree k is proportional to k--γ that is ; where γ is a constant whose
value is typically in the range 2 < γ < 3. While the accuracy of the supposition that the protein
interaction networks are scale free has been questioned, [118-120], the main property of protein
interaction networks consistent with a scale free network – small number of highly connected
nodes (hubs) and large number of weakly connected nodes - is generally not disputed.
4.2. Network centrality and protein essentiality
Network centrality is a measure of the topological prominence of a node within a network. Is
network centrality related to protein function? There are several ways to measure node
centrality emphasizing different aspects of network topology [121]. In the context of biological
networks, the most studied centrality indexes are degree centrality and betweenness centrality,
however many other indexes have been also considered [24, 122, 123]. Degree centrality
evaluates the node’s centrality by the number of its immediate neighbors in the network (Figure
5). The nodes with high degree are referred to as hubs. In contrast, in the shortest-path
betweenness centrality, the node’s centrality value is proportional to the fraction of shortest paths
between all pairs of nodes that go through a given node (Figure 5). Thus betweenness centrality
measures whether a node might be central for the information flow within the network.
Alternatively, one can model the interactome as an electric circuit and use current flow to model
propagation of information between all pairs nodes is such network and define current flow
centrality as a total amount of current going through a given node [24, 124-128].
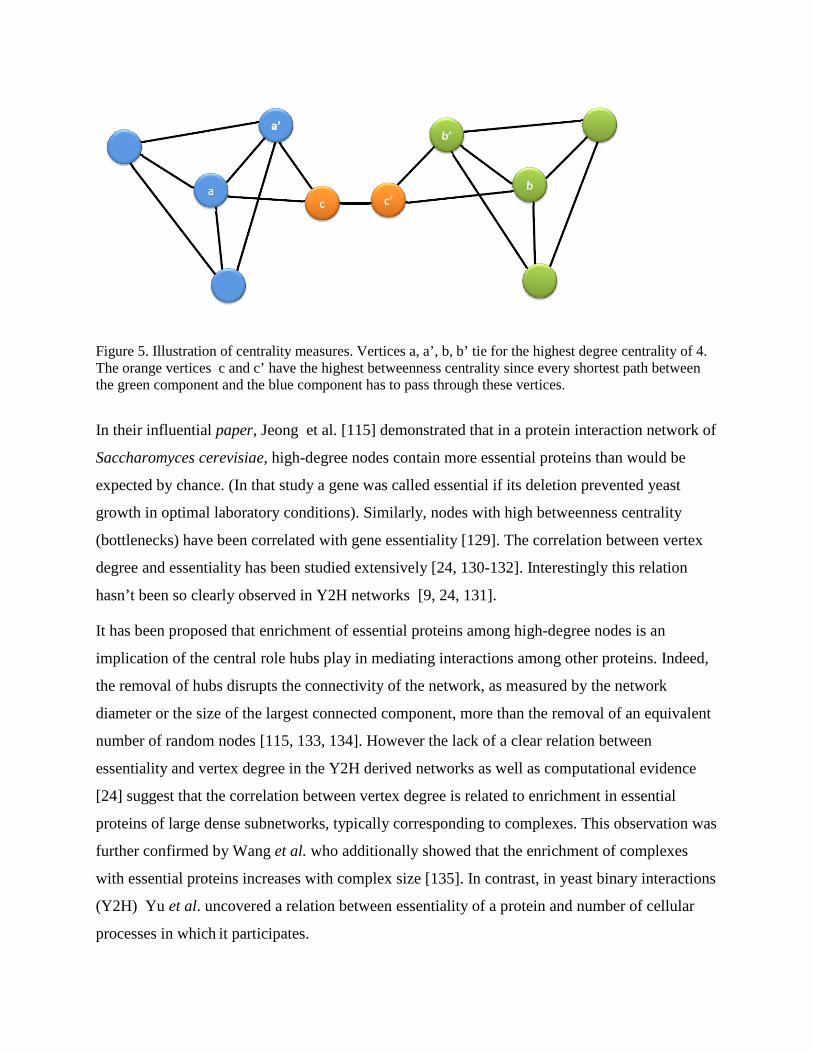
Figure 5. Illustration of centrality measures. Vertices a, a’, b, b’ tie for the highest degree centrality of 4. The orange vertices c and c’ have the highest betweenness centrality since every shortest path between the green component and the blue component has to pass through these vertices.
In their influential paper, Jeong et al. [115] demonstrated that in a protein interaction network of
Saccharomyces cerevisiae, high-degree nodes contain more essential proteins than would be
expected by chance. (In that study a gene was called essential if its deletion prevented yeast
growth in optimal laboratory conditions). Similarly, nodes with high betweenness centrality
(bottlenecks) have been correlated with gene essentiality [129]. The correlation between vertex
degree and essentiality has been studied extensively [24, 130-132]. Interestingly this relation
hasn’t been so clearly observed in Y2H networks [9, 24, 131].
It has been proposed that enrichment of essential proteins among high-degree nodes is an
implication of the central role hubs play in mediating interactions among other proteins. Indeed,
the removal of hubs disrupts the connectivity of the network, as measured by the network
diameter or the size of the largest connected component, more than the removal of an equivalent
number of random nodes [115, 133, 134]. However the lack of a clear relation between
essentiality and vertex degree in the Y2H derived networks as well as computational evidence
[24] suggest that the correlation between vertex degree is related to enrichment in essential
proteins of large dense subnetworks, typically corresponding to complexes. This observation was
further confirmed by Wang et al. who additionally showed that the enrichment of complexes
with essential proteins increases with complex size [135]. In contrast, in yeast binary interactions
(Y2H) Yu et al. uncovered a relation between essentiality of a protein and number of cellular
processes in which it participates.
Combing vertex degree information with expression data, Han et al. distinguished two groups of
hubs called ‘party’ and ‘date’ hubs [136]. For a party hub, the expression of the hub node is
correlated with that of its neighbors, suggesting that all of the interactions may take place
simultaneously or under similar conditions. In contrast, in date hubs, the correlation between the
expression of a hub and its neighbor is, on average low. Thus these two types of hubs are
proposed to play distinct roles in interactome –party hubs being members of protein complexes
or functional modules while date hubs corresponding to global regulators possibly linking
various functional modules.
4.3. Network modules
In their landmark paper, Hartwell et al. proposed functional modules as a critical level of
biological organization [137]. They defined a functional module as an entity, composed of many
type of interacting molecule, whose function is separable from those of other modules. Currently,
modularity of biological systems is a widely accepted phenomenon. Indeed, by analyzing an
early yeast protein-protein interaction network, Schwikowski et al. observed that proteins of
known function and cellular location tend to cluster together. Genome-scale reconstructions of
biological networks that are enabled by current technologies provide context for identifying such
modules. However there is no unique way to mathematically define functional modules.
Computationally, most methods search for densely connected subgraphs or clusters using a
variety of heuristics ranging from growing modules from seed clusters, clustering based on
graph-theoretical distance measures, to Monte Carlo Markov Clustering (MCMC) approaches
[138-155]. Additionally, gene expression information can be utilized to obtain more reliable
modules [156-158].
A characteristic property, that one naturally expects modules to satisfy, is that molecules within
the module are more strongly connected between themselves than are the molecules in the
module to molecules outside the module. This intuition can is formalized by the following
concept of modularity. Given a partition of nodes of network with m edges (links) into groups
C1, C2 … Cr the modularity of such partition can be defined as
𝑄 = 1
2𝑚�(𝐴𝑖𝑗 −
𝑘𝑖𝑘𝑗2𝑚
𝑖,𝑗
)𝐶𝑖𝑗
Where Aij equals one if i and j are connected in the network and zero otherwise; Cij equals to one
of i and j are in the same group and zero otherwise. So defined Q takes values between -1 and 1
where positive value of Q indicates that number of edges within groups is higher than expected
by chance. Following such (or related) definition, some methods identify modules as partitions
into “communities” that maximize modularity [151, 159].
Most of modules finding algorithms assign each node to at most one module. However, in
practice, biological modules can overlap and/or form modular hierarchies. Furthermore, a given
component may belong to a different module at different time. Thus some of the more recent
approaches focus on identifying overlapping modules [140, 160] their hierarchy [161] or
dynamics along activity pathways [162].
Given the wealth and diversity of module finding algorithms, it is important to provide some
means of establishing the biological relevance of uncovered modules. The most commonly
applied strategy is to evaluate how well various methods perform in uncovering known
complexes [163], potentially overlapping functional modules [164], or how well they are
conserved through evolution [165]. In a recent evaluation of module finding algorithms, Song
and Singh observed that the performances of various algorithms in uncovering functional
modules can differ substantially when run on the same network and that their relative
performances change depending upon the topological characteristics of the network under
consideration indicating that there is currently no single best approach to this problem.
4.4 Network motifs and related concepts
In section 4.1 we observed that vertices in protein-protein interaction network tend to have a
characteristics vertex degree distribution manifested by a small number of high degree nodes and
a large number of nodes with a very small degree. As a natural extension of node degree we can
consider distribution of small subnetworks such as such as triangles, squares etc. Along this line
Milo et al., defined network motifs as subgraphs that occur in a network much more often than it
is expected by chance [166]. The “by chance” occurrence in a given type of network is usually
estimated by constructing a set of random networks with the same basic properties as the tested
network - for example the same degree distribution. In their landmark paper, Milo et al.
discovered that various networks are characterized by overrepresentation of certain network
motifs. Focusing on directed networks, Milo et al. showed, among other findings,
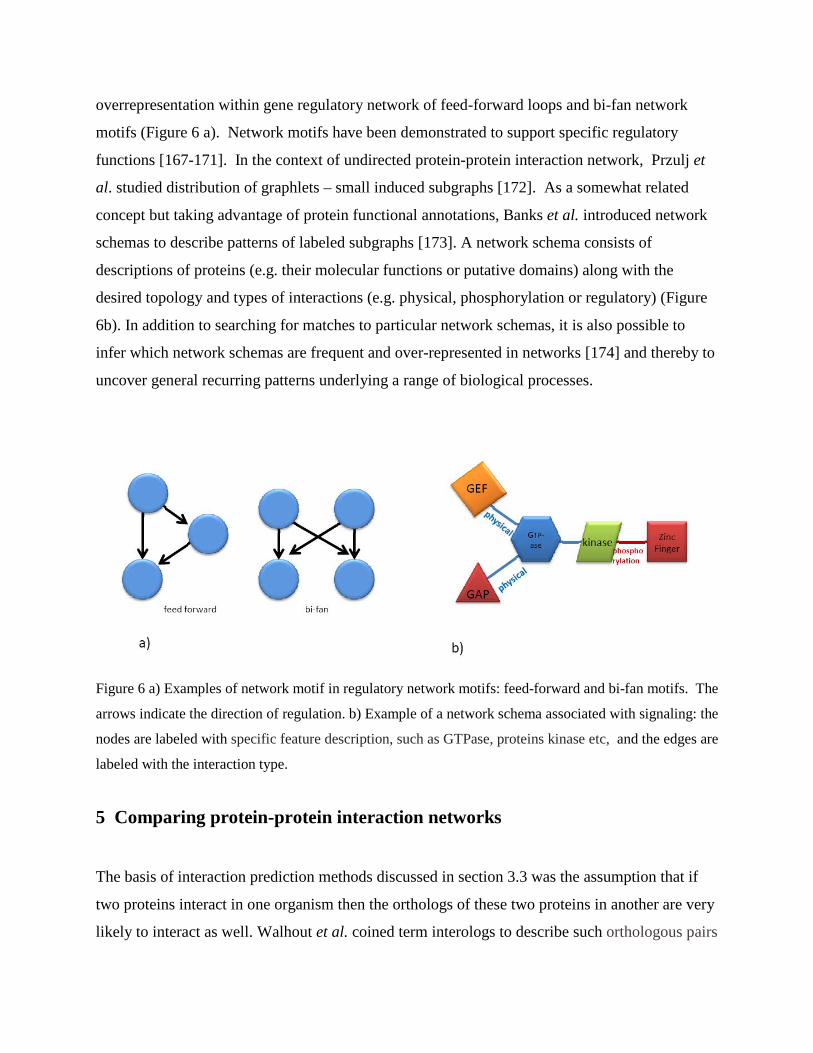
overrepresentation within gene regulatory network of feed-forward loops and bi-fan network
motifs (Figure 6 a). Network motifs have been demonstrated to support specific regulatory
functions [167-171]. In the context of undirected protein-protein interaction network, Przulj et
al. studied distribution of graphlets – small induced subgraphs [172]. As a somewhat related
concept but taking advantage of protein functional annotations, Banks et al. introduced network
schemas to describe patterns of labeled subgraphs [173]. A network schema consists of
descriptions of proteins (e.g. their molecular functions or putative domains) along with the
desired topology and types of interactions (e.g. physical, phosphorylation or regulatory) (Figure
6b). In addition to searching for matches to particular network schemas, it is also possible to
infer which network schemas are frequent and over-represented in networks [174] and thereby to
uncover general recurring patterns underlying a range of biological processes.
Figure 6 a) Examples of network motif in regulatory network motifs: feed-forward and bi-fan motifs. The
arrows indicate the direction of regulation. b) Example of a network schema associated with signaling: the
nodes are labeled with specific feature description, such as GTPase, proteins kinase etc, and the edges are
labeled with the interaction type.
5 Comparing protein-protein interaction networks
The basis of interaction prediction methods discussed in section 3.3 was the assumption that if
two proteins interact in one organism then the orthologs of these two proteins in another are very
likely to interact as well. Walhout et al. coined term interologs to describe such orthologous pairs
of interacting proteins [175]. Indeed, it has been show that a protein interaction map generated
in one species can be used to predict interactions in another species [175-177].
The idea of transferring interaction annotation between organisms can be extended further by
comparing whole interaction networks between different organisms. Such network comparison
allows addressing a number of fundamental biological questions related to the evolution of
protein interaction networks and predicting new functional information about proteins and
interactions that are poorly characterized [178]. Just as sequence alignment is the cornerstone of
sequence comparison, network comparison demands methods for alignment of biological
networks. Indeed, aligning interaction networks from different organisms allows one to discover
evolutionary conserved pathways and functional orthologs [179, 180] [181] [182, 183] .
From the algorithmic-theoretical perspective, network alignment is a difficult problem and, in
the most general formulation, reduces to finding of a maximal common subnetwork of two (or
more) networks – a classical problem in graph theory known to be NP-complete [184]. Thus it is
unlikely that a fast algorithm to solve the problem in the full generality exit. However, over the
years, a number of insightful and efficient algorithms have been proposed that take advantage of
various specific properties of biomolecular networks [181, 185-192]. These algorithms allows
for global network alignment, local alignments, as well as finding alignments of a subnetwork
within a larger network.
With these tools at hand one can search for conserved network regions such as conserved protein
complexes and pathways, identify proteins with despite lack of sequence similarity perform the
same function in the network, or even use network similarities to infer evolutionary trees [193,
194] .
6. Databases of protein and domain interactions
As the data about protein and domain interactions has been steadily increasing, various databases
and public repositories have been constructed to share the knowledge and to support subsequent
studies. Recent reviews of these databases can be found in [195-197]. In this section, we provide
representative examples of such databases. The Database of Interacting Proteins (DIP) catalogs
experimentally determined protein-protein interactions which are obtained from various
resources including the literature, the Protein Data Bank (PDB), and high-throughput
experiments [198, 199]. IntAct [200] and BioGRID [201] contain not only protein-protein
interactions but also other types of interactions such as protein-small molecule interactions and
genetic interactions. MINT [202] annotates each interaction with a score which ranges from 0 to
1 for quantifying interaction support. Since none of the current database can provide the
complete information about interactions for all species, some groups tried to extract and unified
interaction data from different repositories. APID [203] and PINA [204] are two representatives
of such meta-databases. Furthermore, some databases (e.g., STRING [54, 205, 206] and I2D
[207] ) include protein-protein interactions predicted by computational approaches. Finally, some
dedicated protein interaction data focusing on specific model organisms are incorporated as a
part of the organism related resources such as FlyBase [208] for D.melanogaster, and SGD
[209] for yeast.
Analysis of domain interactions often provides important insights into the role and the
mechanism of an interaction. The databases 3did, [210], iPFAM [211], and PIBASE [212]
allow for exploring the details of domain interactions by studying three dimensional structures
of interacting domains extracted from in the Protein Data Bank [213]. The Conserved Binding
Mode (CBM) database [214] categorizes interacting domains by the Conserved Domain
Database (CDD) family type and interaction mode. DOMINE contains both known and predicted
domain interactions obtained from two 3D-structure based databases (iPfam and 3did) and eight
different computational approaches [215].
7. Applications
Knowledge of protein interactions can provide important clues about the functioning of cells and
organisms. In this section, we provide several examples of how interaction networks can be
explored to empower biomedical research. Obviously the examples presented below are only a
small sampling of the diverse applications of bimolecular networks.
7.1. Predicting protein function
The observation that majority of interactions occur between proteins with common functional
assignment [216] paved the way to several approaches to predict protein function based on the
protein’s location in the network in relation to functionally annotated proteins. Sharan et al.
divide the emerging methods into two types: direct and module-assisted schemes [217]. The
direct annotation schemes, individual links in the network are used for inferring functions of
proteins. In contrast, module-based methods first detect modules of interconnected proteins and
then assign protein functions based on functional annotation of other proteins in the module.
Thus the key step of module-based methods is utilization of module finding approaches
discussed in section 4.3. Here we focus on the direct annotation approaches. The pioneering
method of Schwikowski et al. predicts the biological process of a non-annotated protein by
considering its neighboring interactions and assigning to this protein the annotations that are
most frequent among the neighbors [216]. This strategy works very well for biological networks
with high proportion of annotated proteins where un-annotated proteins have many annotated
neighboring proteins [218]. Hishigaki et al. extended further this neighbor derived annotation
method and rather than considering direct neighbors of a given proteins, they consider all
proteins within a particular radius [219]. Subsequently, Nabieva et al. argued that in such
transfer of functional annotation from more distant neighbors, one should take into account not
only the distance to annotated proteins but also the topology of the network. This view is utilized
in their “functional flow” algorithm [218].
Integrating network topology with other type of data, such as gene expression profile, domain
context, text mining can further inform functional annotation [217, 220, 221]. Kourmpetis et al.
proposed Markov random field analysis for integrating protein interaction network with multiple
data sources [222].
7.2. Application to human diseases
It is now increasingly recognized that complex diseases should be studied from the perspective
of dys-regulated pathways and processes rather than individual genes. The availability of
genome scale protein-protein interaction and other interaction maps has made it possible to begin
such systems-level investigation of human diseases. Following this principle, in their elegant
work, Chuang et al. proposed network-based method for classification of breast cancer
metastasis [223]. The main idea of this approach is to combine gene expression profiles with
network/pathway information and look for disease altered subnetworks. The underlying
assumption is that disease related perturbations, manifested by gene expression change,
propagate over the interaction network and lead to clusters of perturbed nodes. Importantly,
some abnormally expressed genes might differ between disease cases but many clusters are
expected to be common. Such perspective has proven to be is helpful for in disease
classification [224, 225], identification of disease dys-regulated pathways [226, 227], and for
finding disease associated genes [228-234].
Recent studies have also begun to connect disease perturbed networks to genetic variations.
Integrating expression and genotypic data from an intercross population, Cheng et al. identified
a liver and adipose macrophage enriched sub-network that associated with metabolic disease
traits [235]. More recently, Kim et al. proposed a novel computational method for genome-wide
identification putatively causal gene copy number variation and affected pathways. Their method
utilizes gene expression profiles, copy number variation information, and diverse interaction
networks [125, 127, 128].
8. Looking ahead - towards the dynamic interactome
Availability of genome scale interactome has made it possible to ask general questions about
organization of biological systems and information flow within such system. In this chapter, we
have focused mostly on protein-protein interaction networks. However in practical applications,
including some of the applications discussed in this chapter, integrative networks combining
various types of interactions are increasingly being used. There are a growing number of tools
that allow interrogating existing networks to generate testable hypotheses. However, most of the
current studies treat molecular networks as hardwired structures. Yet real biological network are
dynamic, and their functioning depends upon this. In a recent review, Przytycka et al. roughly
categorize interactome dynamics as spatial, temporal, and contextual [236]. One should
expect that after the initial decade of interactome studies, the next decade will constitute a shift
from static to dynamic network analysis -- an essential paradigm change necessary for a deeper
understanding of molecular systems.
Acknowledgments
This work is supported by the Intramural Program of the National Institutes of Health, National
Library of Medicine.
References 1. Shannon, P., A. Markiel, O. Ozier, N.S. Baliga, J.T. Wang, D. Ramage, N. Amin, B. Schwikowski, and T.
Ideker, Cytoscape: a software environment for integrated models of biomolecular interaction networks. Genome Res, 2003. 13(11): p. 2498-504.
2. Gavin, A.C., P. Aloy, P. Grandi, R. Krause, M. Boesche, M. Marzioch, C. Rau, L.J. Jensen, S. Bastuck, B. Dumpelfeld, A. Edelmann, M.A. Heurtier, V. Hoffman, C. Hoefert, K. Klein, M. Hudak, A.M. Michon, M. Schelder, M. Schirle, M. Remor, T. Rudi, S. Hooper, A. Bauer, T. Bouwmeester, G. Casari, G. Drewes, G. Neubauer, J.M. Rick, B. Kuster, P. Bork, R.B. Russell, and G. Superti-Furga, Proteome survey reveals modularity of the yeast cell machinery. Nature, 2006. 440(7084): p. 631-6.
3. Krogan, N.J., G. Cagney, H. Yu, G. Zhong, X. Guo, A. Ignatchenko, J. Li, S. Pu, N. Datta, and A.P. Tikuisis, Global landscape of protein complexes in the yeast Saccharomyces cerevisiae. Nature, 2006. 440(7084): p. 637 - 643.
4. Collins, S.R., P. Kemmeren, X.C. Zhao, J.F. Greenblatt, F. Spencer, F.C. Holstege, J.S. Weissman, and N.J. Krogan, Toward a comprehensive atlas of the physical interactome of Saccharomyces cerevisiae. Mol Cell Proteomics, 2007. 6(3): p. 439-50.
5. Fields, S. and O. Song, A novel genetic system to detect protein-protein interactions. Nature, 1989. 340(6230): p. 245-6.
6. Fromont-Racine, M., J.C. Rain, and P. Legrain, Toward a functional analysis of the yeast genome through exhaustive two-hybrid screens. Nat Genet, 1997. 16(3): p. 277-82.
7. Ito, T., T. Chiba, R. Ozawa, M. Yoshida, M. Hattori, and Y. Sakaki, A comprehensive two-hybrid analysis to explore the yeast protein interactome. Proc. Natl. Acad. Sci. U. S. A., 2001. 98(8): p. 4569-74.
8. Uetz, P., L. Giot, G. Cagney, T.A. Mansfield, R.S. Judson, J.R. Knight, D. Lockshon, V. Narayan, M. Srinivasan, P. Pochart, A. Qureshi-Emili, Y. Li, B. Godwin, D. Conover, T. Kalbfleisch, G. Vijayadamodar, M. Yang, M. Johnston, S. Fields, and J.M. Rothberg, A comprehensive analysis of protein-protein interactions in Saccharomyces cerevisiae. Nature, 2000. 403(6770): p. 623-7.
9. Yu, H., P. Braun, M.A. Yildirim, I. Lemmens, K. Venkatesan, J. Sahalie, T. Hirozane-Kishikawa, F. Gebreab, N. Li, N. Simonis, T. Hao, J.F. Rual, A. Dricot, A. Vazquez, R.R. Murray, C. Simon, L. Tardivo, S. Tam, N. Svrzikapa, C. Fan, A.S. de Smet, A. Motyl, M.E. Hudson, J. Park, X. Xin, M.E. Cusick, T. Moore, C. Boone, M. Snyder, F.P. Roth, A.L. Barabasi, J. Tavernier, D.E. Hill, and M. Vidal, High-quality binary protein interaction map of the yeast interactome network. Science, 2008. 322(5898): p. 104-10.
10. Reboul, J., P. Vaglio, J.F. Rual, P. Lamesch, M. Martinez, C.M. Armstrong, S. Li, L. Jacotot, N. Bertin, R. Janky, T. Moore, J.R. Hudson, Jr., J.L. Hartley, M.A. Brasch, J. Vandenhaute, S. Boulton, G.A. Endress, S. Jenna, E. Chevet, V. Papasotiropoulos, P.P. Tolias, J. Ptacek, M. Snyder, R. Huang, M.R. Chance, H. Lee, L. Doucette-Stamm, D.E. Hill, and M. Vidal, C. elegans ORFeome version 1.1: experimental verification of the genome annotation and resource for proteome-scale protein expression. Nat Genet, 2003. 34(1): p. 35-41.
11. Li, S., C.M. Armstrong, N. Bertin, H. Ge, S. Milstein, M. Boxem, P.O. Vidalain, J.D. Han, A. Chesneau, T. Hao, D.S. Goldberg, N. Li, M. Martinez, J.F. Rual, P. Lamesch, L. Xu, M. Tewari, S.L. Wong, L.V. Zhang, G.F. Berriz, L. Jacotot, P. Vaglio, J. Reboul, T. Hirozane-Kishikawa, Q. Li, H.W. Gabel, A. Elewa, B. Baumgartner, D.J. Rose, H. Yu, S. Bosak, R. Sequerra, A. Fraser, S.E. Mango, W.M. Saxton, S. Strome, S. Van Den Heuvel, F. Piano, J. Vandenhaute, C. Sardet, M. Gerstein, L. Doucette-Stamm, K.C. Gunsalus, J.W. Harper, M.E. Cusick, F.P. Roth, D.E. Hill, and M. Vidal, A map of the interactome network of the metazoan C. elegans. Science, 2004. 303(5657): p. 540-3.
12. Giot, L., J.S. Bader, C. Brouwer, A. Chaudhuri, B. Kuang, Y. Li, Y.L. Hao, C.E. Ooi, B. Godwin, E. Vitols, G. Vijayadamodar, P. Pochart, H. Machineni, M. Welsh, Y. Kong, B. Zerhusen, R. Malcolm, Z. Varrone, A. Collis, M. Minto, S. Burgess, L. McDaniel, E. Stimpson, F. Spriggs, J. Williams, K. Neurath, N. Ioime, M. Agee, E. Voss, K. Furtak, R. Renzulli, N. Aanensen, S. Carrolla, E. Bickelhaupt, Y. Lazovatsky, A. DaSilva, J. Zhong, C.A. Stanyon, R.L. Finley, Jr., K.P. White, M. Braverman, T. Jarvie, S. Gold, M. Leach, J. Knight, R.A. Shimkets, M.P. McKenna, J. Chant, and J.M. Rothberg, A protein interaction map of Drosophila melanogaster. Science, 2003. 302(5651): p. 1727-36.
13. Rual, J.F., K. Venkatesan, T. Hao, T. Hirozane-Kishikawa, A. Dricot, N. Li, G.F. Berriz, F.D. Gibbons, M. Dreze, N. Ayivi-Guedehoussou, N. Klitgord, C. Simon, M. Boxem, S. Milstein, J. Rosenberg, D.S. Goldberg, L.V. Zhang, S.L. Wong, G. Franklin, S. Li, J.S. Albala, J. Lim, C. Fraughton, E. Llamosas, S. Cevik, C. Bex, P. Lamesch, R.S. Sikorski, J. Vandenhaute, H.Y. Zoghbi, A. Smolyar, S. Bosak, R.
Sequerra, L. Doucette-Stamm, M.E. Cusick, D.E. Hill, F.P. Roth, and M. Vidal, Towards a proteome-scale map of the human protein-protein interaction network. Nature, 2005. 437(7062): p. 1173-8.
14. Stelzl, U., U. Worm, M. Lalowski, C. Haenig, F.H. Brembeck, H. Goehler, M. Stroedicke, M. Zenkner, A. Schoenherr, S. Koeppen, J. Timm, S. Mintzlaff, C. Abraham, N. Bock, S. Kietzmann, A. Goedde, E. Toksoz, A. Droege, S. Krobitsch, B. Korn, W. Birchmeier, H. Lehrach, and E.E. Wanker, A human protein-protein interaction network: a resource for annotating the proteome. Cell, 2005. 122(6): p. 957-68.
15. Puig, O., F. Caspary, G. Rigaut, B. Rutz, E. Bouveret, E. Bragado-Nilsson, M. Wilm, and B. Seraphin, The tandem affinity purification (TAP) method: a general procedure of protein complex purification. Methods, 2001. 24(3): p. 218-29.
16. Rigaut, G., A. Shevchenko, B. Rutz, M. Wilm, M. Mann, and B. Seraphin, A generic protein purification method for protein complex characterization and proteome exploration. Nat. Biotechnol., 1999. 17(10): p. 1030-2.
17. Collins, M.O. and J.S. Choudhary, Mapping multiprotein complexes by affinity purification and mass spectrometry. Curr Opin Biotechnol, 2008. 19(4): p. 324-30.
18. Gavin, A.C., M. Bosche, R. Krause, P. Grandi, M. Marzioch, A. Bauer, J. Schultz, J.M. Rick, A.M. Michon, and C.M. Cruciat, Functional organization of the yeast proteome by systematic analysis of protein complexes. Nature, 2002. 415(6868): p. 141 - 147.
19. Ho, Y., A. Gruhler, A. Heilbut, G.D. Bader, L. Moore, S.L. Adams, A. Millar, P. Taylor, K. Bennett, K. Boutilier, L. Yang, C. Wolting, I. Donaldson, S. Schandorff, J. Shewnarane, M. Vo, J. Taggart, M. Goudreault, B. Muskat, C. Alfarano, D. Dewar, Z. Lin, K. Michalickova, A.R. Willems, H. Sassi, P.A. Nielsen, K.J. Rasmussen, J.R. Andersen, L.E. Johansen, L.H. Hansen, H. Jespersen, A. Podtelejnikov, E. Nielsen, J. Crawford, V. Poulsen, B.D. Sorensen, J. Matthiesen, R.C. Hendrickson, F. Gleeson, T. Pawson, M.F. Moran, D. Durocher, M. Mann, C.W. Hogue, D. Figeys, and M. Tyers, Systematic identification of protein complexes in Saccharomyces cerevisiae by mass spectrometry. Nature, 2002. 415(6868): p. 180-3.
20. Butland, G., J.M. Peregrin-Alvarez, J. Li, W. Yang, X. Yang, V. Canadien, A. Starostine, D. Richards, B. Beattie, and N. Krogan, Interaction network containing conserved and essential protein complexes in Escherichia coli. Nature, 2005. 433(7025): p. 531 - 537.
21. Deane, C.M., L. Salwinski, I. Xenarios, and D. Eisenberg, Protein interactions: two methods for assessment of the reliability of high throughput observations. Mol. Cell. Proteomics, 2002. 1(5): p. 349-56.
22. Deng, M., F. Sun, and T. Chen, Assessment of the reliability of protein-protein interactions and protein function prediction. Pac Symp Biocomput, 2003. 8: p. 140-51.
23. Goll, J. and P. Uetz, The elusive yeast interactome. Genome Biol., 2006. 7(6): p. 214.1-6. 24. Zotenko, E., J. Mestre, D.P. O'Leary, and T.M. Przytycka, Why do hubs in the yeast protein interaction
network tend to be essential: reexamining the connection between the network topology and essentiality. PLoS Comput Biol, 2008. 4(8): p. e1000140.
25. Marcotte, E.M., M. Pellegrini, H.L. Ng, D.W. Rice, T.O. Yeates, and D. Eisenberg, Detecting protein function and protein-protein interactions from genome sequences. Science, 1999. 285(5428): p. 751-3.
26. Enright, A.J., I. Iliopoulos, N.C. Kyrpides, and C.A. Ouzounis, Protein interaction maps for complete genomes based on gene fusion events. Nature, 1999. 402(6757): p. 86-90.
27. Enright, A.J. and C.A. Ouzounis, Functional associations of proteins in entire genomes by means of exhaustive detection of gene fusions. Genome Biol, 2001. 2(9): p. research0034.1-research0034.7.
28. Koonin, E.V. and Y.I. Wolf, Genomics of bacteria and archaea: the emerging dynamic view of the prokaryotic world. Nucleic Acids Res, 2008. 36(21): p. 6688-719.
29. Mushegian, A.R. and E.V. Koonin, Gene order is not conserved in bacterial evolution. Trends Genet, 1996. 12(8): p. 289-90.
30. Dandekar, T., B. Snel, M. Huynen, and P. Bork, Conservation of gene order: a fingerprint of proteins that physically interact. Trends Biochem Sci, 1998. 23(9): p. 324-8.
31. Overbeek, R., M. Fonstein, M. D'Souza, G.D. Pusch, and N. Maltsev, The use of gene clusters to infer functional coupling. Proc Natl Acad Sci U S A, 1999. 96(6): p. 2896-901.
32. Tamames, J., G. Casari, C. Ouzounis, and A. Valencia, Conserved clusters of functionally related genes in two bacterial genomes. J Mol Evol, 1997. 44(1): p. 66-73.
33. Huynen, M.A. and B. Snel, Gene and context: integrative approaches to genome analysis. Adv Protein Chem, 2000. 54: p. 345-79.
34. Snel, B., G. Lehmann, P. Bork, and M.A. Huynen, STRING: a web-server to retrieve and display the repeatedly occurring neighbourhood of a gene. Nucleic Acids Res, 2000. 28(18): p. 3442-4.

35. Gaasterland, T. and M.A. Ragan, Microbial genescapes: phyletic and functional patterns of ORF distribution among prokaryotes. Microb Comp Genomics, 1998. 3(4): p. 199-217.
36. Pellegrini, M., E.M. Marcotte, M.J. Thompson, D. Eisenberg, and T.O. Yeates, Assigning protein functions by comparative genome analysis: protein phylogenetic profiles. Proc Natl Acad Sci U S A, 1999. 96(8): p. 4285-8.
37. Tatusov, R.L., E.V. Koonin, and D.J. Lipman, A genomic perspective on protein families. Science, 1997. 278(5338): p. 631-7.
38. Huynen, M.A. and P. Bork, Measuring genome evolution. Proc Natl Acad Sci U S A, 1998. 95(11): p. 5849-56.
39. Zheng, Y., R.J. Roberts, and S. Kasif, Genomic functional annotation using co-evolution profiles of gene clusters. Genome Biol, 2002. 3(11): p. research0060.1-research0060.9.
40. De Las Rivas, J., J.J. Lozano, and A.R. Ortiz, Comparative analysis of chloroplast genomes: functional annotation, genome-based phylogeny, and deduced evolutionary patterns. Genome Res, 2002. 12(4): p. 567 - 583.
41. Levesque, M., D. Shasha, W. Kim, M.G. Surette, and P.N. Benfey, Trait-to-gene: a computational method for predicting the function of uncharacterized genes. Curr Biol, 2003. 13(2): p. 129 - 133.
42. Martin, M.J., J. Herrero, A. Mateos, and J. Dopazo, Comparing bacterial genomes through conservation profiles. Genome Res, 2003. 13(5): p. 991 - 998.
43. Peregrin-Alvarez, J.M., S. Tsoka, and C.A. Ouzounis, The phylogenetic extent of metabolic enzymes and pathways. Genome Res, 2003. 13(3): p. 422 - 427.
44. Wu, H., F. Mao, Z. Su, V. Olman, and Y. Xu, Prediction of functional modules based on gene distributions in microbial genomes. Genome Inform, 2005. 16(2): p. 247 - 259.
45. Gutierrez, R.A., M.D. Larson, and C. Wilkerson, The plant-specific database. Classification of Arabidopsis proteins based on their phylogenetic profile. Plant Physiol, 2004. 135(4): p. 1888 - 1892.
46. Mikkelsen, T.S., J.E. Galagan, and J.P. Mesirov, Improving genome annotations using phylogenetic profile anomaly detection. Bioinformatics, 2005. 21(4): p. 464 - 470.
47. Wu, J., Z. Hu, and C. DeLisi, Gene annotation and network inference by phylogenetic profiling. BMC Bioinformatics, 2006. 7: p. 80.
48. Date, S.V. and E.M. Marcotte, Discovery of uncharacterized cellular systems by genome-wide analysis of functional linkages. Nat Biotechnol, 2003. 21(9): p. 1055 - 1062.
49. Glazko, G.V. and A.R. Mushegian, Detection of evolutionarily stable fragments of cellular pathways by hierarchical clustering of phyletic patterns. Genome Biol, 2004. 5(5): p. R32.
50. Marcotte, E.M., I. Xenarios, A.M. van Der Bliek, and D. Eisenberg, Localizing proteins in the cell from their phylogenetic profiles. Proc Natl Acad Sci USA, 2000. 97(22): p. 12115 - 12120.
51. Snel, B. and M.A. Huynen, Quantifying modularity in the evolution of biomolecular systems. Genome Res, 2004. 14(3): p. 391 - 397.
52. Yamada, T., M. Kanehisa, and S. Goto, Extraction of phylogenetic network modules from the metabolic network. BMC Bioinformatics, 2006. 7: p. 130.
53. Jothi, R., T. Przytycka, and L. Aravind, Discovering functional linkages and uncharacterized cellular pathways using phylogenetic profile comparisons: a comprehensive assessment. BMC Bioinformatics, 2007. 8(1): p. 173.
54. von Mering, C., E.M. Zdobnov, S. Tsoka, F.D. Ciccarelli, J.B. Pereira-Leal, C.A. Ouzounis, and P. Bork, Genome evolution reveals biochemical networks and functional modules. Proc Natl Acad Sci USA, 2003. 100(26): p. 15428 - 15433.
55. Sun, J., J. Xu, Z. Liu, Q. Liu, A. Zhao, T. Shi, and Y. Li, Refined phylogenetic profiles method for predicting protein-protein interactions. Bioinformatics, 2005. 21(16): p. 3409 - 3415.
56. Bowers, P.M., S.J. Cokus, D. Eisenberg, and T.O. Yeates, Use of logic relationships to decipher protein network organization. Science, 2004. 306(5705): p. 2246 - 2249.
57. Goh, C.S., A.A. Bogan, M. Joachimiak, D. Walther, and F.E. Cohen, Co-evolution of proteins with their interaction partners. J Mol Biol, 2000. 299(2): p. 283 - 293.
58. Pazos, F., M. Helmer-Citterich, G. Ausiello, and A. Valencia, Correlated mutations contain information about protein-protein interaction. J Mol Biol, 1997. 271(4): p. 511-23.
59. Pazos, F. and A. Valencia, Similarity of phylogenetic trees as indicator of protein-protein interaction. Protein Eng, 2001. 14(9): p. 609-14.
60. Goh, C.S. and F.E. Cohen, Co-evolutionary analysis reveals insights into protein-protein interactions. J Mol Biol, 2002. 324(1): p. 177 - 192.
61. Jothi, R., P.F. Cherukuri, A. Tasneem, and T.M. Przytycka, Co-evolutionary analysis of domains in interacting proteins reveals insights into domain-domain interactions mediating protein protein interactions. J Mol Biol, 2006. 362(4): p. 861-875.
62. Gertz, J., G. Elfond, A. Shustrova, M. Weisinger, M. Pellegrini, S. Cokus, and B. Rothschild, Inferring protein interactions from phylogenetic distance matrices. Bioinformatics, 2003. 19(16): p. 2039 - 2045.
63. Pazos, F. and A. Valencia, In silico two-hybrid system for the selection of physically interacting protein pairs. Proteins, 2002. 47(2): p. 219-27.
64. Sato, T., Y. Yamanishi, M. Kanehisa, and H. Toh, The inference of protein-protein interactions by co-evolutionary analysis is improved by excluding the information about the phylogenetic relationships. Bioinformatics, 2005. 21(17): p. 3482 - 3489.
65. Pazos, F., J.A. Ranea, D. Juan, and M.J. Sternberg, Assessing protein co-evolution in the context of the tree of life assists in the prediction of the interactome. J Mol Biol, 2005. 352(4): p. 1002 - 1015.
66. Tan, S.H., Z. Zhang, and S.K. Ng, ADVICE: Automated Detection and Validation of Interaction by Co-Evolution. Nucleic Acids Res, 2004. 32(Web Server issue): p. W69-72.
67. Craig, R.A. and L. Liao, Phylogenetic tree information aids supervised learning for predicting protein-protein interaction based on distance matrices. BMC Bioinformatics, 2007. 8: p. 6.
68. Kann, M.G., R. Jothi, P.F. Cherukuri, and T.M. Przytycka, Predicting protein domain interactions from coevolution of conserved regions. Proteins, 2007. 67(4): p. 811-20.
69. Hakes, L., S.C. Lovell, S.G. Oliver, and D.L. Robertson, Specificity in protein interactions and its relationship with sequence diversity and coevolution. Proc Natl Acad Sci U S A, 2007. 104(19): p. 7999-8004.
70. Kann, M.G., B.A. Shoemaker, A.R. Panchenko, and T.M. Przytycka, Correlated evolution of interacting proteins: looking behind the mirrortree. J Mol Biol, 2009. 385(1): p. 91-8.
71. Juan, D., F. Pazos, and A. Valencia, High-confidence prediction of global interactomes based on genome-wide coevolutionary networks. Proc Natl Acad Sci U S A, 2008. 105(3): p. 934-9.
72. Tillier, E.R. and R.L. Charlebois, The human protein coevolution network. Genome Res, 2009. 19(10): p. 1861-71.
73. Jothi, R., M.G. Kann, and T.M. Przytycka, Predicting protein-protein interaction by searching evolutionary tree automorphism space. Bioinformatics, 2005. 21(Suppl 1): p. i241 - i250.
74. Ramani, A.K. and E.M. Marcotte, Exploiting the co-evolution of interacting proteins to discover interaction specificity. J Mol Biol, 2003. 327(1): p. 273 - 284.
75. Apic, G., J. Gough, and S.A. Teichmann, An insight into domain combinations. Bioinformatics, 2001. 17 Suppl 1: p. S83-9.
76. Huang, C., F. Morcos, S.P. Kanaan, S. Wuchty, D.Z. Chen, and J.A. Izaguirre, Predicting protein-protein interactions from protein domains using a set cover approach. IEEE/ACM Trans Comput Biol Bioinform, 2007. 4(1): p. 78-87.
77. Kim, W.K., J. Park, and J.K. Suh, Large scale statistical prediction of protein-protein interaction by potentially interacting domain (PID) pair. Genome Inform, 2002. 13: p. 42-50.
78. Nguyen, T.P. and T.B. Ho, Discovering signal transduction networks using signaling domain-domain interactions. Genome Inform, 2006. 17(2): p. 35-45.
79. Singhal, M. and H. Resat, A domain-based approach to predict protein-protein interactions. BMC Bioinformatics, 2007. 8: p. 199.
80. Wojcik, J. and V. Schachter, Protein-protein interaction map inference using interacting domain profile pairs. Bioinformatics, 2001. 17 Suppl 1: p. S296-305.
81. Deng, M., S. Mehta, F. Sun, and T. Chen, Inferring domain-domain interactions from protein-protein interactions. Genome Res, 2002. 12(10): p. 1540-8.
82. Sprinzak, E. and H. Margalit, Correlated sequence-signatures as markers of protein-protein interaction. J Mol Biol, 2001. 311(4): p. 681-92.
83. Wuchty, S., Topology and weights in a protein domain interaction network--a novel way to predict protein interactions. BMC Genomics, 2006. 7: p. 122.
84. Liu, M., X.W. Chen, and R. Jothi, Knowledge-guided inference of domain-domain interactions from incomplete protein-protein interaction networks. Bioinformatics, 2009. 25(19): p. 2492-9.
85. Guimaraes, K.S., R. Jothi, E. Zotenko, and T.M. Przytycka, Predicting domain-domain interactions using a parsimony approach. Genome Biol, 2006. 7(11): p. R104.
86. Guimaraes, K.S. and T.M. Przytycka, Protein Interaction Network Based Prediction of Domain-Domain and Domain-Peptide Interactions, in Protein-Portein interactions and Netwoks A.R. Panchenko and T.M. Przytycka, Editors. 2008, Springer-Verlag. p. 83-98.
87. Ng, S.K., Z. Zhang, and S.H. Tan, Integrative approach for computationally inferring protein domain interactions. Bioinformatics, 2003. 19(8): p. 923-9.
88. Kluger, Y., R. Basri, J.T. Chang, and M. Gerstein, Spectral biclustering of microarray data: coclustering genes and conditions. Genome Res, 2003. 13(4): p. 703-16.
89. Zhao, X.M., L. Chen, and K. Aihara, A discriminative approach for identifying domain-domain interactions from protein-protein interactions. Proteins, 2010. 78(5): p. 1243-53.
90. Wang, H., E. Segal, A. Ben-Hur, Q.R. Li, M. Vidal, and D. Koller, InSite: a computational method for identifying protein-protein interaction binding sites on a proteome-wide scale. Genome Biol, 2007. 8(9): p. R192.
91. Riley, R., C. Lee, C. Sabatti, and D. Eisenberg, Inferring protein domain interactions from databases of interacting proteins. Genome Biol, 2005. 6(10): p. R89.
92. Wang, H., E. Segal, A. Ben-Hur, Q. Li, M. Vidal, and D. Koller, InSite: a computational method for identifying protein-protein interaction binding sites on a proteome-wide scale. Genome Biol, 2007. 8(9): p. R192.
93. Lee, H., M. Deng, F. Sun, and T. Chen, An integrated approach to the prediction of domain-domain interactions. BMC Bioinformatics, 2006. 7: p. 269.
94. Wang, R.S., Y. Wang, L.Y. Wu, X.S. Zhang, and L. Chen, Analysis on multi-domain cooperation for predicting protein-protein interactions. BMC Bioinformatics, 2007. 8: p. 391.
95. Guimaraes, K.S. and T.M. Przytycka, Interrogating domain-domain interactions with parsimony based approaches. BMC Bioinformatics, 2008. 9: p. 171.
96. Jansen, R., H. Yu, D. Greenbaum, Y. Kluger, N.J. Krogan, S. Chung, A. Emili, M. Snyder, J.F. Greenblatt, and M. Gerstein, A Bayesian networks approach for predicting protein-protein interactions from genomic data. Science, 2003. 302(5644): p. 449-53.
97. Rhodes, D.R., S.A. Tomlins, S. Varambally, V. Mahavisno, T. Barrette, S. Kalyana-Sundaram, D. Ghosh, A. Pandey, and A.M. Chinnaiyan, Probabilistic model of the human protein-protein interaction network. Nat Biotechnol, 2005. 23(8): p. 951-9.
98. Tirosh, I. and N. Barkai, Computational verification of protein-protein interactions by orthologous co-expression. BMC Bioinformatics, 2005. 6: p. 40.
99. Soong, T.T., K.O. Wrzeszczynski, and B. Rost, Physical protein-protein interactions predicted from microarrays. Bioinformatics, 2008. 24(22): p. 2608-14.
100. Jansen, R., D. Greenbaum, and M. Gerstein, Relating Whole-Genome Expression Data with Protein-Protein Interactions. Genome Res, 2002. 12(1): p. 37-46.
101. Kemmeren, P., N.L. van Berkum, J. Vilo, T. Bijma, R. Donders, A. Brazma, and F.C. Holstege, Protein interaction verification and functional annotation by integrated analysis of genome-scale data. Mol Cell, 2002. 9(5): p. 1133-43.
102. von Mering, C., R. Krause, B. Snel, M. Cornell, S.G. Oliver, S. Fields, and P. Bork, Comparative assessment of large-scale data sets of protein-protein interactions. Nature, 2002. 417(6887): p. 399-403.
103. Eisen, M.B., P.T. Spellman, P.O. Brown, and D. Botstein, Cluster analysis and display of genome-wide expression patterns. Proc Natl Acad Sci U S A, 1998. 95(25): p. 14863-14868.
104. Marcotte, E.M., M. Pellegrini, M.J. Thompson, T.O. Yeates, and D. Eisenberg, A combined algorithm for genome-wide prediction of protein function. Nature, 1999. 402(6757): p. 83-6.
105. Greenbaum, D., N.M. Luscombe, R. Jansen, J. Qian, and M. Gerstein, Interrelating Different Types of Genomic Data, from Proteome to Secretome: 'Oming in on Function. Genome Res, 2001. 11(9): p. 1463-1468.
106. Ramani, A.K., Z. Li, G.T. Hart, M.W. Carlson, D.R. Boutz, and E.M. Marcotte, A map of human protein interactions derived from co-expression of human mRNAs and their orthologs. Mol Syst Biol, 2008. 4(180): p. 1-16.
107. Costello, J.C., M.M. Dalkilic, S.M. Beason, J.R. Gehlhausen, R. Patwardhan, S. Middha, B.D. Eads, and J.R. Andrews, Gene networks in Drosophila melanogaster: integrating experimental data to predict gene function. Genome Biol, 2009. 10(9): p. R97.
108. Lee, I., S.V. Date, A.T. Adai, and E.M. Marcotte, A probabilistic functional network of yeast genes. Science, 2004. 306(5701): p. 1555 - 1558.
109. Margolin, A.A., I. Nemenman, K. Basso, C. Wiggins, G. Stolovitzky, R. Dalla Favera, and A. Califano, ARACNE: an algorithm for the reconstruction of gene regulatory networks in a mammalian cellular context. BMC Bioinformatics, 2006. 7 Suppl 1: p. S7.
110. Pe'er, D., Bayesian network analysis of signaling networks: a primer. Sci STKE, 2005. 2005(281): p. pl4. 111. Alterovitz, G., J. Liu, E. Afkhami, and M.F. Ramoni, Bayesian methods for proteomics. Proteomics, 2007.
7(16): p. 2843-55. 112. Schadt, E.E., Exploiting naturally occurring DNA variation and molecular profiling data to dissect disease
and drug response traits. Curr Opin Biotechnol, 2005. 16(6): p. 647-54. 113. Sieberts, S.K. and E.E. Schadt, Moving toward a system genetics view of disease. Mamm Genome, 2007.
18(6-7): p. 389-401. 114. Cline, M.S., M. Smoot, E. Cerami, A. Kuchinsky, N. Landys, C. Workman, R. Christmas, I. Avila-
Campilo, M. Creech, B. Gross, K. Hanspers, R. Isserlin, R. Kelley, S. Killcoyne, S. Lotia, S. Maere, J. Morris, K. Ono, V. Pavlovic, A.R. Pico, A. Vailaya, P.L. Wang, A. Adler, B.R. Conklin, L. Hood, M. Kuiper, C. Sander, I. Schmulevich, B. Schwikowski, G.J. Warner, T. Ideker, and G.D. Bader, Integration of biological networks and gene expression data using Cytoscape. Nat Protoc, 2007. 2(10): p. 2366-82.
115. Jeong, H., S.P. Mason, A.L. Barabasi, and Z.N. Oltvai, Lethality and centrality in protein networks. Nature, 2001. 411(6833): p. 41-2.
116. Wagner, A., The yeast protein interaction network evolves rapidly and contains few redundant duplicate genes. Mol Biol Evol, 2001. 18(7): p. 1283-92.
117. Yook, S.H., Z.N. Oltvai, and A.L. Barabasi, Functional and topological characterization of protein interaction networks. Proteomics, 2004. 4(4): p. 928-942.
118. Przulj, N., D.G. Corneil, and I. Jurisica, Modeling interactome: scale-free or geometric? Bioinformatics, 2004. 20(18): p. 3508-15.
119. Han, J.D., D. Dupuy, N. Bertin, M.E. Cusick, and M. Vidal, Effect of sampling on topology predictions of protein-protein interaction networks. Nat Biotechnol, 2005. 23(7): p. 839-44.
120. Tanaka, R., T.M. Yi, and J. Doyle, Some protein interaction data do not exhibit power law statistics. FEBS Lett, 2005. 579(23): p. 5140-4.
121. Brandes , U. and T. Erlebach, eds. Network Analysis: Methodological Foundations. 2005, Springer: Berlin, New York:.
122. Zielinski, R., P.F. Przytycki, J. Zheng, D. Zhang, T.M. Przytycka, and J. Capala, The crosstalk between EGF, IGF, and Insulin cell signaling pathways--computational and experimental analysis. BMC Syst Biol, 2009. 3: p. 88.
123. Lohmann, G., D.S. Margulies, A. Horstmann, B. Pleger, J. Lepsien, D. Goldhahn, H. Schloegl, M. Stumvoll, A. Villringer, and R. Turner, Eigenvector centrality mapping for analyzing connectivity patterns in FMRI data of the human brain. PLoS One, 2010. 5(4): p. e10232.
124. Missiuro, P.V., K. Liu, L. Zou, B.C. Ross, G. Zhao, J.S. Liu, and H. Ge, Information flow analysis of interactome networks. PLoS Comput Biol, 2009. 5(4): p. e1000350.
125. Kim, Y.-A., S. Wuchty, and T.M. Przytycka, Simultaneous Identification of Causal Genes and Dysregulated Pathways in Complex Diseases LNBI, 2010. 6044(RECOMB 2010): p. 263-281.
126. Suthram, S., A. Beyer, R.M. Karp, Y. Eldar, and T. Ideker, eQED: an efficient method for interpreting eQTL associations using protein networks. Mol Syst Biol, 2008. 4: p. 162.
127. Kim, Y.-A., J.H. Przytycki, S. Wuchty, and T.M. Przytycka, Modeling Infromation Flow in Molecular Networks. Physical Biology, 2011. 8(3): p. 035012.
128. Kim, Y.-A., S. Wuchty, and T.M. Przytycka, Identifying Causal Genes and Dysregulated Pathways in Complex Diseases. PLoS Comput Biol, 2011. 7(3): p. e1001095.
129. Yu, H., P.M. Kim, E. Sprecher, V. Trifonov, and M. Gerstein, The importance of bottlenecks in protein networks: correlation with gene essentiality and expression dynamics. PLoS Comput Biol, 2007. 3(4): p. e59.
130. He, X. and J. Zhang, Why do hubs tend to be essential in protein networks? PLoS Genet, 2006. 2(6): p. e88. 131. Batada, N.N., L.D. Hurst, and M. Tyers, Evolutionary and physiological importance of hub proteins. PLoS
Comput Biol, 2006. 2(7): p. e88. 132. Hahn, M.W. and A.D. Kern, Comparative genomics of centrality and essentiality in three eukaryotic
protein-interaction networks. Mol Biol Evol, 2005. 22(4): p. 803-6. 133. Albert, R., H. Jeong, and A.L. Barabasi, Error and attack tolerance of complex networks. Nature, 2000.
406(6794): p. 378-82.
134. Yu, H., D. Greenbaum, H. Xin Lu, X. Zhu, and M. Gerstein, Genomic analysis of essentiality within protein networks. Trends Genet, 2004. 20(6): p. 227-31.
135. Wang, H., B. Kakaradov, S.R. Collins, L. Karotki, D. Fiedler, M. Shales, K.M. Shokat, T.C. Walther, N.J. Krogan, and D. Koller, A complex-based reconstruction of the Saccharomyces cerevisiae interactome. Mol Cell Proteomics, 2009. 8(6): p. 1361-81.
136. Han, J.D., N. Bertin, T. Hao, D.S. Goldberg, G.F. Berriz, L.V. Zhang, D. Dupuy, A.J. Walhout, M.E. Cusick, F.P. Roth, and M. Vidal, Evidence for dynamically organized modularity in the yeast protein-protein interaction network. Nature, 2004. 430(6995): p. 88-93.
137. Hartwell, L.H., J.J. Hopfield, S. Leibler, and A.W. Murray, From molecular to modular cell biology. Nature, 1999. 402(6761 Suppl): p. C47-52.
138. Bader, G.D. and C.W. Hogue, An automated method for finding molecular complexes in large protein interaction networks. BMC Bioinformatics, 2003. 4: p. 2.
139. Spirin, V. and L.A. Mirny, Protein complexes and functional modules in molecular networks. Proc Natl Acad Sci U S A, 2003. 100(21): p. 12123-12128.
140. Adamcsek, B.z., G. Palla, I.s.J. Farkas, I. Derényi, and T.s. Vicsek, CFinder: locating cliques and overlapping modules in biological networks. Bioinformatics, 2006. 22(8): p. 1021-1023.
141. Altaf-Ul-Amin, M., Y. Shinbo, K. Mihara, K. Kurokawa, and S. Kanaya, Development and implementation of an algorithm for detection of protein complexes in large interaction networks. BMC Bioinformatics, 2006. 7: p. 207.
142. Rives, A.W. and T. Galitski, Modular organization of cellular networks. Proc Natl Acad Sci U S A, 2003. 100(3): p. 1128-1133.
143. Arnau, V., S. Mars, and I. Marín, Iterative Cluster Analysis of Protein Interaction Data. Bioinformatics, 2005. 21(3): p. 364-378.
144. Bader, J.S., Greedily building protein networks with confidence. Bioinformatics, 2003. 19(15): p. 1869-74. 145. Asthana, S., O.D. King, F.D. Gibbons, and F.P. Roth, Predicting protein complex membership using
probabilistic network reliability. Genome Res, 2004. 14(6): p. 1170-5. 146. Brun, C., F. Chevenet, D. Martin, J. Wojcik, A. Guenoche, and B. Jacq, Functional classification of
proteins for the prediction of cellular function from a protein-protein interaction network. Genome Biol, 2003. 5(1): p. R6.
147. King, A.D., N. Przulj, and I. Jurisica, Protein complex prediction via cost-based clustering. Bioinformatics, 2004. 20(17): p. 3013-20.
148. Luo, F., Y. Yang, C.F. Chen, R. Chang, J. Zhou, and R.H. Scheuermann, Modular organization of protein interaction networks. Bioinformatics, 2007. 23(2): p. 207-14.
149. Pereira-Leal, J.B., A.J. Enright, and C.A. Ouzounis, Detection of functional modules from protein interaction networks. Proteins, 2004. 54(1): p. 49-57.
150. Wang, C., C. Ding, Q. Yang, and S.R. Holbrook, Consistent dissection of the protein interaction network by combining global and local metrics. Genome Biol, 2007. 8(12): p. R271.
151. Newman, M.E., Modularity and community structure in networks. Proc Natl Acad Sci U S A, 2006. 103(23): p. 8577-82.
152. Dunn, R., F. Dudbridge, and C.M. Sanderson, The use of edge-betweenness clustering to investigate biological function in protein interaction networks. BMC Bioinformatics, 2005. 6: p. 39.
153. Qi, Y., F. Balem, C. Faloutsos, J. Klein-Seetharaman, and Z. Bar-Joseph, Protein complex identification by supervised graph local clustering. Bioinformatics, 2008. 24(13): p. i250-8.
154. Navlakha, S., M.C. Schatz, and C. Kingsford, Revealing biological modules via graph summarization. J Comput Biol, 2009. 16(2): p. 253-64.
155. Jiang, P. and M. Singh, SPICi: a fast clustering algorithm for large biological networks. Bioinformatics, 2010. 26(8): p. 1105-11.
156. Chen, J. and B. Yuan, Detecting functional modules in the yeast protein-protein interaction network. Bioinformatics, 2006. 22(18): p. 2283-90.
157. Maraziotis, I.A., K. Dimitrakopoulou, and A. Bezerianos, Growing functional modules from a seed protein via integration of protein interaction and gene expression data. BMC Bioinformatics, 2007. 8: p. 408.
158. Feng, J., R. Jiang, and T. Jiang, A max-flow based approach to the identification of protein complexes using protein interaction and microarray data. IEEE/ACM Trans Comput Biol Bioinform, 2011. 8(3): p. 621-634.
159. Rosvall, M. and C.T. Bergstrom, An information-theoretic framework for resolving community structure in complex networks. Proc Natl Acad Sci U S A, 2007. 104(18): p. 7327-31.
160. Palla, G., I. Derenyi, I. Farkas, and T. Vicsek, Uncovering the overlapping community structure of complex networks in nature and society. Nature, 2005. 435(7043): p. 814-818.
161. Sales-Pardo, M., R. Guimera, A.A. Moreira, and L.A. Amaral, Extracting the hierarchical organization of complex systems. Proc Natl Acad Sci U S A, 2007. 104(39): p. 15224-9.
162. Zotenko, E., K.S. Guimaraes, R. Jothi, and T.M. Przytycka, Decomposition of overlapping protein complexes: a graph theoretical method for analyzing static and dynamic protein associations. Algorithms Mol Biol, 2006. 1(1): p. 7.
163. Brohee, S. and J. van Helden, Evaluation of clustering algorithms for protein-protein interaction networks. BMC Bioinformatics, 2006. 7: p. 488.
164. Song, J. and M. Singh, How and when should interactome-derived clusters be used to predict functional modules and protein function? Bioinformatics, 2009. 25(23): p. 3143-50.
165. Poyatos, J.F. and L.D. Hurst, How biologically relevant are interaction-based modules in protein networks? Genome Biol, 2004. 5(11): p. R93.
166. Milo, R., S. Shen-Orr, S. Itzkovitz, N. Kashtan, D. Chklovskii, and U. Alon, Network motifs: simple building blocks of complex networks. Science, 2002. 298(5594): p. 824-7.
167. Goentoro, L., O. Shoval, M.W. Kirschner, and U. Alon, The incoherent feedforward loop can provide fold-change detection in gene regulation. Mol Cell, 2009. 36(5): p. 894-9.
168. Rosenfeld, N., J.W. Young, U. Alon, P.S. Swain, and M.B. Elowitz, Accurate prediction of gene feedback circuit behavior from component properties. Mol Syst Biol, 2007. 3: p. 143.
169. Alon, U., Network motifs: theory and experimental approaches. Nat Rev Genet, 2007. 8(6): p. 450-61. 170. Mangan, S., A. Zaslaver, and U. Alon, The coherent feedforward loop serves as a sign-sensitive delay
element in transcription networks. J Mol Biol, 2003. 334(2): p. 197-204. 171. Mangan, S. and U. Alon, Structure and function of the feed-forward loop network motif. Proc Natl Acad
Sci U S A, 2003. 100(21): p. 11980-5. 172. Przulj, N., D.G. Corneil, and I. Jurisica, Efficient estimation of graphlet frequency distributions in protein-
protein interaction networks. Bioinformatics, 2006. 22(8): p. 974-80. 173. Banks, E., E. Nabieva, B. Chazelle, and M. Singh, Organization of physical interactomes as uncovered by
network schemas. PLoS Comput Biol, 2008. 4(10): p. e1000203. 174. Banks, E., E. Nabieva, R. Peterson, and M. Singh, NetGrep: fast network schema searches in interactomes.
Genome Biol, 2008. 9(9): p. R138. 175. Walhout, A.J.M., R. Sordella, X. Lu, J.L. Hartley, G.F. Temple, M.A. Brasch, N. Thierry-Mieg, and M.
Vidal, Protein Interaction Mapping in C.elegans Using Proteins Involved in Vulval Development. Science, 2000. 287(5450): p. 116-122.
176. Yu, H., N.M. Luscombe, H.X. Lu, X. Zhu, Y. Xia, J.D. Han, N. Bertin, S. Chung, M. Vidal, and M. Gerstein, Annotation transfer between genomes: protein-protein interologs and protein-DNA regulogs. Genome Res, 2004. 14(6): p. 1107-18.
177. Matthews, L.R., P. Vaglio, J. Reboul, H. Ge, B.P. Davis, J. Garrels, S. Vincent, and M. Vidal, Identification of potential interaction networks using sequence-based searches for conserved protein-protein interactions or "interologs". Genome Res, 2001. 11(12): p. 2120-6.
178. Sharan, R. and T. Ideker, Modeling cellular machinery through biological network comparison. Nat Biotechnol, 2006. 24(4): p. 427-33.
179. Kelley, B.P., B. Yuan, F. Lewitter, R. Sharan, B.R. Stockwell, and T. Ideker, PathBLAST: a tool for alignment of protein interaction networks. Nucleic Acids Res, 2004. 32(Web Server issue): p. W83-8.
180. Kelley, B.P., R. Sharan, R.M. Karp, T. Sittler, D.E. Root, B.R. Stockwell, and T. Ideker, Conserved pathways within bacteria and yeast as revealed by global protein network alignment. Proc Natl Acad Sci U S A, 2003. 100(20): p. 11394-9.
181. Sharan, R., S. Suthram, R.M. Kelley, T. Kuhn, S. McCuine, P. Uetz, T. Sittler, R.M. Karp, and T. Ideker, Conserved patterns of protein interaction in multiple species. Proc Natl Acad Sci U S A, 2005. 102(6): p. 1974-9.
182. Bandyopadhyay, S., R. Sharan, and T. Ideker, Systematic identification of functional orthologs based on protein network comparison. Genome Res, 2006. 16(3): p. 428-35.
183. Ogata, H., W. Fujibuchi, S. Goto, and M. Kanehisa, A heuristic graph comparison algorithm and its application to detect functionally related enzyme clusters. Nucleic Acids Res, 2000. 28(20): p. 4021-8.
184. Gary, M.R. and D.S. Johnson, Computers and Intractability a Guide to the Theory of NP-Completeness. 1979: WH. Freeman and Co.

185. Flannick, J., A. Novak, B.S. Srinivasan, H.H. McAdams, and S. Batzoglou, Graemlin: general and robust alignment of multiple large interaction networks. Genome Res, 2006. 16(9): p. 1169-81.
186. Koyuturk, M., Y. Kim, U. Topkara, S. Subramaniam, W. Szpankowski, and A. Grama, Pairwise alignment of protein interaction networks. J Comput Biol, 2006. 13(2): p. 182-99.
187. Berg, J. and M. Lassig, Cross-species analysis of biological networks by Bayesian alignment. Proc Natl Acad Sci U S A, 2006. 103(29): p. 10967-72.
188. Kalaev, M., V. Bafna, and R. Sharan, Fast and accurate alignment of multiple protein networks. J Comput Biol, 2009. 16(8): p. 989-99.
189. Singh, R., J. Xu, and B. Berger, Global alignment of multiple protein interaction networks with application to functional orthology detection. Proc Natl Acad Sci U S A, 2008. 105(35): p. 12763-8.
190. Pinter, R.Y., O. Rokhlenko, E. Yeger-Lotem, and M. Ziv-Ukelson, Alignment of metabolic pathways. Bioinformatics, 2005. 21(16): p. 3401-8.
191. Cheng, Q., R. Harrison, and A. Zelikovsky, MetNetAligner: a web service tool for metabolic network alignments. Bioinformatics, 2009. 25(15): p. 1989-90.
192. Dost, B., T. Shlomi, N. Gupta, E. Ruppin, V. Bafna, and R. Sharan, QNet: a tool for querying protein interaction networks. J Comput Biol, 2008. 15(7): p. 913-25.
193. Kuchaiev, O., T. Milenkovic, V. Memisevic, W. Hayes, and N. Przulj, Topological network alignment uncovers biological function and phylogeny. J R Soc Interface, 2010. 7(50): p. 1341-54.
194. Erten, S., X. Li, G. Bebek, J. Li, and M. Koyuturk, Phylogenetic analysis of modularity in protein interaction networks. BMC Bioinformatics, 2009. 10: p. 333.
195. Shoemaker, B.A. and A.R. Panchenko, Deciphering protein-protein interactions. Part I. Experimental techniques and databases. PLoS Comput Biol, 2007. 3(3): p. e42.
196. Lehne, B. and T. Schlitt, Protein-protein interaction databases: keeping up with growing interactomes. Hum Genomics, 2009. 3(3): p. 291-7.
197. De Las Rivas, J. and C. Fontanillo, Protein-protein interactions essentials: key concepts to building and analyzing interactome networks. PLoS Comput Biol, 2010. 6(6): p. e1000807.
198. Salwinski, L., C.S. Miller, A.J. Smith, F.K. Pettit, J.U. Bowie, and D. Eisenberg, The Database of Interacting Proteins: 2004 update. Nucleic Acids Res, 2004. 32(Database issue): p. D449-51.
199. Xenarios, I., D.W. Rice, L. Salwinski, M.K. Baron, E.M. Marcotte, and D. Eisenberg, DIP: the database of interacting proteins. Nucleic Acids Res, 2000. 28(1): p. 289-91.
200. Aranda, B., P. Achuthan, Y. Alam-Faruque, I. Armean, A. Bridge, C. Derow, M. Feuermann, A.T. Ghanbarian, S. Kerrien, J. Khadake, J. Kerssemakers, C. Leroy, M. Menden, M. Michaut, L. Montecchi-Palazzi, S.N. Neuhauser, S. Orchard, V. Perreau, B. Roechert, K. van Eijk, and H. Hermjakob, The IntAct molecular interaction database in 2010. Nucleic Acids Res, 2010. 38(Database issue): p. D525-31.
201. Stark, C., B.J. Breitkreutz, T. Reguly, L. Boucher, A. Breitkreutz, and M. Tyers, BioGRID: a general repository for interaction datasets. Nucleic Acids Res, 2006. 34(Database issue): p. D535-9.
202. Ceol, A., A. Chatr Aryamontri, L. Licata, D. Peluso, L. Briganti, L. Perfetto, L. Castagnoli, and G. Cesareni, MINT, the molecular interaction database: 2009 update. Nucleic Acids Res, 2010. 38(Database issue): p. D532-9.
203. Prieto, C. and J. De Las Rivas, APID: Agile Protein Interaction DataAnalyzer. Nucleic Acids Res, 2006. 34(Web Server issue): p. W298-302.
204. Wu, J., T. Vallenius, K. Ovaska, J. Westermarck, T.P. Makela, and S. Hautaniemi, Integrated network analysis platform for protein-protein interactions. Nat Methods, 2009. 6(1): p. 75-7.
205. Jensen, L.J., M. Kuhn, M. Stark, S. Chaffron, C. Creevey, J. Muller, T. Doerks, P. Julien, A. Roth, M. Simonovic, P. Bork, and C. von Mering, STRING 8--a global view on proteins and their functional interactions in 630 organisms. Nucleic Acids Res, 2009. 37(Database issue): p. D412-6.
206. von Mering, C., M. Huynen, D. Jaeggi, S. Schmidt, P. Bork, and B. Snel, STRING: a database of predicted functional associations between proteins. Nucleic Acids Res, 2003. 31: p. 258 - 261.
207. Brown, K.R. and I. Jurisica, Unequal evolutionary conservation of human protein interactions in interologous networks. Genome Biol, 2007. 8(5): p. R95.
208. FlyBase Consortium, The FlyBase database of the Drosophila genome projects and community literature. Nucleic Acids Res, 2003. 31(1): p. 172-5.
209. Cherry, J.M., C. Ball, S. Weng, G. Juvik, R. Schmidt, C. Adler, B. Dunn, S. Dwight, L. Riles, R.K. Mortimer, and D. Botstein, Genetic and physical maps of Saccharomyces cerevisiae. Nature, 1997. 387(6632 Suppl): p. 67-73.
210. Stein, A., A. Panjkovich, and P. Aloy, 3did Update: domain-domain and peptide-mediated interactions of known 3D structure. Nucleic Acids Res, 2009. 37(Database issue): p. D300-4.
211. Finn, R.D., M. Marshall, and A. Bateman, iPfam: visualization of protein-protein interactions in PDB at domain and amino acid resolutions. Bioinformatics, 2005. 21(3): p. 410-2.
212. Davis, F.P. and A. Sali, PIBASE: a comprehensive database of structurally defined protein interfaces. Bioinformatics, 2005. 21(9): p. 1901-7.
213. Berman, H.M., J. Westbrook, Z. Feng, G. Gilliland, T.N. Bhat, H. Weissig, I.N. Shindyalov, and P.E. Bourne, The Protein Data Bank. Nucleic Acids Res, 2000. 28(1): p. 235-42.
214. Shoemaker, B.A., A.R. Panchenko, and S.H. Bryant, Finding biologically relevant protein domain interactions: conserved binding mode analysis. Protein Sci, 2006. 15(2): p. 352-61.
215. Raghavachari, B., A. Tasneem, T.M. Przytycka, and R. Jothi, DOMINE: a database of protein domain interactions. Nucleic Acids Res, 2008. 36(Database issue): p. D656-61.
216. Schwikowski, B., P. Uetz, and S. Fields, A network of protein-protein interactions in yeast. Nat Biotechnol, 2000. 18(12): p. 1257-61.
217. Sharan, R., I. Ulitsky, and R. Shamir, Network-based prediction of protein function. Mol Syst Biol, 2007. 3: p. 88.
218. Nabieva, E., K. Jim, A. Agarwal, B. Chazelle, and M. Singh, Whole-proteome prediction of protein function via graph-theoretic analysis of interaction maps. Bioinformatics, 2005. 21 Suppl 1: p. i302-10.
219. Hishigaki, H., K. Nakai, T. Ono, A. Tanigami, and T. Takagi, Assessment of prediction accuracy of protein function from protein--protein interaction data. Yeast, 2001. 18(6): p. 523-31.
220. Zhang, S., H. Chen, K. Liu, and Z. Sun, Inferring protein function by domain context similarities in protein-protein interaction networks. BMC Bioinformatics, 2009. 10: p. 395.
221. Jaeger, S., S. Gaudan, U. Leser, and D. Rebholz-Schuhmann, Integrating protein-protein interactions and text mining for protein function prediction. BMC Bioinformatics, 2008. 9 Suppl 8: p. S2.
222. Kourmpetis, Y.A., A.D. van Dijk, M.C. Bink, R.C. van Ham, and C.J. ter Braak, Bayesian Markov Random Field analysis for protein function prediction based on network data. PLoS One, 2010. 5(2): p. e9293.
223. Chuang, H.Y., E. Lee, Y.T. Liu, D. Lee, and T. Ideker, Network-based classification of breast cancer metastasis. Mol Syst Biol, 2007. 3: p. 140.
224. Lee, E., H.Y. Chuang, J.W. Kim, T. Ideker, and D. Lee, Inferring pathway activity toward precise disease classification. PLoS Comput Biol, 2008. 4(11): p. e1000217.
225. Daemen, A., M. Signoretto, O. Gevaert, J.A. Suykens, and B. De Moor, Improved microarray-based decision support with graph encoded interactome data. PLoS One, 2010. 5(4): p. e10225.
226. Ulitsky, I., R.M. Karp, and R. Shamir, Detecting Disease-Specific Dysregulated Pathways Via Analysis of Clinical Expression Profiles in Research in Computational Molecular Biology, M. Vingron and L. Wong, Editors. 2008, Springer. p. 347-359.
227. Mani, K.M., C. Lefebvre, K. Wang, W.K. Lim, K. Basso, R. Dalla-Favera, and A. Califano, A systems biology approach to prediction of oncogenes and molecular perturbation targets in B-cell lymphomas. Mol Syst Biol, 2008. 4: p. 169.
228. Navlakha, S. and C. Kingsford, The power of protein interaction networks for associating genes with diseases. Bioinformatics, 2010. 26(8): p. 1057-63.
229. Kohler, S., S. Bauer, D. Horn, and P.N. Robinson, Walking the interactome for priorization of candidate genes. Am. J. Human Genet., 2008. 82: p. 949-958.
230. Vanunu, O. and R. Sharan, A propagation-based algorithm for inferring gene-disease associations, in German Conference on Bioinformatics 2008: Dresden. p. 54-62.
231. Wu, X., R. Jiang, M.Q. Zhang, and S. Li, Network-based global inference of human disease. Mol. Sys. Biol., 2008. 4: p. 189.
232. Karni, S., H. Soreq, and R. Sharan, A network-based method for predicting disease-causing genes. J Comput Biol, 2009. 16(2): p. 181-9.
233. Vanunu, O., O. Magger, E. Ruppin, T. Shlomi, and R. Sharan, Associating genes and protein complexes with disease via network propagation. PLoS Comput Biol, 2010. 6(1): p. e1000641.
234. Lee, E., H. Jung, P. Radivojac, J.W. Kim, and D. Lee, Analysis of AML genes in dysregulated molecular networks. BMC Bioinformatics, 2009. 10 Suppl 9: p. S2.
235. Chen, Y., J. Zhu, P.Y. Lum, X. Yang, S. Pinto, D.J. MacNeil, C. Zhang, J. Lamb, S. Edwards, S.K. Sieberts, A. Leonardson, L.W. Castellini, S. Wang, M.F. Champy, B. Zhang, V. Emilsson, S. Doss, A. Ghazalpour, S. Horvath, T.A. Drake, A.J. Lusis, and E.E. Schadt, Variations in DNA elucidate molecular networks that cause disease. Nature, 2008. 452(7186): p. 429-35.

236. Przytycka, T.M., M. Singh, and D.K. Slonim, Toward the dynamic interactome: it's about time. Brief Bioinform, 2010. 11(1): p. 15-29.