interannual variability of precipitable water vapour...
TRANSCRIPT
Indian Journal of Radio & Space Physics Yol. 34, February 2005, pp. 50-55
Interannual variability of precipitable water vapour-ENSOILNSO signal
A A L N Sarma
Department of Meteorology & Oceanography, Andhra University, Yisakhaptnam 530 003 (AP), India
[aalnsarma_met @ rediffmail.comJ
and
V Vizaya Bhaskar
Cyclone Warning Centre, India Meteorological Department, Yisakhapatnam 530 017 (AP), India
Received 16 March 2004; revised 1 7 December 2004; accepted 31 December 2004
Knowledge of the quantity of precipitable water vapour content (PWYC) in space and time over a region is of fundamental importance in hydro-meteorological studies. In the present investigation using the radiosonde data for a 1 7-year period from 1 984 to 2000, the mean monthly precipitable water for Yisakhapatnam (lat. 1 7°43'N, long. 83° 14'E) is evaluated for the layers surface to be 500 mbar. The inter-annual and intra-seasonal variation of precipitable water vapour and its relation to the mean monthly rainfall have been discussed. Seasonal cycles of precipitable water during ENSO (El Nino Southern Osci l lation) and LNSO (fA Nina Southern Oscillation) periods along with normal are reported. The paper also deals with cycling rates of moisture flux and percentage occurrence of rainfall from the corresponding amount of precipitable water vapour content.
Keywords: Precipitable water vapour, ENSO event, LNSO event, EI Nino, La Nina PACS No: 92.40.Ea; 92.60.Jq
1 Introduction Till now radiosonde observations are being used for
quantifying the precipitable water vapour content. But the recent studies on determination of precipitable water vapour by Raman Hanssen et al. I, Li et al. 2, Davies and Watson3 i nclude the application of space borne satellite radar interferometry (InSAR), Global Positioning System, Moderate Resolution Imaging Spectroradiometer (MODIS), Medium Resolution Imaging Spectometer (MERIS) measurements. Although the water vapour measurements from different techniques i s in near agreement, the ground borne radiosonde technique is still preferred, as it i s more reliable and accurate and other techniques are having their own limitations.
The precipitable water of a column of air is defined as the depth of water, which would accumulate, if all the water vapour in that column were precipitated. The quantification of precipitable water over a station is an aid for prediction of local weather. Ananthakrishnan et al. 4 studied the precipitable water vapour content in the atmosphere to bring out a relationship between precipitable water vapour content (PWVC) and rainfall over a station. Viswanadham et al. 5 have studied the precipitable water over tropical stations in relation to monsoon
flow. Sridharan et al. 6 also made similar studies on the usefu lness of PWVC for forecasting of rainfall over Visakhapatnam.
In the present paper, an attempt is made not only to understand the magnitude of the inter-annual and intra-seasonal variation of precipitable water vapour, but also its conformity with the prevailing local weather in different seasons during the year. The information on the relation between the different ranges of PWVC and the rainfall amounts will be a useful tool for the weather forecaster, particularly for issuing the local forecast. Percentile frequency distribution of different rainfall amounts in different ranges of PWVC is presented in the paper. The seasonal cycles of cycling rate parameter which is defined as the ratio of precipitation to precipitable water vapour content is also reported, as this gives all idea about the residence time of the moisture over the station. The tropical global Glcean-atmosphere coupled interaction manifests in the form of warm or cold phase events in conjunction with the sea-saw behaviour of sea level pressure south of the equator that modulates the strengthening or weakening of the southeast trade winds, which in turn influence the monsoon flow over the Indian subcontinent. In other words, the hydrological regime of different locations
SARMA & BHAS KAR: PRECIPITABLE WATER VAPOUR VARIABILITY -ENSO/LNSO 5 1
over the Indian subcontinent is teleconnected. An attempt is made in the present investigation for any perceptible variation in the normal seasonal cycles of moisture flux over Visakhapatnam during the years of ENSO (El Nino Southern Oscillation) and LNSO (La Nina Southern Oscillation).
2 Methodology The pwve in a layer of thickness (p - Po) IS
calculated by using the expression 7
PWVC = r x ( p - Po )
1 000 . . . 0 )
where r i s the mean humidity mixing ratio i n the (p -Po) layer in g/kg of dry air. M ixing ratio is defined as the amount of water vapour in the air of a given sized quantity of dry air, i .e grams of vapour per kilogram of dry air. In Eq. 0), P is pressure in mbar of bottom layer and Po the pressure in mbar of top layer.
If rl is the mixing ratio at level P and r2 the mixing ratio at level Po, then the mean mixing ratio (r) of the
. layer (p - Po) is obtained from
. . . (2)
Mean monthly radiosonde data for Visakhapatnam for the period 1 984-2000 for 0000 hrs and 1 200 hrs UTe are obtained from the records of India Meteorological Department for calculating the monthly PWVc. Saturation vapour pressure (es) in mbar and relative humidity (RH) are obtained from
tables using air temperature and dew point temperature available in radiosonde data. Vapour pressure and mixing ratios are obtained as fol lows.
Vapour pressure = (es x RH)/I OO . . . (3)
M ixing ratio = [0.622 x eJ(ps - es)]x 1 03 . . . (4)
where es is saturation vapour pressure in mbar and Ps atmospheric pressure in mbar. Monthly pwve is compared with monthly rainfall . By averaging the monthly values of pwve and rainfall for the whole period the monthly mean of pwve and rainfall are obtained. Monthly cycling rates of moisture flux are calculated by expressing the precipitation as a ratio of pwve for the period 1 984-2000. The events of no rain and specific range of rainfall occasions for pwve values of 0-3, 3 .0-4.0 and 4. 1 -6.0 are obtained. In order to understand the trend and changes in the monthly pwve over different periods during
. the last half century, a comparative study of monthly normal values of pwve for the distinct periods 1 956-2000, 1 956-65 and 1 984- 2000 is also presented and discussed .
3 Results and discussion Normal seasonal cycles of precipitable water
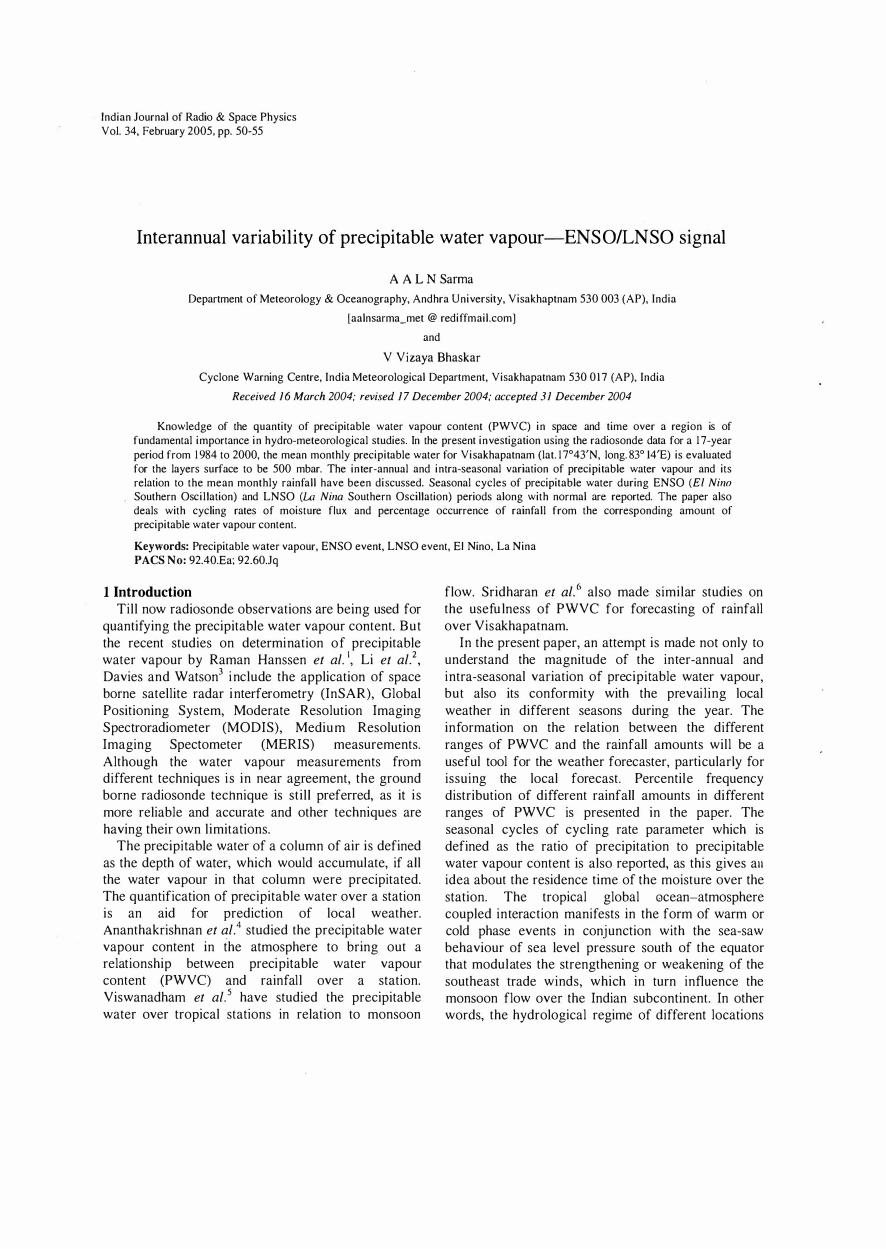
vapour and the rainfall averaged for the periods 1 984-2000 and 1 950-80, respectively, are shown in Fig. 1 . It i s observed that there i s a gradual rise of pwve from a minimum value of 2 .8 g/cm2 in winter (January) to a maximum of 5 .2 g/cm2 by the middle of monsoon months (July). Lower values of pwve are
30 r-------------------------------------------------------,
25
E o :{ 20 <{ u. Z
� 1 5 N
E o rn
5
. • •• • . - PWVC (1984-2000) - -e- - RF(1984-2000) -- Normal "'lnfall(1951-1980)
. . . . ,.,._ ...... :-. ...... ..,: . . .
I I I
,.. - I
I - .
I I
/ . . ' e " · · · • . ' . e . " • . . . . . e · . · · . . . . e . . . . e · · · . . · e · / . - . . - • . .
I
J\ I \ " \
\ \ \ \ \ \ \ \ . \ \ \ . e • . • . . . . . e • . . . . �\ • . . . . . . . . •
.. � .... ... ....... --o L-�==�==�� __ � __ �� ______ �� __ � __ �� J F M A M J J
MONTHS A s o N D
Fig. I-Annual cycle of rainfall Crf) and precipitable water vapour content CPWVC) -Visakhapatnam
52 INDIAN J RADIO & SPACE PHYS, FEBRUARY 2005
found during the winter months of January and February (equal to 2.8 g/cm2) . This may be because the low temperatures and dry continental offshore winds lead to low PWVC, which manifests as clear . skies over the station. The PWVC then starts building from the month of March due to increased thermal heating and occurrence of local convective activity (thunderstorms, etc.) with prevailing offshore winds. The PWVC continues to rise in monsoon months and higher values of PWVC are maintained throughout the monsoon period with a peak (5.2) seen in July. This might be attributed to the fact that the accumulated moi sture from January till the arrival of south-west monsoon current over the station, which is around 5 June, get precipitated in one or two spells of rain after its actual advancement over the station. However, due to prevailing moisture laden onshore circulation in aSSOCIatIOn with the south-west monsoon current, PWVC continues to maintain at higher values throughout the monsoon period in comparison with other months. In spite of a decrease in PWVC from October to December, moderately high values of PWVC are seen both in October and November, because of tropical cyclone activity . The rainfall also rises from January and peaks in the month of October. There is a time difference in the peaks of PWVC and precipitation curves as PWVC peaks in July, while rainfall peaks in October. This i s because the effects of post-monsoon cyclonic disturbances occurring in Bay of Bengal are reflected on the station ' s PWVC and rainfall for 3-4 days in a
60
month and contributing significantly to the total rainfall.
The seasonal cycles in rainfall and precipitable water for Visakhapatnam are given in Fig. I . The rainfall over Visakhapatnam during the study period 1 984-2000 shows a posItIve shift from the climatological normal . The climatological as well as study period rainfall plot shows that October is the rainiest month for Visakhapatnam.
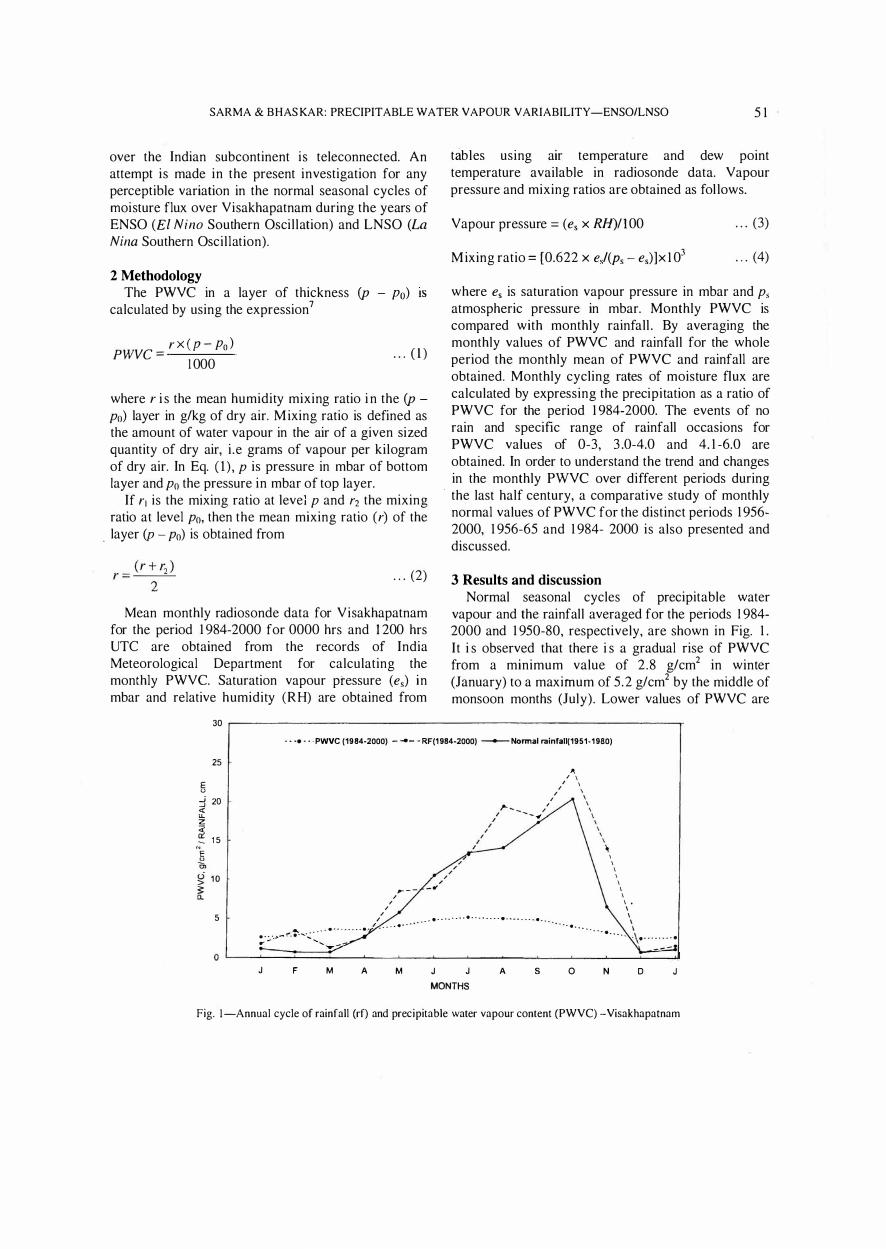
Figure 2 depicts the seasonal cycles of PWVC and rainfall for the period 1 984-2000 along with a 1 1 -month moving average curve. June-October are the rainy months for Visakhapatnam. The trend curve for PWVC reveals a marginal rise in PWVC during 1 990-1 995 compared to 1 984-89 and 1 996-2000 periods, while the rainfall trend shows a marginal decrease during 1 984, 1 992 and 2000 years, indicating approximately a 8-year periodicity.
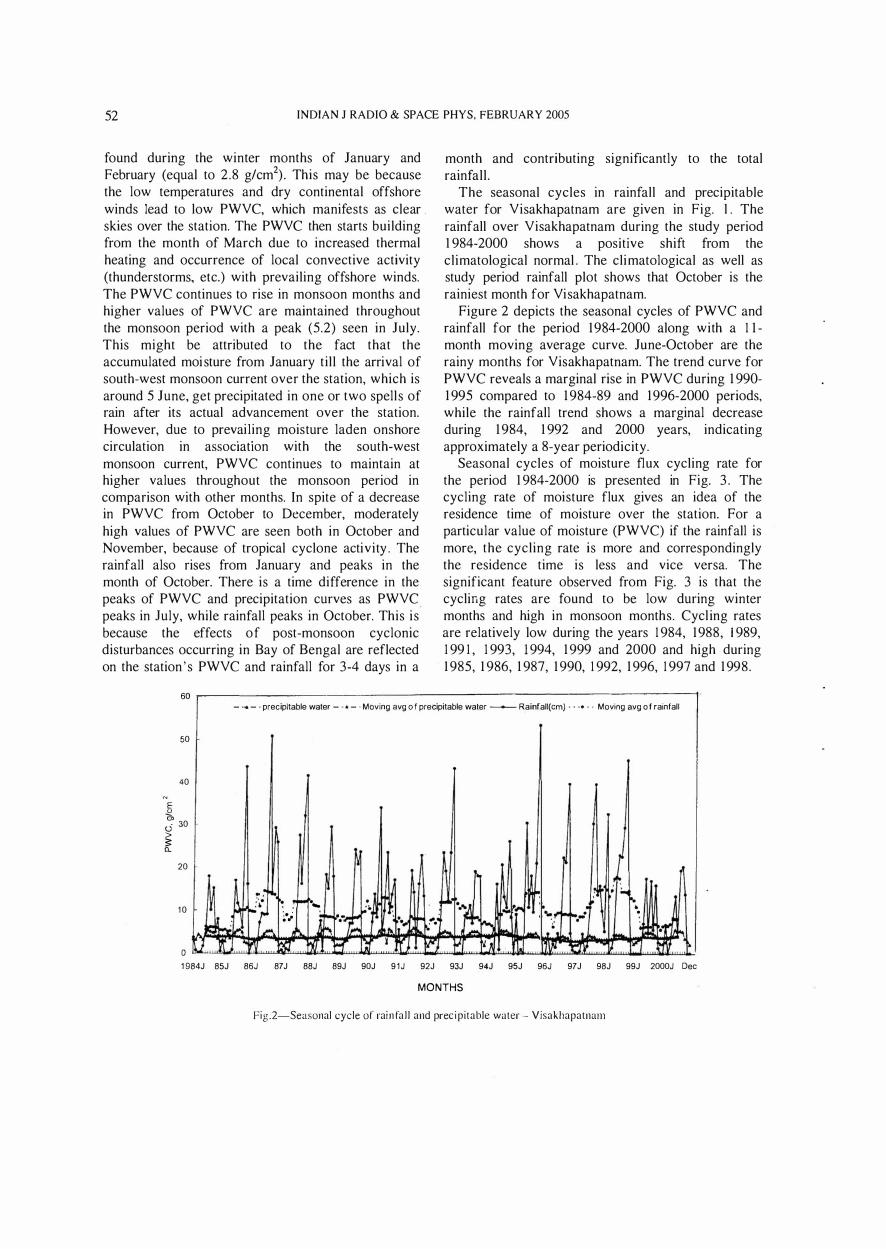
Seasonal cycles of moisture flux cycling rate for the period 1 984-2000 is presented in Fig. 3 . The cycling rate of moisture flux gives an idea of the residence time of moisture over the station. For a particular value of moisture (PWVC) if the rainfall is more, the cycling rate is more and correspondingly the residence time is less and vice versa. The significant feature observed from Fig. 3 is that the cycling rates are found to be low during winter months and high in monsoon months. Cycl ing rates are relatively low during the years 1 984, 1988, 1 989, 1 99 1 , 1 993, 1 994, 1 999 and 2000 and high during 1 985, 1 986, 1 987, 1 990, 1 992, 1 996, 1 997 and 1 998.
- ... - . precipitable water - . • - . Moving avg o f precipitable water - Rainfall{cm) . . . • . . Moving avg o f rainfall
50
40
N E u 0, <5 30
> 3: Cl.
20
1 0
o
Ir lA. � 1. ]t
� . ,. ��. � � _ .... .
�." ;' .. "; �. .� i.o'i . � W � "II � ]
r 1- J � � I -..� �"": t" .. ... 1'-" • .
If>.' � ... .... r--., iII!. .' . .. � r·n �. r- ..... .-. ' ...... c • • I. -� [; tp) "I �� �,�. m I"] �, r-
1 984J 85J 86J 87J 88J 89J 90J 9 1 J 92J 93J 94J 95J 96J 97J 98J 99J 2000J Dec
MONTHS
Fig.2-Seasonal cycle of rai n fa l l and prec i p itable water - Visakhapatnam
SARMA & BHASKAR: PRECIPITABLE WATER VAPOUR VARIABILlTY-ENSOILNSO 53
1 8
1 6
1 4
1 2
UJ f-«
1 0 a: (9 z :J 8 (.) � (.)
6
4
2
0
•
• , , , :
T � , ,
T i\ ' .
• :: :: " :: : : �: :: ,0 .: . ' .'
0 ' . ' . ' . . . .. : : ;, : : : .
.' ' : • . ' . . . .! :: :�.: : : .... . 0 1, " . ' . :; ... �� :��' . : , � : . . � : . : .
. ' " . : .. � : � :
� ::j :. ••• �;..
. . ' , t ! . .
�: �,
1 9 84J 85J 86J 87 J 88J 89J 90J 9 1 J 92J 9 3 J 94J 95J 96J 97 J 9 8 J 99J 2000J Dec
M O N T H S
Fig. 3-Seasonal cycle o f moisture flux cycling rate - Visakhapatnam
Table I -Percentile frequency distribution of rainfall and precipitable water
PWVC No. of occasions No rain g/cm2 % %
< 3 25 37
3.0-4.0 30 1 8
4. 1 -5.0 23 9
5 . 1 -6.0 2 1 t o
Higher cycl ing rates (> 1 0) were observed during ENSO periods of 1 987 and 1 997, while low cycling rates « 5) were found in LNSO year of ] 988. This may be because of low and high moisture flux incursion over India during ENSO and LNSO periods respectively, by overriding the corresponding changes in precipitation.
Percentile frequency di stribution of different rainfall amounts in different ranges of PWVC is presented in Table I . It is found that higher the PWVC, h igher is the percentage of occurrence of high amounts of rai nfall and vice versa. It is also evident from Table I that there is 82% occurrence of rainfall when the PWVC value exceeds 3 .0 and 63% when PWVC is below 3 .
I n a total of 47 occasions where PWVC i s less than 3 .0 g/cm2, 77% of occasions account for no rain or light rain « 25 mm) and there are barely 4% of heavy rainfall occasions. When the PWVC is between 4. 1 -5 and 5 . 1 -6, there are 43 and 39 occasions of nil or light rain occurring with a probabil ity of 2 1 % and 1 8%
< 25 mm 25-200mm >=201 mm % % %
40 19 4
29 37 1 6
1 2 53 25
8 59 24
respectively. Moderate or · heavy rainfall events witnessed a frequency that ranges from 78 to 83%.
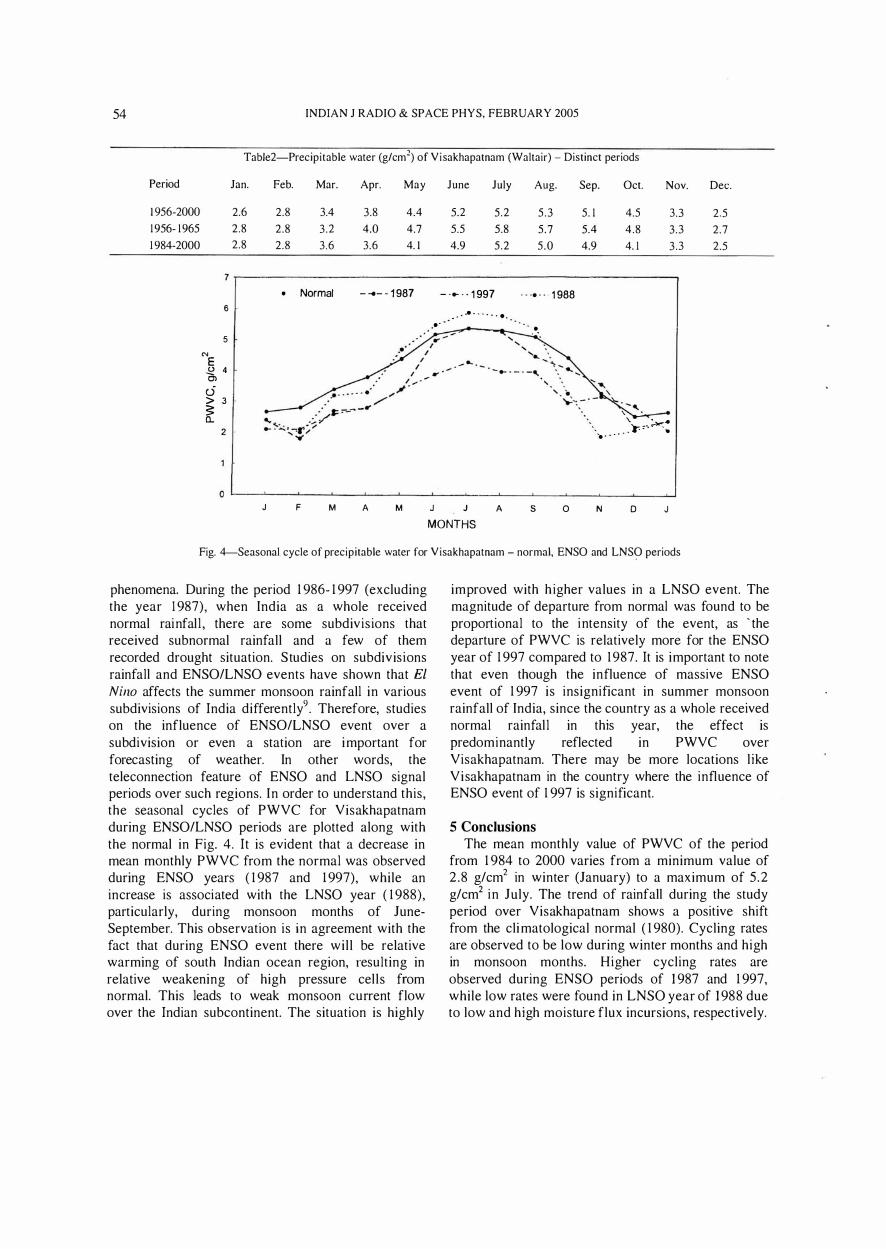
A comparative study of PWVC for the periods 1 956-65 and 1 984-2000 yielded decreasing trend (Table 2). Higher values of PWVC are recorded during monsoon months with a peak seen in the month of July in both the periods. However, the highest PWVC value (5 .8 g/cm2) is registered during 1 956-65 period.
4 Teleconnections Teleconnections are defined as coupling of large
scale atmospheric abnormalities in space between widely separated regions8. Occurrences of global scale ENSOILNSO events are connected to the various climatic anomalies in different parts of the globe. As such the ENSO/LNSO signal events engulfing the major parts of the geographical realms of globe are causing weather anomalies in space and time for rain bearing systems. There may be exemptions from the effect of ENSO/LNSO
54 INDIAN J RADIO & SPACE PHYS, FEBRUARY 2005
Table2-Precipitable water (g/cm2) of Visakhapatnam (Waltair) - Distinct periods
Period Jan.
1 956-2000 2.6 1956- 1965 2.8
1 984-2000 2.8
Feb.
2.8
2.8 2.8
Mar.
3.4
3.2
3.6
Apr. May June
3.8 4.4 5.2
4.0 4.7 5.5 3.6 4. 1 4.9
July Aug. Sep. Oct. Nov. Dec.
5 .2 5.3 5. 1 4.5 3.3 2.5 5.8 5.7 5.4 4.8 3.3 2.7 5.2 5.0 4.9 4. 1 3 .3 2.5
7r-------------------------------------------------------� • Normal - ... - - 1 987
6
5
'" E o 4 C, c5 > 3 3: a...
2 .
J F M A M
- · .. · · 1 997 . # ' •• • • • • - . e .
..
. ---,..----
r I
J
MONTHS
A
. . .• . · 1 988
' ..
s o
- , , --...--, ' .. .. . . . . . . ., ,...�"":.
N o J
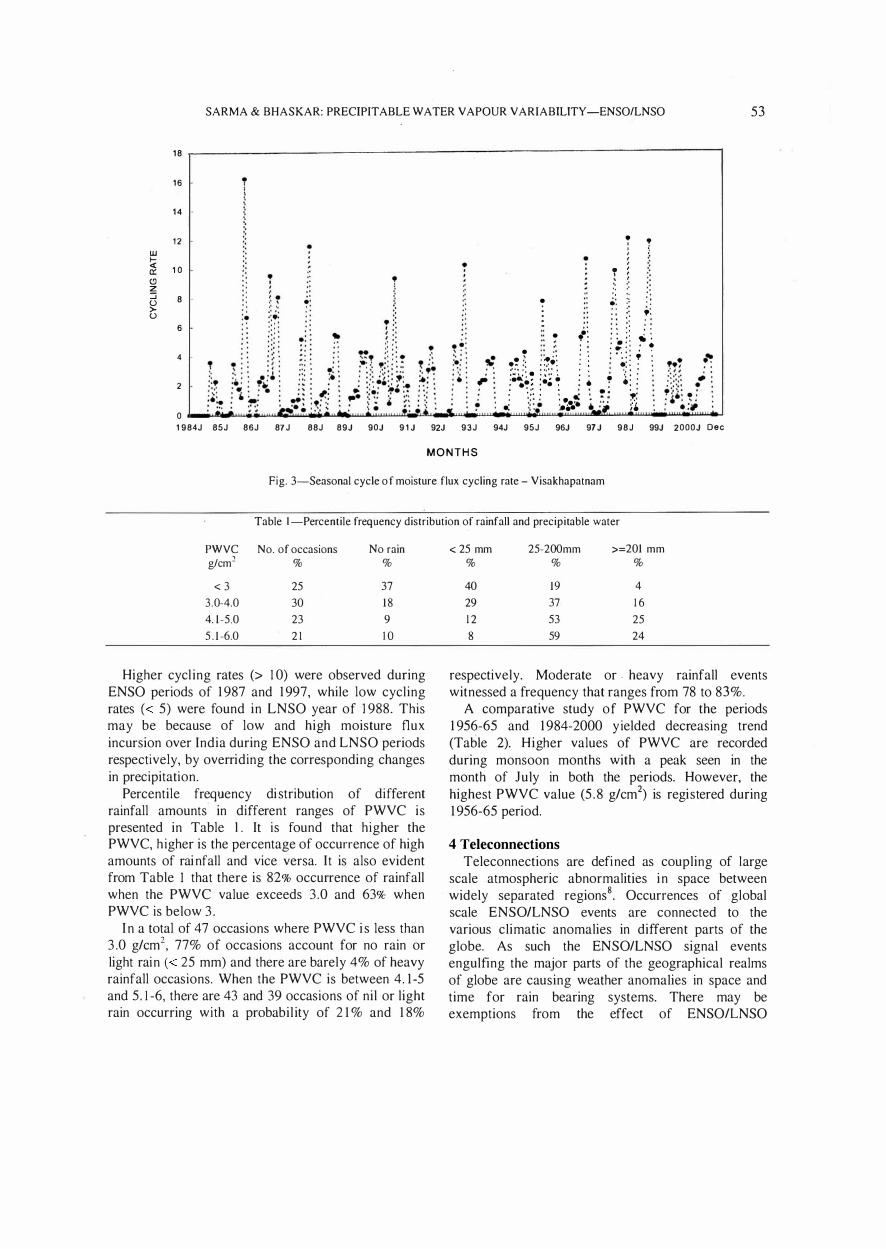
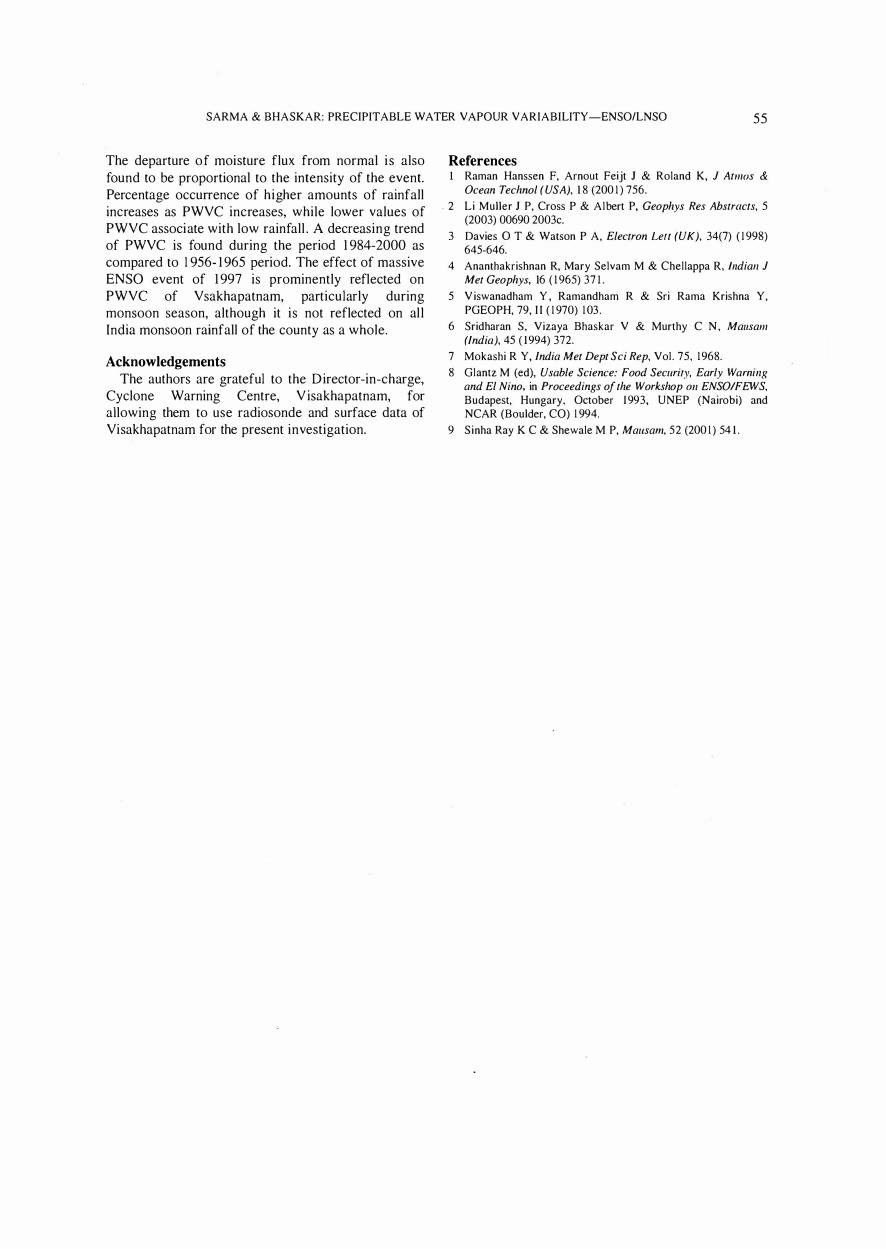
Fig. 4-Seasonal cycle of precipitable water for Visakhapatnam - normal, ENSO and LNSO periods
phenomena. During the period 1 986- 1 997 (excluding the year 1 987), when India as ·a whole received normal rainfall , there are some subdivisions that received subnormal rainfall and a few of them recorded drought situation. Studies on subdivisions rainfall and ENSO/LNSO events have shown that El Nino affects the summer monsoon rainfall in various subdivisions of India differently9 . Therefore, studies on the influence of ENSO/LNSO event over a subdivision or even a station are important for forecasting of weather. In other words, the teleconnection feature of ENSO and LNSO signal periods over such regions. In order to understand this, the seasonal cycles of PWVC for Visakhapatnam during ENSO/LNSO periods are plotted along with the normal in Fig. 4. It is evident that a decrease in mean monthly PWVC from the normal was observed during ENSO years ( 1 987 and 1 997), while an increase is associated with the LNSO year ( 1 988), particularly, during monsoon months of JuneSeptember. This observation is in agreement with the fact that during ENSO event there will be relative warming of south Indian ocean region, resulting in relative weakening of high pressure cells from normal. This leads to weak monsoon current flow over the Indian subcontinent. The situation is highly
improved with h igher values in a LNSO event. The magnitude of departure from normal was found to be proportional to the intensity of the event, as ' the departure of PWVC is relatively more for the ENSO year of 1 997 compared to 1 987. It is important to note that even though the influence of massive ENSO event of 1 997 is insignificant in summer monsoon rainfall of India, since the country as a whole received normal rainfall in this year, the effect is predominantly reflected in PWVC over Visakhapatnam. There may be more locations like Visakhapatnam in the country where the influence of ENSO event of 1 997 is significant.
5 Conclusions The mean monthly value of PWVC of the period
from 1 984 to 2000 varies from a minimum value of 2.8 g/cm
2 in winter (January) to a maximum of 5 .2
g/cm2 in JUly. The trend of rainfall during the study period over Visakhapatnam shows a positive shift from the cli matological normal ( 1 980). Cycling rates are observed to be low during winter months and high in monsoon months. Higher cycling rates are observed during ENSO periods of 1 987 and 1 997, while low rates were found in LNSO year of 1 988 due to low and high moisture flux incursions, respectively.
SARMA & BHASKAR: PRECIPITABLE WATER VAPOUR VARIABILITY -ENSOILNSO 55
The departure of moisture flux from normal i s also found to be proportional to the intensity of the event. Percentage occurrence of higher amounts of rainfall increases as PWVC increases, while lower values of PWVC associate with low rainfall . A decreasing trend of PWVC is found during the period 1 984-2000 as compared to 1 956- 1 965 period. The effect of massive ENSO event of 1 997 is prominently reflected on PWVC of Vsakhapatnam, particularly during monsoon season, although it is not reflected on all India monsoon rainfall of the county as a whole.
Acknowledgements The authors are grateful to the Director-in-charge,
Cyclone Warning Centre, Visakhapatnam, for allowing them to use radiosonde and surface data of Visakhapatnam for the present investigation.
References I Raman Hanssen F, Arnout Feijt J & Roland K, J Atmus &
Ocean Technol (USA), 1 8 (200 1 ) 756. . 2 Li Muller J P, Cross P & Albert P, Geophys Res Abstracts, 5
(2003) 00690 2003c. 3 Davies 0 T & Watson P A, Electron Left (UK), 34(7) ( 1 998)
645-646. 4 Ananthakrishnan R, Mary Selvam M & Chellappa R, Illdiall J
Met Geophys, 16 ( 1 965) 37 1 . 5 V iswanadham Y , Ramandham R & Sri Rama Krishna Y,
PGEOPH, 79, I I ( 1 970) 1 03 . 6 Sridharan S, Vizaya Bhaskar V & Murthy C N, Mal/sam
(India), 45 ( 1994) 372. 7 Mokashi R Y, India Met Dept Sci Rep, Vol. 75, 1968. 8 Glantz M (ed), Usable Science: Food Security, Early Warnillg
and El Nino, in Proceedings of the Workshop 011 ENSOIFEWS, Budapest, Hungary, October 1993, UNEP (Nairobi) and NCAR (Boulder, CO) 1 994.
9 Sinha Ray K C & Shewale M P, Mausam, 52 (200 1 ) 54 1 .