interchange modification report (imr) interstate … · the purpose of this interchange...
TRANSCRIPT

INTERCHANGE MODIFICATION REPORT (IMR)
INTERSTATE 95/J.TURNER BUTLER BOULEVARD
Duval County, Florida
Prepared for
Florida Department of Transportation District Two
July 2013


EXECUTIVE SUMMARY I-95/ J. Turner Butler Blvd IMR
E-1
Executive Summary
The purpose of this interchange modification report (IMR) is to provide the required technical documentation for obtaining Federal Highway Administration (FHWA) approval for improvements at the I-95/J. Turner Butler Boulevard (I-95/JTB) interchange in Duval County. The current interchange is a partial cloverleaf interchange with a signal at the I-95 southbound off ramp terminal. The Methodology Letter of Understanding (MLOU) was approved in May 2013. The primary basis for traffic projections in this IMR is the latest version (4.2) of the adopted Northeast Regional Planning Model (NERPM) which has a base year of 2005 and a cost feasible year of 2035. The analysis years for the study include Existing Year 2011, Opening Year 2015, Interim Year 2025 and Design Year 2035. The operational analysis for this study was be performed using two procedures: Highway Capacity Manual (HCM) 2010 and microsimulation (CORSIM). Both I-95 and JTB carry high volume of traffic with daily traffic exceeding 100,000 vehicles. Jacksonville’s Southside is one of the fastest growing regions in the metropolitan area and, in recent years, congestion on JTB has extended well beyond normal peak hours and onto the local street network. The proposed improvement modification will correct existing deficiencies and accommodate increasing traffic demands and congestion generated by rapid growth and development in southern Duval County and northern St. Johns County. Currently, the I-95 southbound to JTB eastbound movement and westbound is controlled by the signalized ramp terminal intersection. During peak hours, significant queuing develops and spills back onto the I-95 mainline creating operational and potential safety concerns. The current interchange configuration does not provide for the I-95 northbound to JTB westbound left turn movement. Several weave movements occur within the interchange area impacting operations and safety of the interchange. Traffic conditions are expected to worsen as growth continues to occur leading to worsening of these operational issues. Two alternatives will be evaluated in this IMR: an Interim Build Alternative and an Ultimate Build Alternative. The following are the major improvements of the Interim Build Alternative:
• A 2 lane flyover is proposed for the I-95 southbound to JTB eastbound movement.
• Installation of a signal at the I-95 northbound off ramp terminal intersection.
• Construction of a 2 lane JTB westbound to I-95 northbound flyover ramp.
• Provide an additional lane on the westbound JTB to I-95 southbound loop ramp making it a 2 lane ramp.
• Provide a right out movement at Salisbury Road South on to JTB eastbound.
• Eliminate access to and from Salisbury Road North.
• Provide three westbound through lanes from I-95 southbound off ramp terminal to Philips Highway.
• Provide three eastbound through lanes from Philips Highway to the slip ramp on to I-95 southbound.
The Ultimate Build Alternative is very similar to the Interim Build Alternative with a few design modifications. It will include reconstruction of the I-95/JTB interchange bridges. Following are

EXECUTIVE SUMMARY I-95/ J. Turner Butler Blvd IMR
E-2
the other design modifications of the Ultimate Build Alternative that will impact traffic operations:
• In the eastbound direction, the third through lane is carried to the JTB eastbound to I-95 northbound loop ramp. This lane bypasses the signal at the I-95 southbound off ramp terminal intersection.
• Relocation of the exit gore point of JTB westbound to I-95 southbound further upstream along JTB.
The proposed improvements are to be constructed in two phases as: Interim Alternative and the Ultimate Alternative. FDOT is requesting approval of both the Interim and Ultimate Alternatives as part of this IMR. FDOT plans to construct the Ultimate Alternative when funding is available in future. The proposed modifications at the I-95/JTB interchange along with other improvements in the study area such as widening of JTB from Philips Highway to I-95 will provide significantly better operations with no negative impacts. The delay at the I-95/JTB ramp terminal intersections and other study intersections will reduce under both the Interim and Ultimate Build Alternatives in comparison to the No-Build. The Southpoint Parkway at Belfort Road intersection will experience a slight increase in delay of less than 5 seconds under the Build condition. The most significant improvement will be at the I-95/JTB southbound off ramp terminal intersection that will improve to an acceptable LOS in Interim and Ultimate Build from a failing LOS of F in No-Build. The new I-95/JTB northbound off ramp terminal intersection will operate at acceptable LOS through Design Year 2035 in Interim and Ultimate Build Alternatives. When comparing the microsimulation (CORSIM) analysis results between the No-Build and Build Alternatives, the CORSIM results indicate that the Interim and Ultimate Build Alternatives will provide better traffic operations in the area of influence. The I-95 and JTB mainline segments will have higher speeds and better operating conditions under the Build condition as compared to the No-Build. The queues observed in the No-Build will reduce significantly in both the Build alternatives. In the northbound direction, reduced speeds and higher densities will be observed along I-95 in the area around Bowden Road interchange for the Build alternatives. This is mainly due to the fact that the Build alternatives will be able to process more traffic through the network as a result of the proposed improvements. But all of the congestion under Build alternatives will dissipate at the end of the simulation even at the Bowden Road interchange area whereas the No-Build will have residual queues and unmet demand at the end of the simulation period. The CORSIM model shows that the lack of capacity and congested conditions along JTB westbound under the No-Build Alternative prevents traffic from reaching the I-95 northbound mainline. In the Build Alternative, additional traffic is able to be processed on JTB westbound thus degrading I-95 northbound. The heat diagrams confirm this condition. As per the FHWA toolbox, the temporal time limits of the model were increased to 5 hours to allow for recovery and dissipation of traffic. At the end of the simulation period, traffic dissipated from the Build model but the No-Build model still had congested areas. This also confirms that the congested
EXECUTIVE SUMMARY I-95/ J. Turner Butler Blvd IMR
E-3
area on JTB westbound was removed and that traffic is able to reach I-95 NB quicker resulting in some degradation of I-95 northbound during the peak period. Additional capacity is needed on I-95 to effectively process all the traffic demand. A planning level study is underway to evaluate additional capacity projects on I-95 from International Golf Parkway to the Overland Bridge. Due to the proposed improvements from this study, the planning study will need to incorporate these improvements and make recommendations on how to process the additional demand on I-95 NB that the Build Alternative delivers. The number of on ramp lanes merging with I-95 remain the same in both the No-Build and Build alternatives, i.e. 2 lanes. The traffic and LOS from HCS on the I-95 mainline between JTB and Bowden Road also remains the same under No-Build and Build conditions. This indicates that if the entire traffic demand was able to get to the mainline in No-Build and Build conditions during the peak hour, then the LOS would remain the same as per HCS. The Build Alternatives will also improve safety within the vicinity of the interchange by reducing the angle and side swipe crashes. These crashes are associated with congested conditions and complex lane maneuvers that are associated with the No-Build conditions. In conclusion, the comparison of the No-Build and Build alternatives show that the proposed interchange improvements will provide better and safer operating conditions. This IMR has been developed in accordance with FDOT Policy No. 000-525-015: Approval of New or Modified Access to Limited Access Highways on the Strategic Intermodal System (SIS), FDOT Procedure No. 525-030-160: Approval of New or Modified interchange access to limited access facilities on SIS, Interchange Handbook and the FDOT Traffic Forecasting Handbook (Procedure No. 525-030-120).
E.1 Compliance with FHWA General Requirements
The following requirements serve as the primary decision criteria used in approval of interchange modification projects. Responses to each of the FHWA 8 policy points are provided to show that the proposed modification for the I-95/JTB interchange is viable based on the conceptual analysis performed to date.
E.1.1 Existing system is incapable of accommodating the traffic
The need being addressed by the request cannot be adequately satisfied by existing interchanges
to the Interstate, and/or local roads and streets in the corridor can neither provide the desired
access, nor can they be reasonably improved (such as access control along surface streets,
improving traffic control, modifying ramp terminals and intersections, adding turn bays or
lengthening storage) to satisfactorily accommodate the design-year traffic demands (23 CFR
625.2(a)).
The need being addressed by this IMR can only be addressed at the existing I-95/JTB interchange location. Other streets and interchanges within the area of influence cannot meet the demand for traffic within the project. Both I-95 and JTB carry high volume of traffic with daily traffic exceeding 100,000 vehicles. The I-95/JTB interchange serves as a main route for

EXECUTIVE SUMMARY I-95/ J. Turner Butler Blvd IMR
E-4
commuters coming from St. Johns and Clay Counties to major employment centers located in Duval County along JTB. This interchange also provides access to the Beaches and popular medical centers like the St. Vincent’s Medical Center Southside and the Mayo Clinic. The proposed improvements do not significantly modify or change the access to I-95 but enhance the flow of vehicles exiting I-95 to the JTB freeway and local access as well as traffic accessing I-95 from JTB. The I-95 southbound off ramp terminal intersection operates at LOS F in Design Year 2035 and traffic is expected to spill back on to the mainline. This intersection cannot be improved to accommodate the traffic demand. The proposed I-95 southbound to JTB westbound flyover ramp and other improvements within the I-95/JTB interchange area are designed to ensure that no queue spillback will occur onto I-95 from the crossroad intersections or ramps in the design year.
E.1.2 All reasonable alternatives to a new interchange have been considered
The need being addressed by the request cannot be adequately satisfied by reasonable
transportation system management (such as ramp metering, mass transit, and HOV facilities),
geometric design, and alternative improvements to the Interstate without the proposed change(s)
in access (23 CFR 625.2(a)).
Transportation system management (TSM) improvements such as ramp metering and mass transit are not feasible to provide the needed capacity intended by the proposed modifications. TSM improvements have been constructed in the past and will not be able to meet the traffic or safety needs at the interchange in design year.
E.1.3 Proposal does not adversely impact operational safety of the existing freeway
An operational and safety analysis has concluded that the proposed change in access does not
have a significant adverse impact on the safety and operation of the Interstate facility (which
includes mainline lanes, existing, new, or modified ramps, ramp intersections with crossroad) or
on the local street network based on both the current and the planned future traffic projections.
The analysis shall, particularly in urbanized areas, include at least the first adjacent existing or
proposed interchange on either side of the proposed change in access (23 CFR 625.2(a),
655.603(d) and 771.111(f)). The crossroads and the local street network, to at least the first
major intersection on either side of the proposed change in access, shall be included in this
analysis to the extent necessary to fully evaluate the safety and operational impacts that the
proposed change in access and other transportation improvements may have on the local street
network (23 CFR 625.2(a) and 655.603(d)). Requests for a proposed change in access must
include a description and assessment of the impacts and ability of the proposed changes to safely
and efficiently collect, distribute and accommodate traffic on the Interstate facility, ramps,
intersection of ramps with crossroad, and local street network (23 CFR 625.2(a) and
655.603(d)). Each request must also include a conceptual plan of the type and location of the
signs proposed to support each design alternative (23 U.S.C. 109(d), and 23 CFR 655.603(d)).
The safety analysis performed for this IMR showed that there are no high accident locations within the project area. The average crash rates for I-95 and JTB for the last three years is lower

EXECUTIVE SUMMARY I-95/ J. Turner Butler Blvd IMR
E-5
than the statewide average for similar facilities. Side swipe and angle type crashes are the predominant crash types and account for more than fifty percent of the total crashes. These type of crashes are attributed to congested conditions and lane changes in short distance. The proposed interchange modifications in this IMR aim to improve traffic flow at the merge/diverge, intersections and along the local streets. This will provide safer travel conditions. The proposed interchange modifications provide better operations and LOS as compared to the No-Build through Design Year 2035. The operational analysis conducted for this project does not have a significant adverse impact on I-95 and JTB. In the northbound direction between JTB and Bowden Road, speeds decrease and densities increase when comparing the Build alternative to the No-Build alternative. This is primarily due to the fact that the Build alternative is able to process more traffic through the system as compared to the No-Build. However, it should be noted that congestion at this location completely dissipates prior to the end of simulation unlike the No-Build that has congestion at the end of the simulation. The proposed modifications as part of this IMR will provide an acceptable LOS through the Design Year 2035. The operational analysis included sections of interstate and existing adjacent interchanges within the area of influence. Crossroads and other roads and streets were also included in the analysis to assure their ability to collect and distribute the traffic to and from the I-95/JTB interchange. The CORSIM model shows that the lack of capacity and congested conditions along JTB westbound under the No-Build Alternative prevents traffic from reaching the I-95 northbound mainline. In the Build Alternative, additional traffic is able to be processed on JTB westbound thus degrading I-95 northbound. The heat diagrams confirm this condition. As per the FHWA toolbox, the temporal time limits of the model were increased to 5 hours to allow for recovery and dissipation of traffic. At the end of the simulation period, traffic dissipated from the Build model but the No-Build model still had congested areas. This also confirms that the congested area on JTB westbound was removed and that traffic is able to reach I-95 NB quicker resulting in some degradation of I-95 northbound during the peak period. Additional capacity is needed on I-95 to effectively process all the traffic demand. A planning level study is underway to evaluate additional capacity projects on I-95 from International Golf Parkway to the Overland Bridge. Due to the proposed improvements from this study, the planning study will need to incorporate these improvements and make recommendations on how to process the additional demand on I-95 NB that the Build Alternative delivers. The number of on ramp lanes merging with I-95 remain the same in both the No-Build and Build alternatives, i.e. 2 lanes. The traffic and LOS from HCS on the I-95 mainline between JTB and Bowden Road also remains the same under No-Build and Build conditions. This indicates that if the entire traffic demand was able to get to the mainline in No-Build and Build conditions during the peak hour, then the LOS would remain the same as per HCS.
E.1.4 A full interchange with all traffic movements at a public road is provided
The proposed access connects to a public road only and will provide for all traffic movements.
Less than “full interchanges” may be considered on a case-by-case basis for applications
requiring special access for managed lanes (e.g., transit, HOVs, HOT lanes) or park and ride

EXECUTIVE SUMMARY I-95/ J. Turner Butler Blvd IMR
E-6
lots. The proposed access will be designed to meet or exceed current standards for federal-aid
projects on the interstate system (23 CFR 625.2(a), 625.4(a)(2), and 655.603(d)).
The proposed improvements will restore the I-95 northbound to JTB westbound movement within the interchange that was removed during a prior interchange modification project. This will allow the interchange to operate as a full interchange with all traffic movements. The proposed movement will be under signal control and operate at acceptable LOS through Design Year 2035. The proposed modifications are designed to meet current standards for federal-aid projects on the interstate system and conform to AASHTO design standards.
E.1.5 The proposal is consistent with local and regional plans
The proposal considers and is consistent with local and regional land use and transportation
plans. Prior to receiving final approval, all requests for new or revised access must be included
in an adopted Metropolitan Transportation Plan, in the adopted Statewide or Metropolitan
Transportation Improvement Program (STIP or TIP), and the Congestion Management Process
within transportation management areas, as appropriate, and as specified in 23 CFR part 450,
and the transportation conformity requirements of 40 CFR parts 51 and 93. The proposed interchange modifications are supported by the North Florida Transportation Planning Organization (TPO) 2035 Cost Feasible long range transportation plan (LRTP). FDOT plans to construct the improvements as part of a Design-Build (D-B) project. The anticipated letting date for the D-B is fiscal year 2013-2014. There are no additional interchange improvements proposed or planned within the area of influence.
E.1.6 Consistency with State Highway Master Plans
In corridors where the potential exists for future multiple interchange additions, a
comprehensive corridor or network study must accompany all requests for new or revised access
with recommendations that address all of the proposed and desired access changes within the
context of a longer-range system or network plan (23 U.S.C. 109(d), 23 CFR 625.2(a),
655.603(d), and 771.111). The proposed interchange is in conformance with the 2035 LRTP adopted by the North Florida TPO. A Project Development and Environment (PD&E) document was prepared for the interchange in 2011 which will be reevaluated as part of this project for the proposed improvements. The proposed modifications to the interchange are also consistent with the previous I-95 Master Plan and the analysis includes adjacent interchanges and local street network.
E.1.7 Coordinated with the area's development
When a new or revised access point is due to a new, expanded, or substantial change in current
or planned future development or land use, requests must demonstrate appropriate coordination
has occurred between the development and any proposed transportation system improvements
(23 CFR 625.2(a) and 655.603(d)). The request must describe the commitments agreed upon to

EXECUTIVE SUMMARY I-95/ J. Turner Butler Blvd IMR
E-7
assure adequate collection and dispersion of the traffic resulting from the development with the
adjoining local street network and Interstate access point (23 CFR 625.2(a) and 655.603(d)).
The proposed improvements are not driven by any proposed development and the need for interchange improvements is independent of any other transportation improvements within the area. Substantial population increases in Duval and St. Johns County have occurred, since the opening of the I-95/JTB interchange that are anticipated to add significant amount of trips to the interchange.
E.1.8 Request needs to consider planning and environmental constraints
The proposal can be expected to be included as an alternative in the required environmental
evaluation, review and processing. The proposal should include supporting information and
current status of the environmental processing (23 CFR 771.111).
No potential fatal flaws from a planning and environmental perspective are anticipated for the proposed improvements. Some wetland impacts are anticipated. A PD&E study was completed for the interchange in 2011 that will be reevaluated as part of the current project. A Type 2 Categorical Exclusion has been determined as the Class of Action and Efficient Transportation Decision Making (ETDM) screening has been completed.

TABLE OF CONTENTS I-95/ J. Turner Butler Blvd IMR
i
Table of Contents E.1 Compliance with FHWA General Requirements 1-3
E.1.1 Existing system is incapable of accommodating the traffic 1-3
E.1.2 All reasonable alternatives to a new interchange have been considered 1-4
E.1.3 Proposal does not adversely impact operational safety of the existing freeway 1-4
E.1.4 A full interchange with all traffic movements at a public road is provided 1-5
E.1.5 The proposal is consistent with local and regional plans 1-6
E.1.6 Consistency with State Highway Master Plans 1-6
E.1.7 Coordinated with the area's development 1-6
1.0 INTRODUCTION 1-1
1.1 Background 1-1
1.2 Purpose and Need 1-1
1.3 Project Location 1-2
1.4 Applicant Information 1-4
2.0 METHODOLOGY 2-1
2.1 Overview 2-1
2.2 Analysis Years 2-1
2.3 Area of Influence 2-1
2.4 Data Collection 2-2
2.5 Base Traffic Data and Traffic Factors 2-2
2.6 Use of Department’s Adopted Validated Models 2-3
2.6.1 Travel Demand Forecasting Assumptions 2-3
2.6.2 FSUTMS Model Runs 2-3
2.6.3 Model Network Updates 2-4
2.6.4 Future Traffic Volumes 2-4
2.7 Development of Design Traffic 2-5
2.8 Level of Service Criteria 2-5
2.9 Analysis Procedures 2-5
2.9.1 HCM Based Individual Element Analysis Procedure 2-6
2.9.2 Microsimulation Analysis Procedure 2-6
3.0 EXISTING CONDITIONS 3-1
3.1 Existing Land Use 3-1
3.2 Existing Transportation Network 3-1
3.2.1 Existing Roadway Network 3-1
3.2.2 Alternative Transportation Modes 3-2
3.2.3 Existing Interchanges 3-2
3.2.4 Consideration of Other Interchange Proposals 3-2
3.3 Existing Operational Performance 3-4
3.3.1 Existing Traffic Data 3-4
3.3.2 Accident and Safety Information 3-6
3.3.3 HCM Based Operational Analysis 3-6
3.3.4 Microsimulation Based Operational Analysis 3-12
3.4 Existing Environmental Conditions 3-22
3.4.1 Community Data and Socioeconomics 3-22

TABLE OF CONTENTS I-95/ J. Turner Butler Blvd IMR
ii
3.4.2 Cultural Resources 3-22
3.4.3 Natural Environment 3-22
3.5 Consistency with Master Plans, LRTP, LGCP and DRIs 3-23
4.0 NEED 1
5.0 NO-BUILD CONDITIONS 5-1
5.1 Future Land Use 5-1
5.2 Future Transportation Network 5-3
5.3 No-Build Design Traffic 5-3
5.4 Individual Element No-Build Operational Analysis 5-5
5.4.1 2015 No-Build Analysis 5-5
5.4.2 2025 No-Build Analysis 5-10
5.4.3 2035 No-Build Analysis 5-14
5.5 Microsimulation Based No-Build Operational Analysis 5-17
6.0 ALTERNATIVES 6-1
6.1 No-Build Alternative 6-1
6.2 Transportation System Management Alternative 6-1
6.3 Transportation Demand Management Alternative 6-1
6.4 Build Alternatives 6-2
6.4.1 Interim Build Alternative 6-2
6.4.2 Ultimate Build Alternative 6-3
6.5 Build Alternative Design Traffic 6-3
7.0 EVALUATION OF ALTERNATIVES 7-1
7.1 Introduction 7-1
7.2 Conformance with Local, Regional and State Transportation Plans 7-1
7.3 Compliance with FHWA Requirements 7-1
7.4 HCM Based Individual Element Build Operational Analysis 7-1
7.4.1 2015 Interim and Ultimate Build Analysis 7-3
7.4.2 2025 Interim and Ultimate Build Analysis 7-5
7.4.3 2035 Interim and Ultimate Build Analysis 7-10
7.5 Microsimulation Based Build Operational Analysis 7-14
7.6 Environmental Impacts 7-48
7.7 Safety 7-48
7.8 Alternatives Comparison 7-48
7.8.1 Planning and Environmental Comparison 7-48
7.8.2 Operational Comparisons 7-49
7.9 Recommended Alternative 7-51
8.0 MODIFICATION FOR PROJECT 8-1
8.1 Compliance with FHWA General Requirements 8-1
8.1.1 Existing system is incapable of accommodating the traffic 8-1
8.1.2 All reasonable alternatives to a new interchange have been considered 8-1
8.1.3 Proposal does not adversely impact operational safety of the existing freeway 8-2
8.1.4 A full interchange with all traffic movements at a public road is provided 8-3

TABLE OF CONTENTS I-95/ J. Turner Butler Blvd IMR
iii
8.1.5 The proposal is consistent with local and regional plans 8-3
8.1.6 Consistency with State Highway Master Plans 8-4
8.1.7 Coordinated with the area's development 8-4
8.1.8 Request needs to consider planning and environmental constraints 8-4
9.0 CONCEPTUAL FUNDING PLAN/CONSTRUCTION SCHEDULE 9-1
List of Figures Figure 1-1 Project Location and Area of Influence Map ......................................................... 1-3
Figure 3-1 Existing Land Use ................................................................................................. 3-3
Figure 3-2 Existing Year 2011 AADT .................................................................................... 3-5
Figure 3-3 Existing Lane Configuration ............................................................................... 3-10
Figure 3-4 Existing Year 2010 AM (PM) Peak Hour Volumes & LOS ................................. 3-11
Figure 5-1 Future Land Use.................................................................................................... 5-2
Figure 5-2 No-Build AADT .................................................................................................. 5-4
Figure 5-3 2015 No-Build Lane Configuration ....................................................................... 5-8
Figure 5-4 2015 No-Build AM (PM) Peak Hour Volumes and LOS ....................................... 5-9
Figure 5-5 2025 No-Build AM (PM) Peak Hour Volumes and LOS ..................................... 5-13
Figure 5-6 2035 No-Build AM (PM) Peak Hour Volumes and LOS ..................................... 5-16
Figure 6-1 Interim Build Alternative Design Concept ............................................................. 6-4
Figure 6-2 Ultimate Build Alternative Design Concept........................................................... 6-5
Figure 6-3 Conceptual Signing Plan ....................................................................................... 6-6
Figure 6-4 2015, 2025 and 2035 Build AADT Volumes ......................................................... 6-7
Figure 6-5 2015 Build AM (PM) Peak Hour Volumes ............................................................ 6-8
Figure 6-6 2025 Build AM (PM) Peak Hour Volumes ............................................................ 6-9
Figure 6-7 2035 Build AM (PM) Peak Hour Volumes .......................................................... 6-10
Figure 7-1 2015, 2025 and 2035 Interim & Ultimate Build Alternatives Lane Configuration .. 7-2
Figure 7-2 2015 Build AM (PM) Peak Hour Volumes and LOS ............................................. 7-8
Figure 7-3 2025 Build AM (PM) Peak Hour Volumes and LOS ............................................. 7-9
Figure 7-4 2035 Build AM (PM) Peak Hour Volumes and LOS ........................................... 7-13
List of Tables
Table 1-1 Regional Population Growth .................................................................................. 1-2
Table 2-1 Summary of Traffic Factors .................................................................................... 2-3
Table 3-1 Functional Classification of Area Roadways............................................................ 3-1
Table 3-2 Interchange Spacing ................................................................................................ 3-2
Table 3-3 Existing Year 2011 Mainline Capacity Analysis Summary ..................................... 3-7
Table 3-4 Existing Year 2011 Ramp Analysis Summary ........................................................ 3-8
Table 3-5 Existing Year 2011 Intersection Analysis Summary ............................................... 3-9
Table 3-6 Existing Year 2011 Northbound I-95 Freeway MOEs ........................................... 3-14
Table 3-7 Existing Year 2011 Southbound I-95 Freeway MOEs ........................................... 3-16
Table 3-8 Existing Year 2011 Eastbound JTB Freeway MOEs ............................................. 3-18

TABLE OF CONTENTS I-95/ J. Turner Butler Blvd IMR
iv
Table 3-9 Existing Year 2011 Westbound JTB Freeway MOEs ............................................ 3-18
Table 3-10 Existing Year 2011 Arterial MOEs (Control Delay) ............................................ 3-21
Table 5-1 Opening Year 2015 No-Build Mainline Analysis Summary .................................... 5-5
Table 5-2 Opening Year 2015 No-Build Ramp Analysis Summary ........................................ 5-6
Table 5-3 Opening Year 2015 No-Build Intersection Analysis Summary ............................... 5-7
Table 5-4 Interim Year 2025 No-Build Mainline Analysis Summary .................................... 5-10
Table 5-5 Interim Year 2025 No-Build Ramp Analysis Summary ........................................ 5-11
Table 5-6 Interim Year 2025 No-Build Intersection Analysis Summary ............................... 5-12
Table 5-7 Design Year 2035 No-Build Mainline Analysis Summary .................................... 5-14
Table 5-8 Design Year 2035 No-Build Ramp Analysis Summary ......................................... 5-15
Table 5-9 Design Year 2035 No-Build Intersection Analysis Summary ................................ 5-15
Table 5-10 Design Year 2035 No-Build Northbound I-95 Freeway MOEs ........................... 5-21
Table 5-11 Design Year 2035 No-Build Southbound I-95 Freeway MOEs ........................... 5-21
Table 5-12- Design Year 2035 No-Build Eastbound JTB Freeway MOEs ............................. 5-27
Table 5-13 Design Year 2035 No-Build Westbound JTB Freeway MOEs ............................ 5-31
Table 5-14 Design Year 2035 No-Build Arterial MOEs (Control Delay) .............................. 5-32
Table 7-1 2015 Interim & Ultimate Build Mainline Analysis Summary .................................. 7-3
Table 7-2 2015 Interim & Ultimate Build Ramp Analysis Summary ...................................... 7-4
Table 7-3 2015 Interim & Ultimate Build Intersection Analysis Summary ............................. 7-5
Table 7-4 2025 Interim & Ultimate Build Mainline Analysis Summary .................................. 7-5
Table 7-5 2025 Interim & Ultimate Build Ramp Analysis Summary ...................................... 7-6
Table 7-6 2025 Interim & Ultimate Build Intersection Analysis Summary ............................. 7-7
Table 7-7 2035 Interim & Ultimate Build Mainline Analysis Summary ................................. 7-10
Table 7-8 2035 Interim & Ultimate Build Ramp Analysis Summary .................................... 7-11
Table 7-9 2035 Interim & Ultimate Build Intersection Analysis Summary ........................... 7-12
Table 7-10 Design Year 2035 Interim Build Alternative Northbound I-95 Freeway MOEs ... 7-19
Table 7-11 Design Year 2035 Interim Build Alternative Southbound I-95 Freeway MOEs ... 7-19
Table 7-12 Design Year 2035 Interim Build Alternative Eastbound JTB Freeway MOEs ..... 7-24
Table 7-13 Design Year 2035 Interim Build Alternative Westbound JTB Freeway MOEs .... 7-24
Table 7-14 Design Year 2035 Interim Build Alternative Arterial MOEs (Control Delay) ..... 7-30
Table 7-15 Design Year 2035 Ultimate Build Alternative Northbound I-95 Freeway MOEs. 7-33
Table 7-16 Design Year 2035 Ultimate Build Alternative Southbound I-95 Freeway MOEs. 7-41
Table 7-17 Design Year 2035 Ultimate Build Alternative Eastbound JTB Freeway MOEs ... 7-41
Table 7-18 Design Year 2035 Ultimate Build Alternative Eastbound JTB Freeway MOEs ... 7-42
Table 7-19 Design Year 2035 Ultimate Build Alternative Arterial MOEs (Control Delay) ... 7-47
Table 7-15 Alternatives’ Comparison ................................................................................... 7-49

TABLE OF CONTENTS I-95/ J. Turner Butler Blvd IMR
v
List of Appendices Appendix A – Methodology Letter of Understanding Appendix B – 2013 Field Traffic Counts Appendix C – Crash Analysis Summary Appendix D – Existing Year 2010 HCM Based Operational Analysis Appendix E – Existing Year 2011 Microsimulation Analysis Existing Year 2011 CORSIM Model Manual Appendix F – 2015, 2025 and 2035 No Build HCM Based Operational Analysis Appendix G – Design Year 2035 No-Build Microsimulation Analysis Design Year 2035 No-Build CORSIM Model Manual Appendix H – 2015, 2025 and 2035 Interim & Ultimate Build HCM Based Operational Analysis Appendix I – Design Year 2035 Interim & Ultimate Build Microsimulation Analysis Design Year 2035 Build CORSIM Model Manual

1.0 INTRODUCTION I-95/ J. Turner Butler Blvd IMR
1-1
1.0 INTRODUCTION
1.1 Background
The Applicant, Florida Department of Transportation (FDOT) requests the Federal Highway Administration (FHWA) approval of an Interchange Modification Report (IMR) for the improvement of Interstate 95 (I-95) interchange at the J. Turner Butler Boulevard (JTB) in Duval County. This IMR has been developed in accordance with FDOT Policy No. 000-525-015: Approval of New or Modified Access to Limited Access Highways on the Strategic Intermodal System (SIS), FDOT Procedure No. 525-030-160: Approval of New or Modified interchange access to limited access facilities on SIS, Interchange Handbook and the FDOT Traffic Forecasting Handbook (Procedure No. 525-030-120). FDOT is conducting a Project Development and Environment (PD&E) study and IMR to decide on the configuration, location and design of the proposed improvements for the I-95 at JTB interchange from Philips Highway (US 1) to Belfort Road. An Effective Transportation Decision Making (ETDM) process has been completed for the project. The I-95/JTB interchange was constructed in the 1960s and had a partial cloverleaf configuration. Since then several modifications have been made to improve operations of the interchange. In the mid 1990s, operational improvements were made to the interchange and the I-95 northbound to JTB westbound movement was prohibited. This movement is required to travel east on JTB and make a U-turn at the Belfort Road interchange. Another project was completed that constructed auxiliary lanes between the JTB interchange and Bowden Road interchange on I-95. A two-lane southbound exit ramp from I-95 to JTB was also constructed. The improvements listed in this section were included as part of the Existing and No-Build Alternative in this study. The project is included in the North Florida Transportation Planning Organization’s (TPO) long range transportation plan (LRTP) and the anticipated letting of the project for Design-Build is fiscal year 2013-2014.
1.2 Purpose and Need
The purpose of this IMR is to provide the required technical documentation for obtaining FHWA approval for improvements at the I-95/JTB interchange in Duval County. Both I-95 and JTB carry high volume of traffic with daily traffic exceeding 100,000 vehicles. The I-95/JTB interchange serves as a main route for commuters coming from St. Johns and Clay Counties to major employment centers located in Duval County along JTB. This interchange also provides access to the Beaches and popular medical centers like the St. Vincent’s Medical Center Southside and the Mayo Clinic. In the last few years, several large-scale housing and commercial projects have emerged in northern St. Johns County and southern Duval County. This has led to an increase in traffic at the I-95/JTB interchange providing access to residential, business and recreation areas. The increase in traffic due to this growth has been so significant that the

1.0 INTRODUCTION I-95/ J. Turner Butler Blvd IMR
1-2
morning and afternoon peak spreads beyond the peak hour at the interchange and creating recurring traffic congestion. Substantial population increases in Duval and St. Johns County have occurred, since the opening of the I-95/JTB interchange, as shown in Table 1-1. This is anticipated to add significant amount of trips to the interchange. Table 1-1 Regional Population Growth
County 1960 1970 1980 1990 2000 2010
(Census)
Duval 455,411 528,865 571,003 672,971 778,879 864,263
St. Johns 30,034 31,065 51,303 83,829 123,135 190,039
Source: SJRC DEIS
FDOT has initiated this interchange modification study to investigate alternatives for the I-95/JTB interchange that will help alleviate congestion and improve safety and mobility in the area.
1.3 Project Location
The subject interchange is located in Duval County at the junction of I-95 with JTB at Milepost 11.559. The I-95/JTB interchange is located between the I-95 interchanges at Baymeadows Road and Bowden Road. It is approximately 2.3 miles north of Baymeadows Road and 1.5 miles south of Bowden Road. The project location of the I-95/JTB interchange and the area of influence are shown in Figure 1-1. The area of influence (Section 2.3) is shown as a 1 mile buffer or 1 mile in either direction surrounding the subject corridors. The area of influence for this project includes the following interchanges (as shown in Figure 1-1):
• I-95/Baymeadows Road
• STUDY INTERCHANGE of I-95/JTB
• I-95/Bowden Road
• JTB/Belfort Road

1.0 INTRODUCTION I-95/ J. Turner Butler Blvd IMR
1-3
Figure 1-1 Project Location and Area of Influence Map

1.0 INTRODUCTION I-95/ J. Turner Butler Blvd IMR
1-4
1.4 Applicant Information
Stephen Browning, P.E.
Interchange Review Coordinator
Florida Department of Transportation - District 2
1109 S. Marion Avenue, MS 2007
Lake City, FL 32025-5874
Phone: (386) 961 – 7455
Fax: (386) 961- 7508
E-mail: [email protected]

2.0 METHODOLOGY I-95/ J. Turner Butler Blvd IMR
2-1
2.0 METHODOLOGY
2.1 Overview
A Methodology Letter of Understanding (MLOU) was prepared to document the methodology for the analysis and evaluation of this IMR. The MLOU was approved by the FDOT District 2 Interchange Review Coordinator (IRC), FDOT Central Office and FHWA in May 2013. A signed copy of the MLOU is provided in Appendix A. The following sections summarize the methodology as set forth in the MLOU. The methodology used for travel demand forecasting and development of design hour traffic is consistent with the FDOT Project Traffic Forecasting Handbook. The primary basis for traffic projections is the latest version (4.2) of the adopted Northeast Regional Planning Model (NERPM) which has a base year of 2005 and a cost feasible year of 2035.
2.2 Analysis Years
The following study years are established for this IMR:
• Existing Year: 2011
• Opening Year: 2015
• Interim Year: 2025
• Design Year: 2035
2.3 Area of Influence
The study interchange of I-95 at JTB is located in Duval County’s urbanized area. The study interchange is approximately 2.3 miles north of Baymeadows Road and 1.5 miles south of Bowden Road. As per the requirements in the Interchange Handbook the northern oriented ramps of Baymeadows Road and the southern oriented ramps of Bowden Road are included in the area of influence along with the JTB/Belfort Road interchange along JTB. Following is a summary of each study interchange:
• I-95/Baymeadows Road is located at milepost 9.335 (Section No. 72280000). This interchange is in an urbanized area and is 2.30 miles south of the I-95/JTB interchange.
• I-95/JTB interchange is located at milepost 11.559 (Section No. 72280000). This interchange is in an urbanized area and is 2.30 miles north of the I-95/Baymeadows Road interchange.
• I-95/Bowden Road is is located at milepost 13.124 (Section No. 72280000). This interchange is in an urbanized area and is 1.50 miles north of the I-95/JTB interchange.
The area of influence also includes the intersections along JTB from Philips Highway to Belfort Road. The intersections and traffic impacts analyzed within the area of influence are listed below.

2.0 METHODOLOGY I-95/ J. Turner Butler Blvd IMR
2-2
• Intersections � Philips Highway at JTB � Bonneval Road at JTB � Belfort Road at JTB Westbound Off/On Ramps � Belfort Road at JTB Eastbound Off/On Ramps � Belfort Road at AC Skinner Parkway � Belfort Road at Southpoint Parkway
• Mainline through movements
• Ramp merge and diverge junctions
• Queuing analysis for ramps at cross-streets and on mainline
• Ramp roadway capacity
2.4 Data Collection
The data sources within the project study area included:
• Field Traffic Counts
• FDOT Transportation System Data
• Existing Traffic Data from Florida Traffic Information (FTI) DVD
• Duval County Land Use Data
• Environmental Data
• Existing Plans, Programs and Project Lists from FDOT and Duval County
• Approved Studies within the area (PD&E, Master Plans, DRIs)
2.5 Base Traffic Data and Traffic Factors
The primary source of existing traffic for this IMR is field traffic counts. 48-hour tube counts were collected on the I-95 mainline between Baymeadows Road and JTB on April 02, 2013 (Tuesday) and April 03, 2013 (Wednesday). 24-hour ramp counts were also collected at the same time on some study area ramps. Four-hour manual turning movement counts were collected at each of the existing ramp terminal and local street intersections on April 02, 2013 (Tuesday) from 6:00 to 10:00 for both AM peak period and 3:00 to 7:00 for PM peak period. Information from the 2011 FDOT Traffic Information DVD was used to obtain the remaining mainline and ramps traffic data and also to check the reasonableness of the existing traffic counts. Adjustments were made if necessary to ensure that turning movement volumes at ramp terminals sum up to the peak hour ramp volumes. The mainline 48 hour tube counts were converted to Annual Average Daily Traffic (AADT) by applying seasonal factors in accordance with FDOT standards. The traffic data was factored to develop the study existing year 2011 balanced mainline, ramps and intersection volumes. The factors used for design traffic analysis include the Standard K, D30, Tf and PHF factors. The Standard K is the proportion of the annual average daily traffic (AADT) occurring during the peak hour of the design year, depending upon the area type and facility type. D30 is the proportion of the 30th highest hour of the design year traveling in the peak direction. Tf is the

2.0 METHODOLOGY I-95/ J. Turner Butler Blvd IMR
2-3
percentage of truck traffic occurring during the peak hours and is estimated as ½ of the 24 hour truck percentage (T24). The FDOT recommended Standard K value for core freeways in large urbanized areas such as Jacksonville is 8.0 to 9.0%. For core freeways in Jacksonville such as I-95 and JTB, an 8% K factor could be used. The traffic factors used in this IMR are presented in Table 2-1.
Table 2-1 Summary of Traffic Factors
Facility Standard K D30 MOCF Tf PHF
I-95 8.0% 55% 0.96 5% 0.95
JTB 8.0% 56% 0.96 2% 0.95 Source: FDOT Standard K paper and FDOT FTI DVD
A 5% truck factor was selected for I-95 and 2% truck factor was selected for JTB based on the 2011 FTI DVD. A peak hour factor (PHF) of 0.95 was used in the operational analysis. A driver population factor (fp) of 1.0 was used in the analysis due to the fact that the traffic stream characteristics within the study area are known to be representative of regular truck drivers and commuters who are familiar with the facilities.
2.6 Use of Department’s Adopted Validated Models
2.6.1 Travel Demand Forecasting Assumptions
The travel demand forecasts for this study were developed for the future years 2015, 2025 and 2035. The latest available NERPM version 4.2 was used to develop design year 2035 traffic forecasts. Opening year 2015 and interim year 2025 volumes were developed by interpolation. A minimum 1 percent growth rate was applied to any growth rate below 1 percent. The ramp volumes at JTB and I-95 were adjusted as needed to reflect the new alternative configurations studied as part of this project. However, the total demand for these movements was kept the same. No additional forecasts of the I-95 mainline or ramp volumes were performed and no latent demand was added.
2.6.2 FSUTMS Model Runs
The NFTPO’s NERPM model Version 4.2 was used for the development of future year traffic projections for this IMR. This model is the approved, validated model provided by the Department. This model has a base year of 2005 and cost feasible year of 2035. A project base year 2010 model was developed and calibration effort was performed for existing conditions using 2010 count data to validate the reasonableness of the NERPM traffic demand forecast in the project area. The base year 2010 model was run and model volumes were checked for reasonableness. The mainline and ramp volumes were calibrated to within the Florida Standard Urban Transportation Model Structure (FSUTMS) standards. The cost feasible year 2035 model was run to obtain the Design Year 2035 forecasts. All adjustments to the model roadway network

2.0 METHODOLOGY I-95/ J. Turner Butler Blvd IMR
2-4
are discussed in the sections below. No adjustments were made to the model socioeconomic data or zone structure.
2.6.3 Model Network Updates
To accommodate the traffic volumes that will result from the projected growth in the Northeast Florida region, the state, county and various local governments having jurisdiction within the project corridor have planned or programmed a number of roadway improvements. The NERPM model network was reviewed for inclusion of planned and programmed roadway improvements obtained from the North Florida TPO’s 2035 LRTP. In general the following network assumptions were made for No-Build and Build models within the area of influence for this study.
No-Build Model Network
The No-Build model network does not include any improvement alternatives developed as part of this IMR. The No-Build model was run for the Design Year 2035 to obtain forecasts. No model runs were performed for Opening Year 2015 and Interim Year 2025.
Build Model Network
The ramp volumes at JTB and I-95 obtained under the No-Build were adjusted as needed to reflect the new alternative configurations studied as part of this project. No new Build model network was developed and no additional model forecasts of the I-95 mainline or ramp volumes were performed.
2.6.4 Future Traffic Volumes
After reviewing SE data and incorporating network updates, the NERPM model was executed to obtain future traffic forecasts for Design Year 2035 No-Build scenario. The 2035 Build scenario traffic forecasts for the study area were then developed by redistribution based on the new alternative configurations. The traffic forecasts were checked for reasonableness by comparing available counts from FTI against model outputs. Additional traffic counts were taken in April 2013 specifically for this IMR. These new counts were used to further check traffic forecasts for reasonableness. The turning movement forecasts for design year 2035 were developed by applying a growth rate to the existing turning movement counts. This growth rate was obtained by comparing the existing and design year mainline and ramp volumes. The traffic forecasts were then balanced along mainline and arterial. The opening year 2015 and interim year 2025 traffic forecasts were developed by interpolation between the existing year and design year 2035.

2.0 METHODOLOGY I-95/ J. Turner Butler Blvd IMR
2-5
2.7 Development of Design Traffic
The development of design traffic for this IMR followed procedures consistent with the process defined in the 2002 FDOT Project Traffic Forecasting Handbook. The volume projections from NERPM models were in the form of Peak Season Weekday Average Daily Traffic (PSWADT). These PSWADT projections were converted to AADT using the Duval and Duval Countywide Model Output Conversion Factor (MOCF) of 0.96 obtained from 2011 Florida Traffic Information DVD. The AADTs were converted to Directional Design Hour Volumes (DDHVs) through the application of the Standard K and D30 factors described in Section 2.5.
2.8 Level of Service Criteria
FDOT maintains minimum acceptable operating level of service (LOS) standards for the State Highway System as well as the Strategic Intermodal System (SIS). I-95 is a SIS facility. The term LOS is defined as the system of six designated ranges from “A” (best) to “F” (worst) used to evaluate roadway facility performance. The FDOT minimum acceptable operating LOS standards as detailed in the MLOU were used for this IMR. The LOS standards for major roadways analyzed in this IMR are summarized below:
• JTB Mainline and Ramps: LOS D
• I-95 Mainline and Ramps: LOS D
• Study Intersections: LOS D
2.9 Analysis Procedures
The operational analysis for this study was performed using two procedures: Highway Capacity Manual (HCM) 2010 and microsimulation (CORSIM). It should be pointed out that these two procedures can produce different analysis results since they incorporate different mathematical principles and models, as well as have different capabilities for temporal and spatial limits. The HCM methodology is generally classified as a series of analytical procedures (flow rate variables) that produce deterministic results (no randomness). Each transportation facility (freeway mainline, freeway ramp, signalized intersection, etc.) is analyzed using a unique methodology, which is performed independent of other adjacent facilities. CORSIM is a microscopic simulation (microsimulation) model that is stochastic in nature (random processes). Microsimulation models provide a high level of detail regarding the traffic stream, including individual movements and interactions, which are governed by car-following and lane changing models. CORSIM allows for all of the transportation facilities (freeways and arterials) to be modeled at the same time, which can account for congestion on one facility to affect other adjacent facilities. For example, modeling results may differ between HCM and microsimulation where congestion from an intersection spills back onto a freeway. The HCM analysis would not be aware of the congestion; however, microsimulation would capture this occurrence. The information from both modeling methods are useful and significant differences

2.0 METHODOLOGY I-95/ J. Turner Butler Blvd IMR
2-6
in outcomes will be examined. The following sections provide a summary of the HCM and CORSIM analysis procedures.
2.9.1 HCM Based Individual Element Analysis Procedure
Highway Capacity Manual (HCM) 2010 methodologies were used for the operational analysis of individual roadway elements, i.e., mainline segments and ramp junctions. The operational analysis of the mainline segments and ramp junctions was completed using Highway Capacity Software (HCS) based on HCM 2010. The operational analysis for the study intersections was completed using Synchro 8.0.
2.9.2 Microsimulation Analysis Procedure
The microsimulation analysis using CORSIM (Corridor Simulation) software was conducted in addition to the HCM based operational analysis to evaluate the system-wide operational performance. A corridor-wide microsimulation analysis enhances the capability of capturing the network-wide vehicular interaction between the individual roadway elements (mainline segments, ramp junctions and arterial intersections), which may not be reflected in the individual element analysis. The microsimulation analysis for this IMR was conducted following FHWA modeling guidelines and MnDOT CORSIM Manual. The microsimulation model was validated with travel time runs and queuing data collected for existing conditions. The microsimulation model was calibrated to the existing year traffic counts and speeds observed in the field. Ramp, mainline and entry volumes were calibrated to within 10% of counts. Speed was calibrated within 20% using Bluetooth data and speed profiles were prepared. The simulation model was modified accordingly to reflect future conditions. CORSIM is a stochastic model that produces different results by changing the random seed numbers. To ensure model variation does not skew the results, a certain number of different model runs are required. A sample size of 10 runs was used for the CORSIM output processer and the results from these runs were averaged. The number of runs was calculated from the statistical equation in FHWA Toolbox and provides an acceptable confidence interval. The results of the Existing Year 2011, Design Year 2035 No-Build, Design Year 2035 Interim Build and Design Year 2035 Ultimate Build statistical analyses are provided in Appendix E, Appendix G, and Appendix I, respectively. The following sections document the modeling methodology used for performing CORSIM microsimulation operational analysis for the I-95/JTB IMR study.
2.9.2.1 Modeling Analysis Years and Alternatives
The CORSIM models were developed for the AM and PM Peak periods for the following analysis years and alternatives:
• Existing Year 2011
• Design Year 2035 No-Build Alternative
• Design Year 2035 Interim Build Alternative
• Design Year 2035 Ultimate Build Alternative

2.0 METHODOLOGY I-95/ J. Turner Butler Blvd IMR
2-7
The Design Year 2035 models were developed to guide the ultimate design for the area of influence.
2.9.2.2 Model Traffic Volumes
All CORSIM model scenarios (Existing Year 2011, Design Year 2035 No-Build, Design Year 2035 Interim Build and Design Year 2035 Ultimate Build) include AM and PM peak period volumes. 15 minute volumes were developed for input into the CORSIM models during AM and PM peak periods. These volumes correspond directly to the volumes used in the capacity analysis during peak hour of the mainline, ramps, and study intersections used in the HCM based operational analysis of individual elements.
2.9.2.3 Model Spatial Limits
The CORSIM model spatial limits are based on this IMR’s area of influence. The area of influence typically includes adjacent interchanges that could be affected by the construction of the proposed interchange or future improvements to adjacent interchanges that could have an effect on how the proposed project is constructed. The following is a summary of model spatial limits for existing, No-Build and Build CORSIM models.
CORSIM Model Spatial Limits
For this study, the influence area for the Existing Year 2011, Design Year No-Build and Build analysis includes the following study elements:
• I-95 mainline from south of Baymeadows Road to north of Bowden Road
• JTB from Philips Highway to east of Belfort Road
• Belfort Road from south of AC Skinner Parkway to north of Southpoint Parkway
• All interchanges and intersections within these limits
2.9.2.4 Model Temporal Limits
The temporal limits of the modeling period relate to the location of the project and the length of peak period and congestion expected. RITIS data was used to determine the temporal limits and develop speed profiles for this project. The guidelines provided in FHWA Toolbox Volume III were used to address any unmet demand as documented in the MLOU prepared for this IMR. The model temporal limit assumed for this study was a three-hour AM and three-hour PM peak period for existing calibration and five-hour AM and five-hour PM peak period for future year instead of a typical one hour AM and PM peak. The three-hour and five-hour AM and PM peak period models were achieved by developing “shoulder hours” to the AM and PM peaks, which were based on the existing traffic counts in the study area. For the five-hour model, these “shoulder hours” were incorporated by appending one hour before and three hours after the typical peaks, thereby providing a five-hour capture window. The shoulder hours allowed the modeling to capture the build up to the congestion, the potential failure, and the recovery of the transportation network in the area of influence for this study. 15 minute volumes were developed for each hour of the peak period.
2.0 METHODOLOGY I-95/ J. Turner Butler Blvd IMR
2-8
2.9.2.5 CORSIM Measures of Effectiveness
The following measures of effectiveness (MOEs) based on the CORSIM analysis results were used to evaluate the operational performance of the study elements:
• Freeway Segments – Traffic Volume Throughput, Density and Travel Speed
• Signalized Intersections – Traffic Volume Throughput, and Total Delay by movement, approach, and intersection
Traffic volume throughput was included as one of the MOEs for freeway segments as significant differences in demand volumes (observed volume or throughput in the field) vs. simulated volumes from CORSIM can indicate operational deficiencies and/or congestion on upstream freeway segments or arterial intersections. MOEs listed above are compared between the No-Build and Build conditions to evaluate system operations. Lower density and higher speed values indicate good operating conditions. As per Highway Capacity Manual, at free flow speed of 70 mph, a density value greater than 45 pc/mi/ln and speed below 53.3 mph will result in LOS F conditions.

3.0 EXISTING CONDITIONS I-95/ J. Turner Butler Blvd IMR
3-1
3.0 EXISTING CONDITIONS
The following sections provide a discussion and evaluation of the existing conditions within the area of influence for the I-95/JTB interchange modification study. This discussion includes existing land use data, transportation systems data, existing traffic data, known environmental constraints, and existing operating conditions.
3.1 Existing Land Use
Land use surrounding the JTB corridor from Philips Highway to Belfort Road is predominately office and commercial with some residential. The I-95/JTB interchange supports the Southpoint Business Park and hotels in the northwest, northeast and southeast quadrants. Commercial, office and hotel establishments are located in the northwest quadrant of this interchange, with gas stations and restaurants extending to Philips Highway intersection. Commercial and office businesses are also located in the southwest quadrant, extending to Philips Highway. The existing land uses within the area of influence are shown in Figure 3-1.
3.2 Existing Transportation Network
3.2.1 Existing Roadway Network
The existing transportation network within the area of influence consists of a six-lane interstate highway, and a four-lane limited access highway that transitions to principal arterial at its western terminus with Philips Highway. Table 3-1 summarizes the functional classification and number of lanes for I-95, JTB and Belfort Road within the project area of influence. Table 3-1 Functional Classification of Area Roadways
Roadway From To Functional
Classification
Number
of Lanes
I-95 Baymeadows Road JTB Urban Interstate
Highway 6
I-95 JTB Bowden Road Urban Interstate
Highway 8
JTB Philips Highway I-95 Principal Arterial 4
JTB I-95 Belfort Road Limited Access
Highway 4
Belfort Road AC Skinner Pkwy Southpoint
Pkwy Urban Collector 4
I-95 – I-95 within the study area is primarily a six-lane north-south limited access facility with auxiliary lanes north of JTB. The median width in this section of I-95 varies from 0 feet to 80 feet. Interchanges with I-95 adjacent to the I-95/JTB interchange are Baymeadows Road, approximately 2.3 miles to the south and Bowden Road, approximately 1.5 miles to the north

3.0 EXISTING CONDITIONS I-95/ J. Turner Butler Blvd IMR
3-2
JTB - In the study area JTB is a four-lane limited access facility east of I-95. The segment of JTB from I-95 to Philips Highway is a principal arterial with intersections at Bonneval Road and Philips Highway. The inside paved shoulder is four feet wide, and the outside paved shoulder is 8 ft. wide. Median width and other roadside elements vary within the project limits. Belfort Road – Belfort Road is a four-lane divided urban roadway consisting of two 11 ft. lanes in each direction. The raised grassed median is 16 ft. wide. 5 ft. sidewalks are on both sides of the roadway separated from the curb and gutter by 11 ft. grassed utility strips.
3.2.2 Alternative Transportation Modes
The JTA operates a park-and-ride lot on Philips Highway 700 ft. north of JTB serving regular bus routes. The lot is approximately 26 acres and is primarily used by Southside commuters. JTA also has plans for a future bus rapid transit route which passes through the study area. JTA has identified as part of the Bus Rapid Transit Tier I Preliminary Environmental Impact Study parcels located in the northeast quadrant of the I-95/JTB interchange. The JTA is also conducting a commuter rail feasibility study that includes identifying potential station locations along the Florida East Coast Railway main track west of Philips Highway. The current park-and-ride lot facility is identified as one of the potential transit stations. The bus rapid transit or commuter rail service projects addition is not expected to result in a significant difference in the vehicle demand on JTB or within the I-95/JTB interchange ramps.
3.2.3 Existing Interchanges
There are two existing interchanges within the study area, I-95 at Baymeadows Road and I-95 at Bowden Road, both in Duval County. The Baymeadows Road interchange is a diamond interchange. The Bowden Road interchange is a partial diamond interchange. Both existing interchanges are within an urbanized area. Table 3-2 below shows the study interchanges and their spacing. Table 3-2 Interchange Spacing
Location Milepost Spacing from Proposed
Interchange
I-95/Baymeadows Road 9.335 2.30
Study I-95/JTB interchange 11.559 ---
I-95/Bowden Road 13.124 1.50
3.2.4 Consideration of Other Interchange Proposals
There are no other interchange proposals currently under consideration within the project study area.

3.0 EXISTING CONDITIONS I-95/ J. Turner Butler Blvd IMR
3-3
Figure 3-1 Existing Land Use

3.0 EXISTING CONDITIONS I-95/ J. Turner Butler Blvd IMR
3-4
3.3 Existing Operational Performance
This section summarizes the detailed operational analysis performed within the area of influence to assess the traffic and mobility conditions. I-95 is a six-lane limited-access interstate facility. This facility accommodates interstate and regional mobility for commuter and freight traffic. The surrounding transportation network consists of four-lane urban arterials.
3.3.1 Existing Traffic Data
FDOT traffic count data was obtained for the I-95 and JTB mainline and ramps from the 2011 FTI DVD. In addition to FDOT traffic data, a supplementary data collection effort was conducted to obtain existing traffic data for the study area. 48-hour tube counts were collected on the I-95 mainline between Baymeadows Road and JTB on April 02, 2013 (Tuesday) and April 03, 2013 (Wednesday). 24-hour ramp counts were also collected at the same time on some study area ramps. Four-hour manual turning movement counts were collected at each of the existing ramp terminal and local street intersections on April 02, 2013 (Tuesday) for both AM and PM peak periods. The mainline 48 hour tube counts were converted to Annual Average Daily Traffic (AADT) by applying seasonal factors in accordance with FDOT standards. The traffic data was factored to develop the study existing year 2011 balanced mainline, ramps and intersection volumes. A copy of the field counts is included in Appendix B. Information from the 2011 FDOT Traffic Information DVD was used to check the reasonableness of the existing traffic counts as well as to develop Existing Year 2011 AADTs for the ramps. Figure 3-2 shows the Existing Year 2011 AADT.

5,70011,500
33,200
27,90017,200
16,500
9,100
42,300
42,3008,700
59,000
10,500
69,500
22,000
3,300
10,500
54,700
12,500
42,20043,900
13,000
56,900
1,600
9,800
24,000
69,500
10,500
59,000
N. T. S.
Phillips Hwy
Bonneval Rd
Salisbury Rd
Southpoint Blvd Belfort Rd
ToBowden Rd
FromBowden Rd
ToBaymeadows Rd
FromBaymeadows Rd
§̈¦95
J. Turner Butler Blvd
§̈¦95
Legend
Butler BlvdJ. Turner
Salisbury Rd
Existing Year 2011 AADT VolumeX,XXX
Southpoint Pkwy
A.C. SkinnerPkwy
I-95 / J. Turner Butler BlvdInterchange Modification Report Existing Year 2011 Annual Average Daily Traffic (AADT) Figure
3-2

3.0 EXISTING CONDITIONS I-95/ J. Turner Butler Blvd IMR
3-6
3.3.2 Accident and Safety Information
Crash data along I-95 and JTB from 2009 to 2011 included the number of crashes by milepost for each year, number of vehicles involved, type of crashes, number of injuries and/or fatalities, cause, economic loss and average daily traffic. The ‘Average Crash Rate Method’ of crash analysis, based on segment length, average daily traffic and number of crashes occurred, was used for calculating actual crash rate for the roadway segments. The actual crash rate for the facility from year 2009 to year 2011 was compared with the statewide average crash rate for the same type of facility. The crash analysis results showed that there are no high accident locations in the proposed I-95/JTB interchange influence area. The crash analysis results reveal that there were a total of 307 crashes on I-95 from Baymeadows Road to Bowden Road in the study area during this three-year period (2009 to 2011). Of these 307 crashes, rear-end crashes were the most common type of crash accounting for 38.4% of total crashes. Angle collision, sideswipe and guardrail collision accounted for nearly one-third of the total crashes. The average crash rate for I-95 mainline segment (Section 72280000 MP 9.3 to MP 13.1) is 0.589 and is lower than the statewide average crash rate of 0.694 for similar interstate facilities. A summary of the results of the crash analysis is provided in Appendix C. The crash analysis results reveal that there were a total of 165 crashes on JTB from US 1 to East of Belfort Road in the study area during this three-year period (2009 to 2011). Of these 165 crashes, rear-end crashes were the most common type of crash accounting for 48.5% of total crashes. Angle collision, sideswipe and guardrail collision accounted for nearly one-third of the total crashes. The average crash rate for JTB mainline segment (Section 72292000 MP 0.0 to MP 1.80) is 1.163 and is lower than the statewide average crash rate of 2.428 for similar facilities. A summary of the results of the crash analysis is provided in Appendix C.
3.3.3 HCM Based Operational Analysis
A detailed operational analysis of the Existing Year 2011 using HCM 2010 methodologies was performed for individual roadway elements, i.e., mainline segments, ramp junctions and study intersections. HCS 2010 was used for the operational analysis of mainline segments and ramp junctions. Synchro 8.0 was used for the analysis of study intersections. Figure 3-3 shows the existing lane configuration of the I-95 and JTB mainline, ramps, and study intersections used in the operational analysis. Documentation is provided for the Existing Conditions analysis in Appendix D.
Mainline Analysis
The Existing Year 2011 mainline analysis results are summarized in Table 3-3. I-95 was analyzed as a 6-lane section south of JTB and 8-lane section north of JTB to Bowden Road in 2011. The results of the operational analysis show that all the mainline segments operate at an

3.0 EXISTING CONDITIONS I-95/ J. Turner Butler Blvd IMR
3-7
acceptable LOS in both the 2011 AM and PM peak hours. Figure 3-4 illustrates the peak hour volumes and LOS results for the Existing Year 2011 mainline analysis.
Table 3-3 Existing Year 2011 Mainline Capacity Analysis Summary
Freeway Segment Direction Number of
Lanes AM Peak Hour PM Peak Hour
Volume Density1 LOS Volume Density1 LOS
I-95 Baymeadows to JTB
NB 3 5126 28.3 D 3558 18.3 C
SB 3 3427 17.6 B 5088 28.0 D
I-95 JTB to Bowden
NB 4 6223 24.9 C 4895 18.9 C
SB 4 4731 18.2 C 5395 21.0 C
1. Density = passenger cars/mile/lane
Ramp Analysis
The Existing Year 2011 ramp analysis results are summarized in Table 3-4. The results of the operational analysis show that all the study ramp junctions operate at an acceptable LOS in 2011. Figure 3-4 illustrates the peak hour volumes and LOS results for the Exiting Year 2011 ramp analysis. The westbound JTB to I-95 northbound on ramp and the I-95 southbound off ramp were analyzed as a major merge and major diverge respectively. Both are 2 lane ramps that add a lane on I-95 mainline at the merge in northbound direction and reduce a lane at the diverge in southbound direction. The analysis resulted in a volume to capacity ratio (v/c) of less than 1.0 for upstream, diverging and downstream segments. This indicates that the ramp merge and diverge are functioning with adequate capacity. The I-95 northbound off ramp to Bowden Road and the on ramp from Bowden Road to I-95 southbound are single lane ramps that result in a lane drop at the diverge and lane addition at the merge. These ramps were analyzed as ramp roadways as per HCM definitions. The analysis results indicated that both these ramps are under capacity in 2011.

3.0 EXISTING CONDITIONS I-95/ J. Turner Butler Blvd IMR
3-8
Table 3-4 Existing Year 2011 Ramp Analysis Summary
Interchange Ramp AM Peak Hour PM Peak Hour
Volume Density1 LOS Volume Density1 LOS
I-95/Baymeadows NB On 1037 29.7 D 1260 22.5 C
SB Off 1570 13.0 B 1309 18.6 B
I-95/
JTB
NB Off 1362 34.4 D 920 26.1 C
EB to NB On 185 17.1 B 220 11.5 B
WB to NB On2 2274 v/c = 0.59, 0.54,
and 0.703 2037
v/c = 0.43, 0.48,
and 0.553
SB Off2 2092 v/c = 0.43, 0.49,
and 0.403 1917
v/c = 0.49, 0.45,
and 0.523
WB to SB On 683 22.1 C 1442 32.1 D
EB to SB On 105 16.7 B 168 25.3 C
I-95/
Bowden
NB Off3 979 v/c = 0.52 905 v/c = 0.48
SB On3 761 v/c = 0.39 1078 v/c = 0.55
1. Density = passenger cars/mile/lane 2. Ramp junction was analyzed using a major merge/diverge capacity analysis (v/c) for upstream, merge/diverge, and downstream segments (HCM 2010, Chapter 13).
v/c < 1.0 indicates roadway segment operating under capacity (desirable) v/c > 1.0 indicates roadway segment operating over capacity (undesirable)
3. Ramp junction was analyzed using a ramp roadway capacity analysis (HCM 2010, Chapter 13). v/c < 1.0 indicates roadway segment operating under capacity (desirable)
v/c > 1.0 indicates roadway segment operating over capacity (undesirable)
Intersection Analysis
The Existing Year 2011 intersection analysis results are summarized in Table 3-5. The intersections were analyzed using field signal timing and phasing plans. No signal optimization was performed when analyzing Existing Year 2011 conditions. In Existing Year 2011, there are several intersections within the study area that operate at undesirable LOS of E or F. The Bonneval Road at JTB intersection operates at LOS F during PM peak hour. The JTB at I-95 SB Off/On Ramps operates at LOS F during AM peak hour. The Belfort at JTB WB Off/On Ramps intersection operates at LOS F during AM and PM peak hours while the Belfort at JTB EB Off/On Ramps operates at LOS F during PM peak hour. Figure 3-4 illustrates the peak hour volumes and LOS results for the Existing Year 2011 intersections analysis.

3.0 EXISTING CONDITIONS I-95/ J. Turner Butler Blvd IMR
3-9
Table 3-5 Existing Year 2011 Intersection Analysis Summary
Intersection AM Peak PM Peak
Delay1 LOS Delay1
LOS
Philips Highway at JTB 34.5 C 35.9 D
Bonneval Road at JTB 42.0 D 88.3 F
JTB at I-95 SB Off/On Ramps 85.9 F 70.0 E
Belfort at JTB WB Off/On Ramps 117.8 F 132.5 F
Belfort at JTB EB Off/On Ramps 36.7 D 141.2 F
AC Skinner Parkway at Belfort Road 16.2 B 40.6 D
Southpoint Parkway at Belfort Road 37.7 D 48.8 D
1. Delay = seconds/vehicle

< 3
< 33 >
3 >
< 44 >
< 33 >
1 >
< 1
1 >2 >
1 >
< 2
2 >1 >
2 > 3 >< 3
< 1
< 22 >
< 1
< 2
1 >
< 1
1 >
< 1
1 >
< 2
< 3
A.C. SkinnerPkwy
Southpoint Pkwy
Salisbury Rd
J. Turner Butler Blvd
Belfort Rd
Southpoint Blvd
Bonneval Rd
Philips Hwy
Salisbury Rd
ToBowden Rd
FromBowden Rd
ToBaymeadows Rd
FromBaymeadows Rd
§̈¦95
§̈¦95
Butler BlvdJ. Turner
N. T. S.
Legend
Signalized Intersection
Unsignalized Intersection
Intersection Lane Configuration
Mainline/Ramp Lane CountX >
I-95 / J. Turner Butler BlvdInterchange Modification Report Existing Lane Configuration Figure
3-3

455 (
187)
16 (2
2)
293 (
790)
1,810 (1,788)
135 (225)
402 (334)
641 (
190)
987 (
876)
802 (
340)
673 (
997)
28 (29)
812 (1,066)
127 (
91)
80 (2
9)
647 (
667)102 (
408)
282 (129)
45 (46)
214 (247)
78 (165)
446 (426)
17 (31)
46 (72)
20 (21)
4 (0)
1,578 (1,529)
1,012 (620)
1 (3)
638 (
257)
43 (12)
260 (648)
421 (128)
35 (28)
348 (
737)
37 (56)
1,032 (1,152)
114 (
847)
617 (
918)
458 (
1,068
)
556 (
757)
16 (29)536 (852)
662 (345)
69 (28)
73 (140)
422 (133)
809 (194)
730 (667)
10 (4
9)
69 (6
4)
114 (
496)
19 (16)
13 (16)
260 (174)1,313 (1,642)
1,092 (1,940)
1,661 (1,142)
1,010 (935)
768 (482)577 (151)
323 (110)
124 (142)
362 (370)
244 (470)
9 (25)
B (D)
D (D)
D (F)
F (F)
C (F)X (Y)
F (E)
D (F)
C (D)
3,427(5,088)
5,126(3,558)
6,223(4,895)
979(905)
5,244(3,990)
2,970(4,316)
4,980(3,471)
1,857(3,779)
4,089(2,298)
1,037(1,260)
1,362(920)
185(220)
504(215)
3,970(4,317)
4,731(5,395)
2,092(1,917)
683(1,442)
1,570(1,309)
2,274 (2,037) 4,618 (4,621)1,506 (769)
415 (1,293)
1,454 (790)
3,526 (2,681)
2,186 (1,229)680 (460)
761 (1,078)
105 (168)
UC (UC)
UC (OC)
UC (UC)UC (UC)
UC (UC)
B (D)
D (C)
F (E)
C (C)
D (C)
D (C)
B (B)
C (C)
C (D)
B (C)
B (B)
A.C. SkinnerPkwy
Southpoint Pkwy
Salisbury Rd
J. Turner Butler Blvd
Belfort Rd
Southpoint Blvd
Bonneval Rd
Philips Hwy
Salisbury RdN. T. S.
ToBowden Rd
FromBowden Rd
ToBaymeadows Rd
FromBaymeadows Rd
§̈¦95
§̈¦95
Legend
Butler BlvdJ. Turner
Signalized Intersection
Unsignalized Intersection
OC (UC)
AM (PM) Signalized Intersection Level of ServiceAM (PM) Over Capacity / Under Capacity
X (Y)
X,XXX (X,XXX) AM (PM) Mainline Volume
X (Y)
X (Y)
AM (PM) Ramp Merge Level of ServiceAM (PM) Ramp Diverge Level of Service
X (Y) AM (PM) Mainline Level of Service
FreeYield
I-95 / J. Turner Butler BlvdInterchange Modification Report
Existing Year 2011Peak Hour Volumes and Level of Service
Figure 3-4

3.0 EXISTING CONDITIONS I-95/ J. Turner Butler Blvd IMR
3-12
3.3.4 Microsimulation Based Operational Analysis
A detailed microsimulation analysis using CORSIM (Corridor Simulation) software was conducted in addition to the HCM based operational analysis to evaluate the system-wide operational performance. The CORSIM model was prepared for the Existing Year 2011 AM and PM peak periods. The primary objective of this CORSIM model was to establish the existing operational conditions along I-95, JTB, study interchanges and intersections. The CORSIM microsimulation is intended to supplement the HCM based capacity analysis and to identify any additional operational issues present in the roadway network. Speed data from detectors along I-95 was obtained from The Regional Integrated Transportation Information System (RITIS). Simulated speeds for AM and PM peak hours were compared and matched with RITIS detector speed data. Travel time runs were conducted during AM and PM peak hours to observe the field conditions during peak hours. Existing Year 2011 traffic data was obtained from FTI as well as field counts conducted for this study. Speed charts attached in Appendix E show comparison of CORSIM model speed with the detector speed data. 15 minute volumes were input into the CORSIM model for three hour AM and PM peak periods for Existing Year 2011. The existing traffic distribution obtained from the data collection locations was used to develop traffic for the AM and PM peak periods. Ten model iterations with different random number seeds were executed for the AM and PM models. A brief discussion of the calibration methodology and existing conditions is presented in the following paragraphs. Details such as comparison of demand versus simulated volumes, calibration speed charts, heat diagrams etc are provided in Appendix E.
Existing Conditions CORSIM Model Calibration
Default warning sign distance at JTB exit from I-95 northbound and southbound was modified from the default value of 2500’ to 4500’. Default warning sign distance at Baymeadows Road and Bowden Road exit from I-95 northbound and southbound was modified from the default value of 2500’ to 3500’. These modifications were done to provide traffic enough distance to get correctly positioned in the appropriate lane for the downstream exit. Default Car Following Factor was modified between 120 and 180 in order to replicate friction in the corridor. Default minimum acceleration lane speed to trigger upstream anticipatory lane changes and distance to reaction points were changed from 43 and 1500’ to range of 55-65 and 2500’ to replicate aggressive lane change behavior in the field. Adjustments to the existing conditions CORSIM model were validated by comparing peak hour demand volume with the simulated volume and total three hour throughput with three hour simulated volumes. Peak hour simulated volumes and total throughputs are simulated to within + 10% of the demand volumes for I-95 and JTB mainline.

3.0 EXISTING CONDITIONS I-95/ J. Turner Butler Blvd IMR
3-13
The following sections provide a summary of the operational performance based on the CORSIM modeling results. Documentation for the Existing Year 2011 microsimulation analysis is provided in Appendix E. The following CORSIM MOEs were used to evaluate the network’s operational performance:
• Freeways o Traffic Volume Throughput o Mainline Density and Speed
• Arterials o Movement Delay o Approach Delay o Total Intersection Delay
I-95 Freeway Operational Performance
The CORSIM model results, presented in Tables 3-6 and 3-7, indicate that there are operational deficiencies on the I-95 mainline in the existing traffic conditions. The CORSIM model results show relatively low link speeds and high link densities indicating that there are operational deficiencies on the I-95 northbound and southbound mainline under the existing traffic conditions in the area of influence. As shown in the AM peak hour I-95 lane schematic, in the northbound direction, the deficiency is found downstream of the JTB westbound entrance. The high densities found immediately downstream of the entrance ramp indicate recurring congestion in AM peak. In the northbound direction, lower speeds and higher densities were also observed immediately upstream of the JTB exit in the AM peak (highlighted in Table 3-6 and lane schematic). In the southbound direction, the deficiency is found at the I-95 southbound off ramp terminal intersection of JTB interchange. The PM peak hour I-95 lane schematic illustrates how queues from the ramp terminal intersection extend to the I-95 southbound mainline affecting mainline operations (highlighted in Table 3-7).

321
Distance (ft) 1401 1357 1370 1325 1325 1845 1165 1505 1503 1504 1505 1323 890 797 1411 1355 1330 1497 1502 1432 1072 1274 943 906
Speed (mph) 64 68 67 68 68 64 66 67 67 67 64 62 57 62 62 57 60 61 62 62 62 62 63 63
Density (veh/ln/mi) 10 7 7 8 8 12 16 15 15 15 15 16 13 13 13 17 19 19 21 21 21 21 20 21
323 322336 335 324334 333 332 331 330 325345 326329 328 327343 342 341 340 339 338344 337
Baymeadows SR 202/
Road Baymeadows SR 202/ SR 202/ JT Butler Blvd
Entrance Road JT Butler Blvd JT Butler Blvd Exit Bowden Road
294 vph Exit EB Entrance WB Entrance 2092 vph Entrance
630 ft 1570 vph 105 vph 683 vph 1100 ft 761 vph2600 ft 10 1770 ft 420 ft 850 ft 10
9 9 9 9 9 9 9 9
1 1 1 1 1 1 1 1 1 1 1 1 1 1 1 1 1 1 1 1 1 1 1
2 2 2 2 2 2 2 2 2 2 2 2 2 2 2 2 2 2 2 2 2 2 2
Simulated Volumes 2054 3 2055 3 2057 3 1779 3 1780 3 3297 3 3300 3 3302 3 3306 3 3308 3 3313 3 3225 3 3229 3 2610 3 2616 3 4727 4724 3 4727 3 3969 3 3968 3 3968 3 3969 3 3971 3 3969 3
Demand Volumes 2151 2151 2151 1857 1857 3427 3427 3427 3427 3427 3427 3322 3322 2639 2639 4731 4731 4731 3970 3970 3970 3970 3970 3970
Demand Volumes 5697 5697 5697 4689 4689 5726 5726 5726 5726 5726 5726 4364 4549 4549 6823 6823 6823 5844 5844 5844 5844 5844 5844
Simulated Volumes 3 5704 3 5707 5707 3 4566 3 4568 3 5565 3 5566 3 5571 3 5575 3 5575 5572 3 4139 3 4316 3 4318 3 6474 3 6489 3 6506 3 5483 3 5498 3 5515 3 5521 3 5526 3 5530
2 2 2 2 2 2 2 2 2 2 2 2 2 2 2 2 2 2 2 2 2
1 1 1 1 1 1 1 1 1 1 1 1 1 1 1 1 1 1 1 1 1
9 9 9 9 9 9 9
200 ft 360 ft 200 ft 1300 ft 10
Baymeadows Baymeadows SR 202/ SR 202/ 780 ft Bowden Road
Road Road JT Butler Blvd JT Butler Blvd SR 202/ Exit
Exit Entrance Exit EB Entrance JT Butler Blvd 979 vph
I-95 Southbound
Exit Entrance Exit EB Entrance JT Butler Blvd 979 vph
1008 vph 1037 vph 1362 vph 185 vph WB Entrance
2274 vph
Distance (ft) 1427 1426 1427 1562 931 1625 1623 1560 1558 1331 1331 1813 1380 610 1581 1581 1560 1615 1616 1573 686 953 902
Speed (mph) 62 60 57 61 61 57 60 57 57 52 46 35 31 35 41 39 38 43 46 47 51 57 61
Density (veh/ln/mi) 29 30 30 23 24 29 29 31 31 34 38 39 34 38 35 43 42 41 38 38 34 31 29
143
511 Node Number Freeway Geometric Coloring
Density (Veh/Mi/Ln)
20 and below Density above 75
20 - 30 Density above 45
30 - 45 Density above 35
I-95 Northbound
132 133 135 136 137199 129 134
LEGEND
Speed (mph)
121 122 123 124 125 126 140 141 142130 131 138 139127 128
45 and above
900 Demand volume highlighted if simulated falls below = 90%
809 Simulated volume
I-95/ SR 202/JT Butler Boulevard Interchange Modification Report
AM Peak Hour MOE'sI-95 Lane Schematic
Existing Year 2011 Base Model
Existing 2011 AM Peak Hour Lane Schematic
Page 1 of 2

3.0 EXISTING CONDITIONS I-95/ J. Turner Butler Blvd IMR
3-15
Table 3-6 Existing Year 2011 Northbound I-95 Freeway MOEs
From ToDistance
(ft)
Speed
(mph)
Density
(vplpm)
Speed
(mph)
Density
(vplpm)
I-95 Northbound Begins 1427 62 29 64 15
1426 60 30 63 14
Baymeadows Road Exit 1427 57 30 62 14
Baymeadows Road Exit 1562 61 23 63 12
Baymeadows Road Entrance 931 61 24 63 12
Baymeadows Road Entrance 1625 57 29 60 18
1623 60 29 62 18
1560 57 31 61 19
1558 57 31 62 19
1331 52 34 61 19
SR 202/JT Butler Blvd Exit 1331 46 38 60 18
SR 202/JT Butler Blvd ExitSR 202/JT Butler Blvd EB
Entrance1813 35 39 62 14
SR 202/JT Butler Blvd EB Entrance 1380 31 34 61 12
SR 202/JT Butler Blvd WB Entrance 610 35 38 61 15
SR 202/JT Butler Blvd WB Entrance 1581 41 35 56 19
1581 39 43 61 20
Bowden Road Exit 1560 38 42 58 20
Bowden Road Exit 1615 43 41 61 21
1616 46 38 61 21
1573 47 38 61 21
686 51 34 61 21
953 57 31 62 21
I-95 Northbound Ends 902 61 29 63 20
PMFreeway Segment Link AM

321
Distance (ft) 1401 1357 1370 1325 1325 1845 1165 1505 1503 1504 1505 1323 890 797 1411 1355 1330 1497 1502 1432 1072 1274 943 906
Speed (mph) 61 65 64 66 65 64 64 65 66 63 58 58 50 58 57 31 46 53 59 61 61 62 63 63
Density (veh/ln/mi) 28 20 18 21 22 22 28 28 28 29 29 31 27 23 24 47 39 34 28 27 27 27 26 27
345 326329 328 327343 342 341 340 339 338344 337 323 322336 335 324334 333 332 331 330 325
Baymeadows SR 202/
Road Baymeadows SR 202/ SR 202/ JT Butler Blvd
Entrance Road JT Butler Blvd JT Butler Blvd Exit Bowden Road
887 vph Exit EB Entrance WB Entrance 1917 vph Entrance
630 ft 1309 vph 168 vph 1442 vph 1100 ft 1078 vph2600 ft 10 1770 ft 420 ft 850 ft 10
9 9 9 9 9 9 9 9
1 1 1 1 1 1 1 1 1 1 1 1 1 1 1 1 1 1 1 1 1 1 1
2 2 2 2 2 2 2 2 2 2 2 2 2 2 2 2 2 2 2 2 2 2 2
Simulated Volumes 5118 3 5117 3 5116 3 4257 3 4262 3 5524 3 5520 3 5523 3 5527 3 5532 3 5533 3 5388 3 5386 3 4119 3 4121 3 6065 6047 3 6063 3 4990 3 5001 3 5003 3 5005 3 5008 3 5008 3
Demand Volumes 5366 5366 5366 4479 4479 5788 5788 5788 5788 5788 5788 5620 5620 4178 4178 6095 6095 6095 5017 5017 5017 5017 5017 5017
Demand Volumes 2748 2748 2748 2298 2298 3558 3558 3558 3558 3558 3558 2638 2858 2858 4895 4895 4895 3990 3990 3990 3990 3990 3990
Simulated Volumes 3 2750 3 2751 2753 3 2304 3 2305 3 3440 3 3438 3 3435 3 3435 3 3440 3443 3 2550 3 2757 3 2757 3 4724 3 4723 3 4725 3 3830 3 3827 3 3825 3 3825 3 3829 3 3827
2 2 2 2 2 2 2 2 2 2 2 2 2 2 2 2 2 2 2 2 2
1 1 1 1 1 1 1 1 1 1 1 1 1 1 1 1 1 1 1 1 1
9 9 9 9 9 9 9
200 ft 360 ft 200 ft 1300 ft 10
Baymeadows Baymeadows SR 202/ SR 202/ 780 ft Bowden Road
Road Road JT Butler Blvd JT Butler Blvd SR 202/ Exit
Exit Entrance Exit EB Entrance JT Butler Blvd 905 vph
I-95 Southbound
Exit Entrance Exit EB Entrance JT Butler Blvd 905 vph
450 vph 1260 vph 920 vph 220 vph WB Entrance
2037 vph
Distance (ft) 1427 1426 1427 1562 931 1625 1623 1560 1558 1331 1331 1813 1380 610 1581 1581 1560 1615 1616 1573 686 953 902
Speed (mph) 64 63 62 63 63 60 62 61 62 61 60 62 61 61 56 61 58 61 61 61 61 62 63
Density (veh/ln/mi) 15 14 14 12 12 18 18 19 19 19 18 14 12 15 19 20 20 21 21 21 21 21 20
143
511 Node Number Freeway Geometric Coloring
Density (Veh/Mi/Ln)
20 and below Density above 75
20 - 30 Density above 45
30 - 45 Density above 35
121 122 123 124 125 126 140 141 142130 131 138 139127 128
I-95 Northbound
132 133 135 136 137199 129 134
LEGEND
Speed (mph)
45 and above
900 Demand volume highlighted if simulated falls below = 90%
809 Simulated volume
I-95/ SR 202/JT Butler Boulevard Interchange Modification Report
PM Peak Hour MOE'sI-95 Lane Schematic
Existing Year 2011 Base Model
Existing 2011 PM Peak Hour Lane Schematic
Page 1 of 2

3.0 EXISTING CONDITIONS I-95/ J. Turner Butler Blvd IMR
3-17
Table 3-7 Existing Year 2011 Southbound I-95 Freeway MOEs
JTB Freeway Operational Performance
The CORSIM model results, presented in Tables 3-8 and 3-9, indicate that there are operational deficiencies on the JTB westbound mainline in the existing traffic conditions. In the westbound direction, recurring congestion is found downstream of the JTB merge with Belfort Road during AM and PM peak hours. Complex maneuvers such as weaving and lane changes occurring in this segment due to the downstream multiple destinations (exit to I-95 northbound, exit to I-95 southbound and Philips Highway) result in the decreased speed and higher densities on the JTB westbound mainline (highlighted in Table 3-9). CORSIM model results indicate that, the combined queue in the westbound direction from the JTB westbound/ Belfort Road merge extend up to Belfort Road exit affecting JTB westbound mainline operations during both peak hours as illustrated in the JTB lane schematics. The I-95 southbound off ramp terminal intersection also has extensive queues during AM and PM peak hours.
From ToDistance
(ft)
Speed
(mph)
Density
(vplpm)
Speed
(mph)
Density
(vplpm)
I-95 Southbound Begins 906 63 21 63 27
943 63 20 63 26
1274 62 21 62 27
1072 62 21 61 27
1432 62 21 61 27
Bowden Road Entrance 1502 62 21 59 28
Bowden Road Entrance 1497 61 19 53 34
1330 60 19 46 39
SR 202/JT Butler Blvd Exit 1355 57 17 31 47
SR 202/JT Butler Blvd Exit 1411 62 13 57 24
SR 202/JT Butler Blvd WB Entrance 797 62 13 58 23
SR 202/JT Butler Blvd WB Entrance 890 57 13 50 27
SR 202/JT Butler Blvd EB Entrance 1323 62 16 58 31
SR 202/JT Butler Blvd EB Entrance 1505 64 15 58 29
1504 67 15 63 29
1503 67 15 66 28
1505 67 15 65 28
1165 66 16 64 28
Baymeadows Road Exit 1845 64 12 64 22
Baymeadows Road Exit 1325 68 8 65 22
Baymeadows Road Entrance 1325 68 8 66 21
Baymeadows Road Entrance 1370 67 7 64 18
1357 68 7 65 20
I-95 Southbound Ends 1401 64 10 61 28
PMFreeway Segment Link AM
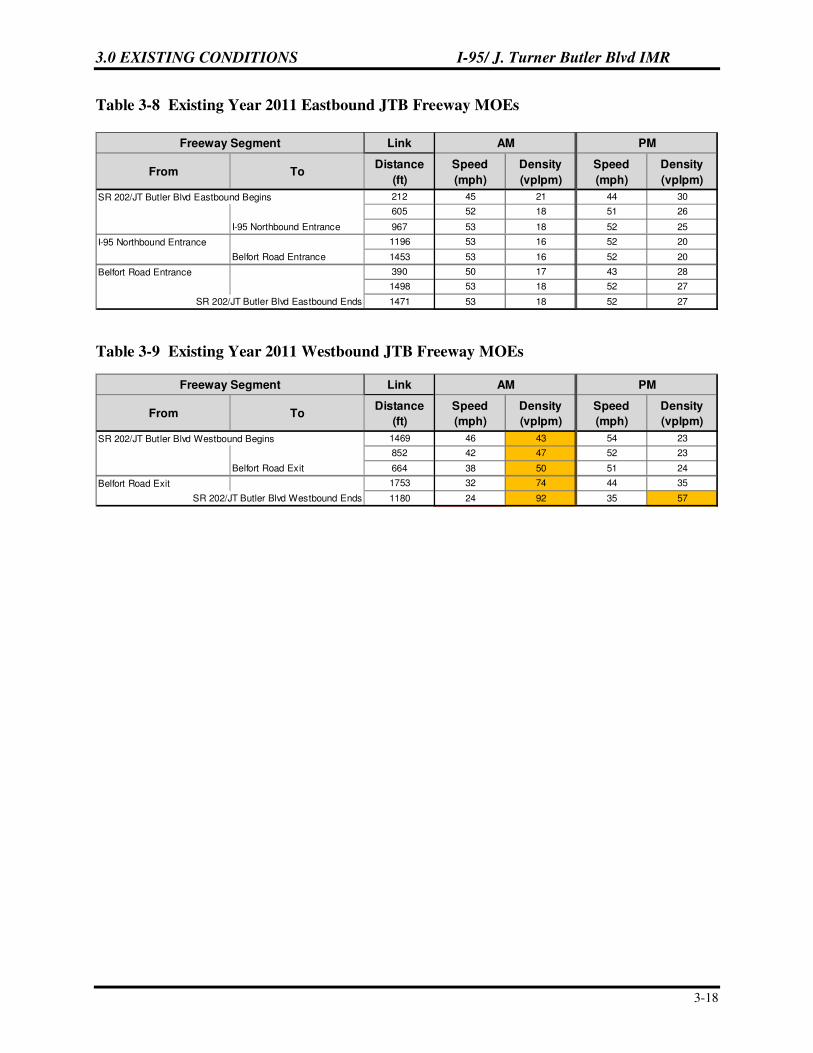
3.0 EXISTING CONDITIONS I-95/ J. Turner Butler Blvd IMR
3-18
Table 3-8 Existing Year 2011 Eastbound JTB Freeway MOEs
Table 3-9 Existing Year 2011 Westbound JTB Freeway MOEs
From ToDistance
(ft)
Speed
(mph)
Density
(vplpm)
Speed
(mph)
Density
(vplpm)
SR 202/JT Butler Blvd Eastbound Begins 212 45 21 44 30
605 52 18 51 26
I-95 Northbound Entrance 967 53 18 52 25
I-95 Northbound Entrance 1196 53 16 52 20
Belfort Road Entrance 1453 53 16 52 20
Belfort Road Entrance 390 50 17 43 28
1498 53 18 52 27
SR 202/JT Butler Blvd Eastbound Ends 1471 53 18 52 27
PMFreeway Segment Link AM
From ToDistance
(ft)
Speed
(mph)
Density
(vplpm)
Speed
(mph)
Density
(vplpm)
SR 202/JT Butler Blvd Westbound Begins 1469 46 43 54 23
852 42 47 52 23
Belfort Road Exit 664 38 50 51 24
Belfort Road Exit 1753 32 74 44 35
SR 202/JT Butler Blvd Westbound Ends 1180 24 92 35 57
PMFreeway Segment Link AM
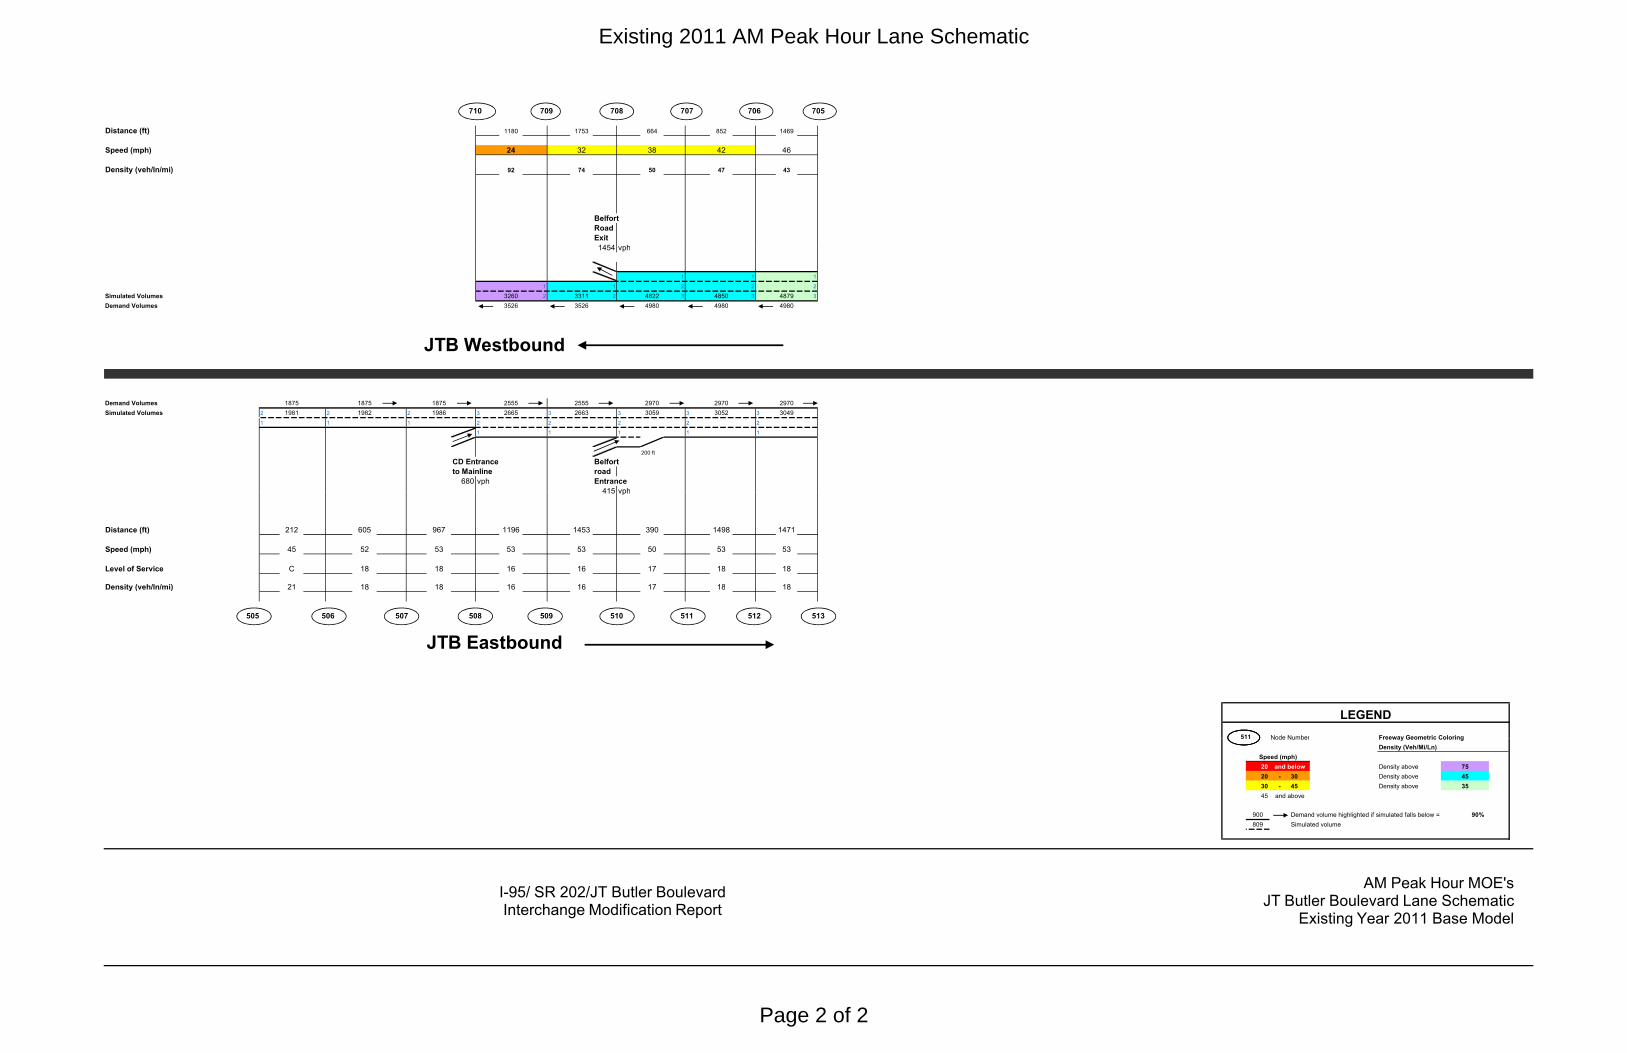
Distance (ft) 1180 1753 664 852 1469
Speed (mph) 24 32 38 42 46
Density (veh/ln/mi) 92 74 50 47 43
Belfort
Road
Exit
1454 vph
706 705710 709 708 707
1454 vph
1 1 1
1 1 2 2 2
Simulated Volumes 3260 2 3311 2 4822 3 4850 3 4879 3
Demand Volumes 3526 3526 4980 4980 4980
Demand Volumes 1875 1875 1875 2555 2555 2970 2970 2970
Simulated Volumes 2 1981 2 1982 2 1986 3 2665 3 2663 3 3059 3 3052 3 3049
1 1 1 2 2 2 2 2
1 1 1 1 1
200 ft
CD Entrance Belfort
to Mainline road
680 vph Entrance
415 vph
JTB Westbound
415 vph
Distance (ft) 212 605 967 1196 1453 390 1498 1471
Speed (mph) 45 52 53 53 53 50 53 53
Level of Service C 18 18 16 16 17 18 18
Density (veh/ln/mi) 21 18 18 16 16 17 18 18
511 Node Number Freeway Geometric Coloring
LEGEND
JTB Eastbound
505 506 507 508 509 510 511 512 513
511 Node Number Freeway Geometric Coloring
Density (Veh/Mi/Ln)
20 and below Density above 75
20 - 30 Density above 45
30 - 45 Density above 35
45 and above
900 Demand volume highlighted if simulated falls below = 90%
809 Simulated volume
Speed (mph)
I-95/ SR 202/JT Butler Boulevard Interchange Modification Report
AM Peak Hour MOE'sJT Butler Boulevard Lane Schematic
Existing Year 2011 Base Model
Existing 2011 AM Peak Hour Lane Schematic
Page 2 of 2

Distance (ft) 1180 1753 664 852 1469
Speed (mph) 35 44 51 52 54
Density (veh/ln/mi) 57 35 24 23 23
Belfort
Road
Exit
796 vph
706 705710 709 708 707
796 vph
1 1 1
1 1 2 2 2
Simulated Volumes 2923 2 2929 2 3728 3 3729 3 3729 3
Demand Volumes 2931 2931 3727 3727 3727
Demand Volumes 2573 2573 2573 3033 3033 4326 4326 4326
Simulated Volumes 2 2634 2 2637 2 2637 3 3101 3 3093 3 4264 3 4263 3 4259
1 1 1 2 2 2 2 2
1 1 1 1 1
200 ft
CD Entrance Belfort
to Mainline road
460 vph Entrance
1293 vph
JTB Westbound
1293 vph
Distance (ft) 212 605 967 1196 1453 390 1498 1471
Speed (mph) 44 51 52 52 52 43 52 52
Level of Service D 26 25 20 20 28 27 27
Density (veh/ln/mi) 30 26 25 20 20 28 27 27
511 Node Number Freeway Geometric Coloring
JTB Eastbound
505 506 507 508 509 510 511 512 513
LEGEND
511 Node Number Freeway Geometric Coloring
Density (Veh/Mi/Ln)
20 and below Density above 75
20 - 30 Density above 45
30 - 45 Density above 35
45 and above
900 Demand volume highlighted if simulated falls below = 90%
809 Simulated volume
Speed (mph)
I-95/ SR 202/JT Butler Boulevard Interchange Modification Report
PM Peak Hour MOE'sJT Butler Boulevard Lane Schematic
Existing Year 2011 Base Model
Existing 2011 PM Peak Hour Lane Schematic
Page 2 of 2

3.0 EXISTING CONDITIONS I-95/ J. Turner Butler Blvd IMR
3-21
Arterial Operational Performance
The results of the CORSIM arterial operational analysis indicate that all the study intersections operate acceptably in the Existing Year 2011 AM and PM peak hours except for Belfort Road at Southpoint Parkway intersection. Table 3-10 provides a summary of the CORSIM MOEs for the study area intersections during the AM and PM peak hours. Table 3-10 Existing Year 2011 Arterial MOEs (Control Delay)
1. Control Delay is in terms of seconds/vehicle
2. Intersection delay greater than the threshold value of 55 sec/veh, which is considered undesirable
3. Queue from the I-95 southbound off ramp intersection extends to I-95 southbound mainline. Control delay from
CORSIM does not accurately represent intersection delay since all the traffic is not processed at the off ramp and
the intersection. Synchro/Capacity analysis show that this intersection operates at LOS F.
L T R D L T R D
WB 902-901 46 - 34 - 42 53 - 45 - 50
NB 966-901 - 30 7 - 21 29 - 32 6 - 26 33
SB 967-901 60 12 - - 28 56 14 - - 24
WB 978-902 69 1 0 - 28 88 25 12 - 31
EB 901-902 88 25 7 - 26 33 83 24 3 - 26 9
NB 923-902 80 133 48 - 53 68 94 66 - 67
SB 924-902 78 68 25 - 65 88 46 20 - 74
EB 900-903 - 37 - - 37 - 33 - - 33
WB 904-903 - 24 - 34 27 31 - 19 - 20 19 313
SB 927-903 30 - 30 - 30 39 - 47 - 40
EB 909-910 82 60 46 - 65 50 - 18 - 43
SB 911-910 0 20 - - 15 41 0 2 - - 1 20
NB 975-910 - 63 2 68 54 - 32 5 35 25
NB 910-911 8 2 - - 4 0 4 - - 2
WB 912-911 62 65 - - 63 41 40 50 - - 45 53
SB 941-911 - 69 - 64 67 - 101 - 151 137
NB 910-917 9 6 6 - 7 16 6 4 - 9
EB 939-917 12 12 7 - 12 12 10 16 16 - 16 19
WB 948-917 33 38 13 - 31 31 34 13 - 31
SB 949-917 40 45 3 - 13 41 46 22 - 24
SB 940-918 48 23 7 - 23 104 90 74 - 90
NB 972-918 56 23 2 - 38 30 67 52 2 - 51 892
EB 950-918 37 39 12 - 19 156 147 182 - 176
WB 951-918 40 37 32 - 39 51 46 45 - 50
SB 920-919 105 16 - - 20 102 9 - - 21
EB 955-919 - 35 2 - 31 36 - 27 4 - 21 29
EB 956-919 49 - 76 - 65 56 - 48 - 54
WB 919-920 57 17 - - 23 30 1 - - 7
NB 959-920 - 36 3 30 25 29 - 12 2 11 8 11
NB 960-920 53 - 19 - 46 72 - 20 - 43
EB 922-921 16 0 - - 5 38 0 - - 13
EB 963-921 - 12 11 - 12 7 - 4 5 - 4 9
WB 921-922 - 35 - - 35 - 9 - - 9
NB 964-922 - 16 - - 16 20 - 13 - - 13 16
SB 965-922 22 - 11 - 16 38 - 14 - 24
Location
WB JTB @ Belfort Road
JTB @ Philips Highway
JTB @ Bonneval Rd
Intersection Approach Link Approach
Baymeadows Road @ I-95 NB
off ramps
Bowden Road @ I-95 SB off
ramps
Bowden Road @ I-95 NB off
ramps
Total Delay by Movement
Belfort Road @ A C Skinner
Pkwy
Belfort Road @ Southpoint Dr
Baymeadows Road @ I-95 SB
off ramps
JTB @ SB I-95 Off ramp
EB JTB @ Belfort Road
Intersection Approach Intersection
PM Peak Control Delay1
Total Delay by Movement
AM Peak Control Delay1
3.0 EXISTING CONDITIONS I-95/ J. Turner Butler Blvd IMR
3-22
3.4 Existing Environmental Conditions
In 2011, a Project Development Summary Report (PDSR) and Type 2 Categorical Exclusion were prepared for this project and approved by FHWA. This project has been screened through the ETDM programming screen. In discussions with FHWA, it has been determined that the current effort will be a reevaluation of the previously approved NEPA document. The base information regarding the existing environmental conditions for the area of influence were extracted from Geographical Information System (GIS) datasets maintained by the Florida Geographic Data Library (FGDL) and Florida Natural Area Inventory (FNAI). In addition, project wetland limits within the study area were determined based on aerial photo interpretation and limited field-trusting methodologies. Additional resources used during this process included the U.S. Fish and Wildlife Services’ National Wetland Inventory maps and the U.S. Geological Service’s Soil Survey. The following is a brief summary of the environmental findings from the PDSR.
3.4.1 Community Data and Socioeconomics
Northern Duval County within the area of influence is a mix of residential, business and
commercial communities. Level II aesthetics are anticipated and will be addressed as part of the
bridge development reports being prepared for this project.
3.4.2 Cultural Resources
There are no religious centers, archeological sites and cemeteries in the study area and no
impacts are anticipated as part of this project.
3.4.3 Natural Environment
Wetlands and Floodplains
Wetlands are a primary concern for potential natural impacts. Regulatory and permitting agencies require avoidance and minimization measures during the planning and design phases of roadway projects, and compensation measures for unavoidable wetland impacts. Special considerations were taken in developing and evaluating the I-95/JTB interchange alternatives to avoid and minimize the environmental impacts associated with this project. There will be 12.7 acres of direct impacts and 4.7 acres of secondary impacts to wetlands through the roadway or proposed pond construction. Unavoidable wetland impacts resulting from this project will be mitigated pursuant to Section 373.4137, F.S. to satisfy all mitigation requirements of Part VI, Chapter 373, F.S. and U.S.C. Section 1344. The use of Section 373.4137, F.S. for mitigation of wetland impact issues associated with this project will occur between FDOT, U.S. Army Corp of Engineers and the St. Johns River Water Management District. Wetland mitigation concepts for impacts will be addressed through pre-application meetings with the U.S. Army Corp of Engineers and the St. Johns River Water Management District. Typically mitigation requirements are based on a compilation of wetland parameters including quality, type, function and size.
3.0 EXISTING CONDITIONS I-95/ J. Turner Butler Blvd IMR
3-23
There are no floodplains within the project area as identified by the Federal Emergency Management Agency’s (FEMA) National Flood Insurance Rate. There are no regulatory floodways associated with this project.
Threatened and Endangered Species and Conservation Areas
No significant wildlife or habitat impacts are anticipated due to this project. There are no conservation areas or farmlands within the interchange study area of influence.
Air Quality
According to the most recent EPA-published data, the I-95/JTB interchange area of influence is located within the area that has been designated as currently in compliance with federal air quality standards for all listed pollution criteria pollutants. Duval County is not currently listed as an air quality maintenance area. The PDSR assessed the potential air quality impacts of the proposed interchange improvements. The results of the assessment indicated that there are no recognized air quality concerns within the area of influence.
Contamination
A Phase 1 contamination screening evaluation for the project showed that there are at least 3 sites – Weatherby Tool and Die, First Coast Energy LLP and Sunshine Food Mart that have a “High” rating. A detailed sampling strategy will need to be developed during the design and construction for each property to address any contaminants in the subsurface that could impact roadway or ponds construction.
3.5 Consistency with Master Plans, LRTP, LGCP and DRIs
This IMR will consider all programmed and planned roadway improvements in the area. These capacity improvements would be consistent with those specified in the regional transportation plans including the following:
• FDOT five year work program
• FDOT SIS plans
• Duval County Comprehensive Plan
• Committed improvements from local and private sources
• Duval County access management plans.
• North Florida TPO The need for improvements at the I-95/JTB interchange has been identified in the TPO’s 2035 Cost Feasible LRTP. There are no major improvements outlined in the LRTP and also no major developments proposed in the study area between Opening Year 2015 and Design Year 2035.

4.0 NEED I-95/ J. Turner Butler Blvd IMR
4-1
4.0 NEED
I-95, a north/south facility, is an integral part of the Strategic Intermodal System (SIS) providing for high-speed and high-volume traffic movements within the State. JTB is a 4/6 lane facility on the SIS extending from Philips Highway to SR A1A in Jacksonville Beach and includes a bridge over the Intracoastal Waterway. JTB is a limited access facility except for the half mile section from I-95 to Philips Highway. Both I-95 and JTB carry high volume of traffic with daily traffic exceeding 100,000 vehicles. Jacksonville’s Southside is one of the fastest growing regions in the metropolitan area and, in recent years, congestion on JTB has extended well beyond normal peak hours and onto the local street network. The proposed improvement modification is needed to correct existing deficiencies and accommodate increasing traffic demands and congestion generated by rapid growth and development in southern Duval County and northern St. Johns County. Several improvement needs have been identified at and around the I-95/JTB interchange that this IMR aims to address. Currently, the I-95 southbound to JTB eastbound movement and westbound is controlled by the signalized ramp terminal intersection. During peak hours, significant queuing develops and spills back onto the I-95 mainline creating operational and potential safety concerns. Queues have been observed to extend over 0.50 mile upstream of the off ramp along the southbound lanes on I-95. The current interchange configuration does not provide for the I-95 northbound to JTB westbound left turn movement. Commuters have to make a right turn at the off ramp and are directed to the Belfort Road interchange to perform a U-turn in order to travel westbound on JTB. The left turn lane will be provided as part of this IMR to create a full movement interchange with I-95. Several weave movements occur within the interchange area impacting operations and safety of the interchange. Along JTB westbound, a complex weave is formed between the Belfort Road on-ramp to JTB and off ramp to I-95. The Belfort Road on-ramp to JTB conflicts with the right-hand off-ramp to I-95 northbound traffic and the loop off-ramp to I-95 southbound. In the eastbound direction, a complex weave exists on the JTB collector-distributor (C-D) road between the I-95 northbound off ramp and the left-hand off-ramp to JTB. The JTB eastbound lane converges with an I-95 ramp add-lane to form two lanes and the low speed Salisbury Road off-ramp exits from the right lane within a short distance of approximately 200 feet of the I-95 ramp gore. Also the off-ramp to JTB approximately 1,100 feet from the I-95 ramp gore creates a weave movement. The combination of these geometric elements has contributed to high crash frequencies on this roadway segment. Traffic conditions are expected to worsen as growth continues to occur leading to worsening of these operational issues. Safety analysis conducted using the last three years of crash data shows that rear-end, angle and side swipe crashes are the most prevalent type of collision recorded over the analysis period, accounting for more than two third of all crashes which were recorded. Rear end crash type is usually an indicator of excessive queuing of vehicles and congested roadways. A majority of the

4.0 NEED I-95/ J. Turner Butler Blvd IMR
4-2
crashes occurred at or near the merge and diverge areas associated with the entrance and exit ramps at the I-95/JTB interchange. JTB provides the primary east-west access route from I-95 to the Jacksonville Beaches and northern St. Johns County. It is a critical hurricane and emergency evacuation route for residents, employees and visitors. By providing an improved interchange and transportation corridor, evacuation and emergency efforts will be facilitated.

5.0 NO-BUILD CONDITIONS I-95/ J. Turner Butler Blvd IMR
5-1
5.0 NO-BUILD CONDITIONS
This section documents the future conditions within the I-95/JTB interchange Modification area of influence for the No-Build Alternative. The No-Build Alternative assumes the existing plus committed roadway network. This section includes a summary of future land use and development plans as well as the transportation improvements programmed for the area roadways. The analysis years considered under the No-Build Alternative are Opening Year 2015, Interim Year 2025 and Design Year 2035. The operational analysis includes the future year daily and peak hour traffic forecasts for the area of influence. The primary objective of this analysis was to establish the No-Build operational conditions along I-95 and at the study interchanges and intersections.
5.1 Future Land Use
Land in the vicinity of the study interchange is mostly built out and includes commercial and business mix of land uses. The future land use around the interchange also is predominantly commercial. Future land use is consistent with the currently adopted land use plans and is shown on Figure 5-1.

5.0 NO-BUILD CONDITIONS I-95/ J. Turner Butler Blvd IMR
5-2
Figure 5-1 Future Land Use

5.0 NO-BUILD CONDITIONS I-95/ J. Turner Butler Blvd IMR
5-3
5.2 Future Transportation Network
The North Florida TPO plays a critical role in addressing regional transportation issues, convening stakeholders, and identifying the long-term transportation needs within Duval, and portions of Nassau, St. Johns and Clay Counties. It also serves as the coordinating forum for all of the local governments in the counties for matters relating to the maintenance and development of the county’s transportation network. Together they establish long-term planning goals and objectives, set priorities, and identify the agency(s) with responsibility for funding and implementing needed transportation improvements. The North Florida TPO is also responsible for maintaining the FSUTMS based NERPM model. Updates to the roadway network in NERPM are based on projects identified in the TPOs current adopted LRTP Cost Feasible Plan. Currently there are no projects identified in the 2035 LRTP Cost Feasible Plan and the Duval County Five Year Work Plan within the I-95/JTB interchange Modification area of influence.
5.3 No-Build Design Traffic
The No-Build Design traffic for years 2015, 2025, and 2035 was developed using the NERPM model. The future year No-Build AADTs for 2015, 2025, and 2035 are shown in Figure 5-2. Peak hour traffic forecasts were developed by applying the Standard K and D30 factors listed in Section 2.5. Future Year No-Build AM and PM peak hour volumes for 2015, 2025, and 2035 are shown in Figures 5-4, 5-5, and 5-6 respectively.

a. 19,500b. 23,300c. 27,800
a. 7,400b. 8,400c. 9,800
a. 16,200b. 19,100c. 23,100
a. 36,500b. 42,000c. 49,000
a. 29,100b. 33,600c. 39,200
a. 23,600b. 27,500c. 32,900
a. 17,800b. 21,200c. 25,300
a. 10,000b. 13,000c. 16,000
a. 46,500b. 55,000c. 65,000
a. 46,500b. 55,000c. 65,000
a. 10,000b. 13,000c. 16,000
a. 62,000b. 71,600c. 80,500a. 13,000
b. 16,000c. 20,000
a. 75,000b. 87,600c. 100,500
a. 5,800b. 6,700c. 7,800
a. 21,700b. 25,200c. 29,300
a. 13,500b. 16,500c. 20,400
a. 61,000b. 72,200c. 83,800
a. 14,600b. 17,400c. 20,800
a. 46,400b. 54,800c. 63,000
a. 46,400b. 54,800c. 63,000
a. 14,600b. 17,400c. 20,800
a. 61,000b. 72,200c. 83,800
a. 2,600b. 3,400c. 4,200
a. 10,900b. 13,100c. 16,200
a. 27,500b. 31,900c. 37,100
a. 75,000b. 87,600c. 100,500
a. 13,000b. 16,000c. 20,000
a. 62,000b. 71,600c. 80,500
N. T. S.
Phillips Hwy
Bonneval Rd
Salisbury Rd
Southpoint Blvd Belfort Rd
ToBowden RdFrom
Bowden Rd
ToBaymeadows Rd
FromBaymeadows Rd
§̈¦95
J. Turner Butler Blvd
§̈¦95
Legend
Butler BlvdJ. Turner
Design Year 2035 AADT Volumec. X,XXX
Interim Year 2025 AADT Volumeb. X,XXX
Opening Year 2015 AADT Volumea. X,XXX
Salisbury Rd
Southpoint Pkwy
A.C. SkinnerPkwy
I-95 / J. Turner Butler BlvdInterchange Modification Report No-Build Annual Average Daily Traffic (AADT) Figure
5-2

5.0 NO-BUILD CONDITIONS I-95/ J. Turner Butler Blvd IMR
5-5
5.4 Individual Element No-Build Operational Analysis
An individual element operational analysis was conducted for the No-Build Alternative using Highway Capacity Manual (HCM) 2010 methodologies. Highway Capacity Software (HCS) was used to perform a capacity analysis for the mainline and ramps within the study area. Synchro 8.0 was used to analyze the study intersections. The results of this detailed analysis are presented in the following sections. Figure 5-3 illustrates the mainline, ramp, and study intersection lane configurations for Opening Year 2015, Interim Year 2025, and Design Year 2035. Documentation for the No-Build Alternative analysis is provided in Appendix F.
5.4.1 2015 No-Build Analysis
Mainline
The Opening Year 2015 No-Build mainline analysis is summarized in Table 5-1. I-95 was analyzed as a 6-lane section south of JTB and 8-lane section north of JTB to Bowden Road in 2015. The results of the operational analysis show that all the mainline segments operate at an acceptable LOS in both the 2015 No-Build AM and PM peak hours. Figure 5-4 illustrates the peak hour volumes and LOS results for the 2015 No-Build mainline analysis. Table 5-1 Opening Year 2015 No-Build Mainline Analysis Summary
Freeway Segment Direction Number of
Lanes AM Peak Hour PM Peak Hour
Volume Density1 LOS Volume Density1 LOS
I-95 Baymeadows to JTB
NB 3 5545 31.8 D 3910 20.2 C
SB 3 3810 19.7 C 5505 31.5 D
I-95 JTB to Bowden
NB 4 6655 27.2 D 5280 20.5 C
SB 4 5145 19.9 C 5960 23.6 C
1. Density = passenger cars/mile/lane
Ramp Analysis
The Opening Year 2015 ramp analysis results are summarized in Table 5-2. The results of the operational analysis show that all the study ramp junctions operate at an acceptable LOS under 2015 No-Build conditions except for the I-95 northbound off ramp that operates at LOS E during AM peak hour and the weaving segment that occurs along westbound JTB between Belfort Road and the I-95 northbound on ramp which operates at LOS E during both the AM and PM peaks. Figure 5-4 illustrates the peak hour volumes and LOS results for the Opening Year 2015 ramp analysis. The westbound JTB to I-95 northbound on ramp and the I-95 southbound off ramp were analyzed as a major merge and major diverge respectively. Both are 2 lane ramps that add a lane on I-95 mainline at the merge in northbound direction and reduce a lane at the diverge in southbound direction. The analysis resulted in a volume to capacity ratio (v/c) of less than 1.0 for upstream, merging/diverging and downstream segments. This indicates that the ramp merge and diverge are functioning with adequate capacity. The I-95 northbound off ramp to Bowden Road and the on ramp from Bowden Road to I-95 southbound are single lane ramps that result in a lane drop at the diverge and lane addition at the merge. These ramps were analyzed as ramp
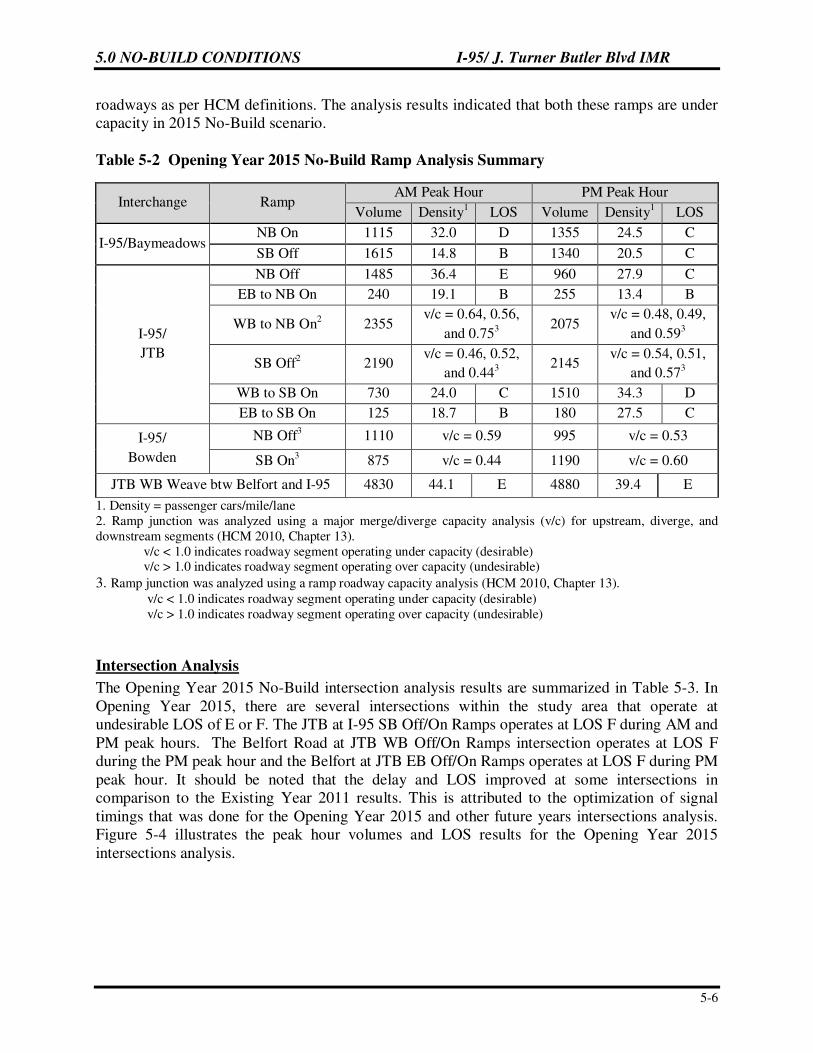
5.0 NO-BUILD CONDITIONS I-95/ J. Turner Butler Blvd IMR
5-6
roadways as per HCM definitions. The analysis results indicated that both these ramps are under capacity in 2015 No-Build scenario. Table 5-2 Opening Year 2015 No-Build Ramp Analysis Summary
Interchange Ramp AM Peak Hour PM Peak Hour
Volume Density1 LOS Volume Density1 LOS
I-95/Baymeadows NB On 1115 32.0 D 1355 24.5 C
SB Off 1615 14.8 B 1340 20.5 C
I-95/
JTB
NB Off 1485 36.4 E 960 27.9 C
EB to NB On 240 19.1 B 255 13.4 B
WB to NB On2 2355 v/c = 0.64, 0.56,
and 0.753 2075
v/c = 0.48, 0.49,
and 0.593
SB Off2 2190 v/c = 0.46, 0.52,
and 0.443 2145
v/c = 0.54, 0.51,
and 0.573
WB to SB On 730 24.0 C 1510 34.3 D
EB to SB On 125 18.7 B 180 27.5 C
I-95/
Bowden
NB Off3 1110 v/c = 0.59 995 v/c = 0.53
SB On3 875 v/c = 0.44 1190 v/c = 0.60
JTB WB Weave btw Belfort and I-95 4830 44.1 E 4880 39.4 E
1. Density = passenger cars/mile/lane 2. Ramp junction was analyzed using a major merge/diverge capacity analysis (v/c) for upstream, diverge, and downstream segments (HCM 2010, Chapter 13).
v/c < 1.0 indicates roadway segment operating under capacity (desirable) v/c > 1.0 indicates roadway segment operating over capacity (undesirable)
3. Ramp junction was analyzed using a ramp roadway capacity analysis (HCM 2010, Chapter 13). v/c < 1.0 indicates roadway segment operating under capacity (desirable)
v/c > 1.0 indicates roadway segment operating over capacity (undesirable)
Intersection Analysis
The Opening Year 2015 No-Build intersection analysis results are summarized in Table 5-3. In Opening Year 2015, there are several intersections within the study area that operate at undesirable LOS of E or F. The JTB at I-95 SB Off/On Ramps operates at LOS F during AM and PM peak hours. The Belfort Road at JTB WB Off/On Ramps intersection operates at LOS F during the PM peak hour and the Belfort at JTB EB Off/On Ramps operates at LOS F during PM peak hour. It should be noted that the delay and LOS improved at some intersections in comparison to the Existing Year 2011 results. This is attributed to the optimization of signal timings that was done for the Opening Year 2015 and other future years intersections analysis. Figure 5-4 illustrates the peak hour volumes and LOS results for the Opening Year 2015 intersections analysis.

5.0 NO-BUILD CONDITIONS I-95/ J. Turner Butler Blvd IMR
5-7
Table 5-3 Opening Year 2015 No-Build Intersection Analysis Summary
Intersection AM Peak PM Peak
Delay1 LOS Delay1
LOS
Philips Highway at JTB 39.1 D 46.0 D
Bonneval Road at JTB 52.2 D 46.2 D
JTB at I-95 SB Off/On Ramps 109.3 F 106.3 F
Belfort at JTB WB Off/On Ramps 50.8 D 279.3 F
Belfort at JTB EB Off/On Ramps 35.0 D 166.4 F
AC Skinner Parkway at Belfort Road 16.4 B 38.5 D
Southpoint Parkway at Belfort Road 39.8 D 49.1 D
1. Delay = seconds/vehicle

< 3
< 33 >
3 >
< 44 >
< 33 >
1 >
< 1
1 >2 >
1 >
< 2
2 >1 >
2 > 3 >< 3
< 1
< 22 >
< 1
< 2
1 >
< 1
1 >
< 1
1 >
< 2
< 3
A.C. SkinnerPkwy
Southpoint Pkwy
Salisbury Rd
J. Turner Butler Blvd
Belfort Rd
Southpoint Blvd
Bonneval Rd
Philips Hwy
Salisbury Rd
ToBowden Rd
FromBowden Rd
ToBaymeadows Rd
FromBaymeadows Rd
§̈¦95
§̈¦95
Butler BlvdJ. Turner
N. T. S.
Legend
Signalized Intersection
Unsignalized Intersection
Intersection Lane Configuration
Mainline/Ramp Lane CountX >
I-95 / J. Turner Butler BlvdInterchange Modification Report No-Build Lane Configuration Figure
5-3

133 (
95)
84 (3
0)
695 (
700)
475 (
196)
17 (2
3)
305 (
830)
1,885 (1,950)
170 (250)
445 (340)
670 (
199)
1,043
(919
)
835 (
355)
700 (
1,045
)
35 (35)
885 (1,115)
150 (
430)
305 (195)
45 (50)
225 (259)
82 (173)
465 (435)
25 (35)
48 (75)
21 (22)
5 (5)
1,785 (1,610)
1,155 (670)
45 (13)
275 (680)
440 (135)
120 (
886)
646 (
955)
480 (
1,120
)
580 (
785)
25 (35)
1,085 (1,170)
585 (870)
780 (400)
11 (5
1)
72 (6
7)
120 (
515)
50 (40)
1 (4)
668 (
267)
365 (
775)
45 (65)
72 (29)
77 (147)
440 (140)
840 (275)
750 (795)
20 (17)
14 (17)
290 (180)1,430 (1,740)
1,250 (2,055)
1,745 (1,505)
1,045 (1,255)
256 (492)
9 (26)
805 (505)590 (160)
330 (115)
165 (165)
390 (580)B (D)
D (D)
D (F)
D (F)
X (Y)
F (F)
D (D)
D (D)
3,810(5,505)
5,545(3,910)
6,655(5,280)
1,110(995)
5,545(4,285)
3,240(4,565)
5,120(3,655)
2,195(4,165)
4,430(2,555)
1,115(1,355)
1,485(960)
240(255)
530(225)
4,270(4,770)
5,145(5,960)
2,190(2,145)
730(1,510)
1,615(1,340)
2,355 (2,075) 4,830 (4,880)1,585 (820)
435 (1,360)
1,540 (830)
3,580 (2,825)
2,325 (1,300)740 (480)
875 (1,190)
125 (180)
A.C. SkinnerPkwy
Southpoint Pkwy
Salisbury Rd
J. Turner Butler Blvd
Belfort Rd
Southpoint Blvd
Bonneval Rd
Philips Hwy
Salisbury Rd
UC (UC)
UC (UC)UC (UC)
UC (UC)
C (D)
D (C)
E (E)
D (C)
D (C)
E (C)
B (B)
C (C)
C (D)
B (C)
B (C)
N. T. S.
Salisbury Rd
ToBowden Rd
FromBowden Rd
ToBaymeadows Rd
FromBaymeadows Rd
§̈¦95
§̈¦95
Legend
Butler BlvdJ. Turner
Signalized Intersection
Unsignalized Intersection
OC (UC)
AM (PM) Signalized Intersection Level of Service
AM (PM) Over Capacity / Under Capacity
X (Y)
X,XXX (X,XXX) AM (PM) Mainline Volume
X (Y)
X (Y)
AM (PM) Ramp Merge Level of ServiceAM (PM) Ramp Diverge Level of Service
X (Y) AM (PM) Mainline Level of Service
FreeYield
X (Y) AM (PM) Weave Level of Service
I-95 / J. Turner Butler BlvdInterchange Modification Report
Opening Year 2015 No-BuildPeak Hour Volumes and Level of Service
Figure 5-4

5.0 NO-BUILD CONDITIONS I-95/ J. Turner Butler Blvd IMR
5-10
5.4.2 2025 No-Build Analysis
Mainline Analysis
The Interim Year 2025 No-Build mainline analysis is summarized in Table 5-4. I-95 was analyzed as a 6-lane section south of JTB and 8-lane section north of JTB to Bowden Road in 2025. The results of the operational analysis show that all the mainline segments operate at an acceptable LOS during AM and PM peak hours except for the segment from Baymeadows Road to JTB that operates at LOS E during AM peak hour in northbound direction and during PM peak hour in southbound direction. Figure 5-5 illustrates the peak hour volumes and LOS results for the 2025 No-Build mainline analysis.
Table 5-4 Interim Year 2025 No-Build Mainline Analysis Summary
Freeway Segment Direction Number of
Lanes AM Peak Hour PM Peak Hour
Volume Density1 LOS Volume Density1 LOS
I-95 Baymeadows to JTB
NB 3 6595 43.9 E 4805 25.9 C
SB 3 4745 25.5 C 6575 43.6 E
I-95 JTB to Bowden
NB 4 7725 34.2 D 6240 25.0 C
SB 4 6170 24.7 C 7380 31.7 D
1. Density = passenger cars/mile/lane
Ramp Analysis
The Interim Year 2025 ramp analysis results are summarized in Table 5-5. The results of the operational analysis show that all the study ramp junctions operate at an acceptable LOS under 2025 No-Build conditions except for the I-95/Baymeadows northbound off ramp that operates at LOS E during AM peak hour, I-95/JTB westbound to southbound on ramp that operates at LOS E during PM peak hour, and the weaving segment that occurs along westbound JTB between Belfort Road and the I-95 northbound on ramp which operates at LOS E during both the AM and PM peaks. Figure 5-5 illustrates the peak hour volumes and LOS results for the Interim Year 2025 ramp analysis. The westbound JTB to I-95 northbound on ramp and the I-95 southbound off ramp were analyzed as a major merge and major diverge respectively. Both are 2 lane ramps that add a lane on I-95 mainline at the merge in northbound direction and reduce a lane at the diverge in southbound direction. The analysis resulted in a volume to capacity ratio (v/c) of less than 1.0 for upstream, merging/diverging and downstream segments. This indicates that the ramp merge and diverge are functioning with adequate capacity. The I-95 northbound off ramp to Bowden Road and the on ramp from Bowden Road to I-95 southbound are single lane ramps that result in a lane drop at the diverge and lane addition at the merge. These ramps were analyzed as ramp roadways as per HCM definitions. The analysis results indicated that both these ramps are under capacity in 2025 No-Build scenario.

5.0 NO-BUILD CONDITIONS I-95/ J. Turner Butler Blvd IMR
5-11
Table 5-5 Interim Year 2025 No-Build Ramp Analysis Summary
Interchange Ramp AM Peak Hour PM Peak Hour
Volume Density1 LOS Volume Density1 LOS
I-95/Baymeadows NB On 1305 37.8 E 1595 29.7 D
SB Off 1720 19.2 B 1420 28.5 D
I-95/
JTB
NB Off 1800 41.0 E 1060 32.3 D
EB to NB On 380 24.0 C 335 18.2 B
WB to NB On2 2550 v/c = 0.78, 0.60,
and 0.873 2160
v/c = 0.61, 0.51,
and 0.703
SB Off2 2430 v/c = 0.55, 0.57,
and 0.563 2705
v/c = 0.66, 0.64,
and 0.703
WB to SB On 840 28.7 D 1685 39.9 E
EB to SB On 165 23.6 C 215 33.1 D
I-95/
Bowden
NB Off3 1435 v/c = 0.76 1215 v/c = 0.65
SB On3 1155 v/c = 0.58 1475 v/c = 0.75
JTB WB Weave btw Belfort and I-95 5355 48.7 E 5535 46.0 E
1. Density = passenger cars/mile/lane 2. Ramp junction was analyzed using a major merge/diverge capacity analysis (v/c) for upstream, merge/diverge, and downstream segments (HCM 2010, Chapter 13).
v/c < 1.0 indicates roadway segment operating under capacity (desirable) v/c > 1.0 indicates roadway segment operating over capacity (undesirable)
3. Ramp junction was analyzed using a ramp roadway capacity analysis (HCM 2010, Chapter 13). v/c < 1.0 indicates roadway segment operating under capacity (desirable)
v/c > 1.0 indicates roadway segment operating over capacity (undesirable)
Intersection Analysis
The Interim Year 2025 No-Build intersection analysis results are summarized in Table 5-6. In Interim Year 2025, there are several intersections within the study area that operate at undesirable LOS of E or F. The Bonneval Road at JTB intersection operates at LOS F during AM peak hour. The JTB at I-95 SB Off/On Ramps operates at LOS F during AM and PM peak hours. The Belfort Road at JTB WB Off/On Ramps intersection operates at LOS F during the AM and PM peak hours while the Belfort at JTB EB Off/On Ramps operates at LOS F during PM peak hour. Signal timings were optimized. Figure 5-5 illustrates the peak hour volumes and LOS results for the Interim Year 2025 intersections analysis.

5.0 NO-BUILD CONDITIONS I-95/ J. Turner Butler Blvd IMR
5-12
Table 5-6 Interim Year 2025 No-Build Intersection Analysis Summary
Intersection AM Peak PM Peak
Delay1 LOS Delay1
LOS
Philips Highway at JTB 51.1 D 50.0 D
Bonneval Road at JTB 116.1 F 56.7 E
JTB at I-95 SB Off/On Ramps 172.0 F 180.9 F
Belfort at JTB WB Off/On Ramps 84.9 F 310.0 F
Belfort at JTB EB Off/On Ramps 52.5 D 230.2 F
AC Skinner Parkway at Belfort Road 18.1 B 53.6 D
Southpoint Parkway at Belfort Road 41.6 D 56.4 E
1. Delay = seconds/vehicle

147 (
106)
93 (3
4)
810 (
780)
526 (
217)
18 (2
6)
340 (
925)
2,065 (2,350)
250 (305)
560 (360)
741 (
222)
1,183
(1,02
5)
925 (
400)
770 (
1,170
)
55 (45)
1,075 (1,230)
265 (
480)
365 (355)
50 (55)
251 (287)
90 (191)
520 (465)
40 (40)
53 (75)
23 (25)
10 (10)
2,305 (1,810)
1,520 (795)
50 (14)
312 (758)
1 (4)
744 (
293)
410 (
860)
70 (90)
490 (145)
133 (
985)
719 (
1,048
)
535 (
1,250
)
645 (
850)
40 (55)
1,220 (1,215)
700 (925)
1,080 (540)
12 (5
7)
81 (7
3)
135 (
570)
80 (65)
80 (33)
88 (164)
490 (155)
910 (470)
805 (995)
22 (18)
15 (18)
360 (200)1,720 (1,990)
1,640 (2,345)
1,965 (1,795)
1,160 (1,455)
286 (546)
10 (29)
900 (565)620 (180)
345 (125)
260 (225)
465 (600)B (D)
D (E)
D (F)
F (F)
F (F)
F (E)
D (D)
4,745(6,575)
6,595(4,805)
7,725(6,240)
1,435(1,215)
6,290(5,025)
3,910(5,195)
5,470(4,120)
3,025(5,155)
5,290(3,210)
1,305(1,595)
1,800(1,060)
380(335)
590(255)
5,015(5,905)
6,170(7,380)
2,430(2,705)
840(1,685)
1,720(1,420)
2,550 (2,160) 5,355 (5,535)1,775 (950)
490 (1,520)
1,755 (930)
3,715 (3,190)
2,675 (1,480)895 (530)
1,155 (1,475)
165 (215)
A.C. SkinnerPkwy
Southpoint Pkwy
Salisbury Rd
J. Turner Butler Blvd
Belfort Rd
Southpoint Blvd
Bonneval Rd
Philips Hwy
Salisbury Rd
UC (UC)
UC (UC)
UC (UC)
UC (UC)
C (E)
E (C)
D (C)
E (D)
E (D)
C (B)
E (E)
C (D)
D (E)
C (D)
B (D)
N. T. S.
Salisbury Rd
ToBowden Rd
FromBowden Rd
ToBaymeadows Rd
FromBaymeadows Rd
§̈¦95
§̈¦95
Legend
Butler BlvdJ. Turner
Signalized Intersection
Unsignalized Intersection
OC (UC)
AM (PM) Signalized Intersection Level of Service
AM (PM) Over Capacity / Under Capacity
X (Y)
X,XXX (X,XXX) AM (PM) Mainline Volume
X (Y)
X (Y)
AM (PM) Ramp Merge Level of ServiceAM (PM) Ramp Diverge Level of Service
X (Y) AM (PM) Mainline Level of Service
FreeYield
X (Y) AM (PM) Weave Level of Service
I-95 / J. Turner Butler BlvdInterchange Modification Report
Interim Year 2025 No-BuildPeak Hour Volumes and Level of Service
Figure 5-5

5.0 NO-BUILD CONDITIONS I-95/ J. Turner Butler Blvd IMR
5-14
5.4.3 2035 No-Build Analysis
Mainline Analysis
The Design Year 2035 No-Build mainline analysis is summarized in Table 5-7. I-95 was analyzed as a 6-lane section south of JTB and 8-lane section north of JTB to Bowden Road in 2035. The results of the operational analysis show that the I-95 mainline segments from Baymeadows to Bowden begin to operate at an undesirable LOS E or F in 2035. The segment from Baymeadows Road to JTB operates at LOS F during AM peak hour in northbound direction and during PM peak hour in southbound direction. Figure 5-6 illustrates the peak hour volumes and LOS results for the 2035 No-Build mainline analysis. Table 5-7 Design Year 2035 No-Build Mainline Analysis Summary
Freeway Segment Direction Number of
Lanes AM Peak Hour PM Peak Hour
Volume Density1 LOS Volume Density1 LOS
I-95 Baymeadows to JTB
NB 3 7640 65.1 F 5690 33.2 D
SB 3 5690 33.2 D 7640 65.1 F
I-95 JTB to Bowden
NB 4 8800 44.0 E 7200 30.5 D
SB 4 7200 30.5 D 8800 44.0 E
1. Density = passenger cars/mile/lane
Ramp Analysis
The Design Year 2035 ramp analysis results are summarized in Table 5-8. The results of the operational analysis show that several study ramp junctions begin to operate at an undesirable LOS E or F under 2035 No-Build conditions. The I-95/Baymeadows northbound on ramp operates at LOS F during AM peak hour and southbound off ramp operates at LOS F during PM peak hour. The I-95/JTB westbound to southbound and eastbound to southbound on ramps operate at LOS F during PM peak hour. The ramp junctions fail due to inadequate capacity on the I-95 mainline. The weaving segment that occurs along westbound JTB between Belfort Road and the I-95 northbound on ramp operates at LOS F during the AM Peak hour and LOS E during the PM Peak hour. Figure 5-6 illustrates the peak hour volumes and LOS results for the Design Year 2035 ramp analysis. The westbound JTB to I-95 northbound on ramp and the I-95 southbound off ramp were analyzed as a major merge and major diverge respectively. Both are 2 lane ramps that add a lane on I-95 mainline at the merge in northbound direction and reduce a lane at the diverge in southbound direction. The analysis resulted in a volume to capacity ratio (v/c) of less than 1.0 for upstream, merging/diverging and downstream segments. This indicates that the ramp merge and diverge are functioning with adequate capacity. The I-95 northbound off ramp to Bowden Road and the on ramp from Bowden Road to I-95 southbound are single lane ramps that result in a lane drop at the diverge and lane addition at the merge. These ramps were analyzed as ramp roadways as per HCM definitions. The analysis results indicated that both these ramps are under capacity in 2035 No-Build scenario.

5.0 NO-BUILD CONDITIONS I-95/ J. Turner Butler Blvd IMR
5-15
Table 5-8 Design Year 2035 No-Build Ramp Analysis Summary
Interchange Ramp AM Peak Hour PM Peak Hour
Volume Density1 LOS Volume Density1 LOS
I-95/Baymeadows NB On 1500 43.7 F 1830 34.8 D
SB Off 1830 23.7 C 1500 38.4 F
I-95/
JTB
NB Off 2110 50.1 F 1160 36.3 E
EB to NB On 520 29.0 D 420 23.0 C
WB to NB On2 2750 v/c = 0.91, 0.65,
and 0.993 2250
v/c = 0.74, 0.53,
and 0.813
SB Off2 2670 v/c = 0.65, 0.63,
and 0.683 3270
v/c = 0.79, 0.77,
and 0.833
WB to SB On 950 33.5 D 1860 45.5 F
EB to SB On 210 28.5 D 250 42.0 F
I-95/
Bowden
NB Off3 1760 v/c = 0.94 1440 v/c = 0.77
SB On3 1440 v/c = 0.73 1760 v/c = 0.89
JTB WB Weave btw Belfort and I-95 5880 - F 6180 52.8 E
1. Density = passenger cars/mile/lane 2. Ramp junction was analyzed using a major merge/diverge capacity analysis (v/c) for upstream, merge/diverge, and downstream segments (HCM 2010, Chapter 13).
v/c < 1.0 indicates roadway segment operating under capacity (desirable) v/c > 1.0 indicates roadway segment operating over capacity (undesirable)
3. Ramp junction was analyzed using a ramp roadway capacity analysis (HCM 2010, Chapter 13). v/c < 1.0 indicates roadway segment operating under capacity (desirable)
v/c > 1.0 indicates roadway segment operating over capacity (undesirable)
Intersection Analysis
The Design Year 2035 No-Build intersection analysis results are summarized in Table 5-9. In Design Year 2035, all the intersections within the study area operate at undesirable LOS of E or F. Signal timings were optimized during analysis of the intersections. Figure 5-6 illustrates the peak hour volumes and LOS results for the Design Year 2035 intersections analysis. Table 5-9 Design Year 2035 No-Build Intersection Analysis Summary
Intersection AM Peak PM Peak
Delay1 LOS Delay1
LOS
Philips Highway at JTB 89.5 F 56.5 E
Bonneval Road at JTB 195.4 F 75.9 E
JTB at I-95 SB Off/On Ramps 249.3 F 256.9 F
Belfort at JTB WB Off/On Ramps 106.9 F 354.4 F
Belfort at JTB EB Off/On Ramps 72.5 E 294.4 F
AC Skinner Parkway at Belfort Road 19.9 B 58.9 E
Southpoint Parkway at Belfort Road 51.1 D 77.6 E
1. Delay = seconds/vehicle

161 (
117)
102 (
37)
930 (
860)
577 (
239)
20 (2
8)
370 (
1,020
)
2,250 (2,750)
330 (360)
670 (380)
812 (
244)
1,323
(1,13
2)
1,010
(440
)
840 (
1,290
)
70 (60)
1,260 (1,350)
380 (
530)
420 (520)
50 (60)
277 (316)
99 (210)
570 (490)
60 (50)
58 (91)
25 (27)
10 (20)
2,820 (2,010)
1,880 (920)
55 (15)
349 (837)
540 (160)
147 (
1,083
)
792 (
141)
590 (
1,380
)
710 (
920)
60 (70)
1,350 (1,260)
820 (980)
1,380 (680)
13 (6
2)
89 (8
0)
150 (
620)
110 (90)
1 (4)
819 (
319)
450 (
950)
90 (110)
88 (36)
98 (181)
540 (170)
980 (670)
860 (1,190)
24 (20)
17 (20)
430 (220)2,010 (2,240)
2,030 (2,630)
2,180 (2,070)
1,260 (1,640)
316 (601)
11 (32)
990 (620)650 (200)
360 (140)
360 (280)
540 (620)B (E)
D (E)
E (F)
F (F)
F (F)
F (E)
F (E)
5,690(7,640)
7,640(5,690)
8,800(7,200)
1,760(1,440)
7,040(5,760)
4,580(5,820)
5,820(4,580)
3,860(6,140)
6,140(3,860)
1,500(1,830)
2,110(1,160)
520(420)
650(280)
5,760(7,040)
7,200(8,800)
2,670(3,270)
950(1,860)
1,830(1,500)
2,750 (2,250) 5,880 (6,180)1,970 (1,080)
540 (1,680)
1,970 (1,030)
3,850 (3,550)
3,020 (1,660)1,050 (580)
1,440 (1,760)
210 (250)
A.C. SkinnerPkwy
Southpoint Pkwy
Salisbury Rd
J. Turner Butler Blvd
Belfort Rd
Southpoint Blvd
Bonneval Rd
Philips Hwy
Salisbury Rd
UC (UC)
UC (UC)UC (UC)
UC (UC)
D (F)
F (D)
F (E)
E (D)
F (D)
F (E)
D (C)
D (E)
D (F)
D (F)
C (F)
N. T. S.
Salisbury Rd
ToBowden Rd
FromBowden Rd
ToBaymeadows Rd
FromBaymeadows Rd
§̈¦95
§̈¦95
Legend
Butler BlvdJ. Turner
Signalized Intersection
Unsignalized Intersection
OC (UC)
AM (PM) Signalized Intersection Level of Service
AM (PM) Over Capacity / Under Capacity
X (Y)
X,XXX (X,XXX) AM (PM) Mainline Volume
X (Y)
X (Y)
AM (PM) Ramp Merge Level of ServiceAM (PM) Ramp Diverge Level of Service
X (Y) AM (PM) Mainline Level of Service
FreeYield
X (Y) AM (PM) Weave Level of Service
I-95 / J. Turner Butler BlvdInterchange Modification Report
Design Year 2035 No-BuildPeak Hour Volumes and Level of Service
Figure 5-6

5.0 NO-BUILD CONDITIONS I-95/ J. Turner Butler Blvd IMR
5-17
5.5 Microsimulation Based No-Build Operational Analysis
A detailed microsimulation analysis using CORSIM was conducted in addition to the HCM based operational analysis to evaluate the system-wide operational performance. The CORSIM model was prepared for the Design Year 2035 AM and PM peak periods. The primary objective of this CORSIM model was to establish the 2035 No-Build operational conditions along I-95, JTB, study interchanges and intersections. The CORSIM microsimulation is intended to supplement the HCM based capacity analysis and to identify any additional operational issues present in the roadway network. Five hour AM and PM peak periods were modeled for the Design Year 2035 No-Build Alternative. 15 minute volumes were input into the CORSIM model for five hour AM and PM peak periods for Design Year 2035. The Design Year No-Build model parameters are based on those used for the Existing Year model. Ten model iterations with different random number seeds were executed for the AM and PM models. The following CORSIM MOEs were used to evaluate the network’s operational performance:
• Freeways o Traffic Volume Throughput o Mainline Density and Speed
• Arterials o Movement Delay o Approach Delay o Total Intersection Delay
MOEs listed above are compared between the No-Build and Build conditions to evaluate system operations. Lower density and higher speed values indicate good operating conditions. As per Highway Capacity Manual, at free flow speed of 70 mph, a density value greater than 45 pc/mi/ln and speed below 53.3 mph will result in LOS F conditions. The following sections provide a summary of the operational performance based on the CORSIM modeling results. Documentation for the Design Year 2035 No-Build Alternative microsimulation analysis is provided in Appendix G.
I-95 Freeway Operational Performance
The CORSIM model results indicate that there are operational deficiencies along the I-95 northbound and southbound mainline in 2035 No-Build traffic conditions. The No-Build AM and PM Peak Heat Diagrams illustrate the locations and duration of congestion within the study area. This is done by illustrating the speed distribution with the lowest speeds shown in red corresponding to the areas of highest congestion. The AM peak heat diagram illustrates congestion in the northbound direction that lasts throughout the duration of simulation from south of Baymeadows Road to the JTB exit; in the southbound direction, congestion occurs from north of Bowden Road to the JTB exit which lasts primarily during the peak hour.
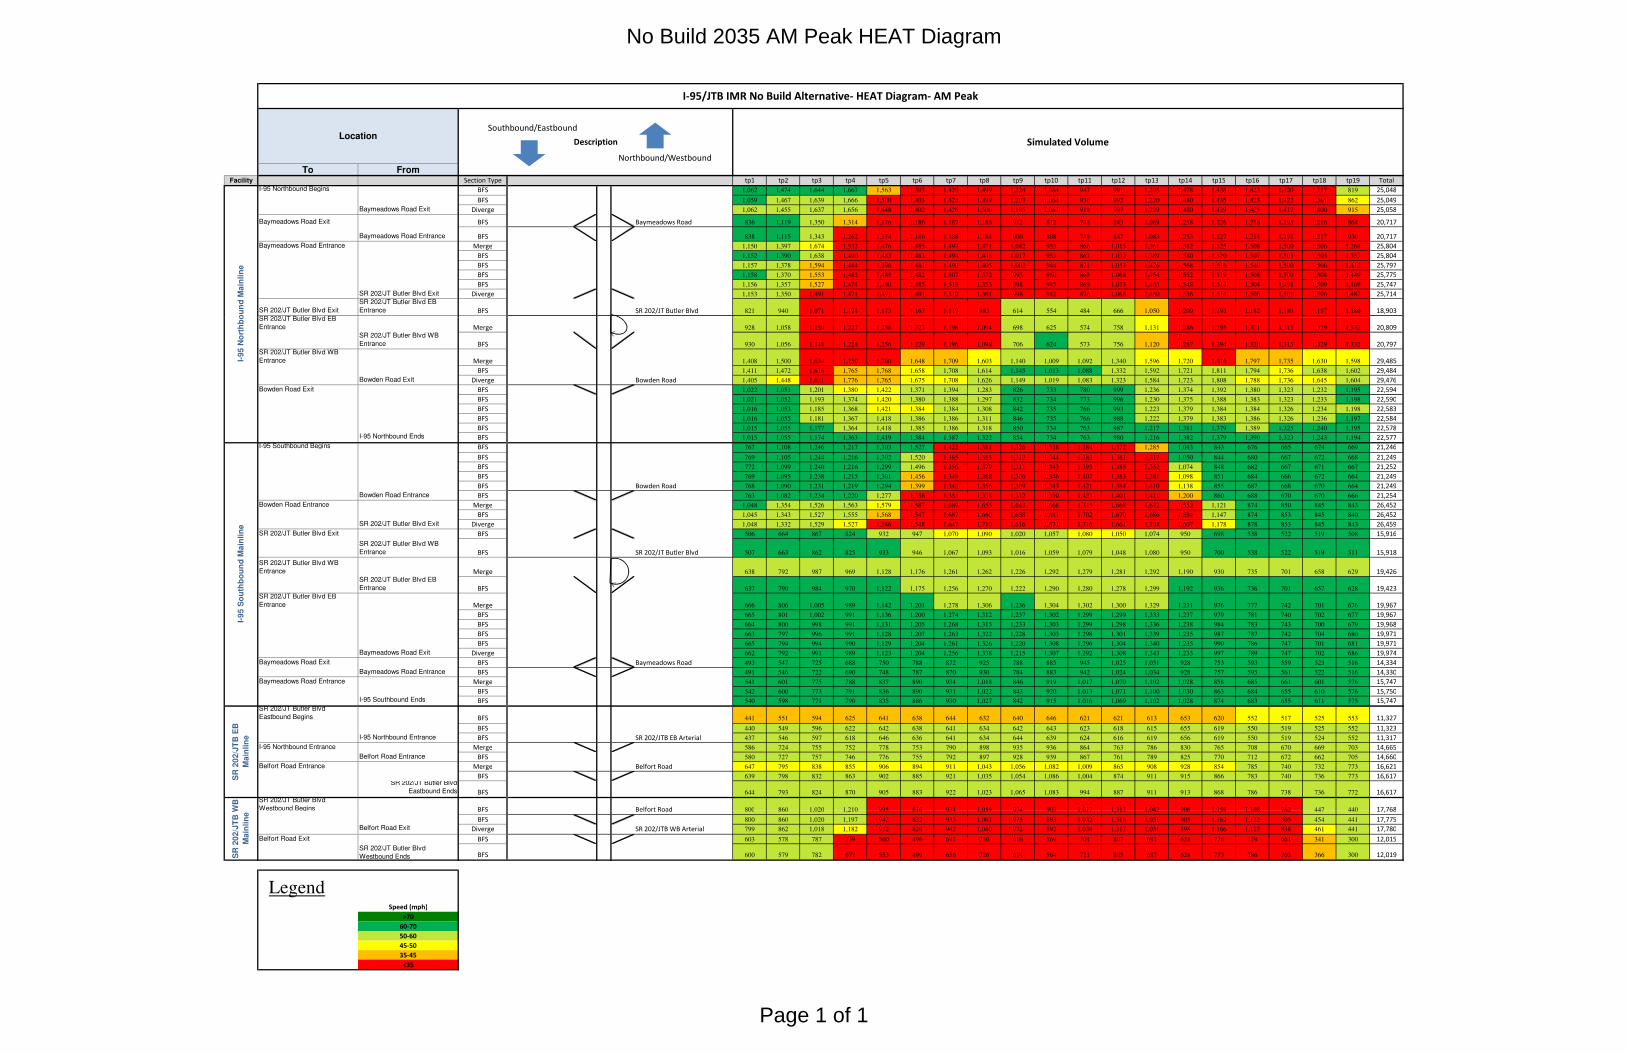
To FromFacility Section Type tp1 tp2 tp3 tp4 tp5 tp6 tp7 tp8 tp9 tp10 tp11 tp12 tp13 tp14 tp15 tp16 tp17 tp18 tp19 Total
I-95 Northbound Begins BFS 1,062 1,474 1,644 1,667 1,563 1,393 1,420 1,499 1,224 1,064 947 991 1,205 1,478 1,438 1,423 1,420 1,317 819 25,048
BFS 1,059 1,467 1,639 1,666 1,500 1,403 1,424 1,499 1,203 1,064 930 992 1,220 1,480 1,435 1,423 1,422 1,361 862 25,049
Baymeadows Road Exit Diverge 1,062 1,455 1,637 1,656 1,448 1,402 1,426 1,506 1,185 1,061 918 997 1,229 1,480 1,439 1,425 1,417 1,400 915 25,058
Baymeadows Road Exit BFS Baymeadows Road 836 1,119 1,350 1,314 1,176 1,186 1,187 1,188 912 812 748 843 1,069 1,258 1,226 1,218 1,195 1,216 864 20,717
Baymeadows Road Entrance BFS 838 1,115 1,343 1,262 1,174 1,186 1,188 1,184 900 808 748 847 1,083 1,255 1,227 1,214 1,198 1,217 930 20,717
Baymeadows Road Entrance Merge 1,150 1,397 1,674 1,532 1,476 1,485 1,497 1,471 1,042 953 866 1,015 1,361 1,582 1,525 1,508 1,500 1,506 1,264 25,804
BFS 1,152 1,390 1,638 1,490 1,483 1,483 1,494 1,446 1,017 953 867 1,032 1,389 1,580 1,520 1,507 1,503 1,503 1,357 25,804
BFS 1,157 1,378 1,594 1,484 1,496 1,481 1,490 1,405 1,002 944 871 1,057 1,426 1,568 1,516 1,510 1,500 1,506 1,412 25,797
BFS 1,158 1,370 1,553 1,482 1,485 1,482 1,507 1,372 993 950 865 1,068 1,454 1,552 1,519 1,508 1,500 1,508 1,449 25,775
BFS 1,156 1,357 1,527 1,474 1,490 1,485 1,513 1,353 998 945 869 1,073 1,465 1,548 1,514 1,504 1,498 1,509 1,469 25,747
SR 202/JT Butler Blvd Exit Diverge 1,153 1,350 1,491 1,471 1,491 1,491 1,512 1,361 998 942 876 1,068 1,460 1,536 1,514 1,506 1,501 1,506 1,487 25,714
SR 202/JT Butler Blvd Exit
SR 202/JT Butler Blvd EB
Entrance BFS SR 202/JT Butler Blvd 821 940 1,071 1,124 1,173 1,167 1,119 983 614 554 484 666 1,050 1,200 1,193 1,182 1,189 1,187 1,186 18,903SR 202/JT Butler Blvd EB
I-95/JTB IMR No Build Alternative- HEAT Diagram- AM Peak
Simulated Volume
I-9
5 N
ort
hb
ou
nd
Ma
inli
ne
LocationDescription
Northbound/Westbound
Southbound/Eastbound
SR 202/JT Butler Blvd EB
Entrance Merge 928 1,058 1,159 1,227 1,256 1,227 1,196 1,094 698 625 574 758 1,131 1,286 1,295 1,321 1,315 1,329 1,332 20,809SR 202/JT Butler Blvd WB
Entrance BFS 930 1,056 1,148 1,228 1,256 1,229 1,196 1,098 706 624 573 756 1,120 1,287 1,294 1,320 1,315 1,329 1,332 20,797SR 202/JT Butler Blvd WB
Entrance Merge 1,408 1,500 1,634 1,750 1,760 1,648 1,709 1,603 1,140 1,009 1,092 1,340 1,596 1,720 1,816 1,797 1,735 1,630 1,598 29,485
BFS 1,411 1,472 1,616 1,765 1,768 1,658 1,708 1,614 1,145 1,013 1,088 1,332 1,592 1,721 1,811 1,794 1,736 1,638 1,602 29,484
Bowden Road Exit Diverge Bowden Road 1,405 1,448 1,611 1,776 1,765 1,675 1,708 1,626 1,149 1,019 1,083 1,323 1,584 1,723 1,808 1,788 1,736 1,645 1,604 29,476
Bowden Road Exit BFS 1,022 1,051 1,201 1,380 1,422 1,371 1,394 1,283 826 733 780 999 1,236 1,374 1,392 1,380 1,323 1,232 1,195 22,594
BFS 1,021 1,052 1,193 1,374 1,420 1,380 1,388 1,297 832 734 773 996 1,230 1,375 1,388 1,383 1,323 1,233 1,198 22,590
BFS 1,016 1,053 1,185 1,368 1,421 1,384 1,384 1,308 842 735 766 993 1,223 1,379 1,384 1,384 1,326 1,234 1,198 22,583
BFS 1,016 1,055 1,181 1,367 1,418 1,386 1,386 1,311 846 735 766 988 1,222 1,379 1,383 1,386 1,326 1,236 1,197 22,584
BFS 1,015 1,055 1,177 1,364 1,418 1,385 1,386 1,318 850 734 763 987 1,217 1,381 1,379 1,389 1,325 1,240 1,195 22,578I-95 Northbound Ends BFS 1,015 1,055 1,174 1,363 1,419 1,384 1,387 1,322 854 734 763 980 1,216 1,382 1,379 1,390 1,323 1,243 1,194 22,577
I-95 Southbound Begins BFS 767 1,108 1,246 1,217 1,303 1,527 1,422 1,381 1,326 1,338 1,384 1,372 1,285 1,043 843 676 665 674 669 21,246
BFS 769 1,105 1,244 1,216 1,302 1,520 1,385 1,385 1,317 1,344 1,383 1,381 1,317 1,050 844 680 667 672 668 21,249
BFS 772 1,099 1,240 1,216 1,299 1,496 1,356 1,379 1,311 1,343 1,395 1,385 1,352 1,074 848 682 667 671 667 21,252
BFS 769 1,095 1,238 1,215 1,301 1,456 1,349 1,368 1,306 1,346 1,407 1,383 1,381 1,098 851 684 666 672 664 21,249
BFS Bowden Road 768 1,090 1,231 1,219 1,294 1,399 1,343 1,356 1,309 1,343 1,421 1,384 1,410 1,138 855 687 668 670 664 21,249
Bowden Road Entrance BFS 763 1,082 1,234 1,220 1,277 1,336 1,353 1,338 1,312 1,350 1,423 1,401 1,411 1,200 860 688 670 670 666 21,254
Bowden Road Entrance Merge 1,048 1,354 1,526 1,563 1,579 1,587 1,689 1,655 1,643 1,668 1,715 1,668 1,672 1,552 1,121 874 850 845 843 26,452
BFS 1,045 1,343 1,527 1,555 1,568 1,547 1,687 1,660 1,638 1,681 1,702 1,670 1,686 1,584 1,147 874 853 845 840 26,452
SR 202/JT Butler Blvd Exit Diverge 1,048 1,332 1,529 1,527 1,546 1,548 1,647 1,710 1,616 1,671 1,716 1,661 1,704 1,607 1,178 878 853 845 843 26,459
SR 202/JT Butler Blvd Exit BFS 506 664 867 824 932 947 1,070 1,090 1,020 1,057 1,080 1,050 1,074 950 698 538 522 519 508 15,916
SR 202/JT Butler Blvd WB
Entrance BFS SR 202/JT Butler Blvd 507 663 862 825 933 946 1,067 1,093 1,016 1,059 1,079 1,048 1,080 950 700 538 522 519 511 15,918
SR 202/JT Butler Blvd WB
I-9
5 N
ort
hb
ou
nd
Ma
inli
ne
I-9
5 S
ou
thb
ou
nd
Ma
inli
ne
SR 202/JT Butler Blvd WB
Entrance Merge 638 792 987 969 1,128 1,176 1,261 1,262 1,226 1,292 1,279 1,281 1,292 1,190 930 735 701 658 629 19,426SR 202/JT Butler Blvd EB
Entrance BFS 637 790 984 970 1,122 1,175 1,256 1,270 1,222 1,290 1,280 1,278 1,299 1,192 936 736 701 657 628 19,423SR 202/JT Butler Blvd EB
Entrance Merge 666 806 1,005 989 1,142 1,201 1,278 1,306 1,236 1,304 1,302 1,300 1,329 1,231 976 777 742 701 676 19,967
BFS 665 801 1,002 991 1,136 1,200 1,274 1,312 1,237 1,302 1,299 1,299 1,333 1,237 979 781 740 702 677 19,967
BFS 664 800 998 991 1,131 1,205 1,268 1,315 1,233 1,303 1,299 1,298 1,336 1,238 984 783 743 700 679 19,968
BFS 663 797 996 991 1,128 1,207 1,263 1,322 1,228 1,303 1,298 1,301 1,339 1,235 987 787 742 704 680 19,971
BFS 665 794 994 990 1,129 1,204 1,261 1,326 1,220 1,308 1,296 1,304 1,340 1,235 990 786 747 701 681 19,971
Baymeadows Road Exit Diverge 662 792 991 989 1,123 1,204 1,256 1,338 1,215 1,307 1,292 1,308 1,343 1,233 997 789 747 702 686 19,974
Baymeadows Road Exit BFS Baymeadows Road 493 547 725 688 750 788 872 925 788 885 945 1,025 1,031 928 753 593 559 523 516 14,334
Baymeadows Road Entrance BFS 491 546 722 690 748 787 870 930 784 883 942 1,024 1,034 928 757 595 561 522 516 14,330
Baymeadows Road Entrance Merge 541 601 775 788 837 890 934 1,018 846 919 1,017 1,070 1,102 1,028 858 685 661 601 576 15,747
BFS 542 600 773 791 836 890 931 1,022 843 920 1,013 1,071 1,100 1,030 863 684 655 610 576 15,750I-95 Southbound Ends BFS 540 598 771 790 835 886 930 1,027 842 915 1,016 1,069 1,102 1,028 874 683 655 611 575 15,747
SR 202/JT Butler Blvd
Eastbound Begins BFS 441 551 594 625 641 638 644 632 640 646 621 621 613 653 620 552 517 525 553 11,327
BFS 440 549 596 622 642 638 641 634 642 643 623 618 615 655 619 550 519 525 552 11,323
I-95 Northbound Entrance BFS SR 202/JTB EB Arterial 437 546 597 618 646 636 641 634 644 639 624 616 619 656 619 550 519 524 552 11,317
I-95 Northbound Entrance Merge 586 724 755 752 778 753 790 898 935 936 864 763 786 830 765 708 670 669 703 14,665
Belfort Road Entrance BFS 580 727 757 746 776 755 792 897 928 939 867 761 789 825 770 712 672 662 705 14,660
Belfort Road Entrance Merge Belfort Road 647 795 838 855 906 894 911 1,043 1,056 1,082 1,009 865 908 928 854 785 740 732 773 16,621
BFS 639 798 832 863 902 885 921 1,035 1,054 1,086 1,004 874 911 915 866 783 740 736 773 16,617SR 202/JT Butler Blvd
Eastbound Ends BFS 644 793 824 870 905 883 922 1,023 1,065 1,083 994 887 911 913 868 786 738 736 772 16,617SR 202/JT Butler Blvd
Westbound Begins BFS Belfort Road 800 860 1,020 1,210 995 816 934 1,059 974 903 1,017 1,317 1,042 906 1,158 1,108 762 447 440 17,768
SR
20
2/J
TB
WB
I-
95
So
uth
bo
un
d M
ain
lin
eS
R 2
02
/JT
B E
B
Ma
inli
ne
Westbound Begins BFS Belfort Road 800 860 1,020 1,210 995 816 934 1,059 974 903 1,017 1,317 1,042 906 1,158 1,108 762 447 440 17,768
BFS 800 860 1,020 1,197 942 822 935 1,061 975 893 1,032 1,318 1,031 905 1,162 1,122 805 454 441 17,775Belfort Road Exit Diverge SR 202/JTB WB Arterial 799 862 1,018 1,182 912 824 942 1,060 972 892 1,038 1,317 1,031 898 1,166 1,127 838 461 441 17,780
Belfort Road Exit BFS 603 578 787 739 560 496 647 730 616 569 701 807 697 628 776 779 661 341 300 12,015
SR 202/JT Butler Blvd
Westbound Ends BFS 600 579 782 677 553 499 656 726 614 564 721 805 687 628 773 786 703 366 300 12,019
Speed (mph)
>70
60-70
50-60
45-50
35-45
<35
SR
20
2/J
TB
WB
Ma
inli
ne
Legend
No Build 2035 AM Peak HEAT Diagram
Page 1 of 1
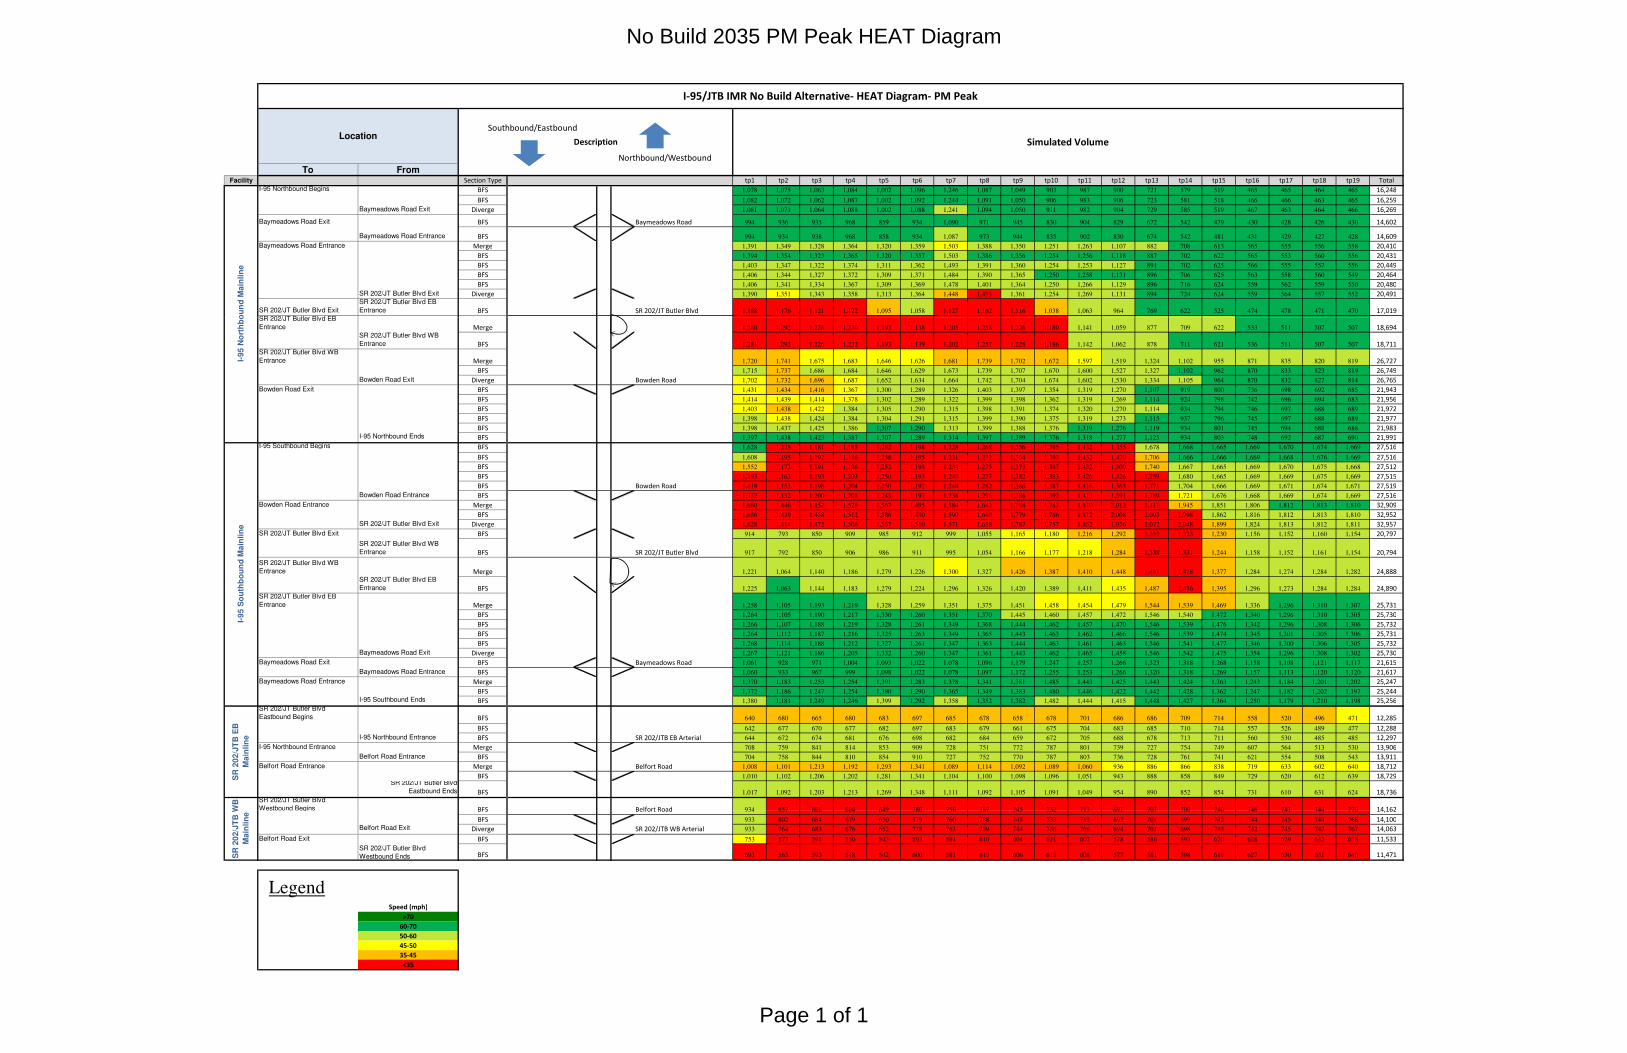
To FromFacility Section Type tp1 tp2 tp3 tp4 tp5 tp6 tp7 tp8 tp9 tp10 tp11 tp12 tp13 tp14 tp15 tp16 tp17 tp18 tp19 Total
I-95 Northbound Begins BFS 1,078 1,075 1,063 1,084 1,002 1,096 1,246 1,087 1,049 903 987 900 721 579 519 465 465 464 465 16,248
BFS 1,082 1,072 1,062 1,087 1,002 1,092 1,244 1,091 1,050 906 983 906 723 581 518 466 466 463 465 16,259
Baymeadows Road Exit Diverge 1,081 1,071 1,064 1,088 1,002 1,088 1,241 1,094 1,050 911 982 904 729 585 519 467 463 464 466 16,269
Baymeadows Road Exit BFS Baymeadows Road 994 936 935 968 859 934 1,090 971 945 830 904 829 672 542 479 430 428 426 430 14,602
Baymeadows Road Entrance BFS 994 934 938 968 858 934 1,087 973 944 835 902 830 674 542 481 431 429 427 428 14,609
Baymeadows Road Entrance Merge 1,391 1,349 1,328 1,364 1,320 1,359 1,503 1,388 1,350 1,251 1,263 1,107 882 708 613 565 555 556 558 20,410
BFS 1,394 1,354 1,323 1,365 1,320 1,357 1,503 1,386 1,356 1,254 1,256 1,118 887 702 622 565 553 560 556 20,431
BFS 1,403 1,347 1,322 1,374 1,311 1,362 1,493 1,391 1,360 1,254 1,253 1,127 891 702 625 566 555 557 556 20,449
BFS 1,406 1,344 1,327 1,372 1,309 1,371 1,484 1,390 1,365 1,250 1,258 1,131 896 706 625 563 558 560 549 20,464
BFS 1,406 1,341 1,334 1,367 1,309 1,369 1,478 1,401 1,364 1,250 1,266 1,129 896 716 624 559 562 559 550 20,480
SR 202/JT Butler Blvd Exit Diverge 1,390 1,351 1,343 1,358 1,313 1,364 1,448 1,435 1,361 1,254 1,269 1,131 894 724 624 559 564 557 552 20,491
SR 202/JT Butler Blvd Exit
SR 202/JT Butler Blvd EB
Entrance BFS SR 202/JT Butler Blvd 1,168 1,176 1,121 1,122 1,095 1,058 1,127 1,162 1,116 1,038 1,063 964 769 622 525 474 478 471 470 17,019SR 202/JT Butler Blvd EB
I-95/JTB IMR No Build Alternative- HEAT Diagram- PM Peak
Simulated Volume
I-9
5 N
ort
hb
ou
nd
Ma
inli
ne
LocationDescription
Northbound/Westbound
Southbound/Eastbound
SR 202/JT Butler Blvd EB
Entrance Merge 1,280 1,292 1,226 1,230 1,193 1,138 1,205 1,258 1,226 1,180 1,141 1,059 877 709 622 533 511 507 507 18,694SR 202/JT Butler Blvd WB
Entrance BFS 1,281 1,292 1,226 1,232 1,193 1,139 1,202 1,257 1,228 1,186 1,142 1,062 878 711 621 536 511 507 507 18,711SR 202/JT Butler Blvd WB
Entrance Merge 1,720 1,741 1,675 1,683 1,646 1,626 1,681 1,739 1,702 1,672 1,597 1,519 1,324 1,102 955 871 835 820 819 26,727
BFS 1,715 1,737 1,686 1,684 1,646 1,629 1,673 1,739 1,707 1,670 1,600 1,527 1,327 1,102 962 870 833 823 819 26,749
Bowden Road Exit Diverge Bowden Road 1,702 1,732 1,696 1,687 1,652 1,634 1,664 1,742 1,704 1,674 1,602 1,530 1,334 1,105 964 870 832 827 814 26,765
Bowden Road Exit BFS 1,431 1,434 1,416 1,367 1,300 1,289 1,326 1,403 1,397 1,354 1,319 1,270 1,107 919 800 736 698 692 685 21,943
BFS 1,414 1,439 1,414 1,378 1,302 1,289 1,322 1,399 1,398 1,362 1,319 1,269 1,114 924 798 742 696 694 683 21,956
BFS 1,403 1,438 1,422 1,384 1,305 1,290 1,315 1,398 1,391 1,374 1,320 1,270 1,114 934 794 746 697 688 689 21,972
BFS 1,398 1,438 1,424 1,384 1,304 1,291 1,315 1,399 1,390 1,375 1,319 1,273 1,115 937 796 745 697 688 689 21,977
BFS 1,398 1,437 1,425 1,386 1,307 1,290 1,313 1,399 1,388 1,376 1,319 1,276 1,119 934 801 745 694 688 688 21,983I-95 Northbound Ends BFS 1,397 1,438 1,423 1,387 1,307 1,289 1,314 1,397 1,389 1,376 1,318 1,277 1,125 934 803 748 692 687 690 21,991
I-95 Southbound Begins BFS 1,628 1,235 1,181 1,185 1,262 1,198 1,228 1,268 1,356 1,395 1,432 1,455 1,678 1,668 1,665 1,669 1,670 1,674 1,669 27,516
BFS 1,608 1,195 1,192 1,186 1,258 1,195 1,231 1,272 1,364 1,393 1,432 1,470 1,706 1,666 1,666 1,669 1,668 1,676 1,669 27,516
BFS 1,552 1,173 1,191 1,196 1,252 1,195 1,234 1,273 1,373 1,387 1,432 1,500 1,740 1,667 1,665 1,669 1,670 1,675 1,668 27,512
BFS 1,493 1,163 1,193 1,203 1,250 1,193 1,240 1,277 1,382 1,383 1,426 1,526 1,759 1,680 1,665 1,669 1,669 1,675 1,669 27,515
BFS Bowden Road 1,418 1,153 1,198 1,204 1,250 1,192 1,244 1,282 1,386 1,387 1,416 1,563 1,771 1,704 1,666 1,669 1,671 1,674 1,671 27,519
Bowden Road Entrance BFS 1,332 1,152 1,200 1,208 1,245 1,197 1,238 1,296 1,386 1,392 1,413 1,591 1,789 1,721 1,676 1,668 1,669 1,674 1,669 27,516
Bowden Road Entrance Merge 1,660 1,446 1,452 1,526 1,567 1,495 1,584 1,642 1,784 1,783 1,810 2,012 2,111 1,945 1,851 1,806 1,812 1,813 1,810 32,909
BFS 1,656 1,439 1,458 1,512 1,586 1,480 1,590 1,640 1,779 1,786 1,812 2,008 2,095 1,998 1,862 1,816 1,812 1,813 1,810 32,952
SR 202/JT Butler Blvd Exit Diverge 1,628 1,414 1,472 1,506 1,567 1,510 1,571 1,638 1,787 1,757 1,852 1,976 2,072 2,048 1,899 1,824 1,813 1,812 1,811 32,957
SR 202/JT Butler Blvd Exit BFS 914 793 850 909 985 912 999 1,055 1,165 1,180 1,216 1,292 1,352 1,323 1,230 1,156 1,152 1,160 1,154 20,797
SR 202/JT Butler Blvd WB
Entrance BFS SR 202/JT Butler Blvd 917 792 850 906 986 911 995 1,054 1,166 1,177 1,218 1,284 1,338 1,331 1,244 1,158 1,152 1,161 1,154 20,794
SR 202/JT Butler Blvd WB
I-9
5 N
ort
hb
ou
nd
Ma
inli
ne
I-9
5 S
ou
thb
ou
nd
Ma
inli
ne
SR 202/JT Butler Blvd WB
Entrance Merge 1,221 1,064 1,140 1,186 1,279 1,226 1,300 1,327 1,426 1,387 1,410 1,448 1,495 1,478 1,377 1,284 1,274 1,284 1,282 24,888SR 202/JT Butler Blvd EB
Entrance BFS 1,225 1,063 1,144 1,183 1,279 1,224 1,296 1,326 1,420 1,389 1,411 1,435 1,487 1,476 1,395 1,296 1,273 1,284 1,284 24,890SR 202/JT Butler Blvd EB
Entrance Merge 1,258 1,105 1,193 1,219 1,328 1,259 1,351 1,375 1,451 1,458 1,454 1,479 1,544 1,539 1,469 1,336 1,296 1,310 1,307 25,731
BFS 1,264 1,105 1,190 1,217 1,330 1,260 1,351 1,370 1,445 1,460 1,457 1,472 1,546 1,540 1,472 1,340 1,296 1,310 1,305 25,730
BFS 1,266 1,107 1,188 1,219 1,328 1,261 1,349 1,368 1,444 1,462 1,457 1,470 1,546 1,539 1,476 1,342 1,296 1,308 1,306 25,732
BFS 1,264 1,112 1,187 1,216 1,325 1,263 1,349 1,365 1,443 1,463 1,462 1,466 1,546 1,539 1,474 1,345 1,301 1,305 1,306 25,731
BFS 1,268 1,114 1,188 1,212 1,327 1,261 1,347 1,363 1,444 1,463 1,461 1,463 1,546 1,541 1,477 1,346 1,300 1,306 1,305 25,732
Baymeadows Road Exit Diverge 1,267 1,121 1,186 1,205 1,332 1,260 1,347 1,361 1,443 1,462 1,465 1,458 1,546 1,542 1,475 1,354 1,296 1,308 1,302 25,730
Baymeadows Road Exit BFS Baymeadows Road 1,061 928 971 1,004 1,093 1,022 1,078 1,096 1,179 1,247 1,257 1,266 1,323 1,318 1,268 1,158 1,108 1,121 1,117 21,615
Baymeadows Road Entrance BFS 1,060 933 967 999 1,098 1,022 1,078 1,097 1,172 1,255 1,253 1,266 1,320 1,318 1,269 1,157 1,113 1,120 1,120 21,617
Baymeadows Road Entrance Merge 1,370 1,183 1,253 1,254 1,391 1,283 1,378 1,341 1,381 1,485 1,443 1,425 1,443 1,424 1,363 1,243 1,184 1,201 1,202 25,247
BFS 1,372 1,186 1,247 1,254 1,390 1,290 1,365 1,349 1,383 1,480 1,446 1,422 1,442 1,428 1,362 1,247 1,182 1,202 1,197 25,244I-95 Southbound Ends BFS 1,380 1,181 1,249 1,246 1,399 1,292 1,358 1,352 1,382 1,482 1,444 1,415 1,448 1,427 1,364 1,250 1,179 1,210 1,198 25,256
SR 202/JT Butler Blvd
Eastbound Begins BFS 640 680 665 680 683 697 685 678 658 678 701 686 686 709 714 558 520 496 471 12,285
BFS 642 677 670 677 682 697 683 679 661 675 704 683 685 710 714 557 526 489 477 12,288
I-95 Northbound Entrance BFS SR 202/JTB EB Arterial 644 672 674 681 676 698 682 684 659 672 705 688 678 713 711 560 530 485 485 12,297
I-95 Northbound Entrance Merge 708 759 841 814 853 909 728 751 772 787 801 739 727 754 749 607 564 513 530 13,906
Belfort Road Entrance BFS 704 758 844 810 854 910 727 752 770 787 803 736 728 761 741 621 554 508 543 13,911
Belfort Road Entrance Merge Belfort Road 1,008 1,101 1,213 1,192 1,293 1,341 1,089 1,114 1,092 1,089 1,060 936 886 866 838 719 633 602 640 18,712
BFS 1,010 1,102 1,206 1,202 1,281 1,341 1,104 1,100 1,098 1,096 1,051 943 888 858 849 729 620 612 639 18,729SR 202/JT Butler Blvd
Eastbound Ends BFS 1,017 1,092 1,203 1,213 1,269 1,348 1,111 1,092 1,105 1,091 1,049 954 890 852 854 731 610 631 624 18,736SR 202/JT Butler Blvd
Westbound Begins BFS Belfort Road 934 857 686 684 649 780 756 787 745 732 713 691 707 700 740 746 741 744 770 14,162
SR
20
2/J
TB
WB
I-
95
So
uth
bo
un
d M
ain
lin
eS
R 2
02
/JT
B E
B
Ma
inli
ne
Westbound Begins BFS Belfort Road 934 857 686 684 649 780 756 787 745 732 713 691 707 700 740 746 741 744 770 14,162
BFS 933 802 684 679 650 779 760 788 745 733 712 692 701 699 742 744 745 744 768 14,100Belfort Road Exit Diverge SR 202/JTB WB Arterial 933 764 683 676 652 778 763 789 744 736 706 694 701 698 745 742 745 747 767 14,063
Belfort Road Exit BFS 753 573 591 550 543 593 584 610 604 621 607 578 586 593 620 628 629 632 638 11,533
SR 202/JT Butler Blvd
Westbound Ends BFS 693 565 593 548 542 600 581 613 606 619 608 577 581 598 619 627 630 631 640 11,471
Speed (mph)
>70
60-70
50-60
45-50
35-45
<35
SR
20
2/J
TB
WB
Ma
inli
ne
Legend
No Build 2035 PM Peak HEAT Diagram
Page 1 of 1

5.0 NO-BUILD CONDITIONS I-95/ J. Turner Butler Blvd IMR
5-20
During the PM peak, congestion occurs in the northbound direction in the vicinity of the JTB interchange; in the southbound direction, congestion occurs from north of Bowden Road to the JTB interchange; the majority of this congestion is cleared by the end of the third hour of simulation. In the northbound direction, high densities are observed immediately downstream of the entrance ramp from JTB westbound during AM and PM peak periods (highlighted in orange in Table 5-10). This operational deficiency is associated with the high volume entrance ramp, heavy mainline volume and close proximity of JTB and Bowden Road interchanges. Congestion from this area extends to I-95 northbound flyover entrance from JTB and affect westbound JTB operations. Recurring congestion is also found between Baymeadows Road entrance and JTB exit during the AM peak as illustrated in the No-Build AM peak hour lane schematic for I-95. This operational deficiency is associated with the high mainline volume of 7,640 vph in the three-lane section of I-95 with maximum capacity of 6,750 vph. Congestion from this area extends to Baymeadows Road interchange and to the beginning of the study network affecting Baymeadows Road interchange operations. (highlighted in Table 5-10). In the southbound direction, congestion is found upstream of the I-95 southbound off-ramp to JTB during the AM and PM peak hours. The high densities found immediately upstream of the exit ramp (highlighted in Table 5-11) indicate recurring congestion associated with the high exiting ramp volume of 2,670 and 3,270 vph during the AM and PM peak hours, respectively. Complex maneuvers and lane changes occurring in this segment due to the downstream exit ramp result in reduced headway and higher freeway segment densities. The No-Build PM peak hour lane schematic for I-95 is shown later in this Section. In the southbound direction, the I-95 southbound to JTB off ramp terminal intersection experiences operational deficiencies. Queues from the ramp terminal intersection extend to the I-95 southbound mainline and affect mainline operation during AM and PM peaks (highlighted in Table 5-11). This is attributed mainly to the heavy left turn volume at the intersection. The lower link speed values and higher link densities at the ramp merge/diverge locations and on the freeway segments north and south of the I-95/JTB interchange indicate the need for geometric improvements at the I-95/JTB interchange and to the I-95 freeway mainline. By the end of the fifth hour of simulation in the AM peak period, the southbound congestion is dissipated. Additionally, congestion in the northbound direction north of JTB is limited to diverge to Bowden Road. By the end of the PM peak period simulation, all northbound congestion is dissipated and southbound congestion is limited to links north of the Bowden Road entrance. Tables 5-10 and 5-11 provide a summary of peak hour CORSIM MOEs for the I-95 mainline and ramps within the I-95/JTB IMR area of influence. The MOEs and other CORSIM results for both the peak hour and fifth hour of the simulation are provided in Appendix G.

5.0 NO-BUILD CONDITIONS I-95/ J. Turner Butler Blvd IMR
5-21
Table 5-10 Design Year 2035 No-Build Northbound I-95 Freeway MOEs
Table 5-11 Design Year 2035 No-Build Southbound I-95 Freeway MOEs
From ToDistance
(ft)
Speed
(mph)
Density
(vplpm)
Speed
(mph)
Density
(vplpm)
I-95 Northbound Begins 1427 24 92 63 24
1426 21 100 62 24
Baymeadows Road Exit 1427 18 102 60 23
Baymeadows Road Exit 1562 12 132 62 21
Baymeadows Road Entrance 931 12 131 61 21
Baymeadows Road Entrance 1625 16 114 50 34
1623 17 114 61 31
1560 22 87 58 32
1558 23 84 59 31
1331 24 80 55 34
SR 202/JT Butler Blvd Exit 1331 23 79 48 39
SR 202/JT Butler Blvd ExitSR 202/JT Butler Blvd EB
Entrance1813 27 54 37 43
SR 202/JT Butler Blvd EB Entrance 1380 26 46 28 44
SR 202/JT Butler Blvd WB Entrance 610 32 50 33 49
SR 202/JT Butler Blvd WB Entrance 1581 41 35 45 33
1581 49 37 56 30
Bowden Road Exit 1560 47 38 54 31
Bowden Road Exit 1615 51 36 58 31
1616 52 35 58 30
1573 51 36 56 31
686 54 34 57 31
953 58 31 60 29
I-95 Northbound Ends 902 61 30 62 29
PMFreeway Segment Link AM
From ToDistance
(ft)
Speed
(mph)
Density
(vplpm)
Speed
(mph)
Density
(vplpm)
I-95 Southbound Begins 906 46 53 13 129
943 44 59 12 136
1274 41 64 12 136
1072 38 69 12 136
1432 33 75 12 135
Bowden Road Entrance 1502 28 83 13 132
Bowden Road Entrance 1497 25 81 14 112
1330 26 66 19 82
SR 202/JT Butler Blvd Exit 1355 23 58 20 65
SR 202/JT Butler Blvd Exit 1411 53 24 54 24
SR 202/JT Butler Blvd WB Entrance 797 57 23 56 23
SR 202/JT Butler Blvd WB Entrance 890 53 22 51 26
SR 202/JT Butler Blvd EB Entrance 1323 59 26 57 30
SR 202/JT Butler Blvd EB Entrance 1505 60 24 57 28
1504 64 24 63 28
1503 66 24 66 27
1505 65 24 65 27
1165 64 24 65 27
Baymeadows Road Exit 1845 64 19 64 21
Baymeadows Road Exit 1325 66 16 65 22
Baymeadows Road Entrance 1325 67 16 66 22
Baymeadows Road Entrance 1370 66 12 64 19
1357 67 13 64 21
I-95 Southbound Ends 1401 62 19 60 30
PMFreeway Segment Link AM

321
Distance (ft) 1401 1357 1370 1325 1325 1845 1165 1505 1503 1504 1505 1323 890 797 1411 1355 1330 1497 1502 1432 1072 1274 943 906
Speed (mph) 62 67 66 67 66 64 64 65 66 64 60 59 53 57 53 23 26 25 28 33 38 41 44 46
Density (veh/ln/mi) 19 13 12 16 16 19 24 24 24 24 24 26 22 23 24 58 66 81 83 75 69 64 59 53
345 326329 328 327343 342 341 340 339 338344 337 323 322336 335 324334 333 332 331 330 325
Baymeadows SR 202/
Road Baymeadows SR 202/ SR 202/ JT Butler Blvd
Entrance Road JT Butler Blvd JT Butler Blvd Exit Bowden Road
374 vph Exit EB Entrance WB Entrance 2670 vph Entrance
630 ft 1830 vph 210 vph 950 vph 1100 ft 1440 vph2600 ft 10 1770 ft 420 ft 850 ft 10
9 9 9 9 9 9 9 9
1 1 1 1 1 1 1 1 1 1 1 1 1 1 1 1 1 1 1 1 1 1 1
2 2 2 2 2 2 2 2 2 2 2 2 2 2 2 2 2 2 2 2 2 2 2
Simulated Volumes 3678 3 3679 3 3679 3 3335 3 3335 3 4921 3 4920 3 4920 3 4919 3 4922 3 4927 3 4823 3 4827 3 4039 3 4039 3 6451 6462 3 6510 3 5304 3 5392 3 5474 3 5530 3 5592 3 5633 3
Demand Volumes 4234 4234 4234 3860 3860 5690 5690 5690 5690 5690 5690 5480 5480 4530 4530 7200 7200 7200 5760 5760 5760 5760 5760 5760
Demand Volumes 7420 7420 7420 6140 6140 7640 7640 7640 7640 7640 7640 5530 6050 6050 8800 8800 8800 7040 7040 7040 7040 7040 7040
Simulated Volumes 3 5875 3 5826 5782 3 4737 3 4732 3 5929 3 5906 3 5872 3 5846 3 5841 5855 3 4442 3 4773 3 4779 3 6720 3 6748 3 6774 3 5470 3 5485 3 5497 3 5501 3 5507 3 5512
2 2 2 2 2 2 2 2 2 2 2 2 2 2 2 2 2 2 2 2 2
1 1 1 1 1 1 1 1 1 1 1 1 1 1 1 1 1 1 1 1 1
9 9 9 9 9 9 9
200 ft 360 ft 200 ft 1300 ft 10
Baymeadows Baymeadows SR 202/ SR 202/ 780 ft Bowden Road
Road Road JT Butler Blvd JT Butler Blvd SR 202/ Exit
Exit Entrance Exit EB Entrance JT Butler Blvd 1760 vph
I-95 Southbound
Exit Entrance Exit EB Entrance JT Butler Blvd 1760 vph
1280 vph 1500 vph 2110 vph 520 vph WB Entrance
2750 vph
Distance (ft) 1427 1426 1427 1562 931 1625 1623 1560 1558 1331 1331 1813 1380 610 1581 1581 1560 1615 1616 1573 686 953 902
Speed (mph) 24 21 18 12 12 16 17 22 23 24 23 27 26 32 41 49 47 51 52 51 54 58 61
Density (veh/ln/mi) 92 100 102 132 131 114 114 87 84 80 79 54 46 50 38 37 38 36 35 36 34 31 30
143
511 Node Number Freeway Geometric Coloring
Density (Veh/Mi/Ln)
20 and below Density above 75
20 - 30 Density above 45
30 - 45 Density above 35
121 122 123 124 125 126 140 141 142130 131 138 139127 128
I-95 Northbound
132 133 135 136 137199 129 134
LEGEND
Speed (mph)
45 and above
900 Demand volume highlighted if simulated falls below = 90%
809 Simulated volume
I-95/ SR 202/JT Butler Boulevard Interchange Modification Report
AM Peak Hour MOE'sI-95 Lane Schematic
No-Build 2035
No Build 2035 AM Peak Hour Lane Schematic
Page 1 of 2

321
Distance (ft) 1401 1357 1370 1325 1325 1845 1165 1505 1503 1504 1505 1323 890 797 1411 1355 1330 1497 1502 1432 1072 1274 943 906
Speed (mph) 60 64 64 66 65 64 65 65 66 63 57 57 51 56 54 20 19 14 13 12 12 12 12 13
Density (veh/ln/mi) 30 21 19 22 22 21 27 27 27 28 28 30 26 23 24 65 82 112 132 135 136 136 136 129
345 326329 328 327343 342 341 340 339 338344 337 323 322336 335 324334 333 332 331 330 325
Baymeadows SR 202/
Road Baymeadows SR 202/ SR 202/ JT Butler Blvd
Entrance Road JT Butler Blvd JT Butler Blvd Exit Bowden Road
1126 vph Exit EB Entrance WB Entrance 3270 vph Entrance
630 ft 1500 vph 250 vph 1860 vph 1100 ft 1760 vph2600 ft 10 1770 ft 420 ft 850 ft 10
9 9 9 9 9 9 9 9
1 1 1 1 1 1 1 1 1 1 1 1 1 1 1 1 1 1 1 1 1 1 1
2 2 2 2 2 2 2 2 2 2 2 2 2 2 2 2 2 2 2 2 2 2 2
Simulated Volumes 5401 3 5394 3 5393 3 4295 3 4289 3 5300 3 5298 3 5302 3 5306 3 5311 3 5313 3 5125 3 5132 3 3946 3 3951 3 6286 6296 3 6288 3 4976 3 4968 3 4960 3 4954 3 4956 3 4956 3
Demand Volumes 7266 7266 7266 6140 6140 7640 7640 7640 7640 7640 7640 7390 7390 5530 5530 8800 8800 8800 7040 7040 7040 7040 7040 7040
Demand Volumes 4431 4431 4431 3860 3860 5690 5690 5690 5690 5690 5690 4530 4950 4950 7200 7200 7200 5760 5760 5760 5760 5760 5760
Simulated Volumes 3 4431 3 4429 4425 3 3854 3 3852 3 5570 3 5566 3 5557 3 5554 3 5557 5560 3 4442 3 4794 3 4791 3 6692 3 6687 3 6692 3 5318 3 5312 3 5308 3 5309 3 5309 3 5307
2 2 2 2 2 2 2 2 2 2 2 2 2 2 2 2 2 2 2 2 2
1 1 1 1 1 1 1 1 1 1 1 1 1 1 1 1 1 1 1 1 1
9 9 9 9 9 9 9
200 ft 360 ft 200 ft 1300 ft 10
Baymeadows Baymeadows SR 202/ SR 202/ 780 ft Bowden Road
Road Road JT Butler Blvd JT Butler Blvd SR 202/ Exit
Exit Entrance Exit EB Entrance JT Butler Blvd 1440 vph
I-95 Southbound
Exit Entrance Exit EB Entrance JT Butler Blvd 1440 vph
571 vph 1830 vph 1160 vph 420 vph WB Entrance
2250 vph
Distance (ft) 1427 1426 1427 1562 931 1625 1623 1560 1558 1331 1331 1813 1380 610 1581 1581 1560 1615 1616 1573 686 953 902
Speed (mph) 63 62 60 62 61 50 61 58 59 55 48 37 28 33 45 56 54 58 58 56 57 60 62
Density (veh/ln/mi) 24 24 23 21 21 34 31 32 31 34 39 43 44 49 33 30 31 31 30 31 31 29 29
143
511 Node Number Freeway Geometric Coloring
Density (Veh/Mi/Ln)
20 and below Density above 75
20 - 30 Density above 45
30 - 45 Density above 35
121 122 123 124 125 126 140 141 142130 131 138 139127 128
I-95 Northbound
132 133 135 136 137199 129 134
LEGEND
Speed (mph)
45 and above
900 Demand volume highlighted if simulated falls below = 90%
809 Simulated volume
I-95/ SR 202/JT Butler Boulevard Interchange Modification Report
PM Peak Hour MOE'sI-95 Lane Schematic
No-Build 2035
No Build 2035 PM Peak Hour Lane Schematic
Page 1 of 2

321
Distance (ft) 1401 1357 1370 1325 1325 1845 1165 1505 1503 1504 1505 1323 890 797 1411 1355 1330 1497 1502 1432 1072 1274 943 906
Speed (mph) 63 68 66 68 67 66 67 67 68 68 65 63 57 63 63 60 63 62 63 63 63 63 64 64
Density (veh/ln/mi) 11 8 8 9 9 8 10 11 10 10 9 9 8 5 4 0 0 0 0 0 0 0 0 0
323 322336 335 324334 333 332 331 330 325345 326329 328 327343 342 341 340 339 338344 337
Baymeadows SR 202/
Road Baymeadows SR 202/ SR 202/ JT Butler Blvd
Entrance Road JT Butler Blvd JT Butler Blvd Exit Bowden Road
260 vph Exit EB Entrance WB Entrance 1328 vph Entrance
630 ft 652 vph 128 vph 428 vph 1100 ft 716 vph2600 ft 10 1770 ft 420 ft 850 ft 10
9 9 9 9 9 9 9 9
1 1 1 1 1 1 1 1 1 1 1 1 1 1 1 1 1 1 1 1 1 1 1
2 2 2 2 2 2 2 2 2 2 2 2 2 2 2 2 2 2 2 2 2 2 2
Simulated Volumes 2524 3 2525 3 2523 3 2194 3 2191 3 2924 3 2915 3 2913 3 2905 3 2900 3 2896 3 2722 3 2723 3 2090 3 2087 3 3419 3412 3 3412 3 2694 3 2689 3 2686 3 2687 3 2687 3 2684 3
Demand Volumes 2232 2232 2232 1972 1972 2624 2624 2624 2624 2624 2624 2496 2496 2068 2068 3396 3396 3396 2680 2680 2680 2680 2680 2680
Demand Volumes 3064 3064 3064 2616 2616 3296 3296 3296 3296 3296 3296 2588 2964 2964 3904 3904 3904 2980 2980 2980 2980 2980 2980
Simulated Volumes 3 4979 3 5068 5157 3 4493 3 4559 3 5778 3 5870 3 5928 3 5965 3 5980 6000 3 4744 3 5297 3 5296 3 6760 3 6770 3 6773 3 5130 3 5137 3 5142 3 5145 3 5149 3 5150
2 2 2 2 2 2 2 2 2 2 2 2 2 2 2 2 2 2 2 2 2
1 1 1 1 1 1 1 1 1 1 1 1 1 1 1 1 1 1 1 1 1
9 9 9 9 9 9 9
200 ft 360 ft 200 ft 1300 ft 10
Baymeadows Baymeadows SR 202/ SR 202/ 780 ft Bowden Road
Road Road JT Butler Blvd JT Butler Blvd SR 202/ Exit
Exit Entrance Exit EB Entrance JT Butler Blvd 924 vph
I-95 Southbound
Exit Entrance Exit EB Entrance JT Butler Blvd 924 vph
448 vph 680 vph 708 vph 376 vph WB Entrance
940 vph
Distance (ft) 1427 1426 1427 1562 931 1625 1623 1560 1558 1331 1331 1813 1380 610 1581 1581 1560 1615 1616 1573 686 953 902
Speed (mph) 27 23 22 16 14 17 17 22 21 23 22 26 26 31 45 54 48 59 59 58 59 61 62
Density (veh/ln/mi) 80 93 94 116 118 108 116 90 92 87 85 58 49 53 34 33 37 29 29 30 29 28 28
143
511 Node Number Freeway Geometric Coloring
Density (Veh/Mi/Ln)
20 and below Density above 75
20 - 30 Density above 45
30 - 45 Density above 35
I-95 Northbound
132 133 135 136 137199 129 134
LEGEND
Speed (mph)
121 122 123 124 125 126 140 141 142130 131 138 139127 128
45 and above
900 Demand volume highlighted if simulated falls below = 90%
809 Simulated volume
I-95/ SR 202/JT Butler Boulevard Interchange Modification Report
AM 5thHour MOE'sI-95 Lane Schematic
No-Build 2035
No Build 2035 AM 5th Hour Lane Schematic
Page 1 of 2

321
Distance (ft) 1401 1357 1370 1325 1325 1845 1165 1505 1503 1504 1505 1323 890 797 1411 1355 1330 1497 1502 1432 1072 1274 943 906
Speed (mph) 61 65 65 66 65 65 65 65 66 64 59 58 55 59 57 57 59 60 59 60 60 60 61 62
Density (veh/ln/mi) 26 19 16 23 23 21 27 27 26 27 27 30 23 27 28 29 33 33 48 47 47 47 46 45
323 322336 335 324334 333 332 331 330 325345 326329 328 327343 342 341 340 339 338344 337
Baymeadows SR 202/
Road Baymeadows SR 202/ SR 202/ JT Butler Blvd
Entrance Road JT Butler Blvd JT Butler Blvd Exit Bowden Road
324 vph Exit EB Entrance WB Entrance 1488 vph Entrance
630 ft 484 vph 100 vph 312 vph 1100 ft 552 vph2600 ft 10 1770 ft 420 ft 850 ft 10
9 9 9 9 9 9 9 9
1 1 1 1 1 1 1 1 1 1 1 1 1 1 1 1 1 1 1 1 1 1 1
2 2 2 2 2 2 2 2 2 2 2 2 2 2 2 2 2 2 2 2 2 2 2
Simulated Volumes 4837 3 4828 3 4830 3 4510 3 4504 3 5260 3 5257 3 5257 3 5252 3 5251 3 5249 3 5137 3 5124 3 4625 3 4622 3 7260 7251 3 7241 3 6680 3 6685 3 6682 3 6682 3 6682 3 6682 3
Demand Volumes 3080 3080 3080 2756 2756 3240 3240 3240 3240 3240 3240 3140 3140 2828 2828 4316 4316 4316 3764 3764 3764 3764 3764 3764
Demand Volumes 1860 1860 1860 1720 1720 2228 2228 2228 2228 2228 2228 1892 2044 2044 2660 2660 2660 2152 2152 2152 2152 2152 2152
Simulated Volumes 3 1859 3 1860 1860 3 1714 3 1715 3 2234 3 2234 3 2234 3 2230 3 2230 2232 3 1893 3 2058 3 2061 3 3345 3 3345 3 3343 3 2811 3 2815 3 2820 3 2819 3 2815 3 2817
2 2 2 2 2 2 2 2 2 2 2 2 2 2 2 2 2 2 2 2 2
1 1 1 1 1 1 1 1 1 1 1 1 1 1 1 1 1 1 1 1 1
9 9 9 9 9 9 9
200 ft 360 ft 200 ft 1300 ft 10
Baymeadows Baymeadows SR 202/ SR 202/ 780 ft Bowden Road
Road Road JT Butler Blvd JT Butler Blvd SR 202/ Exit
Exit Entrance Exit EB Entrance JT Butler Blvd 508 vph
I-95 Southbound
Exit Entrance Exit EB Entrance JT Butler Blvd 508 vph
140 vph 508 vph 336 vph 152 vph WB Entrance
616 vph
Distance (ft) 1427 1426 1427 1562 931 1625 1623 1560 1558 1331 1331 1813 1380 610 1581 1581 1560 1615 1616 1573 686 953 902
Speed (mph) 64 64 63 64 64 62 63 63 63 63 62 63 61 62 60 63 61 62 62 62 62 63 63
Density (veh/ln/mi) 1 1 1 2 2 0 0 0 0 0 0 0 0 0 1 3 2 4 4 4 5 6 7
143
511 Node Number Freeway Geometric Coloring
Density (Veh/Mi/Ln)
20 and below Density above 75
20 - 30 Density above 45
30 - 45 Density above 35
I-95 Northbound
132 133 135 136 137199 129 134
LEGEND
Speed (mph)
121 122 123 124 125 126 140 141 142130 131 138 139127 128
45 and above
900 Demand volume highlighted if simulated falls below = 90%
809 Simulated volume
I-95/ SR 202/JT Butler Boulevard Interchange Modification Report
PM 5th Hour MOE'sI-95 Lane Schematic
No-Build 2035
No Build 2035 PM 5th Hour Lane Schematic
Page 1 of 2

5.0 NO-BUILD CONDITIONS I-95/ J. Turner Butler Blvd IMR
5-26
JTB Freeway Operational Performance
The CORSIM model results, presented in Tables 5-12 and 5-13, indicate that there are operational deficiencies on the JTB westbound mainline in Design Year 2035 No-Build traffic conditions. The No-Build AM and PM Peak Heat Diagrams illustrate the locations and duration of congestion within the study area. This is done by illustrating the speed distribution with the lowest speeds shown in red corresponding to the areas of highest congestion. In both the AM and PM peak periods, congestion occurs along the westbound JTB mainline from east of Belfort Road through the Belfort Road/JTB merge area. During the PM peak period, this congestion lasts for the duration of the simulation. In the westbound direction, recurring congestion is found downstream of the JTB merge with the Belfort Road during AM and PM peak periods. Complex maneuvers such as weaving and lane changes occurring in this segment due to the downstream multiple destinations (exit to I-95 northbound, exit to I-95 southbound and Philips Highway) result in the decreased speed and higher densities on the JTB westbound mainline (highlighted in Table 5-13). The I-95 northbound mainline downstream of the JTB entrance ramp does not have adequate capacity. Therefore congestion occurs at the merge and affects JTB westbound to I-95 northbound operations. Low speeds and high densities were also observed along JTB westbound mainline resulting from this congestion as shown in the AM and PM peak hour JTB lane schematics. By the end of the peak period simulation (5th hour) the congestion along JTB westbound mainline experiences some improvement during the AM, no dissipation of congestion is experienced in the PM prior to the end of simulation. CORSIM model results indicate that, the combined queue in the westbound direction from the JTB westbound/ Belfort Road merge extend to the beginning of the network and does not dissipate at the end of the simulation. The I-95 southbound ramp terminal intersection continues to experience heavy queues. FHWA Traffic Analysis Tool Box Volume III provides guidance on correcting biases in the results for the vehicle queues present at the end of the simulation period. Network-wide statistics were corrected for congestion extending beyond the end of the simulation period. Appendix G includes calculation of the residual delay related to the unmet demand.

Distance (ft) 1180 1753 664 852 1469
Speed (mph) 7 8 10 10 11
Density (veh/ln/mi) 150 149 127 131 134
Belfort
Road
Exit
706 705710 709 708 707
Exit
1970 vph
1 1 1
1 1 2 2 2
Simulated Volumes 2434 2 2433 2 3738 3 3760 3 3804 3
Demand Volumes 3850 3850 5820 5820 5820
Demand Volumes 2991 2991 2991 4040 4040 4580 4580 4580
Simulated Volumes 2 2555 2 2555 2 2557 3 3219 3 3220 3 3754 3 3743 3 3733
1 1 1 2 2 2 2 2
1 1 1 1 1
200 ft
CD Entrance Belfort
to Mainline road
1049 vph Entrance
JTB Westbound
1049 vph Entrance
540 vph
Distance (ft) 212 605 967 1196 1453 390 1498 1471
Speed (mph) 44 51 52 52 53 47 52 52
Density (veh/ln/mi) 29 25 24 20 20 22 24 23
511 Node Number Freeway Geometric Coloring
Density (Veh/Mi/Ln)
JTB Eastbound
505 506 507 508 509 510 511 512 513
LEGEND
Density (Veh/Mi/Ln)
20 and below Density above 75
20 - 30 Density above 45
30 - 45 Density above 35
45 and above
900 Demand volume highlighted if simulated falls below = 90%
809 Simulated volume
Speed (mph)
I-95/ SR 202/JT Butler Boulevard Interchange Modification Report
AM Peak Hour MOE'sJT Butler Boulevard Lane Schematic
No-Build 2035
No Build 2035 AM Peak Hour Lane Schematic
Page 2 of 2

Distance (ft) 1180 1753 664 852 1469
Speed (mph) 7 7 8 7 7
Density (veh/ln/mi) 150 150 132 135 144
Belfort
Road
Exit
706 705710 709 708 707
Exit
1030 vph
1 1 1
1 1 2 2 2
Simulated Volumes 2336 2 2330 2 2982 3 2977 3 2972 3
Demand Volumes 3550 3550 4580 4580 4580
Demand Volumes 3559 3559 3559 4140 4140 5820 5820 5820
Simulated Volumes 2 2743 2 2741 2 2740 3 3241 3 3243 3 4837 3 4826 3 4820
1 1 1 2 2 2 2 2
1 1 1 1 1
200 ft
CD Entrance Belfort
to Mainline road
581 vph Entrance
JTB Westbound
581 vph Entrance
1680 vph
Distance (ft) 212 605 967 1196 1453 390 1498 1471
Speed (mph) 44 51 52 52 52 39 51 52
Density (veh/ln/mi) 31 27 26 21 21 35 31 31
511 Node Number Freeway Geometric Coloring
Density (Veh/Mi/Ln)
JTB Eastbound
505 506 507 508 509 510 511 512 513
LEGEND
Density (Veh/Mi/Ln)
20 and below Density above 75
20 - 30 Density above 45
30 - 45 Density above 35
45 and above
900 Demand volume highlighted if simulated falls below = 90%
809 Simulated volume
Speed (mph)
I-95/ SR 202/JT Butler Boulevard Interchange Modification Report
PM Peak Hour MOE'sJT Butler Boulevard Lane Schematic
No-Build 2035
No Build 2035 PM Peak Hour Lane Schematic
Page 2 of 2

Distance (ft) 1180 1753 664 852 1469
Speed (mph) 29 30 33 35 36
Density (veh/ln/mi) 70 63 47 50 49
Belfort
Road
Exit
706 705710 709 708 707
Exit
556 vph
1 1 1
1 1 2 2 2
Simulated Volumes 2155 2 2081 2 2867 3 2822 3 2757 3
Demand Volumes 1208 1208 1764 1764 1764
Demand Volumes 1460 1460 1460 1900 1900 2172 2172 2172
Simulated Volumes 2 2147 2 2146 2 2145 3 2750 3 2751 3 3030 3 3032 3 3032
1 1 1 2 2 2 2 2
1 1 1 1 1
200 ft
CD Entrance Belfort
to Mainline road
440 vph Entrance
JTB Westbound
440 vph Entrance
272 vph
Distance (ft) 212 605 967 1196 1453 390 1498 1471
Speed (mph) 46 53 53 53 53 51 53 53
Density (veh/ln/mi) 23 20 20 17 17 16 19 18
511 Node Number Freeway Geometric Coloring
Density (Veh/Mi/Ln)
LEGEND
JTB Eastbound
505 506 507 508 509 510 511 512 513
Density (Veh/Mi/Ln)
20 and below Density above 75
20 - 30 Density above 45
30 - 45 Density above 35
45 and above
900 Demand volume highlighted if simulated falls below = 90%
809 Simulated volume
Speed (mph)
I-95/ SR 202/JT Butler Boulevard Interchange Modification Report
AM 5th Hour MOE'sJT Butler Boulevard Lane Schematic
No-Build 2035
No Build 2035 AM 5th Hour Lane Schematic
Page 2 of 2

Distance (ft) 1180 1753 664 852 1469
Speed (mph) 7 7 8 7 6
Density (veh/ln/mi) 150 150 130 145 150
Belfort
Road
Exit
706 705710 709 708 707
Exit
200 vph
1 1 1
1 1 2 2 2
Simulated Volumes 2528 2 2527 2 3001 3 3001 3 3001 3
Demand Volumes 1116 1116 1316 1316 1316
Demand Volumes 1268 1268 1268 1372 1372 1716 1716 1716
Simulated Volumes 2 2045 2 2049 2 2060 3 2214 3 2226 3 2594 3 2600 3 2596
1 1 1 2 2 2 2 2
1 1 1 1 1
200 ft
CD Entrance Belfort
to Mainline road
104 vph Entrance
JTB Westbound
104 vph Entrance
344 vph
Distance (ft) 212 605 967 1196 1453 390 1498 1471
Speed (mph) 45 52 52 52 53 50 53 53
Density (veh/ln/mi) 20 18 18 12 12 7 10 10
511 Node Number Freeway Geometric Coloring
Density (Veh/Mi/Ln)
LEGEND
JTB Eastbound
505 506 507 508 509 510 511 512 513
Density (Veh/Mi/Ln)
20 and below Density above 75
20 - 30 Density above 45
30 - 45 Density above 35
45 and above
900 Demand volume highlighted if simulated falls below = 90%
809 Simulated volume
Speed (mph)
I-95/ SR 202/JT Butler Boulevard Interchange Modification Report
PM 5th Hour MOE'sJT Butler Boulevard Lane Schematic
No-Build 2035
No Build 2035 PM 5th Hour Lane Schematic
Page 2 of 2

5.0 NO-BUILD CONDITIONS I-95/ J. Turner Butler Blvd IMR
5-31
Table 5-12- Design Year 2035 No-Build Eastbound JTB Freeway MOEs
Table 5-13 Design Year 2035 No-Build Westbound JTB Freeway MOEs
Arterial Operational Performance
The results of the CORSIM arterial operational analysis indicate that several study intersections will experience undesirable traffic operations in Design Year 2035 No-Build Alternative. These intersections are listed below:
• JTB at Philips Highway- AM and PM peak.
• JTB at Bonneval Road- AM and PM peak
• Baymeadows Road at I-95 NB On/Off- AM peak.
• Baymeadows Road at I-95 SB On/Off- PM peak
• Bowden Road at I-95 SB On –PM peak
• Bowden Road at I-95 NB Off –PM peak
• Belfort Road at Southpoint Drive- PM peak Table 5-14 provides a summary of the CORSIM MOEs for the study intersections during AM and PM peak hours.
From ToDistance
(ft)
Speed
(mph)
Density
(vplpm)
Speed
(mph)
Density
(vplpm)
SR 202/JT Butler Blvd Eastbound Begins 212 44 29 44 31
605 51 25 51 27
I-95 Northbound Entrance 967 52 24 52 26
I-95 Northbound Entrance 1196 52 20 52 21
Belfort Road Entrance 1453 53 20 52 21
Belfort Road Entrance 390 47 22 39 35
1498 52 24 51 31
SR 202/JT Butler Blvd Eastbound Ends 1471 52 23 52 31
PMFreeway Segment Link AM
From ToDistance
(ft)
Speed
(mph)
Density
(vplpm)
Speed
(mph)
Density
(vplpm)
SR 202/JT Butler Blvd Westbound Begins 1469 11 134 7 144
852 10 131 7 135
Belfort Road Exit 664 10 127 8 132
Belfort Road Exit 1753 8 149 7 150
SR 202/JT Butler Blvd Westbound Ends 1180 7 150 7 150
PMFreeway Segment Link AM

5.0 NO-BUILD CONDITIONS I-95/ J. Turner Butler Blvd IMR
5-32
Table 5-14 Design Year 2035 No-Build Arterial MOEs (Control Delay)
1. Control Delay is in terms of seconds/vehicle
2. Intersection delay greater than the threshold value of 55 sec/veh, which is considered undesirable
3. Queue from the I-95 southbound off ramp intersection extends to I-95 southbound mainline. Control delay from
CORSIM does not accurately represent intersection delay since all the traffic is not processed at the off ramp and
the intersection. Synchro/Capacity analysis show that this intersection operates at LOS F.
L T R D L T R D
WB 902-901 95 - 61 - 82 69 - 43 - 61
NB 966-901 - 96 246 - 168 2022- 203 389 - 269 2322
SB 967-901 9234 45 - - 364 3293 93 - - 385
WB 978-902 67 10 1 - 30 113 29 12 - 49
EB 901-902 207 193 147 - 192 1962364 362 282 - 356 1302
NB 923-902 245 610 561 - 502 82 67 56 - 60
SB 924-902 925 28 42 - 522 468 31 24 - 331
EB 900-903 - 43 - - 43 - 41 - - 41
WB 904-903 - 25 - 30 27 34 - 26 - 33 27 342
SB 927-903 30 - 40 - 32 31 - 41 - 33
EB 909-910 63 69 43 - 54 77 93 37 - 68
SB 911-910 0 4 - - 3 29 0 2 - - 1 45
NB 975-910 - 58 2 63 50 - 77 10 99 67
NB 910-911 0 0 - - 0 0 8 - - 4
WB 912-911 44 51 - - 47 42 58 65 - - 62 24
SB 941-911 - 87 - 87 87 - 39 - 49 46
NB 910-917 7 4 4 - 5 22 5 4 - 11
EB 939-917 6 11 6 - 10 12 26 37 34 - 37 30
WB 948-917 38 42 17 - 38 44 40 24 - 42
SB 949-917 44 57 3 - 10 44 52 22 - 24
SB 940-918 59 29 12 - 29 71 41 20 - 41
NB 972-918 54 26 2 - 38 33 51 69 3 - 57 602
EB 950-918 45 49 16 - 23 116 123 82 - 90
WB 951-918 52 51 35 - 51 56 52 46 - 54
SB 920-919 101 16 - - 20 34 26 - - 28
EB 955-919 - 36 1 - 32 48 - 58 29 195 88 642
EB 956-919 56 - 118 - 92 51 - 46 - 50
WB 919-920 329 18 - - 49 17 1 - - 6
NB 959-920 - 148 682 55 291 1332- 61 5 49 40 23
NB 960-920 51 - 23 - 45 60 - 44 - 51
EB 922-921 42 0 - - 18 96 2 - - 31
EB 963-921 - 13 18 - 16 17 - 57 266 - 166 992
WB 921-922 - 12 - - 12 - 22 - - 22
NB 964-922 - 50 - - 50 25 - 282 - - 282 1012
SB 965-922 16 - 10 - 12 15 - 12 - 13
Location
WB JTB @ Belfort Road
JTB @ Philips Highway
JTB @ Bonneval Rd
Intersection Approach Link Approach
Baymeadows Road @ I-95 NB
off ramps
Bowden Road @ I-95 SB off
ramps
Bowden Road @ I-95 NB off
ramps
Total Delay by Movement
Belfort Road @ A C Skinner
Pkwy
Belfort Road @ Southpoint Dr
Baymeadows Road @ I-95 SB
off ramps
JTB @ SB I-95 Off ramp
EB JTB @ Belfort Road
Intersection Approach Intersection
PM Peak Control Delay1
Total Delay by Movement
AM Peak Control Delay1

6.0 ALTERNATIVES I-95/ J. Turner Butler Blvd. IMR
6-1
6.0 ALTERNATIVES
As part of this IMR, the following alternatives have been considered:
• No-Build
• Transportation System Management (TSM) alternatives and other programmed and planned improvements on adjacent interchanges and consideration of other options such as alternative travel modes and auxiliary lanes.
• Transportation Demand Management (TDM)
• Build Alternatives
The alternatives were analyzed to assess their effectiveness in meeting the future travel demand of the I-95/JTB interchange as well as the physical and social impacts, and safety and environmental considerations associated with each alternative.
6.1 No-Build Alternative
The No-Build alternative provides a baseline for comparison to all study alternatives. This alternative represents the existing physical and operational conditions within the area of influence including all planned and programmed roadway improvements over the course of the analysis years. Since the basis for any interchange proposal is based on a comparison of the No-Build and Build Alternatives, identification of the network that is considered in the No-Build Alternative in each analysis year is required. The No-Build Alternative assumes the existing plus committed roadway network and no additional improvements. Currently there are no committed improvements within the study area of influence. As shown in the operational analysis section, the No-Build alternative does not satisfy the objectives of this project and cannot handle the projected traffic demand. The AADTs, design hour volumes, and level of service for the No-Build Alternative are provided in Section 5.
6.2 Transportation System Management Alternative
TSM measures involve optimizing the use of existing facilities. These measures will selectively upgrade deficient roadway areas with improved signing, pavement marking and merging lanes. TSM improvements to the existing roadway network and interchanges would not provide the necessary capacity to handle the future traffic volumes within the I-95/JTB interchange area. No TSM alternatives were evaluated in this IMR.
6.3 Transportation Demand Management Alternative
Transportation Demand Management (TDM) measures are intended to reduce the demand on single occupant vehicle travel. Examples of TDM measures that could be implemented within the area of influence include the following: increased transit alternative travel modes, High Occupancy Vehicle (HOV) lanes, ride share programs and park-and-ride facilities. Although

6.0 ALTERNATIVES I-95/ J. Turner Butler Blvd. IMR
6-2
JTA operates a park and ride lot at the corner of JTB/Philips Highway intersection, it can neither reduce the traffic significantly nor can it be expanded to meet the traffic needs of the area.
6.4 Build Alternatives
Two alternatives have been developed and evaluated in this IMR: an Interim Build Alternative and an Ultimate Build Alternative. Both these alternatives are discussed in detail below.
6.4.1 Interim Build Alternative
One of the objectives of this IMR is to identify an interim or phased alternative before funding is available for construction of the Ultimate Build Alternative. The following are the major improvements of the Interim Build Alternative:
• A 2 lane flyover is proposed for the I-95 southbound to JTB eastbound movement. The existing I-95 southbound off ramp terminal will be modified to include two left and two right turn lanes.
• Installation of a signal at the I-95 northbound off ramp terminal intersection. The existing ramp will be relocated to provide single left and two right turn lanes at the signal. In addition one free flow right turn lane will be maintained. This configuration will provide for the northbound to westbound movement at the signal which is missing from the existing configuration.
• Construction of a 2 lane JTB westbound to I-95 northbound flyover ramp.
• Provide an additional lane on the westbound JTB to I-95 southbound loop ramp making it a 2 lane ramp. The merge point of this loop ramp will be relocated downstream. The two lane loop ramp will first merge with the single lane JTB eastbound to I-95 southbound on ramp before merging with I-95.
• In the westbound direction, a two lane on ramp from Belfort merges with the two lanes JTB mainline forming a four lane section. The outermost lane leads to I-95 northbound as a single lane ramp. Of the remaining three westbound lanes, one lane exits at the loop ramp to I-95 southbound. The remaining two lanes along with a third lane from the I-95 northbound left movement continue westbound towards Philips Highway. Another opportunity is provided for traffic to access the loop ramp to I-95 southbound from these through lanes. This helps is minimize the weave by providing longer merge distances.
• Provide a right out movement at Salisbury Road South on to JTB eastbound.
• Eliminate access to and from Salisbury Road North.
• Provide three westbound through lanes from I-95 southbound off ramp terminal to Philips Highway.
• Provide three eastbound through lanes from Philips Highway to the slip ramp on to I-95 southbound.
The Interim Build Alternative interchange concept is shown in Figure 6-1.

6.0 ALTERNATIVES I-95/ J. Turner Butler Blvd. IMR
6-3
6.4.2 Ultimate Build Alternative
The Ultimate Build Alternative is very similar to the Interim Build Alternative with a few design modifications. It includes reconstruction of the I-95/JTB interchange bridges. Following are the other design modifications of the Ultimate Build Alternative that will impact traffic operations:
• In the eastbound direction, the third through lane is carried to the JTB eastbound to I-95 northbound loop ramp. This lane bypasses the signal at the I-95 southbound off ramp terminal intersection.
• Relocation of the exit gore point of JTB westbound to I-95 southbound further upstream along JTB. This increases the merge distance for travelers on JTB westbound to access the loop ramp.
The Ultimate Build Alternative interchange concept is shown in Figure 6-2. Figure 6-3 presents the conceptual signing plan for the proposed interchange and the area of influence.
6.5 Build Alternative Design Traffic
The Build Alternative Design traffic for future years 2015, 2025, and 2035 was developed using NERPM. As mentioned in the previous sections, the travel demand model was run for the No-Build configuration and forecasts were developed for the future years. Traffic for the Interim and Ultimate Build Alternatives was developed by redistributing the No-Build traffic as per the design modifications. The future year Interim and Ultimate Build Alternative AADTs for 2015, 2025, and 2035 are shown in Figure 6-4. Peak hour traffic forecasts were developed by applying the Standard K and D30 factors listed in Section 2.5. Future Year Interim and Ultimate Build Alternative AM and PM peak hour volumes for 2015, 2025, and 2035 are shown in Figures 6-5, 6-6, and 6-7 respectively.

95INTERSTATE
95INTERSTATE
C. C
.
C. C
.
C. C.
C. C
.
C. C.C. C.
C. C.
Interim Build Alternative6-1
Figure
Interchange Modification ReportI-95/ J. Turner Butler Blvd
95INTERSTATE 95
INTERSTATE
0 100 400
FeetN
202
Belford R
d
Belford R
d
202
Butler
Blv
d
Philips Hwy
Salsbury Rd South
Salsbury Rd
North

Interchange Modification ReportI-95/ J. Turner Butler Blvd
Ultimate Build Alternative6-2
Figure
95INTERSTATE 95
INTERSTATE
0 100 400
FeetN
Philips Hwy
Butler
Blv
d 2
02
Belford R
d
Belford R
d
202
Salsbury Rd South
Salsbury Rd
North

N
95INTERSTATEINTERSTATE
N.T.S.
INTERCHANGE MODIFICATION REPORTI-95/JTB Interchange Figure 6-3

a. 4,800b. 5,500c. 6,400
a. 5,800b. 6,700c. 7,800
a. 2,600b. 3,400c. 4,200
a. 7,400b. 8,600c. 10,000
a. 20,100b. 23,300c. 27,100
a. 16,900b. 19,700c. 22,900
a. 19,500b. 23,300c. 27,800
a. 17,800b. 21,200c. 25,300
a. 10,000b. 13,000c. 16,000
a. 46,500b. 55,000c. 65,000
a. 46,500b. 55,000c. 65,000
a. 10,000b. 13,000c. 16,000
a. 16,400b. 18,700c. 21,900
a. 17,000b. 20,100c. 24,300
a. 33,400b. 38,800c. 46,200
a. 36,300b. 43,300c. 51,600
a. 62,000b. 71,600c. 80,500a. 13,000
b. 16,000c. 20,000
a. 21,700b. 25,200c. 29,300
a. 13,500b. 16,500c. 20,400
a. 61,000b. 72,200c. 83,800
a. 14,600b. 17,400c. 20,800
a. 46,400b. 54,800c. 63,000a. 46,400
b. 54,800c. 63,000
a. 14,600b. 17,400c. 20,800
a. 61,000b. 72,200c. 83,800
a. 10,900b. 13,100c. 16,200
a. 27,500b. 31,900c. 37,100
a. 13,000b. 16,000c. 20,000
a. 62,000b. 71,600c. 80,500
a. 75,000b. 87,600c. 100,500a. 75,000
b. 87,600c. 100,500
A.C. SkinnerPkwy
Southpoint Pkwy
J. Turner Butler Blvd
Belfort Rd
Southpoint Blvd
Bonneval Rd
Philips Hwy
Salisbury Rd
N. T. S.
Phillips Hwy
Bonneval Rd
ToBowden RdFrom
Bowden Rd
ToBaymeadows Rd
FromBaymeadows Rd
§̈¦95
J. Turner Butler Blvd
§̈¦95
Legend
Butler BlvdJ. Turner
Design Year 2035 AADT Volumec. X,XXX
Interim Year 2025 AADT Volumeb. X,XXX
Opening Year 2015 AADT Volumea. X,XXX
I-95 / J. Turner Butler BlvdInterchange Modification Report
Interim and Ultimate Build Annual Average Daily Traffic (AADT)
Figure 6-4
a. 2,600b. 3,400c. 4,200
a. 7,400b. 8,600c. 10,000
a. 9,999b. 9,999c. 27,100
a. 5,800b. 6,700c. 7,800
a. 10,900b. 13,100c. 16,200
Ultimate Build Alternative

3,810(5,505)
5,545(3,910)
6,655(5,280)5,145
(5,960)
1,110(995)
5,545(4,285)
225(455)
30(60) 3,240
(4,565)
5,120(3,655)
2,195(4,165)
4,430(2,555)
1,115(1,355)
1,485(960)
240(255)
530(225)
4,270(4,770)
2,190(2,145)
655(575)
730(1,510)
1,615(1,340)
3,195 (3,300)1,480 (2,115)
505 (1,055)
1,565 (835)
435 (1,345)
1,540 (830)
1,865 (1,640)
490 (435)2,500 (1,525)
2,805 (3,220)
875 (1,190)
1,535 (1,570)
125 (180)
2,355 (2,075) 1,715 (1,185)
475 (
196)
17 (2
3)
305 (
830)
310 (235)
170 (250)
445 (340)
670 (
199)
1,043
(919
)
835 (
355)
700 (
1,045
)
35 (35)
885 (1,115)
133 (
95)
84 (3
0)
695 (
700)15
0 (43
0)
345 (340)
45 (50)
214 (249)
82 (173)
465 (435)
25 (35)
1,855 (1,590)
1,545 (1,355)
47 (13)
275 (680)
113 (
853)
646 (
955)
455 (
1,070
)
580 (
785)
25 (35)
1,085 (1,170)
1 (4)
668 (
267)
340 (
725)
45 (65)
175 (
175)
585 (875)
780 (400)
1,310
(785
)
11 (5
1)
72 (6
7)
115 (
505) 20 (17)
14 (17)
290 (180)1,330 (1,685)
2,150 (1,740)
1,210 (1,315)
72 (29)
77 (147)
440 (140)
940 (540)
750 (795)
650 (185)
345 (225)
390 (580)
244 (473)
9 (26)
805 (505)
440 (135)
48 (75)
21 (22)
5 (5)
1,785 (1,610)
1,155 (665)
50 (40)
A.C. SkinnerPkwy
Southpoint Pkwy
J. Turner Butler Blvd
Belfort Rd
Southpoint Blvd
Bonneval Rd
Philips Hwy
Salisbury Rd
ToBowden Rd
FromBowden Rd
ToBaymeadows Rd
FromBaymeadows Rd
§̈¦95
§̈¦95
Butler BlvdJ. Turner
Signalized Intersection
Unsignalized Intersection
N. T. S.
LegendX,XXX (X,XXX) AM (PM) Mainline/
Intersection Volume
I-95 / J. Turner Butler BlvdInterchange Modification Report
Opening Year 2015 Interim and Ultimate BuildPeak Hour Volumes
Figure 6-5
240(255)
655(575)
730(1,510)
655(575)
240(255)
490 (435)
1,535 (1,570)125 (180)
730 (1,510)
125 (180)
Ultimate Build Alternative

4,745(6,575)
6,595(4,805)
7,725(6,240)6,170
(7,380)
1,435(1,215)
6,290(5,025)
255(505)
100(215) 3,910
(5,195)
5,470(4,120)
3,025(5,155)
5,290(3,210)
1,305(1,595)
1,800(1,060)
380(335)
590(255)
5,015(5,905)
2,430(2,705)
730(730)
840(1,685)
1,720(1,420)
2,550 (2,160) 1,695 (1,480)
3,325 (3,745)1,630 (2,265)
585 (1,180)
1,720 (1,005)
475 (1,480)
1,755 (930)
2,020 (1,710)
530 (450)3,280 (2,255)
3,435 (3,715)
1,155 (1,475)
1,700 (1,975)
165 (215)
526 (
217)
18 (2
6)
340 (
925)
345 (300)
250 (305)
560 (360)
741 (
196)
1,183
(1,02
5)
925 (
400)
770 (
1,170
)
55 (45)
1,075 (1,230)
147 (
106)
93 (3
4)
810 (
780)26
5 (48
0)
385 (430)
50 (55)
213 (253)
90 (191)
520 (465)
40 (40)
2,270 (1,775)
1,925 (1,475)
50 (14)
312 (758)
113 (
868)
719 (
1,048
)
450 (
1,075
)
645 (
850)
40 (55)
1,220 (1,215)
1 (4)
744 (
293)
320 (
685)
70 (90)
215 (
190)
700 (925)
1,080 (540)
1,585
(870
)
12 (5
7)
81 (7
3)
125 (
530) 22 (18)
15 (18)
360 (200)1,365 (1,785)
2,170 (1,905)
1,240 (1,480)
80 (33)
88 (164)
490 (155)
960 (605)
805 (995)
830 (260)
355 (250)
465 (600)
243 (482)
10 (29)
900 (565)
490 (145)
53 (75)
23 (25)
10 (10)
2,305 (1,810)
1,520 (795)
80 (65)
A.C. SkinnerPkwy
Southpoint Pkwy
J. Turner Butler Blvd
Belfort Rd
Southpoint Blvd
Bonneval Rd
Philips Hwy
Salisbury Rd
ToBowden Rd
FromBowden Rd
ToBaymeadows Rd
FromBaymeadows Rd
§̈¦95
§̈¦95
Butler BlvdJ. Turner
Signalized Intersection
Unsignalized Intersection
N. T. S.
LegendX,XXX (X,XXX) AM (PM) Mainline/
Intersection Volume
I-95 / J. Turner Butler BlvdInterchange Modification Report
Interim Year 2025 Interim and Ultimate BuildPeak Hour Volumes
Figure 6-6
380(335)
730(730)
840(1,685)
730(730)
380(335)
530 (450)
1,700 (1,975)165 (215)
840 (1,685)
165 (215)
Ultimate Build Alternative

5,690(7,640)
7,640(5,690)
8,800(7,200)7,200
(8,800)
290(560)
1,760(1,440)
7,040(5,760)
170(370) 4,580
(5,820)
5,820(4,580)
3,860(6,140)
6,140(3,860)
1,500(1,830)
2,110(1,160)
520(420)
650(280)
5,760(7,040)
2,670(3,270)
800(880)
950(1,860)
1,830(1,500)
2,750 (2,250) 1,670 (1,770)
3,450 (4,190)1,780 (2,420)
660 (1,300)
1,870 (1,170)
520 (1,610)
1,970 (1,030)
2,180 (1,780)
570 (470)4,060 (2,990)
2,190 (1,820)
1,440 (1,760)
1,870 (2,390)
210 (250)
577 (
239)
20 (2
8)
370 (
1,020
)
380 (360)
330 (360)
670 (380)
812 (
244)
1,323
(1,13
2)
1,010
(440
)
840 (
1,290
)
70 (60)
1,260 (1,350)
161 (
117)
102 (
37)
930 (
860)38
0 (53
0)
420 (520)
50 (60)
213 (257)
99 (210)
570 (490)
60 (50)
2,680 (1,950)
2,300 (1,590)
55 (15)
349 (837)
114 (
883)
792 (
1,141
)
440 (
1,080
)
710 (
920)
60 (70)
1,350 (1,260)
1 (4)
819 (
319)
300 (
650)
90 (110)25
0 (21
0)820 (980)
1,380 (680)
1,860
(950
)
13 (6
2)
89 (8
0)
130 (
550) 24 (20)
17 (20)
430 (220)1,400 (1,890)
2,180 (2,070)
1,260 (1,640)
88 (36)
98 (181)
540 (170)
980 (670)
860 (1,190)
1,010 (340)
360 (280)
540 (620)
243 (490)
11 (32)
990 (620)
540 (160)
58 (91)
25 (27)
10 (20)
2,820 (2,010)
1,880 (920)
110 (90)
A.C. SkinnerPkwy
Southpoint Pkwy
J. Turner Butler Blvd
Belfort Rd
Southpoint Blvd
Bonneval Rd
Philips Hwy
Salisbury Rd
ToBowden Rd
FromBowden Rd
ToBaymeadows Rd
FromBaymeadows Rd
§̈¦95
§̈¦95
Butler BlvdJ. Turner
Signalized Intersection
Unsignalized Intersection
N. T. S.
LegendX,XXX (X,XXX) AM (PM) Mainline/
Intersection Volume
I-95 / J. Turner Butler BlvdInterchange Modification Report
Design Year 2035 Interim and Ultimate BuildPeak Hour Volumes
Figure 6-7
800(880)
520(420)
520(420)
800(880)
950(1,860)
950 (1,860)
210 (250)
570 (470)
1,870 (2,390)
210 (250)
Ultimate Build Alternative

7.0 EVALUATION OF ALTERNATIVES I-95/ J. Turner Butler Blvd IMR
7-1
7.0 EVALUATION OF ALTERNATIVES
7.1 Introduction
This section will discuss the analysis of alternatives based on engineering, environmental, and financial factors. The No-Build Alternative was evaluated in Section 5; the Interim and Ultimate Build Alternatives are analyzed in this section. A comparison of the No-Build and the Build Alternatives is provided in this section. The evaluation criteria are described as follows:
• Conformance with Regional and State Transportation Plans
• Compliance with FHWA Requirements
• Traffic Operational Performance
• Environmental Impacts
• Safety
• Achievement of Objectives The differences in geometry of the Interim and Ultimate Build Alternatives are minor and explained in the previous section. The traffic volumes and operational analysis results remain same for both alternatives except for the I-95 southbound off ramp terminal intersection. Therefore for documentation purposes the results of both alternatives have been discussed together.
7.2 Conformance with Local, Regional and State Transportation Plans
This IMR is consistent with the Transportation Improvement Program (TIP) and the SIS Plan for the area. The I-95/JTB interchange project is listed as on one of the cost feasible projects in the North Florida TPO 2035 Adopted Cost Feasible Plan.
7.3 Compliance with FHWA Requirements
The Interim and Ultimate Build Alternative interchange concepts for the I-95/JTB comply with all FHWA geometric design criteria and requirements. The proposed modifications to the I-95/JTB interchange will operate at acceptable LOS and will satisfy the mobility requirements through Design Year 2035.
7.4 HCM Based Individual Element Build Operational Analysis
An individual element operational analysis was conducted for the Interim and Ultimate Build Alternatives using Highway Capacity Manual (HCM) 2010 methodologies. The LOS for individual freeway elements was determined using the Highway Capacity Software (HCS). Synchro 8.0 was used to analyze the study intersections. The results of this detailed analysis are presented in the following sections. Figure 7-1 illustrates the mainline, ramp, and study intersection lane configurations for Opening Year 2015, Interim Year 2025, and Design Year 2035 for Interim and Ultimate Build Alternatives. Documentation for the Build Alternatives HCM based analysis is provided in Appendix H.
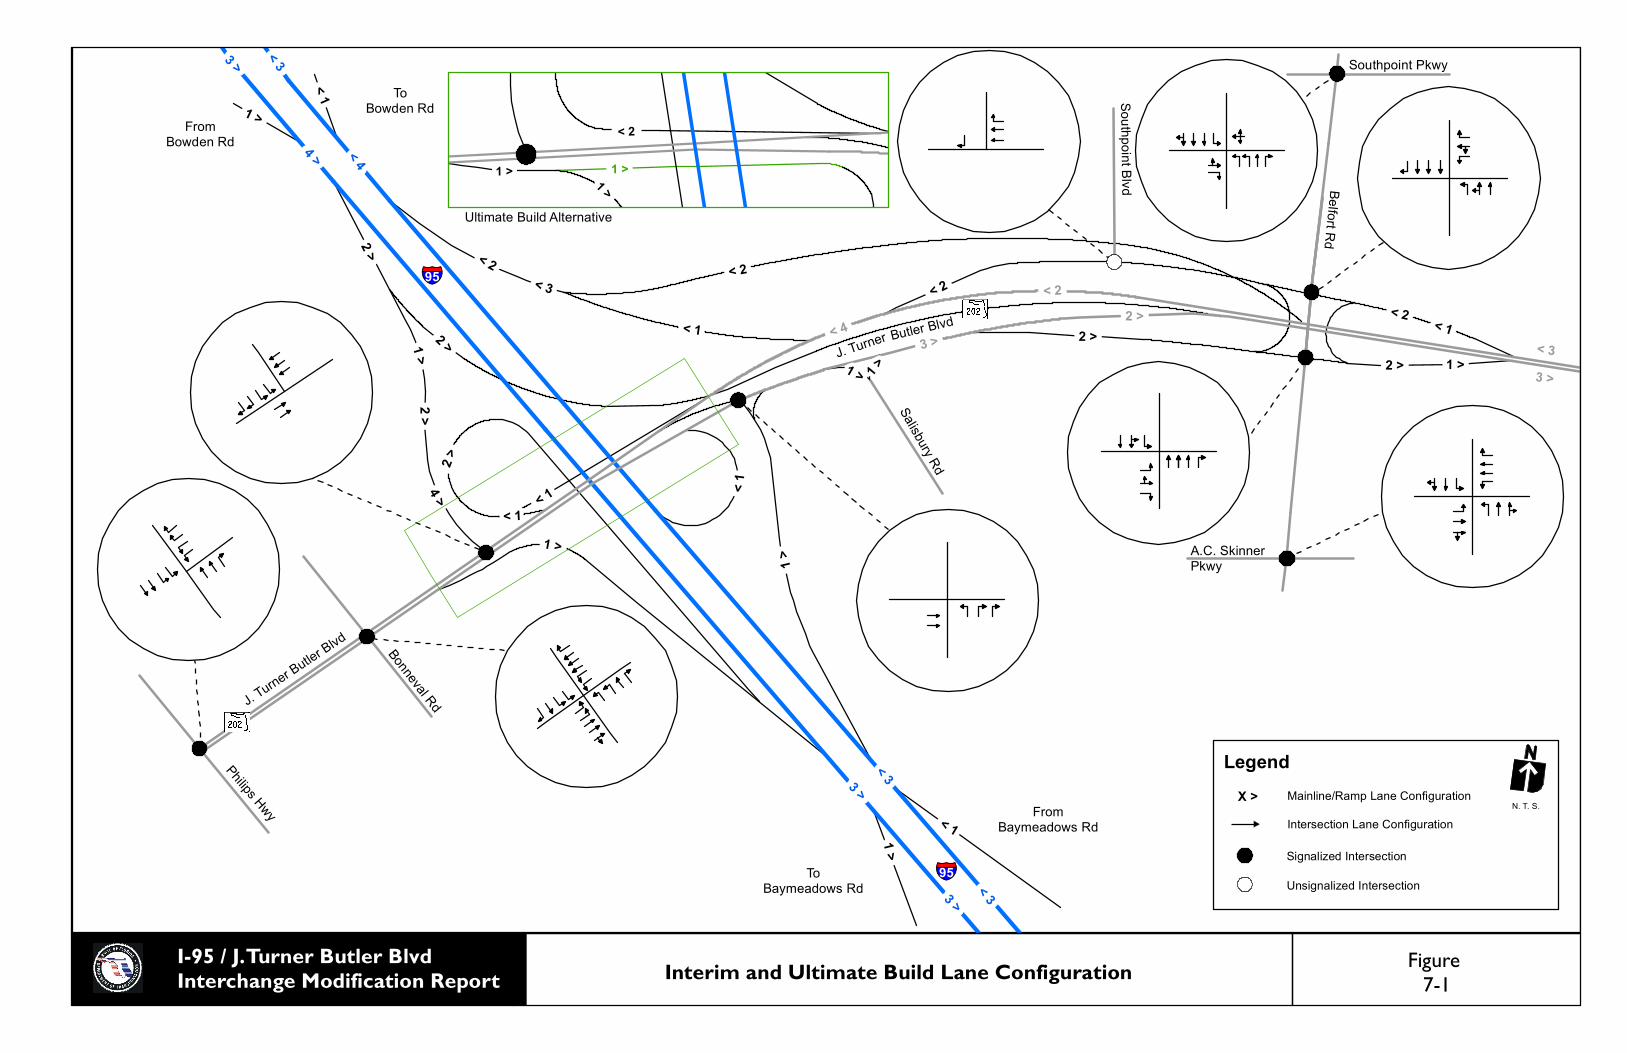
< 1
< 2
2 >
1 >4 >
2 >
< 2< 3
< 3
< 33 >
3 >
< 44 >
< 33 >
1 >
< 1
1 >
< 2
1 >
2 > 2 >2 >
1 > 3 >< 3
< 1
< 2
3 >
< 1
2 >
1 >
< 1
1 >
< 1
1 >
< 4
< 1
2 > < 2
A.C. SkinnerPkwy
Southpoint Pkwy
J. Turner Butler Blvd
Belfort Rd
Southpoint Blvd
Bonneval Rd
Philips Hwy
Salisbury Rd
ToBowden Rd
FromBowden Rd
ToBaymeadows Rd
FromBaymeadows Rd
§̈¦95
§̈¦95
Butler BlvdJ. Turner
N. T. S.
Legend
Signalized Intersection
Unsignalized Intersection
Intersection Lane Configuration
Mainline/Ramp Lane ConfigurationX >
I-95 / J. Turner Butler BlvdInterchange Modification Report Interim and Ultimate Build Lane Configuration Figure
7-1
2 >
1 >
4 >
1 > 1 >
1 >
< 1
1 >2 >
2 >
< 2
Ultimate Build Alternative

7.0 EVALUATION OF ALTERNATIVES I-95/ J. Turner Butler Blvd IMR
7-3
7.4.1 2015 Interim and Ultimate Build Analysis
Mainline Analysis
The 2015 Build mainline analysis is summarized in Table 7-1. I-95 was analyzed as a 6-lane section south of JTB and 8-lane section north of JTB to Bowden Road in 2015. The traffic volumes along mainline for the Build alternatives remain the same as the No-Build. The results of the operational analysis show that all the mainline segments operate at an acceptable LOS in both the 2015 Build AM and PM peak hours. Figure 7-2 illustrates the peak hour volumes and LOS for the 2015 Build mainline analysis. Table 7-1 2015 Interim & Ultimate Build Mainline Analysis Summary
Freeway Segment Direction Number of
Lanes AM Peak Hour PM Peak Hour
Volume Density1 LOS Volume Density1 LOS
I-95 Baymeadows to JTB
NB 3 5545 31.8 D 3910 20.2 C
SB 3 3810 19.7 C 5505 31.5 D
I-95 JTB to Bowden
NB 4 6655 27.2 D 5280 20.5 C
SB 4 5145 19.9 C 5960 23.6 C
1. Density = passenger cars/mile/lane
Ramp Analysis
The Opening Year 2015 ramp analysis results are summarized in Table 7-2. The diverge and merge configuration with I-95 mainline remains same as No-Build except for the JTB westbound to I-95 southbound merge. The loop ramp providing this movement does not merge with I-95 under the Build condition. The loop ramp merges with the JTB eastbound to I-95 southbound slip ramp resulting in a 3 lane ramp that reduces to a single lane ramp before merging with I-95. The location and type of merge with I-95 does not change in the Build condition. This modification is valid for the Interim and Ultimate Build conditions. The results of the operational analysis show that all the study ramp junctions operate at an acceptable LOS under 2015 Build conditions except the I-95 northbound off ramp that operates at LOS E during AM peak hour similar to the No-Build condition. The weaving segment that occurs along westbound JTB between Belfort Road and the I-95 northbound on ramp improves and begins to operate at acceptable LOS during AM and PM Peak hour. This is due to the JTB westbound to I-95 northbound flyover that removes weaving traffic. Figure 7-2 illustrates the peak hour volumes and LOS results for the Opening Year 2015 ramp analysis. The westbound JTB to I-95 northbound on ramp and the I-95 southbound off ramp were analyzed as a major merge and major diverge respectively. Both are 2 lane ramps that add a lane on I-95 mainline at the merge in northbound direction and reduce a lane at the diverge in southbound direction. The analysis resulted in a volume to capacity ratio (v/c) of less than 1.0 for upstream, merging/diverging and downstream segments. This indicates that the ramp merge and diverge are functioning with adequate capacity. The I-95 northbound off ramp to Bowden Road and the on ramp from Bowden Road to I-95 southbound are single lane ramps that result in a lane drop at the diverge and lane addition at the merge. These ramps were analyzed as ramp roadways as per HCM definitions. The analysis results indicated that both these ramps are under capacity in 2015 Build scenario.

7.0 EVALUATION OF ALTERNATIVES I-95/ J. Turner Butler Blvd IMR
7-4
Table 7-2 2015 Interim & Ultimate Build Ramp Analysis Summary
Interchange Ramp AM Peak Hour PM Peak Hour
Volume Density1 LOS Volume Density1 LOS
I-95/Baymeadows NB On 1115 32.0 D 1355 24.5 C
SB Off 1615 14.8 B 1340 20.5 C
I-95/
JTB
NB Off 1485 36.4 E 960 27.9 C
EB to NB On 240 19.1 B 255 13.4 B
WB to NB On2 2355 v/c = 0.64, 0.56,
and 0.753 2075
v/c = 0.48, 0.49,
and 0.593
SB Off2 2190 v/c = 0.46, 0.52,
and 0.443 2145
v/c = 0.54, 0.51,
and 0.573
WB/EB to SB On 855 20.7 C 1690 31.6 D
I-95/
Bowden
NB Off3 1110 v/c = 0.59 995 v/c = 0.53
SB On3 875 v/c = 0.44 1190 v/c = 0.60
JTB WB Weave btw Belfort and I-95 3195 20.2 B 3300 20.5 B
1. Density = passenger cars/mile/lane 2. Ramp junction was analyzed using a major merge/diverge capacity analysis (v/c) for upstream, merge/diverge, and downstream segments (HCM 2010, Chapter 13).
v/c < 1.0 indicates roadway segment operating under capacity (desirable) v/c > 1.0 indicates roadway segment operating over capacity (undesirable)
3. Ramp junction was analyzed using a ramp roadway capacity analysis (HCM 2010, Chapter 13). v/c < 1.0 indicates roadway segment operating under capacity (desirable)
v/c > 1.0 indicates roadway segment operating over capacity (undesirable)
Intersection Analysis
The Opening Year 2015 Build intersection analysis results are summarized in Table 7-3. In Opening Year 2015, there is an improvement in delay at all study intersections under the Build alternatives as compared to the No-Build. The Southpoint at Belfort Parkway intersection experiences a very slight increase in delay of approximately 5 seconds during PM peak hour. The biggest improvement is at the JTB at I-95 SB Off/On Ramps intersection that begins to operate at acceptable LOS B in comparison to the failing LOS F under the No-Build condition. This is due to the proposed I-95 southbound to JTB eastbound flyover ramp that significantly reduces the left turn volume at the intersection. The new JTB at I-95 NB Off/On Ramps intersection operates at acceptable LOS C. The Belfort Road at JTB WB Off/On Ramps intersection and the Belfort Road at JTB EB Off/On Ramps intersection continues to operate at LOS F during PM peak hour but the delay improves in comparison to the No-Build. Figure 7-2 illustrates the peak hour volumes and LOS results for the Opening Year 2015 intersections analysis.

7.0 EVALUATION OF ALTERNATIVES I-95/ J. Turner Butler Blvd IMR
7-5
Table 7-3 2015 Interim & Ultimate Build Intersection Analysis Summary
Intersection AM Peak PM Peak
Delay1 LOS Delay1
LOS
Philips Highway at JTB 37.5 D 41.2 D
Bonneval Road at JTB 33.8 C 33.9 C
JTB at I-95 SB Off/On Ramps (Interim/Ultimate) 19.3/17.62 B/B2 15.3/11.52 B/B2
JTB at I-95 NB Off/On Ramps 25.9 C 33.3 C
Belfort at JTB WB Off/On Ramps 49.9 D 208.2 F
Belfort at JTB EB Off/On Ramps 34.7 C 162.8 F
AC Skinner Parkway at Belfort Road 15.6 B 37.0 D
Southpoint Parkway at Belfort Road 37.5 D 54.5 D
1. Delay = seconds/vehicle 2. Ultimate Build Alternative delay and LOS
7.4.2 2025 Interim and Ultimate Build Analysis
Mainline Analysis
The 2025 Build mainline analysis is summarized in Table 7-4. I-95 was analyzed as a 6-lane section south of JTB and 8-lane section north of JTB to Bowden Road in 2025. The traffic volumes along mainline for the Build alternatives remain the same as the No-Build. The results of the operational analysis show that all the mainline segments operate at an acceptable LOS during AM and PM peak hours except for the segment from Baymeadows Road to JTB that operates at LOS E during AM peak hour in northbound direction and during PM peak hour in southbound direction. Figure 7-3 illustrates the peak hour volumes and LOS for the 2025 Build mainline analysis.
Table 7-4 2025 Interim & Ultimate Build Mainline Analysis Summary
Freeway Segment Direction Number of
Lanes AM Peak Hour PM Peak Hour
Volume Density1 LOS Volume Density1 LOS
I-95 Baymeadows to JTB
NB 3 6595 43.9 E 4805 25.9 C
SB 3 4745 25.5 C 6575 43.6 E
I-95 JTB to Bowden
NB 4 7725 34.2 D 6240 25.0 C
SB 4 6170 24.7 C 7380 31.7 D
1. Density = passenger cars/mile/lane
Ramp Analysis
The Interim Year 2025 ramp analysis results are summarized in Table 7-5. The diverge and merge configuration with I-95 mainline remains same as No-Build except for the JTB westbound to I-95 southbound merge. The loop ramp providing this movement does not merge with I-95 under the Build condition. The loop ramp merges with the JTB eastbound to I-95 southbound slip ramp resulting in a 3 lane ramp that reduces to a single lane ramp before merging with I-95. The location and type of merge with I-95 does not change in the Build condition. This modification is valid for the Interim and Ultimate Build conditions. The results of the operational
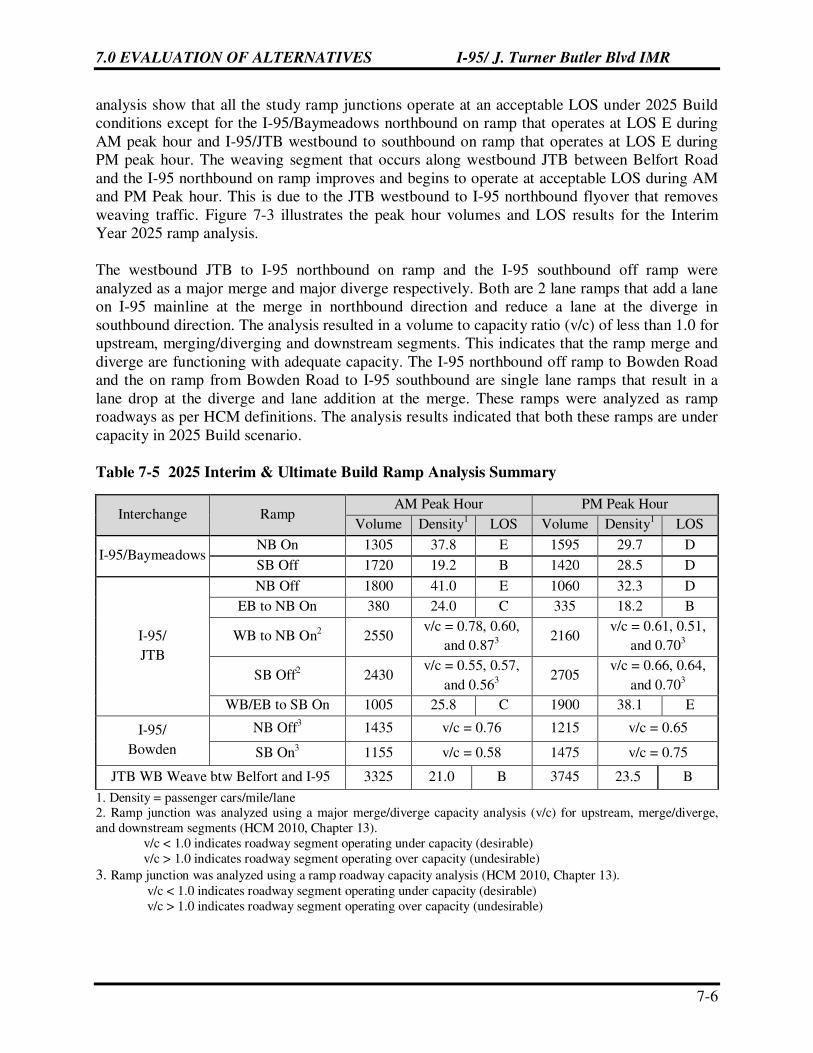
7.0 EVALUATION OF ALTERNATIVES I-95/ J. Turner Butler Blvd IMR
7-6
analysis show that all the study ramp junctions operate at an acceptable LOS under 2025 Build conditions except for the I-95/Baymeadows northbound on ramp that operates at LOS E during AM peak hour and I-95/JTB westbound to southbound on ramp that operates at LOS E during PM peak hour. The weaving segment that occurs along westbound JTB between Belfort Road and the I-95 northbound on ramp improves and begins to operate at acceptable LOS during AM and PM Peak hour. This is due to the JTB westbound to I-95 northbound flyover that removes weaving traffic. Figure 7-3 illustrates the peak hour volumes and LOS results for the Interim Year 2025 ramp analysis. The westbound JTB to I-95 northbound on ramp and the I-95 southbound off ramp were analyzed as a major merge and major diverge respectively. Both are 2 lane ramps that add a lane on I-95 mainline at the merge in northbound direction and reduce a lane at the diverge in southbound direction. The analysis resulted in a volume to capacity ratio (v/c) of less than 1.0 for upstream, merging/diverging and downstream segments. This indicates that the ramp merge and diverge are functioning with adequate capacity. The I-95 northbound off ramp to Bowden Road and the on ramp from Bowden Road to I-95 southbound are single lane ramps that result in a lane drop at the diverge and lane addition at the merge. These ramps were analyzed as ramp roadways as per HCM definitions. The analysis results indicated that both these ramps are under capacity in 2025 Build scenario.
Table 7-5 2025 Interim & Ultimate Build Ramp Analysis Summary
Interchange Ramp AM Peak Hour PM Peak Hour
Volume Density1 LOS Volume Density1 LOS
I-95/Baymeadows NB On 1305 37.8 E 1595 29.7 D
SB Off 1720 19.2 B 1420 28.5 D
I-95/
JTB
NB Off 1800 41.0 E 1060 32.3 D
EB to NB On 380 24.0 C 335 18.2 B
WB to NB On2 2550 v/c = 0.78, 0.60,
and 0.873 2160
v/c = 0.61, 0.51,
and 0.703
SB Off2 2430 v/c = 0.55, 0.57,
and 0.563 2705
v/c = 0.66, 0.64,
and 0.703
WB/EB to SB On 1005 25.8 C 1900 38.1 E
I-95/
Bowden
NB Off3 1435 v/c = 0.76 1215 v/c = 0.65
SB On3 1155 v/c = 0.58 1475 v/c = 0.75
JTB WB Weave btw Belfort and I-95 3325 21.0 B 3745 23.5 B
1. Density = passenger cars/mile/lane 2. Ramp junction was analyzed using a major merge/diverge capacity analysis (v/c) for upstream, merge/diverge, and downstream segments (HCM 2010, Chapter 13).
v/c < 1.0 indicates roadway segment operating under capacity (desirable) v/c > 1.0 indicates roadway segment operating over capacity (undesirable)
3. Ramp junction was analyzed using a ramp roadway capacity analysis (HCM 2010, Chapter 13). v/c < 1.0 indicates roadway segment operating under capacity (desirable)
v/c > 1.0 indicates roadway segment operating over capacity (undesirable)

7.0 EVALUATION OF ALTERNATIVES I-95/ J. Turner Butler Blvd IMR
7-7
Intersection Analysis The Interim Year 2025 Build intersection analysis results are summarized in Table 7-6. In Interim Year 2025, there is an improvement in delay at all study intersections under the Build alternatives as compared to the No-Build. The Southpoint at Belfort Road intersection experiences a very slight increase in delay of approximately 2 seconds during PM peak hour. The biggest improvement is at the JTB at I-95 SB Off/On Ramps intersection that begins to operate at acceptable LOS B and C in comparison to the failing LOS F under the No-Build condition. This is due to the proposed I-95 southbound to JTB eastbound flyover ramp that significantly reduces the left turn volume at the intersection. The new JTB at I-95 NB Off/On Ramps intersection operates at acceptable LOS D. The Belfort Road at JTB WB Off/On Ramps intersection and the Belfort Road at JTB EB Off/On Ramps intersection continues to operate at LOS F during PM peak hour but the delay improves in comparison to the No-Build. Figure 7-3 illustrates the peak hour volumes and LOS results for the Interim Year 2025 intersections analysis.
Table 7-6 2025 Interim & Ultimate Build Intersection Analysis Summary
Intersection AM Peak PM Peak
Delay1 LOS Delay1
LOS
Phillips Highway at JTB 49.5 D 45.5 D
Bonneval Road at JTB 51.9 D 42.7 D
JTB at I-95 SB Off/On Ramps (Interim/Ultimate) 26.0/19.92 C/B2 19.0/13.92 B/B2
JTB at I-95 NB Off/On Ramps 42.1 D 35.7 D
Belfort at JTB WB Off/On Ramps 69.2 E 236.2 F
Belfort at JTB EB Off/On Ramps 44.8 D 197.7 F
AC Skinner Parkway at Belfort Road 15.8 B 37.4 D
Southpoint Parkway at Belfort Road 41.9 D 58.6 E
1. Delay = seconds/vehicle 2. Ultimate Build Alternative delay & LOS

UC (UC)
UC (UC)
0 (0)
UC (UC)
UC (UC)
C (D)
D (C)
D (C)C (C)
B (B)
D (C)
E (C)
B (B)
B (D)
B (C)
3,810(5,505)
5,545(3,910)
6,655(5,280)5,145
(5,960)
1,110(995)
5,545(4,285)
225(455)
30(60) 3,240
(4,565)
5,120(3,655)
2,195(4,165)
4,430(2,555)
1,115(1,355)
1,485(960)
240(255)
530(225)
4,270(4,770)
2,190(2,145)
655(575)
730(1,510)
1,615(1,340)
3,195 (3,300)1,480 (2,115)
505 (1,055)
1,565 (835)
435 (1,345)
1,540 (830)
1,865 (1,640)
490 (435)2,500 (1,525)
2,805 (3,220)
875 (1,190)
1,535 (1,570)
125 (180)
2,355 (2,075) 1,715 (1,185)
B (D)
D (D)
C (F)
D (F)
C (F)
B (B)
C (C)
D (D)
C (C)
B (B)
475 (
196)
17 (2
3)
305 (
830)
310 (235)
170 (250)
445 (340)
670 (
199)
1,043
(919
)
835 (
355)
700 (
1,045
)
35 (35)
885 (1,115)
133 (
95)
84 (3
0)
695 (
700)150 (
430)
345 (340)
45 (50)
214 (249)
82 (173)
465 (435)
25 (35)
1,855 (1,590)
1,545 (1,355)
47 (13)
275 (680)
113 (
853)
646 (
955)
455 (
1,070
)
580 (
785)
25 (35)
1,085 (1,170)
1 (4)
668 (
267)
340 (
725)
45 (65)
175 (
175)
585 (875)
780 (400)
1,310
(785
)
11 (5
1)
72 (6
7)
115 (
505) 20 (17)
14 (17)
290 (180)1,330 (1,685)
2,150 (1,740)
1,210 (1,315)
72 (29)
77 (147)
440 (140)
940 (540)
750 (795)
650 (185)
345 (225)
390 (580)
244 (473)
9 (26)
805 (505)
440 (135)
48 (75)
21 (22)
5 (5)
1,785 (1,610)
1,155 (665)
50 (40)
A.C. SkinnerPkwy
Southpoint Pkwy
J. Turner Butler Blvd
Belfort Rd
Southpoint Blvd
Bonneval Rd
Philips Hwy
Salisbury Rd
N. T. S.
ToBowden Rd
FromBowden Rd
ToBaymeadows Rd
FromBaymeadows Rd
§̈¦95
§̈¦95
Butler BlvdJ. Turner
Signalized Intersection
Unsignalized Intersection
X (Y)
X (Y)
AM (PM) Ramp Merge Level of ServiceAM (PM) Ramp Diverge Level of Service
Yield
AM (PM) Ultimate Signalized Intersection Level of Service
Legend
AM (PM) Signalized Intersection Level of Service
AM (PM) Mainline Level of Service
X (Y)
X,XXX (X,XXX) AM (PM) Mainline VolumeX (Y)
OC (UC) AM (PM) Over Capacity / Under Capacity
X (Y)
X (Y) AM (PM) Weave Level of Service
I-95 / J. Turner Butler BlvdInterchange Modification Report
Opening Year 2015 Interim and Ultimate BuildPeak Hour Volumes and Level of Service
Figure 7-2
240(255)
655(575)
730(1,510)
655(575)
240(255)
490 (435)
1,535 (1,570)125 (180)
730 (1,510)
125 (180)
Ultimate Build Alternative

4,745(6,575)
6,595(4,805)
7,725(6,240)6,170
(7,380)
1,435(1,215)
6,290(5,025)
255(505)
100(215) 3,910
(5,195)
5,470(4,120)
3,025(5,155)
5,290(3,210)
1,305(1,595)
1,800(1,060)
380(335)
590(255)
5,015(5,905)
2,430(2,705)
730(730)
840(1,685)
1,720(1,420)
2,550 (2,160) 1,695 (1,480)
3,325 (3,745)1,630 (2,265)
585 (1,180)
1,720 (1,005)
475 (1,480)
1,755 (930)
2,020 (1,710)
530 (450)3,280 (2,255)
3,435 (3,715)
1,155 (1,475)
1,700 (1,975)
165 (215)
B (D)
D (E)
D (F)
E (F)
C (B)
D (D)
D (D)
D (D)
B (B)
526 (
217)
18 (2
6)
340 (
925)
345 (300)
250 (305)
560 (360)
741 (
196)
1,183
(1,02
5)
925 (
400)
770 (
1,170
)
55 (45)
1,075 (1,230)
147 (
106)
93 (3
4)
810 (
780)265 (
480)
385 (430)
50 (55)
213 (253)
90 (191)
520 (465)
40 (40)
2,270 (1,775)
1,925 (1,475)
50 (14)
312 (758)
113 (
868)
719 (
1,048
)
450 (
1,075
)
645 (
850)
40 (55)
1,220 (1,215)
1 (4)
744 (
293)
320 (
685)
70 (90)
215 (
190)
700 (925)
1,080 (540)
1,585
(870
)
12 (5
7)
81 (7
3)
125 (
530) 22 (18)
15 (18)
360 (200)1,365 (1,785)
2,170 (1,905)
1,240 (1,480)
80 (33)
88 (164)
490 (155)
960 (605)
805 (995)
830 (260)
355 (250)
465 (600)
243 (482)
10 (29)
900 (565)
490 (145)
53 (75)
23 (25)
10 (10)
2,305 (1,810)
1,520 (795)
80 (65)
UC (UC)
UC (UC)
0 (0)
UC (UC)
UC (UC)
C (E)
E (C)
D (C)C (D)
B (B)
E (D)
E (D)
C (B)
C (E)
B (D)
A.C. SkinnerPkwy
Southpoint Pkwy
J. Turner Butler Blvd
Belfort Rd
Southpoint Blvd
Bonneval Rd
Philips Hwy
Salisbury Rd
N. T. S.
ToBowden Rd
FromBowden Rd
ToBaymeadows Rd
FromBaymeadows Rd
§̈¦95
§̈¦95
Butler BlvdJ. Turner
Signalized Intersection
Unsignalized Intersection
X (Y)
X (Y)
AM (PM) Ramp Merge Level of ServiceAM (PM) Ramp Diverge Level of Service
Yield
AM (PM) Ultimate Signalized Intersection Level of Service
Legend
AM (PM) Signalized Intersection Level of Service
AM (PM) Mainline Level of Service
X (Y)
X,XXX (X,XXX) AM (PM) Mainline VolumeX (Y)
OC (UC) AM (PM) Over Capacity / Under Capacity
X (Y)
X (Y) AM (PM) Weave Level of Service
I-95 / J. Turner Butler BlvdInterchange Modification Report
Interim Year 2025 Interim and Ultimate BuildPeak Hour Volumes and Level of Service
Figure 7-3
240(255)
655(575)
730(1,510)
655(575)
240(255)
490 (435)
1,535 (1,570)125 (180)
730 (1,510)
125 (180)
Ultimate Build Alternative

7.0 EVALUATION OF ALTERNATIVES I-95/ J. Turner Butler Blvd IMR
7-10
7.4.3 2035 Interim and Ultimate Build Analysis
Mainline Analysis
The 2035 Build mainline analysis is summarized in Table 7-7. I-95 was analyzed as a 6-lane section south of JTB and 8-lane section north of JTB to Bowden Road in 2035. The traffic volumes along mainline for the Build alternatives remain the same as the No-Build. The results of the operational analysis show that the I-95 mainline segments from Baymeadows to Bowden begin to operate at an undesirable LOS E or F in 2035. The segment from Baymeadows Road to JTB operates at LOS F during AM peak hour in northbound direction and during PM peak hour in southbound direction. Figure 7-4 illustrates the peak hour volumes and LOS for the 2035 Build mainline analysis.
Table 7-7 2035 Interim & Ultimate Build Mainline Analysis Summary
Freeway Segment Direction Number of
Lanes AM Peak Hour PM Peak Hour
Volume Density1 LOS Volume Density1 LOS
I-95 Baymeadows to JTB
NB 3 7640 65.1 F 5690 33.2 D
SB 3 5690 33.2 D 7640 65.1 F
I-95 JTB to Bowden
NB 4 8800 44.0 E 7200 30.5 D
SB 4 7200 30.5 D 8800 44.0 E
1. Density = passenger cars/mile/lane
Ramp Analysis
The Design Year 2035 ramp analysis results are summarized in Table 7-8. The diverge and merge configuration with I-95 mainline remains same as No-Build except for the JTB westbound to I-95 southbound merge. The loop ramp providing this movement does not merge with I-95 under the Build condition. The loop ramp merges with the JTB eastbound to I-95 southbound slip ramp resulting in a 3 lane ramp that reduces to a single lane ramp before merging with I-95. The location and type of merge with I-95 does not change in the Build condition. This modification is valid for the Interim and Ultimate Build conditions. The results of the operational analysis show that several study ramp junctions begin to operate at an undesirable LOS E or F under 2035 Build conditions similar to the No-Build. The I-95/Baymeadows northbound on ramp operates at LOS F during AM peak hour and southbound off ramp operates at LOS F during PM peak hour. The JTB westbound to I-95 southbound and JTB eastbound to I-95 southbound on ramp operates at LOS F during PM peak hour. The ramp junctions fail due to inadequate capacity on the I-95 mainline. The weaving segment that occurs along westbound JTB between Belfort Road and the I-95 northbound on ramp improves and begins to operate at acceptable LOS during AM and PM Peak hour. This is due to the JTB westbound to I-95 northbound flyover that removes weaving traffic. Figure 7-4 illustrates the peak hour volumes and LOS results for the Design Year 2035 ramp analysis. The westbound JTB to I-95 northbound on ramp and the I-95 southbound off ramp were analyzed as a major merge and major diverge respectively. Both are 2 lane ramps that add a lane on I-95 mainline at the merge in northbound direction and reduce a lane at the diverge in southbound direction. The analysis resulted in a volume to capacity ratio (v/c) of less than 1.0 for upstream, diverging and downstream segments. This indicates that the ramp merge and diverge

7.0 EVALUATION OF ALTERNATIVES I-95/ J. Turner Butler Blvd IMR
7-11
are functioning with adequate capacity. The I-95 northbound off ramp to Bowden Road and the on ramp from Bowden Road to I-95 southbound are single lane ramps that result in a lane drop at the diverge and lane addition at the merge. These ramps were analyzed as ramp roadways as per HCM definitions. The analysis results indicated that both these ramps are under capacity in 2035 No-Build scenario.
Table 7-8 2035 Interim & Ultimate Build Ramp Analysis Summary
Interchange Ramp AM Peak Hour PM Peak Hour
Volume Density1 LOS Volume Density1 LOS
I-95/Baymeadows NB On 1500 43.7 F 1830 34.8 D
SB Off 1830 23.7 C 1500 38.4 F
I-95/
JTB
NB Off 2110 50.1 F 1160 36.3 E
EB to NB On 520 29.0 D 420 23.0 C
WB to NB On2 2750 v/c = 0.91, 0.65,
and 0.993 2250
v/c = 0.74, 0.53,
and 0.813
SB Off2 2670 v/c = 0.65, 0.63,
and 0.683 3270
v/c = 0.79, 0.77,
and 0.833
WB/EB to SB On 1160 31.1 D 2110 43.6 F
I-95/
Bowden
NB Off3 1760 v/c = 0.94 1440 v/c = 0.77
SB On3 1440 v/c = 0.73 1760 v/c = 0.89
JTB WB Weave btw Belfort and I-95 3450 21.8 B 4190 26.5 C
1. Density = passenger cars/mile/lane 2. Ramp junction was analyzed using a major merge/diverge capacity analysis (v/c) for upstream, merge/diverge, and downstream segments (HCM 2010, Chapter 13).
v/c < 1.0 indicates roadway segment operating under capacity (desirable) v/c > 1.0 indicates roadway segment operating over capacity (undesirable)
3. Ramp junction was analyzed using a ramp roadway capacity analysis (HCM 2010, Chapter 13). v/c < 1.0 indicates roadway segment operating under capacity (desirable)
v/c > 1.0 indicates roadway segment operating over capacity (undesirable)
Intersection Analysis
The Design Year 2035 Build intersection analysis results are summarized in Table 7-9. In Design Year 2035, there is an improvement in delay at all study intersections under the Build alternatives as compared to the No-Build. The biggest improvement is at the JTB at I-95 SB Off/On Ramps intersection that begins to operate at acceptable LOS C and D in comparison to the failing LOS F under the No-Build condition. This is due to the proposed I-95 southbound to JTB eastbound flyover ramp that significantly reduces the left turn volume at the intersection. The new JTB at I-95 NB Off/On Ramps intersection operates at acceptable LOS D. The Belfort Road at JTB WB Off/On Ramps intersection and the Belfort Road at JTB EB Off/On Ramps intersection continues to operate at LOS F but the delay improves in comparison to the No-Build. Figure 7-4 illustrates the peak hour volumes and LOS results for the Design Year 2035 intersections analysis.

7.0 EVALUATION OF ALTERNATIVES I-95/ J. Turner Butler Blvd IMR
7-12
Table 7-9 2035 Interim & Ultimate Build Intersection Analysis Summary
Intersection AM Peak PM Peak
Delay1 LOS Delay1
LOS
Phillips Highway at JTB 86.5 F 52.7 D
Bonneval Road at JTB 122.8 F 53.6 D
JTB at I-95 SB Off/On Ramps (Interim/Ultimate) 54.3/24.52 D/C2 23.0/16.32 C/B2
JTB at I-95 NB Off/On Ramps 52.9 D 42.5 D
Belfort at JTB WB Off/On Ramps 89.0 F 266.9 F
Belfort at JTB EB Off/On Ramps 64.0 E 231.3 F
AC Skinner Parkway at Belfort Road 16.4 B 37.9 D
Southpoint Parkway at Belfort Road 51.5 D 76.5 E
1. Delay = seconds/vehicle 2. Ultimate Build Alternative delay & LOS

5,690(7,640)
7,640(5,690)
8,800(7,200)7,200
(8,800)
290(560)
1,760(1,440)
7,040(5,760)
170(370) 4,580
(5,820)
5,820(4,580)
3,860(6,140)
6,140(3,860)
1,500(1,830)
2,110(1,160)
520(420)
650(280)
5,760(7,040)
2,670(3,270)
800(880)
950(1,860)
1,830(1,500)
2,750 (2,250) 1,670 (1,770)
3,450 (4,190)1,780 (2,420)
660 (1,300)
1,870 (1,170)
520 (1,610)
1,970 (1,030)
2,180 (1,780)
570 (470)4,060 (2,990)
2,190 (1,820)
1,440 (1,760)
1,870 (2,390)
210 (250)
B (D)
D (E)
E (F)
F (F)
D (C)
F (D)
F (D)
D (D)
C (B)
577 (
239)
20 (2
8)
370 (
1,020
)
380 (360)
330 (360)
670 (380)
812 (
244)
1,323
(1,13
2)
1,010
(440
)
840 (
1,290
)
70 (60)
1,260 (1,350)
161 (
117)
102 (
37)
930 (
860)380 (
530)
420 (520)
50 (60)
213 (257)
99 (210)
570 (490)
60 (50)
2,680 (1,950)
2,300 (1,590)
55 (15)
349 (837)
114 (
883)
792 (
1,141
)
440 (
1,080
)
710 (
920)
60 (70)
1,350 (1,260)
1 (4)
819 (
319)
300 (
650)
90 (110)25
0 (21
0)820 (980)
1,380 (680)
1,860
(950
)
13 (6
2)
89 (8
0)
130 (
550) 24 (20)
17 (20)
430 (220)1,400 (1,890)
2,180 (2,070)
1,260 (1,640)
88 (36)
98 (181)
540 (170)
980 (670)
860 (1,190)
1,010 (340)
360 (280)
540 (620)
243 (490)
11 (32)
990 (620)
540 (160)
58 (91)
25 (27)
10 (20)
2,820 (2,010)
1,880 (920)
110 (90)
UC (UC)
UC (UC)
0 (0)
UC (UC)
UC (UC)
D (F)
F (D)
E (D)D (E)
B (C)
F (D)
F (E)
D (C)
D (F)
C (F)
A.C. SkinnerPkwy
Southpoint Pkwy
J. Turner Butler Blvd
Belfort Rd
Southpoint Blvd
Bonneval Rd
Philips Hwy
Salisbury Rd
N. T. S.
ToBowden Rd
FromBowden Rd
ToBaymeadows Rd
FromBaymeadows Rd
§̈¦95
§̈¦95
Butler BlvdJ. Turner
Signalized Intersection
Unsignalized Intersection
X (Y)
X (Y)
AM (PM) Ramp Merge Level of ServiceAM (PM) Ramp Diverge Level of Service
Yield
AM (PM) Ultimate Signalized Intersection Level of Service
Legend
AM (PM) Signalized Intersection Level of Service
AM (PM) Mainline Level of Service
X (Y)
X,XXX (X,XXX) AM (PM) Mainline VolumeX (Y)
OC (UC) AM (PM) Over Capacity / Under Capacity
X (Y)
X (Y) AM (PM) Weave Level of Service
I-95 / J. Turner Butler BlvdInterchange Modification Report
Design Year 2035 Interim and Ultimate BuildPeak Hour Volumes and Level of Service
Figure 7-4
240(255)
655(575)
730(1,510)
655(575)
240(255)
490 (435)
1,535 (1,570)125 (180)
730 (1,510)
125 (180)
Ultimate Build Alternative

7.0 EVALUATION OF ALTERNATIVES I-95/ J. Turner Butler Blvd IMR
7-14
7.5 Microsimulation Based Build Operational Analysis
A detailed microsimulation analysis using CORSIM was conducted in addition to the HCM based operational analysis to evaluate the system-wide operational performance. The CORSIM model was prepared for the Design Year 2035 AM and PM peak periods for Interim and Ultimate Build Alternatives. The primary objective of this CORSIM model was to establish the 2035 Build operational conditions along I-95, JTB, study interchanges and intersections. The CORSIM microsimulation is intended to supplement the HCM based capacity analysis and to identify any additional operational issues present in the roadway network. Five hour AM and PM peak periods were modeled for the Design Year 2035 Interim and Ultimate Build Alternatives. 15 minute volumes were input into the CORSIM model for five hour AM and PM peak periods for Design Year 2035. The Design Year Build model parameters are based on those used for the Existing Year model. Ten model iterations with different random number seeds were run for the AM and PM models. The following CORSIM MOEs were used to evaluate the network’s operational performance:
• Freeways o Traffic Volume Throughput o Mainline Density and Speed
• Arterials o Movement Delay o Approach Delay o Total Intersection Delay
The following sections provide a summary of the operational performance based on the CORSIM modeling results for Interim and Ultimate Build Alternatives. The results for the two Build Alternatives are very similar. Documentation for the Design Year 2035 Interim and Ultimate Build Alternatives microsimulation analysis is provided in Appendix I.
I-95 Interim Build Freeway Operational Performance
The CORSIM model results for Interim Build Alternative, presented in Tables 7-10 and 7-11, indicate that operational conditions along the I-95 mainline in Design Year 2035 are same or better in the peak hour compared to the No-Build conditions with one exception. In the northbound direction between JTB and Bowden Road, speeds decrease and densities increase when comparing the Build alternative to the No-Build alternative. This is primarily due to the fact that the Build alternative is able to process more traffic through the system as compared to the No-Build. However, it should be noted that congestion at this location completely dissipates prior to the end of simulation whereas in the No-Build some congestion is observed during the 5th hour. The Interim Build AM and PM Peak Heat Diagrams illustrate the locations and duration of congestion within the study area. This is done by illustrating the speed distribution with the lowest speeds shown in red corresponding to the areas of highest congestion. The AM peak heat diagram illustrates congestion in the northbound direction from south of Baymeadows Road to the JTB westbound entrance. No significant congestion is observed in the southbound direction during the AM peak.

To From
Facility Section Type tp1 tp2 tp3 tp4 tp5 tp6 tp7 tp8 tp9 tp10 tp11 tp12 tp13 tp14 tp15 tp16 tp17 tp18 tp19 Total
I-95 Northbound Begins BFS 1,062 1,473 1,652 1,660 1,577 1,382 1,408 1,473 1,499 1,434 1,482 1,432 1,374 1,345 1,352 1,142 766 766 766 25,045
BFS 1,060 1,464 1,651 1,658 1,518 1,383 1,410 1,476 1,504 1,435 1,478 1,416 1,380 1,339 1,356 1,223 766 768 766 25,051
Baymeadows Road Exit Diverge 1,057 1,453 1,648 1,660 1,451 1,379 1,416 1,493 1,508 1,422 1,470 1,424 1,367 1,349 1,354 1,297 771 769 765 25,053
Baymeadows Road Exit BFS Baymeadows Road 827 1,115 1,354 1,333 1,178 1,164 1,185 1,186 1,194 1,150 1,102 1,239 1,177 1,154 1,159 1,159 700 658 654 20,688
Baymeadows Road Entrance BFS 826 1,110 1,352 1,284 1,169 1,170 1,186 1,181 1,197 1,154 1,096 1,241 1,176 1,151 1,157 1,177 750 657 657 20,691
Baymeadows Road Entrance Merge 1,137 1,389 1,691 1,559 1,461 1,462 1,488 1,486 1,498 1,432 1,371 1,591 1,469 1,442 1,445 1,461 1,008 831 813 26,034
BFS 1,139 1,383 1,660 1,505 1,466 1,458 1,497 1,479 1,500 1,420 1,387 1,588 1,462 1,446 1,445 1,472 1,094 827 816 26,044
BFS 1,142 1,374 1,627 1,486 1,471 1,451 1,505 1,477 1,496 1,409 1,411 1,577 1,457 1,450 1,446 1,467 1,163 826 816 26,051
BFS 1,143 1,360 1,601 1,466 1,475 1,460 1,500 1,484 1,486 1,404 1,431 1,557 1,460 1,450 1,446 1,469 1,225 822 816 26,055
BFS 1,140 1,350 1,568 1,467 1,470 1,472 1,498 1,493 1,486 1,404 1,438 1,534 1,459 1,448 1,446 1,484 1,266 819 818 26,060
SR 202/JT Butler Blvd Exit Diverge 1,136 1,347 1,525 1,469 1,472 1,474 1,500 1,500 1,504 1,408 1,440 1,500 1,458 1,447 1,445 1,486 1,319 817 820 26,067
SR 202/JT Butler Blvd Exit
SR 202/JT Butler Blvd EB
Entrance BFS SR 202/JT Butler Blvd 800 922 1,075 1,135 1,148 1,120 1,077 1,036 1,002 862 868 1,057 1,142 1,152 1,152 1,168 1,085 642 644 19,087
Simulated Volume
I-9
5 N
ort
hb
ou
nd
Ma
inlin
e
I-95/JTB IMR Interim Build Alternative- HEAT Diagram- AM Peak
DescriptionLocation
Northbound/Westbound
Southbound/Eastbound
SR 202/JT Butler Blvd Exit Entrance BFS SR 202/JT Butler Blvd 800 922 1,075 1,135 1,148 1,120 1,077 1,036 1,002 862 868 1,057 1,142 1,152 1,152 1,168 1,085 642 644 19,087SR 202/JT Butler Blvd EB
Entrance Merge 927 1,030 1,201 1,258 1,271 1,245 1,189 1,185 1,124 1,002 995 1,209 1,278 1,300 1,291 1,269 1,211 746 735 21,466SR 202/JT Butler Blvd WB
Entrance BFS 926 1,028 1,191 1,256 1,273 1,246 1,189 1,186 1,126 1,006 991 1,203 1,277 1,300 1,293 1,272 1,213 756 735 21,467SR 202/JT Butler Blvd WB
Entrance Merge 1,418 1,514 1,737 1,792 1,787 1,774 1,769 1,768 1,779 1,770 1,760 1,767 1,780 1,739 1,658 1,541 1,442 1,003 976 30,774
BFS 1,415 1,513 1,726 1,795 1,786 1,762 1,749 1,793 1,776 1,764 1,762 1,777 1,782 1,738 1,667 1,545 1,443 1,009 980 30,782
Bowden Road Exit Diverge Bowden Road 1,417 1,509 1,718 1,797 1,781 1,747 1,741 1,802 1,785 1,764 1,767 1,779 1,784 1,737 1,680 1,544 1,449 1,015 980 30,796
Bowden Road Exit BFS 1,033 1,086 1,309 1,422 1,425 1,426 1,425 1,435 1,332 1,304 1,295 1,305 1,419 1,396 1,277 1,148 1,072 770 738 23,617
BFS 1,034 1,083 1,300 1,416 1,421 1,429 1,430 1,434 1,340 1,305 1,292 1,304 1,412 1,399 1,286 1,153 1,073 773 739 23,623
BFS 1,036 1,080 1,291 1,414 1,422 1,425 1,430 1,440 1,347 1,302 1,292 1,302 1,408 1,398 1,294 1,157 1,078 777 739 23,632
BFS 1,034 1,080 1,289 1,414 1,420 1,426 1,430 1,441 1,349 1,302 1,292 1,302 1,408 1,399 1,297 1,156 1,078 779 739 23,635
BFS 1,030 1,082 1,281 1,416 1,418 1,427 1,429 1,439 1,355 1,301 1,287 1,305 1,407 1,400 1,295 1,159 1,080 783 738 23,632I-95 Northbound Ends BFS 1,030 1,081 1,280 1,412 1,421 1,426 1,429 1,439 1,355 1,304 1,286 1,304 1,407 1,402 1,294 1,165 1,079 788 737 23,639
I-95 Southbound Begins BFS 765 1,112 1,242 1,216 1,302 1,534 1,591 1,329 1,514 1,413 1,475 1,119 1,066 1,044 845 673 666 671 670 21,247
BFS 765 1,107 1,239 1,217 1,301 1,530 1,591 1,333 1,513 1,414 1,473 1,123 1,068 1,045 846 675 666 671 670 21,247
BFS 764 1,102 1,237 1,220 1,297 1,527 1,589 1,340 1,508 1,418 1,473 1,127 1,066 1,048 846 680 663 671 671 21,247
BFS 763 1,097 1,233 1,222 1,295 1,524 1,590 1,345 1,502 1,418 1,475 1,132 1,066 1,049 850 682 663 670 671 21,247
BFS Bowden Road 763 1,093 1,226 1,225 1,293 1,521 1,587 1,347 1,502 1,421 1,472 1,140 1,063 1,050 854 685 665 670 669 21,246
Bowden Road Entrance BFS 762 1,083 1,225 1,226 1,290 1,518 1,585 1,354 1,496 1,424 1,468 1,148 1,068 1,051 856 687 666 671 670 21,248
Bowden Road Entrance Merge 1,048 1,359 1,522 1,553 1,642 1,866 1,927 1,717 1,804 1,734 1,743 1,417 1,351 1,310 1,084 863 841 839 835 26,455
BFS 1,048 1,351 1,526 1,552 1,641 1,860 1,930 1,716 1,805 1,735 1,742 1,420 1,353 1,307 1,088 866 839 839 838 26,456
SR 202/JT Butler Blvd Exit Diverge 1,046 1,343 1,525 1,554 1,638 1,855 1,929 1,719 1,806 1,734 1,743 1,430 1,352 1,306 1,093 871 838 837 837 26,456
SR 202/JT Butler Blvd Exit BFS 503 668 878 819 961 1,122 1,269 1,090 1,124 1,080 1,118 924 858 798 677 534 504 510 511 15,948
BFS SR 202/JT Butler Blvd 503 666 875 822 960 1,119 1,266 1,096 1,121 1,081 1,117 928 857 798 680 535 505 510 510 15,949
BFS 504 662 872 824 954 1,119 1,264 1,096 1,127 1,080 1,117 932 854 802 680 536 504 510 512 15,949SR 202/JT Butler Blvd WB and
I-9
5 N
ort
hb
ou
nd
Ma
inlin
eI-
95
So
uth
bo
un
d M
ain
lin
e
SR 202/JT Butler Blvd WB and
EB Entrance BFS 505 658 868 825 951 1,119 1,259 1,105 1,122 1,081 1,118 933 858 802 684 541 503 508 511 15,951SR 202/JT Butler Blvd WB and
EB Entrance Merge 660 800 1,019 1,031 1,171 1,386 1,459 1,344 1,414 1,394 1,405 1,177 1,046 1,020 859 679 639 641 637 19,781
BFS 659 799 1,015 1,030 1,170 1,372 1,456 1,355 1,405 1,399 1,406 1,186 1,049 1,019 861 679 639 643 639 19,781
BFS 659 794 1,012 1,029 1,169 1,364 1,453 1,362 1,402 1,400 1,408 1,191 1,050 1,018 866 683 637 646 634 19,777
BFS 658 791 1,008 1,028 1,168 1,361 1,451 1,364 1,401 1,399 1,410 1,197 1,049 1,020 871 684 640 644 636 19,780
BFS 657 790 1,004 1,031 1,162 1,356 1,453 1,367 1,399 1,401 1,410 1,197 1,051 1,023 871 686 640 644 635 19,777
Baymeadows Road Exit Diverge 654 783 1,001 1,035 1,155 1,354 1,452 1,373 1,393 1,404 1,409 1,203 1,056 1,020 874 692 638 643 640 19,779
Baymeadows Road Exit BFS Baymeadows Road 496 537 741 718 778 877 1,030 938 920 953 1,062 940 797 760 652 520 478 480 477 14,154
Baymeadows Road Entrance BFS 498 537 738 718 778 873 1,027 942 921 950 1,065 939 800 760 654 523 476 481 478 14,158
Baymeadows Road Entrance Merge 543 593 795 818 870 968 1,090 1,022 984 1,004 1,148 1,008 879 857 752 591 535 545 545 15,547
BFS 543 594 790 818 871 961 1,090 1,028 981 1,003 1,149 1,008 882 852 762 592 534 546 542 15,546I-95 Southbound Ends BFS 543 592 782 825 866 963 1,086 1,029 980 1,003 1,143 1,014 885 852 767 594 536 544 541 15,545
SR 202/JT Butler Blvd
Eastbound Begins/From I-95 SB
Flyover BFS 340 403 417 464 467 503 475 450 473 447 409 344 334 333 285 230 221 219 219 7,033
BFS SR 202/JTB EB Arterial 340 403 417 464 467 502 476 449 473 448 409 345 333 333 285 230 222 218 219 7,033I-95 Northbound/SR 202/ JTB
Arterial Entrance Entrance BFS 340 402 418 462 468 500 477 450 472 448 409 346 333 332 286 230 221 219 218 7,031I-95 Northbound/SR 202/ JTB
Arterial Entrance Entrance Merge Belfort Road 540 682 711 812 892 916 968 1,052 1,124 1,152 1,038 790 756 750 685 539 540 475 460 14,882
Belfort Road Entrance BFS 544 674 715 804 892 914 968 1,051 1,126 1,145 1,044 798 752 753 689 539 544 470 466 14,888
Belfort Road Entrance Merge 608 732 795 912 1,018 1,039 1,090 1,193 1,248 1,294 1,189 911 869 850 778 608 603 537 536 16,810
BFS 606 724 792 914 1,020 1,033 1,093 1,183 1,255 1,291 1,186 926 873 847 782 612 603 533 534 16,807SR 202/JT Butler Blvd
Eastbound Ends BFS 610 723 788 909 1,017 1,034 1,097 1,174 1,259 1,286 1,196 929 872 850 781 614 603 535 535 16,812SR 202/JT Butler Blvd
Westbound Begins BFS 816 868 1,038 1,242 1,407 994 1,017 1,228 1,465 1,509 1,499 726 873 694 553 442 443 438 441 17,693
I-9
5 S
ou
thb
ou
nd
Ma
inlin
eS
R 2
02
/JT
B E
B M
ain
lin
eS
R 2
02
/JT
B W
B
Westbound Begins BFS 816 868 1,038 1,242 1,407 994 1,017 1,228 1,465 1,509 1,499 726 873 694 553 442 443 438 441 17,693
BFS Belfort Road 813 868 1,036 1,240 1,375 974 1,011 1,251 1,464 1,517 1,518 743 865 702 553 445 442 440 441 17,698
Belfort Road Exit Diverge 811 869 1,033 1,237 1,329 962 1,008 1,263 1,472 1,528 1,535 758 859 715 555 447 442 438 442 17,703
Belfort Road Exit BFS SR 202/JTB WB Arterial 619 579 796 867 735 567 677 898 892 996 1,063 484 620 508 382 302 298 304 305 11,892I-95 Northbound Exit Diverge 620 579 794 866 695 573 683 895 894 1,001 1,073 498 620 508 386 303 297 305 304 11,894
I-95 Northbound Exit
SR 202/JT Butler Blvd
Westbound Ends BFS 231 189 311 256 245 188 247 448 374 402 414 116 277 205 140 114 120 117 113 4,507
Speed (mph)
>70
60-70
50-60
45-50
35-45
<35
SR
20
2/J
TB
WB
Ma
inlin
e
Legend
Interim Build 2035 AM Peak HEAT Diagram
Page 1 of 1

To From
Facility Section Type tp1 tp2 tp3 tp4 tp5 tp6 tp7 tp8 tp9 tp10 tp11 tp12 tp13 tp14 tp15 tp16 tp17 tp18 tp19 Total
I-95 Northbound Begins BFS 1,076 1,073 1,068 1,075 1,004 1,100 1,244 1,087 1,051 907 978 906 720 578 522 466 460 467 465 16,247
BFS 1,077 1,072 1,068 1,076 1,004 1,101 1,239 1,090 1,051 906 983 905 722 581 523 465 464 465 464 16,256
Baymeadows Road Exit Diverge 1,077 1,071 1,068 1,080 1,003 1,101 1,237 1,092 1,051 906 985 908 725 583 523 465 466 463 466 16,270
Baymeadows Road Exit BFS Baymeadows Road 990 936 934 970 864 943 1,082 974 942 830 905 835 667 538 481 429 430 422 430 14,602
Baymeadows Road Entrance BFS 993 938 933 970 864 942 1,080 975 945 833 902 835 669 541 481 430 430 423 429 14,613
Baymeadows Road Entrance Merge 1,410 1,350 1,333 1,367 1,314 1,365 1,506 1,383 1,350 1,246 1,272 1,106 877 700 626 562 551 562 562 20,442
BFS 1,415 1,343 1,330 1,374 1,310 1,363 1,503 1,386 1,356 1,246 1,269 1,112 882 700 633 559 552 565 556 20,454
BFS 1,416 1,344 1,334 1,368 1,311 1,371 1,494 1,387 1,361 1,242 1,271 1,121 881 706 636 556 556 561 550 20,466
BFS 1,414 1,342 1,344 1,359 1,316 1,369 1,488 1,392 1,363 1,239 1,276 1,123 884 714 634 557 560 557 554 20,485
BFS 1,410 1,340 1,346 1,356 1,325 1,366 1,476 1,408 1,355 1,244 1,282 1,124 885 721 634 559 560 554 557 20,502
SR 202/JT Butler Blvd Exit Diverge 1,380 1,342 1,360 1,350 1,344 1,363 1,437 1,438 1,362 1,247 1,285 1,126 887 728 631 560 564 550 561 20,515
SR 202/JT Butler Blvd Exit
SR 202/JT Butler Blvd EB
Entrance BFS SR 202/JT Butler Blvd 1,150 1,161 1,140 1,127 1,130 1,070 1,112 1,167 1,122 1,040 1,061 957 761 616 530 482 479 459 483 17,047
I-95/JTB IMR Interim Build Alternative- HEAT Diagram- PM Peak
Description
I-9
5 N
ort
hb
ou
nd
Ma
inlin
e
LocationSimulated Volume
Northbound/Westbound
Southbound/Eastbound
SR 202/JT Butler Blvd Exit Entrance BFS SR 202/JT Butler Blvd 1,150 1,161 1,140 1,127 1,130 1,070 1,112 1,167 1,122 1,040 1,061 957 761 616 530 482 479 459 483 17,047SR 202/JT Butler Blvd EB
Entrance Merge 1,313 1,283 1,279 1,264 1,245 1,181 1,217 1,265 1,268 1,186 1,135 1,044 827 667 574 521 519 494 512 18,794SR 202/JT Butler Blvd WB
Entrance BFS 1,311 1,282 1,278 1,265 1,248 1,185 1,212 1,265 1,267 1,194 1,134 1,049 829 670 573 521 518 495 512 18,808SR 202/JT Butler Blvd WB
Entrance Merge 1,757 1,746 1,752 1,749 1,785 1,795 1,777 1,776 1,764 1,754 1,672 1,390 1,089 879 753 683 670 647 664 26,102
BFS 1,732 1,743 1,737 1,779 1,796 1,797 1,775 1,763 1,756 1,764 1,684 1,411 1,097 874 760 685 663 655 660 26,131
Bowden Road Exit Diverge Bowden Road 1,712 1,742 1,740 1,780 1,809 1,798 1,771 1,757 1,751 1,764 1,706 1,428 1,104 873 758 692 662 656 656 26,159
Bowden Road Exit BFS 1,435 1,446 1,448 1,431 1,426 1,418 1,420 1,431 1,439 1,437 1,404 1,183 900 717 612 558 538 536 526 21,305
BFS 1,434 1,448 1,442 1,434 1,430 1,418 1,414 1,439 1,431 1,440 1,411 1,196 900 723 618 554 540 537 528 21,337
BFS 1,436 1,447 1,439 1,438 1,432 1,415 1,409 1,445 1,432 1,437 1,415 1,207 907 726 616 557 541 534 529 21,362
BFS 1,437 1,446 1,438 1,436 1,434 1,414 1,406 1,447 1,431 1,439 1,415 1,211 911 728 615 560 540 532 531 21,371
BFS 1,435 1,447 1,438 1,436 1,437 1,411 1,408 1,448 1,430 1,439 1,416 1,214 915 731 613 561 542 530 533 21,384I-95 Northbound Ends BFS 1,434 1,446 1,438 1,437 1,437 1,412 1,407 1,448 1,430 1,441 1,415 1,219 915 735 612 563 543 530 535 21,397
I-95 Southbound Begins BFS 1,526 1,344 1,499 1,554 1,624 1,607 1,647 1,648 1,662 1,666 1,668 1,667 1,665 1,666 1,662 1,668 1,644 1,015 939 29,371
BFS 1,475 1,353 1,505 1,570 1,619 1,612 1,662 1,652 1,663 1,666 1,668 1,666 1,666 1,664 1,662 1,669 1,647 1,022 939 29,380
BFS 1,408 1,363 1,506 1,592 1,609 1,626 1,672 1,664 1,673 1,667 1,666 1,666 1,667 1,664 1,662 1,668 1,648 1,033 938 29,392
BFS 1,367 1,377 1,504 1,601 1,602 1,636 1,679 1,677 1,686 1,665 1,668 1,666 1,667 1,662 1,665 1,668 1,648 1,043 939 29,420
BFS Bowden Road 1,343 1,398 1,500 1,616 1,591 1,649 1,669 1,708 1,703 1,670 1,665 1,666 1,668 1,660 1,666 1,667 1,652 1,052 940 29,483
Bowden Road Entrance BFS 1,333 1,411 1,493 1,638 1,584 1,656 1,668 1,723 1,721 1,677 1,666 1,666 1,668 1,662 1,663 1,669 1,654 1,063 944 29,559
Bowden Road Entrance Merge 1,730 1,837 1,909 2,048 1,994 2,057 2,079 2,126 2,100 2,055 2,035 1,947 1,889 1,860 1,850 1,836 1,819 1,236 1,110 35,517
BFS 1,729 1,841 1,909 2,047 1,994 2,054 2,083 2,127 2,102 2,051 2,040 1,958 1,887 1,864 1,846 1,838 1,819 1,245 1,111 35,545
SR 202/JT Butler Blvd Exit Diverge 1,729 1,834 1,912 2,043 1,997 2,049 2,086 2,113 2,096 2,043 2,049 1,984 1,888 1,866 1,846 1,836 1,824 1,253 1,110 35,558
SR 202/JT Butler Blvd Exit BFS 959 1,059 1,139 1,265 1,215 1,267 1,306 1,316 1,322 1,307 1,355 1,362 1,246 1,203 1,186 1,182 1,167 822 725 22,403
BFS SR 202/JT Butler Blvd 961 1,054 1,142 1,262 1,211 1,261 1,294 1,307 1,314 1,303 1,359 1,385 1,260 1,205 1,188 1,180 1,166 827 726 22,405
BFS 963 1,051 1,143 1,251 1,213 1,244 1,290 1,299 1,306 1,302 1,363 1,409 1,278 1,206 1,186 1,180 1,167 833 727 22,411SR 202/JT Butler Blvd WB and
I-9
5 N
ort
hb
ou
nd
Ma
inlin
eI-
95
So
uth
bo
un
d M
ain
lin
e
SR 202/JT Butler Blvd WB and
EB Entrance BFS 970 1,042 1,141 1,231 1,212 1,235 1,276 1,290 1,301 1,300 1,375 1,428 1,308 1,209 1,185 1,180 1,172 838 727 22,420SR 202/JT Butler Blvd WB and
EB Entrance Merge 1,372 1,440 1,600 1,668 1,698 1,700 1,696 1,695 1,702 1,691 1,700 1,672 1,518 1,334 1,296 1,282 1,267 941 820 28,092
BFS 1,366 1,419 1,598 1,659 1,698 1,697 1,696 1,699 1,699 1,691 1,702 1,675 1,541 1,346 1,296 1,281 1,273 945 822 28,103
BFS 1,365 1,416 1,591 1,657 1,697 1,700 1,696 1,697 1,698 1,691 1,702 1,678 1,546 1,351 1,294 1,284 1,273 955 818 28,109
BFS 1,361 1,413 1,591 1,658 1,695 1,697 1,697 1,700 1,695 1,694 1,699 1,679 1,553 1,354 1,293 1,286 1,272 963 816 28,116
BFS 1,361 1,407 1,593 1,654 1,696 1,695 1,701 1,698 1,695 1,694 1,699 1,680 1,555 1,356 1,294 1,285 1,276 966 818 28,123
Baymeadows Road Exit Diverge 1,362 1,403 1,590 1,649 1,699 1,692 1,702 1,697 1,698 1,695 1,697 1,683 1,558 1,356 1,298 1,286 1,274 977 818 28,134
Baymeadows Road Exit BFS Baymeadows Road 1,138 1,151 1,312 1,362 1,393 1,372 1,359 1,360 1,379 1,444 1,475 1,459 1,336 1,166 1,115 1,102 1,081 845 688 23,537
Baymeadows Road Entrance BFS 1,136 1,149 1,310 1,360 1,395 1,371 1,361 1,357 1,377 1,443 1,476 1,462 1,336 1,167 1,120 1,096 1,087 850 690 23,543
Baymeadows Road Entrance Merge 1,435 1,396 1,592 1,621 1,716 1,641 1,651 1,602 1,599 1,657 1,653 1,616 1,461 1,277 1,211 1,178 1,165 931 762 27,164
BFS 1,432 1,399 1,586 1,618 1,722 1,642 1,652 1,599 1,599 1,658 1,655 1,610 1,469 1,278 1,213 1,179 1,166 936 762 27,175I-95 Southbound Ends BFS 1,428 1,402 1,582 1,615 1,722 1,647 1,652 1,599 1,597 1,658 1,654 1,611 1,477 1,280 1,213 1,183 1,162 946 762 27,190
SR 202/JT Butler Blvd
Eastbound Begins/From I-95 SB
Flyover BFS 505 517 552 548 547 579 556 568 521 519 490 424 409 408 409 400 406 284 236 8,878
BFS SR 202/JTB EB Arterial 504 517 553 548 545 579 557 567 522 518 490 425 409 407 408 400 407 284 236 8,876I-95 Northbound/SR 202/ JTB
Arterial Entrance Entrance BFS 505 517 551 548 548 577 557 567 523 518 490 426 408 408 406 401 406 286 235 8,877I-95 Northbound/SR 202/ JTB
Arterial Entrance Entrance Merge Belfort Road 849 932 1,050 1,001 1,032 1,104 870 927 934 895 848 712 647 642 613 552 558 436 370 14,972
Belfort Road Entrance BFS 847 925 1,052 995 1,041 1,101 871 934 932 892 850 718 648 642 614 553 556 437 375 14,983
Belfort Road Entrance Merge 1,156 1,232 1,398 1,374 1,464 1,501 1,228 1,270 1,249 1,183 1,085 929 830 750 713 640 628 522 458 19,610
BFS 1,160 1,235 1,386 1,377 1,459 1,502 1,236 1,263 1,253 1,192 1,077 937 834 748 713 645 630 524 452 19,623SR 202/JT Butler Blvd
Eastbound Ends BFS 1,165 1,232 1,384 1,377 1,460 1,495 1,247 1,259 1,256 1,188 1,086 936 834 753 716 640 633 532 452 19,645SR 202/JT Butler Blvd
Westbound Begins BFS 954 1,008 1,025 1,176 1,035 1,187 1,221 1,143 1,032 904 819 618 498 392 350 320 317 317 316 14,632
I-9
5 S
ou
thb
ou
nd
Ma
inlin
eS
R 2
02
/JT
B E
B M
ain
lin
eS
R 2
02
/JT
B W
B
Westbound Begins BFS 954 1,008 1,025 1,176 1,035 1,187 1,221 1,143 1,032 904 819 618 498 392 350 320 317 317 316 14,632
BFS Belfort Road 954 1,008 1,024 1,174 1,034 1,186 1,218 1,148 1,032 906 819 621 500 393 353 317 319 316 316 14,638
Belfort Road Exit Diverge 955 1,005 1,026 1,172 1,036 1,183 1,216 1,150 1,035 910 818 623 502 394 357 316 319 315 316 14,648
Belfort Road Exit BFS SR 202/JTB WB Arterial 799 870 884 967 838 892 949 867 866 770 718 532 422 337 302 268 270 266 267 12,084I-95 Northbound Exit Diverge 796 872 883 968 838 893 947 866 866 772 721 533 423 336 303 268 270 266 267 12,088
I-95 Northbound Exit
SR 202/JT Butler Blvd
Westbound Ends BFS 436 492 453 511 356 461 488 462 470 386 412 297 229 183 165 146 143 147 150 6,387
Speed (mph)
>70
60-70
50-60
45-50
35-45
<35
SR
20
2/J
TB
WB
Ma
inlin
e
Legend
Interim Build 2035 PM Peak HEAT Diagram
Page 1 of 1

7.0 EVALUATION OF ALTERNATIVES I-95/ J. Turner Butler Blvd IMR
7-17
In the northbound direction, recurring congestion is found downstream of the JTB westbound entrance during AM and PM peak similar to the No-Build. The high densities found immediately downstream of the entrance ramp (highlighted in Table 7-11) indicate recurring congestion during AM and PM peak. This operational deficiency is associated with the high volume entrance ramp, heavy mainline volume and close proximity of JTB and Bowden Road interchanges. Congestion from this area extends to I-95 northbound flyover entrance from JTB and affects westbound JTB operations. The CORSIM model shows that the lack of capacity and congested conditions along JTB westbound under the No-Build Alternative prevents traffic from reaching the I-95 northbound mainline. In the Build Alternative, additional traffic is able to be processed on JTB westbound thus degrading I-95 northbound. The heat diagrams confirm this condition. As per the FHWA toolbox, the temporal time limits of the model were increased to 5 hours to allow for recovery and dissipation of traffic. At the end of the simulation period, traffic dissipated from the Build model but the No-Build model still had congested areas. This also confirms that the congested area on JTB westbound was removed and that traffic is able to reach I-95 NB quicker resulting in some degradation of I-95 northbound during the peak period. Additional capacity is needed on I-95 to effectively process all the traffic demand. A planning level study is underway to evaluate additional capacity projects on I-95 from International Golf Parkway to the Overland Bridge. Due to the proposed improvements from this study, the planning study will need to incorporate these improvements and make recommendations on how to process the additional demand on I-95 NB that the Build Alternative delivers. The number of on ramp lanes merging with I-95 remain the same in both the No-Build and Build alternatives, i.e. 2 lanes. The traffic and LOS from HCS on the I-95 mainline between JTB and Bowden Road also remains the same under No-Build and Build conditions. This indicates that if the entire traffic demand was able to get to the mainline in No-Build and Build conditions during the peak hour, then the LOS would remain the same as per HCS. Recurring congestion is also found between Baymeadows Road entrance and JTB exit during AM peak. This operational deficiency is associated with the high mainline volume of 7,640 vph in the three lane section of I-95 with maximum capacity of 6,750 vph. Congestion from this area extends to Baymeadows Road interchange and to the beginning of the study network and affects Baymeadows Road interchange operations. The PM peak heat diagram illustrates congestion in the northbound direction from the JTB exit to Bowden Road; in the southbound direction, congestion occurs from north of Bowden Road to south of the JTB entrance. However, it should be noted that the congestion clears during the peak hour. In the southbound direction, congestion is found upstream of the I-95 southbound off-ramp to JTB during the PM peak. The high densities found immediately upstream of the exit ramp (highlighted in Table 7-11) indicate recurring congestion associated with the high exiting ramp volume of 3,270 vph during the PM peak. Complex maneuvers and lane changes occurring in this segment due to the downstream exit ramp result in reduced headway and higher freeway
7.0 EVALUATION OF ALTERNATIVES I-95/ J. Turner Butler Blvd IMR
7-18
segment densities. Congestion is also observed from the JTB exit to Baymeadows Road exit in the southbound direction during the PM peak, this is due to the high entry volume on the JTB combined entrance ramp of 2,110 vph which merges onto an already congested freeway mainline to produce a downstream volume of 7,640 vph in the three lane section of I-95 which exceeds maximum capacity of 6,750 vph. The congested conditions discussed above exist in the No-Build as well and are not due to the proposed modifications at the I-95/JTB interchange. Higher densities exhibited in the Interim Build alternative that are not apparent in the No-Build are primarily due to elimination of upstream bottlenecks under the Build alternative. Bottlenecks in the No-Build alternative essentially meter the traffic to the remainder of the system making capacity constraints downstream less apparent. The proposed modifications in fact make conditions better and the Build Alternative is able to process more traffic. In addition all the queues are able to dissipate in the Build conditions. No congestion was observed on the I-95 southbound flyover exit to JTB eastbound. The Build alternative results in significant improvements at the I-95 southbound off ramp terminal intersection due to the flyover ramp. This results in increased speeds and lower densities along the mainline as well as reduced delay times at the intersection. In case of the Interim Build Alternative, congestion from all of the locations mentioned above dissipates before the end of the five hour simulation period as illustrated in the lane schematics. This is an improvement over the No-Build condition in which there are vehicle queues present at the end of the simulation period. No unmet demand was observed for the Interim Build condition at the end of the simulation.
A comparison of I-95 freeway operational performance under the Interim Build condition with the No-Build performance presented in Section 5 shows that I-95 has higher speeds and lower densities under the Build condition. The operations on I-95 and the I-95/JTB interchange area are significantly better than the operations observed under the No-Build condition.

7.0 EVALUATION OF ALTERNATIVES I-95/ J. Turner Butler Blvd IMR
7-19
Table 7-10 Design Year 2035 Interim Build Alternative Northbound I-95 Freeway MOEs
Table 7-11 Design Year 2035 Interim Build Alternative Southbound I-95 Freeway MOEs
From ToDistance
(ft)
Speed
(mph)
Density
(vplpm)
Speed
(mph)
Density
(vplpm)
I-95 Northbound Begins 1427 25 92 63 24
1426 21 99 62 24
Baymeadows Road Exit 1427 19 101 60 23
Baymeadows Road Exit 1562 12 132 62 21
Baymeadows Road Entrance 931 12 132 61 21
Baymeadows Road Entrance 1625 16 116 51 34
1623 17 116 61 31
1560 22 87 58 32
1558 24 83 59 32
1331 25 78 53 35
SR 202/JT Butler Blvd Exit 1331 23 80 43 45
SR 202/JT Butler Blvd Exit SR 202/JT Butler Blvd EB Entrance 1813 25 57 30 53
SR 202/JT Butler Blvd EB Entrance 1380 25 48 24 51
SR 202/JT Butler Blvd WB Entrance 610 30 53 30 55
SR 202/JT Butler Blvd WB Entrance 1581 30 53 30 53
1581 41 46 47 39
Bowden Road Exit 1560 40 46 44 43
Bowden Road Exit 1615 45 43 44 44
1616 48 40 48 41
1573 50 39 49 40
686 52 36 52 37
953 57 33 57 33
I-95 Northbound Ends 902 61 31 61 31
PMFreeway Segment Link AM
From ToDistance
(ft)
Speed
(mph)
Density
(vplpm)
Speed
(mph)
Density
(vplpm)
I-95 Southbound Begins 906 62 30 48 53
943 62 30 39 68
1274 61 30 31 81
1072 61 31 28 88
1432 60 31 26 92
Bowden Road Entrance 1502 60 31 26 90
Bowden Road Entrance 1596 58 30 26 83
921 55 32 36 58
SR 202/JT Butler Blvd Exit 1186 57 25 52 33
SR 202/JT Butler Blvd Exit 1891 61 23 48 39
797 61 23 35 57
890 61 23 28 67
SR 202/JT Butler Blvd WB and EB Entrance1324 60 23 24 72
SR 202/JT Butler Blvd WB and EB Entrance 1749 60 19 20 77
1260 50 28 27 71
1503 63 26 55 41
1505 65 26 63 36
1165 64 26 61 37
Baymeadows Road Exit 1845 63 20 62 27
Baymeadows Road Exit 1325 66 17 64 29
Baymeadows Road Entrance 1325 67 17 65 28
Baymeadows Road Entrance 1370 66 13 63 23
1357 67 14 62 27
I-95 Southbound Ends 1401 62 20 58 38
PMFreeway Segment Link AM

321
Distance (ft) 1401 1357 1370 1325 1325 1845 1165 1505 1503 1260 1749 1324 890 797 1891 1186 921 1596 1502 1432 1072 1274 943 906
Speed (mph) 62 67 66 67 66 63 64 65 63 50 60 60 61 61 61 57 55 58 60 60 61 61 62 62
Density (veh/ln/mi) 20 14 13 17 17 20 26 26 26 28 19 23 23 23 23 25 32 30 31 31 31 30 30 30
323 322336 335 324334 333 332 331 330 325345 326329 328 327343 342 341 340 339 338344 337
Baymeadows SR 202/ SR 202/
Road Baymeadows JT Butler Blvd JT Butler Blvd
Entrance Road EB/WB Entrance Exit Bowden Road
374 vph Exit 1160 vph 2670 vph Entrance
630 ft 1830 vph 650 ft 1100 ft 1440 vph2600 ft 10 1770 ft 2350 ft 10
9 9 9 9 9 9 9 9
1 1 1 1 1 1 1 1 1 1 1 1 1 1 1 1 1 1 1 1 1 1 1
2 2 2 2 2 2 2 2 2 2 2 2 2 2 2 2 2 2 2 2 2 2 2
Simulated Volumes 3944 3 3950 3 3950 3 3620 3 3623 3 5334 5338 3 5344 3 5348 3 5353 3 5360 3 4434 3 4433 3 4441 3 4442 3 7141 3 7147 3 7152 3 5747 3 5748 3 5754 3 5753 3 5755 3 5756 3
Demand Volumes 4234 4234 4234 3860 3860 5690 5690 5690 5690 5690 5690 4530 4530 4530 4530 7200 7200 7200 5760 5760 5760 5760 5760 5760
Demand Volumes 7420 7420 7420 6140 6140 7640 7640 7640 7640 7640 7640 5530 6050 6050 8800 8800 8800 7040 7040 7040 7040 7040 7040
Simulated Volumes 3 5840 3 5787 3 5739 3 4713 3 4706 3 5897 3 5900 3 5904 3 5919 3 5933 3 5946 3 4381 3 4890 3 4894 3 7098 3 7090 3 7071 3 5711 3 5714 3 5717 3 5717 3 5713 3 5715
2 2 2 2 2 2 2 2 2 2 2 2 2 2 2 2 2 2 2 2 2 2 2
1 1 1 1 1 1 1 1 1 1 1 1 1 1 1 1 1 1 1 1 1 1 1
9 9 9 9 9 9 9
200 ft 360 ft 200 ft 1300 ft 10
Baymeadows Baymeadows SR 202/ SR 202/ 780 ft Bowden Road
Road road JT Butler Blvd JT Butler Blvd SR 202/ Exit
Exit Entrance Exit EB Entrance JT Butler Blvd 1760 vph
I-95 Southbound
Exit Entrance Exit EB Entrance JT Butler Blvd 1760 vph
1280 vph 1500 vph 2110 vph 520 vph WB Entrance
2750 vph
Distance (ft) 1427 1426 1427 1562 931 1625 1623 1560 1558 1331 1331 1813 1380 610 1581 1581 1560 1615 1616 1573 686 953 902
Speed (mph) 25 21 19 12 12 16 17 22 24 25 23 25 25 30 30 41 40 45 48 50 52 57 61
Density (veh/ln/mi) 92 99 101 132 132 116 116 87 83 78 80 57 48 53 53 46 46 43 40 39 36 33 31
143
511 Node Number Freeway Geometric Coloring
Density (Veh/Mi/Ln)
20 and below Density above 75
20 - 30 Density above 45
30 - 45 Density above 35
I-95 Northbound
132 133 135 136 137199 127 128 134129
LEGEND
Speed (mph)
121 122 123 124 125 126 140 141 142130 131 138 139
45 and above
900 Demand volume highlighted if simulated falls below = 90%
809 Simulated volume
I-95/ SR 202/JT Butler Boulevard Interchange Modification Report
AM Peak Hour MOE'sI-95 Lane Schematic
Interim Build 2035
Interim Build 2035 AM Peak Hour Lane Schematic
Page 1 of 2

321
Distance (ft) 1401 1357 1370 1325 1325 1845 1165 1505 1503 1260 1749 1324 890 797 1891 1186 921 1596 1502 1432 1072 1274 943 906
Speed (mph) 58 62 63 65 64 62 61 63 55 27 20 24 28 35 48 52 36 26 26 26 28 31 39 48
Density (veh/ln/mi) 38 27 23 28 29 27 37 36 41 71 77 72 67 57 39 33 58 83 90 92 88 81 68 53
323 322336 335 324334 333 332 331 330 325345 326329 328 327343 342 341 340 339 338344 337
Baymeadows SR 202/ SR 202/
Road Baymeadows JT Butler Blvd JT Butler Blvd
Entrance Road EB/WB Entrance Exit Bowden Road
1126 vph Exit 2110 vph 3270 vph Entrance
630 ft 1500 vph 650 ft 1760 vph2600 ft 10 1770 ft 2350 ft 10
9 9 9 1 9 9 9 9
1 1 1 1 1 1 1 2 1 1 1 1 1 1 1 1 1 1 1 1 1 1
2 2 2 2 2 2 2 3 2 2 2 2 2 2 2 2 2 2 2 2 2 2
Simulated Volumes 6620 6615 3 6610 3 5484 3 5484 3 6790 6790 3 6789 3 6790 3 6790 4 6789 3 5013 3 5046 3 5073 3 5104 3 8245 3 8258 3 8256 3 6631 3 6617 3 6594 3 6571 3 6545 3 6526 3
Demand Volumes 7266 7266 7266 6140 6140 7640 7640 7640 7640 7640 7640 5530 5530 5530 5530 8800 8800 8800 7040 7040 7040 7040 7040 7040
Demand Volumes 4431 4431 4431 3860 3860 5690 5690 5690 5690 5690 5690 4530 4950 4950 7200 7200 7200 5760 5760 5760 5760 5760 5760
Simulated Volumes 3 4435 3 4434 3 4433 3 3863 3 3861 3 5568 3 5562 3 5563 3 5565 3 5575 3 5582 3 4479 3 4908 3 4910 3 7133 3 7131 3 7135 3 5695 3 5701 3 5701 3 5701 3 5704 3 5704
2 2 2 2 2 2 2 2 2 2 2 2 2 2 2 2 2 2 2 2 2 2 2
1 1 1 1 1 1 1 1 1 1 1 1 1 1 1 1 1 1 1 1 1 1 1
9 9 9 9 9 9 9
200 ft 360 ft 200 ft 1300 ft
Baymeadows Baymeadows SR 202/ SR 202/ 780 ft Bowden Road
Road road JT Butler Blvd JT Butler Blvd SR 202/ Exit
Exit Entrance Exit EB Entrance JT Butler Blvd 1440 vph
I-95 Southbound
Exit Entrance Exit EB Entrance JT Butler Blvd 1440 vph
571 vph 1830 vph 1160 vph 420 vph WB Entrance
2250 vph
Distance (ft) 1427 1426 1427 1562 931 1625 1623 1560 1558 1331 1331 1813 1380 610 1581 1581 1560 1615 1616 1573 686 953 902
Speed (mph) 63 62 60 62 61 51 61 58 59 53 43 30 24 30 30 47 44 44 48 49 52 57 61
Density (veh/ln/mi) 24 24 23 21 21 34 31 32 32 35 45 53 51 55 53 39 43 44 41 40 37 33 31
143
511 Node Number Freeway Geometric Coloring
Density (Veh/Mi/Ln)
20 and below Density above 75
20 - 30 Density above 45
30 - 45 Density above 35
I-95 Northbound
132 133 135 136 137199 127 128 134129
LEGEND
Speed (mph)
121 122 123 124 125 126 140 141 142130 131 138 139
45 and above
900 Demand volume highlighted if simulated falls below = 90%
809 Simulated volume
I-95/ SR 202/JT Butler Boulevard Interchange Modification Report
PM Peak Hour MOE'sI-95 Lane Schematic
Interim Build 2035
Interim Build 2035 PM Peak Hour Lane Schematic
Page 1 of 2

321
Distance (ft) 1401 1357 1370 1325 1325 1845 1165 1505 1503 1260 1749 1324 890 797 1891 1186 921 1596 1502 1432 1072 1274 943 906
Speed (mph) 64 68 67 68 68 66 67 68 68 65 65 63 63 63 63 60 62 62 63 63 63 63 64 64
Density (veh/ln/mi) 8 6 5 6 6 5 7 7 6 4 4 5 5 5 5 5 5 5 6 6 6 6 6 6
345 326329 328 327343 342 341 340 339 338344 337 323 322336 335 324334 333 332 331 330 325
Baymeadows SR 202/ SR 202/
Road Baymeadows JT Butler Blvd JT Butler Blvd
Entrance Road EB/WB Entrance Exit Bowden Road
260 vph Exit 556 vph 1328 vph Entrance
630 ft 652 vph 650 ft 1100 ft 716 vph2600 ft 10 1770 ft 2350 ft 10
9 9 9 9 9 9 9 9
1 1 1 1 1 1 1 1 1 1 1 1 1 1 1 1 1 1 1 1 1 1 1
2 2 2 2 2 2 2 2 2 2 2 2 2 2 2 2 2 2 2 2 2 2 2
Simulated Volumes 2215 3 2214 3 2216 3 1958 3 1955 3 2613 2605 3 2604 3 2600 3 2600 3 2596 3 2063 3 2062 3 2060 3 2059 3 3383 3 3382 3 3378 3 2694 3 2689 3 2686 3 2685 3 2682 3 2680 3
Demand Volumes 2232 2232 2232 1972 1972 2624 2624 2624 2624 2624 2624 2068 2068 2068 2068 3396 3396 3396 2680 2680 2680 2680 2680 2680
Demand Volumes 3064 3064 3064 2616 2616 3296 3296 3296 3296 3296 3296 2588 2964 2964 3904 3904 3904 2980 2980 2980 2980 2980 2980
Simulated Volumes 3 3440 3 3523 3 3602 3 3171 3 3241 3 4113 3 4209 3 4272 3 4332 3 4387 3 4442 3 3539 3 3961 3 3976 3 4962 3 4977 3 4988 3 3728 3 3738 3 3751 3 3752 3 3760 3 3769
2 2 2 2 2 2 2 2 2 2 2 2 2 2 2 2 2 2 2 2 2 2 2
1 1 1 1 1 1 1 1 1 1 1 1 1 1 1 1 1 1 1 1 1 1 1
9 9 9 9 9 9 9
200 ft 360 ft 200 ft 1300 ft 10
Baymeadows Baymeadows SR 202/ SR 202/ 780 ft Bowden Road
Road road JT Butler Blvd JT Butler Blvd SR 202/ Exit
Exit Entrance Exit EB Entrance JT Butler Blvd 924 vph
I-95 Southbound
Exit Entrance Exit EB Entrance JT Butler Blvd 924 vph
448 vph 680 vph 708 vph 376 vph WB Entrance
940 vph
Distance (ft) 1427 1426 1427 1562 931 1625 1623 1560 1558 1331 1331 1813 1380 610 1581 1581 1560 1615 1616 1573 686 953 902
Speed (mph) 53 52 50 48 44 43 43 44 44 44 42 44 43 46 54 61 58 62 61 61 61 62 62
Density (veh/ln/mi) 17 21 23 31 34 33 39 33 34 35 36 27 24 26 13 14 14 14 14 15 15 16 16
143
511 Node Number Freeway Geometric Coloring
Density (Veh/Mi/Ln)
20 and below Density above 75
20 - 30 Density above 45
30 - 45 Density above 35
121 122 123 124 125 126 140 141 142130 131 138 139
I-95 Northbound
132 133 135 136 137199 127 128 134129
LEGEND
Speed (mph)
45 and above
900 Demand volume highlighted if simulated falls below = 90%
809 Simulated volume
I-95/ SR 202/JT Butler Boulevard Interchange Modification Report
AM 5th Hour MOE'sI-95 Lane Schematic
Interim Build 2035
Interim Build 2035 AM 5th Hour Lane Schematic
Page 1 of 2

321
Distance (ft) 1401 1357 1370 1325 1325 1845 1165 1505 1503 1260 1749 1324 890 797 1891 1186 921 1596 1502 1432 1072 1274 943 906
Speed (mph) 62 66 66 66 66 65 66 66 65 60 62 60 61 61 61 59 59 60 61 61 61 61 62 63
Density (veh/ln/mi) 15 11 10 15 15 13 16 16 15 9 6 13 13 13 14 16 17 15 20 20 20 19 19 20
345 326329 328 327343 342 341 340 339 338344 337 323 322336 335 324334 333 332 331 330 325
Baymeadows SR 202/ SR 202/
Road Baymeadows JT Butler Blvd JT Butler Blvd
Entrance Road EB/WB Entrance Exit Bowden Road
324 vph Exit 412 vph 1488 vph Entrance
630 ft 484 vph 650 ft 552 vph2600 ft 10 1770 ft 2350 ft 10
9 9 9 1 9 9 9 9
1 1 1 1 1 1 1 2 1 1 1 1 1 1 1 1 1 1 1 1 1 1
2 2 2 2 2 2 2 3 2 2 2 2 2 2 2 2 2 2 2 2 2 2
Simulated Volumes 4053 4043 3 4036 3 3723 3 3716 3 4355 4345 3 4337 3 4330 3 4321 4 4310 3 3917 3 3907 3 3899 3 3896 3 6023 3 6013 3 6001 3 5330 3 5311 3 5298 3 5287 3 5277 3 5266 3
Demand Volumes 3080 3080 3080 2756 2756 3240 3240 3240 3240 3240 3240 2828 2828 2828 2828 4316 4316 4316 3764 3764 3764 3764 3764 3764
Demand Volumes 1860 1860 1860 1720 1720 2228 2228 2228 2228 2228 2228 1892 2044 2044 2660 2660 2660 2152 2152 2152 2152 2152 2152
Simulated Volumes 3 1858 3 1858 3 1860 3 1711 3 1712 3 2237 3 2232 3 2223 3 2228 3 2230 3 2235 3 1903 3 2046 3 2046 3 2664 3 2663 3 2666 3 2158 3 2159 3 2161 3 2163 3 2166 3 2171
2 2 2 2 2 2 2 2 2 2 2 2 2 2 2 2 2 2 2 2 2 2 2
1 1 1 1 1 1 1 1 1 1 1 1 1 1 1 1 1 1 1 1 1 1 1
9 9 9 9 9 9 9
200 ft 360 ft 200 ft 1300 ft
Baymeadows Baymeadows SR 202/ SR 202/ 780 ft Bowden Road
Road road JT Butler Blvd JT Butler Blvd SR 202/ Exit
Exit Entrance Exit EB Entrance JT Butler Blvd 508 vph
I-95 Southbound
Exit Entrance Exit EB Entrance JT Butler Blvd 508 vph
140 vph 508 vph 336 vph 152 vph WB Entrance
616 vph
Distance (ft) 1427 1426 1427 1562 931 1625 1623 1560 1558 1331 1331 1813 1380 610 1581 1581 1560 1615 1616 1573 686 953 902
Speed (mph) 64 64 63 64 64 62 63 63 63 63 62 63 62 62 61 63 62 63 63 63 63 63 63
Density (veh/ln/mi) 1 1 1 1 2 0 0 0 0 0 0 0 0 0 0 0 0 0 0 0 0 0 0
143
511 Node Number Freeway Geometric Coloring
Density (Veh/Mi/Ln)
20 and below Density above 75
20 - 30 Density above 45
30 - 45 Density above 35
121 122 123 124 125 126 140 141 142130 131 138 139
I-95 Northbound
132 133 135 136 137199 127 128 134129
LEGEND
Speed (mph)
45 and above
900 Demand volume highlighted if simulated falls below = 90%
809 Simulated volume
I-95/ SR 202/JT Butler Boulevard Interchange Modification Report
PM 5th Hour MOE'sI-95 Lane Schematic
Interim Build 2035
Interim Build 2035 PM 5th Hour Lane Schematic
Page 1 of 2

7.0 EVALUATION OF ALTERNATIVES I-95/ J. Turner Butler Blvd IMR
7-24
JTB Freeway Operational Performance
The CORSIM model operations indicate that there are no operational deficiencies along the JTB mainline under the Design Year 2035 Interim Build conditions. The Interim Build Heat Diagrams illustrate the location and duration of congestion along JTB. The AM peak heat diagram illustrates congestion along the JTB westbound mainline from west of Belfort Road to the diverge to I-95 northbound. The PM peak heat diagram illustrates that there is no significant congestion along the JTB mainline in either direction. Similar to the No-Build condition, the I-95 northbound mainline downstream of the JTB entrance ramp does not have adequate capacity. Therefore congestion occurs at the merge and affects JTB westbound to I-95 northbound flyover operations. Low speeds and high densities were also observed along JTB westbound mainline in the AM peak resulting from this congestion. In the PM peak, increased densities are observed on the JTB eastbound mainline after the Belfort Road On-Ramp, this is due to the high On-Ramp volume of 1,610 vph. However, all observed congestion along the JTB mainline dissipates by the end of simulation (5th hour) as illustrated in the lane schematics. The CORSIM model results for Interim Build Alternative for JTB are presented in Tables 7-12 and 7-13 below. Table 7-12 Design Year 2035 Interim Build Alternative Eastbound JTB Freeway MOEs
Table 7-13 Design Year 2035 Interim Build Alternative Westbound JTB Freeway MOEs
From ToDistance
(ft)
Speed
(mph)
Density
(vplpm)
Speed
(mph)
Density
(vplpm)
SR 202/JT Butler Blvd Eastbound Begins 392 53 18 53 21
414 53 18 53 21
I-95 Northbound Entrance 479 53 18 53 21
I-95 Northbound Entrance 1683 51 22 51 24
Belfort Road Entrance 1453 52 23 52 25
Belfort Road Entrance 390 46 25 38 41
1498 52 27 51 36
SR 202/JT Butler Blvd Eastbound Ends 1471 52 26 52 35
PMFreeway Segment Link AM
From ToDistance
(ft)
Speed
(mph)
Density
(vplpm)
Speed
(mph)
Density
(vplpm)
SR 202/JT Butler Blvd Westbound Begins 1469 22 98 53 29
852 21 90 52 29
Belfort Road Exit 974 21 76 51 27
Belfort Road Exit 1937 15 76 51 24
I-95 Northbound Exit 536 12 84 51 25
I-95 Northbound Exit
SR 202/JT Butler Blvd
Westbound Ends606 48 11 53 16
Freeway Segment Link AM PM
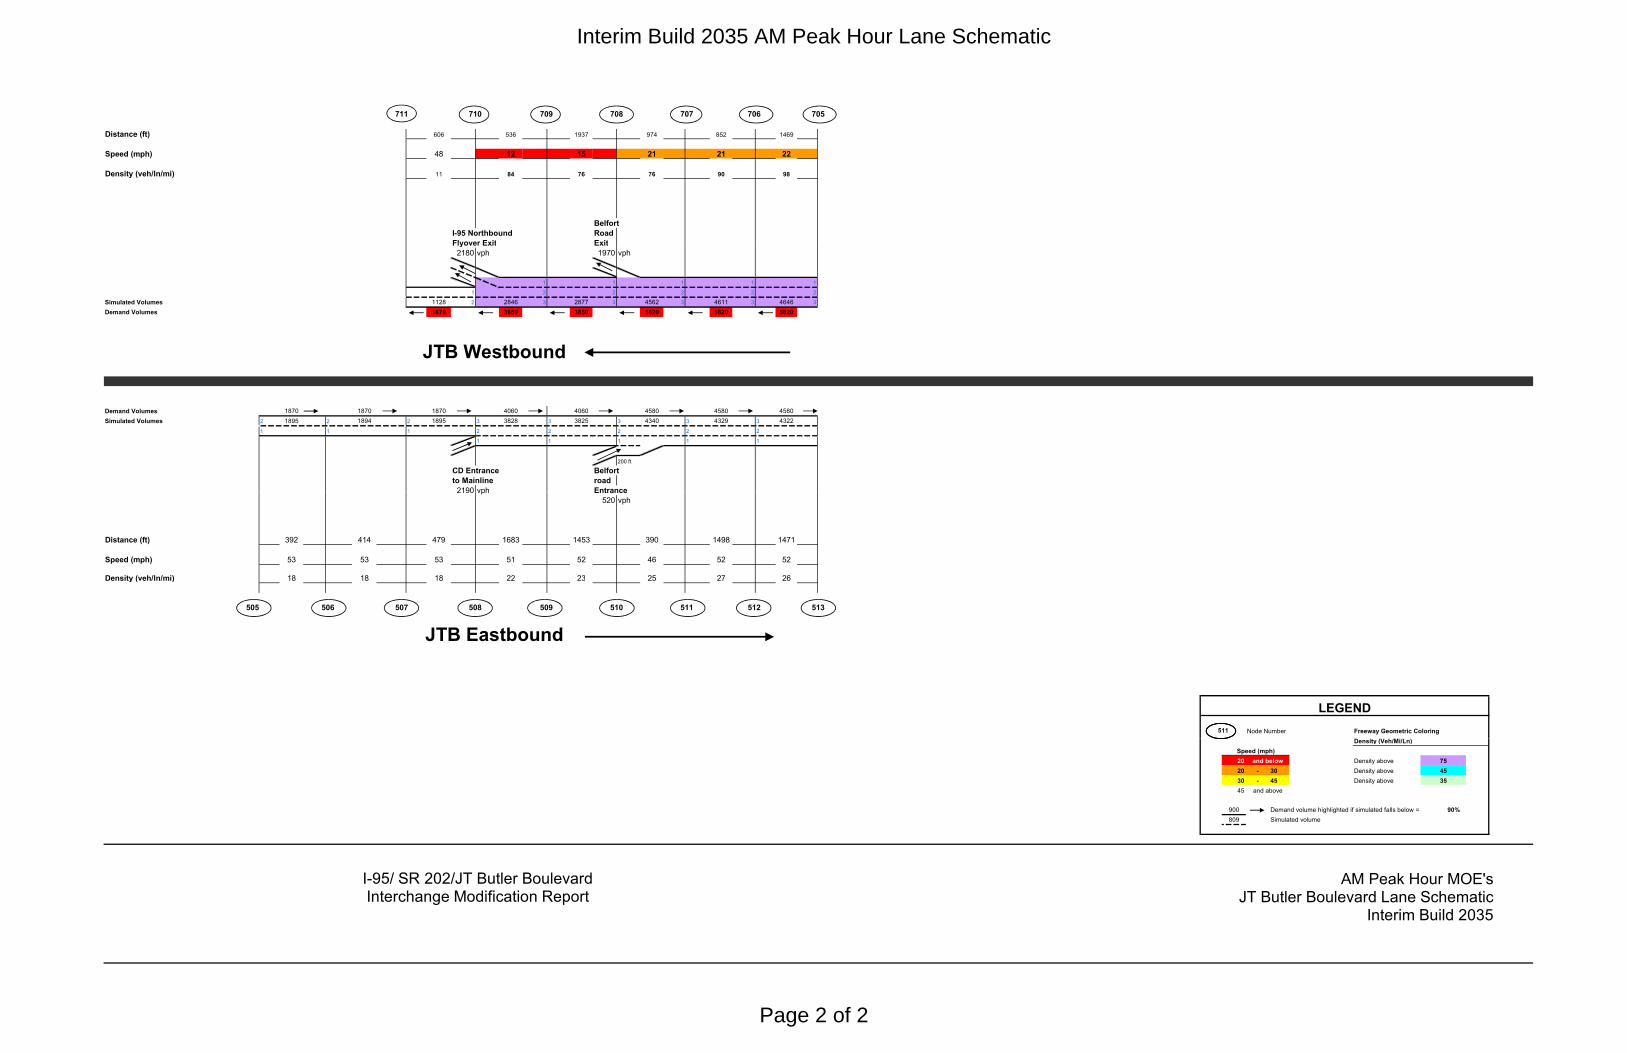
Distance (ft) 606 536 1937 974 852 1469
Speed (mph) 48 12 15 21 21 22
Density (veh/ln/mi) 11 84 76 76 90 98
Belfort
I-95 Northbound Road
Flyover Exit Exit
706 705711 710 709 708 707
Flyover Exit Exit
2180 vph 1970 vph
1 1 1 1 1
1 2 2 2 2 2
Simulated Volumes 1128 2 2846 3 2877 3 4562 3 4611 3 4646 3
Demand Volumes 1670 3850 3850 5820 5820 5820
Demand Volumes 1870 1870 1870 4060 4060 4580 4580 4580
Simulated Volumes 2 1895 2 1894 2 1895 3 3828 3 3825 3 4340 3 4329 3 4322
1 1 1 2 2 2 2 2
1 1 1 1 1
200 ft
CD Entrance Belfort
to Mainline road
2190 vph Entrance
JTB Westbound
2190 vph Entrance
520 vph
Distance (ft) 392 414 479 1683 1453 390 1498 1471
Speed (mph) 53 53 53 51 52 46 52 52
Density (veh/ln/mi) 18 18 18 22 23 25 27 26
511 Node Number Freeway Geometric Coloring
Density (Veh/Mi/Ln)
LEGEND
JTB Eastbound
505 506 507 508 509 510 511 512 513
Density (Veh/Mi/Ln)
20 and below Density above 75
20 - 30 Density above 45
30 - 45 Density above 35
45 and above
900 Demand volume highlighted if simulated falls below = 90%
809 Simulated volume
Speed (mph)
I-95/ SR 202/JT Butler Boulevard Interchange Modification Report
AM Peak Hour MOE'sJT Butler Boulevard Lane Schematic
Interim Build 2035
Interim Build 2035 AM Peak Hour Lane Schematic
Page 2 of 2

Distance (ft) 606 536 1937 974 852 1469
Speed (mph) 53 51 51 51 52 53
Density (veh/ln/mi) 16 25 24 27 29 29
Belfort
I-95 Northbound Road
Flyover Exit Exit
1780 vph 1030 vph
706 705711 710 709 708 707
1780 vph 1030 vph
1 1 1 1 1
1 2 2 2 2 2
Simulated Volumes 1767 2 3544 3 3546 3 4585 3 4586 3 4586 3
Demand Volumes 1770 3550 3550 4580 4580 4580
Demand Volumes 2390 2390 2390 4210 4210 5820 5820 5820
Simulated Volumes 2 2250 2 2248 2 2249 3 3933 3 3947 3 5463 3 5460 3 5461
1 1 1 2 2 2 2 2
1 1 1 1 1
350 ft 200 ft
CD Entrance Belfort
to Mainline road
1820 vph Entrance
1610 vph
JTB Westbound
1610 vph
Distance (ft) 392 414 479 1683 1453 390 1498 1471
Speed (mph) 53 53 53 51 52 38 51 52
Level of Service C 21 21 24 25 41 36 35
Density (veh/ln/mi) 21 21 21 24 25 41 36 35
511 Node Number Freeway Geometric Coloring
LEGEND
JTB Eastbound
505 506 507 508 509 510 511 512 513
511 Node Number Freeway Geometric Coloring
Density (Veh/Mi/Ln)
20 and below Density above 75
20 - 30 Density above 45
30 - 45 Density above 35
45 and above
900 Demand volume highlighted if simulated falls below = 90%
809 Simulated volume
Speed (mph)
I-95/ SR 202/JT Butler Boulevard Interchange Modification Report
PM Peak Hour MOE'sJT Butler Boulevard Lane Schematic
Interim Build 2035
Interim Build 2035 PM Peak Hour Lane Schematic
Page 2 of 2

Distance (ft) 606 536 1937 974 852 1469
Speed (mph) 54 54 54 53 54 54
Density (veh/ln/mi) 0 0 0 0 0 0
Belfort
I-95 Northbound Road
Flyover Exit Exit
706 705711 710 709 708 707
Flyover Exit Exit
748 vph 556 vph
1 1 1 1 1
1 2 2 2 2 2
Simulated Volumes 464 2 1209 3 1209 3 1769 3 1768 3 1764 3
Demand Volumes 456 1204 1204 1760 1760 1760
Demand Volumes 880 880 880 1896 1896 2152 2152 2152
Simulated Volumes 2 889 2 889 2 888 3 2014 3 2019 3 2284 3 2282 3 2287
1 1 1 2 2 2 2 2
1 1 1 1 1
200 ft
CD Entrance Belfort
to Mainline road
1016 vph Entrance
JTB Westbound
1016 vph Entrance
256 vph
Distance (ft) 392 414 479 1683 1453 390 1498 1471
Speed (mph) 54 54 54 52 54 51 54 54
Density (veh/ln/mi) 4 3 3 7 7 7 8 8
511 Node Number Freeway Geometric Coloring
Density (Veh/Mi/Ln)
JTB Eastbound
505 506 507 508 509 510 511 512 513
LEGEND
Density (Veh/Mi/Ln)
20 and below Density above 75
20 - 30 Density above 45
30 - 45 Density above 35
45 and above
900 Demand volume highlighted if simulated falls below = 90%
809 Simulated volume
Speed (mph)
I-95/ SR 202/JT Butler Boulevard Interchange Modification Report
AM 5th Hour MOE'sJT Butler Boulevard Lane Schematic
Interim Build 2035
Interim Build 2035 AM 5th Hour Lane Schematic
Page 2 of 2

Distance (ft) 606 536 1937 974 852 1469
Speed (mph) 55 54 54 54 54 55
Density (veh/ln/mi) 0 0 0 0 0 0
Belfort
I-95 Northbound Road
Flyover Exit Exit
488 vph 200 vph
706 705711 710 709 708 707
488 vph 200 vph
1 1 1 1 1
1 2 2 2 2 2
Simulated Volumes 586 2 1071 3 1071 3 1266 3 1268 3 1270 3
Demand Volumes 580 1068 1068 1268 1268 1268
Demand Volumes 916 916 916 1440 1440 1768 1768 1768
Simulated Volumes 2 1326 2 1327 2 1328 3 1916 3 1921 3 2248 3 2251 3 2257
1 1 1 2 2 2 2 2
1 1 1 1 1
350 ft 200 ft
CD Entrance Belfort
to Mainline road
524 vph Entrance
328 vph
JTB Westbound
328 vph
Distance (ft) 392 414 479 1683 1453 390 1498 1471
Speed (mph) 54 54 54 53 54 51 54 54
Level of Service A 9 9 5 5 1 3 3
Density (veh/ln/mi) 8 9 9 5 5 1 3 3
511 Node Number Freeway Geometric Coloring
JTB Eastbound
505 506 507 508 509 510 511 512 513
LEGEND
511 Node Number Freeway Geometric Coloring
Density (Veh/Mi/Ln)
20 and below Density above 75
20 - 30 Density above 45
30 - 45 Density above 35
45 and above
900 Demand volume highlighted if simulated falls below = 90%
809 Simulated volume
Speed (mph)
I-95/ SR 202/JT Butler Boulevard Interchange Modification Report
PM 5th Hour MOE'sJT Butler Boulevard Lane Schematic
Interim Build 2035
Interim Build 2035 PM 5th Hour Lane Schematic
Page 2 of 2

7.0 EVALUATION OF ALTERNATIVES I-95/ J. Turner Butler Blvd IMR
7-29
Arterial Operational Performance
CORSIM results show that the operating conditions along JTB arterial segments improve significantly under the Build conditions as compared to the No-Build. This is due to the proposed improvements at the I-95/JTB interchange as well as the widening of JTB from Philips Highway to I-95. The most significant improvement is observed at the I-95 southbound off ramp terminal intersection due to the proposed southbound to JTB eastbound flyover. This intersection operates at an acceptable LOS under the Build condition whereas the queues from the intersection backed up on to I-95 mainline under the No-Build condition. In the westbound direction, the CORSIM model results show relatively lower intersection delays indicating that there are no operational deficiencies on the JTB westbound arterial under the Design Year 2035 Interim Build conditions. In the eastbound direction, lower speeds were observed between I-95 southbound ramp terminal intersection and I-95 northbound off ramp terminal intersection. Queues from the I-95 northbound off ramp terminal intersection cleared within one cycle. The results of the CORSIM arterial operational analysis indicate that fewer study intersections experience undesirable operations compared to the No-Build. These intersections are:
• Baymeadows Road at I-95 NB On/Off- AM peak.
• Baymeadows Road at I-95 SB On/Off- PM peak.
• Bowden Road at I-95 SB On - PM peak.
• Belfort Road at Southpoint Parkway- PM peak
Table 7-14 provides a summary of the CORSIM MOEs for the ramp terminal intersections at the study area intersections during AM and PM peak hours for Interim Build Alternative.

7.0 EVALUATION OF ALTERNATIVES I-95/ J. Turner Butler Blvd IMR
7-30
Table 7-14 Design Year 2035 Interim Build Alternative Arterial MOEs (Control Delay)
1. Control Delay is in terms of seconds/vehicle
2. Intersection delay greater than the threshold value of 55 sec/veh, which is considered undesirable
L T R D L T R D
WB 60 - 17 - 43 58 - 41 - 52
NB - 28 21 - 25 39 - 55 1 - 37 41
SB 144 11 - - 57 70 22 - - 33
WB 58 18 12 - 33 57 25 19 - 32
EB 101 51 50 - 52 53 99 42 42 - 44 42
NB 70 168 70 - 76 69 92 46 - 51
SB 132 62 38 - 110 76 49 28 - 67
EB - 6 - - 6 - 12 - - 12
WB - 4 - 5 4 19 - 4 - 5 4 15
SB 98 - 80 - 88 46 - 53 - 50
EB - 12 - 13 12 - 10 - 9 10
NB 40 43 - - 42 17 35 36 - - 36 17
EB 63 55 44 - 54 65 61 39 - 59
SB 0 3 - - 2 28 0 5 - - 2 54
NB - 55 2 58 45 - 136 9 148 98
NB 0 2 - - 1 0 4 - - 2
WB 40 44 - - 42 45 66 78 - - 73 28
SB - 102 - 92 98 - 38 - 47 45
NB 8 6 6 - 7 18 4 3 - 9
EB 6 13 7 - 12 13 11 20 19 - 20 21
WB 36 39 15 - 34 42 39 16 - 40
SB 47 47 2 - 16 47 44 18 - 21
SB 64 43 26 - 42 67 34 15 - 35
NB 58 28 2 - 41 40 49 72 3 - 55 602
EB 48 45 18 - 26 128 130 91 - 100
WB 55 43 43 - 53 70 65 65 - 69
SB 107 13 - - 17 33 25 - - 26
EB - 35 2 - 31 28 - 52 25 174 78 572
EB 54 - 33 - 42 57 - 10 - 42
WB 127 19 - - 35 16 2 - - 6
NB - 76 129 37 92 622- 65 5 48 42 25
WB 48 - 19 - 42 66 - 61 - 64
EB 40 2 - - 17 37 1 - - 15
EB - 15 18 - 16 17 - 51 211 - 138 762
WB - 14 - - 14 - 21 - - 21
NB - 60 - - 60 30 - 52 - - 52 28
SB 18 - 9 - 13 17 - 11 - 14
PM Peak Control Delay1
Total Delay by Movement
AM Peak Control Delay1
Baymeadows Road @ I-95 NB
off ramps
Total Delay by Movement
JTB @ SB I-95 Off ramp
EB JTB @ I-95 NB off ramp
Intersection Approach Intersection
JTB @ Philips Highway
JTB @ Bonneval Rd
Intersection Approach Approach
Location
EB JTB @ Belfort Road
WB JTB @ Belfort Road
Bowden Road @ I-95 SB on
ramps
Bowden Road @ I-95 NB off
ramps
Belfort Road @ A C Skinner
Pkwy
Belfort Road @ Southpoint Dr
Baymeadows Road @ I-95 SB
off ramps
7.0 EVALUATION OF ALTERNATIVES I-95/ J. Turner Butler Blvd IMR
7-31
I-95 Ultimate Build Freeway Operational Performance
The Ultimate Build Alternative is very similar to the Interim Build Alternative with only two design modifications that will impact traffic operations. In the eastbound direction, the third through lane is carried to the JTB eastbound to I-95 northbound loop ramp. This lane bypasses the signal at the I-95 southbound off ramp terminal intersection. Relocation of the exit gore point of JTB westbound to I-95 southbound further upstream along JTB to provide increased merge distance for travelers on JTB westbound to access the loop ramp. The CORSIM analysis results of the Ultimate Build Alternative are very similar to the Interim Build Alternative. Therefore as was observed in case of the Interim Build Alternative, the Ultimate Build Alternative also provides better operating conditions compared to the No-Build. The CORSIM model results for Ultimate Build Alternative, presented in Tables 7-15 and 7-16, indicate that operational conditions along the I-95 mainline in Design Year 2035 are same or better compared to the No-Build conditions with one exception. In the northbound direction between JTB and Bowden Road, speeds decrease and densities increase when comparing the Build alternative to the No-Build alternative. This is primarily due to the fact that the Build alternative is able to process more traffic through the system as compared to the No-Build. However, it should be noted that congestion at this location completely dissipates prior to the end of simulation unlike the No-Build that has congestion at the end of the 5th hour. The CORSIM model shows that the lack of capacity and congested conditions along JTB westbound under the No-Build Alternative prevents traffic from reaching the I-95 northbound mainline. In the Ultimate Build Alternative, additional traffic is able to be processed on JTB westbound, similar to the Interim Build, thus degrading I-95 northbound. Additional capacity is needed on I-95 to effectively process all the traffic demand. A planning level study is underway to evaluate additional capacity projects on I-95 from International Golf Parkway to the Overland Bridge. Due to the proposed improvements from this study, the planning study will need to incorporate these improvements and make recommendations on how to process the additional demand on I-95 NB that the Build Alternative delivers. The number of on ramp lanes merging with I-95 remain the same in both the No-Build and Ultimate Build alternatives, i.e. 2 lanes. The traffic and LOS from HCS on the I-95 mainline between JTB and Bowden Road also remains the same under No-Build and Build conditions. This indicates that if the entire traffic demand was able to get to the mainline in No-Build and Build conditions during the peak hour, then the LOS would remain the same as per HCS. The Ultimate Build AM and PM Peak Heat Diagrams illustrate the locations and duration of congestion within the study area. This is done by illustrating the speed distribution with the lowest speeds shown in red corresponding to the areas of highest congestion. Similar to the Interim Build, the Ultimate Build AM peak heat diagram illustrates congestion in the northbound direction from south of Baymeadows Road to the JTB westbound entrance. No significant congestion is observed in the southbound direction during the AM Peak. The PM peak Ultimate Build heat diagram is also similar to the Interim Build alternative and illustrates congestion in the northbound direction from the JTB exit to Bowden Road; in the

7.0 EVALUATION OF ALTERNATIVES I-95/ J. Turner Butler Blvd IMR
7-32
southbound direction, congestion occurs from north of Bowden Road to south of the JTB entrance. Similar to the Interim Build, the congestion in the Ultimate Build clears during the peak hour. The Ultimate Build AM and PM peak hour freeway operations for I-95 area are illustrated graphically in Section 7. Similar to the Interim Build, recurring congestion is found in the northbound direction downstream of the JTB westbound entrance during the AM and PM peak which also occurs in the No-Build. The high densities found immediately downstream of the entrance ramp (highlighted in Tables 7-15 and 7-16) indicate recurring congestion during AM and PM peak. This operational deficiency is associated with the high volume entrance ramp, heavy mainline volume and close proximity of JTB and Bowden Road interchanges. Congestion from this area extends to I-95 northbound flyover entrance from JTB and affects westbound JTB operations. Similar to the Interim Build, recurring congestion is also found between Baymeadows Road entrance and JTB exit during the AM peak.

To From
Facility Section Type tp1 tp2 tp3 tp4 tp5 tp6 tp7 tp8 tp9 tp10 tp11 tp12 tp13 tp14 tp15 tp16 tp17 tp18 tp19 Total
I-95 Northbound Begins BFS 1,063 1,474 1,642 1,657 1,568 1,390 1,393 1,489 1,479 1,380 1,510 1,445 1,380 1,360 1,351 1,167 768 766 771 25,053
BFS 1,063 1,466 1,640 1,652 1,506 1,391 1,405 1,492 1,481 1,383 1,510 1,428 1,378 1,360 1,356 1,233 780 766 770 25,060
Baymeadows Road Exit Diverge 1,064 1,454 1,640 1,648 1,441 1,395 1,415 1,498 1,488 1,372 1,511 1,423 1,370 1,365 1,350 1,304 792 768 768 25,066
Baymeadows Road Exit BFS Baymeadows Road 828 1,114 1,353 1,321 1,165 1,170 1,183 1,179 1,184 1,114 1,137 1,233 1,173 1,160 1,150 1,173 712 655 647 20,651
Baymeadows Road Entrance BFS 828 1,110 1,349 1,270 1,165 1,168 1,181 1,178 1,184 1,135 1,118 1,236 1,168 1,160 1,155 1,179 768 654 648 20,654
Baymeadows Road Entrance Merge 1,138 1,391 1,686 1,541 1,453 1,460 1,477 1,480 1,481 1,429 1,402 1,575 1,457 1,451 1,447 1,462 1,042 819 815 26,006
BFS 1,137 1,383 1,656 1,492 1,456 1,458 1,481 1,474 1,482 1,425 1,415 1,569 1,456 1,451 1,446 1,467 1,130 817 818 26,013
BFS 1,138 1,372 1,620 1,479 1,458 1,454 1,487 1,470 1,479 1,420 1,438 1,553 1,452 1,450 1,451 1,466 1,197 812 819 26,015
BFS 1,138 1,362 1,597 1,456 1,464 1,451 1,493 1,469 1,475 1,413 1,461 1,534 1,457 1,444 1,457 1,467 1,256 811 819 26,024
BFS 1,134 1,350 1,564 1,457 1,466 1,457 1,489 1,476 1,482 1,415 1,465 1,509 1,458 1,447 1,453 1,468 1,300 821 817 26,028
SR 202/JT Butler Blvd Exit Diverge 1,132 1,343 1,519 1,462 1,467 1,457 1,494 1,480 1,500 1,425 1,456 1,482 1,455 1,444 1,460 1,465 1,340 833 819 26,033
SR 202/JT Butler Blvd Exit
SR 202/JT Butler Blvd EB
Entrance BFS SR 202/JT Butler Blvd 793 929 1,069 1,135 1,146 1,105 1,073 1,025 993 882 885 1,044 1,138 1,147 1,152 1,156 1,097 672 642 19,083
I-95/JTB IMR Ultimate Build Alternative- HEAT Diagram- AM Peak
Description
I-9
5 N
ort
hb
ou
nd
Ma
inlin
e
LocationSimulated Volume
Northbound/Westbound
Southbound/Eastbound
SR 202/JT Butler Blvd Exit Entrance BFS SR 202/JT Butler Blvd 793 929 1,069 1,135 1,146 1,105 1,073 1,025 993 882 885 1,044 1,138 1,147 1,152 1,156 1,097 672 642 19,083SR 202/JT Butler Blvd EB
Entrance Merge 908 1,041 1,201 1,261 1,260 1,232 1,191 1,183 1,118 1,013 1,014 1,179 1,274 1,292 1,292 1,257 1,216 782 730 21,444SR 202/JT Butler Blvd WB
Entrance BFS 908 1,039 1,193 1,257 1,263 1,234 1,191 1,185 1,117 1,017 1,008 1,178 1,274 1,292 1,294 1,258 1,224 786 731 21,449SR 202/JT Butler Blvd WB
Entrance Merge 1,399 1,524 1,745 1,796 1,797 1,760 1,758 1,762 1,765 1,759 1,731 1,759 1,774 1,742 1,630 1,535 1,489 1,038 971 30,734
BFS 1,404 1,519 1,735 1,797 1,797 1,742 1,748 1,783 1,763 1,759 1,726 1,764 1,781 1,739 1,641 1,540 1,496 1,047 967 30,748
Bowden Road Exit Diverge Bowden Road 1,409 1,510 1,734 1,795 1,791 1,727 1,744 1,796 1,765 1,755 1,724 1,772 1,772 1,750 1,648 1,543 1,503 1,054 968 30,760
Bowden Road Exit BFS 1,037 1,090 1,320 1,418 1,440 1,418 1,419 1,429 1,313 1,297 1,243 1,311 1,406 1,407 1,253 1,147 1,116 815 730 23,609
BFS 1,035 1,087 1,310 1,418 1,434 1,417 1,423 1,429 1,323 1,296 1,246 1,303 1,407 1,406 1,260 1,148 1,120 822 729 23,613
BFS 1,035 1,084 1,305 1,411 1,437 1,419 1,421 1,429 1,329 1,299 1,244 1,301 1,399 1,412 1,266 1,148 1,124 828 726 23,617
BFS 1,039 1,080 1,300 1,410 1,439 1,419 1,421 1,430 1,330 1,300 1,244 1,297 1,396 1,417 1,267 1,149 1,125 830 727 23,620
BFS 1,037 1,081 1,296 1,409 1,441 1,418 1,422 1,429 1,331 1,302 1,244 1,295 1,394 1,418 1,270 1,153 1,127 829 727 23,623I-95 Northbound Ends BFS 1,037 1,081 1,292 1,408 1,441 1,418 1,421 1,430 1,332 1,302 1,244 1,295 1,393 1,418 1,273 1,152 1,130 830 730 23,627
I-95 Southbound Begins BFS 764 1,107 1,246 1,212 1,308 1,533 1,589 1,332 1,516 1,415 1,470 1,112 1,076 1,042 842 673 666 672 668 21,243
BFS 765 1,103 1,245 1,212 1,306 1,530 1,589 1,337 1,512 1,419 1,466 1,118 1,074 1,043 844 675 666 671 668 21,243
BFS 765 1,101 1,242 1,211 1,306 1,526 1,587 1,345 1,507 1,420 1,466 1,126 1,073 1,044 848 676 667 671 669 21,250
BFS 762 1,099 1,239 1,211 1,304 1,522 1,586 1,351 1,502 1,424 1,462 1,133 1,071 1,044 851 680 668 669 672 21,250
BFS Bowden Road 763 1,090 1,236 1,213 1,300 1,520 1,585 1,355 1,500 1,424 1,464 1,138 1,071 1,045 855 683 668 668 673 21,251
Bowden Road Entrance BFS 765 1,085 1,232 1,217 1,297 1,516 1,583 1,355 1,500 1,426 1,465 1,142 1,073 1,047 855 688 668 670 672 21,256
Bowden Road Entrance Merge 1,051 1,362 1,526 1,557 1,650 1,863 1,921 1,716 1,810 1,727 1,748 1,415 1,344 1,313 1,084 864 843 841 836 26,471
BFS 1,051 1,354 1,527 1,554 1,651 1,859 1,925 1,717 1,808 1,727 1,750 1,417 1,345 1,317 1,080 869 844 841 835 26,471
SR 202/JT Butler Blvd Exit Diverge 1,052 1,344 1,534 1,547 1,652 1,853 1,925 1,726 1,801 1,731 1,750 1,425 1,344 1,319 1,081 874 842 843 832 26,475
SR 202/JT Butler Blvd Exit BFS 504 671 890 813 964 1,116 1,274 1,091 1,128 1,075 1,107 931 850 804 656 532 513 517 501 15,937
BFS SR 202/JT Butler Blvd 506 669 888 813 964 1,112 1,271 1,095 1,124 1,081 1,103 935 851 805 657 533 511 517 502 15,937
BFS 506 667 883 815 962 1,111 1,270 1,098 1,124 1,081 1,104 938 851 808 657 535 510 517 502 15,939SR 202/JT Butler Blvd WB and
I-9
5 N
ort
hb
ou
nd
Ma
inlin
eI-
95
So
uth
bo
un
d M
ain
lin
e
SR 202/JT Butler Blvd WB and
EB Entrance BFS 504 663 878 818 958 1,109 1,269 1,102 1,122 1,080 1,102 945 850 811 659 539 509 516 504 15,938SR 202/JT Butler Blvd WB and
EB Entrance Merge 675 817 1,042 1,030 1,180 1,365 1,481 1,341 1,418 1,394 1,403 1,178 1,049 1,030 861 702 653 658 645 19,922
BFS 674 815 1,038 1,034 1,177 1,356 1,470 1,354 1,411 1,395 1,401 1,190 1,051 1,030 864 703 654 657 647 19,921
BFS 672 812 1,031 1,038 1,176 1,348 1,465 1,362 1,407 1,396 1,402 1,196 1,053 1,029 869 708 652 658 647 19,921
BFS 671 810 1,021 1,043 1,169 1,351 1,460 1,365 1,405 1,396 1,401 1,208 1,051 1,031 872 713 650 659 648 19,924
BFS 674 807 1,013 1,049 1,162 1,351 1,454 1,370 1,406 1,395 1,400 1,212 1,051 1,032 875 716 652 656 650 19,925
Baymeadows Road Exit Diverge 675 802 1,013 1,043 1,162 1,347 1,454 1,375 1,401 1,398 1,399 1,216 1,055 1,032 879 715 658 654 650 19,928
Baymeadows Road Exit BFS Baymeadows Road 505 545 756 716 786 875 1,023 930 925 958 1,054 948 802 772 655 541 491 491 485 14,258
Baymeadows Road Entrance BFS 504 544 750 723 782 871 1,021 934 925 955 1,054 948 806 772 657 544 491 491 486 14,258
Baymeadows Road Entrance Merge 547 604 807 826 875 966 1,088 1,023 985 1,010 1,147 1,017 887 871 746 614 550 549 547 15,659
BFS 545 602 806 828 871 956 1,092 1,030 982 1,009 1,145 1,021 884 868 753 615 552 549 546 15,654I-95 Southbound Ends BFS 545 599 801 832 869 956 1,086 1,034 984 1,008 1,136 1,033 881 868 758 617 553 549 544 15,653
SR 202/JT Butler Blvd
Eastbound Begins/From I-95 SB
Flyover BFS 337 405 409 465 462 512 464 444 469 445 421 333 333 338 291 226 221 212 220 7,007
BFS SR 202/JTB EB Arterial 337 405 408 467 462 511 465 445 470 445 421 333 332 340 290 228 220 212 220 7,011I-95 Northbound/SR 202/ JTB
Arterial Entrance Entrance BFS 336 405 408 466 462 510 466 444 470 445 421 335 332 339 291 228 220 212 220 7,010I-95 Northbound/SR 202/ JTB
Arterial Entrance Entrance Merge Belfort Road 532 695 688 808 894 920 955 1,037 1,124 1,137 1,067 778 753 767 695 552 521 466 465 14,854
Belfort Road Entrance BFS 533 690 691 804 888 924 952 1,035 1,120 1,138 1,074 778 752 772 696 555 524 459 473 14,858
Belfort Road Entrance Merge 597 750 772 910 1,007 1,052 1,081 1,173 1,242 1,284 1,213 884 872 866 783 623 580 520 541 16,750
BFS 593 748 766 915 1,005 1,049 1,081 1,161 1,247 1,287 1,208 894 878 862 785 630 579 517 540 16,745SR 202/JT Butler Blvd
Eastbound Ends BFS 597 744 766 909 1,001 1,053 1,081 1,154 1,248 1,286 1,212 900 875 864 789 630 582 518 539 16,748SR 202/JT Butler Blvd
Westbound Begins BFS 814 875 1,029 1,243 1,446 1,053 1,024 1,178 1,450 1,490 1,450 702 854 717 596 450 440 440 441 17,692
I-9
5 S
ou
thb
ou
nd
Ma
inlin
eS
R 2
02
/JT
B E
B M
ain
lin
eS
R 2
02
/JT
B W
B
Westbound Begins BFS 814 875 1,029 1,243 1,446 1,053 1,024 1,178 1,450 1,490 1,450 702 854 717 596 450 440 440 441 17,692
BFS Belfort Road 814 874 1,028 1,239 1,435 1,016 1,015 1,198 1,460 1,495 1,466 709 853 721 597 458 440 443 440 17,701
Belfort Road Exit Diverge 812 873 1,026 1,233 1,395 996 1,014 1,206 1,486 1,501 1,480 717 850 726 599 468 440 443 439 17,704
Belfort Road Exit BFS SR 202/JTB WB Arterial 624 593 789 868 781 575 673 866 912 980 1,012 446 603 497 414 338 301 301 298 11,871I-95 Northbound Exit Diverge 625 592 788 867 747 576 676 864 915 979 1,021 466 603 497 413 342 303 301 297 11,872
I-95 Northbound Exit
SR 202/JT Butler Blvd
Westbound Ends BFS 236 203 309 259 268 198 256 426 390 386 399 104 264 197 157 127 115 116 108 4,518
Speed (mph)
>70
60-70
50-60
45-50
35-45
<35
SR
20
2/J
TB
WB
Ma
inlin
e
Legend
Ultimate Build 2035 AM Peak HEAT Diagram
Page 1 of 1

To From
Facility Section Type tp1 tp2 tp3 tp4 tp5 tp6 tp7 tp8 tp9 tp10 tp11 tp12 tp13 tp14 tp15 tp16 tp17 tp18 tp19 Total
I-95 Northbound Begins BFS 1,076 1,070 1,070 1,083 1,001 1,095 1,251 1,084 1,047 907 983 908 717 577 519 463 468 465 462 16,246
BFS 1,078 1,070 1,070 1,083 1,000 1,092 1,250 1,087 1,046 911 984 908 721 578 520 464 468 462 465 16,257
Baymeadows Road Exit Diverge 1,077 1,068 1,069 1,084 1,001 1,091 1,247 1,085 1,049 917 982 908 725 582 520 465 472 462 463 16,267
Baymeadows Road Exit BFS Baymeadows Road 988 930 940 969 868 939 1,094 975 944 837 899 837 669 539 479 430 430 427 428 14,622
Baymeadows Road Entrance BFS 990 930 941 968 869 940 1,089 978 944 838 897 839 670 542 478 432 428 427 428 14,628
Baymeadows Road Entrance Merge 1,410 1,340 1,341 1,377 1,323 1,373 1,508 1,391 1,366 1,258 1,246 1,102 888 697 627 568 545 557 556 20,473
BFS 1,415 1,334 1,344 1,382 1,318 1,373 1,503 1,394 1,377 1,251 1,243 1,112 892 697 634 569 544 556 556 20,494
BFS 1,416 1,335 1,344 1,374 1,324 1,380 1,490 1,399 1,384 1,242 1,248 1,116 895 704 636 566 548 554 553 20,508
BFS 1,416 1,338 1,348 1,351 1,343 1,380 1,484 1,407 1,385 1,239 1,258 1,117 892 713 635 563 557 551 551 20,528
BFS 1,406 1,342 1,344 1,340 1,362 1,378 1,467 1,431 1,375 1,241 1,265 1,118 890 720 637 563 559 549 553 20,540
SR 202/JT Butler Blvd Exit Diverge 1,373 1,343 1,350 1,345 1,372 1,383 1,434 1,450 1,385 1,255 1,264 1,121 893 723 635 567 559 545 558 20,555
SR 202/JT Butler Blvd Exit
SR 202/JT Butler Blvd EB
Entrance BFS SR 202/JT Butler Blvd 1,150 1,165 1,120 1,116 1,149 1,095 1,129 1,173 1,133 1,063 1,050 944 773 614 527 485 470 464 473 17,093
I-95/JTB IMR Ultimate Build Alternative- HEAT Diagram- PM Peak
Description
I-9
5 N
ort
hb
ou
nd
Ma
inlin
e
LocationSimulated Volume
Northbound/Westbound
Southbound/Eastbound
SR 202/JT Butler Blvd Exit Entrance BFS SR 202/JT Butler Blvd 1,150 1,165 1,120 1,116 1,149 1,095 1,129 1,173 1,133 1,063 1,050 944 773 614 527 485 470 464 473 17,093SR 202/JT Butler Blvd EB
Entrance Merge 1,318 1,293 1,263 1,266 1,265 1,197 1,233 1,277 1,268 1,206 1,135 1,028 839 660 571 526 507 504 511 18,867SR 202/JT Butler Blvd WB
Entrance BFS 1,316 1,294 1,262 1,266 1,268 1,197 1,231 1,278 1,266 1,211 1,138 1,036 838 662 572 525 508 506 510 18,884SR 202/JT Butler Blvd WB
Entrance Merge 1,760 1,752 1,728 1,754 1,789 1,789 1,784 1,788 1,770 1,758 1,716 1,414 1,099 872 747 686 658 668 664 26,196
BFS 1,739 1,739 1,718 1,790 1,795 1,788 1,782 1,789 1,744 1,774 1,719 1,442 1,106 871 757 686 655 672 663 26,229
Bowden Road Exit Diverge Bowden Road 1,721 1,736 1,722 1,797 1,803 1,790 1,779 1,780 1,737 1,774 1,719 1,471 1,120 873 759 686 658 669 659 26,253
Bowden Road Exit BFS 1,438 1,450 1,435 1,444 1,422 1,410 1,423 1,434 1,432 1,434 1,423 1,234 910 712 617 554 536 545 534 21,387
BFS 1,437 1,446 1,438 1,440 1,422 1,412 1,419 1,435 1,433 1,439 1,426 1,247 909 719 621 555 535 546 534 21,413
BFS 1,440 1,443 1,437 1,440 1,422 1,416 1,415 1,438 1,431 1,441 1,419 1,265 917 722 617 560 536 542 537 21,438
BFS 1,440 1,443 1,436 1,441 1,422 1,417 1,414 1,438 1,430 1,442 1,416 1,272 920 724 614 562 537 542 537 21,447
BFS 1,439 1,444 1,436 1,440 1,422 1,418 1,413 1,440 1,430 1,440 1,417 1,275 927 726 611 566 537 544 536 21,461I-95 Northbound Ends BFS 1,439 1,441 1,438 1,440 1,421 1,417 1,412 1,441 1,431 1,438 1,417 1,278 934 724 615 567 536 541 537 21,467
I-95 Southbound Begins BFS 1,490 1,307 1,508 1,554 1,651 1,588 1,630 1,654 1,663 1,664 1,665 1,670 1,663 1,660 1,662 1,668 1,638 1,099 936 29,370
BFS 1,444 1,306 1,522 1,566 1,653 1,582 1,641 1,663 1,668 1,666 1,664 1,671 1,663 1,661 1,660 1,668 1,642 1,104 936 29,380
BFS 1,377 1,316 1,527 1,588 1,652 1,578 1,647 1,682 1,677 1,667 1,663 1,670 1,665 1,660 1,661 1,667 1,648 1,110 939 29,394
BFS 1,339 1,323 1,530 1,603 1,646 1,580 1,652 1,697 1,689 1,670 1,661 1,670 1,664 1,662 1,660 1,666 1,651 1,118 940 29,421
BFS Bowden Road 1,327 1,328 1,542 1,624 1,631 1,587 1,651 1,727 1,698 1,674 1,663 1,670 1,664 1,662 1,660 1,668 1,653 1,128 941 29,498
Bowden Road Entrance BFS 1,322 1,346 1,548 1,632 1,620 1,601 1,650 1,747 1,707 1,692 1,662 1,672 1,662 1,662 1,660 1,666 1,657 1,137 941 29,584
Bowden Road Entrance Merge 1,696 1,758 1,971 2,033 2,022 2,020 2,052 2,146 2,092 2,063 2,030 1,975 1,889 1,856 1,844 1,833 1,816 1,310 1,108 35,514
BFS 1,700 1,759 1,967 2,033 2,023 2,023 2,048 2,145 2,101 2,062 2,026 1,984 1,895 1,857 1,843 1,829 1,820 1,317 1,108 35,540
SR 202/JT Butler Blvd Exit Diverge 1,697 1,751 1,968 2,035 2,025 2,016 2,051 2,129 2,101 2,047 2,025 2,002 1,917 1,858 1,845 1,830 1,818 1,328 1,104 35,547
SR 202/JT Butler Blvd Exit BFS 920 986 1,179 1,256 1,238 1,245 1,297 1,318 1,313 1,319 1,311 1,358 1,302 1,209 1,184 1,162 1,155 875 735 22,362
BFS SR 202/JT Butler Blvd 918 986 1,178 1,252 1,234 1,237 1,288 1,313 1,303 1,312 1,311 1,377 1,325 1,213 1,184 1,163 1,154 878 737 22,363
BFS 920 984 1,177 1,236 1,229 1,231 1,282 1,305 1,298 1,306 1,311 1,394 1,349 1,219 1,187 1,163 1,154 886 735 22,366SR 202/JT Butler Blvd WB and
I-9
5 N
ort
hb
ou
nd
Ma
inlin
eI-
95
So
uth
bo
un
d M
ain
lin
e
SR 202/JT Butler Blvd WB and
EB Entrance BFS 922 977 1,173 1,212 1,222 1,230 1,274 1,290 1,294 1,302 1,312 1,418 1,372 1,242 1,183 1,166 1,154 893 737 22,373SR 202/JT Butler Blvd WB and
EB Entrance Merge 1,354 1,391 1,644 1,673 1,700 1,701 1,705 1,704 1,701 1,704 1,697 1,694 1,598 1,390 1,300 1,276 1,259 1,007 835 28,333
BFS 1,351 1,375 1,629 1,670 1,702 1,699 1,707 1,701 1,701 1,704 1,696 1,695 1,618 1,411 1,302 1,275 1,258 1,017 836 28,347
BFS 1,349 1,373 1,623 1,670 1,699 1,700 1,707 1,702 1,701 1,704 1,696 1,693 1,623 1,418 1,305 1,276 1,257 1,024 836 28,356
BFS 1,350 1,370 1,620 1,669 1,701 1,700 1,704 1,705 1,700 1,706 1,696 1,693 1,628 1,422 1,307 1,274 1,256 1,033 834 28,368
BFS 1,350 1,367 1,617 1,668 1,701 1,699 1,706 1,700 1,705 1,704 1,697 1,693 1,630 1,426 1,305 1,278 1,255 1,038 835 28,374
Baymeadows Road Exit Diverge 1,350 1,360 1,614 1,666 1,704 1,697 1,709 1,698 1,705 1,706 1,696 1,697 1,628 1,430 1,306 1,278 1,257 1,047 837 28,385
Baymeadows Road Exit BFS Baymeadows Road 1,137 1,113 1,340 1,386 1,405 1,376 1,361 1,358 1,396 1,450 1,466 1,468 1,389 1,229 1,118 1,084 1,076 902 715 23,769
Baymeadows Road Entrance BFS 1,137 1,109 1,339 1,381 1,409 1,377 1,358 1,362 1,394 1,450 1,464 1,467 1,397 1,227 1,124 1,080 1,078 905 714 23,772
Baymeadows Road Entrance Merge 1,443 1,362 1,614 1,639 1,727 1,653 1,647 1,607 1,616 1,653 1,643 1,627 1,525 1,338 1,204 1,161 1,158 995 795 27,407
BFS 1,446 1,361 1,613 1,636 1,729 1,656 1,642 1,604 1,622 1,653 1,643 1,620 1,536 1,339 1,205 1,164 1,156 1,000 796 27,421I-95 Southbound Ends BFS 1,440 1,366 1,606 1,641 1,724 1,660 1,642 1,607 1,614 1,660 1,638 1,627 1,537 1,340 1,207 1,163 1,158 1,006 796 27,432
SR 202/JT Butler Blvd
Eastbound Begins/From I-95 SB
Flyover BFS 507 506 556 556 542 568 555 572 520 513 488 416 415 409 402 416 420 296 232 8,889
BFS SR 202/JTB EB Arterial 508 506 554 556 542 569 553 574 520 514 488 416 416 409 402 416 419 299 232 8,893I-95 Northbound/SR 202/ JTB
Arterial Entrance Entrance BFS 508 506 553 557 543 569 553 573 520 514 488 417 415 410 402 416 417 300 232 8,893I-95 Northbound/SR 202/ JTB
Arterial Entrance Entrance Merge Belfort Road 843 917 1,041 1,010 1,047 1,098 862 940 936 887 864 714 654 631 602 569 562 442 368 14,987
Belfort Road Entrance BFS 839 912 1,040 1,004 1,059 1,092 862 946 934 883 867 718 654 631 605 569 560 444 372 14,991
Belfort Road Entrance Merge 1,142 1,234 1,391 1,368 1,484 1,494 1,217 1,280 1,250 1,165 1,106 927 844 733 701 659 639 528 459 19,621
BFS 1,150 1,230 1,386 1,367 1,484 1,496 1,225 1,272 1,255 1,173 1,100 934 848 736 696 658 643 531 454 19,638SR 202/JT Butler Blvd
Eastbound Ends BFS 1,152 1,224 1,387 1,368 1,478 1,494 1,237 1,263 1,259 1,172 1,108 937 845 745 697 654 644 538 452 19,654SR 202/JT Butler Blvd
Westbound Begins BFS 956 1,003 1,024 1,181 1,030 1,192 1,218 1,139 1,029 906 823 624 491 393 355 317 320 317 318 14,636
I-9
5 S
ou
thb
ou
nd
Ma
inlin
eS
R 2
02
/JT
B E
B M
ain
lin
eS
R 2
02
/JT
B W
B
Westbound Begins BFS 956 1,003 1,024 1,181 1,030 1,192 1,218 1,139 1,029 906 823 624 491 393 355 317 320 317 318 14,636
BFS Belfort Road 956 1,005 1,024 1,179 1,030 1,190 1,214 1,139 1,030 906 829 627 494 395 355 318 319 315 318 14,643
Belfort Road Exit Diverge 952 1,005 1,022 1,178 1,032 1,185 1,210 1,140 1,031 906 838 630 495 400 354 319 319 316 317 14,649
Belfort Road Exit BFS SR 202/JTB WB Arterial 793 869 890 978 832 874 942 870 854 783 743 540 422 341 299 272 271 266 266 12,105I-95 Northbound Exit Diverge 791 868 891 976 833 868 941 873 854 785 748 542 422 342 299 273 269 267 266 12,108
I-95 Northbound Exit
SR 202/JT Butler Blvd
Westbound Ends BFS 438 486 451 510 370 435 490 464 457 404 420 301 234 186 164 146 147 143 143 6,389
Speed (mph)
>70
60-70
50-60
45-50
35-45
<35
SR
20
2/J
TB
WB
Ma
inlin
e
Legend
Ultimate Build 2035 PM Peak HEAT Diagram
Page 1 of 1

7.0 EVALUATION OF ALTERNATIVES I-95/ J. Turner Butler Blvd IMR
7-35
This operational deficiency is associated with the high mainline volume of 7,640 vph in the three lane section of I-95 with maximum capacity of 6,750 vph. Congestion from this area extends to Baymeadows Road interchange and to the beginning of the study network and affects Baymeadows Road interchange operations. In the southbound direction, congestion is found upstream of the I-95 southbound off-ramp to JTB during the PM peak. The high densities found immediately upstream of the exit ramp (highlighted in Table 7-11) indicate recurring congestion associated with the high exiting ramp volume of 3,270 vph during the PM peak. Complex maneuvers and lane changes occurring in this segment due to the downstream exit ramp result in reduced headway and higher freeway segment densities. Congestion is also observed from the JTB exit to Baymeadows Road exit in the southbound direction during the PM peak, this is due to the high entry volume on the JTB combined entrance ramp of 2,110 vph which merges onto an already congested freeway mainline to produce a downstream volume of 7,640 vph in the three lane section of I-95 which exceeds maximum capacity of 6,750 vph. The congested conditions discussed above exist in the No-Build and Interim Build as well and are not due to the proposed modifications at the I-95/JTB interchange. Higher densities exhibited in the Ultimate Build alternative that are not apparent in the No-Build are primarily due to elimination of upstream bottlenecks under the Build alternative. Bottlenecks in the No-Build alternative essentially meter the traffic to the remainder of the system making capacity constraints downstream less apparent. The proposed modifications in fact make conditions better and the Build Alternative is able to process more traffic. In addition all the queues are able to dissipate in the Build conditions. No congestion was observed on the I-95 southbound flyover exit to JTB eastbound. The Build alternative results in significant improvements at the I-95 southbound off ramp terminal intersection due to the flyover ramp. This results in increased speeds and lower densities along the mainline as well as reduced delay times at the intersection. In the case of the Ultimate Build Alternative, congestion from all of the locations mentioned above dissipates before the end of the five hour simulation period illustrated in lane schematics. This is an improvement over the No-Build condition in which there are vehicle queues present at the end of the simulation period. No unmet demand was observed for the Ultimate Build condition at the end of the simulation.
A comparison of I-95 freeway operational performance under the Interim Build condition with the No-Build performance presented in Section 5 shows that I-95 has higher speeds and lower densities under the Build condition. The operations on I-95 and the I-95/JTB interchange area are significantly better than the operations observed under the No-Build condition.

321
Distance (ft) 1401 1357 1370 1325 1325 1845 1165 1505 1503 1260 1749 1324 890 797 1891 1186 921 1596 1502 1432 1072 1274 943 906
Speed (mph) 62 67 66 67 66 63 64 65 63 50 60 60 61 61 61 57 55 58 60 60 61 61 62 62
Density (veh/ln/mi) 20 14 13 17 17 20 26 26 26 29 19 23 23 23 23 25 32 30 31 31 31 30 30 30
323 322336 335 324334 333 332 331 330 325345 326329 328 327343 342 341 340 339 338344 337
Baymeadows SR 202/ SR 202/
Road Baymeadows JT Butler Blvd JT Butler Blvd
Entrance Road EB/WB Entrance Exit Bowden Road
374 vph Exit 1160 vph 2670 vph Entrance
630 ft 1830 vph 650 ft 1100 ft 1440 vph2600 ft 10 1770 ft 2350 ft 10
9 9 9 9 9 9 9 9
1 1 1 1 1 1 1 1 1 1 1 1 1 1 1 1 1 1 1 1 1 1 1
2 2 2 2 2 2 2 2 2 2 2 2 2 2 2 2 2 2 2 2 2 2 2
Simulated Volumes 3945 3 3949 3 3952 3 3608 3 3614 3 5338 5337 3 5345 3 5351 3 5357 3 5367 3 4438 3 4441 3 4442 3 4445 3 7156 3 7152 3 7150 3 5751 3 5760 3 5763 3 5764 3 5762 3 5762 3
Demand Volumes 4234 4234 4234 3860 3860 5690 5690 5690 5690 5690 5690 4530 4530 4530 4530 7200 7200 7200 5760 5760 5760 5760 5760 5760
Demand Volumes 7420 7420 7420 6140 6140 7640 7640 7640 7640 7640 7640 5530 6050 6050 8800 8800 8800 7040 7040 7040 7040 7040 7040
Simulated Volumes 3 5840 3 5794 3 5749 3 4697 3 4692 3 5870 3 5869 3 5869 3 5877 3 5888 3 5898 3 4349 3 4866 3 4873 3 7077 3 7070 3 7058 3 5706 3 5703 3 5706 3 5709 3 5710 3 5710
2 2 2 2 2 2 2 2 2 2 2 2 2 2 2 2 2 2 2 2 2 2 2
1 1 1 1 1 1 1 1 1 1 1 1 1 1 1 1 1 1 1 1 1 1 1
9 9 9 9 9 9 9
200 ft 360 ft 200 ft 1300 ft 10
Baymeadows Baymeadows SR 202/ SR 202/ 780 ft Bowden Road
Road road JT Butler Blvd JT Butler Blvd SR 202/ Exit
Exit Entrance Exit EB Entrance JT Butler Blvd 1760 vph
I-95 Southbound
Exit Entrance Exit EB Entrance JT Butler Blvd 1760 vph
1280 vph 1500 vph 2110 vph 520 vph WB Entrance
2750 vph
Distance (ft) 1427 1426 1427 1562 931 1625 1623 1560 1558 1331 1331 1813 1380 610 1581 1581 1560 1615 1616 1573 686 953 902
Speed (mph) 24 21 19 12 12 16 17 22 23 25 23 25 26 31 29 42 40 43 47 51 53 58 61
Density (veh/ln/mi) 93 100 101 131 132 116 116 88 83 79 81 57 47 52 53 44 45 45 41 37 35 33 31
143
511 Node Number Freeway Geometric Coloring
Density (Veh/Mi/Ln)
20 and below Density above 75
20 - 30 Density above 45
30 - 45 Density above 35
I-95 Northbound
132 133 135 136 137199 127 128 134129
LEGEND
Speed (mph)
121 122 123 124 125 126 140 141 142130 131 138 139
45 and above
900 Demand volume highlighted if simulated falls below = 90%
809 Simulated volume
I-95/ SR 202/JT Butler Boulevard Interchange Modification Report
AM Peak Hour MOE'sI-95 Lane SchematicUltimate Build 2035
Ultimate Build 2035 AM Peak Hour Lane Schematic
Page 1 of 2

321
Distance (ft) 1401 1357 1370 1325 1325 1845 1165 1505 1503 1260 1749 1324 890 797 1891 1186 921 1596 1502 1432 1072 1274 943 906
Speed (mph) 58 62 63 65 64 62 62 63 55 27 18 22 23 31 47 51 35 25 25 26 28 31 37 46
Density (veh/ln/mi) 38 27 23 28 29 27 37 36 41 73 84 77 75 61 39 33 59 84 93 92 89 83 69 54
323 322336 335 324334 333 332 331 330 325345 326329 328 327343 342 341 340 339 338344 337
Baymeadows SR 202/ SR 202/
Road Baymeadows JT Butler Blvd JT Butler Blvd
Entrance Road EB/WB Entrance Exit Bowden Road
1126 vph Exit 2110 vph 3270 vph Entrance
630 ft 1500 vph 650 ft 1760 vph2600 ft 10 1770 ft 2350 ft 10
9 9 9 1 9 9 9 9
1 1 1 1 1 1 1 2 1 1 1 1 1 1 1 1 1 1 1 1 1 1
2 2 2 2 2 2 2 3 2 2 2 2 2 2 2 2 2 2 2 2 2 2
Simulated Volumes 6633 6631 3 6634 3 5506 3 5500 3 6808 6806 3 6810 3 6808 3 6809 4 6810 3 5016 3 5047 3 5072 3 5098 3 8221 3 8239 3 8240 3 6618 3 6596 3 6575 3 6559 3 6539 3 6523 3
Demand Volumes 7266 7266 7266 6140 6140 7640 7640 7640 7640 7640 7640 5530 5530 5530 5530 8800 8800 8800 7040 7040 7040 7040 7040 7040
Demand Volumes 4431 4431 4431 3860 3860 5690 5690 5690 5690 5690 5690 4530 4950 4950 7200 7200 7200 5760 5760 5760 5760 5760 5760
Simulated Volumes 3 4431 3 4429 3 4424 3 3876 3 3876 3 5595 3 5588 3 5593 3 5614 3 5638 3 5639 3 4546 3 4972 3 4974 3 7150 3 7154 3 7152 3 5689 3 5688 3 5691 3 5691 3 5693 3 5691
2 2 2 2 2 2 2 2 2 2 2 2 2 2 2 2 2 2 2 2 2 2 2
1 1 1 1 1 1 1 1 1 1 1 1 1 1 1 1 1 1 1 1 1 1 1
9 9 9 9 9 9 9
200 ft 360 ft 200 ft 1300 ft
Baymeadows Baymeadows SR 202/ SR 202/ 780 ft Bowden Road
Road road JT Butler Blvd JT Butler Blvd SR 202/ Exit
Exit Entrance Exit EB Entrance JT Butler Blvd 1440 vph
I-95 Southbound
Exit Entrance Exit EB Entrance JT Butler Blvd 1440 vph
571 vph 1830 vph 1160 vph 420 vph WB Entrance
2250 vph
Distance (ft) 1427 1426 1427 1562 931 1625 1623 1560 1558 1331 1331 1813 1380 610 1581 1581 1560 1615 1616 1573 686 953 902
Speed (mph) 63 62 61 62 61 51 61 57 56 50 38 27 24 30 30 49 46 46 46 49 52 57 61
Density (veh/ln/mi) 24 24 23 21 21 34 31 33 35 40 53 60 53 56 53 38 40 43 43 40 37 33 31
143
511 Node Number Freeway Geometric Coloring
Density (Veh/Mi/Ln)
20 and below Density above 75
20 - 30 Density above 45
30 - 45 Density above 35
I-95 Northbound
132 133 135 136 137199 127 128 134129
LEGEND
Speed (mph)
121 122 123 124 125 126 140 141 142130 131 138 139
45 and above
900 Demand volume highlighted if simulated falls below = 90%
809 Simulated volume
I-95/ SR 202/JT Butler Boulevard Interchange Modification Report
PM Peak Hour MOE'sI-95 Lane SchematicUltimate Build 2035
Ultimate Build 2035 PM Peak Hour Lane Schematic
Page 1 of 2

321
Distance (ft) 1401 1357 1370 1325 1325 1845 1165 1505 1503 1260 1749 1324 890 797 1891 1186 921 1596 1502 1432 1072 1274 943 906
Speed (mph) 64 68 67 68 68 66 67 68 68 65 65 63 63 63 63 60 62 62 63 63 63 63 64 64
Density (veh/ln/mi) 8 6 5 7 7 6 7 7 7 4 5 5 5 5 5 5 5 6 6 6 6 6 6 6
345 326329 328 327343 342 341 340 339 338344 337 323 322336 335 324334 333 332 331 330 325
Baymeadows SR 202/ SR 202/
Road Baymeadows JT Butler Blvd JT Butler Blvd
Entrance Road EB/WB Entrance Exit Bowden Road
260 vph Exit 556 vph 1328 vph Entrance
630 ft 652 vph 650 ft 1100 ft 716 vph2600 ft 10 1770 ft 2350 ft 10
9 9 9 9 9 9 9 9
1 1 1 1 1 1 1 1 1 1 1 1 1 1 1 1 1 1 1 1 1 1 1
2 2 2 2 2 2 2 2 2 2 2 2 2 2 2 2 2 2 2 2 2 2 2
Simulated Volumes 2263 3 2262 3 2260 3 2012 3 2008 3 2677 2674 3 2670 3 2665 3 2661 3 2658 3 2068 3 2064 3 2063 3 2063 3 3391 3 3389 3 3384 3 2698 3 2692 3 2689 3 2683 3 2680 3 2679 3
Demand Volumes 2232 2232 2232 1972 1972 2624 2624 2624 2624 2624 2624 2068 2068 2068 2068 3396 3396 3396 2680 2680 2680 2680 2680 2680
Demand Volumes 3064 3064 3064 2616 2616 3296 3296 3296 3296 3296 3296 2588 2964 2964 3904 3904 3904 2980 2980 2980 2980 2980 2980
Simulated Volumes 3 3472 3 3549 3 3632 3 3187 3 3249 3 4138 3 4232 3 4294 3 4353 3 4406 3 4457 3 3567 3 3985 3 3999 3 5033 3 5050 3 5068 3 3808 3 3819 3 3826 3 3831 3 3836 3 3842
2 2 2 2 2 2 2 2 2 2 2 2 2 2 2 2 2 2 2 2 2 2 2
1 1 1 1 1 1 1 1 1 1 1 1 1 1 1 1 1 1 1 1 1 1 1
9 9 9 9 9 9 9
200 ft 360 ft 200 ft 1300 ft 10
Baymeadows Baymeadows SR 202/ SR 202/ 780 ft Bowden Road
Road road JT Butler Blvd JT Butler Blvd SR 202/ Exit
Exit Entrance Exit EB Entrance JT Butler Blvd 924 vph
I-95 Southbound
Exit Entrance Exit EB Entrance JT Butler Blvd 924 vph
448 vph 680 vph 708 vph 376 vph WB Entrance
940 vph
Distance (ft) 1427 1426 1427 1562 931 1625 1623 1560 1558 1331 1331 1813 1380 610 1581 1581 1560 1615 1616 1573 686 953 902
Speed (mph) 53 51 49 47 44 42 42 44 44 43 41 43 42 45 53 60 58 61 61 61 61 62 62
Density (veh/ln/mi) 18 22 25 33 36 35 40 34 36 37 38 29 25 28 14 15 15 15 15 16 16 16 17
143
511 Node Number Freeway Geometric Coloring
Density (Veh/Mi/Ln)
20 and below Density above 75
20 - 30 Density above 45
30 - 45 Density above 35
121 122 123 124 125 126 140 141 142130 131 138 139
I-95 Northbound
132 133 135 136 137199 127 128 134129
LEGEND
Speed (mph)
45 and above
900 Demand volume highlighted if simulated falls below = 90%
809 Simulated volume
I-95/ SR 202/JT Butler Boulevard Interchange Modification Report
AM 5th Hour MOE'sI-95 Lane SchematicUltimate Build 2035
Ultimate Build 2035 AM 5th Hour Lane Schematic
Page 1 of 2

321
Distance (ft) 1401 1357 1370 1325 1325 1845 1165 1505 1503 1260 1749 1324 890 797 1891 1186 921 1596 1502 1432 1072 1274 943 906
Speed (mph) 62 66 66 66 66 65 66 66 65 60 62 60 61 61 61 58 59 60 60 61 61 61 62 63
Density (veh/ln/mi) 16 11 10 15 15 13 17 17 16 9 5 14 13 14 14 16 18 16 22 21 21 21 21 22
345 326329 328 327343 342 341 340 339 338344 337 323 322336 335 324334 333 332 331 330 325
Baymeadows SR 202/ SR 202/
Road Baymeadows JT Butler Blvd JT Butler Blvd
Entrance Road EB/WB Entrance Exit Bowden Road
324 vph Exit 412 vph 1488 vph Entrance
630 ft 484 vph 650 ft 552 vph2600 ft 10 1770 ft 2350 ft 10
9 9 9 1 9 9 9 9
1 1 1 1 1 1 1 2 1 1 1 1 1 1 1 1 1 1 1 1 1 1
2 2 2 2 2 2 2 3 2 2 2 2 2 2 2 2 2 2 2 2 2 2
Simulated Volumes 4123 4116 3 4109 3 3777 3 3777 3 4419 4406 3 4397 3 4393 3 4386 4 4377 3 3950 3 3938 3 3932 3 3927 3 6080 3 6074 3 6067 3 5401 3 5390 3 5375 3 5364 3 5350 3 5341 3
Demand Volumes 3080 3080 3080 2756 2756 3240 3240 3240 3240 3240 3240 2828 2828 2828 2828 4316 4316 4316 3764 3764 3764 3764 3764 3764
Demand Volumes 1860 1860 1860 1720 1720 2228 2228 2228 2228 2228 2228 1892 2044 2044 2660 2660 2660 2152 2152 2152 2152 2152 2152
Simulated Volumes 3 1858 3 1859 3 1862 3 1715 3 1715 3 2226 3 2225 3 2221 3 2222 3 2224 3 2229 3 1892 3 2048 3 2049 3 2676 3 2676 3 2672 3 2169 3 2170 3 2175 3 2178 3 2183 3 2181
2 2 2 2 2 2 2 2 2 2 2 2 2 2 2 2 2 2 2 2 2 2 2
1 1 1 1 1 1 1 1 1 1 1 1 1 1 1 1 1 1 1 1 1 1 1
9 9 9 9 9 9 9
200 ft 360 ft 200 ft 1300 ft
Baymeadows Baymeadows SR 202/ SR 202/ 780 ft Bowden Road
Road road JT Butler Blvd JT Butler Blvd SR 202/ Exit
Exit Entrance Exit EB Entrance JT Butler Blvd 508 vph
I-95 Southbound
Exit Entrance Exit EB Entrance JT Butler Blvd 508 vph
140 vph 508 vph 336 vph 152 vph WB Entrance
616 vph
Distance (ft) 1427 1426 1427 1562 931 1625 1623 1560 1558 1331 1331 1813 1380 610 1581 1581 1560 1615 1616 1573 686 953 902
Speed (mph) 64 64 63 64 64 62 63 63 63 63 62 63 62 62 61 63 62 63 63 63 63 63 63
Density (veh/ln/mi) 1 1 1 2 1 0 0 0 0 0 0 0 0 0 0 0 0 0 0 0 0 0 0
143
511 Node Number Freeway Geometric Coloring
Density (Veh/Mi/Ln)
20 and below Density above 75
20 - 30 Density above 45
30 - 45 Density above 35
121 122 123 124 125 126 140 141 142130 131 138 139
I-95 Northbound
132 133 135 136 137199 127 128 134129
LEGEND
Speed (mph)
45 and above
900 Demand volume highlighted if simulated falls below = 90%
809 Simulated volume
I-95/ SR 202/JT Butler Boulevard Interchange Modification Report
PM 5th Hour MOE'sI-95 Lane SchematicUltimate Build 2035
Ultimate Build 2035 PM 5th Hour Lane Schematic
Page 1 of 2

7.0 EVALUATION OF ALTERNATIVES I-95/ J. Turner Butler Blvd IMR
7-40
Table 7-15 Design Year 2035 Ultimate Build Alternative Northbound I-95 Freeway MOEs
From ToDistance
(ft)
Speed
(mph)
Density
(vplpm)
Speed
(mph)
Density
(vplpm)
I-95 Northbound Begins 1427 24 93 63 24
1426 21 100 62 24
Baymeadows Road Exit 1427 19 101 61 23
Baymeadows Road Exit 1562 12 131 62 21
Baymeadows Road Entrance 931 12 132 61 21
Baymeadows Road Entrance 1625 16 116 51 34
1623 17 116 61 31
1560 22 88 57 33
1558 23 83 56 35
1331 25 79 50 40
SR 202/JT Butler Blvd Exit 1331 23 81 38 53
SR 202/JT Butler Blvd Exit SR 202/JT Butler Blvd EB Entrance 1813 25 57 27 60
SR 202/JT Butler Blvd EB Entrance 1380 26 47 24 53
SR 202/JT Butler Blvd WB Entrance 610 31 52 30 56
SR 202/JT Butler Blvd WB Entrance 1581 29 53 30 53
1581 42 44 49 38
Bowden Road Exit 1560 40 45 46 40
Bowden Road Exit 1615 43 45 46 43
1616 47 41 46 43
1573 51 37 49 40
686 53 35 52 37
953 58 33 57 33
I-95 Northbound Ends 902 61 31 61 31
PMFreeway Segment Link AM

7.0 EVALUATION OF ALTERNATIVES I-95/ J. Turner Butler Blvd IMR
7-41
Table 7-16 Design Year 2035 Ultimate Build Alternative Southbound I-95 Freeway MOEs
JTB Ultimate Build Freeway Operational Performance
The CORSIM model operations indicate that there are no operational deficiencies along the JTB mainline under the Design Year 2035 Ultimate Build conditions. The Ultimate Build Heat Diagrams illustrate the location and duration of congestion along JTB. The AM peak heat diagram illustrates congestion along the JTB westbound mainline from west of Belfort Road to I-95 northbound diverge which is similar to the Interim Build. The PM peak heat diagram illustrates that there is no significant congestion along the JTB mainline in either direction. Similar to the No-Build and Interim Build condition, I-95 northbound mainline downstream of the JTB entrance ramp does not have adequate capacity. Therefore congestion occurs at the merge and affects JTB westbound to I-95 northbound flyover operations. Low speeds and high densities were also observed along JTB westbound in the mainline in the AM peak resulting from this congestion. In the PM peak, increased densities are observed on the JTB eastbound mainline after the Belfort Road On-Ramp, this is due to the high On-Ramp volume of 1,610 vph. However, all observed congestion along the JTB mainline dissipates by the end of simulation (5th hour) as illustrated in lane schematics. The CORSIM model results for Ultimate Build Alternative for JTB are presented in Tables 7-17 and 7-18 below.
From ToDistance
(ft)
Speed
(mph)
Density
(vplpm)
Speed
(mph)
Density
(vplpm)
I-95 Southbound Begins 906 62 30 46 54
943 62 30 37 69
1274 61 30 31 83
1072 61 31 28 89
1432 60 31 26 92
Bowden Road Entrance 1502 60 31 25 93
Bowden Road Entrance 1596 58 30 25 84
921 55 32 35 59
SR 202/JT Butler Blvd Exit 1186 57 25 51 33
SR 202/JT Butler Blvd Exit 1891 61 23 47 39
797 61 23 31 61
890 61 23 23 75
SR 202/JT Butler Blvd WB and EB Entrance1324 60 23 22 77
SR 202/JT Butler Blvd WB and EB Entrance 1749 60 19 18 84
1260 50 29 27 73
1503 63 26 55 41
1505 65 26 63 36
1165 64 26 62 37
Baymeadows Road Exit 1845 63 20 62 27
Baymeadows Road Exit 1325 66 17 64 29
Baymeadows Road Entrance 1325 67 17 65 28
Baymeadows Road Entrance 1370 66 13 63 23
1357 67 14 62 27
I-95 Southbound Ends 1401 62 20 58 38
PMFreeway Segment Link AM
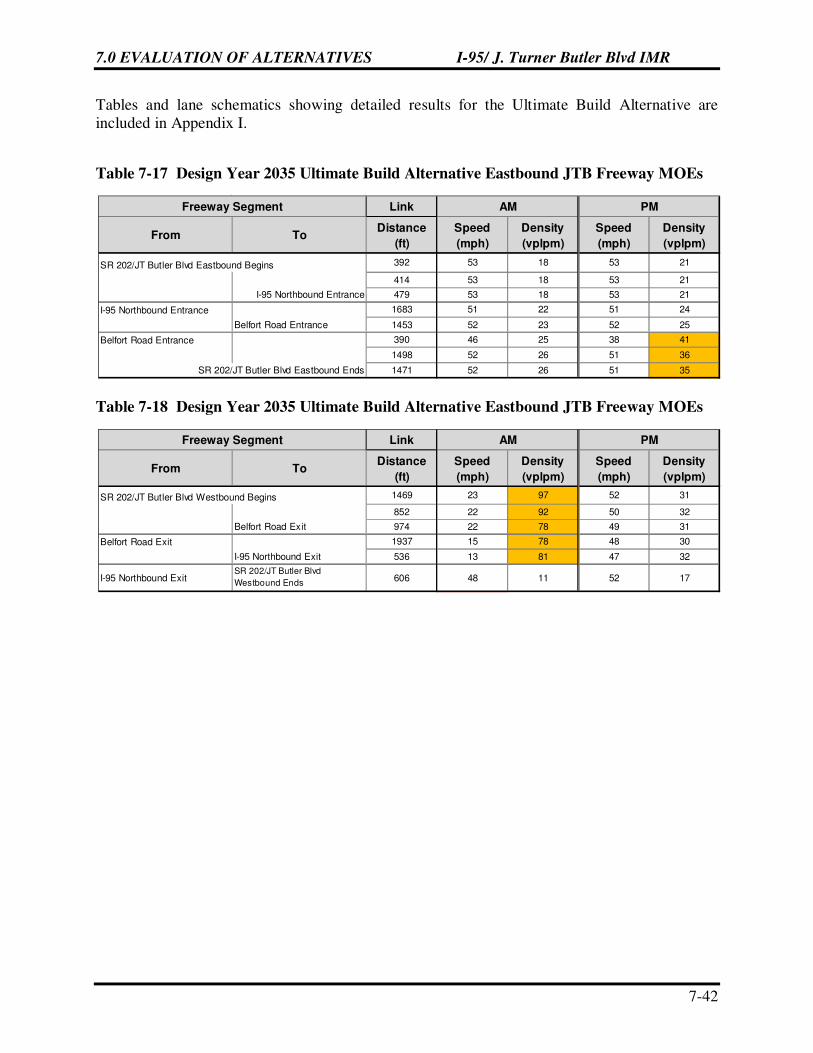
7.0 EVALUATION OF ALTERNATIVES I-95/ J. Turner Butler Blvd IMR
7-42
Tables and lane schematics showing detailed results for the Ultimate Build Alternative are included in Appendix I.
Table 7-17 Design Year 2035 Ultimate Build Alternative Eastbound JTB Freeway MOEs
Table 7-18 Design Year 2035 Ultimate Build Alternative Eastbound JTB Freeway MOEs
From ToDistance
(ft)
Speed
(mph)
Density
(vplpm)
Speed
(mph)
Density
(vplpm)
SR 202/JT Butler Blvd Eastbound Begins 392 53 18 53 21
414 53 18 53 21
I-95 Northbound Entrance 479 53 18 53 21
I-95 Northbound Entrance 1683 51 22 51 24
Belfort Road Entrance 1453 52 23 52 25
Belfort Road Entrance 390 46 25 38 41
1498 52 26 51 36
SR 202/JT Butler Blvd Eastbound Ends 1471 52 26 51 35
PMFreeway Segment Link AM
From ToDistance
(ft)
Speed
(mph)
Density
(vplpm)
Speed
(mph)
Density
(vplpm)
SR 202/JT Butler Blvd Westbound Begins 1469 23 97 52 31
852 22 92 50 32
Belfort Road Exit 974 22 78 49 31
Belfort Road Exit 1937 15 78 48 30
I-95 Northbound Exit 536 13 81 47 32
I-95 Northbound ExitSR 202/JT Butler Blvd
Westbound Ends606 48 11 52 17
Freeway Segment Link AM PM

Distance (ft) 606 536 1937 974 852 1469
Speed (mph) 48 13 15 22 22 23
Density (veh/ln/mi) 11 81 78 78 92 97
Belfort
I-95 Northbound Road
Flyover Exit Exit
706 705711 710 709 708 707
Flyover Exit Exit
2180 vph 1970 vph
1 1 1 1 1
1 2 2 2 2 2
Simulated Volumes 1148 2 2863 3 2895 3 4611 3 4664 3 4701 3
Demand Volumes 1670 3850 3850 5820 5820 5820
Demand Volumes 1870 1870 1870 4060 4060 4580 4580 4580
Simulated Volumes 2 1882 2 1883 2 1882 3 3806 3 3799 3 4313 3 4296 3 4289
1 1 1 2 2 2 2 2
1 1 1 1 1
200 ft
CD Entrance Belfort
to Mainline road
2190 vph Entrance
JTB Westbound
2190 vph Entrance
520 vph
Distance (ft) 392 414 479 1683 1453 390 1498 1471
Speed (mph) 53 53 53 51 52 46 52 52
Density (veh/ln/mi) 18 18 18 22 23 25 26 26
511 Node Number Freeway Geometric Coloring
Density (Veh/Mi/Ln)
LEGEND
JTB Eastbound
505 506 507 508 509 510 511 512 513
Density (Veh/Mi/Ln)
20 and below Density above 75
20 - 30 Density above 45
30 - 45 Density above 35
45 and above
900 Demand volume highlighted if simulated falls below = 90%
809 Simulated volume
Speed (mph)
I-95/ SR 202/JT Butler Boulevard Interchange Modification Report
AM Peak Hour MOE'sJT Butler Boulevard Lane Schematic
Ultimate Build 2035
Ultimate Build 2035 AM Peak Hour Lane Schematic
Page 2 of 2

Distance (ft) 606 536 1937 974 852 1469
Speed (mph) 52 47 48 49 50 52
Density (veh/ln/mi) 17 32 30 31 32 31
Belfort
I-95 Northbound Road
Flyover Exit Exit
1780 vph 1030 vph
706 705711 710 709 708 707
1780 vph 1030 vph
1 1 1 1 1
1 2 2 2 2 2
Simulated Volumes 1759 2 3515 3 3518 3 4567 3 4573 3 4579 3
Demand Volumes 1770 3550 3550 4580 4580 4580
Demand Volumes 2390 2390 2390 4210 4210 5820 5820 5820
Simulated Volumes 2 2237 2 2238 2 2238 3 3947 3 3959 3 5475 3 5477 3 5472
1 1 1 2 2 2 2 2
1 1 1 1 1
350 ft 200 ft
CD Entrance Belfort
to Mainline road
1820 vph Entrance
1610 vph
JTB Westbound
1610 vph
Distance (ft) 392 414 479 1683 1453 390 1498 1471
Speed (mph) 53 53 53 51 52 38 51 51
Level of Service C 21 21 24 25 41 36 35
Density (veh/ln/mi) 21 21 21 24 25 41 36 35
511 Node Number Freeway Geometric Coloring
LEGEND
JTB Eastbound
505 506 507 508 509 510 511 512 513
511 Node Number Freeway Geometric Coloring
Density (Veh/Mi/Ln)
20 and below Density above 75
20 - 30 Density above 45
30 - 45 Density above 35
45 and above
900 Demand volume highlighted if simulated falls below = 90%
809 Simulated volume
Speed (mph)
I-95/ SR 202/JT Butler Boulevard Interchange Modification Report
PM Peak Hour MOE'sJT Butler Boulevard Lane Schematic
Ultimate Build 2035
Ultimate Build 2035 PM Peak Hour Lane Schematic
Page 2 of 2

Distance (ft) 606 536 1937 974 852 1469
Speed (mph) 54 53 53 52 53 54
Density (veh/ln/mi) 1 3 2 1 0 0
Belfort
I-95 Northbound Road
Flyover Exit Exit
706 705711 710 709 708 707
Flyover Exit Exit
748 vph 556 vph
1 1 1 1 1
1 2 2 2 2 2
Simulated Volumes 466 2 1243 3 1238 3 1790 3 1781 3 1771 3
Demand Volumes 456 1204 1204 1760 1760 1760
Demand Volumes 880 880 880 1896 1896 2152 2152 2152
Simulated Volumes 2 879 2 880 2 880 3 2004 3 2011 3 2264 3 2266 3 2269
1 1 1 2 2 2 2 2
1 1 1 1 1
200 ft
CD Entrance Belfort
to Mainline road
1016 vph Entrance
JTB Westbound
1016 vph Entrance
256 vph
Distance (ft) 392 414 479 1683 1453 390 1498 1471
Speed (mph) 54 54 54 52 54 51 54 54
Density (veh/ln/mi) 3 3 3 7 7 6 8 8
511 Node Number Freeway Geometric Coloring
Density (Veh/Mi/Ln)
JTB Eastbound
505 506 507 508 509 510 511 512 513
LEGEND
Density (Veh/Mi/Ln)
20 and below Density above 75
20 - 30 Density above 45
30 - 45 Density above 35
45 and above
900 Demand volume highlighted if simulated falls below = 90%
809 Simulated volume
Speed (mph)
I-95/ SR 202/JT Butler Boulevard Interchange Modification Report
AM 5th Hour MOE'sJT Butler Boulevard Lane Schematic
Ultimate Build 2035
Ultimate Build 2035 AM 5th Hour Lane Schematic
Page 2 of 2

Distance (ft) 606 536 1937 974 852 1469
Speed (mph) 54 54 54 54 54 55
Density (veh/ln/mi) 0 0 0 0 0 0
Belfort
I-95 Northbound Road
Flyover Exit Exit
488 vph 200 vph
706 705711 710 709 708 707
488 vph 200 vph
1 1 1 1 1
1 2 2 2 2 2
Simulated Volumes 579 2 1075 3 1075 3 1271 3 1270 3 1272 3
Demand Volumes 580 1068 1068 1268 1268 1268
Demand Volumes 916 916 916 1440 1440 1768 1768 1768
Simulated Volumes 2 1364 2 1366 2 1365 3 1941 3 1945 3 2285 3 2286 3 2288
1 1 1 2 2 2 2 2
1 1 1 1 1
350 ft 200 ft
CD Entrance Belfort
to Mainline road
524 vph Entrance
328 vph
JTB Westbound
328 vph
Distance (ft) 392 414 479 1683 1453 390 1498 1471
Speed (mph) 54 54 54 53 54 51 54 54
Level of Service A 9 9 5 6 1 4 4
Density (veh/ln/mi) 9 9 9 5 6 1 4 4
511 Node Number Freeway Geometric Coloring
JTB Eastbound
505 506 507 508 509 510 511 512 513
LEGEND
511 Node Number Freeway Geometric Coloring
Density (Veh/Mi/Ln)
20 and below Density above 75
20 - 30 Density above 45
30 - 45 Density above 35
45 and above
900 Demand volume highlighted if simulated falls below = 90%
809 Simulated volume
Speed (mph)
I-95/ SR 202/JT Butler Boulevard Interchange Modification Report
PM 5th Hour MOE'sJT Butler Boulevard Lane Schematic
Ultimate Build 2035
Ultimate Build 2035 PM 5th Hour Lane Schematic
Page 2 of 2

7.0 EVALUATION OF ALTERNATIVES I-95/ J. Turner Butler Blvd IMR
7-47
Arterial Operational Performance
CORSIM results show that similar to the Interim Build Alternative, the operating conditions along JTB arterial segments improve significantly under the Ultimate Build conditions as compared to the No-Build. This is due to the proposed improvements at the I-95/JTB interchange as well as the widening of JTB from Philips Highway to I-95. In fact the I-95 southbound off ramp terminal intersection improves under Ultimate Build condition as compared to the Interim Build. This is because the proposed third JTB through lane in the eastbound direction is a signal bypass lane that drops at the JTB eastbound to I-95 northbound loop ramp. Table 7-19 provides a summary of the CORSIM MOEs for the ramp terminal intersections at the study area intersections during AM and PM peak hours for Ultimate Build Alternative. Table 7-19 Design Year 2035 Ultimate Build Alternative Arterial MOEs (Control Delay)
1. Control Delay is in terms of seconds/vehicle 2. Intersection delay greater than the threshold value of 55 sec/veh, which is considered undesirable
L T R D L T R D
WB 59 - 17 - 43 56 - 40 - 50
NB - 28 20 - 24 39 - 48 2 - 32 38
SB 151 10 - - 59 72 22 - - 33
WB 58 18 11 - 32 58 22 17 - 31
EB 87 36 42 - 38 45 100 41 43 - 44 41
NB 72 156 69 - 75 70 97 45 - 50
SB 86 66 44 - 78 75 51 27 - 66
EB - 6 - - 6 - 12 - - 12
WB - 4 - 5 4 19 - 4 - 5 4 15
SB 85 - 76 - 80 46 - 52 - 50
EB - 12 - 12 12 - 11 - 11 11
NB 40 45 - - 43 18 34 36 - - 35 17
EB 61 71 46 - 54 67 72 41 - 61
SB 0 4 - - 3 29 0 5 - - 2 53
NB - 55 3 58 45 - 133 10 141 95
NB 0 2 - - 2 0 3 - - 2
WB 40 46 - - 42 44 65 76 - - 70 27
SB - 98 - 93 96 - 38 - 47 45
NB 9 5 5 - 7 17 4 3 - 9
EB 6 13 6 - 12 12 10 20 17 - 20 20
WB 36 41 16 - 34 39 38 16 - 38
SB 42 49 3 - 15 48 49 18 - 22
SB 66 42 25 - 41 64 34 14 - 34
NB 65 29 2 - 45 41 49 71 3 - 55 592
EB 46 47 18 - 26 127 119 89 - 98
WB 55 50 41 - 53 69 62 62 - 67
SB 106 13 - - 18 32 25 - - 26
EB - 35 2 - 31 29 - 48 22 159 72 53
EB 54 - 36 - 43 56 - 10 - 41
WB 122 19 - - 34 9 2 - - 4
NB - 74 155 35 99 642- 73 5 50 47 24
WB 48 - 20 - 42 61 - 48 - 54
EB 40 2 - - 17 39 2 - - 16
EB - 15 18 - 16 17 - 50 205 - 135 752
WB - 14 - - 14 - 21 - - 21
NB - 54 - - 54 28 - 76 - - 76 36
SB 18 - 9 - 13 18 - 12 - 14
PM Peak Control Delay1
Total Delay by Movement
AM Peak Control Delay1
Belfort Road @ A C Skinner
Pkwy
JTB @ SB I-95 Off ramp
EB JTB @ I-95 NB off ramp
IntersectionTotal Delay by Movement
Approach Intersection
JTB @ US 1
JTB @ Bonneval Road
Intersection Approach Approach
Location
EB JTB @ Belfort Road
WB JTB @ Belfort Road
Belfort Road @ Southpoint
Drive
Baymeadows Road @ I-95 SB
off ramps
Baymeadows Road @ I-95 NB
off ramps
Bowden Road @ I-95 SB on
ramps
Bowden Road @ I-95 NB off
ramps

7.0 EVALUATION OF ALTERNATIVES I-95/ J. Turner Butler Blvd IMR
7-48
7.6 Environmental Impacts
The I-95/JTB interchange influence area is currently in compliance with the federal air quality standards. The Build Alternative proposed in this IMR will not have a negative impact on air quality. There are no known cultural sites, flood plains or conservation areas within the influence area of the interchange. There are 3 sites with a “High” rating that will need to be sampled to address any contamination issues. There will be some impacts to wetlands within the project study area, therefore mitigation is anticipated. There will be 12.7 acres of direct wetland impacts and 4.7 acres of secondary impacts under the Build Alternative. There will be no impacts to community facilities such as schools and church buildings under the Build alternative. No impacts to any archaeological or historical sites are anticipated as a result of the study interchange. There are no navigable waterways within the project study area.
7.7 Safety
The accident data evaluated in Section 3.3.2 showed that the crash rates along I-95 and JTB within the area of influence are lower than the statewide averages. The predominant crash type along I-95 and JTB is the rear end crash accounting for approximately 38% and 45% of all crashes respectively. No safety concerns exist within the study area and crashes can be attributed to congested conditions in the vicinity of the interchange. From a safety perspective, the recommendations of this study will not have a negative impact and will actually help in reducing the rear end and side swipe type of crashes. The improvements proposed in the southbound direction at the interchange help eliminate traffic congestion and queue along I-95 in the southbound direction, thereby improving safety of the mainline.
7.8 Alternatives Comparison
The No-Build Alternative and the Interim and Ultimate Build Alternatives were compared and a summary is provided in the sections below.
7.8.1 Planning and Environmental Comparison
This section provides a comparison of planning and environmental impacts associated with the No-Build and Build Alternatives. The need for improvements at the I-95/JTB interchange was established a few years ago to address the operational deficiencies. The modified interchange will provide better and safer traffic operations leading to better roadway network connectivity for the northeast Florida region. The Interim and Ultimate Build Alternatives will have the same magnitude of environmental impacts and have been referred to as Build Alternative for discussion in this section. The Build Alternative is in conformance with the recently completed NEPA document, its reevaluation and the North Florida TPO Long Range Transportation Plan. The No-Build Alternative is not in conformance with these plans.
The No-Build Alternative will have no environmental impacts. The Build Alternative (modified I-95/JTB interchange) is part of the long term improvement plans for the Jacksonville region. Special considerations were taken in developing and evaluating the Build Alternative to avoid

7.0 EVALUATION OF ALTERNATIVES I-95/ J. Turner Butler Blvd IMR
7-49
and minimize the environmental impacts associated with this project to the greatest extent practicable. The Build Alternative will have no impacts to the air quality, noise, navigation, schools and churches, or historical/archeological sites within the vicinity of the I-95/JTB study interchange. However, there will be some impact to wetlands that will require mitigation. The wetlands mitigation associated with the proposed I-95/JTB interchange will be addressed as part of the NEPA reevaluation project.
Table 7-20 Alternatives’ Comparison
Criteria No-Build Build
Conformance with Master Plan and FDOT Policies and Standards No Yes
Traffic Operational Performance Not Satisfied
Satisfied
Environmental Elements Impacts
Air Quality Impacts 0 0 Potential Contamination Sites 0 3
Navigation Impacts 0 0 Wetlands - Direct and Secondary (acres) 0 17.4
Floodplains (Transverse Crossings) 0 0
Listed Species (# of species possibly involved) 0 0 Schools & Churches 0 0
Noise Sites 0 0 Historical/Archaeological Sites 0 0
7.8.2 Operational Comparisons
This section compares the mainline, ramp merge/diverge and intersections traffic operational performance of the No-Build and Build Alternatives. The proposed modifications at the I-95/JTB interchange along with other improvements in the study area such as widening of JTB from Philips Highway to I-95 will provide significantly better operations with no negative impacts. The proposed modifications have no traffic or operational impacts to the adjacent interchanges of I-95/Baymeadows Road and I-95/Bowden Road. The delay at the I-95/JTB ramp terminal intersections and other study intersections reduces under both the Interim and Ultimate Build Alternatives in comparison to the No-Build. The most significant improvement is at the I-95/JTB southbound off ramp terminal intersection that improves to an acceptable LOS in Interim and Ultimate Build from a failing LOS of F in No-Build. The new I-95/JTB northbound off ramp terminal intersection operates at acceptable LOS through Design Year 2035 in Interim and Ultimate Build Alternatives. The traffic volumes along the I-95 mainline are not affected by the proposed modifications to the I-95/JTB interchange and therefore remain the same in No-Build and both the Build Alternatives. The operational conditions based on LOS obtained from HCS also remain the same in all the alternatives. The Opening Year 2015 No-Build and Build operational analysis results shows that all of the mainline segments and ramp junctions operated at acceptable LOS D or better.

7.0 EVALUATION OF ALTERNATIVES I-95/ J. Turner Butler Blvd IMR
7-50
In Interim Year 2025, most of the mainline segments and ramp junctions for No-Build and the Interim and Ultimate Build Alternatives operate at acceptable LOS. The following movements operate at unacceptable LOS for all the alternatives – I-95 northbound on ramp from JTB operates at LOS E during AM peak hour, I-95 northbound mainline operates at LOS E during AM peak hour, I-95 northbound off ramp to JTB operates at LOS E during AM peak hour and JTB westbound to I-95 southbound loop ramp operates at LOS E during PM peak hour. In Design Year 2035, some of the mainline and ramp movements begin to operate at LOS F in the No-Build and Interim and Ultimate Build Alternatives. These movements are - I-95 northbound on ramp from JTB operates at LOS F during AM peak hour, I-95 northbound mainline operates at LOS F during AM peak hour, I-95 northbound off ramp to JTB operates at LOS F during AM peak hour, JTB westbound to I-95 southbound loop ramp operates at LOS F during PM peak hour, JTB eastbound to I-95 southbound on ramp operates at LOS F during PM peak hour and I-95 southbound mainline operates at LOS F during PM peak hour. The failure of the ramp merge/diverge movements is due to inadequate capacity on the I-95 mainline. The ramp roadway has adequate capacity to handle the travel demand. A comparison of the intersection operational analysis results shows that the delay reduces at all the study intersections under the Interim and Ultimate Build Alternatives as compared to the No-Build. The I-95 southbound off ramp terminal intersection operates at undesirable LOS F in Opening Year 2015, Interim Year 2025 and Design Year 2035 under the NO-Build Alternative. This improves to an acceptable LOS D or better in all the years for Interim and Ultimate Build Alternatives. When comparing the microsimulation (CORSIM) analysis results between the No-Build and Build Alternatives, the CORSIM results indicate that the Interim and Ultimate Build Alternatives will provide better traffic operations in the area of influence. The I-95 and JTB mainline segments have higher speeds and better operating conditions under the Build condition as compared to the No-Build. The queues observed in the No-Build are reduced significantly in both the Build alternatives. The Build alternatives are able to process more traffic through the network as a result of the proposed improvements. The No-Build has residual queues and unmet demand at the end of the simulation period whereas the entire traffic demand is dissipated in case of Interim and Ultimate Build Alternatives. The CORSIM model shows that the lack of capacity and congested conditions along JTB westbound under the No-Build Alternative prevents traffic from reaching the I-95 northbound mainline. In the Build Alternative, additional traffic is able to be processed on JTB westbound thus degrading I-95 northbound. The heat diagrams confirm this condition. As per the FHWA toolbox, the temporal time limits of the model were increased to 5 hours to allow for recovery and dissipation of traffic. At the end of the simulation period, traffic dissipated from the Build model but the No-Build model still had congested areas. This also confirms that the congested area on JTB westbound was removed and that traffic is able to reach I-95 NB quicker resulting in some degradation of I-95 northbound during the peak period. Additional capacity is needed on I-95 to effectively process all the traffic demand. A planning level study is underway to evaluate additional capacity projects on I-95 from International Golf

7.0 EVALUATION OF ALTERNATIVES I-95/ J. Turner Butler Blvd IMR
7-51
Parkway to the Overland Bridge. Due to the proposed improvements from this study, the planning study will need to incorporate these improvements and make recommendations on how to process the additional demand on I-95 NB that the Build Alternative delivers. The number of on ramp lanes merging with I-95 remain the same in both the No-Build and Build alternatives, i.e. 2 lanes. The traffic and LOS from HCS on the I-95 mainline between JTB and Bowden Road also remains the same under No-Build and Build conditions. This indicates that if the entire traffic demand was able to get to the mainline in No-Build and Build conditions during the peak hour, then the LOS would remain the same as per HCS. In conclusion, the comparison of the No-Build and Build alternatives show that the proposed interchange improvements provide better and safer operating conditions.
7.9 Recommended Alternative
The No-Build Alternative evaluation shows that it is not in conformance with the long range transportation plans for the region and will not provide the travel demand at the I-95/JTB interchange. This report supports the conclusion that proposed modifications at the interchange and other roadways within the area of influence for the Interim and Ultimate Build Alternatives will benefit both the interstate and regional transportation systems. No potential environmental fatal flaws have been identified for the proposed improvements. The Interim Alternative will provide better operations compared to the No-Build Alternative through Design Year 2035 and the proposed modifications as part of this alternative will operate at acceptable level of service (LOS). The Ultimate Alternative is similar to the Interim Alternative with a few design modifications. The main difference is that the Ultimate Alternative will include reconstruction of the I-95/JTB interchange bridges. The Ultimate Alternative also will provide acceptable operations for the proposed modifications. FDOT is requesting approval of both the Interim and Ultimate Build Alternatives as part of this IMR. FDOT plans to construct the Ultimate Alternative when funding is available in future. Additional capacity is needed on I-95 to effectively process all the traffic demand. A planning level study is underway to evaluate additional capacity projects on I-95 from International Golf Parkway to the Overland Bridge. Due to the proposed improvements from this study, the planning study will need to incorporate these improvements and make recommendations on how to process the additional demand on I-95 NB that the Build Alternative delivers. Based on the evaluations of No-Build and Build Alternatives, the Interim and Ultimate Build Alternatives, are recommended as the Preferred Alternatives for approval in this study.

8.0 MODIFICATION FOR PROJECT I-95/ J. Turner Butler Blvd IMR
8-1
8.0 MODIFICATION FOR PROJECT
The proposed modifications at the I-95/JTB interchange will provide traffic relief and enhance safety within the area of influence. The proposed modifications will operate at an acceptable LOS through the Design Year 2035.
8.1 Compliance with FHWA General Requirements
The following requirements serve as the primary decision criteria used in approval of interchange modification projects. Responses to each of the FHWA 8 policy points are provided to show that the proposed modification for the I-95/JTB interchange is viable based on the conceptual analysis performed to date.
8.1.1 Existing system is incapable of accommodating the traffic
The need being addressed by the request cannot be adequately satisfied by existing interchanges
to the Interstate, and/or local roads and streets in the corridor can neither provide the desired
access, nor can they be reasonably improved (such as access control along surface streets,
improving traffic control, modifying ramp terminals and intersections, adding turn bays or
lengthening storage) to satisfactorily accommodate the design-year traffic demands (23 CFR
625.2(a)).
The need being addressed by this IMR can only be addressed at the existing I-95/JTB interchange location. Other streets and interchanges within the area of influence cannot meet the demand for traffic within the project. Both I-95 and JTB carry high volume of traffic with daily traffic exceeding 100,000 vehicles. The I-95/JTB interchange serves as a main route for commuters coming from St. Johns and Clay Counties to major employment centers located in Duval County along JTB. This interchange also provides access to the Beaches and popular medical centers like the St. Vincent’s Medical Center Southside and the Mayo Clinic. The proposed improvements do not significantly modify or change the access to I-95 but enhance the flow of vehicles exiting I-95 to the JTB freeway and local access as well as traffic accessing I-95 from JTB. The I-95 southbound off ramp terminal intersection operates at LOS F in Design Year 2035 and traffic is expected to spill back on to the mainline. This intersection cannot be improved to accommodate the traffic demand. The proposed I-95 southbound to JTB westbound flyover ramp and other improvements within the I-95/JTB interchange area are designed to ensure that no queue spillback will occur onto I-95 from the crossroad intersections or ramps in the design year.
8.1.2 All reasonable alternatives to a new interchange have been considered
The need being addressed by the request cannot be adequately satisfied by reasonable
transportation system management (such as ramp metering, mass transit, and HOV facilities),
geometric design, and alternative improvements to the Interstate without the proposed change(s)
in access (23 CFR 625.2(a)).
Transportation system management (TSM) improvements such as ramp metering and mass transit are not feasible to provide the needed capacity intended by the proposed modifications.

8.0 MODIFICATION FOR PROJECT I-95/ J. Turner Butler Blvd IMR
8-2
TSM improvements have been constructed in the past and will not be able to meet the traffic or safety needs at the interchange in design year.
8.1.3 Proposal does not adversely impact operational safety of the existing freeway
An operational and safety analysis has concluded that the proposed change in access does not
have a significant adverse impact on the safety and operation of the Interstate facility (which
includes mainline lanes, existing, new, or modified ramps, ramp intersections with crossroad) or
on the local street network based on both the current and the planned future traffic projections.
The analysis shall, particularly in urbanized areas, include at least the first adjacent existing or
proposed interchange on either side of the proposed change in access (23 CFR 625.2(a),
655.603(d) and 771.111(f)). The crossroads and the local street network, to at least the first
major intersection on either side of the proposed change in access, shall be included in this
analysis to the extent necessary to fully evaluate the safety and operational impacts that the
proposed change in access and other transportation improvements may have on the local street
network (23 CFR 625.2(a) and 655.603(d)). Requests for a proposed change in access must
include a description and assessment of the impacts and ability of the proposed changes to safely
and efficiently collect, distribute and accommodate traffic on the Interstate facility, ramps,
intersection of ramps with crossroad, and local street network (23 CFR 625.2(a) and
655.603(d)). Each request must also include a conceptual plan of the type and location of the
signs proposed to support each design alternative (23 U.S.C. 109(d), and 23 CFR 655.603(d)).
The safety analysis performed for this IMR showed that there are no high accident locations within the project area. The average crash rates for I-95 and JTB for the last three years is lower than the statewide average for similar facilities. Side swipe and angle type crashes are the predominant crash types and account for more than fifty percent of the total crashes. These type of crashes are attributed to congested conditions and lane changes in short distance. The proposed interchange modifications in this IMR aim to improve traffic flow at the merge/diverge, intersections and along the local streets. This will provide safer travel conditions. The proposed interchange modifications provide better operations and LOS as compared to the No-Build through Design Year 2035. The operational analysis conducted for this project does not have a significant adverse impact on I-95 and JTB. In the northbound direction between JTB and Bowden Road, speeds decrease and densities increase when comparing the Build alternative to the No-Build alternative. This is primarily due to the fact that the Build alternative is able to process more traffic through the system as compared to the No-Build. However, it should be noted that congestion at this location completely dissipates prior to the end of simulation unlike the No-Build that has congestion at the end of the simulation. The proposed modifications as part of this IMR will provide an acceptable LOS through the Design Year 2035. The operational analysis included sections of interstate and existing adjacent interchanges within the area of influence. Crossroads and other roads and streets were also included in the analysis to assure their ability to collect and distribute the traffic to and from the I-95/JTB interchange. The CORSIM model shows that the lack of capacity and congested conditions along JTB westbound under the No-Build Alternative prevents traffic from reaching the I-95 northbound mainline. In the Build Alternative, additional traffic is able to be processed on JTB westbound

8.0 MODIFICATION FOR PROJECT I-95/ J. Turner Butler Blvd IMR
8-3
thus degrading I-95 northbound. The heat diagrams confirm this condition. As per the FHWA toolbox, the temporal time limits of the model were increased to 5 hours to allow for recovery and dissipation of traffic. At the end of the simulation period, traffic dissipated from the Build model but the No-Build model still had congested areas. This also confirms that the congested area on JTB westbound was removed and that traffic is able to reach I-95 NB quicker resulting in some degradation of I-95 northbound during the peak period. Additional capacity is needed on I-95 to effectively process all the traffic demand. A planning level study is underway to evaluate additional capacity projects on I-95 from International Golf Parkway to the Overland Bridge. Due to the proposed improvements from this study, the planning study will need to incorporate these improvements and make recommendations on how to process the additional demand on I-95 NB that the Build Alternative delivers. The number of on ramp lanes merging with I-95 remain the same in both the No-Build and Build alternatives, i.e. 2 lanes. The traffic and LOS from HCS on the I-95 mainline between JTB and Bowden Road also remains the same under No-Build and Build conditions. This indicates that if the entire traffic demand was able to get to the mainline in No-Build and Build conditions during the peak hour, then the LOS would remain the same as per HCS.
8.1.4 A full interchange with all traffic movements at a public road is provided
The proposed access connects to a public road only and will provide for all traffic movements.
Less than “full interchanges” may be considered on a case-by-case basis for applications
requiring special access for managed lanes (e.g., transit, HOVs, HOT lanes) or park and ride
lots. The proposed access will be designed to meet or exceed current standards for federal-aid
projects on the interstate system (23 CFR 625.2(a), 625.4(a)(2), and 655.603(d)).
The proposed improvements will restore the I-95 northbound to JTB westbound movement within the interchange that was removed during a prior interchange modification project. This will allow the interchange to operate as a full interchange with all traffic movements. The proposed movement will be under signal control and operate at acceptable LOS through Design Year 2035. The proposed modifications are designed to meet current standards for federal-aid projects on the interstate system and conform to AASHTO design standards.
8.1.5 The proposal is consistent with local and regional plans
The proposal considers and is consistent with local and regional land use and transportation
plans. Prior to receiving final approval, all requests for new or revised access must be included
in an adopted Metropolitan Transportation Plan, in the adopted Statewide or Metropolitan
Transportation Improvement Program (STIP or TIP), and the Congestion Management Process
within transportation management areas, as appropriate, and as specified in 23 CFR part 450,
and the transportation conformity requirements of 40 CFR parts 51 and 93. The proposed interchange modifications are supported by the North Florida Transportation Planning Organization (TPO) 2035 Cost Feasible long range transportation plan (LRTP). FDOT plans to construct the improvements as part of a Design-Build (D-B) project. The anticipated letting date for the D-B is fiscal year 2013-2014. There are no additional interchange improvements proposed or planned within the area of influence.

8.0 MODIFICATION FOR PROJECT I-95/ J. Turner Butler Blvd IMR
8-4
8.1.6 Consistency with State Highway Master Plans
In corridors where the potential exists for future multiple interchange additions, a
comprehensive corridor or network study must accompany all requests for new or revised access
with recommendations that address all of the proposed and desired access changes within the
context of a longer-range system or network plan (23 U.S.C. 109(d), 23 CFR 625.2(a),
655.603(d), and 771.111). The proposed interchange is in conformance with the 2035 LRTP adopted by the North Florida TPO. A Project Development and Environment (PD&E) document was prepared for the interchange in 2011 which will be reevaluated as part of this project for the proposed improvements. The proposed modifications to the interchange are also consistent with the previous I-95 Master Plan and the analysis includes adjacent interchanges and local street network.
8.1.7 Coordinated with the area's development
When a new or revised access point is due to a new, expanded, or substantial change in current
or planned future development or land use, requests must demonstrate appropriate coordination
has occurred between the development and any proposed transportation system improvements
(23 CFR 625.2(a) and 655.603(d)). The request must describe the commitments agreed upon to
assure adequate collection and dispersion of the traffic resulting from the development with the
adjoining local street network and Interstate access point (23 CFR 625.2(a) and 655.603(d)).
The proposed improvements are not driven by any proposed development and the need for interchange improvements is independent of any other transportation improvements within the area. Substantial population increases in Duval and St. Johns County have occurred, since the opening of the I-95/JTB interchange that are anticipated to add significant amount of trips to the interchange.
8.1.8 Request needs to consider planning and environmental constraints
The proposal can be expected to be included as an alternative in the required environmental
evaluation, review and processing. The proposal should include supporting information and
current status of the environmental processing (23 CFR 771.111).
No potential fatal flaws from a planning and environmental perspective are anticipated for the proposed improvements. Some wetland impacts are anticipated. A PD&E study was completed for the interchange in 2011 that will be reevaluated as part of the current project. A Type 2 Categorical Exclusion has been determined as the Class of Action and Efficient Transportation Decision Making (ETDM) screening has been completed.

9.0 CONCEPTUAL FUNDING PLAN I-95/ J. Turner Butler Blvd IMR
9-1
9.0 CONCEPTUAL FUNDING PLAN/CONSTRUCTION SCHEDULE
Funding for this IMR is available through the FDOT District 2. The interchange is scheduled to open in 2015. The PD&E reevaluation is funded through the FDOT. The Design and Construction is anticipated to be advertised in Fiscal Year 2014. Governor Scott along with FDOT CO has recently allocated $78 million to fund the needed improvements at the I-95/JTB interchange through Design and Construction.