interconnect for airborne power distribution technical
TRANSCRIPT

Interconnect for Airborne Power DistributionTechnical Reference Guide GT-20-394, Rev. VI
INTERCONNECT SOLUTIONS
MISSION-CRITICAL
JULY 2020
2
2 Technical Reference Guide GT-20-394, Rev. VI • Glenair Proprietary Use Only© 2020 Glenair, Inc • 1211 Air Way, Glendale, CA 91201 • 818-247-6000 • www.glenair.com • U.S. CAGE code 06324
1. Purpose
The purpose of this document is to provide technical information to customers and sales support, guiding appropriate selection and use of various Glenair interconnect products based on power application requirements.
Areas of discussion include:• Voltage – dielectric withstanding voltage (DWV), operating voltage, partial
discharge, altitude effects, frequency effects, and lifetime reliability
• Current – current rating, altitude derating, bundle derating, temperature rise, and frequency limitations
While comprehensive, this guide is not definitive or absolute, and should not be used as a substitute for proper design engineering or qualification testing. This guide should be used for initial investigation, but the final solution must be assessed by Glenair engineering and certified by qualification testing.
2. Frequently Asked Questions
What is the difference between “breakdown voltage,” “DWV,” and “voltage rating?”
• Breakdown voltage is the voltage required to cause failure and permanent damage to electrical equipment
• Dielectric withstanding voltage, or DWV, is a proof-test voltage to ensure the electrical equipment is free from defects
• Voltage rating, or working voltage, is the operating voltage of the equipment.
• To provide safety margin, there is always a difference between operating voltage and DWV test voltages. In general, Glenair only provides DWV test data for our interconnect products to ensure they are not defective. It is the customer’s responsibility to derate according to the criticality of their application. Any application requiring a qualified voltage rating must be evaluated by the Glenair High-Voltage Interconnect Solutions Group.
Interconnect for Airborne Power DistributionTechnical Reference Guide GT-20-394, Rev. VIFor Glenair Proprietary Use Only

3
3Technical Reference Guide GT-20-394, Rev. VI • Glenair Proprietary Use Only© 2020 Glenair, Inc • 1211 Air Way, Glendale, CA 91201 • 818-247-6000 • www.glenair.com • U.S. CAGE code 06324
TECHNICAL REFERENCE GUIDE GT-20-394 REV. VIInterconnect for Airborne Power Distribution
What does “current rating” mean?• Current rating is the maximum allowed current before failure, often
defined as 30°C temperature rise for a single conductor at sea-level. It is acceptable to use a conductor for currents greater than the current rating if the system can tolerate the corresponding temperature rise. However, increased altitude and wire bundles will reduce performance, and should be derated accordingly. Any application requiring currents in excess of the standard current rating should be evaluated by the customer. For reference only, Glenair engineering may assist evaluation in accordance with SAE AS508811.
What is partial discharge, and how does it affect performance?• Partial discharge is localized breakdown within the insulation which does
not fully bridge between conductors. Small defects within the insulation, such as air voids or contaminants, are the primary cause. While partial discharge does not result in immediate failure, it will accelerate insulation aging and shorten the interconnect life expectancy. Partial discharge takes many forms, including void discharge, surface discharge, corona discharge, and treeing. Any application with partial discharge requirements must be evaluated by the Glenair High-Voltage Interconnect Solutions Group.
How does altitude affect voltage performance?• In general, clearances between components in connector insulation are
filled with air. The air pockets are electrically insulating, acting as small “components” within the insulation system. Increased altitude reduces air pressure, which reduces the electrical (dielectric) strength. As the air’s dielectric strength is reduced, the total combined strength of the insulation system is reduced as well. However, as altitude increases further, a vacuum replaces the air pockets. Vacuums, being stronger insulators than air, will restore lost performance.
How does source frequency affect voltage performance?• Increasing frequency of the applied power source increases stress on
the insulation, reducing the breakdown voltage (and therefore DWV and voltage rating) of the interconnect. Direct current (DC) sources are the least stressful on the insulation, allowing much higher voltages than alternating current (AC). The interconnect testing standard is power-frequency AC (50/60 Hz). Increasing frequency will reduce strength and the interconnect should be derated accordingly. Any application requiring high frequencies (>400 Hz) or optimized DC performance when only AC DWV is known must be evaluated by the Glenair High-Voltage Interconnect Solutions Group.
How does source frequency affect current performance?• Increasing frequency reduces current rating. Through “skin effect,” high
frequencies prevent full utilization of the conductor. High frequencies are particularly detrimental to larger conductors. Any application requiring high frequencies (>400 Hz) must be evaluated by the Glenair High-Voltage Interconnect Solutions Group.

4
4 Technical Reference Guide GT-20-394, Rev. VI • Glenair Proprietary Use Only© 2020 Glenair, Inc • 1211 Air Way, Glendale, CA 91201 • 818-247-6000 • www.glenair.com • U.S. CAGE code 06324
TECHNICAL REFERENCE GUIDE GT-20-394 REV. VIInterconnect for Airborne Power Distribution
How do we estimate reliability?• Various methods estimate interconnect long-term reliability by applying
elevated stressors to induce failure, then deriving life expectancy at intended usage through advanced calculations. Accelerating factors include elevated voltage, elevated temperature, temperature cycling, and increased frequency. Accelerated aging tests may be useful in some instances, but the gold standard of reliability testing is Weibull analysis. For all tests, because the result is an extrapolation, larger test populations and lower acceleration factors produce more reliable results. However, this becomes expensive and time consuming. For critical products, such as Glenair Series GHV high-voltage products, it is Glenair’s preference to determine reliability through Weibull analysis. However, the reliability of less critical products for certain customer programs may be adequately assessed through accelerated aging.
3. Definitions
AC Alternating Current, supply current cyclically changes direction
Breakdown Catastrophic failure in electrical insulation resulting in instantaneous and complete loss in electrical performance
Current Rate of flow of electrical charge, usually measured in amperes (A)
DC Direct Current, supply current flows in one continuous direction
DWV Dielectric Withstand Voltage, proof-test voltage to ensure interconnect is free of manufacturing defect
Frequency Cyclical rate of change in current direction for AC systems, usually measured in Hz (cycles per second)
OpV Operational Voltage, safe working voltage for continuous use based on application environment and reliability requirements
PD Partial Discharge, localized failure in electrical insulation resulting in slow aging of electrical insulation , usually measured in picocoulombs (pC)
Safety Factor Difference between OpV and DWV, required to ensure proper operation and varies based on application criticality
Skin Effect Loss in conductor utilization and efficiency due to counter-electromotive force (CEMF) in high-frequency alternating currents
Voltage Electrical potential difference between two conductors, usually measured in volts (V)

5
5Technical Reference Guide GT-20-394, Rev. VI • Glenair Proprietary Use Only© 2020 Glenair, Inc • 1211 Air Way, Glendale, CA 91201 • 818-247-6000 • www.glenair.com • U.S. CAGE code 06324
TECHNICAL REFERENCE GUIDE GT-20-394 REV. VIInterconnect for Airborne Power Distribution
4. Guidelines
4.1 Voltage
4.1.1 Working Voltage vs Dielectric Withstanding Voltage
When a new opportunity arises, the customer often provides Glenair with the intended operational voltage, or maximum continuous working voltage, of the equipment. For all applications, a certain safety factor is required between equipment operational voltage (OpV) and the proof-test voltage (DWV) of the interconnect. However, the magnitude of this safety factor varies greatly depending on the criticality of the application and operating conditions.
Metaphor: if a lifeline rope needs to support a 200lb human, it would be unsafe to use a rope that has only been proof-tested to 200lb. This would provide no margin for error, nor allow any aging or degradation over time. Instead, it would be best to use a 2000lb proof-tested rope, providing a 10x safety factor to guarantee performance in critical applications. However, if the goal is to hang a 20lb bicycle in a garage, where failure would not lead to loss of life, a 50lb proof-tested rope (2.5x) might be sufficient. Similarly, high safety factors may be used in high-risk interconnect systems where failure could result in loss of life or expensive/impossible repair (nuclear, aviation, sub-sea cables, deep-space satellites, etc), whereas lower safety factors may be used in low-risk applications were failure is trivial and repair is simple (test bench, R&D evaluation).
Since only the customer is fully aware of application-specific conditions, the customer should establish the safety factor required for satisfactory operation. It is then Glenair’s responsibility to provide the proof-test voltage, or dielectric withstanding voltage (DWV), of our products so the customer can make the appropriate selection for their application.
While Glenair cannot make the final determination, there are a few industry guidelines to aid the customer in selecting an appropriate safety factor (ranked from least-conservative to most-conservative at high voltages):
Method 1. DWV = 1.6×(OpV) Use case: short-life, high-density interconnect Source: AFRL AFWAL-TR-82-20572
Method 2. DWV = 2×(OpV) + 1000V Use case: aircraft/industrial power interconnect Source: SAE AS501513; AFRL AFWAL-TR-82-20572
Method 3. DWV = 3×(OpV) Use case: general mil/aero interconnect Source: MIL-DTL-389994
Method 4. DWV = 4×(OpV) Use case: space-flight interconnect Source: NASA EEE-INST-0025

6
6 Technical Reference Guide GT-20-394, Rev. VI • Glenair Proprietary Use Only© 2020 Glenair, Inc • 1211 Air Way, Glendale, CA 91201 • 818-247-6000 • www.glenair.com • U.S. CAGE code 06324
TECHNICAL REFERENCE GUIDE GT-20-394 REV. VIInterconnect for Airborne Power Distribution
For quick reference, using the guidelines above, we find:
Table 1 – Suggested DWV Based on Various Industry StandardsWorking Voltage
(OpV)Suggested Dielectric Withstanding Voltage (DWV)
Method 1 Method 2 Method 3 Method 4250 400 1,500 750 1,000500 800 2,000 1,500 2,000750 1,200 2,500 2,250 3,000
1,000 1,600 3,000 3,000 4,0001,250 2,000 3,500 3,750 5,0001,500 2,400 4,000 4,500 6,0001,750 2,800 4,500 5,250 7,0002,000 3,200 5,000 6,000 8,000
Example: it is common practice for airframe harnesses operating at 115 VAC to be tested at 1500 VAC DWV. This safety factor is closely approximated by Method 2, but not exactly. The above methods are only provided as a guideline, and there is flexibility within those guidelines for the customer to decide what is best for their application.
However, for some critical applications, customer’s require certified voltage ratings for our product. Since operational voltage has a direct effect on long-term reliability, any voltage rating should also include a reliability statement (MTBF or survival probability, see Section 4.1.5). Due to the added risk/responsibility and complex nature of voltage ratings, only certain products (including Glenair Series GHV high-voltage products) should publish voltage ratings in their sales drawing or catalog.
For all applications with working voltages > 1000 V or require certified voltage ratings, consult Glenair High-Voltage Interconnect Solutions Group
4.1.2 Partial Discharge
For more advanced airborne power applications, the interconnect must be designed and tested for partial discharge to help identify any manufacturing defects or design limitations that may affect overall performance and reliability. Partial discharge (PD) is localized breakdown of the insulation system, which does not result in catastrophic failure of the insulation and does not completely bridge the insulation between conductors. Simply, PD is small yet measurable micro-failures that leave the insulation intact, but overtime will age the insulation and reduce the life of the interconnect.
Metaphor: for a fibrous load-bearing rope, when the load is near breaking strength, individual fibers may fail. Initially, loss of one or two fibers would be negligible, and the rope would continue to support the load. However, over time, as more fibers fail the accumulative effect would eventually compromise the integrity of the rope, and total failure would occur. Similarly, individual partial discharges do not cause immediate failure, but will erode the insulation and eventually lead to failure.
There are several types of partial discharge to consider:
• Void Discharge – partial discharges that occur in air voids within an insulation system. The voids can be created either by defect (air bubble in potting or molded insulator) or by design (clearance zone between
7
7Technical Reference Guide GT-20-394, Rev. VI • Glenair Proprietary Use Only© 2020 Glenair, Inc • 1211 Air Way, Glendale, CA 91201 • 818-247-6000 • www.glenair.com • U.S. CAGE code 06324
TECHNICAL REFERENCE GUIDE GT-20-394 REV. VIInterconnect for Airborne Power Distribution
contact and insulator cavity). Internal discharges ionize the air, creating byproducts (such as ozone) and release energy (UV), which cause chemical breakdown of the insulator.
• Surface Discharge – partial discharges on the surface of an insulator. Naturally occurring contaminants deposited on the surface of an insulator create a conductive path. Upon conduction, the insulator carbonizes (or “burns”), creating a permanently conductive path.
• Corona Discharge – partial discharges which occur in air when the electric field created by a high-voltage conductor is higher than the strength of air. Similar to void discharges, corona discharge creates byproducts (such as ozone) and release energy (UV), which cause chemical breakdown of nearby insulators.
• Treeing – a secondary effect of internal discharges created by void discharge, conductive impurities or defects, which lead to damage of the insulation (similar to surface discharges, but internal to the insulator). As treeing progresses, a branched network of conductive paths is permanently created within the insulation.
Partial discharge testing can be an essential performance requirement for some applications, while totally unnecessary for other applications. As general guidance, Glenair recommends:
• OpV < 327 VDC (232 VAC) PD test is generally not required; PD unlikely if working voltage is below the breakdown strength of air (Paschen’s minimum)
• OpV > 327 VDC (232 VAC), PD test is not required, but may be OpV < 1400 VDC (2000 VAC) necessary for high-reliability applications or high-sensitivity applications
• OpV > 1400 VDC (2000 VAC) PD test is highly recommended for all applications
The above values assume sea-level operation and will be reduced with elevated operational altitude.
When evaluating an interconnect product, there are two primary ways to characterize partial discharge performance:
• Partial Discharge Inception Voltage (PDIV), Partial Discharge Extinction Voltage (PDEV) – the voltage at which an interconnect begins (PDIV) and ceases (PDEV) to experience discharges above a predetermined discharge threshold (pC)
• Partial Discharge Magnitude at a Specified Voltage – the total quantity of discharges or discharge energy permitted at some predetermined voltage over a predetermined time interval
8
8 Technical Reference Guide GT-20-394, Rev. VI • Glenair Proprietary Use Only© 2020 Glenair, Inc • 1211 Air Way, Glendale, CA 91201 • 818-247-6000 • www.glenair.com • U.S. CAGE code 06324
TECHNICAL REFERENCE GUIDE GT-20-394 REV. VIInterconnect for Airborne Power Distribution
In addition to derating from DWV to determine a safe working voltage, partial discharge may also be used:
Method A. PDEV > 1.2×(OpV) Source: IEC 60664-16
Method B. PD < 5 pC at 1.73×(OpV) Source: IEC 60092-3507
For all applications with Partial Discharge requirements, consult Glenair High-Voltage Interconnect Solutions Group
4.1.3 Altitude Effects
When discussing interconnect insulation, typically only the solid components (rigid insulators, interfacial seals, wire sealing grommet, and wire insulation) are considered. However, the gas or vacuum naturally filling the voids between solid components also plays a role in the insulation system, and therefore is considered an insulating “component” in insulation analysis.
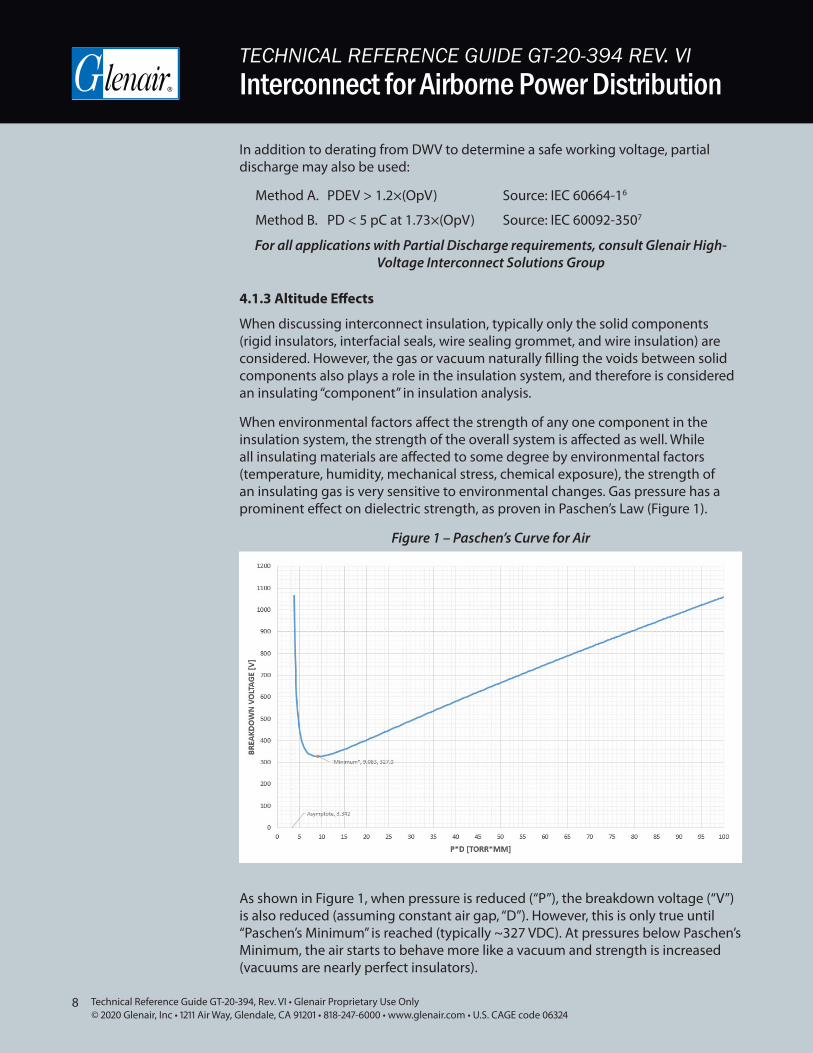
When environmental factors affect the strength of any one component in the insulation system, the strength of the overall system is affected as well. While all insulating materials are affected to some degree by environmental factors (temperature, humidity, mechanical stress, chemical exposure), the strength of an insulating gas is very sensitive to environmental changes. Gas pressure has a prominent effect on dielectric strength, as proven in Paschen’s Law (Figure 1).
Figure 1 – Paschen’s Curve for Air
As shown in Figure 1, when pressure is reduced (“P”), the breakdown voltage (“V”) is also reduced (assuming constant air gap, “D”). However, this is only true until “Paschen’s Minimum” is reached (typically ~327 VDC). At pressures below Paschen’s Minimum, the air starts to behave more like a vacuum and strength is increased (vacuums are nearly perfect insulators).

9
9Technical Reference Guide GT-20-394, Rev. VI • Glenair Proprietary Use Only© 2020 Glenair, Inc • 1211 Air Way, Glendale, CA 91201 • 818-247-6000 • www.glenair.com • U.S. CAGE code 06324
TECHNICAL REFERENCE GUIDE GT-20-394 REV. VIInterconnect for Airborne Power Distribution
Figure 2 - Breakdown Voltage for a .100” Gap at High Altitude
When an interconnect is used in applications at high altitudes, ambient pressure is reduced. Unless the insulation system is hermetically sealed, the pressure of the insulating air is reduced as well. As the insulating air loses pressure, it also loses strength, and weakens the overall insulation system. Therefore, interconnect products perform best at sea-level, and must be derated for high-altitude applications.
While altitude derating can be estimated mathematically (≈e-(A/38200), where A = altitude in feet; ref: IEC 60071-216, simplified ), the best way to assure performance at elevated altitude is through test. For some interconnect families , qualification test plans include DWV testing at altitude (MIL-DTL-389994, for example).
For all applications with high-altitude requirements and no prior test data, consult Glenair High-Voltage Interconnect Solutions Group
4.1.4 Frequency Effects
Airborne power distribution systems use a wide range of frequencies for various applications. Battery banks provide DC power. In more-electric aircraft (MEA), generators produce power at 400 Hz AC. In all-electric aircraft (AEA), variable-frequency drives (VFD) powering electric motors produce fundamental frequencies from 1 kHz to 4 kHz, using pulse-width modulated (PWM) switching frequencies up to 30 kHz .
Due to several physical phenomena, including dielectric heating and ion accumulation, source frequency affects the dielectric strength of the insulation. Simply, high frequency loads put additional stress on the insulation, leading to lower breakdown voltages. While most materials degrade with increased frequency, the sensitivity and degree of degradation vary between materials. Take, for example, XLPE (a common insulating material in high-voltage cables):

10
10 Technical Reference Guide GT-20-394, Rev. VI • Glenair Proprietary Use Only© 2020 Glenair, Inc • 1211 Air Way, Glendale, CA 91201 • 818-247-6000 • www.glenair.com • U.S. CAGE code 06324
TECHNICAL REFERENCE GUIDE GT-20-394 REV. VIInterconnect for Airborne Power Distribution
Table 2 – XLPE Breakdown Voltage at Various Source Frequencies
Source FrequencyBreakdown Strength
(kVRMS/mm)Relative Change
(vs 50 Hz)DC 438.4 ↑ 406.06%
50 Hz 86.63 -300 Hz 74.95 ↓ 13.49%500 Hz 73.02 ↓ 15.71%1000 Hz 64.48 ↓ 25.57%1500 Hz 57.36 ↓ 33.79%2000 Hz 56.87 ↓ 34.35%2500 Hz 51.96 ↓ 40.02%
Source: “The Effect of Frequency on The Dielectric Breakdown of Insulation Materials in HV Cable Systems.”8 Jiayang Wu, Huifei Jin, Armando Rodrigo Mor, Johan Smit; Delft University of Technology; 2017
While source frequency affects intrinsic strength of the material, it is unfortunately uncommon to perform any electrical tests using frequencies other than 60 Hz. Raw material suppliers prepare datasheets testing dielectric strength at 60 Hz in accordance with ASTM D-1499. Similarly, interconnect manufacturers perform DWV at 60 Hz in accordance with EIA-364-2010.
Fortunately, however, testing only at 60 Hz is a satisfactory approximation of performance for many applications.
Example: when using interconnect products in DC applications, typically AC test voltages are converted to DC voltages, where VDCPeak = √2×(VACRMS) = ~1.414×(VACRMS). In these instances, the interconnect is substantially over-engineered for the application since DC dielectric performance is typically much greater than 1.4x VACRMS performance. For example, this methodology for XLPE (Table 2) would estimate DCPeak performance at √2×(86.63) = 122.5 kV/mm, where actual DC test strength is 438.4 kV/mm, thus underestimating actual performance by -72%.
When used for MEA applications up to 400 Hz, the interconnect would suffer a marginal performance loss. However, all interconnect products are designed into applications with an inherent safety factor (see Section 4.1.1), and this marginal loss in performance at 400 Hz is absorbed into the safety margin. For example, if an interconnect utilizing XLPE is designed in assuming DWV50 Hz = 3×(OpV400 Hz) (per MIL-DTL-389994), and suffers a ~14.6% (Table II, interpolation) loss in strength at the operational 400 Hz, the actual safety factor would reduce from 3x to ~2.56x.While lower than intended, it is unlikely to have a meaningful impact on overall performance and reliability
However, for AEA applications operating at substantially higher frequencies, ignoring frequency derating could have dire consequences on performance and reliability. Similarly, using DC-rated products in AC applications is not recommended, unless prior testing has been conducted to verify performance.
For all applications requiring optimized DC performance or frequencies >400Hz, consult Glenair High-Voltage Interconnect Solutions Group

11
11Technical Reference Guide GT-20-394, Rev. VI • Glenair Proprietary Use Only© 2020 Glenair, Inc • 1211 Air Way, Glendale, CA 91201 • 818-247-6000 • www.glenair.com • U.S. CAGE code 06324
TECHNICAL REFERENCE GUIDE GT-20-394 REV. VIInterconnect for Airborne Power Distribution
4.1.5 Reliability
For airborne power distribution systems, the required interconnect reliability is dependent on application criticality and intended service schedule.
For example, the power system for the in-flight entertainment system is far less critical than the electric motor supply cables for all-electric aircraft (AEA); failure of the in-flight entertainment system may lead to boredom, whereas failure of the propulsion system may lead to death. Accordingly, the power cables for propulsion are expected to be far more reliable than for entertainment.
Similarly, service schedule determines reliability. For space applications, service may be impossible, and the interconnect must last the entire system life. For subsea cables, 30 years between service may be expected. For aircraft line-replaceable units (LRU), 5 to 10 years between service may be acceptable. Simply, the longer the interconnect is expected to survive, the more reliable it must be at initial installation.
In industry, there are different ways to quantify reliability:
Method A. MTBF, or MTTF Mean Time Between Failure (repairable assembly), or Mean Time to Failure (non-repairable assembly); the predicted average time elapsed until an assembly fails under normal operation, usually expressed in hours
Method B. λ, or FIT Failure Rate (failures per year), or Failures In Time (failures per 1 billion hours); the number of failures predicted to occur during normal operation over a specific period
Method C. Ps(t) Probability of Survival; the probability (%) that any assembly will function properly after a specified time interval (t) of normal operation
In application, there are several environmental factors that may affect long-term reliability of the interconnect. Aging factors, and their relationship to reliability, include:
• Temperature Increased temperature = decreased life/reliability• Humidity Increased humidity = decreased life/reliability• Mechanical Stress (vibe, shock) Increased stress = decreased life/reliability• Chemical Exposure (corrosion) Increased exposure = decreased life/reliability• Voltage Increased voltage = decreased life/reliability• Source Frequency Increased frequency = decreased life/reliability• Partial Discharge Increased PD = decreased life/reliability
12
12 Technical Reference Guide GT-20-394, Rev. VI • Glenair Proprietary Use Only© 2020 Glenair, Inc • 1211 Air Way, Glendale, CA 91201 • 818-247-6000 • www.glenair.com • U.S. CAGE code 06324
TECHNICAL REFERENCE GUIDE GT-20-394 REV. VIInterconnect for Airborne Power Distribution
While MIL-HDBK-21711 offers crude methods to estimate interconnect reliability, it should not be depended upon for analysis where interconnect reliability is critical. Instead, reliability testing should be included in qualification of the final assembly.
While several methods of reliability testing exist, they all make one basic assumption: test to failure using imposed stresses higher than expected in normal operation, then using physics and statistics, extrapolate to predict failure under normal operation.
Because of this universal basic assumption, there are two common truths that lead to the confidence in the prediction: testing more samples will increase confidence by proving consistency; and reducing test stress will reduce degree of extrapolation and more closely replicate normal operation.
However, increasing the number of samples tested will increase cost and lead-time of reliability test qualification. Reducing test stress levels will also lead to longer test times, increasing both cost and time to perform reliability test qualification. This tradeoff between time/financial cost and confidence in results is known as the “cost of confidence.” Designing the right test plan is both an engineering and program management decision.
For all applications requiring long-term performance reliability, consult Glenair High-Voltage Interconnect Solutions Group
4.2 Current
4.2.1 Current Rating
When electrical current travels across a conductor, inefficiencies and resistance in the conductor cause some of the electrical power to convert into heat. This can be seen in the glowing filament of an incandescent lightbulb or the red-hot coils in a toaster oven. The total heat produced is dependent on the current moving across the conductor (measured in amps, “A”) and the inefficiency of the conductor (or resistance, measured in Ohms, Ω).
For any given conductor, as more current is applied, more energy is converted into heat. The heat generated causes the conductor to reach temperatures above ambient, a process known as “temperature rise.”
For any given current, less efficient (or more resistive) conductors will lose more energy to heat, and experience greater temperature rise. Large conductors (measured in “gauge,” typically American Wire Gauge or “AWG” in North America) have more material to conduct the current, and therefore lower resistances. Similarly, different conductor materials have inherently lower resistances (copper versus aluminum, for example).
13
13Technical Reference Guide GT-20-394, Rev. VI • Glenair Proprietary Use Only© 2020 Glenair, Inc • 1211 Air Way, Glendale, CA 91201 • 818-247-6000 • www.glenair.com • U.S. CAGE code 06324
TECHNICAL REFERENCE GUIDE GT-20-394 REV. VIInterconnect for Airborne Power Distribution
The lower the resistance, the lower the temperature rise. By extension, the lower the resistance, the greater the allowable current for a specified allowable temperature rise. This is the foundation for current rating.
For any given conductor and current, the temperature rise is a balance between heat produced and heat lost through conduction or convection. In land and sea applications, the conductors will often be buried underground or submerged in cold water. In these instances, the surrounding media will act as a vast heat sink, pulling heat away from the conductor, keeping the temperature rise low as current increases. For airborne applications, low-density, high-altitude air is a very poor coolant, keeping more heat in the conductor and leading to higher temperature rise. As a result, current ratings for airborne interconnect products are generally lower than current ratings for land and sea interconnect products, even if the underlying interconnect is essentially identical.
Metaphor: it is common knowledge, “water feels colder than air.” 60°F air would feel like a nice fall afternoon. However, 60°F water would lead to hypothermia within an hour. Compared to air, water has a high heat capacity and conductivity. Water can pull heat from the human body faster than metabolically produced, resulting in reduced body temperature. Similarly, water effectively pulls heat from conductors, allowing higher currents to be obtained while maintaining a low temperature rise.
In airborne power distribution systems, there are practical limitations to the maximum temperature rise. Most electrical interconnects are only rated to 200°C, some a bit higher (230-260°C), some a bit lower (150-175°C). Often the electrical equipment utilizing the interconnect could have an even lower temperature rating. Also, ambient temperature will vary between applications, depending on location within the aircraft and proximity to other equipment. The difference between the maximum permissible temperature of the interconnect and the ambient temperature is the maximum allowable temperature rise.
Application conditions dictate maximum allowable temperature rise, and by extension the maximum current permissible on any given conductor. Since these conditions vary greatly, it is difficult to discuss relative performance of conductors. For this reason, a common standard is needed to determine relative performance between conductors.

14
14 Technical Reference Guide GT-20-394, Rev. VI • Glenair Proprietary Use Only© 2020 Glenair, Inc • 1211 Air Way, Glendale, CA 91201 • 818-247-6000 • www.glenair.com • U.S. CAGE code 06324
TECHNICAL REFERENCE GUIDE GT-20-394 REV. VIInterconnect for Airborne Power Distribution
To satisfy this need, different industries have settled on different standard assumptions to evaluate the current rating of wire.
• SAE AS508811 Ambient temperature of 70°C, 33 or more electrical wires for sizes 26 through 10 and 9 electrical wires for size 8 and larger, carrying 20% or less of rated harness or harness branch current and operating at an altitude of 60,000 feet
• MIL-STD-97512 and Ambient temperature of 70°C, 200°C EEE-INST-0025 wire rating, single conductor, 10-6 torr vacuum
• NASA TM 10217913 Various conditions: 72°F/14.7 psi, 72°F/10-6 torr, 200°F/10-6 torr, 200°C wire rating, single conductor
• NEC 31014 Ambient temperature of 30°C, not more than 3 current-carrying conductors in a raceway, cable, or earth
• AS3902915 (contacts) Ambient temperature of 25°C / 125°C / 200°C, single conductor, based on voltage drop (not temperature rise)
In addition to various industry standards, manufacturers will often adopt their own standards attempting to rival competition. Simply by increasing the assumed allowable temperature rise, a manufacturer could advertise higher current ratings for a technically inferior product. The only way to properly compare products is to evaluate with all derating factors being equal: temperature rise, number of conductors, operating altitude, and source frequency.

15
15Technical Reference Guide GT-20-394, Rev. VI • Glenair Proprietary Use Only© 2020 Glenair, Inc • 1211 Air Way, Glendale, CA 91201 • 818-247-6000 • www.glenair.com • U.S. CAGE code 06324
TECHNICAL REFERENCE GUIDE GT-20-394 REV. VIInterconnect for Airborne Power Distribution
4.2.2 Current Derating
With baseline current rating established by allowable temperature rise under ideal conditions, conductor performance can then be derated to estimate performance in actual applications.
As discussed in the previous section, the first derating element is allowable temperature rise, determined by the difference between ambient temperature and maximum allowable temperature of the interconnect. Since temperature rise under load will vary based on gauge, conductor material, and insulation, it is best to evaluate the temperature rise data for the unique assembly. However, SAE AS508811 provides a conservative estimate to be used as a universal reference point (see Figure 2).
Figure 3 – Temperature Rise for Copper Wire Under Load
Source: Figure 3, “Single Copper Wire in Free Air,” SAE AS508811; 2015

16
16 Technical Reference Guide GT-20-394, Rev. VI • Glenair Proprietary Use Only© 2020 Glenair, Inc • 1211 Air Way, Glendale, CA 91201 • 818-247-6000 • www.glenair.com • U.S. CAGE code 06324
TECHNICAL REFERENCE GUIDE GT-20-394 REV. VIInterconnect for Airborne Power Distribution
The second primary derating factor is the number of wires in a harness bundle. A single wire can freely dissipate heat through convection since all outer surfaces are exposed to ambient air. However, as additional wires are added to a bundle, wire surfaces are in contact with each other and therefore lose the ability to dissipate heat. This is especially true for wires at the center of a large bundle. Since the wires are no longer able to dissipate heat efficiently, the current must be limited to reduce heat produced. The offset of heat produced versus heat dissipated will ensure the temperature rise does not exceed maximum allowable. While “bundle derating” is ideally evaluated for the unique assembly, again AS508811 provides a conservative estimate to be used as a universal reference point (see Figure 3).
Figure 4 – Bundle Derating Factor
Source: Figure 4, “Bundle Derating Curves,” SAE AS508811; 2015

17
17Technical Reference Guide GT-20-394, Rev. VI • Glenair Proprietary Use Only© 2020 Glenair, Inc • 1211 Air Way, Glendale, CA 91201 • 818-247-6000 • www.glenair.com • U.S. CAGE code 06324
TECHNICAL REFERENCE GUIDE GT-20-394 REV. VIInterconnect for Airborne Power Distribution
The third primary derating factor is altitude. At sea-level (standard pressure), air is dense and able to convect substantial heat away from the wire. However, at high altitudes (low pressure), air density is reduced. Reduced air density means there are fewer air molecules available (per unit volume) to convect heat away from the wire. Since the air is no longer able to convect heat as efficiently, the current must be limited to reduce heat produced. The offset of heat produced versus heat dissipated will ensure the temperature rise does not exceed maximum allowable. While “altitude derating” is ideally evaluated for the unique assembly, again AS508811 provides a conservative estimate to be used as a universal reference point (See Figure 4).
Figure 5 – Altitude Derating Factor
Source: Figure 5, “Altitude Derating Curve” SAE AS508811; 2015
The fourth primary derating factor is source frequency. However, “frequency derating” is not readily defined by common industry specifications and requires extensive engineering analysis. For more information, please see the next section (4.2.3 Frequency Effects).
As with all current rating and derating factors, there are several industry standards to provide general guidance; SAE AS508811 is the most prominent standard used in airborne power distribution. However, these specifications should not be taken as absolute, and Glenair engineering should evaluate performance for each unique application.
For all applications requiring current rating/derating, consult Glenair High-Voltage Interconnect Solutions Group

18
18 Technical Reference Guide GT-20-394, Rev. VI • Glenair Proprietary Use Only© 2020 Glenair, Inc • 1211 Air Way, Glendale, CA 91201 • 818-247-6000 • www.glenair.com • U.S. CAGE code 06324
TECHNICAL REFERENCE GUIDE GT-20-394 REV. VIInterconnect for Airborne Power Distribution
4.2.3 Frequency Effects
As stated, the fourth primary derating factor is source frequency. In an AC system, the current alternates direction along the conductor. When current travels one direction, a magnetic field is generated which supports the current flow through inductance. As current reverses, the magnetic field collapses, and the inductance opposes the current reversal. This is known as counter-electromotive force (CEMF), or “back EMF.”
The CEMF is strongest at the core of the conductor, leaving the outer surface less effected and more available to conduct the source current. The “skin effect” is where AC current tends to only conduct on the outer surface of the conductor, leaving the core useless. At higher frequencies, the period of reversal is reduced, and CEMF has less time to dissipate. As a result, higher frequencies lead to more core left unutilized, pushing more current to the outer surface. We can calculate the “skin thickness” (δ) to estimate how much of the conductor is utilized. If the skin thickness is greater than the conductor radius, then we would expect the conductor to be fully utilized. However, if the skin thickness is less than the conductor radius, we would expect core loss.
Table 3 – Conductor Percent Utilization due to Skin Effect at High FrequencyConductor Source Frequency (Skin Thickness, inch)
AWG Radius50 Hz
(0.372)400 Hz(0.131)
1000 Hz(0.083)
1500 Hz(0.068)
2000 Hz(0.059)
2500 Hz(0.053)
8 0.064 100% 100% 100% 100% 99% 97%4 0.102 100% 100% 97% 89% 82% 76%2 0.129 100% 100% 87% 78% 70% 65%
1/0 0.162 100% 96% 76% 66% 59% 54%2/0 0.182 100% 92% 70% 61% 54% 49%4/0 0.230 100% 82% 59% 50% 45% 41%
Calculated estimates for copper (ρ = 1.72×10⁻⁸ Ω-m, α = 4.29×10⁻³ °C-1) at 25°C
As shown in Table 3, standard power frequency (50 Hz) will utilize 100% of all conductors up to 4/0. However, 400 Hz MEA power will only utilize 100% of conductors up to 2AWG, suffering loss on larger conductors. For AEA applications with high frequency and shallow skin depth, the alternating current will utilize only a small portion of large conductors. With the current only traveling across a small percentage of the conductor, conductor efficiency is lost, and conductor performance may be estimated using an elevated current at lower frequency.
As a result, engineering must analyze any application where the conductor may experience skin effect loss to better estimate current rating and temperature rise. Alternatively, there is specialized “Litz” and “semi-Litz” wires developed to remedy skin effect losses, but these wires require special tooling and processing. Another design approach is to utilize a cluster of standard small gauge wires that would not suffer skin effect loss for the application source frequency.
For all applications requiring source frequencies >400 Hz, consult Glenair High-Voltage Interconnect Solutions Group
19
19Technical Reference Guide GT-20-394, Rev. VI • Glenair Proprietary Use Only© 2020 Glenair, Inc • 1211 Air Way, Glendale, CA 91201 • 818-247-6000 • www.glenair.com • U.S. CAGE code 06324
TECHNICAL REFERENCE GUIDE GT-20-394 REV. VIInterconnect for Airborne Power Distribution
5. References
1. SAE AS50881o Wiring Aerospace Vehicle
2. AFRL AFWAL-TR-82-2057o HIGH VOLTAGE DESIGN GUIDE: AIRCRAFT
3. SAE AS50151o Connectors, Electrical, Circular Threaded, AN Type, General Specification For
4. MIL-DTL-38999o CONNECTORS, ELECTRICAL, CIRCULAR, MINIATURE, HIGH DENSITY, QUICK DISCONNECT
(BAYONET, THREADED OR BREECH COUPLING), ENVIRONMENT RESISTANT WITH CRIMP REMOVABLE CONTACTS OR HERMETICALLY SEALED WITH FIXED, SOLDERABLE CONTACTS, GENERAL SPECIFICATION FOR
5. NASA EEE-INST-002o Instructions for EEE Parts Selection, Screening, Qualification, and Derating
6. IEC 60664-1o Insulation coordination for equipment within low-voltage systems – Part 1: Principles,
requirements and tests
7. IEC 60092-350o Electrical Installations in Ships – Part 350: General Construction and Test Methods of Power,
Control, and Instrumentation Cables for Shipboard and Offshore Applications
8. “The Effect of Frequency on The Dielectric Breakdown of Insulation Materials in HV Cable Systems.”o Jiayang Wu, Huifei Jin, Armando Rodrigo Mor, Johan Smit; Delft University of Technology; 2017
9. ASTM D-149o Standard Test Method for Dielectric Breakdown Voltage and Dielectric Strength of Solid
Electrical Insulating Materials at Commercial Power Frequencies
10. EIA-364-20o Dielectric Withstanding Voltage Test Procedure for Electrical Connectors, Sockets and Coaxial
Contacts
11. MIL-HDBK-217o MILITARY HANDBOOK: RELIABILITY PREDICTION OF ELECTRONIC EQUIPMENT
12. MIL-STD-975o NASA STANDARD ELECTRICAL,ELECTRONIC,AND ELECTROMECHANICAL (EEE) PARTS LIST
13. NASA Technical Memorandum 102179o Selection of Wires and Circuit Protective Devices for STS Orbiter Vehicle Payload Electrical
Circuits
14. NEC Article 310o Conductors for General Wiring
15. SAE AS39029o Contacts, Electrical Connector, General Specification For
16. IEC 60071-2o Insulation co-ordination - Part 2: Application guidelines

20
Glenair, Inc.1211 Air Way • Glendale, California • 91201-2497
Telephone: 818-247-6000 • Fax: 818-500-9912 • [email protected]
Telephone:+44-1623-638100
Facsimile:+44-1623-638111
Glenair UK Ltd40 Lower Oakham WayOakham Business ParkMansfield, Notts NG18 5BY England
Telephone:06172 / 68 16 0
Facsimile:06172 / 68 16 [email protected]
Glenair GmbHSchaberweg 2861348 Bad HomburgGermany
Telephone:+33-5-34-40-97-40
Facsimile:+33-5-61-47-86-10
Glenair France SARL7, Avenue ParmentierImmeuble Central Parc #231200 ToulouseFrance
Telephone:847-679-8833
Facsimile:847-679-8849
Glenair Microway Systems7000 North Lawndale AvenueLincolnwood, IL60712
Telephone:[email protected]
Glenair Nordic ABGustav III : S Boulevard 42SE-169 27 SolnaSweden
© 2020 Glenair, Inc. Printed in U.S.A.
GT-20-394 Rev. VI
Telephone:+34-925-89-29-88
Facsimile:+34-925-89-29-87
Glenair IbericaC/ La Vega, 1645612 VeladaSpain
Telephone:203-741-1115
Facsimile:203-741-0053
Glenair East20 Sterling DriveWallingford, CT 06492
Telephone: +39-051-782811
Facsimile:+39-051-782259
Telephone: +82-31-8068-1090
Facsimile:+82-31-8068-1092
Glenair Italia S.p.A.Via Del Lavoro, 7 40057 Quarto Inferiore – Granarolo dell’EmiliaBologna, Italy
Glenair Korea B-1304 Gunpo IT Valley 148 Gosan-Ro, Gunpo-Si Kyunggi-Do, Korea435-733
INTERCONNECT SOLUTIONS
MISSION-CRITICAL