intercontinental journal of human … ambal auto, coimbatore dr.s.m.yamuna assistant professor,...
TRANSCRIPT

www.icm
rr.or
g
83
Volume 1, Issue 8 (October, 2013)
INTERCONTINENTAL JOURNAL OF HUMAN RESOURCE RESEARCH REVIEW
Pee
r R
evie
wed
Jo
urn
al o
f In
ter-
Co
nti
nen
tal M
anag
emen
t R
esea
rch
Co
nso
rtiu
m
htt
p:/
/ww
w.ic
mrr
.org
A STUDY ON EMPLOYEE MOTIVATION WITH SPECIAL REFERENCE
TO AMBAL AUTO, COIMBATORE
Dr.S.M.YAMUNA
Assistant Professor, Department of Commerce, PSG College of Arts and Science, Coimbatore
ABSTRACT
Employees were considered just another input into the production of goods and services but they
are the backbone of the organization. This is a research motivational study which focus can have an
effect on the output of the business and concerns both quantity and quality. See it this way: the business
relies heavily on the efficiency of the production staff to make sure that products are manufactured in
numbers that meet demand for the week. If these employees lack the motivation to produce completed
products to meet the demand, then a problem leading to disastrous consequences are faced. The number
of scenarios is extreme but this is the general picture. Employees are the greatest asset and no matter how
efficient the technology and equipment may be, it is no match for the effectiveness and efficiency of the
staff. Motivation requires a delicate balance of communication, structure, and incentives.
Key words: Motivation, Communication, Incentives
INTRODUCTION TO MOTIVATION
At one time, employees were considered just another input into the production of goods and
services. What perhaps changed this way of thinking about employees was research, referred to as the
Hawthorne Studies, conducted by Elton Mayo from 1924 to 1932. This study found employees are not
motivated solely by money and employee behavior is linked to their attitudes. The Hawthorne Studies
began the human relations approach to management, whereby the needs and motivation of employees
become the primary focus of managers. It is the business owner who must initiate motivation as a strategy
to attain corporate goals. Motivation is operationally defined as the inner force that drives individuals to
accomplish personal and organizational goals. Motivation is the force that makes us do things: this is a
result of our individual needs being satisfied (or met) so that we have inspiration to complete the task.
These needs vary from person to person as everybody has their individual needs to motivate themselves.
Depending on how motivated we are, it may further determine the effort we put into our work and
therefore increase the standard of the output.
When we suggest factors (or needs) that determine the motivation of employees in the workplace,
almost everyone would immediately think of a high salary. This answer is correct for the reason that some
employees will be motivated by money, but mostly wrong for the reason that it does not satisfy others (to
a lasting degree). This supports the statement that human motivation is a personal characteristic, and not a
one fits all option.
To improve staff satisfaction levels
To enhance customer service
To increase turnover and profits
ISSN: 2320-9704- Online ISSN:2347-1662-Print
www.icm
rr.or
g
84
Volume 1, Issue 8 (October, 2013)
INTERCONTINENTAL JOURNAL OF HUMAN RESOURCE RESEARCH REVIEW
Pee
r R
evie
wed
Jo
urn
al o
f In
ter-
Co
nti
nen
tal M
anag
emen
t R
esea
rch
Co
nso
rtiu
m
htt
p:/
/ww
w.ic
mrr
.org
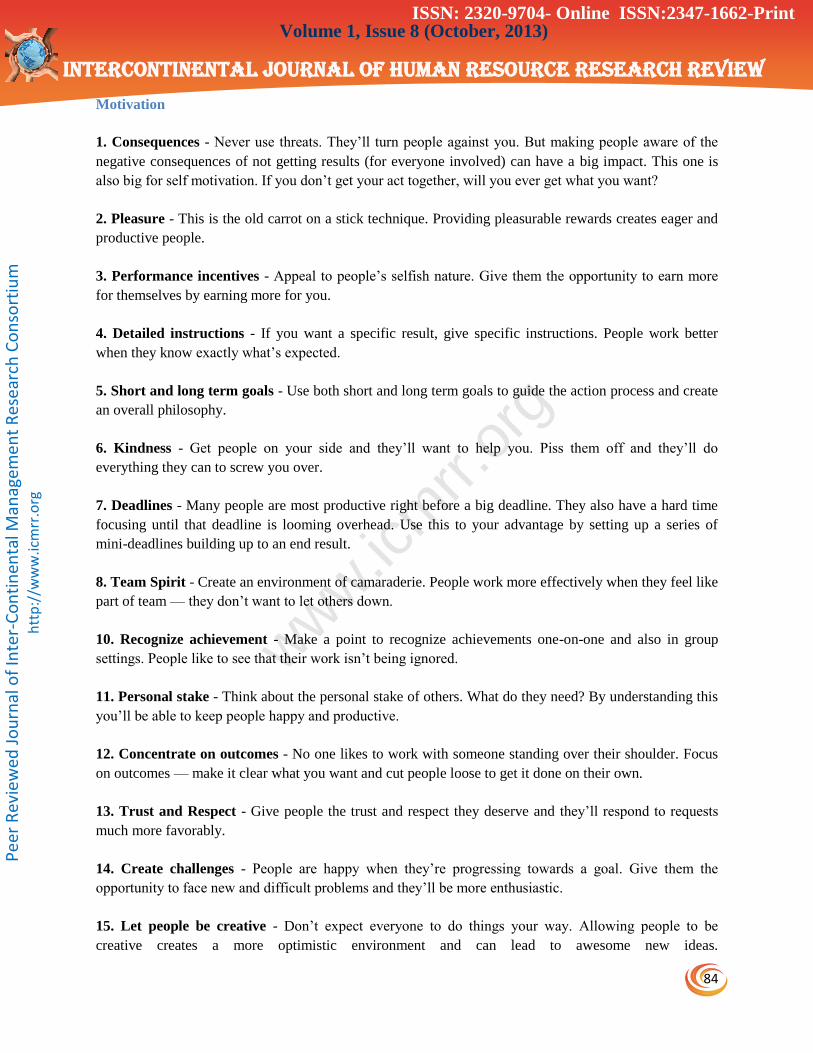
Motivation
1. Consequences - Never use threats. They’ll turn people against you. But making people aware of the
negative consequences of not getting results (for everyone involved) can have a big impact. This one is
also big for self motivation. If you don’t get your act together, will you ever get what you want?
2. Pleasure - This is the old carrot on a stick technique. Providing pleasurable rewards creates eager and
productive people.
3. Performance incentives - Appeal to people’s selfish nature. Give them the opportunity to earn more
for themselves by earning more for you.
4. Detailed instructions - If you want a specific result, give specific instructions. People work better
when they know exactly what’s expected.
5. Short and long term goals - Use both short and long term goals to guide the action process and create
an overall philosophy.
6. Kindness - Get people on your side and they’ll want to help you. Piss them off and they’ll do
everything they can to screw you over.
7. Deadlines - Many people are most productive right before a big deadline. They also have a hard time
focusing until that deadline is looming overhead. Use this to your advantage by setting up a series of
mini-deadlines building up to an end result.
8. Team Spirit - Create an environment of camaraderie. People work more effectively when they feel like
part of team — they don’t want to let others down.
10. Recognize achievement - Make a point to recognize achievements one-on-one and also in group
settings. People like to see that their work isn’t being ignored.
11. Personal stake - Think about the personal stake of others. What do they need? By understanding this
you’ll be able to keep people happy and productive.
12. Concentrate on outcomes - No one likes to work with someone standing over their shoulder. Focus
on outcomes — make it clear what you want and cut people loose to get it done on their own.
13. Trust and Respect - Give people the trust and respect they deserve and they’ll respond to requests
much more favorably.
14. Create challenges - People are happy when they’re progressing towards a goal. Give them the
opportunity to face new and difficult problems and they’ll be more enthusiastic.
15. Let people be creative - Don’t expect everyone to do things your way. Allowing people to be
creative creates a more optimistic environment and can lead to awesome new ideas.
ISSN: 2320-9704- Online ISSN:2347-1662-Print

www.icm
rr.or
g
85
Volume 1, Issue 8 (October, 2013)
INTERCONTINENTAL JOURNAL OF HUMAN RESOURCE RESEARCH REVIEW
Pee
r R
evie
wed
Jo
urn
al o
f In
ter-
Co
nti
nen
tal M
anag
emen
t R
esea
rch
Co
nso
rtiu
m
htt
p:/
/ww
w.ic
mrr
.org
16. Constructive criticism - Often people don’t realize what they’re doing wrong. Let them know. Most
people want to improve and will make an effort once they know how to do it.
17. Demand improvement - Don’t let people stagnate. Each time someone advances raise the bar a little
higher (especially for yourself).
18. Make it fun - Work is most enjoyable when it doesn’t feel like work at all. Let people have fun and
the positive environment will lead to better results.
19. Create opportunities - Give people the opportunity to advance. Let them know that hard work will
pay off.
20. Communication - Keep the communication channels open. By being aware of potential problems
you can fix them before a serious dispute arises.
21. Make it stimulating - Mix it up. Don’t ask people to do the same boring tasks all the time. A
stimulating environment creates enthusiasm and the opportunity for “big picture” thinking
The Role of Motivation
To survive we need motivated employees. Motivated employees are needed in our rapidly
changing workplaces. Motivated employees help organizations survive. Motivated employees are more
productive. To be effective, managers need to understand what motivates employees within the context of
the roles they perform. Of all the functions a manager performs, motivating employees is arguably the
most complex. This is due, in part, to the fact that what motivates employees changes constantly. For
example, research suggests that as employees' income increases, money becomes less of a motivator.
Also, as employees get older, interesting work becomes more of a motivator.
The ranked order of motivating factors are: (a) interesting work, (b) good wages, (c) full
appreciation of work done, (d) job security, (e) good working conditions, (f) promotions and growth in
the organization, (g) feeling of being in on things, (h) personal loyalty to employees, (i) tactful discipline,
and (j) sympathetic help with personal problems.
COMPANY PROFILE
Ambal Automobiles is an authorized MARUTI dealer for Coimbatore, Niligiris, Erode and
Namakkal districts and one of the leading automobile dealers in South India started in the year
1998Ambal Auto over the years has gained confidence of its customers and Maruti. It has the reputation
of an automobile dealer with high level of customer orientation towards attaining customer satisfaction.
Ambal Auto Commitments to services have gained an CERTIFICATION FOR QUALITY AND CAR
CARE - ISO 9002. The company has 30000 plus customers , three new car showrooms , two pre-owned
cars showroom(True Value), five workshops, two body repair workshops well manned by over 400 plus
trained manpower.
ISSN: 2320-9704- Online ISSN:2347-1662-Print

www.icm
rr.or
g
86
Volume 1, Issue 8 (October, 2013)
INTERCONTINENTAL JOURNAL OF HUMAN RESOURCE RESEARCH REVIEW
Pee
r R
evie
wed
Jo
urn
al o
f In
ter-
Co
nti
nen
tal M
anag
emen
t R
esea
rch
Co
nso
rtiu
m
htt
p:/
/ww
w.ic
mrr
.org
For the customers convenience Ambal Auto carries the following services:
Maruti Finance
Maruti Insurance
Maruti True Value
After sales service and workshop
Body shop
Spares (Arts division)
Training centre division
Customer care system
Other facilities
OBJECTIVES OF THE STUDY
To find out the major factors which motivate the employee to perform better.
To identify the various issues which are demotivating factors regarding any staff member.
To find out the most important issues which contribute towards increasing efficiency.
To offer some suggestions to the management regarding some changes in the present system for
the betterment in future.
LIMITATIONS OF THE STUDY
The area of study is confined to Coimbatore only. No other unit is taken for the study and so it
cannot be generalized.
The study had to be confined only to 110 employees out of 500 employees.
RESEARCH METHODOLOGY
The methodology for the study:
Research Design:
A research design is the arrangement of conditions for collection and analysis of data in manner that aims
to combine relevance to the research purpose with economy in procedure. The study is based on the
descriptive survey of the option of the technical and administrative staff, mainly to find the staff
motivating techniques and to analyze it.
Sources of Data:
From the perspective of examining the impact of motivation on the staff and employees, it is appropriate
to categorize the information into two types
a) Primary Data
This data is collected by the questionnaires
b) Secondary Data
Various records maintained by concerned
Departments
Journals
ISSN: 2320-9704- Online ISSN:2347-1662-Print
www.icm
rr.or
g
87
Volume 1, Issue 8 (October, 2013)
INTERCONTINENTAL JOURNAL OF HUMAN RESOURCE RESEARCH REVIEW
Pee
r R
evie
wed
Jo
urn
al o
f In
ter-
Co
nti
nen
tal M
anag
emen
t R
esea
rch
Co
nso
rtiu
m
htt
p:/
/ww
w.ic
mrr
.org
Pamphlets, periodicals, books from library
But as far as this study is concerned all the above methods were used for the collection of data.
Target Group:
The respondents are categorized as follows,
Manager
Supervisors
Chief Advisors
Sales executives
Servicemen
Sampling Methods:
Sampling method comprises of the selection of (i) sampling unit and (ii) sample size.
a) Sampling Unit
The sample unit constitutes, as the study pertains to this unit only.
b) Sampling Size
The sample size refers to the number of people or items selected from
a total population. Sample sizes of 110 employees were chosen in conveniences basis to represent
the total population. The sample has been selected to include the attitude and views of all level of
hierarchy.
Statistical Tools:
The statistical tool used in the study is,
i) Simple percentage method was used to analyze the data
ii) Chi-square test
iii) Regression.
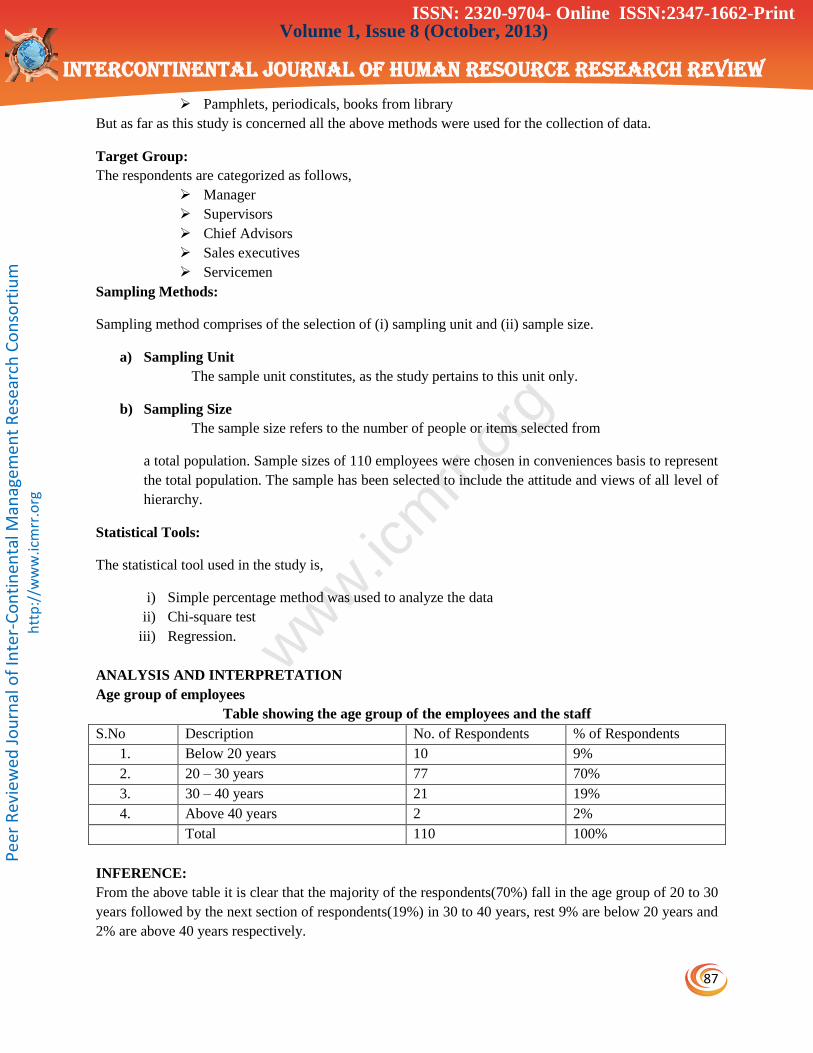
ANALYSIS AND INTERPRETATION
Age group of employees
Table showing the age group of the employees and the staff
S.No Description No. of Respondents % of Respondents
1. Below 20 years 10 9%
2. 20 – 30 years 77 70%
3. 30 – 40 years 21 19%
4. Above 40 years 2 2%
Total 110 100%
INFERENCE:
From the above table it is clear that the majority of the respondents(70%) fall in the age group of 20 to 30
years followed by the next section of respondents(19%) in 30 to 40 years, rest 9% are below 20 years and
2% are above 40 years respectively.
ISSN: 2320-9704- Online ISSN:2347-1662-Print
www.icm
rr.or
g
88
Volume 1, Issue 8 (October, 2013)
INTERCONTINENTAL JOURNAL OF HUMAN RESOURCE RESEARCH REVIEW
Pee
r R
evie
wed
Jo
urn
al o
f In
ter-
Co
nti
nen
tal M
anag
emen
t R
esea
rch
Co
nso
rtiu
m
htt
p:/
/ww
w.ic
mrr
.org
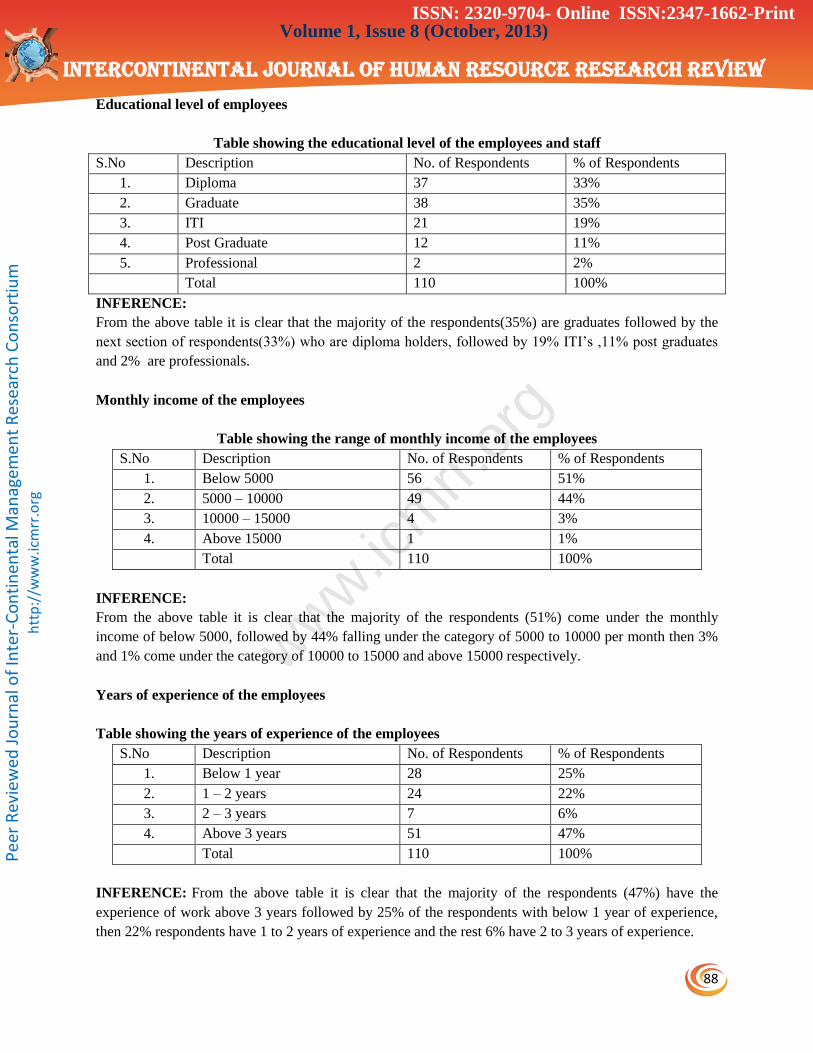
Educational level of employees
Table showing the educational level of the employees and staff
S.No Description No. of Respondents % of Respondents
1. Diploma 37 33%
2. Graduate 38 35%
3. ITI 21 19%
4. Post Graduate 12 11%
5. Professional 2 2%
Total 110 100%
INFERENCE:
From the above table it is clear that the majority of the respondents(35%) are graduates followed by the
next section of respondents(33%) who are diploma holders, followed by 19% ITI’s ,11% post graduates
and 2% are professionals.
Monthly income of the employees
Table showing the range of monthly income of the employees
INFERENCE:
From the above table it is clear that the majority of the respondents (51%) come under the monthly
income of below 5000, followed by 44% falling under the category of 5000 to 10000 per month then 3%
and 1% come under the category of 10000 to 15000 and above 15000 respectively.
Years of experience of the employees
Table showing the years of experience of the employees
INFERENCE: From the above table it is clear that the majority of the respondents (47%) have the
experience of work above 3 years followed by 25% of the respondents with below 1 year of experience,
then 22% respondents have 1 to 2 years of experience and the rest 6% have 2 to 3 years of experience.
S.No Description No. of Respondents % of Respondents
1. Below 5000 56 51%
2. 5000 – 10000 49 44%
3. 10000 – 15000 4 3%
4. Above 15000 1 1%
Total 110 100%
S.No Description No. of Respondents % of Respondents
1. Below 1 year 28 25%
2. 1 – 2 years 24 22%
3. 2 – 3 years 7 6%
4. Above 3 years 51 47%
Total 110 100%
ISSN: 2320-9704- Online ISSN:2347-1662-Print

www.icm
rr.or
g
89
Volume 1, Issue 8 (October, 2013)
INTERCONTINENTAL JOURNAL OF HUMAN RESOURCE RESEARCH REVIEW
Pee
r R
evie
wed
Jo
urn
al o
f In
ter-
Co
nti
nen
tal M
anag
emen
t R
esea
rch
Co
nso
rtiu
m
htt
p:/
/ww
w.ic
mrr
.org
Incentive plan is to improve employee morale
Table showing whether basic purpose of incentive plan is to improve employee morale
INFERENCE:
From the above table it is clear that the majority of the respondents (63%) agreed that basic purpose of
incentive plan is to improve employee morale followed by the next section of respondents (35%) fully
agreed and another 2% had no comments. There were no respondents who disagreed with the above
statement.
Loyalty hike is a motivating factor
Table showing whether loyalty hike is a motivating factor
INFERENCE:
From the above table it is clear that the majority of the respondents (49%) agreed that loyalty hike is a
motivating factor followed by the next section of respondents (32%) fully agreed and another 18% had no
comments. There is only 1% who disagreed to this statement.
Better performance in the organization
Table showing whether better incentive plans leads to better performance in the organization
S.No Description No. of Respondents % of Respondents
1. Fully Agree 39 35%
2. Agree 69 63%
3. No Comments 2 2%
4. Disagree 0 0%
Total 110 100%
S.No Description No. of Respondents % of Respondents
1. Fully Agree 34 32%
2. Agree 54 49%
3. No Comments 21 18%
4. Disagree 1 1%
Total 110 100%
S.No Description No. of Respondents % of Respondents
1. Fully Agree 47 43%
2. Agree 57 52%
3. No Comments 3 2%
4. Disagree 3 3%
Total 110 100%
ISSN: 2320-9704- Online ISSN:2347-1662-Print
www.icm
rr.or
g
90
Volume 1, Issue 8 (October, 2013)
INTERCONTINENTAL JOURNAL OF HUMAN RESOURCE RESEARCH REVIEW
Pee
r R
evie
wed
Jo
urn
al o
f In
ter-
Co
nti
nen
tal M
anag
emen
t R
esea
rch
Co
nso
rtiu
m
htt
p:/
/ww
w.ic
mrr
.org
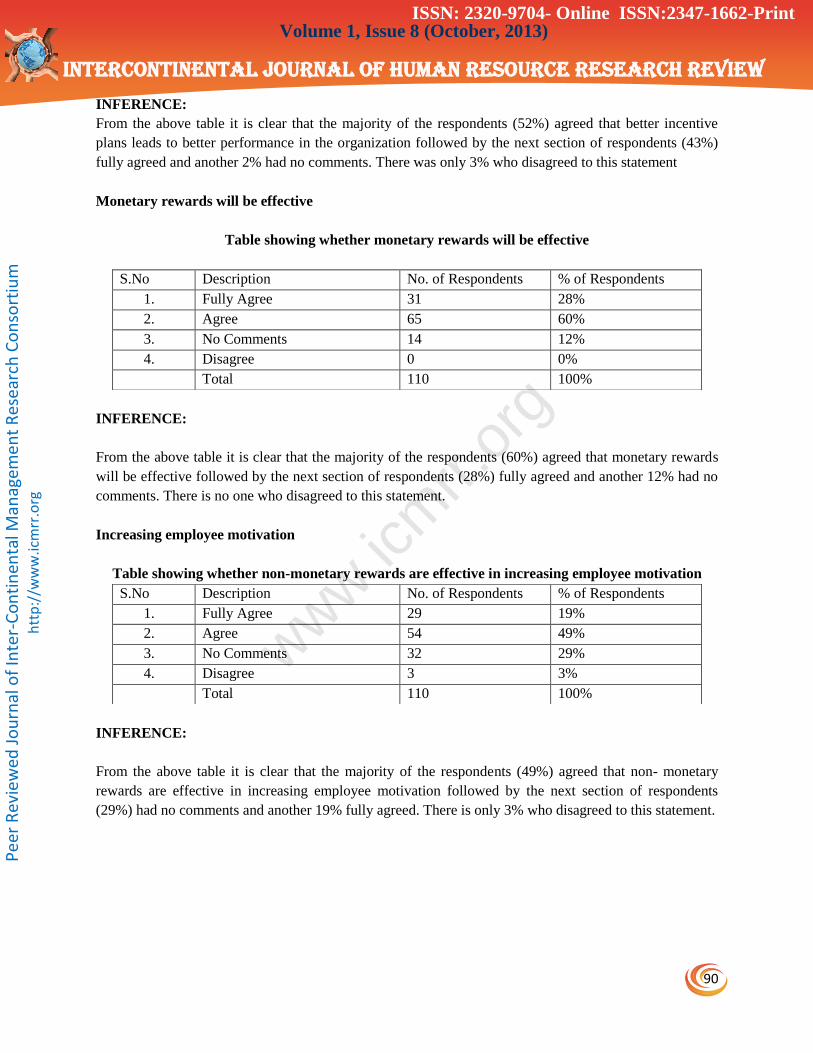
INFERENCE:
From the above table it is clear that the majority of the respondents (52%) agreed that better incentive
plans leads to better performance in the organization followed by the next section of respondents (43%)
fully agreed and another 2% had no comments. There was only 3% who disagreed to this statement
Monetary rewards will be effective
Table showing whether monetary rewards will be effective
INFERENCE:
From the above table it is clear that the majority of the respondents (60%) agreed that monetary rewards
will be effective followed by the next section of respondents (28%) fully agreed and another 12% had no
comments. There is no one who disagreed to this statement.
Increasing employee motivation
Table showing whether non-monetary rewards are effective in increasing employee motivation
INFERENCE:
From the above table it is clear that the majority of the respondents (49%) agreed that non- monetary
rewards are effective in increasing employee motivation followed by the next section of respondents
(29%) had no comments and another 19% fully agreed. There is only 3% who disagreed to this statement.
S.No Description No. of Respondents % of Respondents
1. Fully Agree 31 28%
2. Agree 65 60%
3. No Comments 14 12%
4. Disagree 0 0%
Total 110 100%
S.No Description No. of Respondents % of Respondents
1. Fully Agree 29 19%
2. Agree 54 49%
3. No Comments 32 29%
4. Disagree 3 3%
Total 110 100%
ISSN: 2320-9704- Online ISSN:2347-1662-Print
www.icm
rr.or
g
91
Volume 1, Issue 8 (October, 2013)
INTERCONTINENTAL JOURNAL OF HUMAN RESOURCE RESEARCH REVIEW
Pee
r R
evie
wed
Jo
urn
al o
f In
ter-
Co
nti
nen
tal M
anag
emen
t R
esea
rch
Co
nso
rtiu
m
htt
p:/
/ww
w.ic
mrr
.org
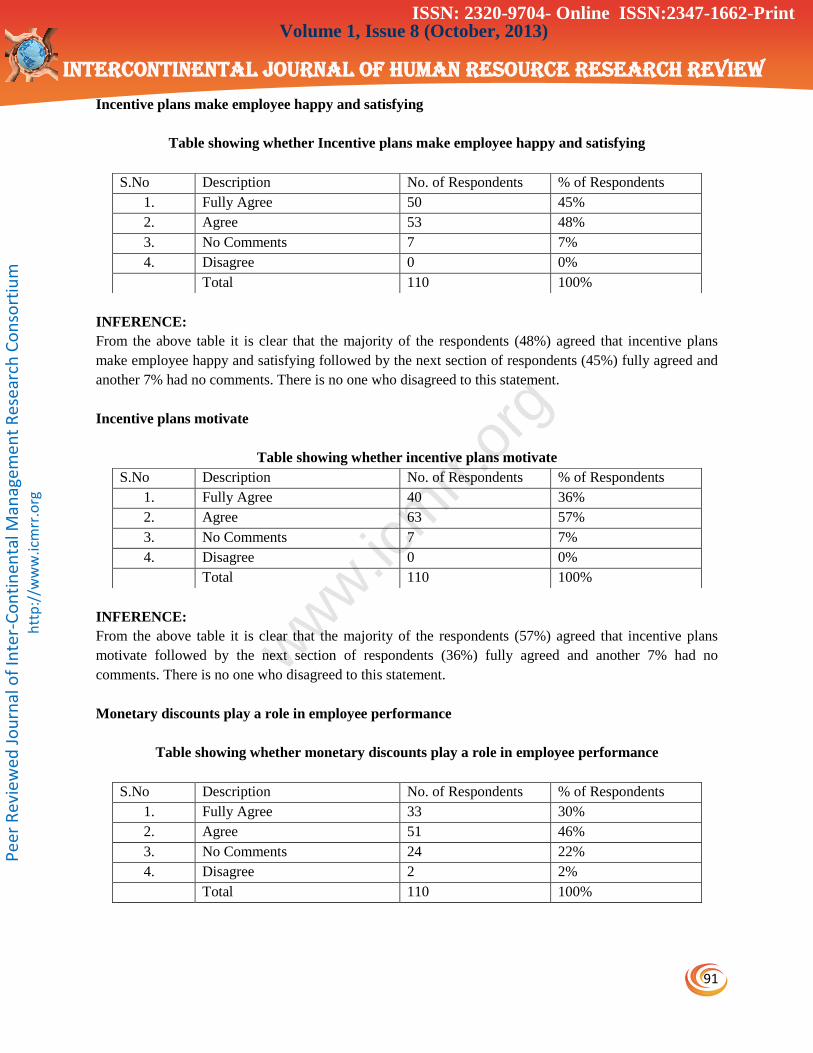
Incentive plans make employee happy and satisfying
Table showing whether Incentive plans make employee happy and satisfying
INFERENCE:
From the above table it is clear that the majority of the respondents (48%) agreed that incentive plans
make employee happy and satisfying followed by the next section of respondents (45%) fully agreed and
another 7% had no comments. There is no one who disagreed to this statement.
Incentive plans motivate
Table showing whether incentive plans motivate
INFERENCE:
From the above table it is clear that the majority of the respondents (57%) agreed that incentive plans
motivate followed by the next section of respondents (36%) fully agreed and another 7% had no
comments. There is no one who disagreed to this statement.
Monetary discounts play a role in employee performance
Table showing whether monetary discounts play a role in employee performance
S.No Description No. of Respondents % of Respondents
1. Fully Agree 50 45%
2. Agree 53 48%
3. No Comments 7 7%
4. Disagree 0 0%
Total 110 100%
S.No Description No. of Respondents % of Respondents
1. Fully Agree 40 36%
2. Agree 63 57%
3. No Comments 7 7%
4. Disagree 0 0%
Total 110 100%
S.No Description No. of Respondents % of Respondents
1. Fully Agree 33 30%
2. Agree 51 46%
3. No Comments 24 22%
4. Disagree 2 2%
Total 110 100%
ISSN: 2320-9704- Online ISSN:2347-1662-Print

www.icm
rr.or
g
92
Volume 1, Issue 8 (October, 2013)
INTERCONTINENTAL JOURNAL OF HUMAN RESOURCE RESEARCH REVIEW
Pee
r R
evie
wed
Jo
urn
al o
f In
ter-
Co
nti
nen
tal M
anag
emen
t R
esea
rch
Co
nso
rtiu
m
htt
p:/
/ww
w.ic
mrr
.org
INFERENCE:
From the above table it is clear that the majority of the respondents (46%) agreed that monetary discounts
play an important role in employee performance followed by the next section of respondents (30%) fully
agreed and another 22% had no comments. There is only 2% who disagreed to this statement.
Present working hours are comfortable
Table showing whether present working hours are comfortable
INFERENCE:
From the above table it is clear that the majority of the respondents (48%) agreed that working
hours are comfortable followed by the next section of respondents (43%) fully agreed and another 7%
had no comments. There is only 2% who disagreed to this statement.
Good working conditions exist
Table showing whether good working conditions exist
INFERENCE:
From the above table it is clear that the majority of the respondents (50%) agreed that exists good
working conditions followed by the next section of respondents (43%) fully agreed and another 7% had
no comments. There is no one who disagreed to this statement.
S.No Description No. of Respondents % of Respondents
1. Fully Agree 47 43%
2. Agree 53 48%
3. No Comments 8 7%
4. Disagree 2 2%
Total 110 100%
S.No Description No. of Respondents % of Respondents
1. Fully Agree 47 43%
2. Agree 55 50%
3. No Comments 8 7%
4. Disagree 0 0%
Total 110 100%
ISSN: 2320-9704- Online ISSN:2347-1662-Print
www.icm
rr.or
g
93
Volume 1, Issue 8 (October, 2013)
INTERCONTINENTAL JOURNAL OF HUMAN RESOURCE RESEARCH REVIEW
Pee
r R
evie
wed
Jo
urn
al o
f In
ter-
Co
nti
nen
tal M
anag
emen
t R
esea
rch
Co
nso
rtiu
m
htt
p:/
/ww
w.ic
mrr
.org
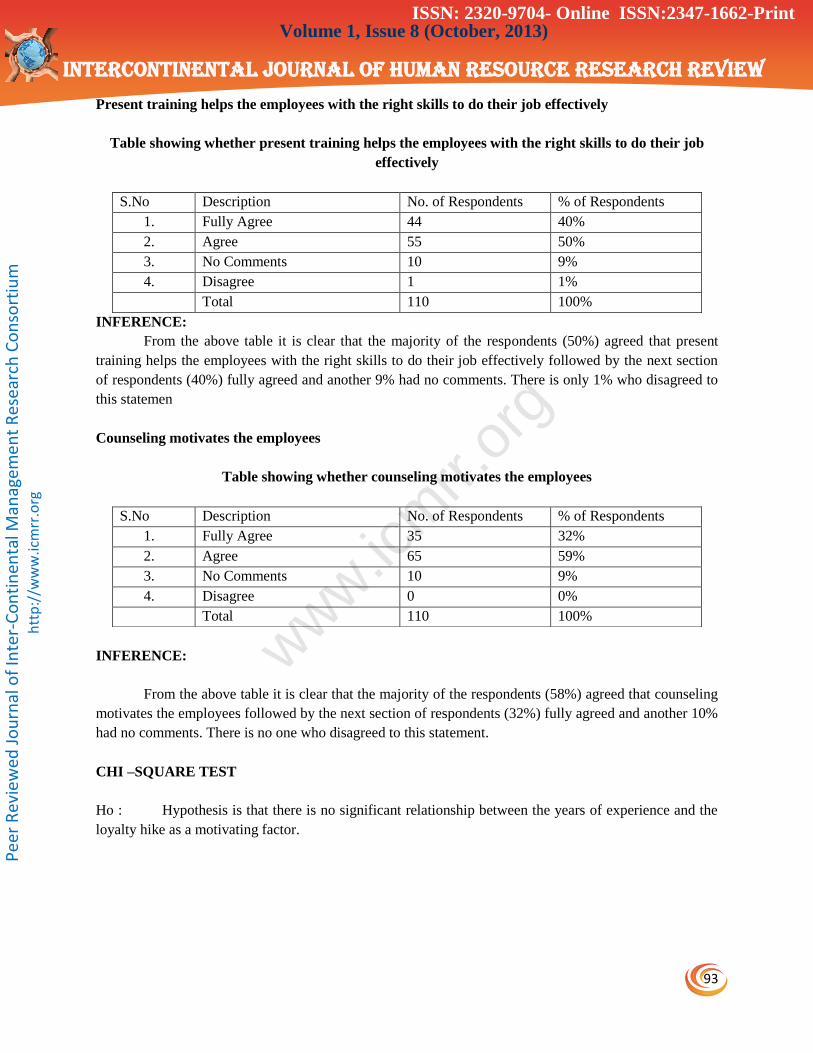
Present training helps the employees with the right skills to do their job effectively
Table showing whether present training helps the employees with the right skills to do their job
effectively
INFERENCE:
From the above table it is clear that the majority of the respondents (50%) agreed that present
training helps the employees with the right skills to do their job effectively followed by the next section
of respondents (40%) fully agreed and another 9% had no comments. There is only 1% who disagreed to
this statemen
Counseling motivates the employees
Table showing whether counseling motivates the employees
INFERENCE:
From the above table it is clear that the majority of the respondents (58%) agreed that counseling
motivates the employees followed by the next section of respondents (32%) fully agreed and another 10%
had no comments. There is no one who disagreed to this statement.
CHI –SQUARE TEST
Ho : Hypothesis is that there is no significant relationship between the years of experience and the
loyalty hike as a motivating factor.
S.No Description No. of Respondents % of Respondents
1. Fully Agree 44 40%
2. Agree 55 50%
3. No Comments 10 9%
4. Disagree 1 1%
Total 110 100%
S.No Description No. of Respondents % of Respondents
1. Fully Agree 35 32%
2. Agree 65 59%
3. No Comments 10 9%
4. Disagree 0 0%
Total 110 100%
ISSN: 2320-9704- Online ISSN:2347-1662-Print

www.icm
rr.or
g
94
Volume 1, Issue 8 (October, 2013)
INTERCONTINENTAL JOURNAL OF HUMAN RESOURCE RESEARCH REVIEW
Pee
r R
evie
wed
Jo
urn
al o
f In
ter-
Co
nti
nen
tal M
anag
emen
t R
esea
rch
Co
nso
rtiu
m
htt
p:/
/ww
w.ic
mrr
.org
OBSERVATION FREQUENCY:
Loyalty
Hike Years of
experience
Strongly
Agree Agree No comments Disagree Total
Below 1 year 9 10 9 0 28
1 – 2 years 5 15 3 1 24
2 – 3 years 1 3 3 0 7
Above 3 years 19 26 6 0 51
35 54 21 1 110
EXPECTED FREQUENCY:
Loyalty
Hike Years of
experience
Strongly
Agree Agree No comments Disagree Total
Below 1 year 8.9 13.7 5.3 0.25 28
1 – 2 years 7.6 11.7 4.5 0.21 24
2 – 3 years 2.2 3.4 1.3 0.06 7
Above 3 years 16.2 25 9.7 0.46 51
35 54 21 1 110
Hence the calculated value of 2 is 14.45
Degree of freedom in the given problem
= (r - 1) (c - 1)
= (4 –1) (4 - 1)
= 9
The table value of 2 for 9 degree of freedom at 5% level of significance is 16.919.
Comparing the table value and calculated value, table value is greater than the calculated value.
Therefore, the hypothesis is accepted. Hence there is no significant relationship between the years of
experience and the loyalty hike as a motivating factor.
CHI –SQUARE TEST – 2
Ho : Hypothesis is that there is no significant relationship between educational qualification and
monthly income.
ISSN: 2320-9704- Online ISSN:2347-1662-Print

www.icm
rr.or
g
95
Volume 1, Issue 8 (October, 2013)
INTERCONTINENTAL JOURNAL OF HUMAN RESOURCE RESEARCH REVIEW
Pee
r R
evie
wed
Jo
urn
al o
f In
ter-
Co
nti
nen
tal M
anag
emen
t R
esea
rch
Co
nso
rtiu
m
htt
p:/
/ww
w.ic
mrr
.org
OBSERVED FREQUENCY:
Educational
qualification
Income
Dip
lom
a
Gra
du
ati
on
ITI
Po
st
Gra
du
ati
on
Pro
fess
ion
al
To
tal
Below 5000 18 24 10 3 1 56
5000 – 10000 19 12 11 7 0 49
10000 – 15000 0 2 0 1 1 4
Above 15000 0 0 0 1 0 1
37 38 21 12 2 110
EXPECTED FREQUENCY:
Educational
qualification
Income
Dip
lom
a
Gra
du
ati
on
ITI
Post
Gra
du
ati
on
Pro
fess
ion
al
Tota
l
Below 5000 18.5 19 10.5 6 1 56
5000 – 10000 16.28 16.72 9.24 5.28 0.88 49
10000 – 15000 1.33 1.36 0.75 0.43 0.07 4
Above 15000 0.33 0.33 0.18 0.10 0.01 1
37 38 21 12 2 110
Calculation:
Chi – square 2 = (O - E)
2 / E
The table value of 2 for 7 degree of freedom at 5% level of significance is 14.067
Comparing the table value and calculated value, table value is less than the calculated value. Therefore,
the hypothesis is rejected. Hence there is significant relationship between educational qualification and
monthly income.
FINDINGS
The majority of the respondents (70%) fall in the age group of 20 to 30 years.
The majority of the respondents (35%) are graduates.
The majority of the respondents (51%) come under the monthly income of below 5000.
The majority of the respondents (47%) have the experience of work above 3 years.
ISSN: 2320-9704- Online ISSN:2347-1662-Print
www.icm
rr.or
g
96
Volume 1, Issue 8 (October, 2013)
INTERCONTINENTAL JOURNAL OF HUMAN RESOURCE RESEARCH REVIEW
Pee
r R
evie
wed
Jo
urn
al o
f In
ter-
Co
nti
nen
tal M
anag
emen
t R
esea
rch
Co
nso
rtiu
m
htt
p:/
/ww
w.ic
mrr
.org
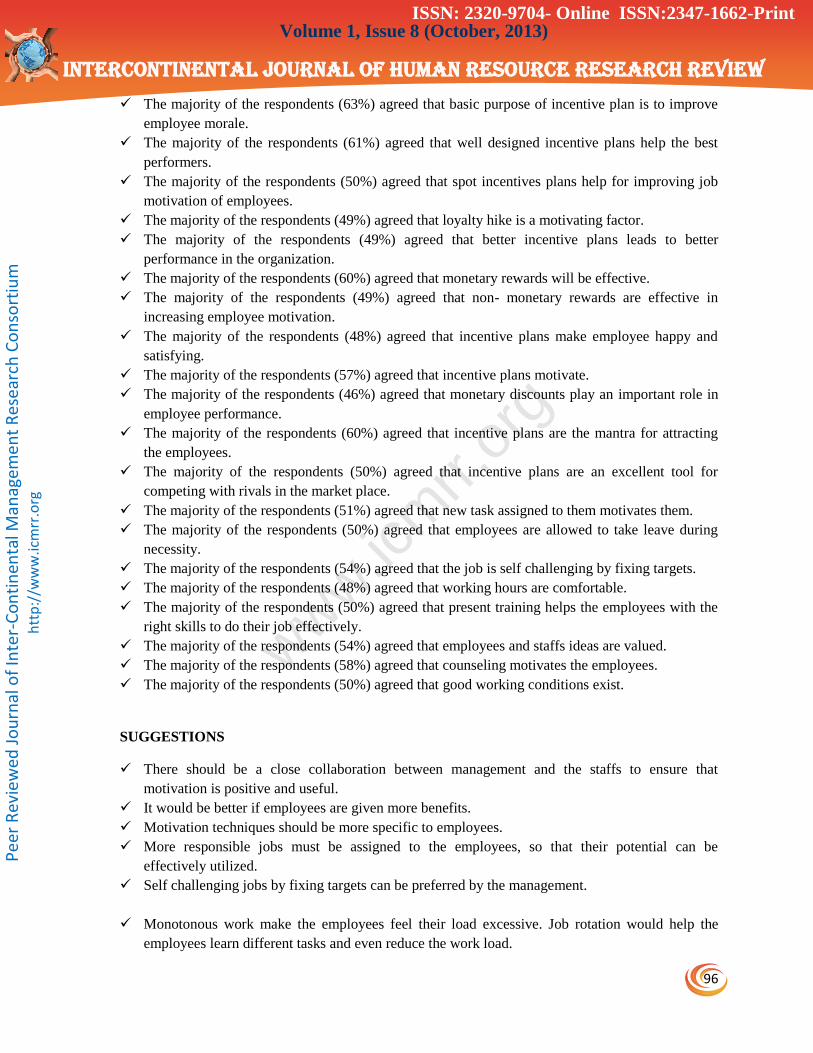
The majority of the respondents (63%) agreed that basic purpose of incentive plan is to improve
employee morale.
The majority of the respondents (61%) agreed that well designed incentive plans help the best
performers.
The majority of the respondents (50%) agreed that spot incentives plans help for improving job
motivation of employees.
The majority of the respondents (49%) agreed that loyalty hike is a motivating factor.
The majority of the respondents (49%) agreed that better incentive plans leads to better
performance in the organization.
The majority of the respondents (60%) agreed that monetary rewards will be effective.
The majority of the respondents (49%) agreed that non- monetary rewards are effective in
increasing employee motivation.
The majority of the respondents (48%) agreed that incentive plans make employee happy and
satisfying.
The majority of the respondents (57%) agreed that incentive plans motivate.
The majority of the respondents (46%) agreed that monetary discounts play an important role in
employee performance.
The majority of the respondents (60%) agreed that incentive plans are the mantra for attracting
the employees.
The majority of the respondents (50%) agreed that incentive plans are an excellent tool for
competing with rivals in the market place.
The majority of the respondents (51%) agreed that new task assigned to them motivates them.
The majority of the respondents (50%) agreed that employees are allowed to take leave during
necessity.
The majority of the respondents (54%) agreed that the job is self challenging by fixing targets.
The majority of the respondents (48%) agreed that working hours are comfortable.
The majority of the respondents (50%) agreed that present training helps the employees with the
right skills to do their job effectively.
The majority of the respondents (54%) agreed that employees and staffs ideas are valued.
The majority of the respondents (58%) agreed that counseling motivates the employees.
The majority of the respondents (50%) agreed that good working conditions exist.
SUGGESTIONS
There should be a close collaboration between management and the staffs to ensure that
motivation is positive and useful.
It would be better if employees are given more benefits.
Motivation techniques should be more specific to employees.
More responsible jobs must be assigned to the employees, so that their potential can be
effectively utilized.
Self challenging jobs by fixing targets can be preferred by the management.
Monotonous work make the employees feel their load excessive. Job rotation would help the
employees learn different tasks and even reduce the work load.
ISSN: 2320-9704- Online ISSN:2347-1662-Print

www.icm
rr.or
g
97
Volume 1, Issue 8 (October, 2013)
INTERCONTINENTAL JOURNAL OF HUMAN RESOURCE RESEARCH REVIEW
Pee
r R
evie
wed
Jo
urn
al o
f In
ter-
Co
nti
nen
tal M
anag
emen
t R
esea
rch
Co
nso
rtiu
m
htt
p:/
/ww
w.ic
mrr
.org
To get the job efficiently done employees must be provided with the right skills by training them.
Attractive incentive plans can be framed to attract the employees.
The age group of the employees is mostly 20 – 30 years so their ideas may be valued.
REFERENCES
Websites
www.ambal.com
www.latimes.com
www.maruthisuzukiindia.com
www.google.com
www.getmotivation.com
www.motivation123.com
www.selfgrowth.com
Journals
Academic of Management, New Delhi
Journal of Applied Psychology, New York
Journal of Management, Durhan
The Hindu, Opportunities, HR Highs
Journal of Organization Behavior
Journal of Cross-Culture Psychology, U S A
Human Resource Management, University of Michigan, Michigan
Books
Human Resource Management - Garry Dessler
Research methodology - C. R. Kothari
Human Resource Management -Dr.V. P. Rao
Organizational Behavior - Stephen P. Robbins
An Empirical of a new theory of human needs - C. P. Alderfer
ISSN: 2320-9704- Online ISSN:2347-1662-Print