interdependence of the electricity generation system and ... summary concern about energy ......
TRANSCRIPT

Lincoln LaboratoryMASSACHUSETTS INSTITUTE OF TECHNOLOGY
LEXINGTON, MASSACHUSETTS
ESC-EN-HA-TR-2012-121
Technical Report1173
Interdependence of the Electricity Generation System and the Natural
Gas System and Implications for Energy Security
N. Judson
15 May 2013
Prepared for the Office of the Secretary of Defense under Air Force Contract FA8721-05-C-0002.
Approved for public release; distribution is unlimited.

Interdependence of the Electricity Generation System and the Natural Gas System and Implications for Energy Security
N. JudsonGroup 99
15 May 2013
Massachusetts Institute of Technology Lincoln Laboratory
Technical Report 1173
Lexington Massachusetts
Approved for public release; distribution is unlimited.

This page intentionally left blank.
iii
EXECUTIVE SUMMARY
Concern about energy security on domestic Department of Defense installations has led to the possibility of using natural gas-fired electricity generators to provide power in the event of electric grid failures. As natural gas is an increasingly base-load fuel for electricity generation in the United States, the electricity generation system has become increasingly dependent on the operation of the natural gas system. However, as the natural gas system is also partly dependent on electricity for its ability to deliver natural gas from the well-head to the consumer, the question arises of whether, in the event of an electric grid failure, the natural gas would continue to flow. As the natural gas transmission system largely uses natural gas from the pipelines as a source of power, once the gas has been extracted from the ground, the system is less dependent on the electric grid. However, some of the drilling rigs, processing units, and pipeline compressors do depend on electric power, making the vulnerability to the system to a disruption in the national electricity supply network vary depending on the cause, breadth, and geographic location of the disruption. This is due to the large numbers of players in the natural gas production and transmission system, variations in the layout of transmission pipelines, variations in the penetration of electric motor-driven compressors and other equipment, and the availability of nearby gas production, import terminals, or storage facilities.
Existing historical data on the monthly rates of natural gas production, storage, and use were used to determine for what length of time the system would continue to operate. As a conservative, worst-case scenario, it was assumed that all production ceased with the failure of the electric power grid, but that stored gas could be withdrawn, that the transmission pipelines could continue to operate, and that gas could be withdrawn from transmission pipelines by local distribution companies. This analysis shows that the effect of an electricity outage on the natural gas supply depends on the scale of the outage. There are two scales that matter: local, short disturbances (confined to several states and, depending on the time of year, lasting less than about two weeks to three months) will likely have minimal impact, depending on the region of the country affected, with mitigation strategies possible; and widespread, long-term outages (encompassing one of the three sections of the electricity grid and again, depending on the time of year, but longer than two weeks to three months), which will have increasing effects as stored gas runs out, with variation within the country.
In general, the gas supply system is reliable for the local, short-term disruptions to the electricity supply due to several reasons: demand for gas decreases during power outages as gas-fired electricity generation goes offline; many compressor stations that keep the pressure in the pipelines at serviceable levels are powered from the natural gas in the pipelines themselves, allowing continued operation; and interruptible delivery contracts can be curtailed, further reducing demand. Risk of interruptions to natural gas supply during this type of outage can be reduced by enrolling in firm delivery contracts with transmission companies. Those obligations have been met during recent electrical outages, whereas some interruptible service customers have had service curtailed.

iv
However, disruptions that cover entire sections of the electric grid encompassing areas from extraction wells to customers and which last longer than available gas in storage (two weeks to several months) or transmission pipeline constraints from elsewhere, will be subject to contractual force majeure clauses, rendering the firm delivery contracts void. In this case, continued operation of gas-fuelled power generation systems that are not dual-fuel capable will be unlikely. Several weather-related outages in recent years have provided limited case studies showing the system’s resilience, but no long-term, widespread electricity grid failures have occurred.

v
TABLE OF CONTENTS
Page
Executive Summary iii List of Illustrations vii
1. NATURAL GAS SYSTEM OVERVIEW 1
1.1 Study Motivation 1 1.2 Overview of the Natural Gas Delivery System 1 1.3 Dependence on Electric Power 6 1.4 Contingency Operations 9 1.5 Implications for Energy Security 13
2. SUMMARY 17
3. RECOMMENDATIONS 19
References 21

This page intentionally left blank.

vii
LIST OF ILLUSTRATIONS
Figure Page No.
1 Natural gas system architecture. 2
2 Military installations and natural gas processing plants. 3
3 Military installations, natural gas pipelines, and compressor stations. 4
4 Military installations and natural gas storage fields. 5
5 Natural gas production since 2005. 8
6 Natural gas output and consumption since 2001. 10
7 Duration of natural gas storage supplies since 2001 (assuming no further production and consumption at historical rates). 11
8 Regional and seasonal variation in natural gas storage since 1994. 12
9 Calculated duration of natural gas storage. 13
10 Variability of natural gas prices since 1997 (monthly prices). 15

This page intentionally left blank.
1
1. NATURAL GAS SYSTEM OVERVIEW
1.1 STUDY MOTIVATION
The natural gas supply network and the electricity generation network are interdependent: loss of function of either system affects the operation of the other system. With the increasing use of natural gas–fuelled electricity generation plants, much attention has been paid to the requirement for natural gas delivery to meet the needs of the electricity generators, and the effects of limited natural gas supply on the operation of these electricity generation stations [1–11]. The converse situation is also true: natural gas delivery is dependent on a reliable electricity supply. While this obvious point has been mentioned repeatedly [1, 2, 12–16], few studies address this potential problem.
The Department of Defense (DoD) supports a number of critical national security functions from domestic DoD installations which must maintain operational capabilities in the event of an outage of the local electric grid. Traditionally, the DoD has provided energy security with individual backup generators, but recently has begun to examine microgrids, power systems that can purposefully disconnect from the utility grid and operate in an islanded mode, as a more robust and cost-effective solution to long-term power outages [17, 18]. As microgrid systems become larger and need to provide more power, they generally have larger generators as a part of their power generation scheme. One efficient and cost-effective option to fuel these generators is to use natural gas. However, if the natural gas system is dependent on external electricity to deliver the gas, a solely natural gas-powered generator does not provide any additional energy security unless natural gas is stored on-site [19]. This study was performed to determine how dependent the natural gas delivery network is on electricity for its continued function.
1.2 OVERVIEW OF THE NATURAL GAS DELIVERY SYSTEM
There are three main parts of the national gas system: the gathering of the gas from multiple small wells, the transmission of the gas by long-distance pipelines, and the distribution of the gas to local customers (Figure 1).

2
Figure 1. Natural gas system architecture.
The flow of gas in the entire delivery system from the wells to the customers is achieved through pressure differentials. In the gathering stage, wells produce natural gas, sometimes with other by-products, which, if they are present, need to be removed by well-head processing units. Gas is collected from multiple wells and, if necessary, is then compressed and sent to a processing plant. Well operations can be powered by several methods: self-powered by the natural gas that comes from the well, by diesel motors (this is typically the case only for offshore drilling platforms), or by electric motors dependent on a local electricity supply.
Some compressors in the field are self-powered, using the natural gas from the wells as the source of their power. More recently, however, electric motor-driven compressors have become increasingly prevalent on gathering networks as connections to the electric utility grid are readily available along some of the pipelines, as they are cheaper to install and maintain, and as many regions have emissions standards that require them, such as in parts of Colorado [20, 21], Texas, and California [2].
At the processing plant, water, natural gas liquids, CO2, and other gases are removed. Once clean, dry gas is produced, it is compressed and sent into transmission pipelines. There are many processing

3
plants, located in regions of the country where natural gas is available; Figure 2 shows the location of these plants as well as the location of all continental United States (CONUS) military installations.
Military installations (brown areas) are shown in relation to natural gas processing plants (red dots) and producing basins (grey areas). Data from [22].
Figure 2. Military installations and natural gas processing plants.
The transmission stage consists of larger diameter, long pipelines, through which the gas is transported. For long-distance transmission, due to frictional losses in the pipes, the gas needs to be recompressed periodically. These compressor stations are spaced at irregular intervals, generally every 75 to 100 miles, but sometimes more frequently spaced (40 miles) [23]. These are also often powered with natural gas-fired engines or turbines that run the compressors. If so, these systems generate their own power from the natural gas in the pipelines. In aggregate, about 3% of the natural gas in the pipeline is used to self-power the transmission portion of the system. However, like in the gathering stage, in regions of the country where emissions are a concern, such as in California or near large cities like Houston or Denver [21, 24], or in regions that have had pipelines recently built, the compressors are often powered by electric motors supplied by the local electric grid [2, 25].

4
Once the gas reaches its destination, it goes through a gate, where it is metered and distributed to consumers by a local distribution company (LDC), or it goes into storage for later use. Some large customers (generally these are customers with demand greater than a 300 MW electricity power plant) are connected directly to the transmission pipeline, bypassing the LDC. Figure 3 shows the location of all transmission pipelines, compressor stations, and CONUS military installations. Figure 4 shows the location of gas storage fields and their proximity to military installations.
Military installations (brown areas) are shown in relation to natural gas transmission pipelines (blue and grey lines) and compressor stations (red squares). This shows the large number of compressor stations and the variability in redundancy across the nation. Data from [26].
Figure 3. Military installations, natural gas pipelines, and compressor stations.

5
Military installations (brown areas) are shown in relation to underground natural gas storage sites. This shows the clustering of storage locations across the country and military installations that are far removed from local storage. Data from 2007 and does not show the location of above ground LNG storage facilities [27].
Figure 4. Military installations and natural gas storage fields.
In the distribution phase, compressor stations are typically no longer required. Instead, gas is distributed to the end user through pressure regulators that reduce the pressure of the gas to the expected level for the consumer. At the point of delivery, there are also meters and sensors that measure the quantity and quality of gas delivered.
All these systems are monitored and controlled along the way, with different companies responsible for each of the extraction, gathering, processing, transmission, storage, and distribution stages. These measurements include temperature, pressure, flow rate, composition, and heat content of the gas, as well as compressor engine rpm, temperature, and pressure, and status of the equipment and valves [28]. The monitoring equipment is often remote and needs to transmit information back to a central control center and supervisory control and data acquisition (SCADA) equipment so that the system status is known and compressors can be turned on and off remotely, if necessary. The data are communicated over microwave communication, satellite links, and telephone lines, depending on the location of the data collection device [23–25, 29].

6
1.3 DEPENDENCE ON ELECTRIC POWER
The natural gas network has few single points of failure that can lead to a system-wide propagating failure. There are a large number of wells, storage is relatively widespread, the transmission system can continue to operate at high pressure even with the failure of half of the compressors, and the distribution network can run unattended and without power. This is in contrast to the electricity grid, which has, by comparison, few generating points, requires oversight to balance load and demand on a tight timescale, and has a transmission and distribution network that is vulnerable to single point, cascading failures. Because of this, the resilience of the natural gas network to the loss of electric power is generally high, but the farther upstream one goes towards the extraction of gas from the ground, the more the operations become dependent on electricity. The number of processing plants and extraction wells increase drastically compared to the number of transmission pipelines, making specific assignment of the percentages of rigs that are dependent on electricity challenging, but if there are problems at the extraction and processing stage and if these are widespread across a region, those failures will, if they continue for long enough, affect the rest of the transmission system (as quantified in Section 1.4).
Working backwards from the point of delivery, LDCs are generally not dependent on electricity, since they reduce the pressure from transmission to distribution levels using mechanical regulators and use mechanical meters to measure it. At the point where supply is tapped off from the transmission pipelines (referred to as the ‘city gate’), chromatography equipment (to monitor the heat content of the gas) and other equipment require electricity, but the pressure-reducing regulators do not and most of the approximately 100,000 city gates have backup power [30] (although it is unclear how long those fuel supplies would last). For large customers that need higher pressure gas than an LDC can provide, direct connections to the transmission pipelines are normal. This has much lower gas commodity costs and gives more resilience as control of the gate equipment is in the hands of the customer, but has a higher initial expense due to interconnection costs. This type of connection is typically pursued by electric generators with power plants upwards in size from about 300 MW and which are sited close to transmission pipelines [24, 25]. DoD customers would typically connect through an LDC.
There are many transmission pipelines (Figure 3), but books [28] and conversations with operators at three large pipeline companies (Kinder Morgan, Spectra Energy, and Williams) [24, 29, 31] indicated that for their pipelines, they have a high percentage of natural gas-fuelled compressors, not electric motor-driven compressors. Specifically, the Tennessee Gas Pipeline (Texas to Boston) has 90% gas-fuelled compressors; Maritimes and Northeast (Boston to Maine): 100%; Texas Eastern (Texas or Louisiana to New York): 50%; Transco (Texas to New York): 94%. In the event that there is a loss of electricity, the compressors that are dependent on electricity will not operate, but two things ameliorate that problem. First, when power goes out, there is a reduction in the demand for gas since the gas-fired generators for grid operation are not running and consumer gas-fired appliances which require electric ignition are also inoperable, reducing demand by about 20%, depending on time of year and region of the country [24, 29–31]. Second, the remaining gas-fuelled compressors on the pipelines will continue to operate. The loss of the electrical compressors results in only a modest reduction in flow rate; even with all electric motor-

7
driven compressors on the Texas Eastern pipeline failing, flow is reduced to only 70% to 75% of normal [29].
Some transmission pipelines also have redundant operations centers and transfer operations from one location to another routinely and seamlessly, mitigating the risk of the loss of electric power at one location [24]. If a compressor station loses functionality or loses communications, crews will be sent out for manual operation of that station. Compressor stations that fail to receive updated SCADA commands will continue to operate at their last set-point, assuming they do not go out of their safe operational range, in which case mechanical shutoffs would actuate.
Natural gas is stored in geologic formations across the country to flatten the annual fluctuations in demand and ease transmission pipeline constraints (Figure 4). Though the methods for storage vary, with all storage requiring compression to put gas in, methods vary to get the gas out; when compression is required, much of this is powered by natural gas from the storage formation [21, 31]. Not shown on the map in Figure 4 is local LNG storage, which plays a role in supply, especially in New England, where it can supply up to 20% of yearly demand [32].
The picture becomes more complicated at the processing and extraction end. Offshore drilling and extraction platforms are independent of grid-supplied electricity for primary power, as their power comes from onboard diesel generators. However, they are ultimately dependent on electricity as their diesel comes from onshore fuel pumps which use electricity, as highlighted by the gasoline shortages in New York after Hurricane Sandy [33]. Pipeline quality gas is produced on the platform and pressurized for transmission to shore.
Onshore operations are more variable and, depending on the reason for the electricity outage, can be more vulnerable. For example, a cold weather event in early 2011 in the Southwest resulted in well-head freeze offs, which reduced flows in gathering pipelines and shut down some gas processing plants. Rolling blackouts across the system also shut down other processing plants that were dependent on electric power. These events caused a significant reduction in the production of natural gas from wells and in deliveries to the transmission pipelines from the processing plants. Fortunately, the transmission pipeline system continued to function due to the normal operation of wells, gathering systems, and processing plants in regions that were not affected [2, 34]. The network of transmission pipelines in this region allowed feeding supply from regions like Colorado where wells, gathering systems, and processing plants were functioning normally.
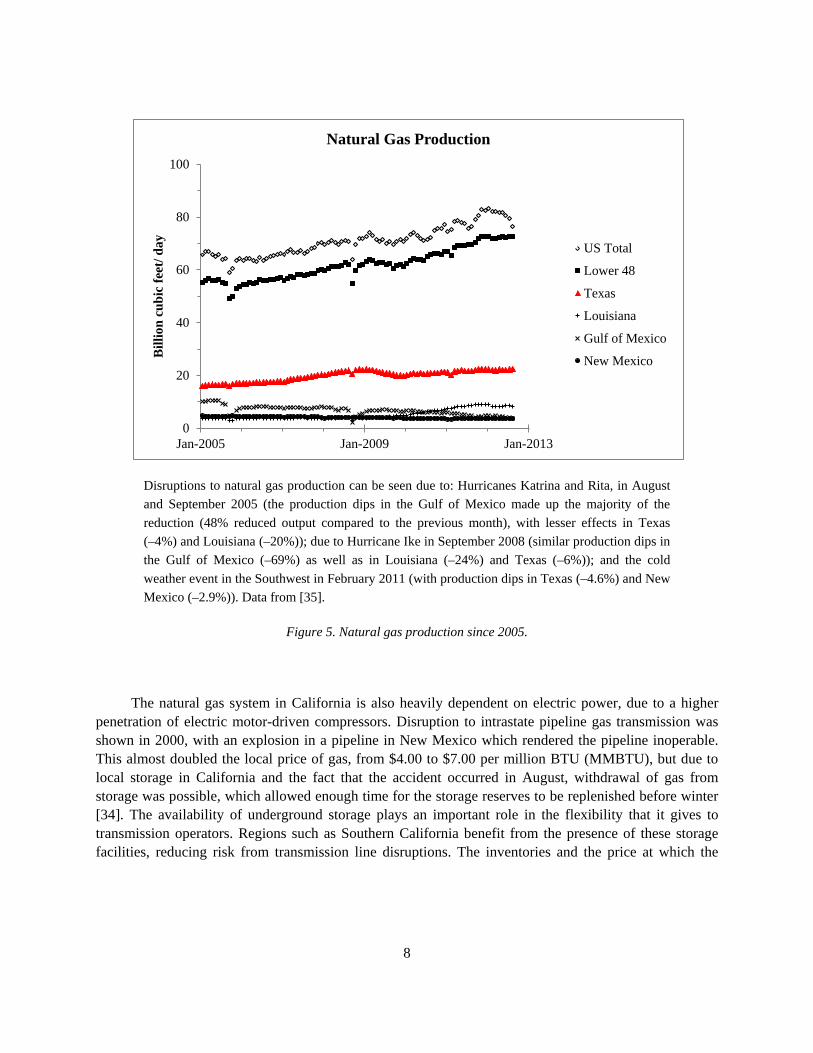
Effects of historical weather events on the production of natural gas can be seen due to hurricanes and well-head freeze offs (Figure 5). An electrical outage in production regions where the wells are heavily dependent on electric power, such as the Barnett Shale formation in northern Texas, would result in significant loss of production [34].
8
Disruptions to natural gas production can be seen due to: Hurricanes Katrina and Rita, in August and September 2005 (the production dips in the Gulf of Mexico made up the majority of the reduction (48% reduced output compared to the previous month), with lesser effects in Texas (–4%) and Louisiana (–20%)); due to Hurricane Ike in September 2008 (similar production dips in the Gulf of Mexico (–69%) as well as in Louisiana (–24%) and Texas (–6%)); and the cold weather event in the Southwest in February 2011 (with production dips in Texas (–4.6%) and New Mexico (–2.9%)). Data from [35].
Figure 5. Natural gas production since 2005.
The natural gas system in California is also heavily dependent on electric power, due to a higher penetration of electric motor-driven compressors. Disruption to intrastate pipeline gas transmission was shown in 2000, with an explosion in a pipeline in New Mexico which rendered the pipeline inoperable. This almost doubled the local price of gas, from $4.00 to $7.00 per million BTU (MMBTU), but due to local storage in California and the fact that the accident occurred in August, withdrawal of gas from storage was possible, which allowed enough time for the storage reserves to be replenished before winter [34]. The availability of underground storage plays an important role in the flexibility that it gives to transmission operators. Regions such as Southern California benefit from the presence of these storage facilities, reducing risk from transmission line disruptions. The inventories and the price at which the
0
20
40
60
80
100
Jan-2005 Jan-2009 Jan-2013
Bill
ion
cubi
c fe
et/ d
ay
Natural Gas Production
US Total
Lower 48
Texas
Louisiana
Gulf of Mexico
New Mexico

9
companies who own them decide to buy or sell gas into the system, however, are outside the control of the DoD, so their vulnerability is variable and not often known.
1.4 CONTINGENCY OPERATIONS
To estimate the length of time that the natural gas network would continue to function in the event of a widespread failure of the electricity network, it is possible to extrapolate from historical data on production, storage, and demand. The overall data plotted in Figure 6 show the seasonal variation in storage and consumption since 2001, along with the increasing production quantities and use of summertime gas-fired electric power generation over time.
Using those data, it can be calculated how long gas supplies would have lasted, given certain scenarios and assumptions. As the most vulnerable link to the natural gas system to a wide-spread, long-lasting electrical failure is the production and processing of natural gas, a worst-case scenario was used to calculate the length of time that the supplies in storage would last with no new production, using historical consumption data.
This analysis used some simplifying assumptions:
1. As a worst case, it was assumed that all production stopped. This is a conservative estimate, as not all wells or processors are externally dependent on the electric grid.
2. As a worst case, it was assumed that loads continued at full demand as they did historically (unlikely, given than many consumer devices, such as boilers with electronic ignition, do not function without electricity [however, all pilot-light–based appliances would continue to function]).
3. There is ability for gas supplies in storage to be withdrawn and that the storage could be withdrawn at the rate that the system load demanded (likely).
4. All regions have demand that is proportional to storage, so that all regions have supply (possible).
5. Full ability of the transmission pipelines to get supply to all loads with only their natural gas compressors running (likely, but see next assumption).
6. That all pipelines are similar to the three large pipeline companies that I talked with in terms of penetration levels of electric motor-driven compressors.
7. Where there is 50% penetration of electric motor-driven compressor stations, they are distributed evenly along the pipeline, not clustered in sections that would then completely lose pressure.

10
8. Local distribution companies continue to operate any equipment at city gates that need electricity so that gas continues to flow into distribution systems (likely).
9. No LNG imports (unlikely).
Data was compiled from the www.eia.gov website [36] to show all production, consumption, and storage data on the same chart for the lower 48 states. Production was reported as mean billion cubic feet (bcf)/day and converted to bcf per month. Consumption is shown as reported by sector and total for each month. Storage is shown as total available storage at the end of each week. The gas that is produced, but not consumed, is put into storage. Increased use of natural gas–fired power generation has increased the summertime peak in natural gas usage, whereas industrial, commercial, and residential natural gas usage all peak in the winter (bottom four lines in chart).
Figure 6. Natural gas output and consumption since 2001.
0
1000
2000
3000
4000
Jan-2001 Jan-2005 Jan-2009 Jan-2013
Bill
ion
cubi
c fe
et
Natural Gas Production, Consumption, and Storage
Total Storage (Lower 48)
Total Production (Lower 48)
Total Consumption (Lower 48)
Electric Power Consumption
Industrial Consumption
Commercial Consumption
Residential Consumption
11
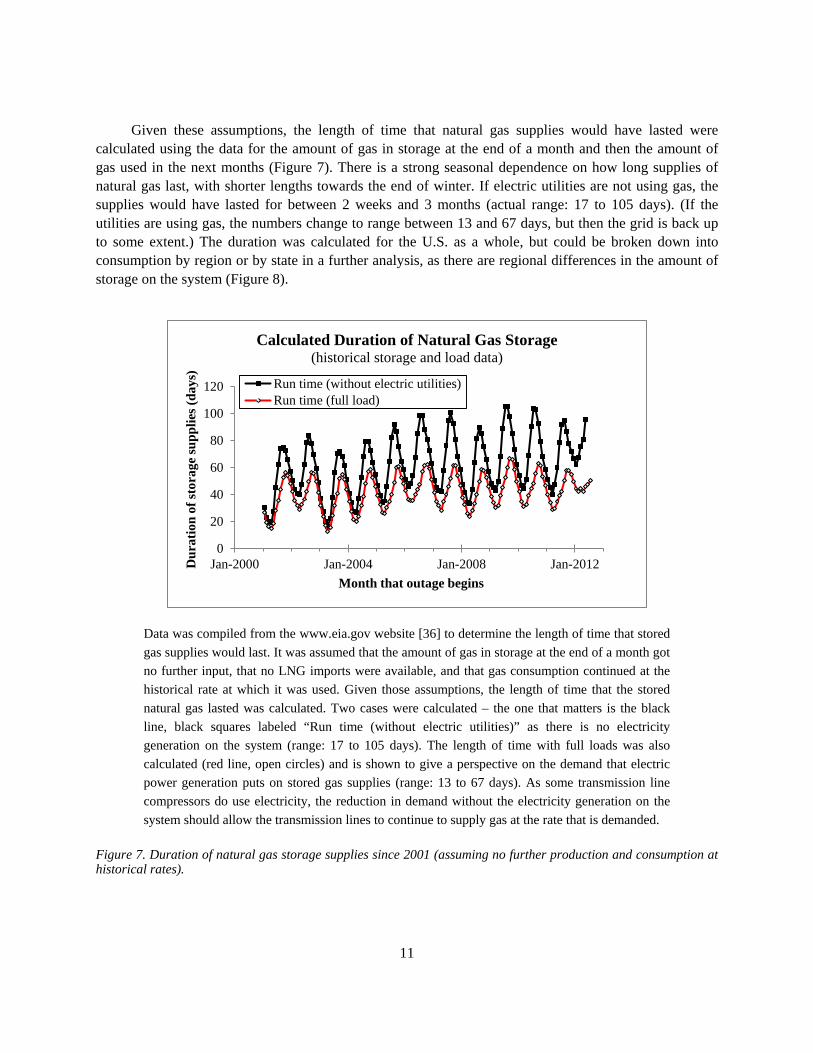
Given these assumptions, the length of time that natural gas supplies would have lasted were calculated using the data for the amount of gas in storage at the end of a month and then the amount of gas used in the next months (Figure 7). There is a strong seasonal dependence on how long supplies of natural gas last, with shorter lengths towards the end of winter. If electric utilities are not using gas, the supplies would have lasted for between 2 weeks and 3 months (actual range: 17 to 105 days). (If the utilities are using gas, the numbers change to range between 13 and 67 days, but then the grid is back up to some extent.) The duration was calculated for the U.S. as a whole, but could be broken down into consumption by region or by state in a further analysis, as there are regional differences in the amount of storage on the system (Figure 8).
Data was compiled from the www.eia.gov website [36] to determine the length of time that stored gas supplies would last. It was assumed that the amount of gas in storage at the end of a month got no further input, that no LNG imports were available, and that gas consumption continued at the historical rate at which it was used. Given those assumptions, the length of time that the stored natural gas lasted was calculated. Two cases were calculated – the one that matters is the black line, black squares labeled “Run time (without electric utilities)” as there is no electricity generation on the system (range: 17 to 105 days). The length of time with full loads was also calculated (red line, open circles) and is shown to give a perspective on the demand that electric power generation puts on stored gas supplies (range: 13 to 67 days). As some transmission line compressors do use electricity, the reduction in demand without the electricity generation on the system should allow the transmission lines to continue to supply gas at the rate that is demanded.
Figure 7. Duration of natural gas storage supplies since 2001 (assuming no further production and consumption at historical rates).
0
20
40
60
80
100
120
Jan-2000 Jan-2004 Jan-2008 Jan-2012Dur
atio
n of
stor
age
supp
lies (
days
)
Month that outage begins
Calculated Duration of Natural Gas Storage (historical storage and load data)
Run time (without electric utilities)Run time (full load)

12
The seasonal variation in the length of time that storage would have lasted allows statistics to be calculated to give a sense of the ranges that would be expected for an outage starting at the beginning of a particular month. The mean and standard deviation for each month was calculated for data since 2001 (Figure 9). The month with the shortest duration, assuming no gas-fired electricity generation, was March (mean: 39 days, standard deviation (σ): 14.8) and the longest was August (mean: 90 days, σ: 11.9). Given that the amount of gas in storage and the demand varies across the country and that some regions have increasing storage (Figure 8), further analysis could determine regional variability.
Regional variability of storage exists across the country [37]. Further analysis could quantify these regional differences using state-by-state consumption and storage data. Linear fit trend lines are shown for each region.
Figure 8. Regional and seasonal variation in natural gas storage since 1994.
0
1000
2000
3000
4000
Jan-1994 Jan-1998 Jan-2002 Jan-2006 Jan-2010
Bill
ion
cubi
c fe
et (b
cf)
Working Gas in Underground Storage Total Lower 48Consuming Region EastProducing RegionConsuming Region West

13
Data from Figure 7 were used to calculate mean values and standard deviations (vertical lines with bars) for the length of time that storage would last for an outage that began in each month. Consumption, coupled with the amount in storage, makes February, March, and April the months with the least stored gas available, and July, August, and September the months with the most. Mean values ranged from 39 days (March) to 90 days (August) when electric utilities are not operating and from 27 (April) to 59 days (September) when they are.
Figure 9. Calculated duration of natural gas storage.
1.5 IMPLICATIONS FOR ENERGY SECURITY
Energy security that allows continued operation despite a wider grid failure depends in part on the nature of that failure (hurricane vs. earthquake vs. electricity outage). For short-duration disruptions in electricity supply (this depends on the time of year and the assumptions about natural gas usage rates, but conservatively, two weeks to several months), firm delivery contracts (which are based on the capacity of the transmission pipelines and guarantee delivery) from gas transmission companies have historically provided reliable delivery. Existing natural gas customers are typically confident in the reliability of firm delivery contracts, based on past performance [38]. An example of disruptions to supply, for example, occurred in 1998 when a cold weather event in the Pacific Northwest increased gas demand there and reduced supply to California, causing curtailed supply to interruptible service customers, but not to firm delivery customers [34] (interruptible contracts usually have cheaper commodity prices, but the quantity of gas is not guaranteed as it is not part of the capacity planning process).
0
20
40
60
80
100
120
0 2 4 6 8 10 12
Dur
atio
n of
stor
age
supp
lies
(day
s)
Month that outage begins
Calculated Duration of Natural Gas Storage (using historical storage and load data, 2001–2012)
mean, standard deviation Run time (without electric utililies)Run time (full load)

14
However, in the case of long-term electricity failures (this has not occurred, but given this analysis, these would be disruptions greater than two weeks to several months, again, depending on time of year and assumptions), firm delivery contracts will be void as they contain force majeure clauses that rule out guaranteed delivery in the event of uncontrollable events, such as war, riot, crime, strikes, floods, hurricanes, earthquakes, freeze offs, explosions, and blow outs [39]. Gas transmission companies will make every effort to continue to supply customers, with a priority to firm contracts over interruptible service. However, the very event that would make the contracting of firm delivery a sensible precaution could also cause force majeure that would void the firm delivery contract.
Regardless of the energy security concerns or potential benefits, there are currently economically viable reasons to use natural gas energy production on military installations. For example, Tinker AFB, Robins AFB, and MCAGCC Twentynine Palms all have natural gas-fired generation or cogeneration on site. If natural gas is available as a resource at a particular site, it will provide energy security because of its separate distribution pathway. This was the case in New York after Hurricane Sandy [40]. Power is not assured in all possible scenarios that disrupt the electric grid, or in all locations of the country, but natural gas has demonstrated energy security benefits during all historical electricity outages.
Methods to mitigate the risk of supply disruptions have been explored, and contracting for storage of natural gas has been implemented by some customers. Natural gas storage provides both energy security and the ability to do peak load management. Nationally, to level out the winter peak gas demand, gas is typically stored throughout the gas transmission network during the summer and used to supply about 20% of the winter demand [23] (Figure 4); it is occasionally withdrawn at other times to meet unexpected needs [41]. Regionally, Con Edison of New York has firm pipeline delivery contracts for gas supply from the Gulf Coast to the receipt point in New York City and also has gas storage that provides about 80 days of supply, at half their typical use rate, at a storage location in Louisiana [31] – Con Edison is obviously satisfied with the firm delivery contracts that it has in place and the level of reliability that comes with that service.
If there are no geologic formations in the area and gas storage closer to the point of consumption is desired, liquid natural gas (LNG) storage allows significant volumes of gas to be stored on-site, although there are significant cost differences between receipt of LNG from tankers and investing in the infrastructure to liquefy the gas on-site [4, 25]. LNG is also used across the country to support peak demands that existing pipelines cannot serve [4].
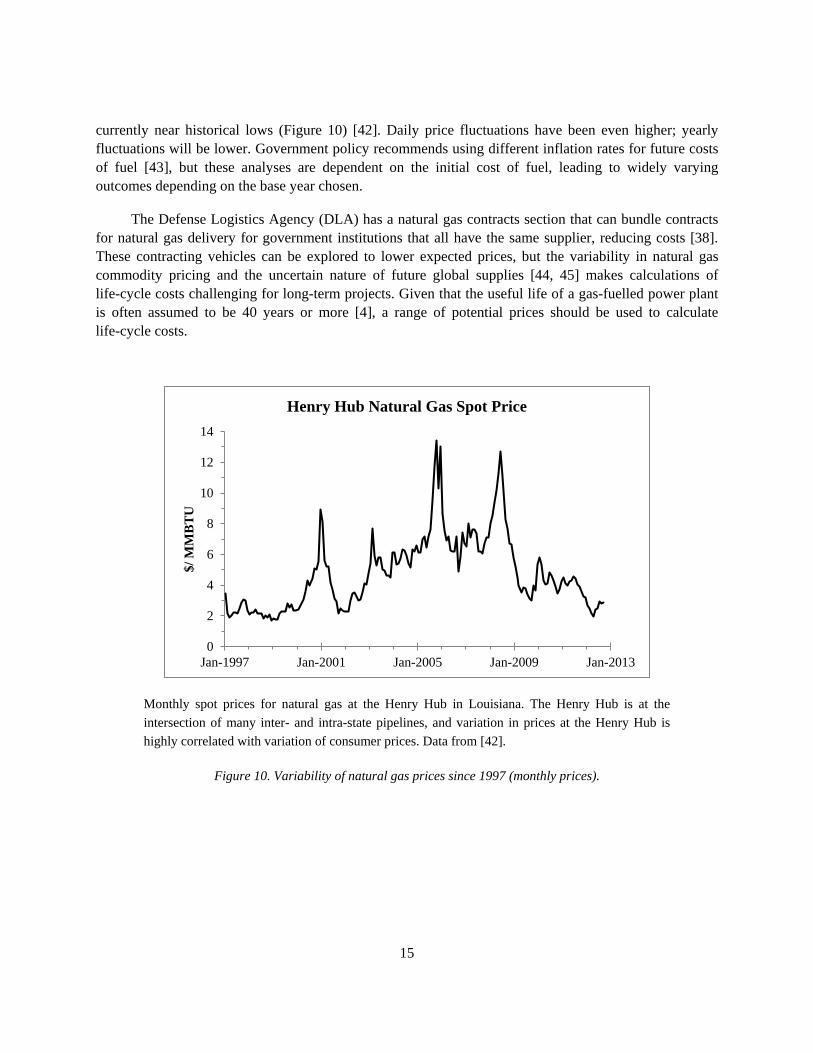
Gas price variability is one important factor to consider for planning purposes. The cost of natural gas has been highly variable in the last several decades. The recent downward trend in prices has been partly due to the rapid development of shale gas deposits in Pennsylvania, Texas, and elsewhere, which have drastically redistributed availability of gas supplies in the U.S. and the world. Within the U.S. natural gas transmission system, there are approximately 90 “hubs” where several transmission pipelines meet [1]. A commonly used hub for price comparisons, due to ample supply reaching the hub and good price transparency, is the Henry Hub in Louisiana. The monthly variation in price over the last fifteen years has been more than seven-fold, from a low of $1.72/MMBTU to a high of $13.42/MMBTU, and is
15
currently near historical lows (Figure 10) [42]. Daily price fluctuations have been even higher; yearly fluctuations will be lower. Government policy recommends using different inflation rates for future costs of fuel [43], but these analyses are dependent on the initial cost of fuel, leading to widely varying outcomes depending on the base year chosen.
The Defense Logistics Agency (DLA) has a natural gas contracts section that can bundle contracts for natural gas delivery for government institutions that all have the same supplier, reducing costs [38]. These contracting vehicles can be explored to lower expected prices, but the variability in natural gas commodity pricing and the uncertain nature of future global supplies [44, 45] makes calculations of life-cycle costs challenging for long-term projects. Given that the useful life of a gas-fuelled power plant is often assumed to be 40 years or more [4], a range of potential prices should be used to calculate life-cycle costs.
Monthly spot prices for natural gas at the Henry Hub in Louisiana. The Henry Hub is at the intersection of many inter- and intra-state pipelines, and variation in prices at the Henry Hub is highly correlated with variation of consumer prices. Data from [42].
Figure 10. Variability of natural gas prices since 1997 (monthly prices).
0
2
4
6
8
10
12
14
Jan-1997 Jan-2001 Jan-2005 Jan-2009 Jan-2013
$/ M
MB
TU
Henry Hub Natural Gas Spot Price

This page intentionally left blank.
17
2. SUMMARY
The natural gas system is generally robust to two-week to three-month outages in the electricity supply, depending on the time of year (using conservative assumptions about the dependence of natural gas production on electricity and on continued demand for natural gas). If there is reason to relax the assumptions, the length of time that gas supplies would last would increase, as long as backup generation continued to operate for any required city-gate equipment. Longer-term electricity outages would strain the system and could cause regional pipeline failures as demand outstrips the stored gas supplies and any production that may come back online. There are also regional differences, with some areas, especially California and New England, having both restricted supply routes and more demand than supply during certain times of the year, which makes them more vulnerable. The opening up of the shale gas deposits in Pennsylvania has changed the flow dynamics of the major pipelines, and current pipeline construction in the northeast will reduce some of the supply constraints in coming years, but the nature of the gathering and processing equipment used matters greatly in the analysis of risk. Increased dependence on electric motor-driven compressors (to comply with emissions standards and for economic reasons) has increased risk, but this penetration on most pipelines is not yet at a critical level. Historically, there have been very few outages in the natural gas distribution system, with firm delivery contracts exhibiting greater than 99.999% reliability [31]. The interconnected nature of the natural gas system has allowed workarounds for any transmission line problems with natural gas coming from storage or from other producing regions and pipelines.
There have not been any long-term or widespread-enough disruptions to the nation’s electricity supply network to test the resilience of the natural gas system in the event of a catastrophic failure of the electricity supply network. It is likely that the gas transmission and distribution systems would still operate, that gas could be supplied from many of the storage sites or from facilities with on-site LNG supplies, but many of the production sites are dependent on electricity and would lose the capacity to put new gas into the system. In time, a large disruption in natural gas production could cause the whole system to fail once storage reserves are exhausted. This length of time varies depending on the time of year and the amount of gas in storage, with the least amount of gas in storage at the end of the winter. Depending on the scenario that is postulated (physical disruption, earthquake, hurricane, cold weather, etc.), there are many situations that would result in a failure in the production of natural gas. The size and location of the electric system outage will determine what level of security the natural gas system will offer.

This page intentionally left blank.

19
3. RECOMMENDATIONS
1. DoD installations with large electricity loads should consider installation of natural gas generation or cogeneration plants to increase their energy security from the typical three days using diesel supplies to weeks-to-months using natural gas generation.
2. Local storage of natural gas will increase energy security. If costs are prohibitive, exploration of public/private partnerships to facilitate the implementation of LNG storage for both peak use and for military backup power could cost-effectively increase energy security in regions of the country where natural gas supplies are more vulnerable to electricity disruptions. For example, an LDC could be permitted to install and operate a natural gas storage facility on a DoD base that is oversized for the military’s needs, with the military having first rights to the gas if an emergency arises.
Alternately, the nation should consider creating a strategic gas reserve with regional storage that allows the military first rights to the gas. This would increase overall storage on the system and thereby increase energy security for military installations that use natural gas for generation.
3. A red-team analysis should be performed to determine the range of risks to the natural gas system and to gas-fired generation on DoD installations and possible mitigation options. This could guide investments for increased energy security.
4. DoD installations that are planning on using natural gas-fuelled generation to increase energy security should analyze the gas supply network upstream of the installation to identify bottlenecks and quantify the amount of energy security they could obtain. Any dependence on backup generation at the nearest city gate feeding an LDC network needs to be determined to ensure that gas from the transmission pipelines will continue to flow into the LDC distribution system that a military installation is served by. The regional variation in resilience of the gas supply to electricity outages means that specific regions of the country will require different solutions. In some instances, transmission bottlenecks are immediately obvious, such as in parts of California and New England. In other regions, where there is plentiful supply and transmission, the likely points of failure are much closer to the initial extraction sites.
Modeling of the natural gas network and simulation of scenarios that affect the supply of electricity could better quantify the regional impact of natural gas for energy security. Modeling and simulation could identify those regions and DoD installations that are most vulnerable to disruptions in the natural gas supply, and those that would see the greatest energy security improvement by switching to natural gas-fired generation.
5. Plans to install new generation should include dual-fuel capability. Dual-fuel generators provide extra security. Several DoD installations with natural gas generation (Tinker AFB, Robins AFB, MCAGCC Twentynine Palms) have dual-fuel capability.

20
6. The DoD should consider purchasing capacity in nearby storage facilities and signing firm delivery contracts. This will increase the energy security of a natural gas-fired generator on a DoD installation for events similar to those experienced in the past.
7. To achieve cost savings, contracts for firm delivery of natural gas can be combined across government departments through programs at the DLA. This should be pursued wherever possible.
8. Given that the useful life of a gas-fuelled power plant is often assumed to be 40 years or more and that the price of gas is variable, costs should be projected using the costs of fuel for several base years to calculate life-cycle costs.
21
REFERENCES
1. North American Electric Reliability Corporation, 2011. 2011 Special reliability assessment: A primer of the natural gas and electric power interdependency in the United States. iii, 151 pp.
2. Federal Energy Regulatory Commission and the North American Reliability Corporation, 2011. Report on outages and curtailments during the Southwest cold weather event of February 1–5, 2011. 37 pp.
3. North American Electric Reliability Corporation, 2011. 2011 Long-term reliability assessment. ix, 554 pp.
4. Aspen Environmental Group, 2010. Implications of greater reliance on natural gas for electricity generation.
5. Gopalakrishnan, K. and Peeta, S., eds. Sustainable and resilient critical infrastructure systems simulation, modeling, and intelligent engineering. 2010, Springer: Berlin. 265 pp.
6. Li, T., Eremia, M., and Shahidehpour, M., 2008. Interdependency of Natural Gas Network and Power System Security. IEEE Transactions on Power Systems, 2008. 23(4): pp. 1817–1824.
7. Urbina, M. and Li, Z. Y., 2008. Modeling and Analyzing the Impact of Interdependency between Natural Gas and Electricity Infrastructures. 2008 IEEE Power & Energy Society General Meeting, 2008. 1(11): pp. 644–649.
8. Shahidehpour, M., Fu, Y., and Wiedman, T., 2005. Impact of natural gas infrastructure on electric power systems. Proceedings of the IEEE, 2005. 93(5): pp. 1042–1056.
9. Nozick, L., Turnquist, M., et al., 2005. Assessing the performance of interdependent infrastructures and optimizing investments. International Journal of Critical Infrastructures, 2005. 1(2-3): pp. 144–154.
10. Fournier, D.F. and Westervelt, E.T., 2005. Energy trends and their implications for U.S. Army installations. U.S. Army Corps of Engineers: Engineer Reseach and Development Center: Construction Engineering Research Laboratory. Report number: ERDC/CERL TR-05-21. 86 pp.
11. Munoz, J., Jimenez-Redondo, N., Perez-Ruiz, J., and Barquin, J., 2003. Natural gas network modeling for power systems reliability studies, in PowerTech Conference Proceedings, 2003 IEEE Bologna. Bologna, Italy.
12. Hibbard, P. and Schatzki, T., 2012. The interdependence of electricity and natural gas: current factors and future prospects. The Electricity Journal. 25. Available from: http://dx.doi.org/10.1016/j.tej.2012.04.012.
13. North American Electric Reliability Corporation, 2004. Gas/ electricity interdependencies and recommendations. 23 pp.
22
14. Rinaldi, S.M., 2004. Modeling and simulating critical infrastructures and their interdependencies, in Proceedings of the 37th Hawaii International Conference on System Sciences: Hawaii, U.S.A. pp. 873–880.
15. Gursesli, O. and Desrochers, A.A., 2003. Modeling infrastructure interdependencies using Petri nets. 2003 IEEE International Conference on Systems, Man and Cybernetics, Vols 1–5, Conference Proceedings, 2003: pp. 1506–1512.
16. Rinaldi, S.M., Peerenboom, J.P., and Kelly, T.K., 2001. Identifying, understanding, and analyzing critical infrastructure interdependencies. IEEE Control Systems Magazine, 2001. 21(6): pp. 11–25.
17. Van Broekhoven, S. B., Judson, N., Nguyen, S. V. T., and Ross, W. D., 2012. Technical Report 1164. Microgrid study: energy security for DoD installations. Lexington, MA: MIT Lincoln Laboratory. Report number: TR 1164. 100 pp.
18. Anderson, E., Antkowiak, M., et al., 2011. A broad overview of energy efficiency and renewable energy opportunities for Department of Defense installations. Golden, CO: National Renewable Energy Laboratory. Report number: TP-7A20-50172. 236 pp.
19. BENS task force on microgrids, 2012. Power the fight: capturing smart microgrid potential for DoD installation energy security. 63 pp. Available from: http://www.bens.org/ document.doc?id=187.
20. McPherson, J.R., 2012. DCP Midstream, personal communication 10/23/2012.
21. Williams, K., 2012. Senior Vice President, North Region, DCP Midstream, personal communication 10/23/2012.
22. Natural gas processing: the crucial link between natural gas production and its transportation to market, 2006. Energy Information Administration Office of Oil and Gas.
23. The Interstate Natural Gas Association of America, 2009. America's natural gas pipeline network: delivering clean energy for the future. Available from: http://www.ingaa.org/ 11885/Reports/DeskBook.aspx. [Accessed: 6/25/2012].
24. Johnson, A., 2012. Director, System Design Central and Eastern Pipelines, Kinder Morgan, personal communication 10/11/2012 and 12/7/2012.
25. Miesner, T. O. and Leffler, W. L., 2006. Oil & gas pipelines in nontechnical language Tulsa, Okla.: PennWell Corp. xviii, 357 pp.
26. Energy Information Administration, 2008. U.S. natural gas pipeline compressor stations illustration. Available from: http://www.eia.gov/pub/oil_gas/natural_gas/analysis_publications/ ngpipeline/compressorMap.html. [Accessed: February 1, 2013].

23
27. Energy Information Administration, 2007. U.S. underground natural gas storage facilities, close of 2007. Available from: http://www.eia.gov/pub/oil_gas/natural_gas/analysis_publications/ ngpipeline/undrgrndstor_map.html. [Accessed: February 1, 2013].
28. Kennedy, J. L., 1993. Oil and gas pipeline fundamentals. 2nd ed Tulsa, Okla.: PennWell Books. xi, 366 pp.
29. Whaley, B., 2012. Vice President, Gas Control and Customer Service, Spectra Energy, personal communication 10/18/2012.
30. Quine, T., 2012. President, Northstar Industries, LLC, personal communication 10/2/2012.
31. Amezquita, C., 2012. Director, Gas Management and Control, Williams Gas Pipeline – Transco, personal communication 10/26/2012.
32. Dalton, J., 2012. Panel IV: Gas electric coordination – how reliable are our delivery systems?, in NECA Fuels Conference. Waltham, MA.
33. Zernike, K., 2012. Gasoline runs short, adding woes to storm recovery. The New York Times. New York: The New York Times Company. Available from: http://www.nytimes.com/2012/11/03/nyregion/recovery-efforts-after-hurricane-sandy.html. [Accessed: 11/2/2012].
34. Ingram, J., 2012. Petrochemical Group Lead, Mission Assurance Division, personal communication 8/29/2012: Dahlgren, VA.
35. U.S. Energy Information Administration, 2012. Monthly natural gas gross production report. Available from: http://www.eia.gov/oil_gas/natural_gas/data_publications/eia914/eia914.html. [Accessed: 11/20/2012].
36. U.S. Energy Information Administration, 2012. Natural gas monthly. Available from: http://www.eia.gov/naturalgas/monthly/. [Accessed: 11/20/2012].
37. U.S. Energy Information Administration, 2012. Weekly natural gas storage report. Available from: http://ir.eia.gov/ngs/ngs.html. [Accessed: 11/20/2012].
38. Byrd, B., 2012. Defense Logisitics Agency, personal communication 10/12/2012.
39. Northwest Pipeline GP, 2012. FERC gas tariff, fifth revised volume no. 1. Available from: http://www.northwest.williams.com/Files/Northwest/tariff/tariff176.html. [Accessed: 10/31/2012].
40. Revkin, A., 2012. How Natural Gas Kept Some Spots Bright and Warm as Sandy Blasted New York City. The New York Times. New York: The New York Times Company. Available from: http://dotearth.blogs.nytimes.com/2012/11/05/how-natural-gas-kept-some-spots-bright-and-warm-as-sandy-blasted-new-york/.
41. Energy security in the United States, 2012. Congressional Budget Office. Report number: 4303.

24
42. U.S. Energy Information Administration, 2012. Henry Hub Gulf Coast natural gas spot price. Available from: http://www.eia.gov/dnav/ng/hist/rngwhhdm.htm. [Accessed: 10/31/2012].
43. Rushing, A.S., Kneifel, J.D., and Lippiatt, B.C., 2012. Energy price indices and discount factors for life-cycle cost analysis 2012: Annual supplenment to NIST handbook 135 and NBS special publication 709. 64 pp. Available from: http://www.wbdg.org/ccb/NIST/nistir85 3273 26.pdf.
44. Jaffe, A.M. and O'Sullivan, M.L., 2012. The geopolitics of natural gas: report of scenarios workshop of Harvard University's Belfer Center and Rice University's Baker Institute energy forum. Cambridge, MA and Houston, TX: Harvard Kennedy School and Rice University. 26 pp.
45. Roesser, R., 2009. Natural gas price volatility. 44 pp. Available from: http://www.energy.ca.gov/ 2009publications/CEC-200-2009-009/CEC-200-2009-009-SD.pdf.

REPORT DOCUMENTATION PAGE Form Approved
OMB No. 0704-0188 Public reporting burden for this collection of information is estimated to average 1 hour per response, including the time for reviewing instructions, searching existing data sources, gathering and maintaining the data needed, and completing and reviewing this collection of information. Send comments regarding this burden estimate or any other aspect of this collection of information, including suggestions for reducing this burden to Department of Defense, Washington Headquarters Services, Directorate for Information Operations and Reports (0704-0188), 1215 Jefferson Davis Highway, Suite 1204, Arlington, VA 22202-4302. Respondents should be aware that notwithstanding any other provision of law, no person shall be subject to any penalty for failing to comply with a collection of information if it does not display a currently valid OMB control number. PLEASE DO NOT RETURN YOUR FORM TO THE ABOVE ADDRESS. 1. REPORT DATE (DD-MM-YYYY)
15 May 2013 2. REPORT TYPE
Technical Report3. DATES COVERED (From - To)
4. TITLE AND SUBTITLE
5a. CONTRACT NUMBER FA8721-05-C-0002
Interdependence of the Electricity Generation System and the Natural Gas System and Implications for Energy Security
5b. GRANT NUMBER
5c. PROGRAM ELEMENT NUMBER
6. AUTHOR(S)
5d. PROJECT NUMBER 2140
Nicholas Judson 5e. TASK NUMBER 2
5f. WORK UNIT NUMBER
7. PERFORMING ORGANIZATION NAME(S) AND ADDRESS(ES)
8. PERFORMING ORGANIZATION REPORT NUMBER
MIT Lincoln Laboratory 244 Wood Street Lexington, MA 02420-9108
TR-1173
9. SPONSORING / MONITORING AGENCY NAME(S) AND ADDRESS(ES) 10. SPONSOR/MONITOR’S ACRONYM(S) Office of the Secretary of Defense, ESTCP Office 4800 Mark Center Dr., Suite 17D08 11. SPONSOR/MONITOR’S REPORT
Alexandria, VA 22350-3605 NUMBER(S) ESC-EN-HA-TR-2012-12112. DISTRIBUTION / AVAILABILITY STATEMENT
Approved for public release; distribution in unlimited.
13. SUPPLEMENTARY NOTES
14. ABSTRACT Concern about energy security on domestic Department of Defense installations has led to the possibility of using natural gas–fired electricity generators to provide power in the event of electric grid failures. The natural gas system in the United States is partly dependent on electricity for its ability to deliver natural gas from the well-head to the consumer, but it also uses natural gas from the system itself to fuel some of the drilling rigs, processing units, and pipeline compressors. The vulnerability of the system to a disruption in the national electricity supply network varies depending on the cause and breadth of the disruption and where in the country one is located relative to that disruption, as the interconnected nature of transmission pipelines, the penetration of electric motor-driven compressors and other equipment, and the availability of nearby gas production, import terminals, or storage varies. In general, the gas supply system is reliable for short-term, limited-area disruptions in the electricity supply, and firm delivery contracts for natural gas increase the likelihood of continued operation, but for disruptions that cover large sections of the electric grid encompassing areas from extraction wells to customers and which last longer than available gas in storage or transmission pipeline constraints from elsewhere, contractual force majeure limits will come into play rendering the firm delivery contracts void; operation of gas-fuelled power generation systems that are not dual-fuel capable for longer than weeks to a few months (depending on time of year) will be unlikely. Several weather-related outages in recent years have provided limited case studies showing the system’s resilience, but no long-term, widespread electricity grid failures have occurred.15. SUBJECT TERMS
16. SECURITY CLASSIFICATION OF:
17. LIMITATION OF ABSTRACT
18. NUMBER OF PAGES
19a. NAME OF RESPONSIBLE PERSON
a. REPORT
Unclassified b. ABSTRACT Unclassified
c. THIS PAGE
Unclassified
Same as report 33
19b. TELEPHONE NUMBER (include area code)
Standard Form 298 (Rev. 8-98)Prescribed by ANSI Std. Z39.18